mathematical model of fcc catalyst deactivation
TRANSCRIPT
This article was downloaded by: [Thammasat University Libraries]On: 07 October 2014, At: 00:22Publisher: Taylor & FrancisInforma Ltd Registered in England and Wales Registered Number: 1072954Registered office: Mortimer House, 37-41 Mortimer Street, London W1T 3JH,UK
Chemical EngineeringCommunicationsPublication details, including instructions forauthors and subscription information:http://www.tandfonline.com/loi/gcec20
Mathematical model of fcccatalyst deactivationWilliam Richard Gilbert aa Petrobras , Rio de Janeiro, BrazilPublished online: 09 Sep 2010.
To cite this article: William Richard Gilbert (2003) Mathematical model of fcccatalyst deactivation, Chemical Engineering Communications, 190:11, 1485-1498, DOI:10.1080/714909158
To link to this article: http://dx.doi.org/10.1080/714909158
PLEASE SCROLL DOWN FOR ARTICLE
Taylor & Francis makes every effort to ensure the accuracy of all theinformation (the “Content”) contained in the publications on our platform.However, Taylor & Francis, our agents, and our licensors make norepresentations or warranties whatsoever as to the accuracy, completeness,or suitability for any purpose of the Content. Any opinions and viewsexpressed in this publication are the opinions and views of the authors, andare not the views of or endorsed by Taylor & Francis. The accuracy of theContent should not be relied upon and should be independently verified withprimary sources of information. Taylor and Francis shall not be liable for anylosses, actions, claims, proceedings, demands, costs, expenses, damages,and other liabilities whatsoever or howsoever caused arising directly orindirectly in connection with, in relation to or arising out of the use of theContent.
This article may be used for research, teaching, and private study purposes.Any substantial or systematic reproduction, redistribution, reselling, loan,

sub-licensing, systematic supply, or distribution in any form to anyone isexpressly forbidden. Terms & Conditions of access and use can be found athttp://www.tandfonline.com/page/terms-and-conditions
Dow
nloa
ded
by [
Tha
mm
asat
Uni
vers
ity L
ibra
ries
] at
00:
22 0
7 O
ctob
er 2
014
MATHEMATICALMODELOFFCCCATALYSTDEACTIVATION
WILLIAMRICHARDGILBERT
Petrobras, Rio deJaneiro, Brazil
A model is proposed that explains both lab-scale and commercial unit FCC
catalyst deactivation, taking vanadium mobility between particles into ac-
count. Equilibrium catalyst density fractionation is also simulated, helping in
the interpretation of the commercial unit results.
Keywords: FCC; Catalyst deactivation; Model; Density Fractionation; Van-
dium migration
INTRODUCTION
Fluid Catalytic Cracking (FCC) catalysts in commercial units suffer anongoing process of deactivation and metal contamination, particularlywith nickel and vanadium. In order to maintain a minimum level ofactivity in the catalyst inventory, equilibrium catalyst (Ecat) is con-tinuously purged from the unit and exchanged with fresh catalyst. Cat-alyst purchase is a major cost to the refiner, who has to balance the gainsin increasing high-value product yield obtained with extra fresh catalystmakeup with the associated expense. Accurate prediction of catalystdeactivation is, therefore, an important issue in commercial unit opti-mization and in catalyst design and evaluation.
A common procedure that attempts to separate the complex mixtureof differently aged particles present in the equilibrium catalyst into itscomponent fractions is density fractionation. As catalyst particles getolder their porous structure suffers a partial collapse (Beyerlein et al.,1990) with a resulting increase in bulk density. By suspending the
Received 26 September 2000; in final form 18 August 2001.
Address correspondence to William Richard Gilbert, PETROBRAS/CENPES/TFCC,
Cidade Universitaria Quadra 7, Ilha do Fundao, Rio de Janeiro, 21949-900, Brazil. E-mail:
Chem. Eng. Comm.,190: 1485�1498, 2003Copyright#Taylor & Francis Inc.
ISSN: 0098-6445 print/1563-5201online
DOI: 10.1080/00986440390215379
1485
Dow
nloa
ded
by [
Tha
mm
asat
Uni
vers
ity L
ibra
ries
] at
00:
22 0
7 O
ctob
er 2
014

equilibrium catalyst in a solvent whose density is close to the averagedensity of the equilibrium catalyst mixture, it is possible to isolate theyounger portion of the catalyst, which tends to float, from the olderportion, which sinks.
The dominant factors in FCC catalyst deactivation, such as regen-erator steam partial pressure, temperature, and sodium and vanadiumcontent, have been known for a long time. The migration of vanadiumfrom the old and heavily contaminated particles in the catalyst inventoryto the younger particles is also firmly established (Beyerlein, et al., 1990;Palmer and Cornelius, 1987; Wormsbecher et al., 1995). By consideringthe dynamic and nonlinear evolution of vanadium concentration oncatalyst particles as a function of time, the mathematical modeling ofcatalyst deactivation is greatly simplified, and the same basic equationsused to describe lab-scale deactivation may be applied to commercial unitresults.
An extensive database of deactivation results from catalyst evalua-tions done at the PETROBRAS research center, using two differentprotocols, showed consistent patterns, such as linear dependence of cat-alyst surface area with vanadium content and logarithmic surface areadecay with time. These results could be described by simple first-orderkinetic equations, as will be shown further on. In order to extend themodel to commercial unit density fractionation data, the effects of cat-alyst inventory age distribution and catalyst vanadium concentration as afunction of time had to be included.
Although catalyst decay was monitored only from the surface arealoss, the analysis can readily be extended to catalyst activity, which showsgood correlation with surface area both in laboratory tests and inindustrial experience.
MODEL
SurfaceArea Decay
Results from steam deactivation experiments, where catalyst sampleswere taken at varying run times, showed that surface area drop wasfast to begin with, then slowed down, approaching a minimum value.Equation (1), similar to that used by Fuentes (1985), was used to describethis behavior. Equation (1) can be integrated to give Equation (2):
dSA
dt¼ csa � SAmin � SAð Þ; ð1Þ
SA ¼ SAi � SAmin � 1� expðcsa � tÞð Þexpðcsa � tÞ
: ð2Þ
1486 W. R. GILBERT
Dow
nloa
ded
by [
Tha
mm
asat
Uni
vers
ity L
ibra
ries
] at
00:
22 0
7 O
ctob
er 2
014

Furthermore, it was also observed that the level of vanadium loadedon the catalyst through incipient metal impregnation was proportional tothe final surface area. The proportionality of deactivated catalyst surfacearea and vanadium concentration would hold not only for the lab databut also for commercial trial results as shown in Figure 3. To include thiseffect in the catalyst decay equation, SAmin in Equation (1) was assumedto be proportional to vanadium concentration, Equation (3). Parametersav in Equations (3) and (4) may be interpreted as the slope in the surfacearea versus vanadium concentration graph, Figure 3:
SAmin ¼ SA0 � sav � V; ð3Þ
dSA
dt¼ csa � SA0 � sav � V� SAð Þ: ð4Þ
Equation (4), derived from Equations (1) and (3), can be used todescribe two cases of laboratory catalyst deactivation. In the first case thecatalyst is impregnated with vanadium before steam deactivation, sovanadium concentration does not change with time, and the surface areamay be calculated from Equations (2) and (3). In the second case, a cyclicdeactivation-metal impregnation reactor is used, where feed laced withvanadium is cracked onto a batch of catalyst for a short time, after whichthe coke produced in the cracking step is burned, readying the catalystfor a new cycle. In cyclic deactivation (CD), vanadium concentrationincreases linearly with time, Equation (5), and surface area is describedby Equation (6), derived from Equations (4) and (5):
V ¼ vR � t; ð5Þ
SA ¼ SA0 � sav � vR � csað Þ � expðcsa � tÞ � 1
expðcsa � tÞ
� �� sav � vR � tþ SAi
expðcsa � tÞ:
ð6Þ
In the commercial unit, equilibrium catalyst is continually drainedfrom the FCC regenerator and replaced with fresh catalyst. Assuming theFCC to be a continuous stirred tank reactor (CSTR) regarding the cat-alyst, catalyst age distribution may be calculated from Equation (7)derived by Anderson et al. (1954), where S is the unit makeup rate (tonsof catalyst added per day divided by catalyst inventory):
f ¼ S � expð�S � tÞ: ð7Þ
MODELING FCC CATALYST DEACTIVATION 1487
Dow
nloa
ded
by [
Tha
mm
asat
Uni
vers
ity L
ibra
ries
] at
00:
22 0
7 O
ctob
er 2
014

Since the catalyst particles are not all the same age as in the CD reactor,somewill havemore vanadium than others, having been exposed to the feedfor longer periods. Vanadium migration from the old particles to the newparticles must then be considered, and a vanadium accumulation modelmust be developed before surface area decay can be handled.
Equation (8) describes the rate of vanadium increase for a givenparticle. Its first term, Vfeed, includes the feed contribution, which isproportional to the feed vanadium concentration and the feed ratedivided by catalyst inventory and is assumed to be constant with time.The second term takes into account interparticle vanadium exchange andis derived from the vanadium mass balance around a single particle.The driving force for vanadium migration is the difference between theaverage vanadium concentration in the whole inventory and that ofthe particle. Some of the vanadium, Vfix, is chemically anchored to thevanadium-rich particles, and therefore unavailable for migration:
dV
dt¼ Vfeed þ cv � Vecat � Vfix � V
� �: ð8Þ
By assuming nickel concentration on the catalyst to be proportionalto particle age (Beyerlein et al., 1990; Palmer and Cornelius, 1987; Kuglerand Leta, 1988), it is possible to change the differential Equations (8)and (4) to a format that is more suitable to the density fractionation data.The nickel accumulation velocity, k in Equation (9), may be calculatedfrom Equations (9) and (7), since the equilibrium catalyst nickel concen-tration, Niecat, is the average value of the whole inventory, Equation (10):
Ni ¼ k � t; ð9Þ
Niecat ¼Z 1
0
k � tð Þ � S � expð�S � tÞdt �! k ¼ Niecat � S: ð10Þ
To change Equation (8) to a nickel base, it must be divided by thenickel time derivative, constant k. Vfeed is the feed contribution tovanadium accumulation without interparticle migration and may beshown to be the product of the equilibrium catalyst vanadium con-centration, Vecat, times the makeup rate. Equations (8) and (4) thenbecome Equations (11) and (12):
dV
dNi¼ Vecat
Niecat
� �þ cv
k� Vecat � Vfix � V� �
; ð11Þ
1488 W. R. GILBERT
Dow
nloa
ded
by [
Tha
mm
asat
Uni
vers
ity L
ibra
ries
] at
00:
22 0
7 O
ctob
er 2
014
dSA
dNi¼ csa
k� SA0 � sav � V� SAð Þ: ð12Þ
Equations (11) and (12) are integrated and solved for time zero (Ni¼ 0)to give Equations (13) and (14), which are the equations used to describethe density fractionation (sink-float) data:
V ¼ M1 �expðcvk �NiÞ � 1� �
expðcvk �NiÞ �! M1 ¼Vecat
Niecat
� �cvk
� � þVecat �Vfix; ð13Þ
SA¼SA0�sav �M1ð Þ� expðcsak �NiÞ�1
� �þcv�sav�M1
csa�cvð Þ � expðcsa�cvk �NiÞ�1
� �þSAi
h iexpðcsak �NiÞ :
ð14Þ
Sink-Float Simulation
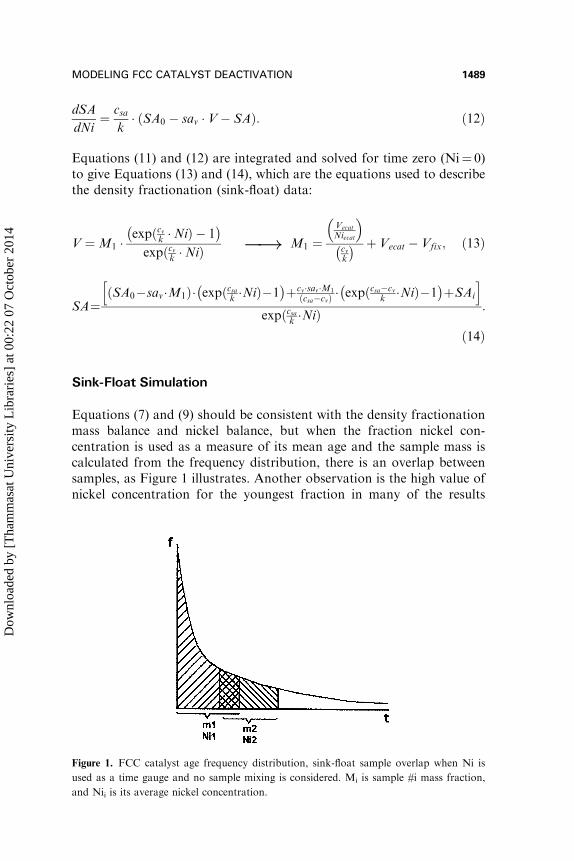
Equations (7) and (9) should be consistent with the density fractionationmass balance and nickel balance, but when the fraction nickel con-centration is used as a measure of its mean age and the sample mass iscalculated from the frequency distribution, there is an overlap betweensamples, as Figure 1 illustrates. Another observation is the high value ofnickel concentration for the youngest fraction in many of the results
Figure 1. FCC catalyst age frequency distribution, sink-float sample overlap when Ni is
used as a time gauge and no sample mixing is considered. Mi is sample #i mass fraction,
and Nii is its average nickel concentration.
MODELING FCC CATALYST DEACTIVATION 1489
Dow
nloa
ded
by [
Tha
mm
asat
Uni
vers
ity L
ibra
ries
] at
00:
22 0
7 O
ctob
er 2
014

reported in literature (Beyerlein et al., 1990; Palmer and Cornelius, 1987).These two observations led to the conclusion that there is an inefficiencyin density fractionation, causing one sample to be contaminated by theothers.
In order to simulate the inefficiencies in the density fractionation, it issupposed that each catalyst particle has a probability of being recoveredin the light density fraction, which is proportional to the difference indensity between the particle and the solvent used in the fractionation. Aparticle whose density is much less than that of the solvent will have a100% probability of floating; conversely a particle whose density is muchhigher than the solvent will have zero probability of floating. A nor-malized arctangent function was used to describe the probability offloating for a given particle as a function of its density factor x, Equation(15). The particle age distribution of the first fraction may be calculatedfrom the product of Equations (15) and (7). The age distribution fi ofthe following fractions are calculated from Equation (16), where pi is theprobability of a given particle being recovered in fraction i, and pj theprobability that it was recovered in previous fractionations:
p1ðtÞ ¼ 1� arctgðA1:xðtÞ � B1Þ �! xðtÞ ¼ NiðtÞNiecat
; ð15Þ
fiðtÞ ¼ piðtÞ � S � expð�s � tÞ �Yi�1
1
ð1� pjðtÞÞ: ð16Þ
Finally, to explain the sink-float surface area and vanadium versusnickel profiles, the age distribution of each sample is first calculated,fitting parameters Ai and Bi in Equation (15) to the nickel and weightfraction mass balances for all the samples. Vanadium mobility anddeactivation parameters in Equations (13) and (14) are then determinedby using the samples age distribution profile, fi, to calculate each sampleaverage properties. A first approximation for the deactivation parametersis obtained by assuming the samples to be homogeneous.
EXPERIMENTAL
In the surface area decay experiments catalysts A and B were deactivatedin a fluidized bed reactor using two different protocols. In the hydro-thermal deactivation mode, the catalyst was treated with 100wt% steamat 788�C. In the cyclic propylene steaming mode (CPS) (Boock et al.,1995), the gas composition is changed every 10min, in cycles that startwith a nitrogen stripping step, followed by a catalyst coking step with3wt% propylene in nitrogen, another nitrogen stripping step, and a final
1490 W. R. GILBERT
Dow
nloa
ded
by [
Tha
mm
asat
Uni
vers
ity L
ibra
ries
] at
00:
22 0
7 O
ctob
er 2
014

coke burning step, in the presence of air. Throughout the whole cyclesteam concentration is equal to 50wt%. The temperature in the CPSdeactivation tests was 770�C.At regular time intervals, samples of partiallydeactivated catalyst were taken. Specific surface areas were single-pointdeterminations from a Gemini 2375 instrument. Nickel and vanadiumwere loaded on the catalyst through incipient wetness impregnation(Mitchell, 1980) and then calcined for 6 h at 600�C prior to deactivation,metal concentration on the catalyst was measured by X-ray fluorescence.The properties of catalysts A and B before deactivation are listed inTable I.
In the vanadium migration experiment, a 1:1 mixture of fine equili-brium catalyst C (V¼ 2935 ppm, Ni¼ 3792 ppm, particle size < 325mesh)and coarse fresh catalyst C (particle size> 270mesh) was submitted tosteam deactivation in a fixed-bed tubular furnace at 780�C. At the end ofthe run the reactor contents were sieved and the vanadium level wasmeasured in the coarse fraction, so that if any catalyst breaking wouldhappen, the vanadium-receiving fraction wouldn’t be contaminated withthe vanadium-donating fraction. Four runs of different time lengths weredone to establish the vanadium transfer kinetics. The fresh catalyst Cproperties are listed in Table I.
Cyclic deactivation (Gerritsen et al., 1991) of catalyst C was done in afluidized bed quartz reactor. In every cycle there is a metal impregnationstep, in which vacuum gas-oil laced with vanadium naphtenate is crackedby the FCC catalyst at 500�C for 1min, followed by a coke burn andcatalyst deactivation step, where the catalyst is heated at 788�C for33min in a 50/50 vol% mixture of air and steam.
RESULTSANDDISCUSSION
The loss of surface area, mainly through zeolite destruction, associatedwith catalyst deactivation may be directly correlated to catalyst activity,as is illustrated in Figure 2. In this case, two deactivation tests were done
Table I Properties of the Fresh Catalysts A, B, C, and D Used in the Deactivation and
Vanadium Transfer Experiments
Catalyst A B C D
Spec. area (m2/g) 254.4 306.0 301.2 319.6
Micropore vol (cm3/g) 0.102 0.093 0.096 0.106
Chemical composition
Al2O3 (w%) 37.0 36.0 35.8 33.0
SiO2 (w%) 58.9 59.0 59.1 57.0
RE2O3 (w%) 1.97 3.69 2.05 3.78
MODELING FCC CATALYST DEACTIVATION 1491
Dow
nloa
ded
by [
Tha
mm
asat
Uni
vers
ity L
ibra
ries
] at
00:
22 0
7 O
ctob
er 2
014

to investigate catalyst resistance to metals, showing that surface areaprediction through a catalyst deactivation model can be used to estimatecatalyst activity.
Figure 2. Micro Activity Test (MAT) and surface area correlation for the commercial equi-
librium catalysts D and lab deactivation of catalysts B.
Figure 3. Correlation of surface area retention, relative to fresh catalyst surface area, and
vanadium concentration.
1492 W. R. GILBERT
Dow
nloa
ded
by [
Tha
mm
asat
Uni
vers
ity L
ibra
ries
] at
00:
22 0
7 O
ctob
er 2
014
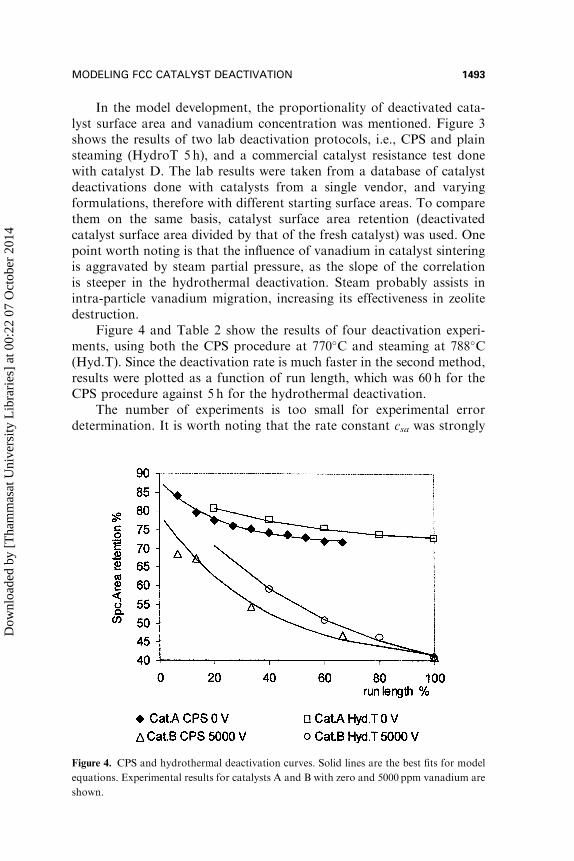
In the model development, the proportionality of deactivated cata-lyst surface area and vanadium concentration was mentioned. Figure 3shows the results of two lab deactivation protocols, i.e., CPS and plainsteaming (HydroT 5 h), and a commercial catalyst resistance test donewith catalyst D. The lab results were taken from a database of catalystdeactivations done with catalysts from a single vendor, and varyingformulations, therefore with different starting surface areas. To comparethem on the same basis, catalyst surface area retention (deactivatedcatalyst surface area divided by that of the fresh catalyst) was used. Onepoint worth noting is that the influence of vanadium in catalyst sinteringis aggravated by steam partial pressure, as the slope of the correlationis steeper in the hydrothermal deactivation. Steam probably assists inintra-particle vanadium migration, increasing its effectiveness in zeolitedestruction.
Figure 4 and Table 2 show the results of four deactivation experi-ments, using both the CPS procedure at 770�C and steaming at 788�C(Hyd.T). Since the deactivation rate is much faster in the second method,results were plotted as a function of run length, which was 60 h for theCPS procedure against 5 h for the hydrothermal deactivation.
The number of experiments is too small for experimental errordetermination. It is worth noting that the rate constant csa was strongly
Figure 4. CPS and hydrothermal deactivation curves. Solid lines are the best fits for model
equations. Experimental results for catalysts A and B with zero and 5000 ppm vanadium are
shown.
MODELING FCC CATALYST DEACTIVATION 1493
Dow
nloa
ded
by [
Tha
mm
asat
Uni
vers
ity L
ibra
ries
] at
00:
22 0
7 O
ctob
er 2
014

dependent on the deactivation procedure, as would be expected. Also,that the initial surface area, SAi, was very close in three of the fourexperiments, with an average value of 87% of the fresh catalyst surfacearea.
Equation (6), derived from the surface area rate equation for thecyclic deactivation experiment, accurately describes the behavior of theexperimental points in Figure 5. After a short number of cycles, the expo-nential terms in Equation (6) cancel out, and surface area is dominated bythe linear increase in catalyst vanadium concentration. A few commercialunits with very low vanadium transfer between particles can be fairly wellrepresented with linear vanadium models, such as the one proposed byLeuenberger (1985).
The plausibility of the vanadium transfer hypotheses, expressedin Equation (8), was checked with a vanadium transfer experiment,where the rate of vanadium exchange between a vanadium-rich equili-
Figure 5. Cyclic deactivation of catalyst C. The solid line is the model equation best fit. The
experimental results for two runs, using the same conditions, are shown.
Table II Calculated Parameters of Equation (2) that Would Fit the Deactivation Results
Catalyst A B A B
Deactivation method CPS CPS HT HT
csa h71 0.08 0.05 0.44 0.36
SAmin (% fresh SA) 71.54 38.76 71.3 31.89
SAi (% fresh SA) 88.32 79.5 86.3 87.39
Vanadium ppm 0 5000 0 5000
Error cm2/g 1.1 2.7 0.1 1.5
1494 W. R. GILBERT
Dow
nloa
ded
by [
Tha
mm
asat
Uni
vers
ity L
ibra
ries
] at
00:
22 0
7 O
ctob
er 2
014

brium catalyst and a vanadium-free fresh catalyst was measured. As therewas no external source of vanadium, the Vfeed term in Equation (8) iszero. Figure 6 shows the experimental results and the line generated fromthe curve fitting of Equation (8). Vinv in this case was equal to half of theequilibrium catalyst concentration. If all the vanadium in the sourcecatalyst had been mobile, the concentration of vanadium in the coarsefraction would have approached that of the average concentration ofthe two fractions, Vinv. What happened instead was that after a numberof hours, vanadium concentration stabilized at about 60% of Vinv,showing that a lot of the vanadium was fixed to the source particles.
One of the problems in FCC catalyst development is finding ingre-dients or additives capable of increasing the percentage of nonmobilevanadium. This kind of catalyst component would affect not only the Vfix
model parameter, in the case of interparticle mobility, but also the savparameter, which measures catalyst resistance to vanadium, which in turnis affected by intraparticle vanadium mobility.
To illustrate the analysis of sink-float data of commercial equilibriumcatalysts, experimental results from Table III were treated with the samemethodology described above. To fit the fraction weight and nickelbalance, the probabilities of particle recovery in each fractionation werefirst calculated. Figure 7 shows the probability curves obtained for thethree fractionations and the graphical interpretation of constants A and Bin Equation (15). The product of Equation (7) times the probabilitycurves for each fraction generated the sample age distribution, Figure 8,used to calculate the deactivation model parameters that would fit each
Figure 6. Concentration of vanadium in the coarse fraction of catalyst mixture in the vana-
dium exchange experiment.
MODELING FCC CATALYST DEACTIVATION 1495
Dow
nloa
ded
by [
Tha
mm
asat
Uni
vers
ity L
ibra
ries
] at
00:
22 0
7 O
ctob
er 2
014
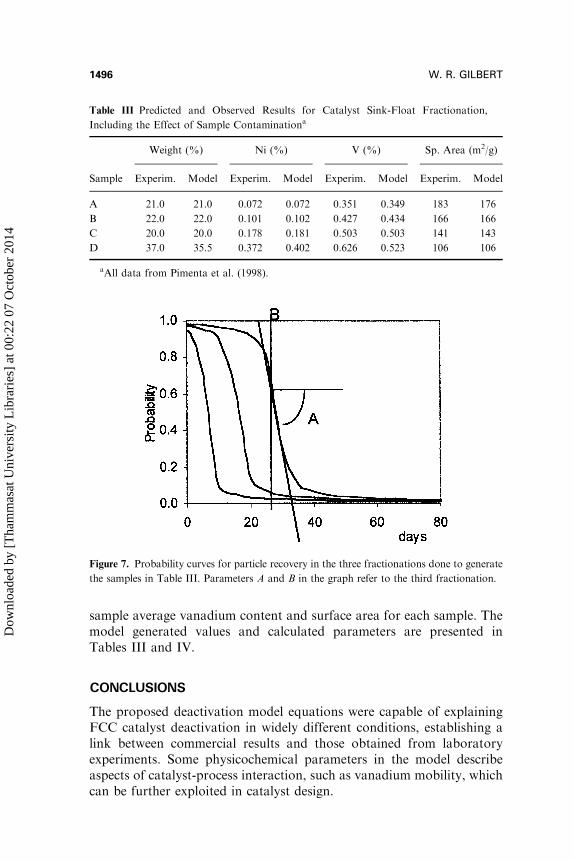
sample average vanadium content and surface area for each sample. Themodel generated values and calculated parameters are presented inTables III and IV.
CONCLUSIONS
The proposed deactivation model equations were capable of explainingFCC catalyst deactivation in widely different conditions, establishing alink between commercial results and those obtained from laboratoryexperiments. Some physicochemical parameters in the model describeaspects of catalyst-process interaction, such as vanadium mobility, whichcan be further exploited in catalyst design.
Table III Predicted and Observed Results for Catalyst Sink-Float Fractionation,
Including the Effect of Sample Contaminationa
Weight (%) Ni (%) V (%) Sp. Area (m2/g)
Sample Experim. Model Experim. Model Experim. Model Experim. Model
A 21.0 21.0 0.072 0.072 0.351 0.349 183 176
B 22.0 22.0 0.101 0.102 0.427 0.434 166 166
C 20.0 20.0 0.178 0.181 0.503 0.503 141 143
D 37.0 35.5 0.372 0.402 0.626 0.523 106 106
aAll data from Pimenta et al. (1998).
Figure 7. Probability curves for particle recovery in the three fractionations done to generate
the samples in Table III. Parameters A and B in the graph refer to the third fractionation.
1496 W. R. GILBERT
Dow
nloa
ded
by [
Tha
mm
asat
Uni
vers
ity L
ibra
ries
] at
00:
22 0
7 O
ctob
er 2
014

Mathematical simulation of the equilibrium catalyst density frac-tionation compensates for the experiment’s inherent inefficiencies, allow-ing for a more accurate evaluation of the model’s parameters. Theseinefficiencies explain why it is so difficult to separate the catalyst youngerfractions, which have a significant contribution to the equilibrium cata-lyst’s overall activity and selectivity.
Figure 8. Sample age distribution for the data in Table. CSTR age distribution is the sum of
the fractions age distribution.
Table IV Fitted Parameters and Equilibrium Catalyst Properties for the Sink-Float
Results of Table III
Fraction #1 Fraction #2 Fraction #3
A 6.00 5.77 3.31
B 1.21 2.83 3.03
Equil. catalyst
S (day71) 0.03
Niecat (w%) 0.21
Vecat (w%) 0.51
SA decay
SAi (cm2/g) 202
SA0 (cm2/g) 88
sav (cm2/g/w%) 60
Csa/k (w%71) 3
V transfer
cv/k (w%71) 10
Vfix (w%) 0.08
MODELING FCC CATALYST DEACTIVATION 1497
Dow
nloa
ded
by [
Tha
mm
asat
Uni
vers
ity L
ibra
ries
] at
00:
22 0
7 O
ctob
er 2
014

Finally, a deactivation model is a useful tool for improving laboratorycatalyst equilibrium simulation procedures in catalyst evaluation. Thecurrently used rules of thumb are highly subjective and may have been oneof the main reason for ranking mistakes in evaluations done in the past.
NOMENCLATURE
Ai sink-float fractionation efficiency parameter
Bi sink-float fractionation sample average age
csa deactivation rate constant, cm2/g/h
cv interparticle V exchange rate constant, day71 or h71
f age profile frequency distribution, day71
k feed contribution to Ni buildup, w%/day
Ni nickel concentration, w%
Niecat equilibrium catalyst Ni content, w%
pi probability a particle floats as a function of its age
S catalyst makeup rate, day71
SA specific area, cm2/g
SAi initial SA, cm2/g
SAmin minimum SA, cm2/g
sav SA versus V slope, cm2/g /w%
SA0 minimum SA for zero vanadium, cm2/g
t time, h or days
V vanadium concentration, ppm or w%
Vecat equilibrium catalyst V content, w%
Vfeed feed contribution to V buildup, w%/day
Vfix V in ecat unavailable for exchange, w%
VR V addition rate in CD unit, ppm/cycle
x sink-float density factor
REFERENCES
Anderson, S. L. and Mathias, R. H. (1954). Ind. Eng. Chem., 46(6), 1296.
Beyerlein, R. A., Tamborski, G. A., and Marshall, C. L. (1990). ACS Div. Pet.
Chem. Preprints, 35(4), 694�718.
Boock, L. T., Petti, T. F., and Rudesill, J. A. (1995). ACS Preprints of Int. Symp.
Deact. Test. H.C. Conv. Cat., August 1995, Chicago, 421�425.
Fuentes, G. A. (1985). App. Catal. 15, 33�40.
Gerritsen, L. A., Wijngaards, H. N. J., Verwoert, J., and O’Connor, P. (1991).
Akzo Catalysts Symposium, 109�124.
Kugler, E. L. and Leta, D. P. (1988). J. Catal., 109, 387�395.
Leuenberger, E. L. (1985). Oil Gas J., July 15, 125�128.
Mitchell, B. R. (1980). Ind. Eng. Chem. Prod. Res. Dev. 19, 209�213.
Palmer, J. L. and Cornelius, E. B. (1987). Appl. Catal., 35(2), 217�235.
Pimenta, R., Quinones, A., and Imhof, P. (1998). Akzo Catalysts Symposium, F-6
Wormsbecher, R. F., Cheng, W. C., and Harding, R. H. (1995). ACS Preprints of
International Symposium on Deactivation and Testing of Hydrocarbon Con-
version Catalysts, August 1995, Chicago, 482�486.
1498 W. R. GILBERT
Dow
nloa
ded
by [
Tha
mm
asat
Uni
vers
ity L
ibra
ries
] at
00:
22 0
7 O
ctob
er 2
014