mathematical and statistical - dimacsdimacs.rutgers.edu/sustainabilityreport/sustainability... ·...
TRANSCRIPT

CHALLENGES FOR SUSTAINABILITY
MATHEMATICAL AND STATISTICAL

Mathematical and Statistical
Challenges for Sustainability
Report of a Workshop held November 15-17, 2010
by Julie Rehmeyer
Editors: Margaret (Midge) Cozzens and Fred S. Roberts
May 31, 2011

2 | P a g e

3 | P a g e
The six North American mathematical sciences research institute sponsors of the Workshop on Mathematical Challenges for Sustainability are:

4 | P a g e
Acknowledgements The editors wish to express their sincere appreciation to Julie Rehmeyer,
the Science Writer for this project. The author and editors wish to acknowledge the organizing committee of
the workshop on Mathematical Challenges for Sustainability, on which this report was based, without whose hard work both the workshop and this report would not have been possible:
• Alejandro Adem, Pacific Institute for the Mathematical Sciences (PIMS) • Russell Caflisch, Institute for Pure and Applied Mathematics (IPAM) • Lou Gross, National Institute for Mathematical and Biological Synthesis
(NIMBios) • Iain Johnston, Former Chair, Mathematical and Physical Sciences
Advisory Committee to NSF • Simon Levin, co-Author of Toward a Science of Sustainability • Fred Roberts, the Center for Discrete Mathematics and Theoretical
Computer Science (DIMACS) • Christiane Rousseau, Centre de Recherches Mathematique (CRM) and
Chair of Program Mathematics of Planet Earth • Richard Smith, Statistical and Applied Mathematical Sciences Institute
(SAMSI) We would like to thank the National Science Foundation (NSF) for making the workshop on the Mathematical Challenges for Sustainability possible as well as for encouraging research involving mathematical and statistical scientists on issues of sustainability. In particular, we would like to thank the Division of Mathematical Sciences at NSF for their sponsorship of the workshop. We also wish to thank the Canadian Mathematical Sciences Institutes, which supported Canadian participation in the workshop, through support from the Natural Sciences and Engineering Research Council of Canada (NSERC).
The cover design is by Barbara Cozzens, who also provided substantial assistance with the images included in the report. Getty images provided most of the photos.
A special thank you goes to the American Mathematical Society, which has been very helpful in arranging to publish and circulate this report. .

5 | P a g e
TABLE OF CONTENTS
Executive Summary
Chapter 1… Human Well-being and the Natural Environment Chapter 2 … Human-Environmental Systems as Complex
Adaptive Systems Chapter 3 … Measuring and Monitoring Progress Toward
Sustainability Chapter 4 … Managing Human-Environmental Systems for Sustainability
Chapter 5 … Mathematical Challenges in Energy Sustainability
Conclusion Appendices: Group White Papers Appendix 1 … Human Well-being and the Natural Environment Appendix 2… Human-Environmental Systems as Complex Adaptive Systems Appendix 3 … Measuring and Monitoring, and Forecasting Progress
Toward Sustainability Appendix 4 … Managing Human-Environmental Systems for Sustainability Appendix 5… Mathematical Challenges in Energy Sustainability
6 | P a g e
Mathematical and Statistical Challenges for Sustainability
Executive Summary
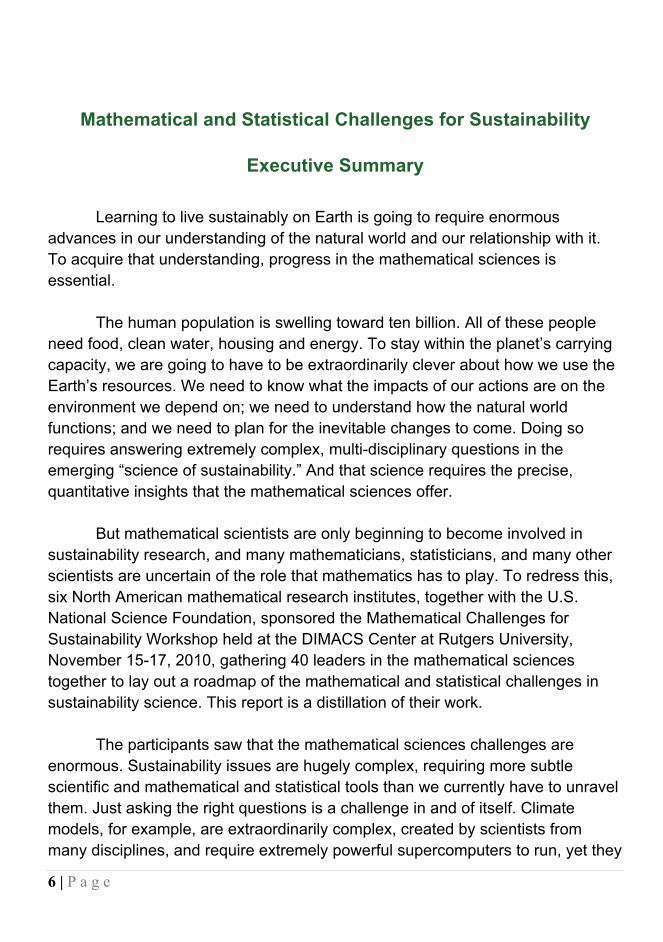
Learning to live sustainably on Earth is going to require enormous advances in our understanding of the natural world and our relationship with it. To acquire that understanding, progress in the mathematical sciences is essential.
The human population is swelling toward ten billion. All of these people need food, clean water, housing and energy. To stay within the planet’s carrying capacity, we are going to have to be extraordinarily clever about how we use the Earth’s resources. We need to know what the impacts of our actions are on the environment we depend on; we need to understand how the natural world functions; and we need to plan for the inevitable changes to come. Doing so requires answering extremely complex, multi-disciplinary questions in the emerging “science of sustainability.” And that science requires the precise, quantitative insights that the mathematical sciences offer.
But mathematical scientists are only beginning to become involved in sustainability research, and many mathematicians, statisticians, and many other scientists are uncertain of the role that mathematics has to play. To redress this, six North American mathematical research institutes, together with the U.S. National Science Foundation, sponsored the Mathematical Challenges for Sustainability Workshop held at the DIMACS Center at Rutgers University, November 15-17, 2010, gathering 40 leaders in the mathematical sciences together to lay out a roadmap of the mathematical and statistical challenges in sustainability science. This report is a distillation of their work.
The participants saw that the mathematical sciences challenges are enormous. Sustainability issues are hugely complex, requiring more subtle scientific and mathematical and statistical tools than we currently have to unravel them. Just asking the right questions is a challenge in and of itself. Climate models, for example, are extraordinarily complex, created by scientists from many disciplines, and require extremely powerful supercomputers to run, yet they

7 | P a g e
provide only a crude and imprecise approximation of the true processes affecting climate. They are raising mathematical and statistical questions that have never before been faced, and right now, we don’t have the answers.
Almost every sustainability challenge we face requires new mathematical tools. For instance, saving the world’s fisheries will require us to understand the mechanisms of evolution of fish populations and to develop intricate strategies for assuring a stable and ample supply of fish under environmental stressors of various kinds. Addressing these challenges requires countries with competing interests to work together, and that cooperation has to be attained with no world governing body to enforce it. The only way an agreement will work is if participating countries are eager to adhere to it because doing so is in the self-interest of each one – but such agreements are so difficult to create that they demand the power of new mathematical tools for bargaining and fair allocation, which have barely begun to be used in creating fishery treaties.
Economic issues, which are deeply interwoven with sustainability issues, raise their own mathematical and statistical challenges. To decide how much we should spend to protect an ecosystem, for example, we need to be able to forecast the economic impacts of our decisions. But our current models of the economy are woefully lacking – as the 2008 financial crisis dramatically demonstrated. The starting assumptions in these economic models is that the market will stay in equilibrium and that all participants will behave rationally, but those assumptions are simply not true, and in many cases, they’re not even close to being true. Furthermore, economics and the environment are intricately connected, with economic issues affecting the environment and the environment in turn affecting the economy (as vividly illustrated by the economic impacts of the 2011 earthquake and tsunami in Japan). Thus the only way to understand the real impacts is to integrate economic models with mathematical models of climate, energy, biodiversity, etc., a task that presents dramatic new challenges. Moreover, with the increase in the world population, we may have to revisit the definition of a healthy economy. Complex issues arise, including issues concerning the carbon market, concepts of equity between nations and intergenerational equity, etc. Addressing these issues requires new partnerships between mathematical scientists and social scientists.
The examples go on and on: Monitoring the state of our forests requires new methods for combining vast streams of data into a single, coherent picture, a

8 | P a g e
mathematical task we can’t yet do very well. The problem is exacerbated by the possibility that climate change could cause our forest ecosystems to be replaced by more tropical ones or that it might expose our forests to new invasive species like the mountain pine beetle. Understanding the mechanisms of changing forest health and how to prevent unhealthy forest evolution presents challenges for many disciplines, with mathematics heavily involved with each one.
Similarly, transforming our energy infrastructure will require the mathematical tools to design a more robust power grid, mathematically guided improvements in materials science to build better batteries, and better incentive schemes to make cap-and-trade solutions effectively reduce carbon emissions. And planning how to respond to the heat waves, tsunamis, hurricanes, and floods that some models predict will be unleashed by climate change requires new, mathematically-guided strategies for evacuations, for hospital triage, and for supply transportation, as well as new approaches to mitigate the effects of these natural disasters.
Meeting these mathematical and statistical challenges is going to require more mathematical scientists to get involved, new ways for mathematical scientists to interact with other disciplines, and greater levels of funding for mathematical work in sustainability. This report is designed to lay out the mathematical challenges that face us in sustainability science. The field is so broad that this report can’t possibly describe every challenge, but it provides a number of representative examples that show the range of work that remains to be done. The Appendices present white papers written by participants in the workshop and go into more detail at a somewhat more technical level. However, even these white papers provide only a sampling of the challenges that face us.
The mathematical and statistical scientists at the Mathematical Challenges for Sustainability Workshop at Rutgers were divided into groups to brainstorm about the mathematical sciences challenges in five different areas. The first, Human Well-Being and the Natural Environment, focused on the interrelationship between human needs and ecological needs. We depend on being able to use the resources of the natural environment. One way of doing so sustainably is to use resources no more quickly than nature can regenerate them. Another way, which can also be sustainable, is to deplete natural stocks and to convert them into another form of capital (manufactured, human, or social) at a rate that is capable of maintaining human well-being over the long term. This group laid out

9 | P a g e
the mathematical methods that we need to do this effectively along with some of the challenges we face. For example, we need to be able to precisely quantify natural capital as well as human and natural well-being, to understand how our activities affect natural capital, to calculate how quickly nature can regenerate, to develop ways we can adapt to a changing environment, and to make responsible decisions balancing the needs of people today with the needs of future generations and balancing the needs of different people around the world.
The second group focused on Human-Environment Systems as Complex Adaptive Systems. The interactions between humans and the environment are both extraordinarily complex and constantly changing, with interacting feedbacks between different parts of the system. For example, humans farm, which affects the health of the soil; the health of the soil then affects where humans farm, which in turn affects the health of the soil. The science of complex adaptive systems has been developing to understand interactions like these. This group looked at how the mathematics of complex adaptive systems can illuminate the interactions between humans and their environment.
The third group discussed Measuring and Monitoring Progress toward Sustainability. To learn to live sustainably, we’ve got to know how well we’re doing. But measuring the health of a forest or an ocean is an extremely complex task: You have to collect a huge amount of data, get the most information possible given limited resources, and then make sense of the data you get. Every step raises mathematical and statistical challenges.
The fourth group examined Managing Human-Environment Systems for Sustainability. The central point of sustainability science is to guide decision-making. This group examined this final step. For example, given current trajectories, society might have to double food production in the next 40 years while reducing pollution impacts on lakes and rivers and reducing the rates of biodiversity loss associated with land-use change and overfishing. How are we going to do it? This group laid out the mathematical sciences tools needed to put together what we know into a precisely defined set of questions and into a practical course of action.
The fifth group examined Mathematical Challenges in Energy Sustainability as an in-depth case study that touches on all four previous groups. The energy system needs a radical transformation, fast, and so does the relation

10 | P a g e
of human activity to energy. Oil is becoming depleted. Greenhouse gases resulting from the use of fossil fuels appear to be affecting the climate. The U.S. is too dependent on foreign energy supplies. Developing countries don’t have sufficient energy sources. We face radical challenges with energy, and this group discussed how mathematical scientists can help us address them.
Before the workshop, selected participants wrote and shared a set of white papers as seeds for the discussion, and, in the end, each group wrote a white paper summarizing their discussions and describing the mathematical sciences challenges in their area. The full text of the group white papers appears in the Appendix of this report, while both sets of white papers appear on the workshop website at http://dimacs.rutgers.edu/SustainabilityReport/. This report is a distillation of this work for the general mathematical sciences audience and the general public.
The structure used was chosen because this workshop was a follow-up to a 2009 workshop entitled “Toward a Science of Sustainability” that used a similar structure. That workshop brought together a highly multi-disciplinary team of researchers to lay out the scientific challenges in sustainability as a whole. The Mathematical Challenges for Sustainability workshop which followed, and which is discussed in this report, focused on the mathematical sciences challenges particular to sustainability. Perhaps the biggest challenges for mathematical scientists, however, are to learn to ask the right questions, to learn how to work together with scientists in other disciplines, and to determine how to train their students to do so, so as to address these complex but crucial problems facing our world.
A word or two about what this report aims to do and what it does not. First, the report aims to rally the mathematical sciences community to work on the problems of sustainability. This will require more than simply applying their methods to small, well-defined problems. It will involve collaborating with scientists from many disciplines, and it will involve mathematical scientists in using their skills to make the new challenges precise, to ask the right questions, and to contribute to making progress to address them. Secondly, the report aims to demonstrate to a broader audience, including public servants, government agencies, and members of the public, just what some important sustainability problems are and why mathematical scientists have a role to play in solving them. This report does not claim to provide solutions to problems of sustainability

11 | P a g e
nor does it claim that mathematical scientists will be able to solve them alone – they will need involvement with new communities and new applications.
Many thanks to the National Science Foundation (NSF) for making the Mathematical Challenges for Sustainability workshop possible and for encouraging research involving mathematical scientists on issues of sustainability. Particular thanks go to the Division of Mathematical Sciences at NSF for their sponsorship of the workshop. Thanks also to the Canadian mathematical sciences institutes, which supported Canadian participation in the workshop through support from the Natural Sciences and Engineering Research Council of Canada (NSERC).

12 | P a g e
CHAPTER 1
Human Well-being and the Natural Environment
Humans depend on the resources of the natural environment. This chapter lays out the mathematical sciences methods needed to help assess whether our use of environmental resources is sustainable, to protect humans from the consequences of environmental change, and to meet human needs while limiting environmental damage.
A hurricane picks up speed and force as it passes the Carolinas.
Hurricanes in that region are notoriously unpredictable, but it appears to be headed straight for Manhattan. Officials order an evacuation, and bridges, highways, and trains clog. Although it’s hours before the storm hits – if it hits at all – flooding has already begun, and subways are getting inundated. There simply isn’t enough time to get everyone out.
History gives a hint of the damage to come. In 1821, a much smaller storm raised the tide 13 feet in an hour, causing the flooded East and Hudson rivers to swamp lower Manhattan all the way to Canal Street. Blessedly few people died – but that was only because the storm landed at low tide and lower Manhattan was much less populated than it is now. In 1938, a hurricane killed around 700 people in Long Island, NY and areas of New England.
The next hurricane, though, could be far worse. As the climate changes, development increases, and ecosystems become more fragile, hurricanes could become more frequent and intense in years to come – along with wildfires, tsunamis, floods and heat waves.
And this is one of the worst possible disasters. The New York harbor
forms a funnel for the incoming storm surge, and with nowhere else to go, the water could be pushed 30 feet high. All three airports would end up underwater. The damage could keep the port of New York and the New York Stock Exchange closed for weeks, causing global economic havoc.

13 | P a g e
Figure 1: Though a hurricane in New York City is not especially probable, the results could be catastrophic. A storm surge could endanger millions. Mathematics is essential for planning evacuation and response strategies. Credit: Fred Roberts.
Indeed, The Federal Emergency Management Agency has identified three
“max max” disasters that would cause devastation on a scale never seen before, and this is one of them. But the damage remains to be dealt with in the future. The immediate question is: What’s the most efficient way to evacuate?
When the time comes that New York City faces that question, the quality of its answer could depend significantly on how much we’ve invested in mathematical sciences research today.
The odds of a hurricane like this in any given year are extraordinarily low. But over the long run, a strong hurricane is virtually certain to hit Manhattan, particularly as the climate becomes less stable and sea levels rise. And human population along the shoreline has relentlessly increased, magnifying our vulnerability. Determining how many people can be evacuated and how quickly, what the safest option is for people too frail to travel, the conditions under which it would be safe for people to weather the storm in place, where people should evacuate to, and many more such questions rely on mathematical models that can simulate terrible scenarios we hope never to play out in real life.
Such models cannot be generated by mathematicians acting in isolation.
They require partnerships between mathematical scientists and scientists in

14 | P a g e
other disciplines. This is true of many questions in sustainability science. In the case of the hurricane, for example, there are many more questions that need to be asked, increasingly complex and subtle questions. A key role of mathematical scientists, collaborating with others, is to help pose the right questions. For example: What happens after the evacuation? Or suppose that the hurricane occurs at the time of an epidemic when people are in quarantine; how does this change our response? Also, how much does it cost to repair the damage? Is the economy of the region destroyed? What are the indirect economic effects of the disaster and how can they be measured? And is it a good idea to repair the damage or should the center of the city be moved over the long term? Could we have prevented some of the damage by building dikes? Should we invest in dikes for the future, considering that hurricanes are likely to become more frequent and stronger in the future? What if there are several hurricanes in a period of a few years? These are just some of the questions we can ask. For each of the examples given in this report, we could ask many similar questions.
Operations research and discrete mathematics have long studied questions like those about evacuation, but answering such questions pushes existing tools beyond their capabilities. For example, in an evacuation, decisions need to be made about how many doctors and nurses need to stay behind to care for those who don’t evacuate, and where those medical personnel should be assigned. This “job assignment problem” is a classical one in operations research, but existing techniques don’t deal with uncertainty well. In a real evacuation, uncertainty is huge: How many doctors and nurses will be willing to put themselves at risk by staying behind? How long will the city remain inundated? How many people will need care, and what will their medical needs be? Planning in the face of this uncertainty will require new tools in the field known as “stochastic optimization” (optimization under uncertainty/randomness). Similar questions surround stockpiling supplies at evacuation sites. Inventory planning has long been studied in operations research, but existing methods don’t deal well with uncertainty of the kind we might experience.
Human well-being includes adequate food, housing, and water; good health; a secure and pleasant environment (one protected against natural disasters as well as threatening changes in the climate, rising sea level, etc.); and a prosperous economy so that people have jobs. The hurricane scenarios illustrate how human well-being, in all these senses, is intimately connected to the health of our ecosystems. We have learned that our decisions enormously

15 | P a g e
affect the robustness of the natural environments that we depend on, in some ways that we understand and many that we don’t fully understand. The mathematical sciences have a key role to play in elucidating and planning for these impacts.
A basic but challenging need is the ability to quantify how well the ecosystems we depend on are doing, so that we can see whether they’re getting better or worse. Mathematicians are particularly attuned to this need, since mathematics is the science of deducing the logical consequences of carefully defined statements. So when a mathematician examines ecosystem health, the natural first question is, how do we define it?
Biologists have come to realize that the health of ecosystems is intimately tied up with the diversity of life within them. The more complex the web of life, the more resilient it is – and conversely, the less complex, the more fragile. When the potato blight arrived in Ireland in the early 1840s, for example, a third of the Irish people depended on the potato for all of their food, only two species of potato existed on the island, and both were susceptible to the disease. A million people starved. By contrast, when rice grassy stunt virus struck Asia in the 1970s, more than six thousand species of rice grew in the area. Scientists tested them all, and just one was able to withstand the virus. By hybridizing that type of rice, rice cultivation could be saved. Examples like these have proven that an ecosystem that is more diverse is more robust and healthier – and the people who depend on it are less vulnerable.
But this observation, though helpful, isn’t precise enough for mathematical scientists. In partnership with biologists, they need to formulate more specific questions. What do we mean by biodiversity? How do we measure it? A first cut would be simply to use the number of species: More species imply greater diversity. Even so simple a definition as this raises mathematical questions: How do you effectively count the number of species, particularly when comparing different ecosystems in which species may be easier or harder to find? How does the length of time you explore an ecosystem affect the number of species discovered? How does the number of new species discovered in a day decrease over time? Furthermore, if a forest has one area that’s all hemlocks, another that’s all pines, and another that’s all spruces, it won’t have the interconnected web of

16 | P a g e
relationships between the species that creates robustness. So, mathematical scientists have developed measures that account for the spatial distribution of species.
That doesn’t capture everything, though, because those species also have to occur in appropriate numbers. A forest that is almost all pine, with a few trees from a variety of other species sprinkled evenly throughout, isn’t biodiverse, even though it may contain a large number of species that are well distributed. But equal numbers of individuals of different species also may not be appropriate: You don’t want to have the same number of lions as zebras. So, mathematical scientists have helped to develop measures that capture the appropriateness of the distribution of individuals among species. Developing these preliminary ideas further will require close collaboration with biologists to produce new and more intricate methods designed to handle problems that address the wide variety of criteria that will enter into a more sophisticated definition of biodiversity.
Such more sophisticated measures can be derived by examining the entire food web. By mapping out the relationships of who eats whom and analyzing the resultant graph, teams of mathematical scientists and ecologists can ask questions like: If you were to eliminate a group of animals, would the network structure collapse? Which species are critical to the overall robustness of the connections in the food web? Is present biodiversity a good predictor of future biodiversity?
Each of these questions captures a different aspect of biodiversity, and all of them are relevant in different contexts. Scientists have sensibly abandoned the idea that they may find the one true perfect definition, and instead they use each definition to get a different view of the overall issue of diversity. That raises the challenge, however, of finding systematic ways of combining the measures. Furthermore, current measures are rather crude, capturing only the least subtle aspects of biodiversity.
Biodiversity not only indicates the health of ecosystems that we depend on but also directly contributes to human well-being. Wild varieties of domestic crops provide a wealth of genes with valuable properties like pest-resistance, greater hardiness, or faster growth. Many of our pharmaceutical drugs are derived from wild plants. Recent work has also shown that humans are more susceptible to disease spread when biodiversity decreases. For example, forest fragmentation

17 | P a g e
has led to lower numbers of opossums (which are poor hosts for the pathogen that causes Lyme disease) and higher numbers of white-footed mice (which are excellent hosts), leading to more Lyme disease cases in humans.
Figure 2: Mathematical models have helped officials manage foot-and-mouth disease in the U.K. and in particular led to a series of ring culling strategies that helped control the potentially devastating 2001 epidemic. (Getty images)
This points to another mathematical need: Mathematical models are a key way to plan effective responses to disease outbreaks. The need could be even greater if diseases emerge in new locations or re-emerge in old locations because of changing climates. (See for instance the map in Figure 3, which shows places where malaria might re-emerge in the U.S.) Suppose, for example, that a deadly new virus emerges in Africa: Would we be better off sending our national stockpiles of medicines to Africa in the hope of containing it, or should we hang onto them for our own use? Or if terrorists were to release the plague in Chicago, would it be more effective to administer antibiotics widely, or to impose mass quarantines? These questions are at the heart of mathematical approaches to epidemiology. Mathematical models guided the response to cholera in Haiti as it unfolded after the recent earthquake, helping decide where to put treatment centers, where to provide palliative care, and how to distribute the very scarce resources among a huge number of sick people. Models have also been essential to planning immunization strategies and managing foot-and-mouth disease in the U.K.

18 | P a g e
Figure 3: Currently, about 1,200 malaria cases are reported each year in the United States, almost all in people who were infected in other parts of the world. But small outbreaks of malaria have occurred within the U.S. when imported cases have been transmitted to others. So far, the outbreaks have been quickly and easily contained, but the potential exists for malaria to re-emerge as a native disease throughout much of the U.S. Credit: CDC.
Another effort being pursued now is to develop models to guide triage
decisions. Ordinarily, the sickest patients are treated first, while those who can wait without getting much worse do so. In the midst of a crisis like a major earthquake or an epidemic outbreak, however, medical resources may be insufficient to treat everyone, and more people will benefit if resources are allocated first to those who can best make use of them. At the moment, nurses may have to make a gut decision about when to switch protocols. A mathematical model could provide guidance to help make a more informed decision.
Epidemiological models like these are developed enough to have proven their worth, but much work remains to be done, and we have to be especially vigilant to make sure that we are not just solving interesting mathematical problems whose solution will have no useful connection to true public health. Agent-based models are one promising approach, for example. They create individuals inside the computer and model their movement along with the

19 | P a g e
movement of any pathogens they carry, but they’ve only recently been used in this context. Current models often make simplifying assumptions that aren’t borne out in real life. For example, they assume that if the government imposes a quarantine, people will obey it. In Singapore during the SARS epidemic, however, the threat of fines and jail time proved insufficient to persuade quarantined people to stay home. Authorities ultimately installed webcams in the homes of everyone quarantined, telephoned them three times a day, and required them to take their temperature on camera. Such measures probably wouldn’t be tolerated in a less authoritarian state. To deal with similar public health challenges in the future, we need to foster collaborations between mathematical scientists and researchers from the economic, social, and behavioral sciences.
Figure 4: A cholera hospital can be set up relatively quickly, saving the lives of those infected and helping to control the spread of the disease. Mathematical models were used to help officials decide where to place such hospitals during the 2010 cholera epidemic in Haiti. Since a cholera epidemic was first confirmed in October in Haiti’s Artibonite region, hospitals were set up and teams have treated more than 10,000 suspected cases nationwide. Credit: Richard Accidat/MSF, Nov 11, 2010. Mathematical and statistical models need to be developed that allow for
imperfect compliance with quarantines and that help to determine the combination of punishments and rewards that will be sufficient to keep quarantined individuals in their homes with minimal intrusions on their freedom and privacy. Similar issues arise in introducing model assumptions about compliance with vaccination orders, travel restrictions, or other public health interventions. Developing mathematical models for issues like these – much of

20 | P a g e
which hasn’t yet been undertaken at all – is valuable both for the specific predictions they make and for the deepened understanding they create. Developing the models takes scientists from a general, qualitative understanding of the dynamics driving disease to a concrete, quantitative understanding of which forces are truly critical and why.
Models also have a role to play in elucidating water quality issues, such as how pollutants like phosphorous runoff from farmland can affect the health of lakes. A lake is able to accommodate runoff without significant ecological damage as long as the levels don’t get too high. A sudden, intense rainstorm, however, might wash enough phosphorous into the lake to kill off fish, disrupt the ecological function of the lake, and destroy much of its economic value. It’s then difficult for the lake to return to its previous, functional state. Mathematically, these two states (healthy and unhealthy) can be understood as “basins of attraction” in state space, stable states that the lake can be in. While mathematicians have worked on the local dynamics of these basins of attraction, the theory underlying how systems can stochastically shift from one state to another is poorly understood.
These are just a few examples of how the mathematical sciences can help protect human well-being as ecosystems change, among many more. Changing migration patterns of birds affect human well-being because birds help control insect populations that can destroy crops. As the climate changes, birds sometimes arrive in places before or after their traditional food sources have arrived. But the effects of climate change have not yet been included in migration models. Similar issues affect fish migration, and understanding and predicting fish movement is key for protecting fisheries over the long term. Fish migration is also impacted by the increasing acidification of the oceans caused by climate change, and mathematical questions abound in models of ocean acidification.
Some of the mathematical sciences challenges in the area of human well-being and the natural environment are:
• Climate models strongly need new mathematical methods for understanding uncertainty. Additionally, better models are needed of extreme events like heat waves or hurricanes, or gradual events such as increase in sea level, at the scale of cities rather than large regions of the globe. And we need statistical tools for analyzing the impact

21 | P a g e
(both spatial and temporal) of extreme or gradual events.
• To prepare for rare extreme events, classical problems in operations research need to be expanded to deal with uncertainty. Furthermore, mathematical models are needed to help understand how human health will be impacted by events like heat waves.
• We need clear, mathematically precise criteria to measure biodiversity
that are robust even given the difficulties of gathering data in sometimes harsh environments. We need ways of combining multiple measures to create an overall picture of biodiversity. We then need methods to use these measures to attain sustainable ecosystems. All of this must be done in the context of uncertain, but potentially large impacts on biodiversity of changing climate, and global environmental change more generally.
• We need models of animal migration that take climate change and
other human disruptions into account. New tools such as network theory and others might offer an opportunity to develop richer models of migration than our existing ones.
• We need mathematical models that will describe how agriculture both
affects and is affected by the availability and quality of fresh water. Improved models of ocean acidification are needed. We need improved monitoring methods using statistics, machine learning and remote sensing to allow us to detect changes in the health of bodies of water much more quickly.

22 | P a g e
CHAPTER 2
Human-Environmental Systems as
Complex Adaptive Systems Interactions between humans and the environment are both extraordinarily complex and constantly changing, with interacting feedbacks between different parts of the system. The science of complex adaptive systems has been developing to understand interactions like these. This chapter looks at how the mathematics of complex adaptive systems can illuminate the interactions between humans and their environment.
Sustainability science is hard!
The problem is that answering the questions we care about – How can we stop a new virus from spreading? How many tuna can we sustainably catch? What will the climate be like in fifty years? – requires understanding systems that are enormously complex and constantly changing.
Historically, science has tackled complex questions by breaking them down into simpler components that can be understood separately. For example, legend has it that Newton worked out his laws of motion by studying a falling apple. Once he discovered those laws, he could use them to understand such complex questions as how the planets wheel about the heavens. Predicting planetary motion with perfect precision gets tough – after all, every object in the universe is simultaneously pushing and pulling on the Earth, and Einstein’s relativity theory tweaks the orbit as well – but Newton was able to get an excellent approximation using the simple principles that govern the apple.
That’s not possible with many of the problems in sustainability, because the parts of the system interact in much more subtle ways, with changes that feed back into one another. For example, when the planet gets warmer, sea ice melts. The dark ocean that is then exposed absorbs more heat than the white sea ice does. That makes the planet get warmer, which melts more sea ice, which warms the planet, which melts more sea ice… As a result, to predict future temperatures, it’s not enough to understand the isolated questions of how sea ice

23 | P a g e
melts in response to rising temperatures or how temperatures rise in response to melting sea ice: You also have to understand how the melting ice and the rising temperatures affect one another. And until you do, your predictions – unlike Newton’s excellent approximation – may be grossly inaccurate.
Figure 5: Larsen_B_Collapse. In 2002, a 12,000-year-old Antarctic ice shelf the size of Rhode Island collapsed as a result of rising temperatures. This exposed the dark seawater beneath the ice, which absorbs more of the sun’s warmth, contributing to further warming. Credit: Robert A. Rohde
Unfortunately, most human-environment systems (HESs) will behave more like the climate than like Newton’s planets. Feedbacks are inherent in an HES: Human behavior impacts the environment, and environmental changes in turn impact human behavior, forming a feedback loop. Systems like this, with many interacting parts that change over time, are called complex adaptive systems. And the mathematics of complex adaptive systems is still poorly understood.
The field has only emerged in the last thirty years, and it’s a challenging one because the large-scale behavior of such systems as a whole can be remarkably different from the small-scale behavior of the interacting parts. For example, ants, which individually behave in thoughtless, preprogrammed ways, form colonies that can build bridges, carry dead insects hundreds of times an ant’s bodyweight, and find the shortest path between two points.

24 | P a g e
One of the most fundamental discoveries that has come out of the study of complex adaptive systems is a rather appalling one: These systems sometimes behave in ways that cannot be predicted – no matter how good the science is or how powerful our computers are. That means that on a practical level, even the wisest and most well-informed policymaker can make decisions that have unintended consequences. One lesson of the science of complexity, then, is that humility and caution are essential in the face of this irremediable uncertainty. The uncertainty applies to all complex adaptive systems, including cities, fisheries, forests, ocean-atmosphere systems, water supplies, financial markets – really, any interaction between humans and a natural system.
Nevertheless, the study of complex adaptive systems can guide decisions, even if it can’t guarantee particular outcomes. Mathematical scientists can describe the range of behaviors a system might have, find critical thresholds where the behavior might suddenly change, understand how different parts of the system interact, and give decision makers a good sense of the most likely outcomes.
Climate models are an example where this kind of information could be hugely helpful, but so far, few mathematical scientists have been deeply involved in developing these models. These models are extremely complex computer programs that draw in expertise from mathematics, physics, chemistry and other sciences, thus forming the collaborative brainchildren of hundreds of scientists working in parallel. Chemists model how reactions among airborne molecules affect the transparency of the air; oceanographers model how the currents stir the oceans; atmospheric scientists model how clouds reflect sunlight. Each of these parts and many more are then assembled into a giant model that gives us the clearest view we can get of what our climate future is likely to hold. Analyzing such models requires months of time to run on our fastest supercomputers. Yet, when all is said and done, these models are only crude and imprecise representations of the true processes affecting climate.
Since climate is a complex adaptive system, mathematicians know that the interactions of all these different parts deeply matter. And climate scientists know it too: The El Niño effect, a climate pattern that occurs about every five years and changes the weather throughout the tropical Pacific ocean area, is created by the interaction of the ocean and the atmosphere. Until climate models

25 | P a g e
allowed the two to influence one another, they couldn’t capture this critical phenomenon.
Nevertheless, climate modelers have only just begun to include such feedbacks into their models. The delay hasn’t been because they haven’t thought such feedbacks were important; it’s been because modeling them is extremely tricky. Feedback effects can make tiny inaccuracies blow up into massive errors over time. The models need to be designed with enormous care to control for this.
And no one really knows how to do it. Climate modelers are trying to figure it out in the context of these enormously complex models, ones which no single person could possibly understand in their entirety. It’s an overwhelmingly confusing and difficult task (that can come down to the impossibility of solving a large system of partial differential equations exactly through “discrete approximation”). What they need is something analogous to what biologists have in the fruit fly: a simpler case to study to develop a basic understanding of how things work. Long before tackling the horrifically complex human genome, for example, biologists cut their teeth by sequencing the fruit fly. Armed with a simple model like the fruit fly, climate scientists would have a vastly easier time unraveling how the various components of climate interact with one another.
Mathematical scientists can play a leading role in providing this simpler model. They specialize in abstraction, reaching beneath the messy details of real life to expose the skeleton beneath. They can learn from climate scientists what the most important elements are and then explore how those elements interact by analyzing relatively simpler mathematical models that can be thoroughly understood. However, there is a danger here: We must be careful not to think that solving a simpler, though still relatively complex, mathematical problem is the end of the story. It is only the beginning.
Mathematical scientists can also work with climate scientists to deal with the uncertainty in their models that is inevitable because these models are of complex adaptive systems. Scientists will never, for example, be able to produce a model that can tell us the precise lowest wintertime temperature in Manhattan in fifty years. Accepting that limitation allows scientists to focus on the questions that can be answered, like, what’s the best estimate they can make, and what is

26 | P a g e
the range of uncertainty? Or how can we remove the rapid oscillations and variations that come from meteorology to concentrate on the long term variations that we need in climate science? So far, climate modelers have been so focused on making the best predictions possible that they have not devoted as much effort to quantifying the uncertainty. But for practical decision-making, the uncertainty is as important as the prediction. If, for example, a utility is laying water pipe that will be used for 50 years, they need to know not only the coldest wintertime temperatures that are expected, but a range of the coldest temperatures with their probabilities, and the possibility that extreme temperatures may become more likely in a new climate regime. The mathematical and statistical tools required to understand this kind of uncertainty don’t yet exist.
These kinds of mathematical tools and insights are needed to understand HESs of all types. Contrary to the central lesson of complex adaptive systems – that understanding how the components interact is key to predicting how the total system will behave – the environment and human activity are almost always studied in isolation. For example, demographic trends are used to predict how much farmland people will demand, while a separate study might look at how human migration patterns are affected by landslides. But as people move into an area they need more farmland, so they farm steeper, less suitable land and as a consequence make the land more susceptible to landslides – and in turn, when landslides destroy farmland, people are forced to migrate away. Understanding the system as a whole requires integrating these two types of studies. In fact, population is a primary driver of every environmental challenge that threatens sustainability: generation of greenhouse gases, other pollutants and toxic waste; depletion of resources, including water, oil, fisheries, topsoil; resource wars and civil conflicts; malnutrition and world hunger; lack of resources for education and health care, especially in poor countries; best farmland converted to urban and suburban sprawl; garbage disposal and the need to find more landfill space; species extinction. But, the classic mathematically-based topic of population science does not begin to address the true complexity of factors affecting and affected by population.

27 | P a g e
Figure 6: Human-nature interactions can be complex and surprising. As parks in Africa protect ecosystems and the animals that thrive in them, animals sometimes leave the park and cause problems in nearby farms. Baboons in particular are a serious source of crop destruction in the areas near national parks in Africa, as are elephants and other species. Protecting farmers is critical for maintaining public support for wildlife protection. Credit: Fred Roberts.
So to properly understand any of these problems involving HESs, the model of the human system and the model of the environmental system need to be fully coupled.
Such fully coupled systems are still in their infancy, and building them will require solving a host of mathematical problems. First, we have to tease out how the different aspects of the system interact, which requires identifying all the feedbacks in the system. Particularly when linking human and natural systems, this can be extremely tricky. For example, integrated assessment models attempt to predict the impact of climate change on the economy. However, they rely on United Nations projections for population and don’t consider the effect variations in climate might have on population size. This extremely complex feedback loop presents a challenge for mathematical modelers. The problem is further complicated by the differing time scales over which environmental systems and human systems evolve.
Next, we have to encode interactions in a computer model, which inevitably requires clever simplifications. For example, models inevitably require parameters – that is, numbers that capture an aspect of how the system works. In a climate model, for example, the reflectiveness of the clouds might be

28 | P a g e
captured by a single number. In reality, of course, cloud reflectiveness varies, but some reasonable estimate has to be given. Finding the best values for these parameters in a way that is effective and is based on well-defined mathematical and physical principles is extremely difficult.
Figure 7: Clouds vary in their reflectiveness, but in order to be computationally manageable, climate models have to approximate their reflectiveness with a single number called a parameter. Much mathematical work needs to be done to come up with the best values for these parameters. Credit: Fred Roberts.
Once the models are built, they need to be analyzed so that they can provide useful information. This is also tricky, since precise predictions are impossible, but mathematicians can still pull out a qualitative understanding of how the system behaves. For example, some systems have tipping points, thresholds where the system suddenly starts acting very differently: With climate, if global temperatures rise enough to melt the Greenland ice sheet, the climate would be irreversibly changed; with infectious disease, if a virus spreads enough to reach people who fly, it could become a global pandemic rather than a local contagion; with fisheries, when fish populations dip below some threshold, the entire species may disappear. Understanding when the tipping points can occur within a system and identifying where those tipping points are, as precisely as possible, is critical.
Pulling predictions from the model raises another set of mathematical and statistical questions. Scientists have found that the “wisdom of the crowd” applies to models as well as people: under the right conditions, when multiple models

29 | P a g e
describing the same system have been built, an average of the output of the different models can be better than any single prediction. It’s therefore immensely valuable to have an ensemble of models, each designed somewhat differently. But what’s the best way to put their predictions together into a single best estimate? The most straightforward is to just average them, but sometimes, one model is known to be better than another much of the time. In that case, it may be that weighting the output of the models according to quality would produce a better prediction. But mathematical scientists don’t yet know the best ways to combine the forecasts of different models, so a huge amount of work remains to be done in this area.
The importance of ensembles also points to the need for the same problem to be modeled in different ways. Mathematicians are working to build and understand entire new classes of models for this purpose. Infectious disease, for example, can be studied using network models, in which each individual is modeled as a node in a network and the people they have contact with (and might spread disease to) are connected to them by an edge. Network models have the potential to be very powerful, but their application to the understanding of complex adaptive systems is sufficiently new that their theoretical underpinning requires further development. Studying complex systems from multiple perspectives, using different modeling paradigms, helps deal with their inherent difficulty.
The economy points to another kind of model that needs to be built.
Economic concerns are essential to almost all sustainability issues, but our current ability to forecast the economy is very limited. Current economic models entirely ignore its complex adaptive nature; instead they imagine the economy as a fundamentally unchanging structure that stays in equilibrium. The complete failure of such models to predict the 2008 economic collapse points out their deep limitations. A bubble is essentially a positive feedback loop that is carried to its limits, and these static models are by their fundamental design incapable of predicting them. So, new models of the economy, using the principles of complex adaptive systems, need to be built. Then these models need to be linked to models of the environment.

30 | P a g e
Some of the major mathematical sciences challenges in the area of human-environment systems as complex adaptive systems are:
• New mathematical models need to be built that can describe complex adaptive systems. Such models need to operate at a variety of scales: for example, on a small scale, an individual subsistence farmer interacts with the land he’s cleared from the Amazon forest, while on a large scale, the clearing of the rainforest has an impact on the global climate. An individual farmer and his land would be described by one model, while the rainforest’s relationship with global climate would be captured by another. These models need to be designed so that they can be put together into a super-model capturing both levels of interaction. The output of the model needs to shed light on the behavior of the system at all its different scales, both describing how the farmers and their land will act differently over time and how the rainforest and climate will develop.
• These models need to be powerful enough to deal with the
complexities of messy, real-world data, which has the mathematically unpleasant characteristics of being “discrete” and “non-smooth.”
• Once such multi-scale, composable models have been developed,
they need to be understood theoretically. In particular, what happens when two models that are designed in very different ways – for example, a network model and a traditional differential equation model – are put together?
• Modern techniques in network models allow us to understand and
utilize huge and complex networks. These are especially important, and the practical and theoretical basis for utilizing such massive network models needs to be developed. In particular, new techniques are needed to understand how the shape of these networks changes over time.
• An expanded mathematical toolkit is needed to couple model of the
environment with models of human activity. A particular challenge is that the cycles of human activity are often at odds with the cycles of

31 | P a g e
environmental change; for example, a politician is usually in office for only a few years, while the effects of his or her decisions on the environment may not be seen for decades. New mathematical methods are needed to characterize this discrepancy and to develop strategies for managing it, including subtle uses of discounting to better understand the tradeoff between short-term economic gain and long-term environmental degradation and the development of the science of uncertainty to better understand the likelihood of long-term impacts of current activities.
• HESs often involve very complex datasets that are then reduced to
many fewer variables in order to make the problems tractable. The health of an individual forest, for example, emerges from the health of all the species in the forest and the way they interact – a very complex, high-dimensional dataset – but in a model of the world’s forests, that health might be captured in a single number. This process of reducing a high-dimensional dataset to a lower-dimensional one is called projection geometry, and it needs further development in the context of HESs.
• Using ensembles of models to improve prediction has emerged as an
especially important tool in forecasting HESs. This technique is poorly understood theoretically and needs more development.

32 | P a g e
CHAPTER 3 Measuring and Monitoring Progress Toward Sustainability
To learn to live sustainably, we’ve got to know how well we’re doing. But measuring the health of a forest or an ocean is an extremely complex task: One has to collect a huge amount of data, get the most information possible given limited resources, and then make sense of that data. Every step raises mathematical challenges. Chapter 3 focuses on these challenges.
What’s the climate like right now?
This question might seem bone-headedly obvious, answerable in a
moment of poking your nose out the door. But that would be confusing two things that are very different: climate and weather. Weather describes what the atmospheric conditions are at a given moment, while climate describes the average atmospheric conditions for a particular place at a given time of year. In sustainability science, we are interested in both, one for short-term effects that could become more drastic and the other for long-term trends that have implications for the health of our planet. Short-term weather forecasts, over five to seven days, have become quite good, but long-term prediction of weather – such as whether Chicago will have a white Christmas next year – is impossible. Predicting climate is even more involved, particularly for a small region, like a city.
So, what’s the weather like right now?
It’s that question that we might feel can be answered by going outside and looking. But figuring out the current weather around the entire globe turns out to be a remarkably difficult problem.
If weather forecasters had a nice, tidy grid of perfectly reliable weather stations evenly spread around the world and extending up into the atmosphere, all they would have to do is to consider the readings. But what they have is far from that. See Figure 1, which shows weather monitoring stations in Europe, which are located according to funding and local interest. That’s not so convenient for weather forecasters, whose models need to know the temperature

33 | P a g e
at evenly spaced points of a tidy grid extending across oceans and up into the atmosphere. Weather stations are rare in the middle of the ocean or in tropical jungles. Satellites help fill in the gaps, but their data aren’t always reliable: For example, they infer wind speed from cloud motion, which requires guessing the height of the clouds. And thermometers and wind gauges sometimes break.
This is a real nuisance for meteorologists, because to predict the coming weather, they really need to know the current weather everywhere. After all, the seeds of the next hurricane get hatched in some unmonitored corner of the Atlantic, not in the middle of New York City bristling with thermometers.
Figure. 8. Weather monitoring stations in Europe are located according to funding and local interest. Mathematicians are creating ever-improved methods to infer the temperature at each of the models’ grid points from the messy spread of real-world data. Reprinted from “A European daily high-resolution gridded data set of surface temperature and precipitation for 1950 – 2006,” Journal of Geophysical Research, vol. 113, Oct. 30 2008, with permission from American Geophysical Union.
Fortunately, forecasters have another source of information about the state of the weather, one perfectly tuned to their needs. that gives the current state precisely at every grid point: the forecasts themselves. Six-hour forecasts are remarkably good, usually predicting temperatures accurately within half a

34 | P a g e
degree. Indeed, these forecasts are usually more accurate than the information inferred for a given location from scattered weather stations at other locations.
Paradoxically, though, if the models that generate the forecasts aren’t regularly updated with real-world data, the forecasts will rapidly become no better than the predictions from the Farmer’s Almanac. That’s because weather is chaotic (in both a technical and nontechnical sense). Left undisturbed, the output of even the best model will get further and further away from the real weather over time.
So the best approach is to use a bit of each: Rely on the forecasts when they’re reliable, turn to the weather station data when they’re not. The problem of combining the two effectively is called data assimilation, and solving it requires some pretty fancy mathematical tricks.
The challenge is to figure out when the forecasts are likely to be right and when they’re questionable. When a strong cold front pushes through the eastern U.S. in September, for example, several days of clear weather will almost certainly follow. In that case, the forecast is likely to be better than the measurements. But when a hurricane is churning northward along the East Coast, its path is hard to predict, so the forecasts can’t be relied on and real-world measurements are essential. Mathematics is needed to distinguish between these situations.
One of the best approaches to this at the moment is called a “Local Ensemble Transform Kalman Filter” (LETKF). A LETKF creates a collection of forecasts, not just one: Researchers run the model fifty times using slightly varying initial data. If those simulations lead to fifty very different results in one area, the researchers know that the forecast is highly uncertain there, and they rely heavily on the data from the weather stations. But in regions that come out pretty much the same, they trust the model’s forecast more than the data. In areas with few weather stations (like the middle of an ocean), the LETKF is as much as 65% better than the techniques currently in use. But even better techniques are still needed.
Data assimilation was initially developed in the context of weather forecasting, but it could be used in areas as diverse as oil recovery, CAT scans, forestry, fisheries, or maybe even climate. Any situation in which a model makes

35 | P a g e
predictions and measurements create data could benefit from data assimilation techniques, and so far, that potential has been little explored. Each context will raise its own mathematical demands.
Data assimilation has hardly been used at all in the context of climate models, and some researchers believe that it has great promise. One of the critical problems in climate modeling, which statistical methods, whether data assimilation or other methods, are needed to address, is assessing how certain the models’ predictions are. Currently, the uncertainty is estimated in a very ad hoc way: Different modeling centers build different models that take somewhat different approaches, and the spread of the predictions of the models is presumed to give a reasonable sense of the degree of certainty. If they vary in their prediction of average global temperature in 2100 by, say, 5 degrees Celsius, it is imagined that the best prediction lies somewhere within that range, and that the 5 degree spread roughly describes the spread of temperature that it might end up being. But while the models certainly do help us understand how climate is likely to behave, there’s little reason to believe that the spread between the models faithfully represents the range of possibilities. An alternate approach would be to assess the uncertainty in each piece of the model separately along with the uncertainty in the data itself. Statistical methods could then combine uncertainty estimates from each model piece and from the data and provide an objective, unbiased assessment of uncertainty overall. But this approach has yet to be developed.
Sustainability issues raise all kinds of data-modeling issues like this, more than most areas of science. Because sustainability problems deal with complex natural systems, understanding them requires lots of data, and the data are never as tidy, reliable, consistent, or meaningful as is needed. So when scientists march out and install thermometers, count tree species, drill ice cores, and tally malaria cases, filling their hard drives with millions and billions and trillions of data points, they usually find that they don’t have exactly the information that they need when they bring those hard drives back to the lab. They then turn to statisticians or other mathematical scientists and ask them how to manipulate the data into the necessary from – but often, the mathematical tools needed for the job haven’t yet been invented.
Part of the problem is that sustainability issues often require merging datasets produced at different times for different purposes. In the U.S., for

36 | P a g e
example, many different government agencies and others collect data that is relevant to understanding the health of forests: The Forest Service does an inventory of plots around the country every five to ten years that assesses the trees, the ground vegetation, the soils, and the air quality; the U.S. Environmental Protection Agency assesses water quality around the country; the Census assesses population levels and housing densities; private groups monitor at-risk species; the list goes on and on. Understanding the true state of our forests and the threats to them requires integrating this data coherently.
“Forests on the Edge” is a project that is doing just that, combining all those data sources into a single map and analyzing the results. But the data doesn’t line up neatly. The plots the Forest Service analyzes, for example, are different from the plots the Geological Survey analyzes. The data are of varying quality and are gathered in different ways. Scales vary. The project has developed techniques to use the combined data to produce the clearest picture of the state of our forests and the threat to it, but new techniques are needed to quantify the uncertainty of the combined data they produce.
In other situations, the hard data scientists need simply don’t exist. It’s difficult and expensive too, for example, count all the caribou in a ten-thousand-square-mile area. In some such situations, however, knowledgeable, experienced folks have some good ideas about what is going on – they just can’t back their opinions up scientifically. Inuit in northern Canada, for example, may have a strong sense of whether the caribou population is rising or falling, based on their long experience traveling across the land and sharing information with one another. Mathematical scientists are working on developing unbiased ways based on mathematical and biological principles to combine this “soft” data with the limited available hard data. For caribou, as an example, scientists could survey a few, limited areas carefully and then test out how accurate the expert knowledge is on those particular areas in order to determine how much weight to give it in an overall assessment. This approach has only begun to be explored.
Even when the funding exists to gather the data needed, mathematical
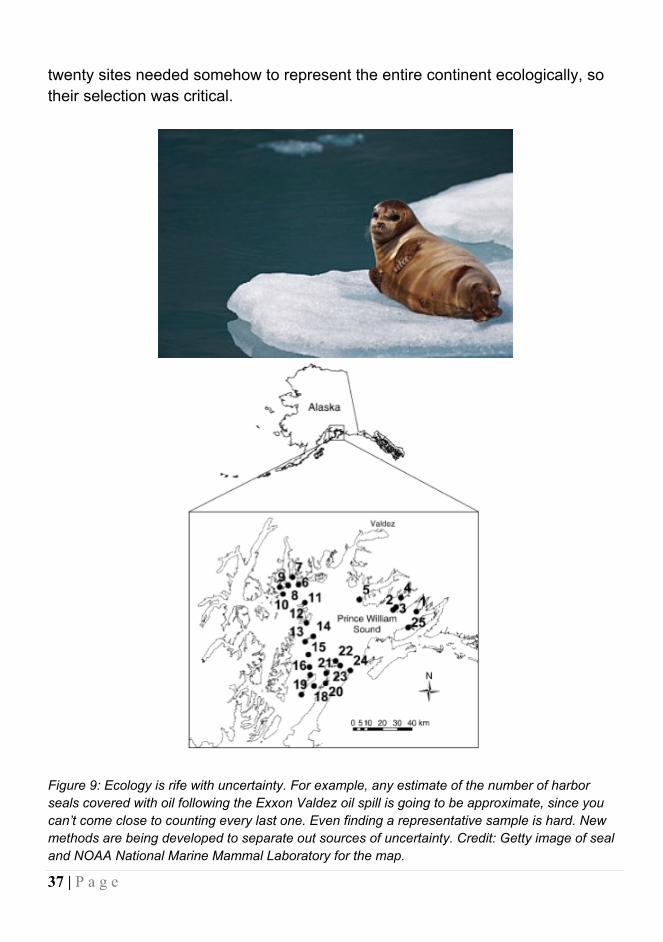
questions arise about how to do so most efficiently. For example, the National Ecological Observatory Network (NEON) is collecting data at twenty sites across the U.S. to get a continent-wide picture of the impacts of climate change, land use change and invasive species on natural resources, and biodiversity. Those
37 | P a g e
twenty sites needed somehow to represent the entire continent ecologically, so their selection was critical.
Figure 9: Ecology is rife with uncertainty. For example, any estimate of the number of harbor seals covered with oil following the Exxon Valdez oil spill is going to be approximate, since you can’t come close to counting every last one. Even finding a representative sample is hard. New methods are being developed to separate out sources of uncertainty. Credit: Getty image of seal and NOAA National Marine Mammal Laboratory for the map.

38 | P a g e
Their first step was to divide the U.S. into twenty ecologically homogeneous regions using methods based on firm scientific principles. They divided the country into eight million patches, and for each patch, they collected nine pieces of information about its ecology and climate. They then used a supercomputer to cluster the patches into similar regions and picked a representative site within each region. They then reanalyzed the data to make sure that the twenty sites were as different from one another as possible and represented the full spread of ecological conditions. This method worked well, but it would be better to consider 100 different ecological properties rather than just nine. New techniques will be needed to make that computationally practical.
Figure 10: The National Ecological Observatory Network had to choose twenty ecologically representative sites across the United States to monitor to see what effects changes in land use, climate, and invasive species might be having. They started by dividing the country into eight million patches, which they classified by ecological type. This generated the map above. Credit: William Hargrove, U.S. Forest Service.
Measuring progress toward sustainability might require us to understand how to measure the health of specific “indicator species” that, like the canary in the coal mine, indicate the overall health of an ecosystem. For example, lichens respond to changes in forest structure (air quality, climate) and disappearance of lichens may indicate environmental stress (high levels of sulfur dioxide, nitrogen oxides, etc.). Algal species in aquatic systems may indicate organic pollution and nutrient loading (e.g., nitrogen, phosphorus). Mussels are sensitive to siltation and low dissolved oxygen in water. Efforts have been made to build mathematical models that show how one can find “clusters” of unhealthy plants such as lichens. These “dynamical spatio-temporal models” of the distribution of

39 | P a g e
healthy/unhealthy plants are challenging, particularly using messy real-world data. Thus, understanding how the health of indicator species can give early warning of problems in an ecosystem will require new mathematical and statistical tools.
Finally, we need better methods to figure out just how good our mathematical models are. For example, we have models that describe how substances move between the atmosphere, land and oceans over time, using a series of non-linear ordinary differential equations. This cycle is critical for marine life, which relies on the balance between nutrients, phytoplankton, and zooplankton, which are in turn influenced by temperature, light, and resource availability. The equations of the model are, of course, approximations, but standard analyses commonly ignore this, and the result is that the model doesn’t properly predict the size distribution of phytoplankton and zooplankton. Similar difficulties arise in the highly complex problem of modeling air quality. If air quality is substantially worse than our large reaction-diffusion models predict, we need to know whether that is because the underlying dynamics are different from what we thought, because of inherent randomness in the system, or because our models captured those dynamics badly. Models have become vastly more complex over time, making existing methods of evaluation inadequate. Mathematical sciences challenges in the area of measuring and monitoring progress toward sustainability include development of the following:
• Tools for uncertainty quantification via probabilistic modeling approaches, including tools to deal with the following challenges in this area alone:
Characterizing the bias or discrepancy between models and reality (data);
Recognizing that cost constraints often mean that models can only be run for certain combinations of input parameters, requiring extrapolation of model output to other input parameters;
Accounting for uncertainties in the initial conditions; Estimating unknown parameters in the process models; Accommodating stochastic features of the process models; Producing predictions that arise by combining models and
observational data, as might occur via data assimilation methods.

40 | P a g e
• Methods for estimation of parameters to use in our models.
• Sampling designs for monitoring and measuring quantities relevant to
sustainability.
• Data fusion methods for integrating diverse datasets.
• Computer experiment methods to help us deal with sustainability data and models.
• Model diagnostics for complex, hierarchical models.
• Model assessment tools for integration or comparison of multiple
models.
• New methods of developing and applying complex networks and network theory.
Methods to address these challenges should be developed in the context of dynamic spatio-temporal models.

41 | P a g e
CHAPTER 4
Managing Human-Environmental Systems for Sustainability To be useful, sustainability science needs to guide decision-making. Chapter 4 lays out the mathematical sciences tools needed to put together what we know into a precisely defined set of questions and into a practical course of action. Fish don’t stop at international borders. They swim where they will, paying
no heed to which country owns the territorial waters they’re swimming in. This willfulness creates nasty problems for fishery managers – problems that have led to disputes between nations, broken agreements, and the collapse of fisheries. And some of these problems are ones that only mathematics can solve.
Pacific salmon are a prime example: They migrate along the Pacific Northwest coast of the U.S., past Canada, and along the coastline of Alaska before looping back to return to the precise river they hatched in themselves to lay their eggs and die. The result is that Canadian fishermen inevitably catch fish hatched in U.S. waters and vice-versa – and if either country overfishes, both lose.
In 1985, the two countries came to an apparently simple solution to the problem: fish trading. Each country would harvest fish in proportion to the number produced in their own rivers. That way, if one of the countries invested in habitat restoration, say, and increased its fish population as a result, it would reap the benefits of its efforts.
The solution turned out to be a bit too simple. Climate shifts (unrelated to global warming) caused the number of adult salmon in Alaskan waters to explode while the number along the Pacific Northwest and Canada dwindled. Alaskan fishermen harvested record numbers of fish, many hatched in Canada. Canada couldn’t catch enough salmon from the reduced numbers in their own waters to balance it out. Worse yet, Alaska had no motivation to change the agreement, since it was profiting handsomely.
By 1993, the agreement had broken down entirely. The results were predictable: Some fish stocks crashed. It was a classic case of what game

42 | P a g e
theorists call the “Prisoner’s Dilemma”: Even though both the U.S. and Canada were better off cooperating, without an agreement their individual interests pushed them toward competition – with devastating consequences for both.
At this point, fishery managers in both countries started talking with mathematicians about how game theory could offer a way out of the impasse. Game theory models offered several insights. The most fundamental was that at all times, any agreement had to be in the self-interest of every player involved (i.e., every entity with bargaining power). The failure of the existing treaty to do this for Canada is what led to its downfall.
Another insight was that although two countries were involved, the actual
number of players was higher, because individual states in the U.S. have more authority over their own fishing policies than the federal government does. So Alaska, Washington and Oregon acted as separate players, with the interests of Washington and Oregon closely enough aligned that they acted as a block. A final insight was key to breaking the impasse: The mathematicians noted that it wasn’t necessary for the two countries to harvest fish in proportion to their production; instead, the essential thing was that they harvest economic benefits from the fish in proportion to their production.
Figure 11: Pacific salmon migrate in a huge loop through US, Canadian and international waters, before returning to their home river to spawn. This necessitates international agreements between the countries to prevent overfishing and ensure that each country is able to harvest its fair share of salmon. Game theory can guide the design of such agreements so that they’ll be self-reinforcing. Credit: Getty images.

43 | P a g e
Five years after the agreement broke down, both the U.S. and Canada
were near disaster. As the Canadians fished frantically in an effort to balance out the Alaskan harvest, the coho and Chinook stocks that dominated their waters dwindled, affecting both Canada and the Pacific Northwest states. The famous “tragedy of the commons” was unfolding.
So both countries went back to the bargaining table. They adjusted the harvesting limits to take a longer-term view, account for the prevalence of each species of fish, and better protect against overfishing. In addition, the U.S. began to indirectly compensate Canada for the extra Canadian fish caught by U.S. fishermen. This system, which the mathematicians had recommended based on their game theory models, allowed the two nations to balance the economic benefits from the fish rather than balancing the number of fish harvested. This also created greater flexibility to respond to future shifts in fish abundance or migration patterns. The 1999 agreement has proven to be sufficiently robust that it was re-ratified in 2005, with only minor changes.
Because of experiences like this, fishery managers have started to recognize that it’s impossible to understand what’s really going on with fishery agreements without game theory. The dynamics are too complex. Nevertheless, game theory is still underutilized in fishery management. Side payments, like the U.S. payment to Canada, are rare and usually smaller than ideal when implemented. Every fishery represents its own game theoretic challenge, and the rules of the game change over time as the fishing fleets of different nations rise and fall and as international laws around fishing evolve. The contribution game theory has to make to fishery management has only begun to be exploited.
Even within a single country, management issues are tricky and need mathematical guidance. A nation, of course, has the power to regulate how much fish each fisher is allowed to catch, rather than having to rely exclusively on self-interest. The first way this was tried was by limiting the fishing season. This backfired, though: Fishers developed faster boats and better ways to find the fish, so as to catch as many fish as possible as fast as possible. Managers tried limiting the number of boats, but fishers then built bigger boats. Recently, managers have moved to giving fishers individual quotas that they can trade among themselves, where the quota size is determined by the fish population. If

44 | P a g e
designed carefully, these can give fishers a long-term stake in the health of the fishery.
Figure 12: When fishing managers tried to control fish harvests by limiting the number of fishing boats, fishers responded by increasing the size and capacity of their boats. Mathematics can be used to predict the impact of fishing regulations in advance and avoid such unintended consequences. Credit: Skagman
That careful design requires mathematics. Agent-based mathematical models represent each individual fish and each individual fisher in a computer model and can play out the consequences of strategies before implementation, avoiding a continuation of the costly trial-and-error approach that dominated early attempts at regulation.
Mathematicians are also working to develop models that will help predict the fish populations from year to year. “Age-structured models” can determine the age at which a caught fish will have the least impact on the population as a whole. By adjusting the size of the mesh of their nets, fishers can ensure that they won’t catch younger fish – and if the quotas are designed well, fishers will support such rules even if it reduces their catch in the short run. But so far, these models only work well in fish whose populations aren’t subject to large changes from outside forces – and there aren’t very many of those. Most fish are strongly impacted by ocean circulation, which changes based on weather patterns from year to year in ways that aren’t predictable. Predicting fish populations precisely is impossible given this variability, but a mathematical challenge that could be

45 | P a g e
met is to build models of the “spatial dynamics” that will reveal the patterns of variability over time.
Another technique managers have used to protect fish populations is to create “marine protected areas,” keeping fishers entirely out of areas that are particularly important for breeding. This raises another mathematical challenge for predicting fish populations, because the marine protected areas create a sharp boundary: inside the boundary, the fish are protected, and outside, they’re not. Most mathematical models rely on smooth transitions from one zone to another.
Fisheries are just one example where math is key to managing the Earth’s resources. Lumber, food, and fuel provide other examples. As human population grows, we have to be smarter about how we manage resources so that the planet is able to produce enough to sustain us. Mathematics is a key tool to predict the consequences of our decisions.
Figure 13: Managing air pollution raises mathematical challenges including modeling how pollutants disperse, determining minimum levels of different pollutants that have health effects, and developing air pollution indices that provide early warning about unhealthy air. Credit: Getty Images
Forests are another example that demands mathematical models for understanding, and new techniques will be needed to capture their complexity. A simple interaction that’s easy to model is the three-way dance among fire, aspens and ponderosa pines throughout the Rocky Mountains. A mature Rocky mountain forest is predominantly ponderosa pine, but when a fire burns hot enough to kill the ponderosas, the quick-spreading aspens take over. The

46 | P a g e
ponderosas slowly fill in and displace the aspens. By characterizing this process mathematically, it’s fairly straightforward to predict the percentage of aspen and ponderosa pine some number of years after a fire. Such predictions can guide foresters in managing timber resources or biologists in understanding biodiversity.
In the Amazon rainforest, however, a similar interaction might critically
involve the interactions of 300 species rather than just two. While a model can be built to describe such a complicated set of interactions, it would be so complex that it would be impossible to analyze or use to generate predictions. So, new mathematical techniques are needed to handle these complex interactions – for example, statistical methods that can characterize the interaction of many species without having to trace the impact on each individual species.
A similar difficult question is to understand the interactions between individual trees, rather than species of trees. Since trees compete with one another for water, light and minerals, they affect one another’s growth – more if they’re closer, less if they’re further away. Mathematical scientists can model such interactions effectively for a pair of trees, but with even three trees, the problem gets extremely difficult, because the pairwise interactions end up affecting one another in an infinite sequence.
Figure 14: In southern Brazil, the forest was cleared for grassland, but it is now protected and is coming back. Mathematical modeling helps estimate the rate of forest expansion and understand the different stable states of the system. Credit: Madhur Anand.

47 | P a g e
A third mathematical challenge for forests is to understand how many
species can be removed before the functioning of the forest breaks down. Northeast forests in the U.S., for example, have lost their elms and their cherry trees, and ash trees are in danger of disappearing. So far, the forests have been able to absorb these losses, but if too many more species die out, the ecosystem will collapse. Mathematicians don’t yet have good ways of understanding the resilience of a complex system like a forest.
Agriculture is a third area where mathematical scientists are having a growing impact. Spatial planning provides one challenge. Optimization methods can be used to determine the mixture of crops that is likely to be most productive in a particular area, taking into account growth rates, susceptibility to disease, economic value, etc. There’s an additional consideration that so far has been little accounted for in such analyses: what crop grows where. One crop may be hard to transport (like switchgrass for a biofuel plant, for example); another may be susceptible to bacterial contamination from livestock (like spinach); a third may be subject to invasive species. The mathematics to determine the best spatial placement of crops is only now being developed.
To understand issues of sustainability, mathematical scientists need to understand issues of the social sciences and to bring social science issues and methods into their models. Agriculture provides a prime example. One of the greatest sustainability challenges comes from rising consumption and the need for consumption to be divided more equitably around the world. This is particularly true for agricultural products. Many different forces are coming together to create an increasing demand for certain agricultural products: population is rising; the developing world is growing economically; meat consumption is increasing. Large models of the economy have been created that take into account the different consumption levels in different areas, but there is enormous uncertainty that influences their output: How fast will the developing world grow? How much more meat will people eat? How fast will population rise? How will decisions made by societies affect population growth patterns? All of these things impact model output enormously. Improving these models requires that mathematical scientists work with social scientists to understand the dynamics of the developing and developed world and the impact of alternative management plans.

48 | P a g e
Some of the overarching mathematical sciences challenges in the area of managing human-environmental systems for sustainability are:
• Management problems often involve finding the optimal solution to a set of mathematical equations. For example, we want to know how many fish we can catch per year to get the maximum fish harvest over the long run, or how we minimize the spread of invasive species. Good techniques have been developed for doing this as long as there isn’t too much random fluctuation in the system, but when the system is impacted by unpredictable outside influences like ocean circulation changes or weather, those techniques break down. Methods for finding the optimal solutions in systems with large variability are essential to solving these management problems.
• It’s usually much easier to make predictions over the short run or the
very long run. Tomorrow, the condition of the Rocky Mountain forests is likely to be quite similar to the condition today. And in the long run, climate change will force species northward and to higher latitudes. But predicting the intermediate term is tough: How fast will those changes happen? Most management problems require information about exactly those intermediate time scales. New mathematical methods are required to understand the evolution of dynamical systems over these intermediate time scales.
• Any large-scale mathematical model has “parameters,” single numbers
that encapsulate some complex process, for example, biotic variables needed to understand forest health that include diameter, height, health, and live/dead status for different trees and tree species, and plot variables such as proportion of forest, regeneration, and understory vegetation. Better mathematical methods are needed to find which of these parameters are most useful and to find the best value for these parameters. The problem is particularly complex when models are linked together and deal with uncertainty.

49 | P a g e
• Because natural systems are always complex dynamical systems,
understanding them and predicting them is difficult. Management decisions hinge, as a result, on understanding the effects of feedbacks in these systems. So new approaches are needed to understand them.
• Mathematical scientists need to work closely with social and behavioral
scientists to understand the concepts that social scientists use and to include these concepts in mathematical models of human and natural systems and their interaction.

50 | P a g e
CHAPTER 5
Mathematical Challenges in Energy Sustainability
Chapter 5 examines Energy as an in-depth case study that touches on the themes in the other four chapters. The energy system needs a radical transformation, fast, and so does the relation of human activity to energy. This chapter discusses how mathematical scientists can help us address this huge challenge.
In the early morning hours of Feb. 2, 2011, temperatures across Texas plummeted into the teens. As people climbed out of bed into their chilly houses, they simultaneously reached to turn up their electric heaters. Power drained out of the grid, creating a spike in demand so sudden that the power generators couldn’t ramp up their production fast enough. Lights dimmed as operators were forced to drop the voltages for short periods in order to prevent major blackouts. Worse, the computers that controlled traffic systems, elevator banks and manufacturing plants couldn’t operate at the lower voltage and failed. Speculators were reported to have taken advantage of the chaos to charge $2,000 per megawatt-hour, when the price averages around $50.
The power grid these days is remarkably robust, and such events are rare. But as we push to increase the use of renewable energy with thousands of wind turbines and millions of solar panels on the roofs of homes and businesses, avoiding such events is going to become harder and harder. Each time the wind drops, the power pumping out of wind turbines falls, and if that happens dramatically and unexpectedly, the grid may not be able to compensate. Utilities are going to have to manage power grids with a level of uncertainty that has not been faced since electricity was first harnessed.
The basic problem is that electric power can’t be stored on an industrial scale. It must be made in the exact quantity that users consume it, which varies unpredictably. Furthermore, turning power plants on or off is often expensive and can’t be done on a moment’s notice. The power produced by wind turbines varies as unpredictably as, well, the wind. A given power line can only carry so much electricity. Utilities and grid operators need to manage energy generators, anticipate customer needs and balance energy resources under uncertainty from supplies, prices, customer requirements and equipment failures. Designing

51 | P a g e
algorithms to balance all these needs makes for a massive mathematical challenge.
The mathematical problem of planning the operation of power generating units has long been recognized, but for decades, utilities resorted to ad hoc solution methods, and as a result they’ve typically been forced to schedule excess capacity to compensate for the lack of precise solutions. This approach is worse than just costly: the fossil fuels wasted are in limited supply, and their combustion could be threatening the climate of our planet.
In the late 1990’s, mathematicians brought advances in “mixed integer programming” to this problem, which new hardware and software had just made practical for large-scale problems. The result of a simple improvement in an algorithm was a savings of $250 million per year, along with millions of barrels of oil.
Utilities have long lived with considerable uncertainty as to demand for power, requiring what are known as stochastic optimization tools and methods of reliability analysis in planning for capacity and operation. But now the utilities’ problem is getting even more challenging as wind and solar power become more prominent. They make the energy supply unpredictable as well as the energy demand. That is not so hard to deal with in small quantities, but as the percentage of renewables climbs – as new laws are increasingly mandating – the difficulty grows dramatically. As long as we know the future, advances in the field of integer programming have made it possible to solve power generation problems with thousands of variables in a reasonable time. By contrast, once we introduce uncertainty, seemingly toy problems with just a few variables can explode, producing algorithms that exceed the capabilities of the largest supercomputers. If we are going to find efficient, robust solutions to manage our power grid in the presence of uncertainty from wind, solar, weather and human behavior, existing mathematics isn’t enough; new techniques are essential.
This is just one of the challenges we face from the enormous task of transforming our energy systems. Energy demand is continuing to grow, while the costs, both monetary and environmental, are becoming harder to bear. We need new energy solutions that make us less dependent on foreign oil, release less greenhouse gas into the atmosphere, and are robust and affordable both for

52 | P a g e
us and for the developing world. Doing so is going to require many new developments in the mathematical sciences.
The power grid itself is getting pushed to its limits as demand continues to increase faster than capacity. Getting close to the limit increases the vulnerability of the grid. In 2003, a tree fell on a power line, and the human operators of the grid didn’t notice the problem. The result was that the excess power went to another line, which became overloaded and failed. That caused even more power to go to a third line, causing its failure. At that point, a cascade of outages began that ended up making the entire northeastern U.S. and Canada go dark for days and cost billions as the lack of electricity snarled traffic, stopped subways and interrupted communication. Increasing the robustness of the grid is critical to prevent such costly mistakes.
Figure 15: The increasingly complex distribution network for electricity carries creates both increasing vulnerabilities and an increasing ability to manage the system to catch anomalies early. Credit: Jeffrey G. Katz
Doing so is tricky because the power grid wasn’t planned; it evolved in response to the needs of the community, and is in constant flux. As the complexity of the system grows and it is pushed closer to its maximum capacity,

53 | P a g e
it can not be managed by human intelligence alone; we have to have good models to guide decision-making. Improved models can also catch problems before they occur, guiding the placement of new lines or generating stations or extra maintenance on key ones that are vulnerable. Today’s “smart grid” allows us to monitor the health of the power system with greater precision and much more rapidly than before. However, this calls for new and more powerful algorithms and new and more powerful statistical tools to rapidly detect anomalies from the massive amount of data generated about the grid, and to take corrective actions before dangers cascade throughout the system. Mathematical scientists have only recently begun to get seriously involved in modeling the power grid, and an enormous amount of work remains to be done.
Another major challenge is to find clean sources of energy and effective
ways to store that energy. This will require new materials to be created, and math can dramatically speed up the process of finding materials with the particular properties we need. For example, a recently created material can turn low-grade heat (which is typically lost as waste) into usable electricity. The material when cool is an ordinary, non-magnetic metal that seems like nothing special. But when it heats up, it undergoes a phase transformation and becomes strongly magnetic.
As Faraday’s Law describes, this change in the magnetic field creates an electric current. Many of us as kids created a transformation like this by rubbing a magnet along a nail, aligning the electrons and turning the nail magnetic. Unlike such a nail, which stays magnetized after the magnet goes away, this new material goes back to being almost perfectly non-magnetic once it cools. The removal of the magnetic field also induces an electric current, and the material is ready to be used again.
This reversibility of the magnetic field is an extremely rare property, and researchers would have had great difficulty finding a material that can do this without guidance from mathematics. By analyzing the macroscopic properties they were looking for, they were able to deduce the microscopic structure the material would need to have, and then they could go into the lab and create it. The mathematical ideas used are based in the “calculus of variations,” which in principle can be used to reveal almost all the properties of interest about a material. Realizing this potential fully would lead to a true revolution in materials science, but it will require significant advances in the theory.

54 | P a g e
Figure 16: A new alloy in the midst of changing phase. The blue needle is the martensite phase, which is growing into the orange-brown austenite phase as the material cools. In a similar alloy, one phase is magnetic and the other is non-magnetic, and the resulting material can be used to turn low-grade heat into electricity. The clean, undistorted interface between the two phases in this picture is extremely unusual, and in the magnetic version, it creates the near-complete reversibility of the magnetic field. Credit: R. Delville and D. Schryvers, EMAT, University of Antwerp, Belgium. Reproduced from the cover of Advanced Functional Materials 12 (20), 2010, with permission. Copyright 2010, WILEY-VCH Verlag GmbH & Co. KGaA.
Another group is creating membranes that can function inside fuel cells
like artificial versions of the mitochondria that provide energy for biological cells. The membranes are made of polymer electrolytes, which consist of a hydrophobic polymer backbone with charges stuck on here and there. These form a hydrophilic network structure, a bit like a plate of spaghetti – but one that’s thirsty and sucks up any nearby tomato sauce (or, in this case, water). When the polymer electrolytes suck up water, the charges push the water into strange shapes which depend on the stiffness of the backbone and the placement of the charges. The water could take the shape of a sheet of paper, or tiny soda straws, or a network of pearls of water connected by pores, or a fluctuating network of isolated pearls that occasionally meet up. The properties of the membrane depend on the shape the water takes, and the mathematical challenge is to predict the behavior of the water from the properties of the polymer electrolytes.

55 | P a g e
Figure 17: Mathematics is essential to designing electrolyte membranes that lie at the heart of fuel cells. The green areas of this image are crystallized polymer, the white areas are uncrystallized polymer, and the blue areas are water. The charges on the polymer force the water into this convoluted shape. Credit: Zhengfu Xu, Keith Promislow, Andrew Christlieb, and Nir Gavish.
The traditional approach has been to do an atom-by-atom simulation, but
this is untenably slow. Techniques from the field of differential geometry can create a rich language to describe the shapes that the water can form and give a much more powerful way of modeling them.
To meet the energy challenge, we need promising technologies like these. But another huge aspect of the challenge is scaling up laboratory techniques to make them into economical solutions that will work on a large scale, which requires major investment. A serious challenge is choosing which technologies to invest in.
A natural first thought would be to let many flowers bloom and invest a small amount in every promising technology. But technologies get cheaper the more we invest: Investment spurs innovation and innovation spurs more investment, as we’ve seen so powerfully with, for example, the development of personal computers over the last few decades. So with new energy technologies, we’ll get a much bigger return on our investment if we choose a small number of

56 | P a g e
the most promising technologies to invest in heavily than if we spread the money around evenly.
The basic assumption of current finance theory, though, is that any individual person’s investment is too small to affect the value of what’s being invested in. Even in traditional finance, that assumption is problematic, but in the context of new energy technologies, it’s catastrophic, eliminating these virtuous cycles of investment and innovation from the very beginning. Essentially what’s needed is a more powerful theory of optimization that can deal with these highly complex, stochastic (i.e., random), non-linear problems.
Such optimization techniques are needed in a wide variety of other contexts as well, for example, deciding when to recharge a battery and when to withdraw energy from it, determining which power stations to use and when, and deciding on the price at recharging stations for electric vehicles.
Another key to investment is for the market to provide the appropriate incentives. When carbon can be emitted without cost, it is very difficult for cleaner but more costly technologies to get a foothold. A cap-and-trade system is one solution for this. This is a policy in which regulators set a target level of greenhouse gas emissions (the “cap”) which can be reduced over time, and energy producers either buy or are given permits to emit, which they can subsequently buy or sell (the “trade”). The allure of this policy is that it has the potential to allow the market to find the most efficient way of reducing emissions. A coal plant, for example, wouldn’t be forced to shut down, but it would require lots of permits that would make it more expensive to operate. If the plant is located in an area with cheap coal and few other energy options, its owners might choose to continue to operate it, paying the premium. But in an area with abundant sunshine, it might be more profitable to build a solar thermal plant, shut the coal plant down, and sell the unneeded permits to someone else.
The downside of cap-and-trade systems is that they can fail spectacularly unless they’re carefully designed. When Europe implemented its cap-and-trade policy in 2005, for example, the price of carbon emissions collapsed, emissions targets were missed, prices to the consumer shot up, and energy companies reaped enormous windfall profits.

57 | P a g e
The fundamental problem was that European officials implemented their system blindly, with little mathematical analysis to guide them. Many argued after the European debacle that the problem was that the emission permits were given away for free and that if they had been auctioned off instead, windfall profits wouldn’t have occurred. But mathematicians have found that some windfall profits are inevitable, regardless of how the permits are allocated. The best way of controlling them, current research suggests, is to give producers around 70 percent of their permits for free and require them to buy the remainder at auction. Producers who choose a particularly clean mix might not need to buy any additional permits, while those with a dirtier mix would have to buy a lot.
Much more work is needed, however. The key challenges are to set the appropriate emissions targets and to choose the right method of allocating emissions credits.
Finding the regulations that will most effectively limit emissions without
significantly raising prices to the consumer remains an open problem, and one with major consequences to both humanity and the environment. Some of the mathematical sciences challenges we need to meet in order to transform our energy systems are:
• Development of new methods of stochastic optimization of complex, dynamic systems that arise in storage, R&D portfolio optimization, design of grids, choice of generators, and models of users.
• Our models of the economy need to be vastly improved. Current
models assume that our economy will always be in a state of equilibrium and that everyone will behave rationally, but as the 2008 financial crisis proved, at the most critical moments, these assumptions can be dramatically false. We need these models in order to determine how much money we should be spending on alternative systems for generation, storage, transmission, and distribution of energy, and to predict the economic impacts of our energy policy decisions.
• Design of new materials for energy production, storage, transmission
58 | P a g e
and conversion often requires solving inverse problems for partial differential equations and stochastic partial differential equations, which present challenging problems.
• We need ways to reduce energy consumption, which leads to
mathematical challenges involving economic incentives for energy-efficient construction, new pricing schemes for energy use, and use of the “smart grid” to track consumption.
• We need new methods for modeling and simulation of multi-scale and
multi-physics systems, e.g., downscaling of fluid mechanics equations for wind turbines, thin films, and nanoscale materials.
• New statistical methods of optimal sampling are needed for estimation
of climate change impact on market responses, for identifying signals of environmental change, for understanding new materials, for comparing readings from numerous sensors providing massive amounts of data in a short time, and for placing sensors to maximize their usefulness in providing relevant data.

59 | P a g e
CONCLUSION
The mathematical statistical sciences have a leading part to play in rising to the challenge of learning to live sustainably on the Earth.
The interaction between humans and the environment create systems of enormous complexity. Understanding those interactions will require fundamental advances in the mathematical sciences. We need to understand the basic principles underlying complex systems. We need to develop new tools to deal with the vast quantities of high-dimensional data being created. We need better methods to handle uncertainty, both to wring out the best predictions possible despite the inherent randomness involved in the interactions between humans and the environment and to quantify the uncertainty of those predictions. We need to create models that can function at varying scales of both space and time. We need to link models of human systems to models of environmental systems to capture the feedbacks between them. Essentially every significant question in sustainability science has major unsolved mathematical challenges inherent in its answer.
As a result, it is critical that more mathematical scientists get involved in sustainability research, and it is critical that funding be available to support their work.
The mathematicians and statisticians at the Mathematical Challenges for
Sustainability workshop made the following recommendations:
1. The Institutes, Centers and Professional Societies should play a leading role in educating mathematical scientists to the research questions arising in the science of sustainability. They should be aware of the new research questions that are arising and communicate them to the mathematical sciences community. They should organize a series of interdisciplinary activities that will encourage the leadership of mathematical sciences in research related to sustainability and will enhance linkages among mathematical sciences and other scientific areas involved in sustainability. These activities should include workshops aimed at developing new mathematical theories for specific research areas, but should also include multi-year activities to develop sustained interactions. The focus should be both national and international.

60 | P a g e
2. Mathematical scientists, in partnerships with scientists in other disciplines, should develop mathematical theories of sustainability science. The integration of science, data and computational models is critical. Current or emerging areas of the mathematical sciences that are relevant to this activity include uncertainty quantification, massive datasets, complex adaptive systems, parameter estimation and model selection, integrating data from different sampling designs, stochastic optimization and game theory, inverse problems and multi-scale systems. 3. Scientists working in areas related to sustainability should form interdisciplinary teams with mathematical scientists, including mathematicians, statisticians, operations researchers, computer scientists and mathematical economists, together with experts from many subject matter fields. Researchers should also collaborate with industry. 4. There should be a focus on education at all levels, including new courses and research seminars on the mathematics of sustainability for graduate students, activities aimed at undergraduates and K-12, and communication with policymakers and the general public. 5. It is essential to develop paradigms for sharing data and models. One possible mechanism is a national sustainability data center containing links to publicly accessible datasets, computer programs and models. 6. Funding agencies should consider the most appropriate funding mechanisms for encouraging research in mathematical sustainability science. One possibility is a grants competition requiring collaboration between researchers from two or more disciplines, similar to NSF's Collaborations in Mathematical Geosciences initiative. Funding for such a program needs to include specific resources for data processing and computer programming.

61 | P a g e
Appendices: Group White Papers
Appendix 1: Human Well-Being and the Natural Environment
Authors: Alejandro Adem (University of British Columbia) Michelle Bell (Yale University) Margaret Cozzens (Rutgers University) Charmaine Dean (Simon Fraser University) Francesca Dominici (Harvard University) Avner Friedman (Ohio State University) Fred Roberts (Rutgers University) Steve Sain (National Center for Atmospheric Research – NCAR) Abdul-Aziz Yakubu (Howard University) Charge to the Group: Under this theme, the group should seek to identify a small set of research challenges in the mathematical sciences where progress could advance our understanding of the interdependence of human well-being and the natural environment. Understanding this interdependence is an essential foundation for sustainability science. Under this theme, the group should focus on the challenge of developing an internally consistent mathematical sciences-based framework for showing how use, and even depletion, of aspects of the natural environment could be consistent with sustainability so long as they are converted into other forms of capital (e.g. manufactured, human, social) at appropriate rates capable of maintaining human well-being over the long-term. Key issues for sustainable development the group should explore involve precise definitions of human well-being, and mathematical models of how natural capital contributes to human well-being, how human actions impact on natural capital, tradeoffs in benefits over space (intra-generational equity) and time (intergenerational equity), and the role of institutions, technology and knowledge in promoting sustainable development. Health (and freedom from disease) is one sample component of sustainability and of interest here, among other things, is the potential for emerging infectious diseases to arise from climate change and greatly impact both human and natural systems. Mathematical epidemiological methods, linked to climate change, provide a growing area of research which should be linked with sustainability science, and the group is asked to explore these. 1. Introduction
Given the impact that humans have on the environment and the fundamental role
that the environment plays in supporting human well-being, sustainable development requires improved understanding of human-environment interactions and intelligent decisions to guide human actions so they are consistent with maintaining human well-being in the long-run.

62 | P a g e
Human well-being requires, at the very minimum, an acceptable level of safe food, clean air and drinking water, safe shelter (housing) and protection from diseases. Among the large and interconnected problems believed to be facing humanity in this century are poverty and global change. It is believed that nearly half of the world population lives in poverty (less than $2.00 per day; Shah 2008). At the same time, the high level of use of total resources and energy are leading to global changes that threaten the life-support system of the planet (Cairns 2010). Increasing the material well-being of people in developing countries is considered to be a global priority, yet bringing the entire world population to levels of consumption prevalent in developed countries, given current technology, does not appear to be sustainable (Ehrlich and Ehrlich 1989).
Key issues for sustainable development involve precise definitions of human well-being, how “natural capital” contributes to human well-being, how human actions impact natural capital, the nature of multiple tradeoffs among “ecosystem services” and other components of human well-being, as well as the role of human institutions, technology and knowledge in impacting the natural environment and promoting sustainable development. Finding precise definitions of these concepts is a key challenge for the mathematical sciences, since a fundamental feature of mathematics is its ability to make imprecise concepts precise. A related key challenge is to develop, analyze, and test mathematical models involving these concepts as basic parameters. In this report, we present illustrative (but by no means comprehensive) examples of areas which address the relationship between human well-being and the natural environment that can be advanced by research in the mathematical sciences and provide sample research challenges for the mathematical sciences. 2. Overview
In this section we provide a brief general overview of sample areas at the interface of the natural environment and human well-being, and the inherent challenges of sustainability in these areas, giving a few examples of mathematical sciences approaches in each case. We provide more detailed examples of a few specific cases in Section 3.
Human beings depend on ecosystem services for their well-being: clean and sufficiently abundant water, clean air to breathe, building material for shelter, fuel to power their machines, etc. Most theories of environmental impact assume that exploitation of the environment provides benefits to human well-being. However, this assumption has not been subject to rigorous empirical study and there is much work to be done to make such theories precise through mathematical models. In one mathematical approach, Dietz et al. 2009 model human well-being as a function of physical, natural and human capital. Using data from 135 nations, they find that controlling for physical and human capital, exploitation of the environment has no net effect on well-being. This suggests that improvements in well-being may be attainable without adverse effects on the environment. The model accounts for trade-offs between human and natural capital, but it does not address the important problem of non-renewable resources such as coal, oil and minerals.
At the interface between the natural environment and human well-being is the issue of climate change. One challenge here is a consideration of the effects of rising temperatures on the spread of disease. Climate change may adversely affect a number

63 | P a g e
of diseases, with malaria a leading example. Five hundred million malaria cases occur every year and some scientists predict that, as a result of climate change in the coming decades, tens -- even hundreds -- of millions more cases will occur in regions where the disease is already present, and that transmission will extend to higher latitudes and altitudes. Such predictions, sometimes supported by simple (mathematical) models, are persuasive because they are intuitive, but they sidestep factors that are key to the transmission and epidemiology of the disease: the ecology and behavior of both humans and vectors, and the immunity of the human population. Malaria is not the only disease so affected. The report "Climate Change and Human Health, Risks and Responses" (eds. A. J. McMichael et al., published by WHO in Geneva 2003) provides a very broad scenario of diseases that may become exacerbated by climate change. No mathematical models are described, but some can be found in the references. This is an area that can benefit from new mathematical sciences research. The importance of the world's forests on human health cannot be overstated. It is essential for us to develop models that articulate the dynamics of the physical and ecological phenomena that shape our forests, how these processes interact, and how they are affected by and affect humans. The need to understand these processes will grow in importance as climate change influences forests, the way they are managed, and the increasingly important need for sustainable forest practices (Flannigan et al. 2005; Westerling et al. 2006; Woolford et al. 2010). The interplay and feedback mechanisms between climate and forest need greater consideration. For example, we need to precisely model the effects of climate change on onset of fire seasons, length of fire seasons, and frequency of extreme fire events, as well as the changing range and abundance of severe destructive forest pests such as the pine beetle. The interplay between fire, climate and pests, and the aggregate effects of fire, climate, pests, and other factors on total forest area involve complex feedback processes, and they are closely related to human well-being through the effect of changing forest composition on sustainable timber supply and also the spread of disease that is exacerbated or influenced by forest conditions. Understanding this complex web of feedback encompasses modeling of both physical and ecological processes such as fire spread and the spread of infection, and incorporates research tools such as differential equations and spatial statistics methodologies to address key forest dynamic issues. Water pollution from human activities, either industrial or domestic, is a major health problem in many countries. Mathematical analysis of water-quality problems dates back at least to the 1920's. A recent article by Pimpunchat et al. (2007) investigates the alleviation of pollution by aeration within a flowing river contaminated by distributed sources and the associated depletion of dissolved oxygen. The question of how to reduce water pollution by economic stimulation was investigated in Rikun (1992). This paper considers a scheme of economic stimulation in which payment for water pollution is partially used to compensate for expenses for water conservation measures. A mathematical model is used to determine stimulation parameters, when potential polluters are interested in the decrease of discharged waste-water volume to an optimum level. However, there is much embedded uncertainty requiring identification of different mathematical models of water quality and their applications to problems of prediction. This reflects a major mathematical challenge in sustainability science: uncertainty quantification and how to make optimal decisions under uncertainty.
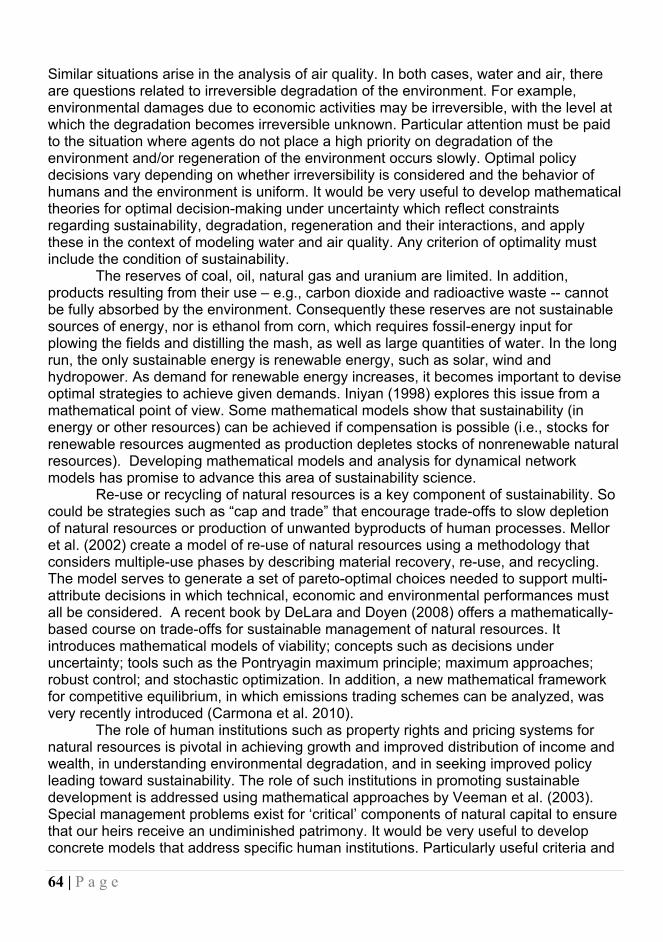
64 | P a g e
Similar situations arise in the analysis of air quality. In both cases, water and air, there are questions related to irreversible degradation of the environment. For example, environmental damages due to economic activities may be irreversible, with the level at which the degradation becomes irreversible unknown. Particular attention must be paid to the situation where agents do not place a high priority on degradation of the environment and/or regeneration of the environment occurs slowly. Optimal policy decisions vary depending on whether irreversibility is considered and the behavior of humans and the environment is uniform. It would be very useful to develop mathematical theories for optimal decision-making under uncertainty which reflect constraints regarding sustainability, degradation, regeneration and their interactions, and apply these in the context of modeling water and air quality. Any criterion of optimality must include the condition of sustainability.
The reserves of coal, oil, natural gas and uranium are limited. In addition, products resulting from their use – e.g., carbon dioxide and radioactive waste -- cannot be fully absorbed by the environment. Consequently these reserves are not sustainable sources of energy, nor is ethanol from corn, which requires fossil-energy input for plowing the fields and distilling the mash, as well as large quantities of water. In the long run, the only sustainable energy is renewable energy, such as solar, wind and hydropower. As demand for renewable energy increases, it becomes important to devise optimal strategies to achieve given demands. Iniyan (1998) explores this issue from a mathematical point of view. Some mathematical models show that sustainability (in energy or other resources) can be achieved if compensation is possible (i.e., stocks for renewable resources augmented as production depletes stocks of nonrenewable natural resources). Developing mathematical models and analysis for dynamical network models has promise to advance this area of sustainability science.
Re-use or recycling of natural resources is a key component of sustainability. So could be strategies such as “cap and trade” that encourage trade-offs to slow depletion of natural resources or production of unwanted byproducts of human processes. Mellor et al. (2002) create a model of re-use of natural resources using a methodology that considers multiple-use phases by describing material recovery, re-use, and recycling. The model serves to generate a set of pareto-optimal choices needed to support multi-attribute decisions in which technical, economic and environmental performances must all be considered. A recent book by DeLara and Doyen (2008) offers a mathematically-based course on trade-offs for sustainable management of natural resources. It introduces mathematical models of viability; concepts such as decisions under uncertainty; tools such as the Pontryagin maximum principle; maximum approaches; robust control; and stochastic optimization. In addition, a new mathematical framework for competitive equilibrium, in which emissions trading schemes can be analyzed, was very recently introduced (Carmona et al. 2010).
The role of human institutions such as property rights and pricing systems for natural resources is pivotal in achieving growth and improved distribution of income and wealth, in understanding environmental degradation, and in seeking improved policy leading toward sustainability. The role of such institutions in promoting sustainable development is addressed using mathematical approaches by Veeman et al. (2003). Special management problems exist for ‘critical’ components of natural capital to ensure that our heirs receive an undiminished patrimony. It would be very useful to develop concrete models that address specific human institutions. Particularly useful criteria and

65 | P a g e
indicators of sustainable development relate to ‘green’ output and productivity measures in which the depreciation of natural capital is being considered.
The above brief snippets indicate the wide variety of problems of sustainability that arise from the interplay between natural and human processes and the opportunities for mathematical sciences to address these problems. The power of mathematical sciences methods is that tools developed for one application are often generalizable and applicable to other applications. Still, specific critical applications have historically been the driver of new mathematics and problems of sustainability are certainly likely to be such a driver. Thus, though we would be tempted to organize a discussion around mathematical sciences topics that cross over into a wide variety of applied areas, we have chosen to organize the rest of this report around illustrative examples of applied topics that are clearly connected to the need for new mathematical sciences approaches. 3. Seven Specific Examples
We focus here on seven examples in more detail where mathematical sciences
methods are already utilized or seen to be relevant. We highlight inadequacies in current methods and propose new mathematical sciences frameworks for their investigation. We also discuss research areas related to major challenges in sustainability that cannot be addressed without these analytical, numerical, computational and statistical tools. Example 1: Impacts of Climate Change
As policy makers and politicians formulate the policies and make the decisions for a sustainable Earth, the effects of climate change exacerbate the problems and issues they face. With the engagement of mathematicians and statisticians and scientists, new paradigms for decision making in the face of the Earth’s changing climate will be needed to face these challenges which will require novel mathematical and statistical tools. Below, we outline some of the issues and the some of the areas where mathematics and statistics can contribute.
Climate projection/prediction is fraught with uncertainty. The natural variability of the climate system contributes to such uncertainty, as well as a lack of knowledge about the trajectories of future emissions of greenhouse gases and aerosols and how the Earth system will respond to these forcings. When climate models are a part of the mix, there are additional uncertainties that arise from the parametric uncertainty resulting from approximations to processes that exist below the spatial scale of the climate model as well as the structural uncertainty resulting from the processes that are unknown and not implemented in climate models or processes that are poorly implemented in the climate models. Current approaches to studying these uncertainties involve creating climate model ensembles that are essentially collections of model runs that result from perturbing initial conditions or physical parameterizations, using completely different models, or some combination of all of these.
There is an emerging field of uncertainty quantification that combines many of the elements of computational mathematics and statistical science, and there is a great opportunity for research in this area to contribute in climate science by working with climate models to improve calibration and assessment (although these are serious challenges made all the more difficult since the Earth system is not itself in equilibrium),

66 | P a g e
to improve how ensembles are created (experimental design), and to improve how information in climate model ensembles is combined. The current state-of-the-art for combining climate model ensembles is based on a Bayesian hierarchical model. This includes representations of uncertainty that span the sources of uncertainty sampled by the ensemble (although these ensembles do not represent any sort of "random sample" from elementary statistics -- often the sample space of climate models is not even well-defined). However, climate model output is complex and highly multivariate, and there are still many opportunities for research including spatial and spatial-temporal modeling of non-stationary processes, theory and methodology for extremes, and, of course, ensuring such methods are scalable to the size of the datasets that will be generated by the next-generation climate models (statistical computing).
Characterizing the uncertainty in climate model ensembles is just the beginning. Often the spatial and temporal scales that are native to global climate models are too coarse to use in various applications needed for impact studies. Downscaling refers to the growing body of work that uses the coarse-scale information in global climate models to produce regional and local climate information. Dynamic downscaling uses high-resolution climate models, often by forcing a regional climate model over a limited spatial domain with a boundary condition provided by global models. Statistical downscaling involves using empirical relationships. So-called stochastic weather generators are yet another alternative. There are strengths and weaknesses of each of these, but there are opportunities for the mathematical sciences to contribute to new downscaling methods that also allow for the propagation of uncertainty. These new methods will almost surely require new tools for spatial and spatial-temporal modeling, data fusion, data assimilation, and other methods that incorporate deterministic and statistical models.
Understanding how a natural system responds to climate and climate change typically begins by linking the natural system to weather phenomena (e.g., linking a public health endpoint to heat stress, linking mosquito life cycles and effective ranges to temperature and precipitation, linking animal migration to seasonal cycles, linking the response of crops, grassland, forests, etc. to meteorology, etc.). While there is a growing body of mathematical and statistical modeling central to these efforts, there is more work to be done in expanding current mathematical models and developing new models. Again, the common theme of uncertainty and characterizing uncertainty in such mathematical models is crucial, in particular the difficult problem of propagating the uncertainty in the meteorological inputs (i.e., weather) through these models especially when changes to these inputs are informed by climate models. Another emerging area connected to the response of a natural system to a changing climate is adaptation and there are opportunities for new mathematical frameworks or modeling strategies to better explore how a natural system can or cannot adapt.
Many of these analyses and modeling efforts that incorporate mathematical and/or statistical models of a natural system and that system's response to climate and climate change are being used for decision making at various levels. New tools for visualizing uncertainty from the analysis of complex systems are required to help inform policy makers. While decision making under uncertainty has a long history in statistical science and other fields, this is something of a new era where choices are more ambiguous. Decision making under ambiguity or deep uncertainty requires new mathematical frameworks or even new paradigms, including recognizing the potential of

67 | P a g e
"negative learning" where the scientific belief and technical evidence turns out to be incorrect.
There is perhaps a grand-challenge problem inherent in this discussion. Much of this work focuses on how natural systems respond to climate and climate change. However, this is not strictly a one-way process, as the response of natural systems to climate change (potentially resulting from human intervention) will have a feedback to the climate system. Such responses are being incorporated in some crude way in climate models, but there is much work to be done in this area.
Research Challenge for the Mathematical Sciences: Find new methods for quantifying and visualizing uncertainty in ensembles of climate models; develop scalable, spatial, and spatial-temporal models of extreme climate events and adaptation of natural systems to climate drivers; explore how changes in human systems affect the climate systems; develop new tools for studying spatial and spatial-temporal processes and the underlying issues of data fusion and data assimilation. Example 2: Preparing for and Responding to Rare Extreme Events
Increasing frequency of extreme events such as floods, hurricanes, wildfires, or heat waves is predicted as an outcome of climate change. Reacting to such events stresses human beings and the infrastructure designed to protect them; preparing for them and responding to them so as to minimize impact on humans leads to challenging mathematical problems. For example, extreme heat events overtax energy and water needs of cities, eventually compromising infrastructure and safety of homes, offices, and public facilities. Increased incidence of heat stroke, dehydration, cardiac stress and respiratory distress are commonly resulting health problems. These can be especially serious among elderly or juvenile populations. Under severe enough conditions, evacuation (transport) to controlled environments can be the best means of ensuring the continued well-being of the population. However, the determination of optimal placement of relief centers can be difficult. Facilities must be able to maintain energy and water supplies and sufficient, hygienically-maintained space for displaced persons. They must be able to manage incoming supplies of food and potable water despite the heat-related increase in the dangers of food spoilage. Further, the populations at greatest health risk from heat events are also those least able to travel long distances, requiring consideration of spatial demography for the area being served by the facility. Easy access to healthcare will also be of great importance, whether that should ultimately include planning for onsite care, or ensuring nearby access to hospitals capable of handling the increased patient load. Careful planning for the locations chosen for relief centers may be of critical importance to ensuring minimal health impact during heat events. The research challenges in this area cut across disciplines, involving spatial demographic distribution of vulnerable populations, probabilistic mixed integer programming methods, and other aspects of “location theory”. While location theory is a classical subject in operations research and discrete mathematics, there are major new twists that interrelate choice of optimal location to predictions of duration, onset time, and severity of heat events that will require the engagement of remote sensors and the expertise of climate change modelers.1 1 This paragraph is taken from the description of the DIMACS Climate and Health Research Initiative.

68 | P a g e
Similar evacuation problems arise during floods, hurricanes, and wildfires, though here evacuees are not necessarily limited to certain vulnerable populations but are instead those closest to areas of threat. Moreover, evacuation distances for these extreme events are frequently longer than in the heat event scenario. Now, uncertainty in resulting location problems still arises from duration, onset time, and severity, but also involves uncertain spatial distribution of disasters.
In addition to location theory, various other topics from operations research are relevant to the evacuation problem. One involves supplying and staffing evacuation sites. The job assignment problem is a classic problem in operations research that arises in heat events through the need to assign an appropriate mix of doctors, nurses, and support staff to relief centers. New twists on this problem arise from uncertainty. We don’t know how long the heat event will take place. We don’t know whether the staff will show up for work or instead choose to care for their own families. We don’t know how many people will show up at the relief center and what underlying health conditions they will have, requiring different skills among the medical staff. Thus, we face assignment problems under considerable uncertainty, a major problem in stochastic optimization calling for new tools and methods. Similar issues arise from having to decide what kinds of supplies to stockpile in or order for a relief center, whether it’s due to a heat event or a flood, hurricane, or wildfire. This is related to the classic operations research problem of inventory planning, but with complex stochastic twists of the kind described above. The transportation problem is a classic operations research problem that arises in evacuation planning. In this problem, we want to move goods from sources to destinations. Here, we want to move evacuees from homes to relief centers. But whom do we send where? The answer depends upon transportation times (which are undoubtedly stochastic), the physical condition of evacuees which may allow the less vulnerable people to be transported further away, and the medical expertise available at a given relief center that might or might not match the needs of an evacuee. Thus, we have a stochastic optimization problem with new twists, including uncertainties, combined with a “matching problem” of operations research that involves assigning people to relief centers that match their needs and that minimize their travel times. This is a multicriteria optimization problem of considerable complexity.
Under emergency conditions, particular strategies for evacuation are more successful than others at maintaining order and maximizing the safety of those being displaced. Many natural disasters lead to the progressive loss of motor vehicle access, e.g., by making transversal of specific routes dangerous or impossible through flooding, making routing strategies that were designed assuming a known and constant set of accessible roadways inappropriate. Further, exactly these same conditions are those in which medical transport can be most critical, especially if the affected roadways are limiting access to local hospitals. As situations change during extreme weather events (e.g. water level rises), different areas can experience both greater need of immediate access to medical care and fewer accessible means of transportation into and out of the area to receive that care. These conditions can lead to very specific and otherwise unlikely complications, requiring particular attention. This calls for new algorithms for determining optimal routing for emergency transportation on the road systems in real-time under dynamically changing network structure, as information about current (and likely future) access levels change to maximize the efficiency of use of available routes. Among the relevant areas of the mathematical sciences are spatial analysis, analysis of
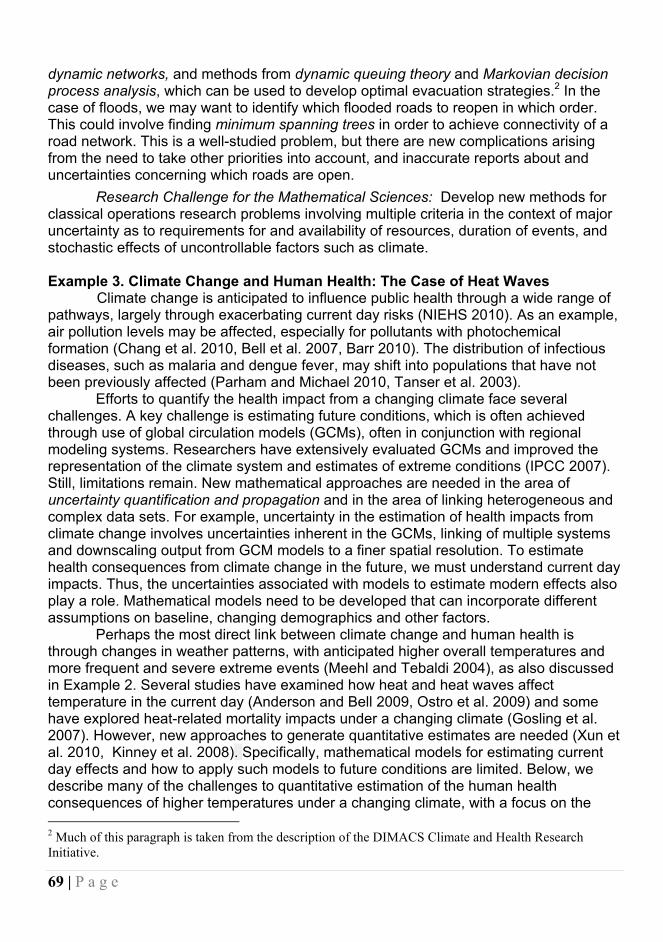
69 | P a g e
dynamic networks, and methods from dynamic queuing theory and Markovian decision process analysis, which can be used to develop optimal evacuation strategies.2 In the case of floods, we may want to identify which flooded roads to reopen in which order. This could involve finding minimum spanning trees in order to achieve connectivity of a road network. This is a well-studied problem, but there are new complications arising from the need to take other priorities into account, and inaccurate reports about and uncertainties concerning which roads are open.
Research Challenge for the Mathematical Sciences: Develop new methods for classical operations research problems involving multiple criteria in the context of major uncertainty as to requirements for and availability of resources, duration of events, and stochastic effects of uncontrollable factors such as climate. Example 3. Climate Change and Human Health: The Case of Heat Waves Climate change is anticipated to influence public health through a wide range of pathways, largely through exacerbating current day risks (NIEHS 2010). As an example, air pollution levels may be affected, especially for pollutants with photochemical formation (Chang et al. 2010, Bell et al. 2007, Barr 2010). The distribution of infectious diseases, such as malaria and dengue fever, may shift into populations that have not been previously affected (Parham and Michael 2010, Tanser et al. 2003).
Efforts to quantify the health impact from a changing climate face several challenges. A key challenge is estimating future conditions, which is often achieved through use of global circulation models (GCMs), often in conjunction with regional modeling systems. Researchers have extensively evaluated GCMs and improved the representation of the climate system and estimates of extreme conditions (IPCC 2007). Still, limitations remain. New mathematical approaches are needed in the area of uncertainty quantification and propagation and in the area of linking heterogeneous and complex data sets. For example, uncertainty in the estimation of health impacts from climate change involves uncertainties inherent in the GCMs, linking of multiple systems and downscaling output from GCM models to a finer spatial resolution. To estimate health consequences from climate change in the future, we must understand current day impacts. Thus, the uncertainties associated with models to estimate modern effects also play a role. Mathematical models need to be developed that can incorporate different assumptions on baseline, changing demographics and other factors.
Perhaps the most direct link between climate change and human health is through changes in weather patterns, with anticipated higher overall temperatures and more frequent and severe extreme events (Meehl and Tebaldi 2004), as also discussed in Example 2. Several studies have examined how heat and heat waves affect temperature in the current day (Anderson and Bell 2009, Ostro et al. 2009) and some have explored heat-related mortality impacts under a changing climate (Gosling et al. 2007). However, new approaches to generate quantitative estimates are needed (Xun et al. 2010, Kinney et al. 2008). Specifically, mathematical models for estimating current day effects and how to apply such models to future conditions are limited. Below, we describe many of the challenges to quantitative estimation of the human health consequences of higher temperatures under a changing climate, with a focus on the 2 Much of this paragraph is taken from the description of the DIMACS Climate and Health Research Initiative.

70 | P a g e
potential contributions of mathematical modeling. Many of the challenges discussed apply more broadly to the study of human health and climate change in general.
Studying adaptation: The ability of people to adapt to increasing long-term average temperatures as well as increasing frequency and severity of heat waves is one of many interrelated variables contributing to the uncertainty about the human health impact of climate change (Patz et al. 2000). We consider adaptation to mean a person’s ability to adapt to temperature patterns that they commonly experience, thereby mitigating potentially negative health effects. Adaptation pathways can be biological, structural (e.g., differences in building designs), or behavioral (e.g., changes in clothing or indoor/outdoor activity patterns). Studies of temperature and mortality have quantified aspects of adaptation in many different ways, and there is no mathematical framework that has been developed that comprehensively quantifies adaptation. For example, a study of 11 large U.S. cities found that for the years 1973–1994, compared to southern cities, northern cities, which typically have milder climates, generally had larger heat effects (Curriero et al. 2002). Central air conditioning is an adaptive factor associated with decreasing effects of extreme heat (Bouchama et al. 2007).
Characterizing susceptibility: A key question of interest is whether extreme heat affects individuals and populations equally, and studies have identified a number of factors that make people more susceptible to dying from or being hospitalized for heat-related illnesses, such as medical conditions, age, and socio-economics (Bouchama et al 2007). However, results have not been completely in agreement, and current approaches have a number of deficiencies. It is not always clear whether differences between studies of heat waves are attributable to differences in study populations, temperature characteristics, or statistical methodology. Spatial statistics may contribute to research on differences in vulnerability across communities.
Providing evidence toward the mortality displacement hypothesis: A few studies have examined whether some heat related deaths would have occurred only a few days later even without the elevated exposures, in this case, elevated temperatures, a concept known as “mortality displacement”. Again, results for previous studies are mixed. Mathematical models could be developed to better characterize the time course of temperature effects on mortality. For example, distributed lag models allow one to make inferences about the cumulative health effect of a heat wave over a multi-day period after the heat wave episode and they have been applied in the context of time series studies of air pollution and mortality (Schwartz 2000, Welty and Zeger 2005).
Developing a comprehensive treatment of both statistical and model uncertainty: Understanding the contribution of different sources of uncertainty (uncertainty quantification), as well as how these uncertainties are propagated, are integral parts of research on health risks under climate change. In order to combine estimates of present and historical relative risk of mortality associated with heat waves with output from climate simulation models, a measure of the corresponding uncertainty is desired. This measure should include both model uncertainty as well as statistical uncertainty conditional on a given model.
Surveillance modeling to track health effects from extreme temperatures. Surveillance modeling could include linked data bases with information on weather, health, and potential confounders. New methods for developing integrated data bases are needed. These linked national data set and statistical and mathematical models could be used to: 1) routinely estimate the association between extreme temperature
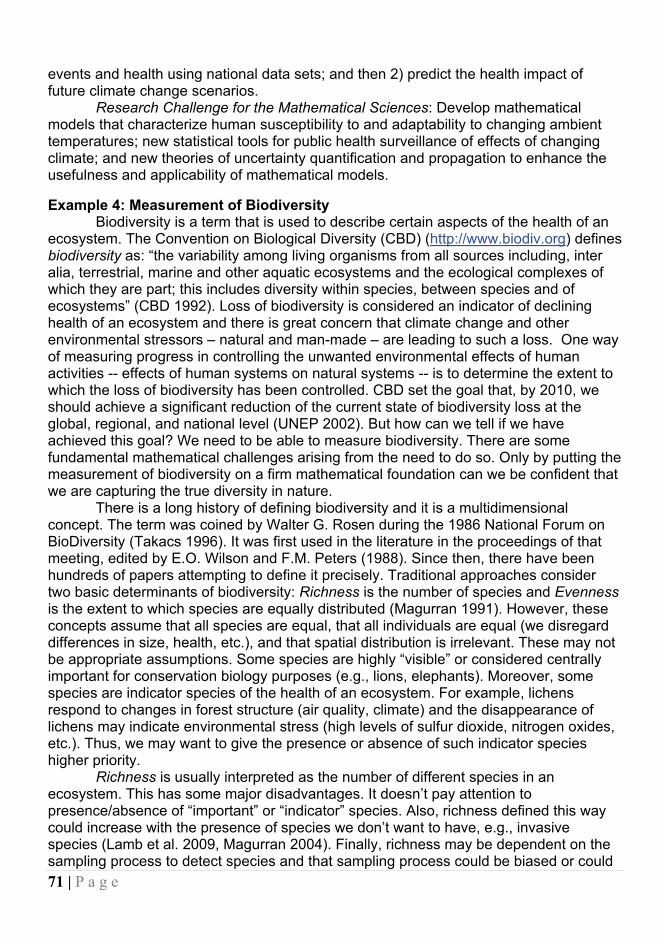
71 | P a g e
events and health using national data sets; and then 2) predict the health impact of future climate change scenarios.
Research Challenge for the Mathematical Sciences: Develop mathematical models that characterize human susceptibility to and adaptability to changing ambient temperatures; new statistical tools for public health surveillance of effects of changing climate; and new theories of uncertainty quantification and propagation to enhance the usefulness and applicability of mathematical models.
Example 4: Measurement of Biodiversity Biodiversity is a term that is used to describe certain aspects of the health of an
ecosystem. The Convention on Biological Diversity (CBD) (http://www.biodiv.org) defines biodiversity as: “the variability among living organisms from all sources including, inter alia, terrestrial, marine and other aquatic ecosystems and the ecological complexes of which they are part; this includes diversity within species, between species and of ecosystems” (CBD 1992). Loss of biodiversity is considered an indicator of declining health of an ecosystem and there is great concern that climate change and other environmental stressors – natural and man-made – are leading to such a loss. One way of measuring progress in controlling the unwanted environmental effects of human activities -- effects of human systems on natural systems -- is to determine the extent to which the loss of biodiversity has been controlled. CBD set the goal that, by 2010, we should achieve a significant reduction of the current state of biodiversity loss at the global, regional, and national level (UNEP 2002). But how can we tell if we have achieved this goal? We need to be able to measure biodiversity. There are some fundamental mathematical challenges arising from the need to do so. Only by putting the measurement of biodiversity on a firm mathematical foundation can we be confident that we are capturing the true diversity in nature.
There is a long history of defining biodiversity and it is a multidimensional concept. The term was coined by Walter G. Rosen during the 1986 National Forum on BioDiversity (Takacs 1996). It was first used in the literature in the proceedings of that meeting, edited by E.O. Wilson and F.M. Peters (1988). Since then, there have been hundreds of papers attempting to define it precisely. Traditional approaches consider two basic determinants of biodiversity: Richness is the number of species and Evenness is the extent to which species are equally distributed (Magurran 1991). However, these concepts assume that all species are equal, that all individuals are equal (we disregard differences in size, health, etc.), and that spatial distribution is irrelevant. These may not be appropriate assumptions. Some species are highly “visible” or considered centrally important for conservation biology purposes (e.g., lions, elephants). Moreover, some species are indicator species of the health of an ecosystem. For example, lichens respond to changes in forest structure (air quality, climate) and the disappearance of lichens may indicate environmental stress (high levels of sulfur dioxide, nitrogen oxides, etc.). Thus, we may want to give the presence or absence of such indicator species higher priority.
Richness is usually interpreted as the number of different species in an ecosystem. This has some major disadvantages. It doesn’t pay attention to presence/absence of “important” or “indicator” species. Also, richness defined this way could increase with the presence of species we don’t want to have, e.g., invasive species (Lamb et al. 2009, Magurran 2004). Finally, richness may be dependent on the sampling process to detect species and that sampling process could be biased or could

72 | P a g e
depend on the length of time sampling is done, the intensity of the sampling procedure, and the size of the area sampled. See, for example, Boulinier et al. (1998), Gotelli and Colwell (2001), Soberon and Llorente (1993). The statistical analysis of the interplay between species “richness” and the sampling procedure calls for new mathematical work. There are already some interesting mathematical approaches to the connection between time spent sampling and number of species detected; for instance, as noted by Soberon and Llorente (1993), there is evidence that as time spent collecting increases, the number of species identified asymptotically approaches some limit. Soberon and Llorente also investigate different assumptions about the probability of detecting a new species in a given time period given the number of species that have been detected so far. Which model of species richness is most suitable depends on the collecting experience/procedure. For example, does the probability of finding a new species decrease linearly or become more and more difficult (e.g., exponentially) over time? Much more work along these lines is needed.
Notions of evenness in the biological literature are frequently based on ideas going back in the economic literature to the early 1900s, in particular on the work of Gini (1909, 1912) on measures of even income or wealth distribution and the work of Dalton (1920) on measures of inequality. This work is of interest in its own right with regard to sustainability, as we study ways to characterize the human sense of well-being and the extent to which we have achieved a stable degree of social or economic equity (see e.g., Firebaugh 1999, 2003). Other measures of biodiversity or of evenness go back to work in communication theory, in particular work of Shannon (1948) on the concept of entropy in information theory, though they are predated in the biological literature by work of Boltzmann (1872). Still others, such as the well-known Simpson index (Simpson 1949), measure the probability that any two individuals drawn at random from an infinite population will belong to the same species. There are many indices that have been proposed over the years. How does one choose among these? One idea is to write down some general principles (axioms) that a measure of evenness should satisfy and see which of the suggested indices satisfy them. This approach goes back to the work of Dalton (1920) in the economics literature and is widely discussed in the literature of biodiversity (Egghe and Rousseau 1990, 1991 or Rousseau 1992). Some axiom systems lead to theorems that limit the possible measures of evenness very greatly, but much more is needed to isolate the appropriate axioms for different contexts and to derive the evenness measures that follow from them. Another approach is to derive a partial order on vectors giving number of individuals of each kind of species, so-called abundance vectors. Then we require that a measure of evenness reflect this partial order (Nijssen et al. 1998, Patil and Taillie 1982, Rousseau et al. 1999). While the literature has several widely-used ways to define such partial orders, approaches to define them axiomatically or derive them from fundamental theories about species distributions are lacking. Also, the problem gets to be quite subtle if we compare two abundance vectors with different numbers of species, which is often of interest. Another challenge is to modify the classic approach to measurement of evenness when we incorporate weights of importance for different species, e.g., indicator species or invasive species.
Since biodiversity is more than just richness (number of species) and more than just evenness, we can explore ways of combining both measures into one index. This presents major challenges for mathematical analysis, including finding axiom systems

73 | P a g e
that characterize a partial order on abundance vectors that reflects the combined effect of richness and evenness (Rousseau and Van Hecke 1999, Rousseau et al. 1999).
Because different indices of biodiversity have different advantages and disadvantages, we sometimes look to use several of them in addressing a question and see if they yield a consistent conclusion. This raises both mathematical and statistical challenges, for example studying families of biodiversity indices that depend upon some parameter and giving conditions on the range of values of the parameter where the indices will give consistent rankings of biodiversity (Buckland et al. 2005, Ricotta 2003).
It should be noted that making precise notions of richness or evenness or other notions of biodiversity is an example of what is now being termed a hybrid mathematical model. For, in many cases we can describe ecosystems in terms of number of individuals of different kinds of species (a discrete variable) and other times we can describe them in terms of the biomass of different kinds of species (a continuous variable), and sometimes, however, we need hybrid models that include both discrete and continuous counterparts.
Finally, a measure of biodiversity is applied to a particular ecosystem at a particular instant of time. A goal of biodiversity preservation is to achieve ecosystems that are sustainable, i.e., maintain relatively stable biodiversity into the future. A good measure of biodiversity should be usable in mathematical models that help us predict that under certain conditions of an evolving ecosystem, the biodiversity will remain relatively stable. The development of such mathematical models is a key goal of sustainability science, and it is intimately connected to finding precise definitions of biodiversity.
Research Challenge for the Mathematical Sciences: Develop clear criteria for how to measure biodiversity, derived from mathematically-precise assumptions; devise methods for applying the criteria that take into account potential biases and problems in data gathering to inform the measures and the multiple criteria for a biodiversity measure; understand the uncertainty involved in claims about changes (positive or negative) in biodiversity; and find ways to use the measures to understand how to achieve ecosystems that are sustainable and maintain stable biodiversity into the future. Example 5: Migration
Migration of animals, birds, fish, insects, and plants are key processes in the balance of natural systems. These processes can be dramatically sped up by modern transportation systems that move “stowaway” species from one part of the world to another in a matter of days or even hours. All of these processes interact in a fundamental way with human well-being. For example, fish contribute a great percentage of our planet’s biomass, while animal migration/invasion affects agriculture and disease. Yet, changing environmental conditions, often traceable to human activities, threaten to impact these critical migration processes.
Fish populations are a key case in point. An International Symposium on Climate Change, held on April 25-29, 2010 in Sendai, Japan, dealt with forecasting impacts, assessing ecosystem response, and evaluating management strategies in ocean fishery. Fishery conditions in the ocean are affected by global changes in temperature and by acidification arising from increasingly dissolved CO2. Some of the consequences are changing migration patterns, and increased ratio of small-to-large fish populations; see, e.g. Garcia and Moreno (2003), Yakubu and Fogarty (2006). There are many

74 | P a g e
mathematical models of ocean food-limited fishery. A challenge is to incorporate the effects of global change and ocean acidification into such models. The effect of climate change on fish migration is clearly amenable to mathematical models. For example, one can readily state a system of partial differential equations that includes a transport term, diffusion, and nonlinear interactions among the species. For example, for fish seeking cooler environment, the transport term may be proportional to the gradient of the temperature and the acidity of the ocean water. The diffusion matrix is such that it tends to discourage too many fish converging on one spot. There are many variants in such differential equation models and challenging problems arise from analyzing them. Animal migration on land including predator-prey relationship and plant migration or invasion can be modeled by a similar system, where one incorporates land cover types such as water and different kinds of vegetation.
Birds migrate long distances as seasons change. With changing climate, these migration patterns are changing. Not all species react in the same way or adapt as quickly to changing environmental conditions. Thus, for example, there are cases of birds migrating earlier than before, but arriving at their destination before their traditional food sources are available (see, e.g. Miller-Rushing et al. 2008). A key to ecosystem health is the delicate balance among interacting cyclic processes, and climate change can disrupt long-developed synchronicities in timing among these processes. This type of problem – and prediction of its impact on natural populations – leads to serious mathematical challenges. It connects closely to human well-being since birds play an important role in insect control, which in turn affects the growth of crops and other agricultural products for human consumption.
Understanding animal and plant migrations requires us to understand interactions among biological entities from ecological and evolutionary perspectives in a dynamic and disturbed global environment (Agrawal et al. 2007). Graph theory provides a flexible conceptual model that can clarify the relationship between structures and processes in such applied problems, including the mechanisms of configuration effects and compositional differences. Graph concepts apply to many ecological and evolutionary phenomena, including interspecific associations, spatial structure, dispersal in landscapes, and relationships within meta-populations and meta-communities. Spatial graph properties can be used for description and comparison of migration patterns as well as to test specific hypotheses about migration. The analysis of animal movement can focus either on the attractive or avoidance effects of each patch of land, or on the directionality and volume of movement between patches (Croft et al. 2008). Spatially explicit graph analyses of these two aspects can be examined separately or together using gravity models, spatial graphs, or other new models not yet developed. Numerous questions about migration can be addressed this way, for example: What is the relationship between changes in spatial habitat structure and gene flow? How do these changes affect species survival? How does the pattern of migration routes affect the spread of disease? The mathematical sciences have much to contribute in answering such questions.
Sampling processes create serious limitations for the interpretation of metrics that describe the property of a graph when there is no assurance that there is a complete census of the objects depicted in the graph. The comparison of metrics is a significant problem to be addressed in the mathematical sciences. The distribution of degrees of nodes in a graph presents a relevant example, and we need to understand

75 | P a g e
how the sampling procedure affects the properties of the sequence of node degrees in a graph representing a physical, biological, or social process. A random graph has a binomial or Poisson distribution of node degrees, a scale-free graph has a power law distribution of node degrees, and a “small world” graph has an exponential distribution of node degrees (Albert and Barabási 2002). Different models of graph evolution lead to these different degree distributions in dynamically evolving networks and can be used to understand the evolutionary processes underlying changing migration patterns. Moreover, the differences among such models of graphs and their formation provide information about the processes that may have produced them. The degree parameters are also important characteristics of the graph’s structure. For example, they can lead to an analysis of the vulnerability or stability of a network under the removal of any particular node (under various measures of vulnerability and stability).
Scientists are predicting human mass migration as a consequence of climate change: millions of people fleeing from rising sea levels and drought, leading to serious consequences for both migrants and receiving societies. A mathematical approach to such mass migration, which modeled the connection between climate change and human migration, was developed by Perch-Nielsen (2004). Among the mathematical sciences challenges involving the study of mass human migrations are the development of models describing analogies to and evolution of patterns of animal migrations, and the understanding of the complex adaptive systems involved in mass human migrations.
Research Challenge for the Mathematical Sciences: Develop models of the interplay between climate and migration and the disruption/synchronization of the processes that allow for seamless integration of multiple mechanisms relevant to migration; model the spatial and temporal spread of animal and plant populations under rapidly changing environmental conditions caused by human processes and the impact of modified human systems on changing migration patterns; understand the evolution of networks that interconnect migratory routes so as to understand forces threatening the stability of migration and the resulting impact on human systems. Example 6: Health of Lakes and Oceans
The quality of water in our lakes, rivers, streams, and oceans is critical to sustaining life on our planet. The natural processes underlying healthy bodies of water, large and small, are closely related to processes underlying human activities.
Human and natural processes are often effectively modeled by linked economic-ecological models, often capable of exhibiting multiple (coexisting) attractors. A simple example is given by the eutrophication of a lake through phosphorous run-off from agricultural land, which has been extensively studied by ecologists and economists (see e.g. Bennett et al. 1999). The driver of change in this setting is often that fertilizer runs off farmland around the lake and into the lake, particularly when it rains. Phosphorus in the fertilizer dissolves in water and also is retained by sediment on the lake bottom. At low concentrations of phosphorus a lake is clear and productive, with many sources of economic value. At high concentrations it is biologically almost dead and of little or no economic value. The basic dynamics are that phosphorus leaves the lake through outflow in the stream that exits the lake, at a rate that is proportional to the concentration in the water; it flows in off the neighboring cropland, and may also move from the sediment at the bottom of the lake into solution.

76 | P a g e
A simple deterministic description of this system is given by an ordinary differential equation, where the rate of change of the concentration of phosphorous equals the difference between inflow and outflow of phosphorus. This simple system exhibits three equilibria where inflow and outflow are equal, two of which are locally stable and one unstable. Such a system is “normally” in a stable equilibrium at the low concentration, and is economically and biologically productive. But a sudden heavy rain can wash in enough fertilizer to shift the concentration of phosphorus to within the basin of attraction of the right hand equilibrium, leaving it in a far less productive state. So could a very hot dry spell, by evaporating water from the lake and increasing concentration above a critical level. This is a very simple example of dynamical behaviors that can emerge from ecosystems under stress from human economic activities. These systems can exhibit multiple attractors (not necessarily equilibrium attractors) with complex basins of attraction of varying sizes. Understanding how these systems may move stochastically between these attractors is critical. We sometimes understand the local dynamics of these basins but questions on the outcomes of stochastic movements tipping complex systems from one attractor to another are mostly open.
Eutrophication is just one example of a freshwater water quality problem that is related to the interplay of natural and human systems and is amenable to analysis using mathematical models. There are many others. For example, novel mixing patterns in run-off and natural ground water collection caused by change in climate can lead to novel mixing patterns of otherwise benign contaminants whose combination could potentially lead to unwanted impacts. Research is required in the fundamental understanding of these mixing patterns. For another example, water supply is both required for agricultural processes and affected by them. How can we model the effect on water supply of changing agricultural practices due to climate change? We also need early warning of changing availability of good quality water for agricultural use. How can machine learning and data mining give us early warning of areas of shortage of water arising from climate change? - see, for example, Dzeroski et al. (2000), Policastro et al. (2004). Rain is the input for water in hydrological cycles, yet spatial and temporal estimates of water amounts, at the national or regional level, are poorly understood. Traditional methods of rain gauging need to be supplemented with remote sensing and there are many mathematical challenges arising from placement of sensors to finding patterns from reports from a network of distributed sensors; see, e.g., Schultz (1993). Speaking more broadly, can we develop mathematical models that will allow us to predict regional water shortages due to changing climate?
Water in the oceans is critical for the health of the planet in that the life cycle of many of the world’s species is intimately tied to the oceans and related wetlands, and also tied to a major source of food of many of our planet’s inhabitants. There is great concern that increased dissolved organic carbon in the world’s oceans and resulting ocean acidification, tied to human activities, is a threat to the health of our oceans. Large-scale computational models are required to better understand both long-term and short-term carbon cycling in the oceans (Caldeira and Wickett 2005). The field of ocean science has long emphasized the connection between oceans and climate, and has used sophisticated numerical analysis methods to model this interconnection. New challenges require adaptation of these models to understand the connection between carbon dioxide in the air and dissolved carbon in the water. Getting early warning of
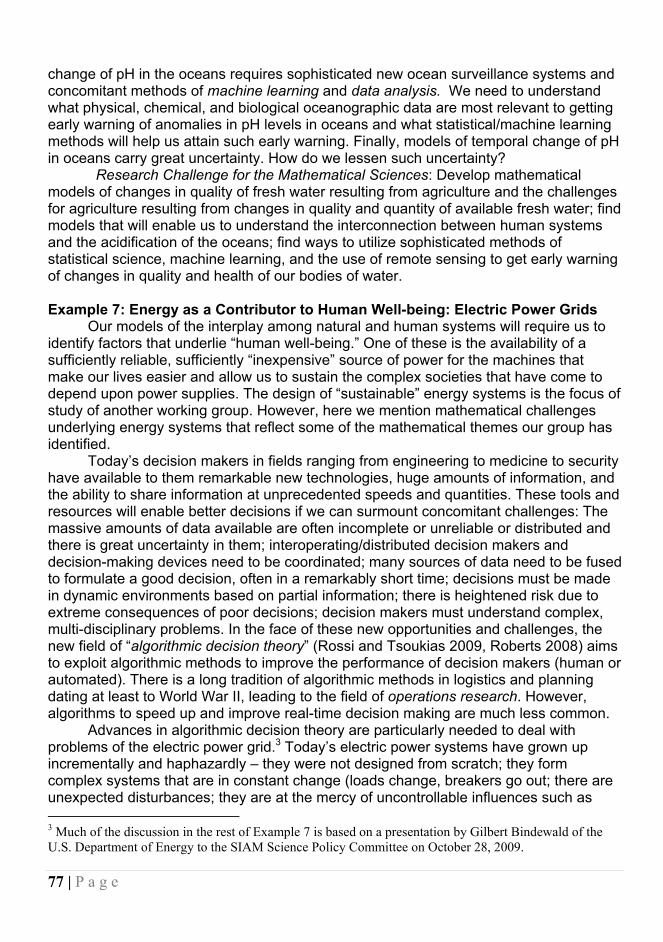
77 | P a g e
change of pH in the oceans requires sophisticated new ocean surveillance systems and concomitant methods of machine learning and data analysis. We need to understand what physical, chemical, and biological oceanographic data are most relevant to getting early warning of anomalies in pH levels in oceans and what statistical/machine learning methods will help us attain such early warning. Finally, models of temporal change of pH in oceans carry great uncertainty. How do we lessen such uncertainty?
Research Challenge for the Mathematical Sciences: Develop mathematical models of changes in quality of fresh water resulting from agriculture and the challenges for agriculture resulting from changes in quality and quantity of available fresh water; find models that will enable us to understand the interconnection between human systems and the acidification of the oceans; find ways to utilize sophisticated methods of statistical science, machine learning, and the use of remote sensing to get early warning of changes in quality and health of our bodies of water. Example 7: Energy as a Contributor to Human Well-being: Electric Power Grids
Our models of the interplay among natural and human systems will require us to identify factors that underlie “human well-being.” One of these is the availability of a sufficiently reliable, sufficiently “inexpensive” source of power for the machines that make our lives easier and allow us to sustain the complex societies that have come to depend upon power supplies. The design of “sustainable” energy systems is the focus of study of another working group. However, here we mention mathematical challenges underlying energy systems that reflect some of the mathematical themes our group has identified.
Today’s decision makers in fields ranging from engineering to medicine to security have available to them remarkable new technologies, huge amounts of information, and the ability to share information at unprecedented speeds and quantities. These tools and resources will enable better decisions if we can surmount concomitant challenges: The massive amounts of data available are often incomplete or unreliable or distributed and there is great uncertainty in them; interoperating/distributed decision makers and decision-making devices need to be coordinated; many sources of data need to be fused to formulate a good decision, often in a remarkably short time; decisions must be made in dynamic environments based on partial information; there is heightened risk due to extreme consequences of poor decisions; decision makers must understand complex, multi-disciplinary problems. In the face of these new opportunities and challenges, the new field of “algorithmic decision theory” (Rossi and Tsoukias 2009, Roberts 2008) aims to exploit algorithmic methods to improve the performance of decision makers (human or automated). There is a long tradition of algorithmic methods in logistics and planning dating at least to World War II, leading to the field of operations research. However, algorithms to speed up and improve real-time decision making are much less common.
Advances in algorithmic decision theory are particularly needed to deal with problems of the electric power grid.3 Today’s electric power systems have grown up incrementally and haphazardly – they were not designed from scratch; they form complex systems that are in constant change (loads change, breakers go out; there are unexpected disturbances; they are at the mercy of uncontrollable influences such as 3 Much of the discussion in the rest of Example 7 is based on a presentation by Gilbert Bindewald of the U.S. Department of Energy to the SIAM Science Policy Committee on October 28, 2009.

78 | P a g e
weather). Moreover, these systems operate under considerable uncertainty. Cascading failures can have dramatic consequences (Amin and Schewe 2007). Research challenges relating to sustainability of our electric power system arise from the huge number of customers; uncontrolled demand; changing supply mix system not designed for complexity of the grid; and the fact that the grid operates close to the edge and is thus vulnerable to failures. The grid is managed through large parallel computers/supercomputers with the system not set up for this type of management, and finding better ways to use these supercomputers to manage the power grid is called for. In addition, algorithmic methods are needed to improve security of the energy system in light of its haphazard construction and dynamically changing character and to find early warning of a changed state, i.e., in anomaly detection. We also need such methods to identify and overcome vulnerabilities and to protect the privacy of individuals under new data collection methods about electricity use.
Today’s “smart grid” data sources enable real-time precision in operations and control previously unobtainable (see e.g., Amin 2005, Amin and Stringer 2008, Amin and Wollenberg 2005, Farrell et al. 2002, Zhao and Villasecca 2008): Real-time data from smart meter systems will enable customer engagement through demand response, efficiency, etc.; time-synchronous phasor data, linked with advanced computation and visualization, will enable enhanced operational intelligence, advances in state estimation, real-time contingency analysis, and real-time monitoring of dynamic (oscillatory) behaviors in the system; sensing and measurement technologies will support faster and more accurate response, e.g., through remote monitoring; advanced control methods will enable rapid diagnosis and precise solutions appropriate to an “event.” Traditional SCADA measurement provides bus voltages; line, generator, and transformer flows; and breaker status with a measurement every 2 to 4 seconds. Phasor technology and phasor measurements provide additional data: voltage and current phase angles; frequency rate of change; with measurements taken many times a second. This provides challenges for the analysis of massive data sets, allowing us to get dynamic visibility into power system behavior. New algorithmic methods to understand, process, visualize data and find anomalies rapidly are required. New measurements will allow rapid understanding of how customers are using electricity, thus raising privacy issues, which is another area for research – combining data science with statistical and cryptographical approaches to data privacy. Mathematical methods will be required to take advantage of monitoring that will give us visibility beyond local controls, frequency instability detection, and triangulation to estimate location of generator dip or hard drop. They will also be required to assist in analysis/assessment for improved state estimation, to assist in planning for dynamic model evaluation and forensic analysis, and to assist in protection and control through automatic arming of remedial action schemes.
Mathematical challenges also arise from issues of grid robustness. For example, how will the grid respond to disturbances and how quickly can it be restored to a healthy state; in other words, how can we design algorithms that enhance grid sustainability? Advanced computational tools are needed to gain wide area situational awareness and they can help with quick response to dynamic process changes, e.g., using automatic switching. For example, can we tell quickly how far we are “from the edge” and thus avoid power system collapse when voltages drop too fast? We need to develop reliable, robust models to help us achieve system understanding and need a new mathematics

79 | P a g e
for characterizing uncertainty in information created from the large volumes of data arising from the smart grid. We also need new methods to enable the use of high-bandwidth networks by dynamically identifying only the data relevant to the current information need and discarding the rest.
Cyber attacks on the electric power grid are a major concern. “Cyberspace” is insecure and faced with attacks by adversaries who wish to take advantage of our dependence on it. Use of cyberspace subjects us to loss of information, loss of money, and disruption, destruction, or interruption of critical services. Adversaries can launch sophisticated “information warfare” (e.g., Russian cyberattacks on Estonia and “botnet” attacks by North Korea on the South Korean government and private industry sites). We need to find ways to protect against cyber attacks that take advantage of vulnerabilities created by dependence on massive amounts of data generated through the smart grid. Development of fast methods of anomaly detection, randomized algorithms for botnet detection in order to confuse adversaries and increase the cost and risk of attacks, and game-theoretic approaches to competition from smart adversaries are all important mathematical sciences challenges in cyberdefense.
Research Challenge for the Mathematical Sciences: Find statistical and algorithmic methods of data analysis, advanced computational tools, and new cryptographic tools to aid us in making management and policy decisions about the electric power grid; learn how to handle the massive amount of data that arise in monitoring the grid to give us rapid awareness of anomalies so as to prevent cascading failures; find ways to protect it against failures (deliberate and otherwise); and guide us to efficient use of power while protecting the privacy of individuals. 4. Concluding Remarks
As the examples given above show, the concept of human well-being is multidimensional, depending on a number of factors, each depending on the local environment. We may then represent the relationships between human systems and the natural environment as a network whose nodes are the various factors by which we measure this complex relationship. This network is dynamic, and the edges correspond to evolving relationships that can be modeled by mathematical/statistical tools. Given that what happens in one region of the world may affect what happens in other regions, we may seek to understand human well-being and that of the natural environment of planet Earth through understanding the whole as a network of networks. This network consists of dynamically evolving networks, tied together in a network that itself is changing over time and space. Sustainability can then be framed in terms of the long term stability of networks over the local network and the network of networks. The study of dynamically changing networks and the interplay of a complex web of such networks presents a major set of challenges for the mathematical sciences.
We have focused on several examples that demonstrate how mathematical and statistical methods can be used to provide new insight for challenging issues in sustainability. However, we also articulate below a longer list of mathematical areas which we believe can be transformative to the study of several research areas in sustainability and also give a more extensive list of examples of sustainability issues that seem amenable to analysis using methods of the mathematical sciences. Neither of the

80 | P a g e
following lists is intended to be exhaustive and they are included simply for illustrative purposes. Illustrative Relevant Mathematical Areas Data/data science (including dealing with massive amounts of data; data mining; data
presentation/visualization) Uncertainty quantification and uncertainty propagation Operations research Information theory Multiscale methods Dynamic networks (both networks that are dynamically changing and those whose
components can undergo dynamic change of state) Decision science/theory, policy science Game theory Stochastic optimization Partial orders Spatial statistics Hybrid models (as a mix of discrete and continuous models) Illustrative Applied Problems Relating to Sustainability Climate and disease Migration Heat events/extreme events Biosurveillance Population growth Power grid (including smart meters) Green computing/green living Habitat formation Urbanization Behavioral responses to disasters Epidemiology/public health Forest health Fisheries Air pollution Water pollution Transportation systems

81 | P a g e
References
1. Agrawal AA, Ackerly DD, Adler F, Arnold AE, C´aceres C, et al. (2007). Filling key gaps in population and community ecology. Front. Ecol. Environ. 5:145–52.
2. Albert R, Baraba si AL (2002). Statistical mechanics of complex networks. Rev. Mod. Phys. 74: 47–97
3. Amin M (2005). Powering the 21st century: We can - and must - modernize the grid. IEEE Power and Energy Magazine 3: 93-95.
4. Amin M, Schewe P (2007). Preventing blackouts. Scientific American May: 60-67. 5. Amin M, Stringer J (2008). The electric power grid: Today and tomorrow. Materials
Research Society Bulletin 33: 399-407. 6. Amin M, Wollenberg B (2005). Towards a smart grid. IEEE Power and Energy
Magazine 3: 34-41. 7. Anderson GB, Bell ML (2009). Weather-related mortality: how heat, cold, and heat
waves affect mortality in the United States. Epidemiology 20: 205-213. 8. Barr C, Dominici F (2010). Cap and trade legislation: Additional benefits from air
pollution mitigation. Journal of American Medical Association, 303: 69-70. 9. Bell ML, Goldberg R, Hogrefe C, Kinney PL, Knowlton K, Lynn B, Rosenthal J,
Rosenzweig C, Patz J (2007). Climate change, ambient ozone, and health in 50 U.S. cities. Climatic Change 82: 61-76.
10. Bennett EM, Reed-Anderson T, Houser JN, Gabriel JR and Carpenter SR (1999). A phosphorus budget for the Lake Mendota watershed, Ecosystem, 2: 69-75.
11. Boltzmann L (1872). Weitere studien uber das warmegleichgewicht unter gasmolekalen. S.K. Akad. Wiss. Wien 66: 275-370.
12. Bouchama A, Dehbi M, Mohamed G, Matthies F, Shoukri M, Menne B (2007). Prognostic factors in heat wave related deaths: A meta-analysis. Archives of Internal Medicine 167: 2170–2176.
13. Boulinier T, Nichols JD, Sauer JR, Hines JE, Pollock KH (1998). Estimating species richness: The importance of heterogeneity in species detectability. Ecology 79: 1018-1028.
14. Buckland ST, Magurran AE, Green RE, Fewster RM (2005). Monitoring change in biodiversity through composite indices. Philosophical Transactions of the Royal Society B 360:243-254.
15. Cairns, J (2010). Where do we come from? What are we? Where are we going? Ethics in an era of human-influenced rapid climate change, Asian J. Exp. Sci. 24: 01-10.
16. Caldeira A, Wickett ME (2005). Ocean model predictions of chemistry changes from carbon dioxide emissions to the atmosphere and ocean. Journal of Geophysical Research 110: doi:10.1029/2004JC002671.
17. Carmona R, Fehr M, Hinz J, and Porchet A (2010). Market design for emission trading schemes. SIAM Rev. 52: 403-452.
18. CBD (1992). Convention on Biological Diversity. Article 2. CBD (http://www.biodiv.org/convention/articles.asp)
19. Chang HH, Zhou J, Fuentes M (2010). Impact of climate change on ambient ozone level and mortality in southeastern United States. International Journal of Environmental research and Public Health 7: 2866-2880.
20. Croft DP, James R, Krause J (2008). Exploring Animal Social Networks. Princeton

82 | P a g e
Univ. Press, Princeton, NJ. 21. Curriero F, Heiner K, Samet J, Zeger S, Patz, J (2002). Temperature and mortality
in 11 cities of the Eastern United States. American Journal of Epidemiology 155: 80–87.
22. Dalton H (1920). The measurement of inequality of incomes. The Economic Journal 30: 348-361.
23. De Lara M, Doyen L (2008). Sustainable Management of Natural Resources. Mathematical Models and Methods. Springer-Verlag, Berlin.
24. Dietz T, Rose E, York R (2009). Environmentally efficient well-being: Rethinking sustainability as the relationship between human well-being and environmental impacts. Human Ecology Review 16:114-123.
25. Dzeroski S, Demsar D, Grobovic J (2000). Predicting chemical parameters of river water quality from bioindicator data. Applied Intelligence 13: 7-17.
26. Egghe L, Rousseau (1990). Elements of concentration theory. In L. Egghe and R. Rousseau (eds.), Informetrics, Elsevier, 97-137.
27. Egghe L, Rousseau R (1991). Transfer principles and a classification of concentration measures. Journal of the American Society for Information Science 42: 479-489.
28. Farrell A, Lave L, Morgan G (2002). Bolstering the security of the electric power system. Issues in Science and Technology 18: 49-56.
29. Ehrlich PR, Ehrlich AH (1989). How the rich can save the poor and themselves: Lessons from the global warming. In S. Gupta and R. Pachauri, (eds.), Proceedings of the International Conference on Global Warming and Climate Change: Perspectives from Developing Countries. Tata Energy Research Institute, New Delhi, 287-294.
30. Firebaugh G (1999). Empirics of world income inequality. American Journal of Sociology 104: 1597-1630.
31. Firebaugh G (2003). Inequality: What it is and how it is measured? The New Geography of Global Income Inequality. Harvard University Press, Cambridge, MA.
32. Flannigan MD, Logan KA, Amiro BD, Skinner WR, Stocks BJ (2005). Future area burned in Canada. Climatic Change 72: 1–16. DOI:10.1007/s10584-005-5935-y.
33. Garcia SM, Moreno JL (2003). Global overview of marine fisheries In: M. Sinclair, and G. Valdimarsson (eds), Responsible Fisheries in the Marine Ecosystem. FAO and CABI Publishing, 1-24.
34. Gini C (1909). Il diverso accrescimento delle classi sociali e la concentrazione della richezza. Giornale degli Economist, serie II, 37.
35. Gini C (1912). Variabilite mutabilita. Studi Economicoaguridic della Facotta di Giurisprudenza dell Univ. di Cagliari III. Parte II.
36. Gosling SN, McGregor GR, Páldy A (2007). Climate change and heat-related mortality in six cities part 1: Model construction and validation. International Journal of Biometeorology 51: 525-540.
37. Gotelli, NJ, Colwell, RK (2001). Quantifying biodiversity: Procedures and pitfalls in the measurement and comparison of species richness. Ecology Letters 4: 379-391.
38. Intergovernmental Panel on Climate Change (IPCC) (2007). Climate Change 2007: The Physical Science Basis: Contribution of Working Group I to the Fourth Assessment Report of the IPCC.

83 | P a g e
39. Iniyan S, Suganthi L, Jagadeesan TR (1998). Renewable energy planning for India in 21st century. Renewable Energy 14: 453-457.
40. Kinney PL, O'Neill MS, Bell ML, Schwartz J (2008). Approaches for estimating effects of climate change on heat-related deaths: Challenges and opportunities. Environmental Science and Policy 11: 87-96.
41. Lamb EG, Bayne E, Hollowa, G, Schieck J, Butin S, Herbers J, Haughland DL (2009). Indices for monitoring biodiversity change: Are some more effective than others? Ecological Indicators 9: 432-444.
42. Magurran AE (1991). Ecological Diversity and its Measurement. Chapman & Hall, London.
43. Magurran AE (2004). Measuring Biological Diversity. Blackwell, Oxford. 44. Meehl GA, Tebaldi C (2004). More intense, more frequent, and longer lasting heat
waves in the 21st century, Science 305: 994–997. 45. Mellor W, Wright E, Clift R, Azapagic A, Stevens A (2002). A mathematical model
and decision-support framework for material recovery, recycling and cascaded use. Chemical Engineering Science 57: 4697-4713.
46. Miller-Rushing, AJ, Lloyd-Evans TL, Primack RB, Satizinger P (2008). Bird migration times, climate change, and changing population sizes. Global Change Biology, 14: 1959-1972.
47. National Institute of Environmental Sciences (NIEHS) (2010). A Human Health Perspective on Climate Change: A Report Outlining the Research Needs on the Human Health Effects of Climate Change.
48. Nijssen D, Rousseau R, Van Hecke P (1998). The Lorenz curve: A graphical representation of evenness. Coenoses 13: 33-38.
49. Ostro BD, Roth LA, Green RS, Basu R (2009). Estimating the mortality effect of the July 2006 California heat wave. Environmental Research 109: 614-619.
50. Parham PE, Michael E (2010). Modeling the effects of weather and climate change on malaria transmission. Environmental Health Perspectives 118: 620-660.
51. Patil, GP, Taillie, C (1982). Diversity as a concept and its measurement. Journal of the American Statistical Association 77: 548-561.
52. Patz J, McGeehin M, Bernard S, Ebi K, Epstein P, Grambsch A, Gubler D, Reither P, Romieu I, Rose J, Samet J, Trtanj J (2000). The potential health impacts of climate variability and change for the United States: Executive summary of the report of the health sector of the U.S. National Assessment. Environmental Health Perspectives 108:367–376.
53. Perch-Nielsen S (2004). Understanding the effect of climate change on human migration: The contribution of mathematical and conceptual models. Department of Environmental Studies. Zurich, Swiss Federal Institute of Technology. M. Sc. Environmental Physics.
54. Pimpunchat P, Sweatman WL, Triampo W, Wake GC, Parshotam A (2007). Modelling river pollution and removal by aeration. In L. Oxley and D. Kulasiri (eds), MODSIM 2007 International Congress on Modeling and Simulation. Land, Water ad Environmental Management: Integrated Systems for Sustainability. Modelling and Simulation Society of Australia and New Zealand, 2431 – 2437.
55. Policastro CA, Carvalho CPLF, Delbem ACP (2004). A hybrid case based reasoning approach for monitoring water quality. In B. Orchard, C. Yang, M. Ali (eds.), Innovations in Applied Artificial Intelligence: Proceedings of the 17th

84 | P a g e
International Conference on Applied and Engineering Applications of Artficial Intelligence and Expert Systems. Springer, Berlin, 492-501.
56. Ricotta C (2003). On parametric evenness measures. Journal of Theoretical Biology 222: 189-197.
57. Rikun AD (1992). On modeling incentive systems which utilize pollution charges for pollution abatement. Environmental and Resource Economics 2: 593-604.
58. Roberts FS (2008). Computer science and decision theory. Annals of Operations Research 163: 209-253.
59. Rossi F, Tsoukias A (2009). Proceedings of ADT 2009. LNAI 5783, Springer, Berlin. 60. Rousseau R (1992). Concentration and diversity of availability and use in
information systems: A positive reinforcement model. Journal of the American Society for Information Science 43: 391-395.
61. Rousseau R, Van Hecke P (1999). Measuring biodiversity. Acta Biotheoretica 47: 1-5.
62. Rousseau R, Van Hecke P, Nijssen D, Bogaert J (1999). The relationship between diversity profiles, evenness and species richness based on partial ordering. Environmental and Ecological Statistics 6: 211-223.
63. Schultz GA (1993). Hydrological modeling based on remote sensing information. Advances in Space Research 13: 149-166.
64. Schwartz J (2000). Harvesting and long term exposure effects in the relation between air pollution and mortality. American Journal of Epidemiology 151: 440-448.
65. Shah A (2008). Poverty facts and statistics. Global Issues (http://www.globalissues.org)
66. Shannon CE (1948). A mathematical theory of communication. Bell System Technical Journal 27: 379-423.
67. Simpson EH, Llorente B (1993). The use of species accumulation functions for the prediction of species richness. Conservation Biology 7: 480-488.
68. Soberon J, Llorente B (1993). The use of species accumulation functions for the prediction of species richness. Conservation Biology 7: 480-488.
69. Takacs D (1996). The Idea of Biodiversity: Philosophies of Paradise, Johns Hopkins Press, Baltimore.
70. Tanser FC, Sharp B, le Sueur D (2003). Potential effect of climate change on malaria transmission in Africa. Lancet 362:1792-1798.
71. UNEP (2002). Report of the Sixth Meeting of the Conference of the Parties to the Convention on Biological Diversity (UNEP/CBD/COP/6/20).
72. Veeman TS, Politylo J (2003). The role of institutions and policy in enhancing sustainable development and conserving natural capital. Environment, Development and Sustainability 5: 317-332, DOI: 10.1023/A:1025720911995
73. Welty LJ, Zeger SL (2005). Are the acute effects of particulate matter on mortality in the National Morbidity, Mortality, and Air Pollution Study the result of inadequate control for weather and season? A sensitivity analysis using flexible distributed lag models. American Journal of Epidemiology 162: 80-88.
74. Westerling AL, Hidalgo HG, Cayan DR, Swetnam TW (2006). Warming and earlier spring increase Western U.S. forest wildfire activity. Science 313: 940–943.
75. Wilson EO, Peters FM (eds.) (1988). Biodiversity. National Academy Press, Washington, DC.

85 | P a g e
76. Woolford DG, Cao J, Dean CB, Martell DM (2010). Characterizing temporal changes in forest fire ignitions: Looking for climate change signals in a region of the Canadian boreal forest. Environmetrics DOI: 10.1002/env.1067.
77. Xun WW, Khan AE, Michael E, Vineis P (2010). Climate change epidemiology: Methodological challenges. International Journal of Public Health 55: 85-96.
78. Yakubu AA, Fogarty M (2006). Spatially discrete metapopulation models with directional dispersal. Mathematical Biosciences 204: 68–101.
79. Zhao W, Villaseca FE (2008). Byzantine fault tolerance for electric power grid monitoring and control. Proceedings of the 2008 International Conference on Embedded Software and Systems, IEEE Computer Society, 129-135.
86 | P a g e
Appendix 2: Human-Environment Systems (HESs) as Complex Adaptive Systems
Authors Madhur Anand (University of Guelph) Chris Bauch (University of Guelph) Jacques Bélair (University of Montreal) John Harer (Duke University) Nina Fefferman (Rutgers University) Eugenia Kalnay (University of Maryland) Linda Ness (Telcordia) Peter March (Ohio State University) Jorge Rivas (University of Minnesota) James Watmough (University of New Brunswick) Charge to the Group: Under this theme, the group is asked to focus on the dynamics, both endogenous and in response to outside disturbance, of coupled Human-Environment Systems (HES). Key questions regarding the dynamics of HESs relate to the ways in which their behaviors emerge from adaptive actions by their constituent agents, interacting across multiple scales. Addressing such questions will require new mathematics-based theories that must merge holistic and reductionistic perspectives, integrate physical, social, and biological sciences, and scale from the genomic to the biosphere. Societies are complex adaptive systems, composed of individual agents who have their own priorities, and who value the macroscopic features of their societies differently. Resolving those competing perspectives is at the core of addressing sustainability. Under this theme, the group is asked to develop research themes and related questions that focus on integrating advances in the theory and mathematical modeling of complex adaptive systems (CAS) with rich empirical work on the actual dynamics of coupled HES and to explore the relevance of new tools in CAS research for addressing their interactions. 1. Introduction
Sustainability science spans more fields of science than most other interdisciplinary scientific efforts, and yet it can be argued that no science of sustainability is complete unless is examines interactions between human systems and environmental systems (both physical and biological) at multiple scales. It is well known that environmental systems are heavily impacted by the activities of highly organized human societies, and it is also increasingly recognized that environmental systems in turn feed back upon human systems. In addition to this complex feedback loop connecting environmental systems and human systems, societies themselves are highly complex, consisting of “individual agents who have their own priorities, and who value the macroscopic features of their societies differently” (Levin and Clark 2010, p. 22).
A highly suitable conceptual language for the types of interactions seen in coupled human-environment systems is provided by complex adaptive systems (CAS). Complex adaptive systems are defined by several key features: “CAS are composed of agents that interact locally in time and space based on information they use to respond

87 | P a g e
to their environments. Macroscopic behaviors emerge from these local interactions and are not imposed or predetermined. Agents (at least some agents) have the capacity to process information and modify (adapt) their behavioral strategies. Finally, CAS dynamics are often unpredictable (even if the system is deterministic), and uncertainty is pervasive” (Levin and Clark 2010, p. 19). Likewise, human-environment systems are “complex adaptive systems, composed of individual agents that have their own priorities, and who value the macroscopic features of their societies differently” (Levin and Clark 2010, p. 22), but they are also distinguished from other complex adaptive in several ways—we will expand upon these differences in subsequent paragraphs.
The mathematical sciences have made essential contributions to many fields of science, once those fields have been put on a firm quantitative foundation. In the coming years, it will be natural to pose the question: “what role will the mathematical sciences play in developing our understanding of human-environment systems as complex adaptive systems?” There are many reasons to think the role will be very significant, with the primary difference from previous contributions of mathematics to other fields stemming from the trans-disciplinary nature of sustainability science. In the remainder of this white paper we will attempt to outline the potential roles of mathematical sciences in developing the study of human-environment systems as complex adaptive systems.
The 2010 report “Toward a Science of Sustainability” outlined three major themes in the development of HES as CAS: (A) Characterizing and understanding complex HESs, (B) Local adaptive response and their global consequences, and (C) Characterizing tradeoffs in HESs. Each of these themes is important, however our group discussion focused primarily on (A) and secondarily on (B), with little emphasis on (C). In the following paragraphs we outline more detailed research themes that correspondingly fall primarily under (A) and (B) of the 2010 report. After describing some of the research themes that arise in the study of HESs and complex adaptive systems (section 2), we give further examples of such systems (section 3), followed by general and specific recommendations (section 4). 2. Research Themes The defining property of Human-Environment Systems (HESs) is the two-way interaction between humans and the natural environment. In contrast, the social sciences may be concerned with the social dynamics of interactions between humans and neglect what is occurring in the natural environment. Similarly, traditional natural sciences research on environmental systems regards dynamic interactions only within an environmental system, and the human impact is either absent, or static. In HESs, it is the dynamical presence of humans in the context of the natural environment that makes the investigation of HESs particularly challenging. These challenges arise from the range of scales, both temporal and spatial, that emerge from these interactions. “Human and environmental systems impact across variety of scales (...that) are generally mismatched. This mismatch means, for example, that given a spatial scale, social processes (be they economic, or governmental) are likely to be too sluggish to deal easily with the rapid changes normally associated with atmosphere, but too rapid and impatient to recognize and manage many slow but important ecological changes (e.g. soil depletion)” (Levin and Clark 2010, p.60).

88 | P a g e
In trying to identify potential contributions of the mathematical sciences to the development of a science of HESs as CASs, we isolate essential features of the latter that must be captured in a mathematical approach to the subject. Each of these should be included, in one way or another, in any credible mathematical representation, keeping in mind that successful model development is an exercise in compromise. Specific implementations in the form of examples will be detailed in the following section. The mutual, bidirectional interaction between the composing human and environmental elements is an essential feature of HESs. As alluded to above, the way humans bidirectionally modify the environment has been neglected in many representations of HESs, especially the feedback of evolving environments on human behavior. In both the temporal and spatial domains, many different time scales are at play. It may be that a simplification is equally justifiable and necessary in order to gain insight into the modeled system. Multiscale modeling is a mature subject in classical mathematical physics, and uses techniques as such as matched asymptotic expansions and singular perturbations to address the problem of differing temporal scales. Such methods are receiving much attention even outside of the environmental sciences, as witnessed by a full SIAM journal (“Multiscale Modeling & Simulation”) devoted to this topic; the extent to which these techniques are being developed to address environmental problems is less clear, but some illustrative examples are presented in the following section. The modeling process itself should be seen as dynamical and hierarchical. There is hardly a definitive, comprehensive and “final” representation of a given HES. There is thus a need for consideration of a hierarchy of representations, addressing progressively more refined incorporation of the details of the description of the HES under study. In this respect, diversity pays off: there is considerable insight to be gained by a wide variety of model building approaches. The role of stochasticity, for example, can be incorporated in many different ways, and most are complementary and provide deeper understanding of the robustness of the different hypotheses. Either uncertainty in the initial states, which are never known to arbitrary precision, or sensitivity to variations in the numerous parameters constituting the model have to be analyzed, both qualitatively (e.g., classical results on “continuous dependence on initial data”) and quantitatively (e.g., more recent “sensitive dependence on initial conditions”, the essence of chaos). Robustness, and a related property—adaptability—are essential features of HESs. Resilience is a remarkable trait of the human components of an HES, and it is not entirely clear how this concept can be expressed unambiguously, mathematically, let alone incorporated in an HES model. Indeed, it could be one of the many emergent properties of the system—unpredictable properties of an assembled system that appear (emerge) when constituent components are assembled and put in dynamical interaction, but are not clear when the components are considered in isolation: the whole is more than the sum of its parts. An example of emergence is collective behavior, global coordination among the agents of a complex system, which may or may not be a direct, predictable consequence of explicit individual properties. Especially when human components are incorporated, it is a challenge to ascertain at which level of the model building these should be included, and it is particularly difficult to mediate between local and global behaviors. It is premature to advance a comprehensive mathematical theory of coupled human-environment systems as complex adaptive systems. Instead, we sketch a

89 | P a g e
number of examples of HES which illustrate the essential features of CAS noted above, and that may serve as motivation to the mathematical sciences community. Not all examples have the same level of mathematical maturity, as reflected in the differentiated level of mathematical precision that can be provided in their formulation. 3. Examples
We outline five examples that illustrate these research themes. For each example, emerging challenges and questions in the mathematical sciences are also described. We will present three examples in sufficient detail to give the reader a clear sense of the scientific and mathematical issues, followed by two shorter examples to illustrate the enormous range of coupled human-environment systems 3.1. Fully coupled earth-human systems (Kalnay)
The interaction between human and natural systems has been typically studied in a unidirectionally coupled fashion, i.e., one component provides input, the other responds. Examples of this one-way coupling approach include demographic projections used to predict demand for natural resources (water, energy), and natural disasters triggering human migration patterns. In a more realistic representation of the Earth system, its human and natural components are fully coupled, meaning that their coupling is bi-directional.
It is essential to fully couple systems to allow for important feedbacks. For example, the atmosphere and the ocean are coupled in both directions, so that the important chaotic phenomenon of El Niño-Southern Oscillation (ENSO) takes place as the result of an instability in the coupled ocean-atmosphere system. By contrast, until the late 1990’s atmospheric and ocean models used to be coupled in a “one-way” mode: the atmospheric models would affect the sea surface temperature (SST) but could not change it, and the ocean models would be driven by the atmospheric wind stress and surface fluxes, but could not change them. As a result these models were not able to predict the ENSO chaotic oscillations. Since the late 1990’s climate models switched to fully coupled atmosphere-ocean-land-ice submodels. More recently, biosphere systems are also being fully coupled, allowing for changes in vegetation able to affect climate through changes in albedo and soil moisture, but also the local climate determining the type of vegetation that can grow in a region. It should be noted that realistic coupled models are considerably harder to develop than one-way coupled models because there is much more freedom for the coupled model to drift away from reality. For example, with a one-way coupling, the atmosphere can feel the ocean sea surface temperature (SST) but cannot change it, so that the SST “anchors” the atmosphere within realistic limits of temperature. In a two-way coupling, by contrast, the temperatures of the coupled atmosphere-ocean system have much more freedom to drift away. This requires a more careful model to develop realistic solutions. At present, fully coupled climate models (known as Earth System models) have been developed to the extent that they are now fairly realistic, and there is general agreement among climate modelers that full coupling is essential in order to have a realistic climate system. The human system in many ways now dominates the natural system, with, for example, domesticated animals making up the vast majority of large mammals , and most of the land that can be cultivated already devoted to agriculture. Humans are

90 | P a g e
influencing climate through both emissions of greenhouse gases (GHG), and use of natural resources (e.g., land, water, minerals). In fact, population is a primary driver of every environmental challenge that threatens sustainability: generation of GHGs, other pollutants and toxic waste; depletion of resources, including water, oil, fisheries, topsoil, etc.; resource wars and civil conflicts; malnutrition and world hunger; lack of resources for education and health care, especially in poor countries; best farmland converted to urban and suburban sprawl; garbage disposal and need to find more landfill space; species extinction.
Given the prominent role that population and human activity have in driving climate change, it seems that Earth System models should be also fully coupled with Human System models if we want to be able to simulate more realistically climate change and sustainability. This need is particularly well expressed in a recent Science paper by Liu et al (2007) that includes the NOAA Administrator (Jane Lubchenco) as one of the authors: he abstract states that ‘Integrated studies of coupled human and natural systems reveal new and complex patterns and processes not evident when studied by social or natural scientists separately. Synthesis of six case studies from around the world shows that couplings between human and natural systems vary across space, time, and organizational units. They also exhibit nonlinear dynamics with thresholds, reciprocal feedback loops, time lags, resilience, heterogeneity, and surprises. Furthermore, past couplings have legacy effects on present conditions and future possibilities. Current Integrated Assessment Models (IAM) couple economic models to rather simple earth system models (e.g., Prinn et al., 1999, Kim et al., 2006). However, as with the Netherlands Environmental Assessment Agency IMAGE model, these IAMs are not fully coupled, since the Earth System model is quite simple, and population is an exogenous input.
This raises the interesting issue of how to model the Human System so that it is fully coupled with the Natural System. One approach that can address this challenging modeling problem is System Dynamics (SD). Modeling the human system with a SD modeling approach with regional submodels would have several advantages such as being relatively simple to design and couple with the natural system and allowing for consideration of the impact of government policies, migration, and disturbances such as HIV, as well as the regional vulnerabilities associated with sea level rise, erosion, etc. It would be also possible to create estimation of risk by using a probabilistic approach based on ensemble techniques, now widely used for weather and climate prediction.
Examples of major challenges in creating a fully coupled HES include: • Collection of necessary Earth and Human Systems data (some of which has
been fairly abundant on a regional basis since about the 1950’s). • Design of a coupled model structure such as that shown in schematic Figure 1.
In this prototype it is assumed that the Earth system model is an intermediate complexity dynamical model that includes an atmosphere coupled with land and a vegetation model, with a mixed layer ocean model that has already been used for climate change simulations (e.g., Zeng and Yoon, 2009).
• Calibration and validation of the model behavior from its ability to reproduce sub-periods of 1950-2010, while reserving some decades for cross-validation.
• Testing the model for different scenarios (e.g., carbon emission), government policies, and climate anomalies such as droughts or prolonged heat waves.

91 | P a g e
• Calibration of the model. Novel statistical approaches may be necessary to calibrate a model that includes many regional Human models. One possible approach could be the use of modern data assimilation techniques such as Ensemble Kalman Filter (EnKF) used in numerical weather prediction that have the ability to estimate not only the model variables, but also unobserved parameters. EnKF in principle could be used to perform an initial calibration of the submodels of the system by estimating their optimal parameters.
• Exploration of the dynamical behavior under different parameter ranges, such as chaotic, oscillatory or stable behavior. The use of EnKF for calibration may depend on whether the model is chaotic, in which case it is expected to work well, or non-chaotic, in which case the behavior of EnKF is less well known.
• Use of an ensemble of forecasts with different initial conditions and different model parameters to explore and define the uncertainty of the projections of the models.
• Parameterization of the government policies (as sliding knobs in the model, or as responses to the model evolution) so that trade-offs can be valued.
Figure 1: Schematic of a prototype of a fully coupled HES model. The left box represents an example of a geographically distributed Earth System model, , and the right box is one of the regional Human System models. The arrows represent one or two-way coupling, and the horizontal red arrows represent trade and migration between different regions. Credit: Eugenia Kalnay and Jorge Rivas.

92 | P a g e
3.2. Forest Systems (Anand)
It has been suggested that forests are complex adaptive systems. They can show several features of complexity, such as self-organization, connectedness and resilience to small-scale disturbances. Simple models have been constructed to display complex forest dynamics and patterns such as power-law scaling of spatial patterns, a hallmark of self-organized criticality (Anand et al. 2010). What happens to these systems when humans intervene in the form of land-use changes (Figure 2)? Humans have the ability to both increase (via afforestation) and decrease (deforestation) various aspects of forests including biomass (and hence carbon sequestration) and diversity.
The dominant paradigm is for humans to break down the complex adaptive nature of forests via deforestation, resulting in overall forest loss. But this human land-use system is neither complex nor adaptive, until there is feedback from this forest loss on human behavior. Humans also have the ability to reforest. Often times, this is only done to comply to some legislation. But this would only be a change to the human system informed by the forest system, not a true feedback. Humans however typically respond to deforestation by increasing agricultural yield. Ultimately, this decreases the need to deforest and thus these lands are eventually returned to forest. Thus, the return to forests is the result of human activities, but not necessarily deliberate (it’s a true feedback), creating a complex human-environment adaptive system.
Figure 2. Endangered Atlantic forest in southern Brazil within a matrix of natural grassland. Both of these ecosystems are important to humans for sustainability, one for mainly economic value and the other for mainly ecosystem services, but we have little understanding of how to predict or manage the unique land-use dilemmas around this, particularly in the face of diverse global ecological changes (climate change, invasive species, etc.). Credit: M. Anand, Canada Research Chair in Global Ecological Change.
93 | P a g e
Managing a complex human environment system involving forests would require balancing the positive and negative effects of humans on forests. This is important for sustainable use of resources of any kind. These ecology-human models should ultimately be linked to climate models creating tripartite models. Challenges for the mathematical sciences include:
• Models with high diversity (e.g., some tropical forests have over 300 tree species, not to mention within species variation); how to deal with redundancy and high dimensionality that are implied
• Predicting spatial and temporal strategies for deforestation and afforestation; for example, do we need to reforest twice the amount we deforest? Do we need to introduce time intervals between harvesting? Which areas should we prioritize for deforestation or afforestation (decision trees – no pun intended)?
• How to deal with imperfect human behavior (e.g., individual, political, and corporate priorities not aligning with socially optimal outcomes).
• How to deal with changing state space (e.g., the forest is always evolving in time due to climate change; value of wood fluctuates due to availability/scarcity and fashion).
3.3. Economic Systems (Rivas)
Within the spectrum of social systems, it is clear that economic activities and processes are central to the relationship between sustainability and modeling Human-Environmental Systems (HES). Modeling economic systems is therefore essential to coupled HES. This is especially true if one of our goals is to develop tools to aid decision-makers in addressing the issue of sustainability. When economics, in its current “neoclassical” form, developed starting in the 1870s, it relied primarily on linear relationships, comparative static methods, and the assumption of stable equilibria. Despite tremendous advancements in mathematical methods since then, economics continues, to a large extent, to be theorized and modeled in this way. However, human systems in general, and economic systems in particular, are clearly not limited to linear relationships and stable equilibria. Human systems are complex adaptive systems which exhibit non-linear and chaotic dynamics, with instabilities produced by positive feedback loops, thresholds, emergent properties, unpredictable behaviors and persistent uncertainties.
Are there compelling reasons to bring more advanced mathematical methods to the theorization and modeling of economic systems? If our economic theories and models are limited to linear relationships and stable systems and feedbacks are modeled only as negative (thus always moving the solution back to an equilibrium), they are likely to miss the reciprocal dynamics and positive feedbacks that lead to economic bubbles, economic crises and economic collapses. Bubbles are by definition unsustainable dynamic processes with positive feedbacks. The collapses occur when these processes pass some unsustainable threshold causing a downward spiral itself composed of positive feedbacks. As a result, in the vast majority of the economics literature, bubbles and crises are still seen as aberrations or problems with the system rather than inherent outcomes of the properties and structure of the system. The general failure to predict the current economic crises is indicative of these gaps in current modeling methods.

94 | P a g e
One reason early economics avoided modeling systems that moved away from equilibrium is that these non-equilibrium systems were seen as invariably breaking down or spiraling out of control. Current understanding of chaotic systems that do not settle to an equilibrium or steady state but nevertheless can produce predictable patterns and behaviors could bring a great deal of advancement to realistic economic modeling. Mathematicians could help to identify and specify what it is about the structure of the system that that makes it produce the behaviors that it does.
Macroeconomic theories and models that focus on systemic processes and emergent properties are often rejected within Neoclassical economics because they do not include what are referred to as “solid micro-foundations.” This reductionist approach may lead to neglecting important system-level or macro-level emergent properties and emergent behavior. One of the lessons of the study of complex adaptive systems is the existence of multiple scales at which dynamical systems can operate. Mathematical scientists could help address whether there are some problems in economics that can be solved at a higher scale without being dependent on having the details at a lower scale fully worked out. In other words, mathematicians can help to establish whether there are there macro-level processes that are not dependent on specifics at the micro level.
Modeling economics within the framework of sustainability presents us with the additional challenges of coupling Human and Environmental Systems (HES). Coupled HES present a set of unique characteristics not found in purely physical, purely biological, and purely social processes. Physical, biological and social systems are each made up of different types of dynamics, properties, behaviors, and governing laws. Coupling them therefore entails combining models with different types of dynamics, different temporal, spatial, organizational and output scales, and massive, heterogeneous data derived with very different methods and from very different sources. This raises a set of more general modeling challenges for economics with regard to the question of modeling social, biological and Earth systems in order to address the issues of sustainability. The Earth System has many structures which can be understood as performing particular functions of providing services to human systems. These “ecosystem services” functions can be grouped into two broad categories: “Sources” (of the real physical and energy resource inputs of the human economy) and “Sinks” (the absorption and processing of the real physical and energy outputs of the human economy). The way in which the scale of the human economy has grown relative to these two ecosystem services presents the human system with the problems of depletion and pollution.
As Herman Daly (1977, 1996) and other ecological economists have shown, the neoclassical assumptions of price-driven market substitution of resources and factors of production negate the need to model depletion of sources. If the Economic System can always switch to other resources, the model can ignore stocks of natural capital in the Earth System which are being drawn down in an unsustainable manner. Similarly, the neoclassical focus on market prices rather than on stocks and flows of physical matter and energy excludes “externalities” such as physical and energy outputs of the Economic System (e.g. greenhouse gases).
A conclusion of our working group is the need for a recognition of a diversification of models, approaches and paradigms. There is a great deal of literature on the homogeneous nature of most work within the field of Economics. The development of

95 | P a g e
new methods and approaches to theorizing and modeling economics could help to make great advancements in tackling the economic component of sustainability.
Figure 3: Standard Neoclassical Model,. Credit: Adapted by Jorge Rivas from Daly and Herman (1977, 1996).
Figure 4: HES Model: Economic System coupled with the Earth System, showing Ecosystem Services and feedbacks. Credit: Adapted by Jorge Rivas from Daly and Herman (1977, 1996). 3.4. Fisheries systems (Watmough)
Many models and theories have been developed to predict the maximum sustainable yield for various fish stocks. In the past, these have been used to set quotas for maximum harvests. These were implemented by starting the fishery on a certain day and closing the fishery when the quota was met. This led to the interesting effect of concentrating fishing effort into just a few days a year due to the need for fishermen to compete to bring in as many fish as possible before the quota was met.
Several inefficiencies arise from this: notably, only 10% of the harvest was sold

96 | P a g e
fresh, even though the selling price for fresh fish is twice that of frozen fish; large numbers of boats were fitted for halibut fishing that were only used for two or three days during the year.
Upon introducing individual tradable quotas, the season immediately expanded to 250 days and profits increased dramatically. With the tradable quotas, fishermen were guaranteed the right to harvest a certain number of fish, and no longer needed to compete to be the first to land the fish. Hence, fish could be caught at a rate that allowed them to be sold fresh for higher prices. This opens up many interesting questions on coupling resource models with a theory of cap and trade systems incorporating social and economic components. Specifically,
• How should quotas be priced and distributed? • What will be the socio-economic consequences of various pricing systems? • Will these systems be robust to unforeseen shocks in the harvest? • What impact will the different pricing systems have on the
biology/ecology/environment? These questions also arise in situations such as quotas for livestock, land-use or
other resources and similar models can be used for quotas applied to emissions and pollutants. 3.5. Infectious Disease Systems (Fefferman)
Within a network of social contacts, there are two interrelated on-going dynamic systems that need to be modeled both separately and together: the transmission of infection and the making/breaking of contacts as a continued social process. The systems both shift state internally in non-trivial ways: disease dynamics are driven by epidemiological characteristics of the disease and the underlying network topology, and the social system is driven by individual preferences in affiliation and also potentially by larger scale needs of society (e.g. sufficient organizational success for complicated task completion, rapid dissemination of information/consensus building for decision making, etc.). Further, these systems also fundamentally impact each other: disease can impact social contacts by causing affiliations to be made/broken in response to disease status and the ongoing social processes are responsible for constructing the underlying, shifting network topology over which infection can spread. For example, healthy individuals can avoid contact with unwell individuals to avoid exposure or unwell individuals can temporarily avoid social contact while convalescing, these actions interrupt routes of transmission, changing the epidemiological outcomes, but also potentially compromise information pathways or decrease participation in a group beneath a minimally effective threshold for action. Similarly, individual behaviors driven only by social motivations can drastically impact the epidemiological burden of society in general (e.g. reporting to work despite infectious illness in order to ensure meeting a project deadline and thereby infecting coworkers, etc.). All of these considerations raise challenging issues of modeling, simulation, and analysis for mathematical scientists. 4. Recommendations
We discuss both high-level recommendations (section 4.1) as well as recommendations for specific areas wherein opportunities may lie for mathematical sciences to advance sustainability science (section 4.2).

97 | P a g e
4.1. High-level Recommendations Four major high-level recommendations emerged from our working group
discussions: A. Develop a mathematical formulation of sustainability; B. Foster innovation through a diversity of modeling paradigms; C. Provide opportunities for involving a broader set of mathematicians; D. Require that both data and models should be kept open source and made fully
public, and encourage citizen science. We expand on these recommendations below. A. Develop a mathematical formulation of sustainability We recommend development of a common mathematical language to facilitate integration of different disciplinary approaches to modeling. This may require going beyond the conveniences of existing mathematical theory. We recommend that researchers
• Develop theories of dynamics that goes beyond current dynamical systems theory to address the “messy” real-world problems that exist in complex, adaptive human-environment systems (put succinctly, “sustainability does not equal stability”). Whereas dynamical systems address questions of asymptotic stability, transient behavior naturally occurs in real systems and may be more important, as in stuttering chains of transmission in the spread of zoonoses for example (Lloyd-Smith et al., 2009).
• Develop theoretical frameworks to aid understanding and interpreting large-scale computational models
B. Foster innovation through a diversity of modeling paradigms This recommendation entails several specific steps, including:
• Use ensembles of models for better system forecasting and understanding. Often, combining the results from different models produced by independent groups
can provide better predictive power than any single model. An example comes from the history of climate modeling. In December 1991, two major operational Numerical Weather Prediction (NWP) centers started a major new approach to weather prediction with the introduction of ensemble forecasting. Until then NWP forecasts were deterministic, with twice a day forecasts started from the best estimate of the state of the atmosphere (known as analysis) and run for 10 days at the European Center for Medium Range Weather Forecasts (ECMWF) and 15 days at the US National Centers for Environmental Prediction (NCEP). Both centers introduced the idea of running an ensemble of forecasts started from initial conditions that were given by the analysis to which different initial perturbations had been added. The difference between the two approaches was the type of initial perturbations, with NCEP using Breeding of Lyapunov Vectors, and ECMWF using Singular Vectors.
The introduction of ensemble forecasting had a major positive impact on the usefulness of the forecasts since the ensembles indicated not only the most probable forecast but also the uncertainty associated with it. As a result, human forecasters learned how and where to have confidence in longer forecasts, since weather predictability depends on the growth of errors in the initial conditions due to atmospheric instabilities, and is therefore quite dependent on the evolution of the weather itself. An

98 | P a g e
immediate result was the decision of the TV weather forecasters to extend their forecasts from 3 days until the early 1990’s to 5 and even 7 days in the mid 1990’s.
In addition to introducing perturbations in the initial conditions, it was found by the NWP community that introducing model perturbations, or even using multiple models from different centers also resulted in a major improvement in the forecast skill and the usefulness of the forecasts. It has been a consistent result that a multimodel ensemble has a performance that is better than that derived using a single model, even the model that has the best performance.
• Encourage a hierarchy of models from simple to complex and across scales. In the quest for realism, some models tend to incorporate a high level of detail in an
attempt to reflect the complicated interacting properties of the system under study. However, there remains a need for simple models that may be more efficient in providing insight at a higher level or that may explain the data equally well. One recommendation of our working group is recognition of the tremendous benefits that “model biodiversity” can bring to a particular issue or problem. This diversity refers not only to employing ensembles of models, but also to the application of a variety of approaches and paradigms to solving common problems, including both simple and complicated models. As has long been known in biological sciences, biodiversity produces systems that are both robust and adaptable to different conditions and contexts, as well as developing innovative solutions to a multiplicity of potential problems. The diversity of paradigms and approaches would also function like portfolio theory, to spread society’s research investments out across various “asset” types whose performance is not tied to one specific approach. Building models from the approach of other disciplines will also lead to the development of solutions that would have been entirely non-intuitive from a different discipline. We have found that the coupling of Human and Environmental Systems (HES) in order to address the issues of sustainability presents additional reasons to emphasize the need for the application of diverse paradigms. Coupled HES involve unique challenges not found in solely physical, biological, or social models, as each involves different classes and kinds of scales, properties, behaviors, and data. Coupling human to environmental systems therefore entails developing theories and models composed of submodels requiring very different sets of knowledge. While this calls for interdisciplinary collaboration, it also calls for the application of approaches from different fields. We are therefore recommending that mathematical sciences encourage and participate in the marshaling of a variety of approaches and paradigms to the theorizing about and modeling of sustainability problems.
• Introduce ensemble methods for model comparison The mathematical framework to statistically assess the validity of simulations has
been developed significantly by theoretical computer scientists in the last decades. Unfortunately, modelers outside the community have passively ignored this theory. In view of the considerable challenges presented above, the time has come to integrate these considerations in model comparisons and validations. In particular, the statistical foundation for a systematic determination of ranges of predictions needs to be put on firm, convincing basis to infer public policy recommendations. Lessons can be learned from the machine-learning community, which has matured in an analogous way over the last decades, to develop a sound basis for understanding convergence properties in both algorithmic and heuristic senses.

99 | P a g e
C. Provide opportunities for involving a broader set of mathematicians. All fields of the mathematical sciences can be profitably incorporated in one aspect
or another of the investigation of HESs. The richness of the techniques and approaches is one defining characteristic of the complexity of these systems, and only through a diversified approach will we be able to develop a sound understanding, leading to believable predictions.
D. Require that both data and models should be kept open source and made fully
public, and encourage citizen science. A primary recommendation of our working group is to call for both data and models
to be kept open source and made fully public. Progress in model development is more efficient and rapid when the code is made available to other researchers and modelers. Keeping models and data proprietary or secret may be beneficial to commercial interests, but should not be the case when problems facing humanity are at stake. When a model remains proprietary, there are fewer possibilities for application of the model or reproduction of results. Wider use of a given model can uncover existing problems, and lead to model innovations and even new kinds of solutions. When data and models are open, the research community can check both model design and the accuracy and the realism of the model. So many of the problems facing humanity, and in particular those associated with sustainability, do not stop at national or regional frontiers. International sharing of data should be especially encouraged. Having access to everyone’s data helps to develop, improve, calibrate and validate models and to compare them with reality. Inevitably, progress is much slower when data and models are limited to a few hands and eyes. The common good of humanity calls for this information to be shared.
Once a model has been developed and passed basic tests, it should be made available for other scientists to experiment and add/change the model. Such “Community HES models” would accelerate HES model progress and provide decision makers better tools with which to make decisions. If the model(s) are sufficiently robust that they can be run on a PC, invite public volunteers (Citizen Science, http://www.nsf.gov/news/special_reports/science_nation/citizenscience.jsp) to run the models, explore their limits and modify them, and report their results to a central web site. This will allow us to analyze the many-members’ ensemble results and to develop the best statistical and dynamic approaches to estimation of risk and uncertainty.
The benefits of open sharing of models are again exemplified by the history of climate modeling. The improvement in the forecast performance of NWP models in all the major centers is one of the most remarkable scientific achievements of the last half-century. As the meteorologist Lorenz discovered, even if a NWP model was perfect and if the initial conditions were also essentially perfectly known, the presence of atmospheric instabilities would make it impossible to predict the evolution of weather for more than two weeks. The discovery that if a flow is chaotic, then there is a limit of predictability, had a tremendous scientific impact, but was at that time only of academic interest, since even the 1-2 day forecasts were quite poor. Now, 50 years later, forecasts routinely remain accurate for 10 days, especially during the winter season, both in the Northern and the Southern Hemispheres. One reason why progress has accelerated is that different operational centers have developed their own models and methods of data assimilation, their research approaches were always public and Meteorology has always

100 | P a g e
had a spirit of international cooperation. As a result, whenever one center developed an idea that resulted in a major improvement in the operational forecast skill, the idea was discussed in scientific meetings and workshops, and different centers tested variations of the same idea in their own center. There is no doubt that this friendly international competition has resulted in much faster progress than what would have taken place if the method of improvement had been kept secret.
4.2. Specific recommendations
In addition to the relatively high-level recommendations of the previous section, a number of potentially promising avenues for specific areas of the mathematical sciences also emerged from group discussions. We describe these areas in bullet point format below. These recommendations are not intended to be an exhaustive list of potentially promising areas of research.
• Mathematical formulation of sustainable, composable, multiscale dynamical systems acting on discrete, non-smooth real world data; multi-scale characterization of features emerging in the data;
• New theoretical frameworks for the dynamics of hybrid HES models consisting of different types of models for human versus environmental submodels;
• Methods to characterize dynamic topologies relevant to analysis of social and biological networks;
• An expanded mathematical toolkit to explore the impact of coupling in dynamic, complex, adaptive HESs and to characterize the interaction of shifting rates of dynamics in coupled systems;
• Further development of complex dynamical systems theory as it relates to HES;
• Further developing of coding and information theory, time series analysis, and projection geometry as it relates to HES; and
• Theory of ensemble models, such as development of theoretically justified simulation, and machine learning and pattern recognition with neural networks and genetic algorithms.
These areas can obviously involve a broad segment of the mathematics community, including the computational harmonic analysis community, the dynamical systems community, the computational topology community, the distributed systems community in computer sciences, the algebraic and analytic geometry community, the topological quantum computing community, the stochastic PDE community, the stochastic processes community, and the information theory community.
References 1. Anand M, Gonzalez A, Guichard F, Kolasa J, Parrott L (2010). Ecological systems
as complex systems: Challenges for an emerging science. Diversity, 2: 395-410. 2. Beddoe R, Costanza R, Farley J, et al. (2009). Overcoming systemic roadblocks to
sustainability: The evolutionary redesign of worldviews, institutions and technologies. PNAS 106(8): 2483-2489.

101 | P a g e
3. Daly HE, Herman E (1977). Steady-State Economics: The Economics of Biophysical Equilibrium and Moral Growth. W. H. Freeman, San Francisco.
4. Daly HE, Herman E (1996). Beyond Growth. Beacon Press, Boston. 5. Kim SH, Edmonds JA, Lurz J, Smith SJ, Wise MA (2006). The ObjECTS: framework
for integrated assessment: Hybrid modelling of transportation. The Energy Journal, Special Issue No. 2: 63.
6. Levin SA, Clark WC (2010). Toward a science of sustainability. Report from the Toward a Science of Sustainability Conference, Airlie Centre, Warrenton, Virginia, November 29, 2009 to December 2, 2009. http://www.nsf.gov/mps/dms/documents/SustainabilityWorkshopReport.pdf.
7. Liu J, Dietz T, Carpenter SR, et al. (2007). Complexity of coupled human and natural systems. Science, 317(5844): 1513-1516.
8. Lloyd-Smith JO, George D, Pepin KM, Pitzer VE, Pulliam JRC, Dobson AP, Hudson PJ, Grenfell BT (2009). Epidemic dynamics at the human-animal interface. Science, 326(5958): 362-1367.
9. Prinn R, Jacoby H, Sokolov A, Wang C, Xiao X, Yang Z, Eckhaus R, Stone P, Ellerman D, Melillo J, Fitzmaurice J, Kicklighter D, Holia G, Liu Y. (1999). Integrated global system model for climate policy assessment: Feedbacks and sensitivity studies. Climatic Change, 41(3–4): 469-546.
10. Raudsepp-Hearne C, Peterson GD, Tengo M, et al. (2010). Untangling the environmentalists’ paradox: Why is human well-being increasing as ecosystem services degrade? BioScience, 60(8): 576-589.
11. Zeng N, Yoon J (2009). Expansion of the world's deserts due to vegetation-albedo feedback under global warming. Geophys. Res. Lett, 36: L17401.

102 | P a g e
Apendix 3: Measuring, Monitoring, and Forecasting Progress toward Sustainability
Authors: Noel Cressie (The Ohio State University) Jennifer A. Hoeting (Colorado State University) Subhash Lele (University of Alberta) Ronald McRoberts (U.S. Forest Service) Kiona Ogle (Arizona State University) Richard Smith (SAMSI) Len Stefanski (North Carolina State University) Guy Ziv (Princeton University)
Charge to the Group:
Development of a science of measuring and monitoring for sustainability is essential for guiding policies and evaluating progress towards improved human well-being and sustenance of the earth's life support systems. Under this theme, the group is asked to identify the major priority areas (research themes) in the mathematical sciences for development of a science of sustainability monitoring and measuring that builds on but goes beyond contemporary approaches. As part of this theme, the group is asked to explore a conceptual and methodological framework for sustainability measuring and monitoring that confronts inherent issues of scale, aggregation problems and the need to develop common metrics for sustainability. Specifically, the group is asked to answer the questions: What are the critical mathematical sciences research developments necessary for sustainability monitoring and measuring? Why are these important? And, are they feasible?
1. Introduction Measuring, monitoring and forecasting play a fundamental role in assessing
progress and evaluating policies for the sustainability of both human well-being and natural resources. These objectives will involve observational data from the human and natural environment, as well as the effective development and application of computational models. The charge to our working group was to identify the contributions of mathematical scientists towards the fundamental research that is needed to develop effective tools, and the additional resources, including those involving data and computing, that are needed to bring these tools to effective application.
There are many elements of sustainability to consider including water, air, agriculture, energy, humans, natural resources, and many more. A common theme in sustainability is the monitoring of these systems. This can be done via direct data observation and/or via modeling of processes. In either case, data are acquired and models are used. Thus, models and data are the key building blocks of the sciences of sustainability.
2. Research themes/questions First, we consider, what should be measured or monitored. Here, we give three
examples to show the challenges of setting up a data monitoring system. Second, we

103 | P a g e
consider how the data should be collected, with consideration of statistical design and other data collection issues. Finally, we discuss several overarching issues associated with application of models for synthesizing such data and for forecasting future needs and states. 2.1 What to measure/monitor?
A key issue in sustainability science is to construct a framework to collect data that will help scientists monitor progress toward sustainability. We consider examples from three categories of variables: biotic, abiotic, and human-element datasets, and we explore the challenges with collecting and converting the raw data into useful data products. 2.1.1 Biotic Datasets
An example of biotic data and datasets is the Forest Inventory and Analysis (FIA) program of the U.S. Forest Service. The USFS conducts a national forest inventory of the USA (McRoberts et al. 2005). The program’s mission is to assess the current state and health of the Nation’s forest resources and the change in those resources over time. On plots distributed across the country at a sampling intensity of one plot per 2400 ha, field crews observe or measure human variables such as land ownership, abiotic variables such as soils and topography, and a suite of biotic variables that includes tree species, diameter, height, health, and live/dead status and plot variables such as proportion forest, regeneration, and understory vegetation. The data cover the entire country, are acquired in a nationally consistent manner, and are maintained in a publicly accessible database that is updated annually. Collection of these data is at least partially motivated by the necessity of reporting to an international sustainability convention using a set of agreed-upon criteria and indicators. A good reference for this criteria is at: (http://www.rinya.maff.go.jp/mpci/criteria_e.html). While such datasets are very useful for addressing basic science questions, they may also provide an important time-series for evaluating progress towards sustaining, for example, our forest ecosystems. 2.1.2 Abiotic Datasets
Natural datasets that are not biological in origin include climatic variables, measures of air and water pollution, and oceanographic measurements. Although the original intention of obtaining such data may not have been motivated by sustainability issues, such data are often critical to understanding changes in biotic variables that may be the target of sustainability research and monitoring. Many abiotic datasets are collected by government agencies with public funding, but standards vary for the archiving and accessibility of the datasets. For effective use in long-term monitoring, many of the datasets require gridding. For example, climatic datasets are often reported as averages over five degree latitude and longitude grid cells, which are then further aggregated into hemispheric or global averages. However, the aggregation procedure raises many issues connected with efficient interpolation methods, the effect of changes over time of the observing network, and quality control. For example, raw temperature data may show a sudden changepoint due to moving the observing station, or a gradual but localized trend due to the urban heat island effect, but these sources of variability do not reflect long-term variability in the true climate system, and therefore the temperature data may need to be corrected in the calculation of climatic datasets.

104 | P a g e
Many of these issues were discussed in a recent workshop on “Datasets for the 21st Century” held at the United Kingdom Meteorological Office in Exeter, U.K. The aim of the workshop was stated as an international and multi-discipline effort to build the framework to construct high quality, high resolution, transparent, fully reproducible, and robustly verified climate records and to ensure their usefulness for decision makers and society. The workshop was sponsored by the World Meteorological Office with co-sponsorship from a number of other meteorological and environmental agencies. The home page for the World Meteorological Office (http://www.metoffice.gov.uk) provides links to papers discussing numerous aspects of both the administrative and scientific components of preparing climate data products.
From an administrative point of view, a major issue is the availability of raw data and computer programs for processing the data. The recent publicity associated with the leakage of emails from the University of East Anglia related to climate change has drawn attention to the problems that arise when raw data and programs are not readily available to other researchers who may desire to understand or challenge the assumptions made in constructing climate data products such as gridded temperature averages. In response, the climate community has recognized the need to provide access to raw data, but there are problems; for example, not all the World’s meteorological agencies are willing to make raw data publicly available. From a scientific point of view, two major issues are correcting data sets for spurious trends and changepoints and choosing interpolation methods for constructing gridded averages. Fig. 1 illustrates the issues associated with constructing gridded datasets: the observing grid is primarily land based and not at all uniformly distributed, reflecting different priorities and political systems in the countries that collect the data.
Figure. 1. Part of the European network of temperature measurement stations. Reprinted from “A European daily high-resolution gridded data set of surface temperature and precipitation for 1950 – 2006,” Journal of Geophysical Research, vol. 113, Oct. 30 2008, with permission from American Geophysical Union.

105 | P a g e
The aforementioned issues have been extensively analyzed by meteorologists
and climate scientists using increasingly sophisticated statistical methods, see e.g. the recent papers by Haylock et al. (2008) for statistically motivated interpolation methods, and Menne et al. (2010) for the methods used to correct for spurious changepoints and trends. Nevertheless, the methods currently in use do not reflect the latest research in statistics; see e.g. Smith and Cressie (2010) for a review of spatial interpolation methods in the light of modern developments in spatial statistics, and the papers of Cassinus and Mestre (2004) and Reeves et al. (2007) for modern developments in changepoint detection. Continued interaction between statistical scientists and experts in both land-based and ocean-based observing systems is needed to deliver high-quality data products for research and policy decision-making. 2.1.3 Human-element Datasets
From an anthropocentric perspective, sustainability is typically defined as improving human well-being while maintaining the life-support systems of the planet. Thus, measuring and monitoring human variables is crucial for assessing whether we are making progress toward sustainability. Human-focused variables include population, health, disease, wealth and its distribution, security, economic indicators, education and governance structures and institutions. Variables measuring human well-being and activities are collected by a myriad of governmental agencies (e.g. census data), international organizations such as the UN (e.g. poverty indicators) and commercial companies (e.g. marketing data). Each entity uses different approaches for designing their data collection and assimilation methods. Apart from availability, proprietary, and privacy issues, these multiple datasets have different spatial scales and boundaries (e.g. nation-states, geographic regions, political units or discrete survey locations), different temporal sampling periods (with frequency ranging from 1 year for census data to nearly zero for not-reproduced reports) and different levels of uncertainty (which is frequently left unspecified). Often, data are altogether missing in some spatial regions or are measured inconsistently over time. While the numerous sustainability indicators proposed in the past have different aims and specifics (Parris and Kates 2003), many of them have in common the need to perform calculations of these human variables (together with relevant biotic and abiotic variables) in a unified spatio-temporal grid. Getting the appropriate data from the diverse world of online data warehouses requires both statistical methodologies and mathematical process-modeling to fill-in, interpolate and extrapolate data, methods the mathematical sciences have been developing the tools to do. 2.2. How to measure and monitor? Sampling design and scales
The examples above show the challenges of constructing and maintaining data products for sustainability science. These examples illustrate the importance of bringing general statistical principles of good sampling design to the forefront. The examples also show some of the challenges of establishing baselines and modeling using data collected over long periods and/or multiple instrumentations.
Good sampling design should follow the three principles of design espoused by Fisher (1935), namely blocking (stratification), randomization, and replication. Even if a spatio-temporal component was not incorporated in the design, an observation was

106 | P a g e
taken at a particular instant of time and at a particular location. This information should be recorded as it can be used for post-stratification or for building models based on the sample. It is almost certainly true that the sample will not be at the right spatial or temporal scales when it is used for future studies, and this misalignment can be handled using spatio-temporal statistical methodology (sometimes referred to as change-of-support). Optimal sampling design has a large literature, but here it makes just as much sense to use near-optimal designs that capture the various sources of variability. Dynamical designs exploit the temporal statistical dependence of the variable under study by choosing fewer sample locations per time period without sacrificing the size of estimation variances (Wikle and Royle, 1999).
A common thread in sustainability assessment is the quantification of baselines. Sustainability assessments are generally conducted by estimating trends expressed as changes from baseline estimates. Data for estimating baselines from probability sampling designs are preferable because they lend themselves to analysis using familiar sampling theory. Spatially explicit baseline estimates may be necessary in which case interpolation techniques may be used or sample data may be combined with spatially explicit ancillary data such as satellite imagery. Of non-trivial importance, efficient sampling designs for estimating baselines, for estimating trends and/or change, and for calibrating models using ancillary data may differ considerably.
Regardless of how one defines sustainability, the fact that there is a time-invariance component to it is generally accepted. Thus presence of (or lack of) changes in a system over time scales of sufficient duration to avoid confounding with inherent and natural short-term fluctuations are key barometers of sustainability (or lack thereof). For example, because climate is defined over time scales of 30+ years, looking for evidence of changes in climate requires data over much longer periods of time. The same is true of many other key ecological processes or systems. Thus for data-based investigations of sustainability, reliance on existing historical data is essential and will always be. This creates challenges because measurement technology evolves faster than climate-paced processes, usually in the direction of greater information content (more and extensive measurements of higher quality), although not always as evidenced by policy- and funding-induced cessation of data collection efforts.
The unavoidable reliance on data collected over relatively long periods of time (or combining historical and current data) results in challenging problems of: 1) uncertainty analysis (information from the past often has greater uncertainty than contemporary data); 2) temporal data fusion (changes in measurement technology or protocol often necessitates calibration of one data stream to another); and 3) sampling design (optimal augmentation of existing sampling sites/technology with new sites/technology). These problems will persist as long as measurement technology and protocol evolve at a faster rate than the processes they are designed to measure. 2.3 Models for synthesizing data and forecasting
The word model has many different meanings to many people. For example, statisticians often think of models as empirical models estimated based on observed data. Mathematicians tend to think of models in terms of theoretical constructions, or process models. In this document, one of our goals is to discuss how sustainability science can be advanced by combining theoretical process models with observed data. Two major advantages of this approach are that it allows for the predictions beyond the

107 | P a g e
range of the data and facilitates greater insight into the underlying mechanisms producing the observed patterns. Another issue that we face in applying a more process-based modeling approach is the need to balance complexity (detail) with simplicity (transparency). In the construction of models for sustainability science, we have the potential to build complex systems of equations that define the process model(s). If such models are to be informed by datasets such as those described above, then we must be able to link the datasets to different model components. That is, if the models are overly complex, then we are potentially faced with an over-parameterization problem such that available data may not contain enough information to identify or estimate all parameters in the process model. Such issues are important to consider if such models are to be used for forecasting or making inferences related to sustainability. In general, models, especially if informed by data, can be used for many things including making projections and forecasts, scenario evaluation, capturing nonlinearities, for space/time scaling, to quantify and propagate uncertainty, and to inform the construction of monitoring networks. However, care will need to be taken so to avoid poorly-parameterized models.
Finally good data visualization techniques allow modelers to convey complex ideas in simple terms and allow non-experts to understand the results (e.g., http://www.gapminder.org). 3. Role of the mathematical sciences We identified several research themes that the mathematical sciences can contribute to in the context of advancing both basic and applied sustainability research. These themes focus on issues associated with measuring, monitoring, and forecasting elements of sustainability, and are broadly applicable across a range of disciplines in this general area. An important motivation underlying these themes is the collection and use of diverse datasets in the context of relatively complex, process-based models related to sustainability. The idea is that these models will be informed by and improved upon by existing and new datasets, and the models in turn should be applied to update sampling and monitoring designs. The data-informed models can subsequently be applied to forecast quantities relevant to evaluating sustainability. The major themes that we identified include: 1. Focus on uncertainty quantification via probabilistic modeling approaches 2. Develop sampling designs for monitoring and measuring quantities relevant to
sustainability 3. Develop data fusion methods for integrating diverse datasets 4. Use computer experiment methods as related to sustainability data and models 5. Develop model diagnostics for complex, hierarchical models 6. Develop model assessment tools for integration or comparison of multiple models 7. Develop the aforementioned methods in the context of dynamic spatio-temporal
models 8. Develop and apply complex networks and network theory in sustainability research Below we provide more detail on the issues underlying these eight research themes, and the important role that the mathematical sciences can play in addressing these themes.

108 | P a g e
3.1 Uncertainty quantification The topic of uncertainty quantification arises whenever complex, process-based
models⎯which often must be implemented via computational approaches⎯are used for simulating real-world process. Typical issues include:
• Characterizing the bias or discrepancy between models and reality (data); • Recognizing that cost constraints often mean that models can only be run for
certain combinations of input parameters, requiring extrapolation of model output to other input parameters;
• Accounting for uncertainties in the initial conditions; • Estimating unknown parameters in the process model, and those arising by
embedding the model in a stochastic framework (i.e., when coupling the model to data);
• Accommodating stochastic features of the process models, independent of the framework for linking the models to data;
• Producing predictions that arise by combining models and observational data, as might occur via data assimilation methods.
Addressing these issues requires the combination of expertise from mathematics, statistics, and computer science, as well as the specific subject expertise required to build the process models and understand the intricacies of the datasets. Existing tools are available for addressing many of the above issues for simpler models and datasets, but the challenge that we face is expanding upon these tools, and perhaps developing new tools that can accommodate the types of complex systems, data sources, and models that are necessary for advancing sustainability research.
It is possible to capture some aspects of the uncertainty in process-based models by using randomness. For example, consider the problem of understanding the basic biogeochemical cycles (BGC) of large water bodies like oceans and their estuaries. This is a very important problem, since marine life relies on the relationship between nutrients, phytoplankton, and zooplankton and how they react to temperature, light, and resource availability. The relationship can be described by a series of non-linear ordinary differential equations in time, yielding the process model. It is recognized that the equations are approximations, but standard BGC analyses ignore this. A physical-statistical approach embraces the uncertainties in the model; i.e., the equations' coefficients (model parameters) could be modeled as random to account for the size distribution of phytoplankton and zooplankton (i.e., incorporate parameter uncertainty), and the equations themselves could still capture the "mass balance" but have a random closure term (i.e., include process “error” or uncertainty). The coupling of the process-based BGC model to data may be facilitated by a hierarchical, probabilistic framework that acknowledges that the data are often measured with error.
Thus, the uncertainty in the data can also be described by measurement or observational error terms. An issue related to uncertainty quantification in sustainability science is that complex, process-based models such as the aforementioned BGC model will often be necessary for synthesizing diverse data and for producing forecasts. As part of this, we need to develop methods for, and emphasize the importance of quantifying the various components of uncertainty related to parameters, the process model(s), and the observational data sets. This uncertainty should be propagated via, for example, probability theory such that accurate and realistic forecasts are obtained. For example,

109 | P a g e
point estimates of future quantities (e.g., amounts of available resources) will be insufficient for evaluating progress towards sustainability or for making decisions regarding certain actions to achieve particular sustainability markers.
3.2. Sampling designs for monitoring and measurement
Design criteria - Here we offer a few examples of sampling or monitoring designs that were or could be motivated by specific design criteria. These examples are not necessarily meant to serve as specific role models as they could be improved upon for sustainability research. They also are not meant to represent the only existing designs; there are likely other relevant monitoring and sampling networks that could be expanded upon for the purpose of obtaining information to advance sustainability research. Because many different variables are expected to be important to developing and testing models related to sustainability, we anticipate that a wide array of sampling and monitoring designs will be necessary to obtain relevant information, and the spatial extent of each sampling or monitoring network will likely vary depending on the variable of interest and the scope of the research problem. Below we highlight examples of existing designs and/or design criteria that span local to national to global scales. New methods for sampling designs will be required for measurement and monitoring of baselines and to estimate trends in sustainability. Since the data will typically be spatio-temporal in nature, both the frequency of observations as well as the number and location of sites for monitoring stations will need to be considered. In most cases, multiple criteria will need to be considered when designing a network. For example, a sampling design may be constructed to achieve optimal predictions, to produce accurate estimates of key quantities of interest, to allow for model assessment, to estimate spatial and temporal trends, to detect catastrophic change, to estimate dynamical invariants, and/or to estimate parameters in models for extreme events. A common goal in all sampling design is to construct networks that use the available funds for monitoring in the most efficient manner possible. When constructing a sampling design to address sustainability issues, we will also need to consider other sources of data. Sustainability science will require new statistical methods for combining massive quantities of observational and experimental data, combining and modeling data collected at different scales, and combining and analyzing historical and new data. For example, should we design a new network so that you can maximize the use of historical data in future analyses to enable analyses of longer time series? One example of the challenges of constructing sampling designs in the context of sustainability science error are the multiple efforts that are now emerging on developing methods for assessing carbon, carbon loss, and carbon sequestration in tropical forests. Many such forests are remote and inaccessible and do not lend themselves well to ground-based sampling. Thus, the data requirements and acquisition methods for constructing remote sensing-based maps that are of sufficient quality (e.g., quality of fit, precision) to serve as the basis for assessing carbon change is a huge emerging issue. Two aspects are crucial: (i) acquisition of reference data to train or calibrate the models that are then used to predict carbon or carbon change for non-sampled areas using remotely sensed data, and (ii) acquisition of validation or accuracy assessment data to evaluate the quality of the resulting map. The relevant issue here is construction of sampling designs and plot configurations that are simultaneously efficient for the
110 | P a g e
acquisition of both ground and remotely sensed data. For example, for satellite imagery, the plot should be of sufficient size to constitute an adequate sample of a satellite image pixel, whereas for airborne laser data which are acquired by an airplane in strips, efficiency dictates that the ground plots be located along straight, systematic lines to facilitate flight paths. The point is that sampling designs must be constructed in advance to accommodate data from multiple, diverse, independent sources (ground crews, satellites, airplanes).
Some other examples of applications where careful thought has been put into the location of the monitoring stations includes monitoring water quality (Dobbie et al, 2008), air pollution (Zidek et al, 2000), assessment of ecological resources via the US Environmental Protection Agency’s Environmental Monitoring and Assessment Program (EMAP) (Stevens and Olsen, 2004), and the monitoring of US forests by the USFS FIA program as previously discussed. More recently the sampling designs for sensor networks have been of interest. There are both engineering and statistical sampling design issues to be considered with these problems (Porter et al, 2005; Borgman et al. 2007).
Invasive species – One example, which is also relevant to sustainability issues, is the use of sampling designs for the monitoring of invasive species. For example, understanding and estimating the rate of long distance dispersal is critical for monitoring and controlling the spread of invasive species. Adaptive spatial sampling designs have been used in this context (Piellat et al. 2006). In this case, a sequential sampling design was used where sampling locations were added sequentially by modeling the dispersal pattern of seed based on data observed. Potential information about the dispersal parameters at each unsampled location was considered and the new location that provided the largest information gain was selected. Similarly, effective estimation of the probability of establishment of the initial population (often referred to as an “Allee effect”) is essential for controlling the spread of invasive species. Effective temporal sampling designs that provide information on the initial growth phase of the population are critical for the estimation of the Allee effect precisely (Dennis, 1989), and since the estimation of this effect is critically dependent on the size and rate of change of the initial, invading population, sampling strategies must be developed to target this critical time period.
NEON – Most national-scale observing systems are not built around a cause-and-effect model but instead seek to efficiently monitor a small number of driving variables (e.g., environmental, climate) or response variables (e.g., forest productivity, animal abundance). That is, the sampling design is often not be guided by conceptual models or scientific questions. The design of monitoring and measurement systems for understanding, quantifying, and forecasting quantities related to sustainability issues should, however, be motivated by underlying issues that can be quantified in terms of conceptual or quantitative models (see “design criteria”). The National Ecological Observatory Network (NEON) is as an example of a measurement system whose design was strongly guided by conceptual models within a complex systems perspective. For example, one focus of NEON is to provide the information necessary to quantify and forecast changes in biodiversity. In particular, NEON will obtain and maintain a wide diversity of datasets on both driving and response variables. The selection of these datasets and the sampling intensity and frequency were identified a priori to capture changes in time and space and to integrate information across scales. Measurement systems such as NEON will be invaluable for revealing underlying processes and

111 | P a g e
providing information necessary for building and assessing quantitative models that may be used for forecasting in the context of sustainability. However, as for all monitoring systems, the design of process-driven measurement systems such as NEON must be discovered in the context of known constraints (e.g., logistical, financial). Global Forest Network– The Global Forest Resources Assessment 2010 (FAO 2010) examines the current status and recent trends for the extent, condition, uses and values of forests and other wooded land. Information has been collated from 233 countries and territories for four points in time: 1990, 2000, 2005 and 2010. The results are presented according to seven themes associated with sustainable forest management. A systematic sampling design based on intersections of whole degrees of longitude and latitude was used with a reduced intensity above 60 degrees North/South latitude. At each sample site, a 10-km × 10-km area is accessed via interpretation and classification of four Landsat satellite images dating from circa 1975, 1990, 2000 and 2005. 3.3. Data fusion methods
Development of data fusion methods will be necessary for combining multiple sources of information. Data fusion could come in the form of fusion of one set of observations with another set, obtained under different sampling paradigms, or fusion of observations with model-based output. In some cases, we may consider model outputs as a form of data observation (e.g., climate model outputs may be used as “data” for a biogeochemical cycle model or an economics model), and hence they involve the same mathematical problem. The general problem is to come up with an estimate of the underlying latent (or unobservable) process(es) of interest based on the two (or more) sets of observations. Approaches for fusing different datasets are just beginning to emerge. For example, Nguyen, Cressie, and Braverman (2010) combined data from two different instruments on the same satellite to find optimal spatial predictors of aerosol optical depth. The idea is to expand upon such data fusion methods so that they can accommodate a wide range of datasets that may inform similar or overlapping processes. Data fusion examples– The combination of ground data obtained from sample plots and remotely sensed data such as satellite imagery are often combined to estimate baseline conditions and to assess change. Combining such independently acquired data produces multiple sources of uncertainty: (1) rectification of the imagery to the plot coordinate system is not without error, (2) ground plot coordinates have varying degrees of error depending on the quality of global positioning system (GPS) receivers, (3) plots and image pixels are nearly always of different sizes, and (4) plot measurement and image acquisition dates are seldom the same. Although reasonably accurate maps and estimates of land cover parameters may be obtained, the effects of the sources of uncertainty on the uncertainty of land cover parameter estimates is generally unknown. Forests on the Edge (Stein et al., 2009), a project of the U.S. Forest Service, uses geographic information systems (GIS) techniques to assess the contributions of private forest land and threats to those contributions. The analyses are based on the fusion of independently constructed data layers of different spatial resolution obtained from a diverse set of underlying data sources. The primary layer from which a private forest land map is constructed is based on a 30-m x 30-m, satellite image-based forest/non-forest layer (Homer et al., 2007) and a layer depicting land protection status

112 | P a g e
(CBI, 2007). Contribution layers include timber supply based on forest inventory sample plot observations (FIA, 2007), water buffers based on national hydrological data (Steeves et al., 1994), and habitat for endangered species based on information obtained from NatureServe (http://www.natureserve.org/explorer/ranking.htm). Data on which spatially explicit projected housing density values are obtained, the primary threat layer, is based on U.S. Census data and a layer depicting transportation networks. The data from all sources are aggregated at the level of watersheds, which is of more coarse resolution than data for any of the underlying sources. 3.4. Role of computer experiments
Although computer-aided discovery predated 1961, there is no more appropriate way to broach the subject of computer experiments in climatology, ecology, and complex systems in general than to mention the pioneering work of Edward Lorenz. However, the field of computer experimentation has developed immensely since the time of Lorenz's serendipitous discoveries as have the computing machines themselves.
Computer experimentation encompasses modern Monte Carlo methods of statistics including Efron's bootstrap (and resampling methods more generally), Markov chain Monte Carlo methods, stochastic approximation for optimization and equation solving, and formal statistical design-based methods for understanding how the output of a complex system f() (e.g., the mathematical/simulation process models) depends on inputs x (driving variables and parameters) and on f() itself (e.g., autoregressive-type relationships).
Although all varieties of computer experimentation are likely to find applications in the science of sustainability and will require further development, modification, and adaptation, it is the applications to understanding complex models of complex systems and processes that will most assuredly need further development by mathematical and statistical scientists due to its importance to the problems of quantifying uncertainty of all forms. Of the latter there are three main constituents: imperfect understanding of the map x -> f(x) even when x and f() are assumed free of uncertainty; uncertainty in f() as a model of a real process or system (e.g., due to process or parameter uncertainty); and uncertainty in inputs x (e.g., due to observational uncertainty or measurement error) which for this discussion are assumed to include initial conditions, and "tuning" (or "tunable") inputs (e.g., inputs that determine characteristics of f() that one might consider adjusting to provide better fit to empirical data, e.g., via maximum likelihood).
A disciplined study of uncertainty uses the strategies of statistical experimental design (e.g., fractional factorials, space-filling designs, blocking, and randomization) to systematically vary those factors through which uncertainty is manifest (Santner, et al., 2003). Computer experiments, in particular, are important for understanding and quantifying uncertainty in highly complex models because these models may be too computationally demanding to implement many times, as would occur if the model, f(x), had to be evaluated for many levels of x and/or for many iterations (e.g., thousands of MCMC iterations). Thus, we can draw-up methods developed for computer experiments that enable the evaluation of f(x) for a “small” number of levels of x, reducing the computational burden of evaluating f() an undue number of times. This may require approaches to approximating f(), and development of effective strategies for doing so in the context of models relevant to sustainability is an important research problem.

113 | P a g e
3.5. Model diagnostics Good model diagnostics are essential for model building. Essentially one is
looking at whether properties of the model are supported by the data. There is a cycle of proposing a model, diagnosing the model, modifying the proposed model, diagnosing the modified model and so forth. For complex, non-linear, hierarchical statistical models, model diagnostics are essential, but there are few of them, and there is a great need for fundamental research in this area (Little 2006).
There are several generic diagnostic procedures that currently exist in our statistical portfolio, including:
• Validation (splits the data into two parts, one for model fitting, and one for comparison to the fitted model predictions);
• Cross-validation (successively deletes a datum, or group of data, with replacement, and carries out a validation exercise for each deleted component);
• Information criteria such as AIC, DIC, BIC, and posterior predictive loss (used to compare several models but could also be used for model diagnosis; simultaneously accounts for model fit and model complexity);
• Posterior predictive distribution (a Bayesian version of a classical significance-testing approach to testing hypotheses; see Gelman et al, 1996).
Although the aforementioned procedures exist, they were generally developed for relatively simple models and data sets. These methods must be expanded upon, or new methods developed, to accommodate the types of complex models that we will encounter in sustainability research. That is, many models may produce different types of predictions, potentially at different spatial and/or temporal scales, especially if the overarching model(s) represents the coupling of multiple sub-models (see Section 3.7). And, the models will likely be coupled to multiple data sources, also potentially varying in their temporal frequencies, spatial scales, and levels of uncertainty (see Section 3.3). Thus, the above procedures will likely be inadequate for diagnosing the overall “behavior” of such complex models and/or their components. 3.6 Model assessment
The area of model assessment includes model selection using methods like AIC (Burnham and Anderson, 2002) as well combining models using methods like Bayesian model averaging (Hoeting et al., 1999). While much work has been done in model assessment, the construction of new models requires new methods for model assessment. For example, in hierarchical models, questions have arisen about how to quantify the number of parameters in a model (Spiegelhalter et al. 2003). While methods to address this issue have been proposed, these approaches have been shown to be misleading when there are missing data and nonlinear model components. As an example, consider a population dynamic model to estimate the number of elk in Rocky Mountain National Park. The goal of the park is to maintain a sustainable population as the number of elk skyrocketed after their predators were eradicated. A Bayesian hierarchical model to predict the number of elk over time might involve one of more dynamic models for aspects of population growth. The dynamic components of the model typically have very different biological interpretations and thus scientists are interested in choosing between them. Existing model selection methods often have difficulties differentiating between these highly nonlinear models. New methodology

114 | P a g e
needs to be developed to address model selection in this and other more complex models. 3.7 Dynamic spatio-temporal models
In this report, we emphasize the integration of diverse data sources, process-based or theoretical models, and parameter models, which include parameters arising by embedding the process models in a stochastic framework, and quantities (e.g., coefficients) directly incorporated in the process models. The process models are where the science resides, and their development is facilitated expert knowledge and existing information. Within a probabilistic framework that combines available data sources and the process models, the process model(s) may be viewed as describing the underlying latent quantities that we would like to have observed (e.g., the “true” process), but cannot directly observe due to, for example, measurement error, instrument inaccuracy, instrument drift, or other sources of observation uncertainty. In some cases, the process model may be viewed as yielding the true process exactly, without error, but in many cases, since no model is perfectly correct, the process model may be viewed as describing the expected process. The true, latent process would be given by the “expected process plus process error” (see Section 3.1). In the context of understanding, quantifying, and forecasting elements of sustainability, we suggest that such process models must be able to accommodate spatial and temporal dimensions.
The evaluation of sustainability involves comparisons between base-line (or current) quantities and predicted (future) quantities, and measures of change will be key to defining and evaluating metrics of sustainability. That is, change with respect to space and/or time (e.g., as may be quantified by analytical or numerical derivatives), and thus divergence from the baseline(s), will be critical to evaluating the degree to which sustainability has been achieved or not. Thus, the underlying process models must be able to accommodate temporal dynamics to obtain predictions and/or to evaluate rates of change. Of course, these quantities may vary over space due to, for example, heterogeneity in drivers or initial conditions (e.g., land-use, climatic conditions, population density). This implies that dynamic, spatio-temporal models (Cressie and Wikle, 2011) ⎯such as might be encapsulated by partial differential equations (PDEs) or stochastic PDEs, but certainly not limited to these types of models⎯are critical for advancing sustainability science, and the mathematical sciences can contribute greatly to the development and evaluation of such models. There are many existing spatio-temporal process models that may be useful for quantifying and forecasting sustainability in different contexts, including models of biogeochemical cycles (e.g., transformations, storage, and fluxes of elements such as carbon and nitrogen), hydrological processes (e.g., river flow, flooding, groundwater movement and extraction), atmospheric chemistry (e.g., production, degradation, distribution, and concentration of pollutants), climate (e.g., temperature, precipitation, cloud formation), epidemiology (e.g., spread of infectious diseases, vaccination strategies), population dynamics (e.g., animals, plants, or humans), and economics (e.g., financial stability, price indices).
None of the above modeling examples are particularly new, and some are often only applied to quantify temporal dynamics (e.g., many may lack an explicit spatial component). What will be important for advancing our understanding and ability to quantify sustainability is the coupling of multiple spatial-temporal models, and the
115 | P a g e
integration of these models with diverse datasets that can be aligned to spatial and temporal dimensions of the process model outputs. For example, this is currently being done, to some extent, in the context of climate change modeling whereby dynamic, spatially explicit climate models are coupled to ocean circulation models and terrestrial biosphere models. However, this coupling imposes major computational challenges and thus one model may simply serve as “boundary conditions” or “inputs” to another model (e.g., climate model outputs are often treated as fixed input into terrestrial vegetation models), and feedbacks between the models have been relatively difficult to accommodate. At this time, computational methods do not exist for effectively integrating such coupled models with the plethora of data available at the different temporal and spatial scales, especially if placed within a probabilistic data-model integration framework. Development of probabilistic methods for incorporating such feedbacks and linking coupled process models to diverse datasets will be necessary for advancing sustainability science, particularly in the context of forecasting future, multi-dimensional states. 3.8 Complex Networks
The complexity in a sustainable society can be captured mathematically by graphs (commonly called networks, which are used in a completely different context than the aforementioned references to sampling or monitoring “networks”). There is an embryonic discipline of “complex networks,” populated by physicists, statisticians, computer scientists, epidemiologists, mathematicians, etc; see, for example, Kolaczyk (2009) and Newman (2010). Complex networks are models of how “the world works,” but they are extendable to allow for more complexity or more variables. That strength is also a weakness; network sizes and complexities can clearly grow exponentially. However, it does offer a paradigm to understand growth and its counterpart, recession. In fact, by definition sustainability will require both growth and recession in different sectors, in different regions, and at different times. To build, measure, and assimilate a complex network is a worthy endeavor, but destined to fail. An analogy would be to try to track every gas molecule in the atmosphere over time. To study complex networks, we could move away from their mathematical building blocks (vertices and edges) and consider instead identifiable “objects” made up of those building blocks and/or study local densities (“fields”) within the network. The dependencies implied by the network are expressed through conditional distributions. There is an important theoretical problem that involves construction of the joint distribution from the conditional distributions implied by the network. This will involve a generalization of the Hammersley-Clifford Theorem (e.g., Cressie, 1993, Ch.6) for complex networks. 4. Recommendations
Mathematical scientists should be encouraged to build and evaluate tools that are not restricted to any particular field of application but that exploit the commonalities among the different fields contributing to the sustainability science. There is a need to develop methodologies for the iterative process of combining data and sampling designs with models, leading to forecasting. Specific examples of problems to be solved include: estimation of parameters in complex models based on diverse data sources, evaluating the agreement between complex process models and observational data, and integrating data from different sampling designs.

116 | P a g e
To ensure the success of this program of research, a number of resources will need to be in place. Support is needed for interdisciplinary research involving statisticians, applied mathematicians, computational scientists, and experts from multiple fields, including, but not limited to, ecology, atmospheric science, oceanography, epidemiology, sociology, and economics. In addition to research on basic methodology, however, there are issues connected with constructing both datasets and computer programs in a form that can be permanently archived and made available to other researchers. This will require investment in database sciences and geographical information sciences; there is also a need to involve statistical computing scientists to develop efficient algorithms and user-friendly software required to implement modern statistical and mathematical methods on the scale required for effective implementation. As part of this, we envision the establishment of a national data center / portal for sustainability research that would potentially house, maintain, and/or provide links to publically available datasets relevant to sustainability research. This would greatly facilitate the ability of members from the mathematical sciences community to tackle the research themes outlined in Section 3.
Our recommendations to the mathematical sciences community can be summarized by the following points:
• Build and evaluate tools that can be broadly applicable to a range of problems in sustainability as identified in Section 3.
• Develop the iterative process for combining data, models, and forecasting in the context of the complexity discussed in Section 3.
• Develop methods for estimating parameters and quantify uncertainty in complex models.
• Expand upon or develop new protocols for evaluating the agreement between models and data in the context of the complexity discussed in Section 3.
• Establish strategies for integrating data from different sampling designs. • Establish strategies for acquiring data from multiple independent sources using the
same sampling design.
Our recommendations to funding agencies and the scientific community at large can be summarized by the following points:
• Facilitate and promote multi-disciplinary research teams that support collaborations between the mathematical sciences (mathematics, statistics, computational scientists) and the subject/applied fields associated with addressing sustainability problems (e.g., ecologists, atmospheric scientists, oceanographers, social scientists, economists).
• Provide mechanisms for improved infrastructure related to research support for the development, maintenance, and querying of databases, and provide computing support necessary for implementation of computational or statistical algorithms and user-friendly software. An example of a particularly important resource is the creation of a national data center for sustainability research.
5. Final remarks

117 | P a g e
We need to develop the mathematical and statistical methods and theory so that in 2020 we can determine whether we have made significant progress towards sustainability.
References
1. Beissinger SR (2001). Population viability analysis: Past, present, future. In SR.Beissinger and DR MacCullough (eds.), Population Viability Analysis. Chicago, University of Chicago Press, 5-17.
2. Borgman CL, Wallis JC, Enyedy N (2007). Little science confronts the data deluge: Habitat ecology, embedded sensor networks, and digital libraries. International Journal on Digital Libraries, 7(1): 17-30.
3. Burnham KP, Anderson DR (2002). Model Selection and Inference: A Practical Information Theoretic Approach. Springer-Verlag, New York, 2nd edition.
4. Caussinus H, Mestre O (2004). Detection and correction of artificial shifts in climate.Journal of the Royal Statistical Society, Series C, 53: 405-425.
5. Conservation Biology Institute (CBI) (2007). Protected areas database v4.6. [Unpublished data set]. http://www.consbio.org/what-we-do/protected-areas database-pad-version-4
6. Cressie NAC (1993). Statistics for Spatial Data, New York, Wiley. 7. Cressie NAC, Wikle CK (2011). Statistics for Spatio-Temporal Data, Wiley, Hoboken,
NJ. 8. Dennis B (1989). Allee effects: population growth, critical density, and the chance of
extinction. Natural Resource Modeling, 3: 481–538. 9. Dobbie MJ, Henderson BL, Stevens Jr. DL (2008). Sparse sampling: Spatial design for
monitoring stream networks. Statistics Surveys, 2: 113–153. 10. Food and Agriculture Organization of the United Nations (FAO) (2010). Global forest
resources assessment 2010, main report. FAO Forestry Report 163. Rome, Italy, 340. 11. Forest Inventory and Analysis (FIA) (2007). Forest Inventory and Analysis national
program: We are the Nation’s forest census, U.S. Department of Agriculture, Forest Service. http://fia.fs.fed.us/
12. Gelman A, Meng XL, Stern H (1996). Posterior predictive assessment of model fitness via realized discrepancies. Statistica Sinica, 6: 733-759.
13. Haylock MR, Hofstra N, Klein Tank AMG, Klok EJ, Jones PD, New MA (2008). European daily high-resolution gridded data set of surface temperature and precipitation for 1950-2006. Journal of Geophysical Research, 113: D20119. doi:10.1029/2008JD010201.
14. Hoeting JA, Madigan D, Raftery AE, Volinsky CT (1999). Bayesian model averaging: A tutorial (with discussion). Statistical Science, 14: 382–417.
15. Homer C, Dewitz J, Fry J, Coan M, Hossain N, Larson C, Herold N, McKerrow A, VanDriel JN, Wickham, J (2007). Completion of the 2001 national land cover database for the conterminous United States. Photogrammetric Engineering & Remote Sensing, 73(4): 337–341.
16. Kolaczyk ED (2009). Statistical Analysis of Network Data, Springer, New York. NY. 17. Little RJ (2006). Calibrated Bayes: A Bayes/frequentist roadmap. American
Statistician, 60: 213–223. 18. McRoberts RE, Bechtold WA, Patterson PL, Scott CT, Reams GA (2005).The
enhanced Forest Inventory and Analysis program of the USDA Forest Service:

118 | P a g e
Historical perspective and announcement of statistical documentation. Journal of Forestry, 103: 304-308.
19. Menne MJ, Williams Jr.CN, Palecki MA (2010). On the reliability of the US surface temperature record. Journal of Geophysical Research, 115: D11108. doi: 10.1029/2009JD013094, 2010.
20. Newman MEJ (2010). Networks: An Introduction, Oxford University Press, Oxford, UK. 21. Parris TM, Kates RW (2003). Characterizing and measuring sustainable development.
Annual Review of Environment and Resources, 28(1): 559-586. 22. Piellat AM, Lewis M, Lel SR, BeckTDC (2006). Optimal sampling designs for seed
dispersal experiments. Ecological Modelling, 190: 205-222. 23. Porter J., Arzberger P, Braun HW, Bryant P, Gage S, Hansen T, Hanson P, Lin CC,
Lin FP, Kratz T, et al. (2005). Wireless sensor networks for ecology. BioScience, 55(7): 561-572.
24. Reeves J, Chen J, Wang XL, Lund R, Lu Q (2007). A review and comparison of changepoint detection techniques for climate data. Journal of Applied Meteorology and Climatology, 46: 900-915. doi: 10.1175/JAM2493.1.
25. Santner TJ, Williams BJ, Notz W (2003). The Design and Analysis of Computer Experiments. Springer Verlag.
26. Smith R, Cressie N (2010). Statistical interpolation methods. Supplement to white paper 11, Workshop on Datasets for the 21st Century, UK Met Office, Exeter, UK. http://www.metoffice.gov.uk/conference/surftemp/index.html
27. Spiegelhalter DJ, Best NG, Carlin BP, van der Lind A (2003). Bayesian measures of complexity and fit. Journal of the Royal Statistical Society - B, 64:, 583-639.
28. Steeves PA, Nebert DD (1994). Hydrological unit maps of the conterminous United States [database], U.S. Geological Survey [USGS], open-file dataset “huc250,” ed. 1. Reston, VA: U.S. Geological Survey. http://water.usgs.gov/ GIS/metadata/usgswrd/XML/huc250k.xml
29. Stevens DL Jr, Olsen, AR (2004). Spatially-balanced sampling of natural resources. Journal of American Statistical Association, 99(465): 262–278.
30. Stein SM, McRoberts RE, Mahal LG, Carr,MA, Alig RJ, Comas SJ, Theobald DM, Cundiff A (2009). Private forests, public benefits: Increased housing density and other pressures on private forest contributions. Gen. Tech. Rep. PNW-GTR-795, Portland, OR, U.S. Department of Agriculture, Forest Service, Pacific Northwest Research Station., 74.
31. Wikle CK, Royle JA (1999). Space-time models and dynamic design of environmental monitoring networks. Journal of Agricultural, Biological, and Environmental Statistics, 4: 489-507.
32. Zidek JV, Sun W, Le ND (2000). Designing and integrating composite networks for monitoring multivariate (Gaussian) pollution fields. Journal of Applied Statistics, 49: 63–79.

119 | P a g e
Appendix 4: Managing Human-Environment Systems for Sustainability
Authors Colin Clark (University of British Columbia) Jonathan Dushoff (McMaster University) Lou Gross (University of Tennessee) Alan Hastings (University of California, Davis) David Shmoys (Cornell University) Mike Steuerwalt (NSF) Laura Wynter (IBM Research) Mary Lou Zeeman (Bowdoin College) Charge to the Group The planet faces enormous sustainability challenges. With a still-growing human population and rapidly increasing consumption, society must determine how to meet the basic needs of people for food, energy, water, and shelter without degrading the planet's life support infrastructure, its atmosphere and water resources, the climate system, and species and ecosystems on land and in the oceans on which we and future generations will rely. For example, given current trajectories, it has been predicted that society will have to double food production in the next 40 years to keep pace with demand, while reducing pollution impacts on aquatic ecosystems and reducing the rates of biodiversity loss associated with land-use change and overfishing. An improvement in well-being within this ambitious scenario would require improved livelihood opportunities for the poor and a shift in human behavior among others toward goals that seek well-being through a less consumptive lifestyle. This would necessitate radical changes in the management of human-environment systems for sustainability. Under this theme, the Group is asked to explore potential strategies for managing complex adaptive systems with real actors, polycentric problems, and multiple scales of interactions, starting with the need for precise mathematical formulations of these challenges. This requires going beyond identifying the mathematical challenges to sustainability management of human systems (e.g., population, consumption, environmental externalities, and commons problems) to developing a fundamental, mathematically-based understanding of exactly what management means, what information is required to do good managing, and how one measures the performance of management systems that aim at sustainability. Moreover, it requires developing an understanding of how shifts in human behavior can be achieved in a more effective way. For example, such shifts may arise more readily if risks associated with various responses can be defined in an appropriate probabilistic framework and presented so as to most effectively provide general public appreciation of the trade-offs involved in various management actions.
1. Introduction We challenged ourselves to articulate and identify components of a feasible
research agenda for the mathematical sciences community that deals with sustainability at the interface of human systems and environmental issues. This includes identifying areas where new mathematical efforts will assist in describing, modeling, analyzing and

120 | P a g e
projecting the impacts of human management actions and policies on sustainable development. The multiple scales and variability inherent in the diversity of human and natural systems potentially affected by management actions imply that mathematical scientists offer a uniquely useful skill set and conceptual foundation upon which to build the science of sustainability.
2. Examples The problem of managing for sustainability is broad, and many of the topics that
must be addressed demand mathematical understanding to be managed effectively. In most of these cases, mathematical techniques are already being applied. Our focus is on examples not just where mathematical understanding is required for management, but where new mathematical perspectives or approaches hold at least potential promise to improve management. The world of sustainability is complex, and our examples are not intended to be exhaustive.
The sustainability problems that confront us are almost all deeply inter-related, and one important challenge is dealing with these interactions. Most of the important problems are international in scope, and require international co-operation in order to to be handled effectively. Pollution does not recognize borders, nor do greenhouse gases or fish or sea water.
An important component of managing for sustainability will be understanding how human systems work, and how policy initiatives may play out through human social and economic networks to lead to results in natural and human-run systems. Many sustainability issues, including pollution abatement, climate change, the harvesting of living resources, and so on, involve “public goods” whose utility to individuals is affected by the actions of others. It is well known that individual users of public goods often behave in ways that are inimical to sustainable use. Game-theoretic models are useful in understanding such behavior, and in predicting the response of users to various management initiatives.
Managing for sustainability implies both trying to limit damage to the Earth’s natural capital, and finding ways to provide for human well-being once damage has occurred. For example, one goal is to limit deforestation, and another related goal is to use remaining forests efficiently. Similarly, the goal of limiting the extent of human-induced climate change should be modeled and addressed in conjunction with the study of ways to maintain society in the face of an already-changing climate.
As we think about how to manage for sustainability, we should ask both what our objectives are, and how our progress towards these objectives should be evaluated. 2.1. Fisheries
Fisheries are an important source of healthy and delicious protein. But many marine fish populations have been severely overfished. In addition, ocean pollution negatively impacts fish stocks, reducing their food source, and harming marine habitats. For example, ocean acidification destroys coral reefs and reduces zooplankton communities worldwide.
Mathematical models have been central to fisheries management for over 50 years. The initial, logistic-type models were very simple, and management for many years was based on a “maximum sustainable yield” (MSY) paradigm. Later, bio-economic models, starting with the so-called Gordon-Shaefer model, combined the MSY
121 | P a g e
approach with economic considerations. However, these models turned out to be too simplistic for effective management.
Currently, bio-economic models incorporating fishermen’s motivations are being used as the basis for establishing individualized quota systems. These bio-economic models that include fishermen’s motivations have been successfully implemented in Canada, Iceland, Australia, Namibia, and other countries. This is a good example of the need to include social sciences in what had previously been considered a marine biological problem.
Individualized transferable catch quotas (ITQs) can and do alter fishermen’s incentives so as to favor sustainable harvesting. Real world fish populations are components of highly complex ecosystems having spatial, temporal and other structures. Recognition of these structures may be essential for good management. To mention one typical case: spawning areas may attract fishing activity because of the high concentration of fish, but uncontrolled fishing in such areas can result in severe overfishing. The use of protected “no-take” areas to protect breeding stocks would lead to greater long-term catches. However, fishermen may oppose protected areas because they typically reduce catch rates temporarily. Under an ITQ management system, the fisherman may be economically motivated to favor protected areas, which will increase the future value of their quota.
Hence, a mathematical challenge is to search for effective incentive systems. One approach is to use agent-based models to explore the balance of cooperative and competitive behavior that emerges in fishing communities under different incentive scenarios.
Fish increase in size and economic value as they grow older. Age-structured models are used to estimate the optimal age of capture, and regulation of the mesh size of fishing nets is then used to achieve this optimum. ITQ-based fishermen typically support such regulation, even though short term catch rates may be reduced. Yet another important structure is genetic; maintenance of genetic diversity, for example in salmon populations, is essential for sustainable management. This is a serious issue in fisheries that capture mixtures of different genotypes.
Contrary to the predictions of a simple aggregated model, disaggregated models exhibit circumstances under which optimal management may require greater levels of fishing effort than occurs under unregulated exploitation. Not much work has been done in this area; it is ripe for mathematical exploration.
It would be desirable to manage fisheries on the basis of ecosystem structure. This introduces serious modeling challenges because of the complexity and limited observability of marine systems. Approaches that might be tractable are to aggregate into species groups, to identify critical resources that act as bottlenecks in the population dynamics, or to use single species models incorporating constraints designed to conserve ecosystem structure.
Linkages between the oceans and the atmosphere are critical for future climate conditions on earth. Examples include:
• Heat exchange (the oceans store more than 99% of combined ocean and atmospheric heat, transfer of which takes place on a slow time scale).
• Ocean acidification (increased atmospheric CO2 has resulted in severe ocean acidification, which is affecting marine life globally)

122 | P a g e
• The oceans contain large amounts of methane, currently in a frozen state, but subject to release if the ocean temperature increases by a few degrees. Since methane is itself a potent greenhouse gas, this could lead to a dangerous feedback cycle.
• Glacial melting (increases in fresh water flow into the oceans has the potential to induce massive changes on ocean currents, which could have extreme effects on future climate conditions.
These factors all impact marine ecosystems, including fisheries and coral reefs,
so their effects need to be incorporated into models and management decisions on the long time scale. The mathematical techniques that we suggest be developed further would help in addressing these ecosystem models on longer time scales.
2.2. Forest management
Forests are ecosystems which are important for sustainability at many levels, ranging from the provision of renewable resources to carbon storage to provision of habitat for other species. Forests are under continual threat from many directions including development, changing climate, diseases, and many other issues. A comprehensive approach to sustainability is obviously required, but the problem is so large that important questions that are less comprehensive must be solved first.
Two interrelated threats to forest health are forest insect pests and forest fires, both of which can have impact beyond the forest. These threats are both subjects of extensive work in the mathematical sciences, and build upon a wide array of both classical and cutting edge mathematical, statistical, and computational tools.
One critical issue in the management of forests is the policies maintained for fire suppression. For many years, the US government had maintained a policy of total suppression, but this has been reversed from the gradual understanding that it is not in the long-term interest of sustainability of the forests. A number of unintended consequences contributed to this change of perspective: for example, suppressing forest fires leads to the exaggerated build-up of undergrowth and younger stands of trees, which make catastrophic fires more likely; the seeds of the sequoia are released only with the heat of fires from the forest floor; the extended aging of the pine forests of British Columbia was a contributing factor in their devastation by the pine beetle, which destroyed 50% of those forests.
Once one determines that some fires should be suppressed and others not, then one must introduce a process to decide which fires to suppress. This has been the domain of a great deal of mathematical modeling already. For example, Parija, Kumar, Xi, and Keller (2007) apply a mixed-integer programming approach to the question of budget allocation for fire program analysis (based on an earlier model of Rideout and Kirsch, 2002), where the objective is to minimize the total utility of the acres burned. This approach is one of static deterministic planning, in contrast to, for example, the work of Hof and Bevers (2000, 2002) that provides mathematical programming tools for longer-term decision-making in a stochastic setting.
However, what is absent from the current state of the art is the ability to provide real-time support for making fire suppression decisions in the context of a stochastic model of the state of the forest as it evolves over an intermediate time frame. This is not surprising - the computational intractability of such a stochastic optimization model (even

123 | P a g e
with a relatively coarse-grained spatial-temporal description of modest scope) is well beyond the reach of current-day solvers, and improving them to be relevant to such a setting is a significant mathematical challenge. Furthermore, it remains to be seen to what extent the crude approximations in this approach - the particular discretization of both time and space, or the linearization of the objective that completely abstracts away the spatial dimension - lead to results that would align with more detailed models (which are even further beyond our computational capabilities).
Alternatively, one might also investigate more sophisticated models that seek to capture stochasticity inherent in changes linked to climate change, such as the increased frequency of future droughts. Understanding the alignment between differently-scaled models is particularly important in this context, since more sophisticated models, while not solvable in a real-time setting, would be useful in validating decisions.
Forest insect pests are a major threat to forest health (Liebhold et al., 1995). Many forest insect pests both respond to the damage of trees by fires, and also can damage trees and make them more susceptible to fires. Particular pests that illustrate some of the mathematical issues involved in management range from gypsy moth to mountain pine beetle and other bark beetles. The goal is either eradication or reduction of the population level to a low enough level so that there are no damages. The management of forest insect pests is a complex problem that requires attention to spatial and temporal heterogeneity both in the trees and in the population dynamics of the insects in a control problem that must include stochasticity at many levels.
Although there is a long history in mathematics of attention to control problems, management of forest pests introduces a series of extra complications that are typical of biological problems that are not well understood as well as requiring attention to different statistical and estimation questions. The population dynamics is likely to be modeled best as a nonlinear stochastic integro-difference equation, and control problems for this sort of model are not well understood. In the case of bark beetles there are additional important issues related to the interactions between individuals in their movement. Estimation of populations in a spatial context introduces difficult problems of estimation that are necessary both to start the control problem and to determine whether management has been successful. Other approaches could include determining what simpler versions of the models would still be sufficient for management.
2.3. Agricultural systems
Agricultural systems present numerous opportunities to utilize diverse mathematical approaches and offer various challenges requiring new mathematics. These arise in part due to the coupling of agricultural systems to many environmental components, human behaviors, and the intimate linkages between various sub-components of agriculture. There is a very long history of quantitative approaches in cropping systems, animal production systems, and economics including the use of large systems approaches and more general mathematical formulations (Thornley and France, 2007). These systems present unique opportunities to project the impacts of various management and policy actions on food availability for the growing world population, water resources, waste production, and contributions to greenhouse gas emissions.

124 | P a g e
Numerous statistical issues arise from dispersed data and diverse data types and sources for agricultural processes and production across and within countries. As one example, given current data restrictions estimates of agricultural contributions to greenhouse gas emission are inconsistent. Accounting for the spatial variation in agricultural practice at various scales (e.g. between country heterogeneity and within country variations) and the temporal dynamics associated with both seasonal and year-to-year variations presents significant challenges of statistical analyses to estimate not only current greenhouse gas (GHG) inputs but longer-term projections as well. Similar issues arise in projection of agricultural resource demands when taking account of potential economic variations in the costs of inputs such as fertilizer, and associated spatial changes in production practices.
These present opportunities for analysis of spatial stochastic processes with dynamics operating on longer time scales (e.g. crop system responses to climate changes over decades) and shorter ones (e.g. between seasons) to estimate current agricultural impacts spatially averaged across the world. Development of agreed upon methods to estimate these impacts can provide useful inputs to a variety of international policy decisions as well as serve as potential planning tools for agribusiness. Methods to effectively compare the spatial distributions of production to models would provide confidence that the models can be effectively used to compare impacts of alternative management practices and longer-term policies. Confidence developed through mathematical analysis of spatially-structured models for emissions are essential for providing evidence that mitigation strategies for pollutants can work, the time scales these might require, and whether regulation or incentives associated with such mitigation strategies can be effective.
An additional challenge is to develop methods to elaborate equitable allocations of resources to meet increasing world demands arising from population growth, economic growth of the developing world and associated potential changes in caloric intake and animal protein consumption. This includes developing methods to handle spatial variation in demand and production so as to evaluate alternative assumptions about future consumption demand. The large spatially-disaggregated economic sector models tend to be sensitive to uncertainties in demands arising from social systems models, presenting significant computational challenges. In addition, this complexity requires new impact estimators derived from the spatiotemporal model outputs.
Integrated assessments of economics linked to biological production models and alternative models for social system response can reflect the strengths and weaknesses of different worldviews by comparing alternative models. A mathematical challenge concerns whether rankings of impacts of alternative scenarios derived from differing management plans or policies are robust to uncertainties; such uncertainly stems from human system responses, environmental conditions derived from climate assumptions, and also from the parameterization of the models. The robustness of such relative assessments of scenarios has been applied in ecological evaluations (Fuller et al., 2008) in a computational framework, but it is possible that new mathematical approaches could lead to generalized results on the robustness of rankings.
The complexity of interactions between components of agricultural systems models and the associated need for extensive parameterization naturally lead to concerns about data availability and the utility of these models to project the implications of current trends. The implications for human food consumption are sufficiently important

125 | P a g e
that it is worthwhile to investigate the use of more aggregated, simplified models to provide qualitative “back-of-the-envelope” estimates of system response. Developing valid yet simplified models is an inherently mathematical question. It is possible that the forms of feedback inherent in certain component agricultural system models may be amenable to simplification that produces results sufficient for general policy and management comparisons.
3. Mathematical themes Several consistent themes arise within the above examples. All these cases
involve crossing scales and crossing domains. Consider the case of forest management: information on forest components presents itself at different scales such as insect dynamics operating at localized within-tree scale, dispersal over many kilometers, and weather, which is known at a much coarser resolution. Human management of forests operates at intermediate scales between individual trees and broad scale weather patterns. Similarly, different temporal responses are intertwined with spatial heterogeneity. In such cases, defining models at an appropriate level of aggregation across and within scales is a challenging mathematical modeling question.
Issues of uncertainty arise when dealing with how to estimate parameters from variable and often sparse data sets. For example in agricultural systems, economic aspects of production are poorly characterized for some regions relative to others. Uncertainty in process and parameterization are common in sustainability examples including climate variability and human system responses arising from different political and policy decisions. In addition to the difficulty of taking into account effects of model uncertainty, a significant challenge remains in solving large scale stochastic problems.
Recovery of overexploited fisheries is a dynamical transients problem that is poorly understood. The dynamics of climate systems in general have not been well incorporated into human system response and management for many components of sustainability. The estimation of uncertain population levels is a substantial problem in fisheries management and in the management of forest insect pests. Many components of sustainability involve linkages between dynamical systems operating on differing temporal and spatial scales and connecting these requires new approaches for multiscale modeling, a challenge for the study of such dynamical systems. 4. Connecting with the communities 4.1. Education
Every student is exposed to mathematics throughout their education. A critical challenge in mathematics education is to draw the link between the abstractions of mathematics and its utility across many areas of science. Sustainability issues are therefore an excellent focal point around which to demonstrate the power of mathematics to students; sustainability-related topics provide pedagogically useful examples that can engage K-12 students. In addition, the use of sustainability examples in mathematics courses provides the further benefit of engaging youth to become more involved in helping to address the sustainability issues existing in the world today.
Colleges and universities across North America have instituted a vast array of new courses, degrees and certificate programs involving sustainability. These programs could benefit from an explicit course on the mathematics of sustainability that may be

126 | P a g e
offered at a level to attract a broad collection of students from outside the natural sciences and engineering. A similar course which focuses on the interdisciplinary nature of challenges posed by sustainability at a more advanced mathematical level could provide a “capstone” experience, drawing together an array of students from science, technology, engineering, and mathematics disciplines. Sustainability programs also provide a natural context for mathematical scientists to collaborate with faculty from other disciplines in developing brief modules that illustrate quantitative approaches to practical issues potentially useful as short components in a wide variety of undergraduate science offerings.
4.2. Data sharing
To engage a broader community of mathematical scientists in studying problems of sustainability, an effective approach is through the sharing of data.
For many mathematical researchers as well as students, an introduction to a new application area comes from reading about a specific problem in a paper or research article. Taking that introduction to the next level involves the generalization or improvement of the approach.
Having access to the data sets for relevant aspects of the human and environmental disciplines is an excellent way to facilitate entry for mathematical researchers not presently engaged in the area. Indeed, new ideas can be tested and benchmarked against existing approaches, as more data becomes available to a larger public of scientists. A broader community of researchers involved in the modeling of sustainability sciences will have multiple benefits, from greater visibility by the public of the issues themselves, to new and potentially better mathematical approaches for solving existing problems, to tackling more complex and far-reaching issues in those areas.
Making data sets available to the community can be done in both a centralized and a decentralized manner and most likely both approaches are needed. Centralized approaches would include the various professional societies hosting a website repository either for the data sets themselves or for links to data sets stored elsewhere. Decentralized approaches include individual researchers or university departments/laboratories hosting such websites or via the various social networking platforms.
The data sets in question should be broad and cover aspects central to traditional areas of sustainability science as well as those presently on the fringes. Examples of data from the traditional areas include those covered in this document: fishery data, historical weather (climate) data, consumption levels, reported forest fires and their characteristics over time, rainfall, sea levels, and other environmental variables covering numerous parts of the world, over significantly long time periods.
Furthermore, studying the above factors in the context of other human-environmental systems is particularly important for moving sustainability science forward and for drawing in more mathematical researchers. Examples of data sets from outside these core areas include human land-use data such as is used in economic studies, water and energy distribution networks and their characteristics, water and energy consumption levels and system failures, etc, transportation-related data such as network connectivity, travel demands and costs, and health-related data such as incidence of various diseases over time and in different locations across the country and the world.

127 | P a g e
In some cases, these data sets may come from researchers who have engaged with clients, cities, regions and governmental organizations and have the ability to then post (potentially anonymized) versions of the data on their own or other websites. However, it is desirable to reach out to the agencies, cities, and organizations themselves to make such anonymized data available.
An example is a city making its traffic data readily available (e.g. as a data feed) to the public for the sake of encouraging the development of new technologies. In this way, the traffic data may be used by research scientists for studying impacts of traffic on, for example, public health or other environmental systems, or the impact of other factors on traffic. Similarly, a hospital or regional health agency which regroups multiple hospitals could publish online daily or weekly data on the diseases that they are treating to allow researchers to develop the models that link those diseases to other systems that are present in the same geographical area.
We also need to develop standards for sharing data at different scales without compromising private or proprietary information. One possibility would be a standard for “scrambling” data in a way that allows models to be first tested on scrambled data.
4.3. Model linking and sharing
While the sharing of data sets may be a precursor to encouraging the entry of many mathematical researchers into studying the problems related to sustainability, taking it a step further involves the sharing of mathematical models themselves. The challenges of studying sustainability are daunting. The ability to communicate openly about how models work, to use outputs from one model as inputs into another, and to integrate systems that may have interacting feedback promises to be a valuable, if not indispensable, goal.
Web platforms where models as well as data can be shared have the potential to foster valuable dialogue, and to lower substantially the barriers to entry to mathematicians who want to work on these relevant questions. Specifically, whereas we discussed the goal of having publicly-available data sets online, we can take that notion a step further to the goal of having models online which can be run by other researchers across the globe; in that way, other researchers could use those model outputs as input into their own, related models. This would bring us dramatically closer to the development of “models of models” or “systems of systems,” both of which are critical components of the study of sustainability and the human-environment interactions.
Some effort has already been made in this direction, including at least successful online collaborative projects to prove mathematical problems such as open theorems (Castelvecchi, 2010, and Rehmeyer, 2010), as well as the models used for predicting weather (WRF) but much more can be done.
In particular, we should encourage standard formats for describing models and expressing their inputs and outputs that would allow for such links. Models must be documented to be usable by others, but many already are through the academic papers that their authors publish and present at conferences. What is missing today is an online version, not of the paper text, but of the functioning models, allowing other researchers to test and use them.
As with data sets, “live” models can be hosted in various locations, in central repositories, or on individual researchers’ websites or social networking sites, and can be open in the sense of making source code available, or, when necessary, can be

128 | P a g e
available in executable form only. In both cases, a valuable service would be provided to the scientific community to make these live models available and a significant increase in the complexity of the research would be expected to follow. With that would come new problems, new challenges and presumably new discoveries.
5. Challenges
The importance of engaging a wider community to work on sustainability challenges, including the ones highlighted in the examples above, can hardly be overstated. To this end, we suggest the creation of specific Challenges to the community of mathematical scientists. We define a Challenge to be one of two types: a Competitive Challenge and a Grand Challenge. In short, both encompass a set of problems intended to stimulate research and attract the attention of mathematical scientists in different fields to work on these important questions. 5.1. Competitive challenges
By “Competitive Challenges” we mean contests open to anyone, and often with some prize to the winners, to solve a well-defined mathematical problem. One example is the Netflix challenge to predict individuals’ movie preferences; this competition generated significant attention and culminated in a million-dollar prize three years after its inception. Other successful examples of competitive challenges include the ACM KDD Cup which sponsors competitions each year (including an early version of the Netflix contest) and more recently the IEEE ICDM contest, both of which challenge scientists to solve prediction-type problems from domains as diverse as protein structure to urban traffic congestion. In the operations research community, the French OR society ROADEF sponsors the ROADEF/EURO Challenge each year, in which a problem defined in conjunction with an industrial partner is posed to the research community, roughly a year is given to any individual or team to solve the problem, and finally, prizes provided by the sponsor to the winning team. Another example is the engineering competitions such as the steel bridge building competition sponsored each year for undergraduate and graduate students and their professors by the American Society of Civil Engineers and the SAE Formula student design competition and its recent cousin the Formula Hybrid competition for designing next-generation race cars and plug-in hybrid vehicles.
Developing a Competitive Challenge for the general mathematical sciences is in itself a challenge but the attention that it would generate for the discipline would be significant. Competitive challenge problems related to sustainability can come from those discussed in the Examples section of this document or others. The primary steps needed in developing a Competitive Challenge for problems related to sustainability are the identification of a sponsor organization and, where possible, an organization to provide data and potentially prize money. The identification of the sponsoring organization helps to drive in many cases the definition of the competition problem to be solved. 6. Mathematical Recommendations • Develop optimization techniques that can address the kinds of management
problems arising in studies of sustainability in the face of uncertainty, including stochastic optimization and other approaches.

129 | P a g e
• Extend Bayesian and related methods for parameterizing models under uncertainty, including multiple, linked models, and for propagating uncertainty in models used for making large-scale predictions
• Develop dynamical systems methods for robust prediction of long transient phenomena and to help understand the effects of different types of feedback in complex systems.
References
1. Fuller MM, Gross LJ, Duke-Sylvester SM, Palmer M (2008). Testing the robustness of management decisions to uncertainty: Everglades restoration scenarios. Ecological Applications, 18: 711-723.
2. Liebhold A, MacDonald W, Bergdahl D, Mastro V (1984). Invasion by exotic forest pests: A threat to forest ecosystems. Forest Science, 30: a0001-z0001(1).
3. Castelvecchi D (2010). Problem solved, LOL: A complex tic-tac-toe puzzle falls thanks to blog comments. Scientific American, March 17.
4. Hof J, Bevers M, (200). Direct spatial optimization in natural resource management: Four linear programming examples. Annals of Operations Research, 95: 67-81.
5. Hof J, Bevers M (2002). Spatial Optimization in Ecological Applications, Columbia University Press, New York.
6. Parija G, Kumar T, Xi H, Keller D.(2007). Strategic planning of preparedness budgets for wildland fire management. IBM Journal of Research and Development, Business Optimization, 51(3/4)..
7. Rehmeyer J (2010). Massively collaborative mathematics. SIAM News, 43(3): April.
8. Rideout DB, Kirsch AG (2002). [Unpublished], Optimal Deployment for Initial Attack in Support of the Fire Program Analysis (FPA) Preparedness Module (Summary Report of Preliminary Progress).
9. WRF: Weather Research and Forecasting Model, http://www.wrf-model.org/index.php
10. Thornley JHM, France J (2007). Mathematical Models in Agriculture: Quantitative Methods for the Plant, Animal and Ecological Sciences, CAB International, Wallingford, UK.

130 | P a g e
Appendix 5: Mathematical Challenges in Energy Sustainability
Authors: Rene Carmona (Princeton University) Doyne Farmer (Santa Fe Institute) Irene Fonseca (Carnegie Mellon University) John Guckenheimer (Cornell University) Geoffrey Heal (Columbia University) Warren Powell (Princeton University) David Waltz (Columbia University) Hank Warchall (NSF) Charge to the Group Energy is at the heart of modern life, but it has crucial connections to a sustainable life on the planet. The theme of this group is to investigate sustainable energy pathways, to look at the entire pathway from production to storage to distribution to conservation to environmental impact. The group should consider mathematical challenges in all phases of the energy system, from how best to generate energy, to how to store it so it is available when needed, to how to transmit and distribute it effectively and efficiently, to how to conserve it.
Introduction
This white paper focuses on the identification of a set of mathematical goals, strategies, cross-cutting themes and research questions prompted by the challenges posed by the apparent conflict between the ever-growing appetite for energy of a modern society and the imperative need to rely on sustainable production methods. We will discuss and identify areas where investments should be made in research and education in the mathematical sciences that will better position this and future generations to attain this sustainability goal.
Energy research cannot be carried out completely within traditional vertically integrated academic structures. It requires interdisciplinary collaborations that bridge computer science, engineering (electrical, mechanical, civil, biomedical, financial, environmental, etc.), finance, law, business, natural science (physics, biology, chemistry, etc.), medicine, public policy, and others, glued and kept together by mathematics. This will require new funding mechanisms and new ways of organizing research.
Main Goals and Societal Issues We identify the following objectives:
• To reduce environmental impact of energy production and consumption. This objective should be attained while maintaining and possibly improving standards

131 | P a g e
of living despite possible cuts in energy usage. See for example the discussion of greenhouse gas emissions discussed later.
• To improve the security of supplies} and increase energy independence by stabilizing and robustifying energy sources to terrorist attacks and natural disasters.
• To aim at a more socially equitable distribution} of the benefits of energy consumption, and control the socio-political impacts of the current dependence of most of the sectors of the economy on oil production.
• To stimulate and encourage the young generations of talented researchers to get engaged in sustainability issues.
Regardless of the order in which we prioritize these objectives, a clear sense of urgency emerges: we must act now, we cannot afford to wait. Energy investments are highly capital intensive. Both long-term and short-term energy investments incur significant risks, which can be mitigated using modern (hedging) strategies. How do we design these instruments, and what are the implications in terms of managing risk?
Strategies In order to design strategies and balance these goals, the following questions need to be addressed:
• How can we reduce usage while maintaining and even increasing standards of living? How do we quantify externalities and put figures on the impact on quality of life?
• How do we transform supplies? By introducing new sources? By better managing existing ones? How can that be done with minimal impact on the environment?
• How can we optimize efficiency?
Computation is increasingly essential to all aspects of our lives. We are on the cusp of achieving very significant improvements in the energy consumption of computation in terms of “millions of instructions per second per watt.” Significant sources of gain will come from dramatic improvements in the efficiency of standalone computers-- processor efficiency, wireless radio efficiency, display efficiency, sleep modes, etc.
Another area of potential gain involves the development of entirely new computational algorithms that have energy minimization as a goal. Since the dawn of computing, we have analyzed and optimized algorithms for their running time and memory usage requirements. We have come to understand tradeoffs between these two -- it is often possible to improve running time at a cost of memory space, and vice versa. Energy consumption represents a third dimension.
Mathematical Challenges We now consider the different kinds of new methods and investments that need to be made in order to enable the development of new mathematics necessary to tackle issues raised by sustainable energy. Right at the onset, it is important to emphasize that, while mathematics is the underlying discipline that cuts across theory, modeling, simulation, understanding and prediction of sustainability issues, across all energy

132 | P a g e
sectors, mathematicians are too often treated as junior partners, “the technical consultants” instead of the science drivers. This needs to change.
In the following discussion of mathematical areas of research we identified Three Cross-Cutting Themes: a) Uncertainty, b) Multiscale and Mixed Methods, and c) Model Evaluations.
Uncertainty The stochasticity of energy supply and demand and the need to reduce environment impact and increase energy independence demand the development of new mathematical tools to • deal with uncertainty; • address how multiple time and spatial scales enter in this quantification; • treat coarse-grained and fine-grained uncertainties; • deal with heavy tailed distributions and the associated measures of risk; • build models to describe rare but disruptive (natural) events; • solve complex design and control problems in the area of stochastic optimization to
include: o long term policy models; o the power/smart grid (conservation, control, engineering); o energy storage; o market mechanisms and agent based models in the portfolio of tools used to
control green house gas emissions, discussed below.
Multiscale and Mixed Modeling In this area new initiatives are needed to
• continue and enhance the development of theories of Partial Differential Equations (PDEs) and Stochastic Partial Differential Equations (SPDEs) for specific purposes such as microstructural optimization, sustainable technologies, and the design of new materials for energy conversion (batteries, fuel cells, etc.);
• develop mixed models for climate, ocean, macro/micro economics; • design and study networks (edges + nodes; e.g. power grid, transportation, etc.)
at different scales; • create new statistical models to accommodate stochastic factors; • design and manage sensor technologies to collect data more efficiently.
Model Evaluation One of the major issues is the validation/invalidation of models, especially in the
absence of a ground truth. Clearly, one needs new tools in PDEs/SPDEs to validate the simulated design of novel energy high-impact materials and physical devices, complex models, climate, economy, atmospheric, ocean. Can we use historical back testing for this purpose? Also, how should we design and implement assessment/metrics?

133 | P a g e
Sample Research Areas Driven by Energy and Climate Change Challenges
Below we identify a series of research areas that hint at the broad range of problems that need advances in mathematics. These include
• Greenhouse gas emissions control and public policy • Development of new energy sources • Transforming energy sources • Uncertainty and energy investment portfolios • Uncertainty and climate change • Stochastic optimization, statistics and machine learning • Simulation of complex systems
Greenhouse Gas Emissions Control and Public Policy Countries and organizations have already taken drastic actions to fight global
warming. Most of the proposed solutions include increasing energy efficiency and conservation, examining the potential for capture, sequestration and storage of carbon, expanding the production of renewable energy, and even reviving nuclear energy production. Most of the proposed strategies include market mechanisms for carbon dioxide emissions. In a typical cap-and-trade scheme, the regulator allocates a number of tradable credits (permits to emit carbon dioxide CO2) to the responsible installations, and at pre-settled compliance dates; each source must have enough allowances to cover all its recorded emissions or be the subject of significant penalties. The rationale for such a system is that the exchange of allowances between agents through trading will minimize the overall social costs since companies that can easily reduce emissions will do so, and those for which it is harder will buy credits. For this reason, cap-and-trade systems are touted as a tool of choice to reduce pollution in a cost efficient way.
Such markets do exist. After a first unsuccessful attempt to impose a wide tax on energy and carbon in the early 90's, the European Union (EU) undertook an ambitious effort to correct for its first market failure, and tried to address the reduction of emissions of carbon dioxide (CO2) by such a cap-and-trade system. Unfortunately, the results of the implementation of the first phase of the European Union cap-and-trade Emissions Trading Scheme (EU ETS) were not satisfactory, mostly due to poor planning by the regulators. Emission markets also exist in the U.S. (e.g. for SOx and NOx), and some regional markets for CO2 are mandatory (e.g. RGGI). A good understanding of their inner working (costs and efficiency) is crucial.
Stochastic models for the optimal behavior of profit maximizing electricity producers have been proposed and equilibrium prices for electricity and carbon tax have been derived by optimization and game theoretical arguments. Finding the right schedule of certificate allocation to guarantee that emissions targets are reached is a very difficult inverse problem which the regulators of the European Union did not solve well in their first trial. Carmona, et al (2010) tackle these issues and highlight the role of mathematical analysis in public policy decision making.
In the U.S., the debate became increasingly politicized to the point that the use of the word cap-and-trade equated to a political suicide in some circles. There is not a single politician who does not have strong opinions on the crucial issue of the design of emissions markets. However, not many of them understand what they are talking about,

134 | P a g e
and research and education are sorely needed in this context. This should offer a chance to applied mathematicians to weigh in on this important debate.
Development of New Energy Sources The development of non-hydrocarbon-based energy sources is central to the
sustainability of technologically advanced civilization (MacKay, 2009). There are a wide variety of areas of research aimed at developing or improving such nontraditional energy sources. Some mathematical challenges in fundamental research for the discovery of new physical mechanisms for energy sources include:
• Modeling and simulation of multi-scale, multi-physics systems • Development of computational chemistry • Nanoscale modeling for materials-by-design • Data assimilation in phenomenological models • Exploration of data in large parameter spaces
The energy-source research areas listed below will profit from increased involvement of mathematical scientists in mathematical modeling, simulation, data mining, and optimization, used in the design of materials, simulation of chemical processes, and device design.
• Electricity Generation o Wind: blade materials and design, generator design, power conditioning o Solar: photovoltaic, semiconductor, organic, nanostructure, new phenomena,
concentrated solar photovoltaic (solar concentrators), concentrated solar power (alternative working fluids, high-temperature materials), distributed solar thermoelectric
• Chemical: fuel cells • Hydropower: turbines, micro-turbines, advanced water power (waves, tidal) • Thermoelectric processes • Energy Storage: batteries, capacitive, salts, phase change materials, flywheel,
microturbines, pumped fluids, compressed air energy storage, water splitting / water assembly
• Energy Distribution & Transmission • Power Electronics: high voltage components, power systems, distributed
generation, electric vehicles, smart grid • Fuels o Hydrogen: water splitting, photocatalytic, photoelectrochemical, solar thermal
decomposition of water, photobiological and other chemical hydrogen production technologies.
o Nuclear power (e.g. fusion, fission, materials for extreme environments)
In the following section, we outline examples of specific mathematical investigations that are poised to make significant impact in transforming sources of energy.
For examples of U.S. National Science Foundation funding of some solar energy research projects that involve collaborations between chemists, materials scientists, and mathematical scientists, see the award list for the NSF CHE-DMR-DMS Solar Energy Initiative (National Science Foundation, 2010).

135 | P a g e
Transforming Energy Sources Mathematical research on new materials is key to generate clean and renewable
energy and to help manage problems from existing energy sources. Partial differential equations, the calculus of variations, continuum mechanics and numerical analysis, among other mathematical areas, are well positioned to address these challenges.
Mathematics and Managing of Existing Supplies Carbon Sequestration: The computational mathematics community has had a
huge impact on enhanced oil recovery techniques by developing efficient and accurate models of multiphase flow through porous media. Darcy and Buckley-Leverett equations for the flow in porous media have been used in Glimm, et al (2004). The new problem of carbon dioxide subsurface reservoirs involves many of the same issues, but with additional complexities inherent from the underlying chemistry.
Cellular and Granular Networks: These are ubiquitous in nature. They exhibit behavior on many different length and time scales and are often found to be metastable. The energetics and connectivity of the ensemble of the grain and the boundary network during evolution plays a crucial role in determining the properties of a material across a wide range of scales. Questions that arise include: What is the nature of patterns? One view is that patterns are stable statistics of metastable systems. Can we predict the pattern dynamics and the evolution of the microstructure? The challenge, from this perspective, is to understand how to identify and validate such statistics, and to use them for predictive theories (see Barmak, et al., 2008).
Mathematics and Design of New Materials for Sustainable Energy and Energy Conversion
Energy Conversion: Electro-chemical systems such as batteries and fuel cells require the transport of electrons, ions and multiple fluids in a controlled manner, through a multiphase arrangement (electrodes and electrolytes each of which may itself be a multiphase system). Further, important reactions occur at triple junctions or in the presence of catalysts, ionic conductors may not be good electronic conductors, etc. There have been dramatic improvements in individual components in recent years, but this has not been manifested at the macroscopic/device level. It is here, in the design of new materials for energy storage and conversion, that microstructure optimization will make a fundamental contribution.
Recently, the prediction of hysteresis has acquired fresh significance in connection with materials for energy conversion, since the efficiency of a conversion process often depends on the size of an associated hysteresis loop. For a solid-to-solid phase transformation, thermal hysteresis refers to a transformation temperature on cooling that differs from that on heating. Hysteresis also occurs during stress-induced transformation, with the stress needed to induce the forward transformation being different from that causing the reverse transformation. Moving forward in this area will require theoretical progress and experimental verification.
Nonlinear analysis and sharp interface models will play a pivotal role in this area (see Delville, et al, 2011, Zhang, et al. 2009).
Photovoltaics: This a method of generating electrical power by converting solar radiation into electricity using semiconductors that exhibit the photovoltaic effect. Here one wants to maximize photon paths (to maximize the probability of capture) but

136 | P a g e
minimize electronic paths (to avoid recombination). This technology is used in remote locations where cost-effective access to local power grids is not possible.
Quantum Dots: One of the energy goals of nanomaterials is to achieve better energy conversion efficiency in portable power, solar cells and solid state lighting. The devices include composite materials and quantum dots, both areas of intense mathematical interest, from the description and understanding of wetting phenomena to the rigorous prediction of island shapes (pyramids, domes, barns) which, in turn, determine the technological properties of the material (see Fonseca, et al 2007 ).
Shape Memory Materials: The typical procedure in the mathematical analysis of materials is to start with a material, describe its constitutive laws and equilibrium states, predict the microstructure and macroscopic material behavior, and then compare with experiment. The inverse procedure leads to the development of new materials. Indeed, new ferromagnetic shape-memory materials have been created in this way, beginning with a theoretical concept of an interesting property or effect, formulating the material response via energy minimization or a dynamical theory, proposing a hypothetical material and going to the laboratory to actually make the material. This inverse procedure can lead to entirely new materials that might not have been anticipated by purely experimental approaches. James and Wuttig followed this approach to produce a new material that exhibits, under moderate field, about 50 times the field-induced strain of giant magnetostrictive materials (see Bhattacharya , et al, 2009, James and Wuttig, 1998).
Ultracapacitors: These are electrochemical capacitors that have an unusually high energy density when compared to common capacitors (e.g. on the order of thousands of times greater than a high capacity electrolytic capacitor), and have a variety of commercial applications (e.g. as energy storage devices used in vehicles). The underlying mathematical modeling uses the Nernst-Planck-Poisson equation, commonly applied in describing the ion-exchange kinetics in solids, and is still poorly understood.
Uncertainty and Energy Investment Portfolios As another example containing challenging mathematical problems, we consider
the problem of choosing investments for production of new sources of energy, for example low-greenhouse gas methods of generating electricity. This is an example of the very general problem of constructing research and investment portfolios.
Assume all sources under consideration are substitutable (e.g. that they are all roughly the same in terms of their environmental impact). Assume a given set of probabilistic forecasts for the cost of each technology as a function of the cumulative production investment made in each technology, and that there is uncertainty in both the parameters as well as the future costs if the parameters are known. The goal is to construct an investment schedule that maximizes the time-discounted utility, where the time discounted utility function gives greater weight to costs on shorter time horizons and prefers certainty over uncertainty.
This problem is inherently nonlinear due to the dependence of the cost on the investment. Unlike standard portfolio theory as normally applied in finance, diversification is not necessarily favorable. This is because the rate of progress for a given technology increases as more is invested in that technology, and so if the cost as a function of investment is known, one should simply invest everything in the best technology. But with uncertainty one does not want to take the risk of making a bad bet
137 | P a g e
on a single technology. Because of the strong nonlinearities, there may be a very large number of local maxima.
The problem is also complicated by additional issues that arise in realistic situations: • The noise (i.e. the uncertainty in future costs if parameters are known) has heavy
tails and possibly long memory. • The response of technologies to investment may be correlated across
technologies, e.g. an improvement in the structural material for one technology may also help another technology.
• Such models are difficult to calibrate. Even worse, there may be Knightian uncertainty (ambiguity), i.e. we may not know the correct probability distributions and we may want to understand the robustness under variations in the assumptions.
A few interesting questions: • What are the best numerical methods for finding good solutions? • How does the number of technologies one should invest in depend on the
properties of the problem (e.g. total number of technologies, level of uncertainty, learning rates, nature of the utility function, correlations, heavy tails)?
• Which parameter regimes have robust solutions, and which have unstable solutions?
Uncertainty and Climate Change Economists, following Frank Knight, distinguish between risk and uncertainty.
Risk occurs when we have a stochastic outcome following a known probability distribution (the toss of a fair coin): uncertainty occurs when we don’t know the distribution (rolling an unfair dice when we have no historical record of its outcomes). The word ambiguity is now used to refer to these situations of uncertainty, i.e. stochasticity without a known probability density function (pdf). Take climate change: there is a wide range of estimates of key parameters such as the climate sensitivity s (the equilibrium temperature response to a doubling of CO2). Such a diversity raises the question: what assumption about the probability density function over outcomes should a decision-maker maintain, if any? There are several competing approaches.
One is to combine the probability density functions from the various underlying models following a Bayesian approach. A competing approach is to recognize that there is no single distribution over outcomes and to work with a second order probability distribution over the different models, so that pi is the probability that the i-th model is the correct model. In this approach it is assumed consistently with many experimental studies of human behavior that decision-makers are ambiguity-averse so that their payoff is the expectation according to the second order probabilities of a concave function of the expected outcomes of the various models. There are several competing axiom sets that seek to provide a basis for this type of approach to decision-making under ambiguity, following a generalization of the approach in Savage’s Foundation of Statistics (see e.g. Klibanoff et.al. (2005) or Schmeidler (1989).
This issue occurs not only with climate change, but also in a wide range of situations of relevance to sustainability. We frequently face stochastic outcomes without well-defined pdfs, and often have competing models with divergent predictions. This is true for the impact of genetically modified organisms, the availability and costs of

138 | P a g e
different energy sources at future dates (will fusion be available, will large-scale storage devices be available, etc.), and many others. In all these cases we lack a widely-agreed-upon framework for making decisions.
Stochastic Optimization, Statistics and Machine Learning There are numerous problems in the design and control of energy devices,
networks and markets that need to be modeled as sequential decision problems in the presence of different forms of uncertainty. Decisions include storing/withdrawing energy from a battery, determining which energy generators to use each hour, how to price recharging stations for electric vehicles, optimal maintenance of grid components, optimal load curtailment to meet grid capacity constraints, design of energy investment portfolios and robust design of the power grid. Other stochastic optimization problems arise in laboratory environments: how to sequence the testing of new compounds, optimal design of experiments, and optimal sampling of materials and processes to obtain the best performance from new materials for converting biomass.
Stochastic optimization is an intrinsically difficult problem, as it involves the sequential choice of decisions (controls), followed by observations of new information, followed by more decisions. Unless the problem has special structure, the research community has focused on three broad strategies: 1) lookahead policies, which include tree-search and stochastic programming (Birge and Louveaux, 1997), 2) policy function approximations, which involves searching within a well defined class of functions, and 3) policies based on approximating the value function in Bellman’s equation.
We do not have general purpose algorithms for finding optimal policies, and we often struggle even to find good policies. The field of approximate dynamic programming (known as reinforcement learning in computer science) blends simulation, deterministic math programming and machine learning (to approximate the value function), producing some successes (Bertsekas and Tsitsiklis, 1996, Powell, 2007, Sutton and Barto,1998). There is active research in the design of all three types of policies listed above. The complexity of lookahead policies grows exponentially with the number of time periods. Policy function and value function introduce the difficult challenge of specifying and fitting functions, introducing a range of challenges to the statistics and machine learning communities (Hastie, et al 2009). This discussion ignores important modeling issues in the handling of uncertainty. For example, electricity prices are easy to quantify, but are not described by standard Gaussian distributions and have been found to be heavy-tailed (infinite variance), which means that you cannot compute an expectation. There are a number of instances where we would like to introduce risk as an explicit constraint, such as the risk that we will not meet a renewable target, or the risk that we will overuse a backup diesel generator. There are also problems where the uncertainty is hard to model, such as the likelihood that Congress will pass a tax on carbon or that there will be a breakthrough in batteries.
For the near term, there is active research simply to solve narrow problem classes. A longer term goal is to develop robust, general purpose tools that solve broader problem classes. For example, parametric approximations of value or policy functions are the easiest to estimate, but introduce an undesirable manual step in the design of these functions. Nonparametric techniques offer considerable generality, but these are harder to use and still struggle with functions with even a modest number of

139 | P a g e
dimensions. Policy optimization introduces the complex interaction between observing the value of a suboptimal policy, and finding better policies. There is a vast array of applications in the analysis of energy systems, economics and policy which require the tools of statistics and machine learning to infer relationships from observational data. We may need to understand the performance of different molecular compounds in terms of converting solar energy, the status of different components in the grid for a utility, the response of households to changes in electricity prices, or the energy from sun or wind. Statistics arises within algorithms, where we may have to estimate the value of being in a state and following a policy.
Statistical challenges come in many forms. For many spatial applications, we need to estimate fine-grained behavior from coarse-grained observations. For example, how can we predict the anticipated energy production from a particular wind farm using observations from weather stations? We may have to estimate high-dimensional functions (such as the price of energy at a node as a function of supplies, demands and weather around the network), in some cases with relatively little data (the big p, small n problem). We often have to estimate functions with complex structures, such as the amount of energy to put into storage from wind as a function of wind, demand, prices and their histories. Machine learning researchers use a variety of statistical learning methods, e.g., support vector machines (SVMs) and boosting, together with kernel transformation methods, but this is an active research area with good opportunities for mathematical contributions. A popular area of research in statistics is in the general area known as nonparametric statistics and locally polynomial regression. Such methods typically approximate functions using a weighted sum of observations, where the weights are given by kernel functions which put a higher weight on closer observations. Such strategies suffer from the curse of dimensionality, since the likelihood of having a reasonable number of observations within close proximity drops very quickly as the dimensionality of the observation space grows.
There are many problems where observations are expensive, and we have to collect information efficiently, an area that falls under names such as active learning and optimal learning. Given limited resources, when and where should we measure wind velocities, ocean temperatures, or test the performance of an energy saving technology in a building? The problem of finding optimal information collection policies is computationally intractable, and as a result research is needed to test the efficiency and accuracy of different approximations. Optimal learning policies need to be developed that work well in the context of the characteristics of the problem (dimensionality of the explanatory variables, nature of the belief structure). A continuing problem in statistics is the vast plethora of models and statistical estimation techniques, without a single, dominant method (see Hastie, et al, 2009). Scientists have developed methods such as ensemble models and boosting to combine the best results from different models. Energy scientists need robust methods to solve their learning problems to avoid turning every statistical estimation problem into a research project.
Simulation of Complex Systems Simulation is an important technology for studying energy and many other
systems. Here we discuss the relationship between the structure of a complex system and its dynamics.
There are many aspects of this question that form whole research areas by themselves. Spatial pattern formation in fluids, reaction-diffusion systems and similar

140 | P a g e
settings based upon partial differential equations are one example. Dynamical systems with an underlying network structure are an area of vigorous research activity at this time. Some of the earliest work in this area investigates synchronization. Huygens observed pendulum clocks hanging from a wall that synchronized with one another due to their weak coupling through vibrations of the wall. In what other circumstances do collections of weakly coupled oscillators synchronize with one another? Theories have been developed for symmetric networks of oscillators. Nonetheless, the question of synchronization remains an important one in pragmatic terms involving energy. The power grid seeks to synchronize oscillations throughout the grid.
The relationship between structure and dynamics is of particular interest in the context of networks. Are there quantities we can measure about the structure of a network that will allow us to make predictions of various features of a dynamical process on that network? Is the network design of the power grid inherently prone to instability that would be ameliorated by new power lines that increase the connectivity of the grid? The general problem is a clear bottleneck in current networks research. We have a mountain of data and expertise about structure. We have measures, models, vast data sets, and a well-developed theory of many aspects of network topology. But we have relatively little understanding of dynamical processes on networks. We would very much like to leverage our knowledge of structure to say something about dynamics, but at present, with a few exceptions, we don't know how to do this.
The "blue sky" dream is that, presented with substantial data about the structure of a network and with a definition of the dynamics taking place on it, we could measure some gross summary statistics of the structure and from the results of those measurements make quantitative predictions about the dynamics. Examples might include deriving equations of motion for coarse-grained variables, summary statistics for the dynamics, or extreme value statistics. Applications could be widespread. In the case of the power grid, as large numbers of small solar devices and turbines are added to the generating capacity of the system, coarse graining is needed to operate the system reliably. There are few systematic tools for coarse-graining dynamics on (possibly directed) graphs with very inhomogeneous topologies. One of the questions about networks that is being studied intensively is how the statistical properties of connectivity in a large network influence the rate at which information (or disease) spreads across the network. We do not know at this time which complex system structures are the important ones for science and engineering, so exploratory research on many possibilities is appropriate. Following Wigner's famous title about the unreasonable effectiveness of mathematics in science, those structures that give rise to extensive mathematical theory may prove to be the most useful.
The role of structure in shaping the dynamics of complex systems is in part an important modeling issue. The example of hybrid dynamical systems illustrates this issue in the context of engineering problems. Hybrid dynamical systems combine continuous and discrete components, possibly in both space and time. There is no standard definition of a hybrid system, and that impedes progress on the topic. A simple example of a hybrid system is a discontinuous vector field that reaches an impasse or deadlock along a boundary. Think of a thermostat that regulates the temperature in a room by turning a fan off or on. At the set point for the thermostat, the room will heat up if the fan is on and the temperature will fall if the fan is off. How should the system evolve at the set point? This is a modeling issue, with answers that depend upon the context in which

141 | P a g e
the discontinuous vector field arises. Three sources of an impasse come from (1) reduction of models with multiple time scales to the slow time scale, (2) mechanical systems with impacts and (3) the design of controllers like thermostats or relays that have switches. Each of these settings suggests a different resolution of the impasse, and the dynamics observed in each case is also qualitatively different. Thus the dynamics of a hybrid dynamical system depend upon the structure embodied in the details of how the continuous and discrete time components of the system are modeled. Theory that classifies the different possibilities and characterizes the dynamics of systems that are generic in each context would be very useful in engineering complex systems.
The interplay of theory, experiment and computation will continue to be important for the study of emergent properties of complex systems. All are needed in the discovery of unifying principles that explain how, where and why emergent properties arise. Empirical data is the beginning and the end: we want to understand and engineer the real world. Simulation is an important tool for detailed study of specific models. With diverse models from the abstract to the highly detailed we can explore the origins and characteristics of emergent properties. Still, many simulation models are sufficiently complex that they are difficult to analyze, so we need theory to provide a guide that helps us interpret and organize simulation results. Theory also directs our attention to interesting phenomena that might otherwise be overlooked, often by highlighting the structural similarities between different systems.
Research programs on complex systems should maintain a balance for the mutual contributions of theory, experiment and computation. Support for the engineering and operation of complex systems that we increasingly rely upon in our daily lives should recognize the value of cross-cutting principles even in work focused upon a particular system.
Sample Recommendations Here we list recommendations on research and training activities in the mathematical
sciences that should be promoted in light of the above discussion. The recommendations are directed at various groups: Mathematics Institutes and Scientific Societies:
• To broaden the partnership of scientific societies involved in the current joint effort to promote mathematical research toward sustainability. The engagement of the Institute for Mathematical Statistics (IMS), the American Statistical Association (ASA), the Society for Industrial and Applied Mathematics (SIAM) and of societies such as INFORMS (Institute for Operations Research and the Management Sciences) and IEEE (Institute of Electrical and Electronics Engineers) with a broad international footprint is pivotal. There is also a clear need to reach out and involve national mathematical societies all over the world.
• To organize multi-year research and training programs where undergraduate and graduate students as well as postdocs could return year after year. It is important to make sure that these programs engage regulators, policy makers, international institutions and industry representatives.
142 | P a g e
Institutions of higher education and the research community: • To develop curricula that encompass energy education; • To encourage the development of international collaborations on energy related
issues.
The final set of recommendations is a sample list of areas of mathematics and specific topics of research whose development would significantly enhance the role of mathematicians in achieving sustainable energy production for a modern society:
• Stochastic optimization of complex, dynamic systems: e.g. for storage, R&D portfolio optimization, grids, generators, users;
• Incomplete economic models and stochastic games: e.g. for greenhouse gas emissions policy, power generation policies;
• Inverse problems for PDEs and SPDEs for the design of new materials: e.g. for energy production, storage, transmission and conversion;
• Modeling and simulation of multi-scale and multi-physics systems: e.g. downscaling of fluid mechanics equations for wind turbines, thin films, nanoscale materials;
• Optimal sampling for estimation of climate change impact for market response to price signals, understanding new materials, sensor placement.
References:
1. National Science Foundation, CHE-DMR-DMS Solar Energy Initiative, NSF 10-613, Technical report. http://www.nsf.gov/publications/pub_summ.jsp?org=MPS&ods_key=nsf10613
2. Barmak K, Emelianenko,M, Golovaty D, Kinderlehrer D, Ta’asan SA (2004). New perspective on texture evolution. International Journal on Numerical Analysis Models 1(1): 1-18,
3. Bertsekas D, Tsitsiklis J (1996). Neuro-Dynamic Programming, Athena Scientific. 4. Bhattacharya K, Friesecke G, James RD (1999). The mathematics of microstructure
and the design of new materials. Proceedings National Academy of Science 96: 93328333.
5. Birge J, Louveaux F (1997). Introduction to Stochastic Programming, Springer-Verlag.
6. Carmona R, Fehr F, Hinz J, Porchet A (2010). Market designs for emissions trading schemes. SIAM Review 52: 403-452.
7. Delville R, Kasinathan S, Zhang Z, Humbeeck V, James RD, Schryvers DA (2011). Transmission electric microscopy study of phase compatibility in low hysteresis shape memory alloys. Phil. Mag.
8. Fonseca I, Fusco N, Leoni G, Morini M (2007). Equilibrium configurations of epitaxially strained crystalline films: Existence and regularity results. Archives Rational Mechanical Analysis 186: 477537.
9. Glimm J, Hou S, Lee YH, Sharp D, Ye K (2004). Sources of uncertainty and error in the simulation of flow in porous media. Computational Applied Mathematics 23: 109-120.
10. Hastie T, Tibshirani R, Friedman J (2009).The Elements of Statistical Learning: Data Mining, Inference and Prediction, Springer Verlag.

143 | P a g e
11. James RD, Wuttig M (1998). Magnetostriction of martensite. Phil. Mag. A 77: 1273-1299.
12. Klibanoff R, Marinacci M, Mukerji S (2005). A smooth model of decision making under ambiguity. Econometrica 73: 1849-1892.
13. MacKay DJC (2009). Sustainable Energy Without the Hot Air, UIT Cambridge Ltd. 14. Meinshausen M, Meinshausen N, Hare W, Raper SCB., Frieler K, Knutti R, Frame
DJ, Allen MR (2009). Letters: Joint and marginal probability distribution of climate sensitivity and transient climate response. Nature 458: 1158-1162.
15. Powell WB (2007). Approximate Dynamic Programming: Solving the Curses of Dimensionality, J. Wiley and Sons, New York.
16. Schmeidler D (1989). Subjective probability and expected utility without additivity. Econometrica 571-587.
17. Sutton R, Barto A (1998). Reinforcement Learning, The MIT Press. 18. Zhang Z, James RD, Muller S (2009). Energy barriers and hysteresis in martensitic
phase transformations. Acta Materialia 57: 4332-4352.
Appendix: Disciplines vs. Applications: Examples

This material is based upon work supported by the National Science Foundation under Grant No. DMS-1053887. Any opinions, findings, and conclusions or recom-mendations expressed in this material are those of the author and editors and do
not necessarily reflect the views of the National Science Foundation.