math 263 review for exam 3 - university of arizonamath.arizona.edu/~dhh/reviewexam3_sols.pdf ·...
TRANSCRIPT
Math 263 Review for Exam 3
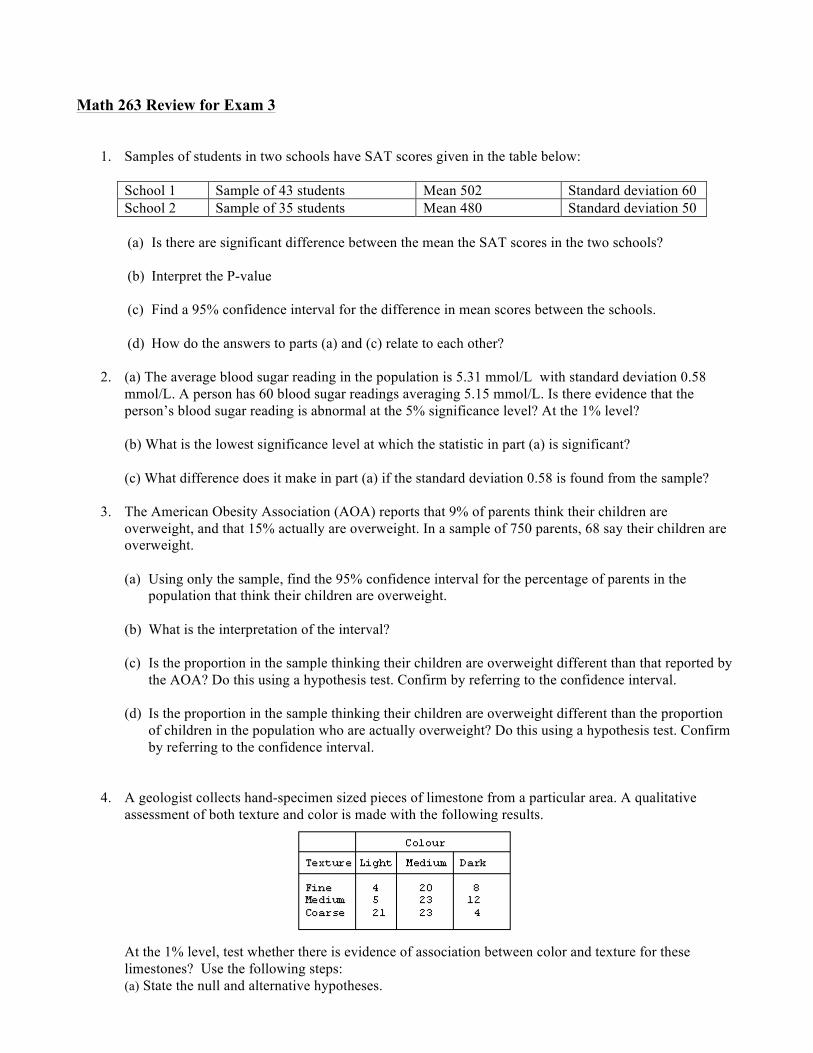
1. Samples of students in two schools have SAT scores given in the table below: School 1 Sample of 43 students Mean 502 Standard deviation 60 School 2 Sample of 35 students Mean 480 Standard deviation 50
(a) Is there are significant difference between the mean the SAT scores in the two schools?
(b) Interpret the P-value
(c) Find a 95% confidence interval for the difference in mean scores between the schools. (d) How do the answers to parts (a) and (c) relate to each other?
2. (a) The average blood sugar reading in the population is 5.31 mmol/L with standard deviation 0.58
mmol/L. A person has 60 blood sugar readings averaging 5.15 mmol/L. Is there evidence that the person’s blood sugar reading is abnormal at the 5% significance level? At the 1% level? (b) What is the lowest significance level at which the statistic in part (a) is significant? (c) What difference does it make in part (a) if the standard deviation 0.58 is found from the sample?
3. The American Obesity Association (AOA) reports that 9% of parents think their children are overweight, and that 15% actually are overweight. In a sample of 750 parents, 68 say their children are overweight. (a) Using only the sample, find the 95% confidence interval for the percentage of parents in the
population that think their children are overweight.
(b) What is the interpretation of the interval? (c) Is the proportion in the sample thinking their children are overweight different than that reported by
the AOA? Do this using a hypothesis test. Confirm by referring to the confidence interval. (d) Is the proportion in the sample thinking their children are overweight different than the proportion
of children in the population who are actually overweight? Do this using a hypothesis test. Confirm by referring to the confidence interval.
4. A geologist collects hand-specimen sized pieces of limestone from a particular area. A qualitative
assessment of both texture and color is made with the following results.
At the 1% level, test whether there is evidence of association between color and texture for these limestones? Use the following steps: (a) State the null and alternative hypotheses.
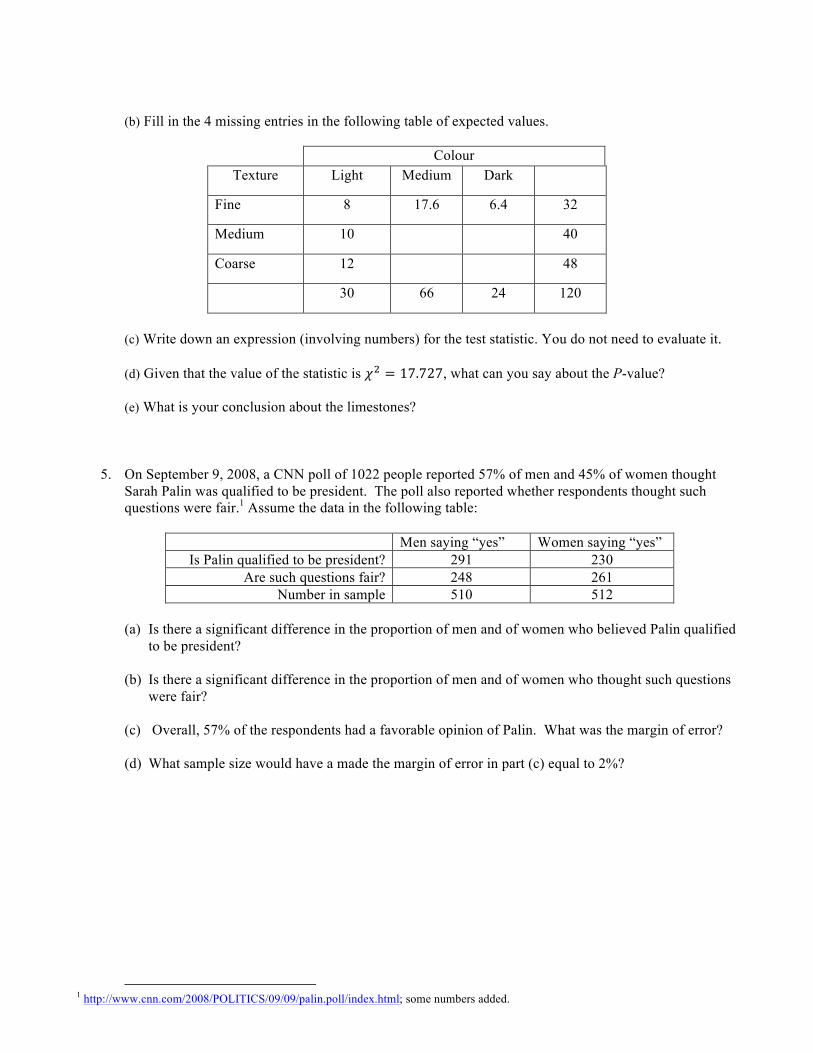
(b) Fill in the 4 missing entries in the following table of expected values.
Colour
Texture Light Medium Dark
Fine 8 17.6 6.4 32
Medium 10 40
Coarse 12 48
30 66 24 120
(c) Write down an expression (involving numbers) for the test statistic. You do not need to evaluate it. (d) Given that the value of the statistic is 𝜒! = 17.727, what can you say about the P-value?
(e) What is your conclusion about the limestones?
5. On September 9, 2008, a CNN poll of 1022 people reported 57% of men and 45% of women thought Sarah Palin was qualified to be president. The poll also reported whether respondents thought such questions were fair.1 Assume the data in the following table:
Men saying “yes” Women saying “yes” Is Palin qualified to be president? 291 230
Are such questions fair? 248 261 Number in sample 510 512
(a) Is there a significant difference in the proportion of men and of women who believed Palin qualified
to be president?
(b) Is there a significant difference in the proportion of men and of women who thought such questions were fair?
(c) Overall, 57% of the respondents had a favorable opinion of Palin. What was the margin of error? (d) What sample size would have a made the margin of error in part (c) equal to 2%?
1 http://www.cnn.com/2008/POLITICS/09/09/palin.poll/index.html; some numbers added.
Math 263 Solutions Review for Exam 3
1. See Class #17 for detailed solutions.
(a)No, with 𝑡 = 1.767, df = 34, and 𝑃-value 8.6%. Cannot reject null at 5% level; not a significant difference at 5% level. (b) Assuming the schools have the same mean, the 𝑃-value is the probability of seeing by chance a difference in means in the samples as large as we saw, or larger. (c) Confidence interval is (−3.4, 47.4). Use 𝑡 = 2.042. (d) Since 0 is in the CI, we cannot reject the null. We do not have evidence for a significant difference in means between the schools.
2. (a) Yes at 5% level; no at 1% level. We have 𝑧 = −2.142,𝑃 = 0.033. (b) This is another way of interpreting the p-value of 3.3%. (c) Need to use t with 59 df instead of z. The 𝑃-value will be slightly different (3.7%) but the conclusion is the same.
3. (a) CI is 0.070, 0.111 = 7.0%, 11.1% . (b) Roughly, there is a 95% chance that the proportion of parents in the population thinking that their children are overweight is between 7.0% and 11.1%. More precisely, the procedure generating the interval has a 95% of generating an interval which contains the population proportion. (c) No; 𝑃-value = 2 0.462 = 92.4%; a pretty big number; don’t reject the null. Confirm by noticing 9% is in the CI (d) Yes, 𝑃-value is approx 0 (the z-value is −4.55); reject null. Confirm by noticing 15% is not in CI.
4.
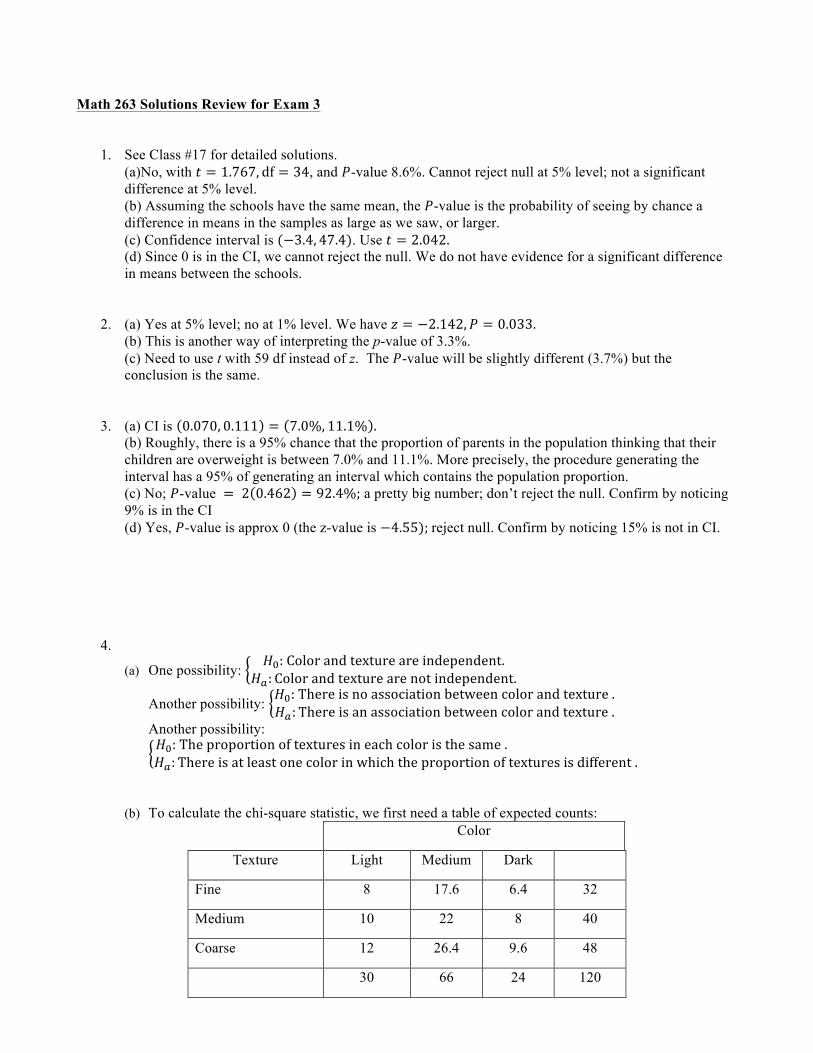
(a) One possibility: 𝐻!: Color and texture are independent.
𝐻!: Color and texture are not independent.
Another possibility: 𝐻!: There is no association between color and texture .𝐻!:There is an association between color and texture .
Another possibility: 𝐻!: The proportion of textures in each color is the same . 𝐻!:There is at least one color in which the proportion of textures is different .
(b) To calculate the chi-square statistic, we first need a table of expected counts: Color
Texture Light Medium Dark
Fine 8 17.6 6.4 32
Medium 10 22 8 40
Coarse 12 26.4 9.6 48
30 66 24 120
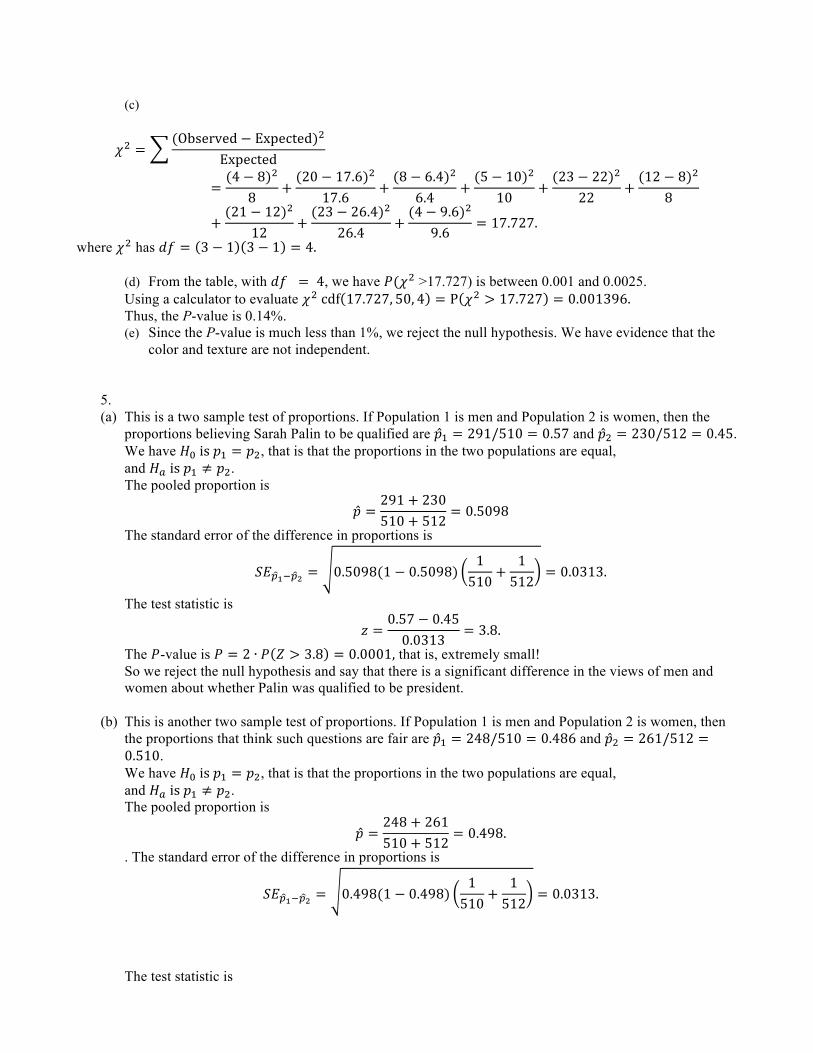
(c)
𝜒! =(Observed − Expected)!
Expected
=(4 − 8)!
8+(20 − 17.6)!
17.6+(8 − 6.4)!
6.4+(5 − 10)!
10+(23 − 22)!
22+(12 − 8)!
8
+(21 − 12)!
12+(23 − 26.4)!
26.4+(4 − 9.6)!
9.6= 17.727.
where 𝜒! has 𝑑𝑓 = 3 − 1 3 − 1 = 4.
(d) From the table, with 𝑑𝑓 = 4, we have 𝑃(𝜒! >17.727) is between 0.001 and 0.0025. Using a calculator to evaluate 𝜒! cdf 17.727, 50, 4 = P 𝜒! > 17.727 = 0.001396.
Thus, the P-value is 0.14%. (e) Since the P-value is much less than 1%, we reject the null hypothesis. We have evidence that the
color and texture are not independent.
5. (a) This is a two sample test of proportions. If Population 1 is men and Population 2 is women, then the
proportions believing Sarah Palin to be qualified are 𝑝! = 291/510 = 0.57 and 𝑝! = 230/512 = 0.45. We have 𝐻! is 𝑝! = 𝑝!, that is that the proportions in the two populations are equal, and 𝐻! is 𝑝! ≠ 𝑝!. The pooled proportion is
𝑝 =291 + 230510 + 512
= 0.5098
The standard error of the difference in proportions is
𝑆𝐸!!!!! = 0.5098(1 − 0.5098)1510
+1512
= 0.0313.
The test statistic is
𝑧 =0.57 − 0.450.0313
= 3.8. The 𝑃-value is 𝑃 = 2 ∙ 𝑃 𝑍 > 3.8 = 0.0001, that is, extremely small! So we reject the null hypothesis and say that there is a significant difference in the views of men and women about whether Palin was qualified to be president.
(b) This is another two sample test of proportions. If Population 1 is men and Population 2 is women, then the proportions that think such questions are fair are 𝑝! = 248/510 = 0.486 and 𝑝! = 261/512 =0.510. We have 𝐻! is 𝑝! = 𝑝!, that is that the proportions in the two populations are equal, and 𝐻! is 𝑝! ≠ 𝑝!. The pooled proportion is
𝑝 =248 + 261510 + 512
= 0.498. . The standard error of the difference in proportions is
𝑆𝐸!!!!! = 0.498(1 − 0.498)1510
+1512
= 0.0313.
The test statistic is
𝑧 =0.486 − 0.510
0.0313= −0.77.
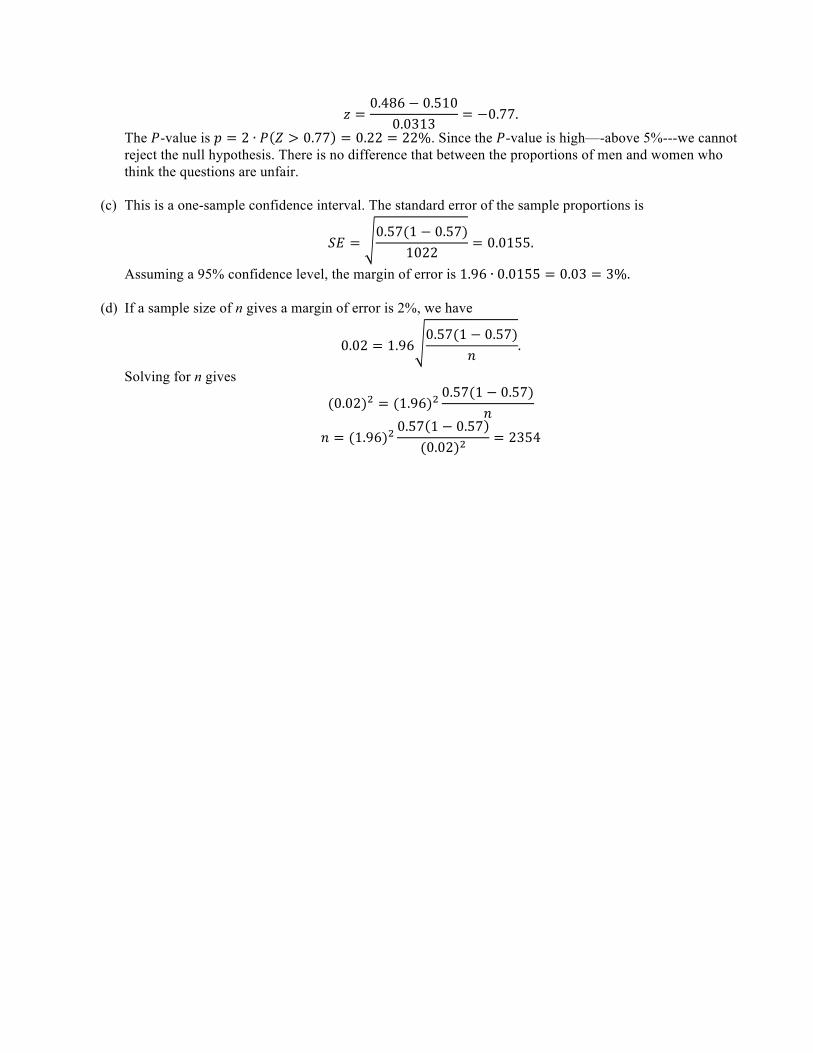
The 𝑃-value is 𝑝 = 2 ∙ 𝑃 𝑍 > 0.77 = 0.22 = 22%. Since the 𝑃-value is high—-above 5%---we cannot reject the null hypothesis. There is no difference that between the proportions of men and women who think the questions are unfair.
(c) This is a one-sample confidence interval. The standard error of the sample proportions is
𝑆𝐸 =0.57(1 − 0.57)
1022= 0.0155.
Assuming a 95% confidence level, the margin of error is 1.96 ∙ 0.0155 = 0.03 = 3%.
(d) If a sample size of n gives a margin of error is 2%, we have
0.02 = 1.960.57(1 − 0.57)
𝑛.
Solving for n gives
(0.02)! = (1.96)!0.57(1 − 0.57)
𝑛
𝑛 = (1.96)!0.57 1 − 0.57
(0.02)!= 2354