math 2 coordinate geometry part 1 unit november 3,...
TRANSCRIPT

Math 2 Coordinate Geometry part 1 Unit November 3, 2016
1
Reviewing the basics
The number line
A number line is a visual representation of all real numbers. Each of the images below are examples of
number lines. The top left one includes only positive whole numbers, the top right one includes integers
(which are positive and negative whole numbers), the third example shows positive and negative
rational numbers (the word "rational" refers to ratios or fractions). A number line is a way to graph, or
visually represent, a single variable.
1. Point C is at 3.5 on the real number line. If Point D is also on the real number line and is 8.5
units from C, then what are the possible locations of D?
2. In the figure below, L, M, R, and S are collinear. Line segment LS is 50 units long, line segment
MS is 38 units long, and line segment MR is 13 units long. How many units long is line segment
LR?

Math 2 Coordinate Geometry part 1 Unit November 3, 2016
2
The coordinate plane
The coordinate plane (also called the Cartesian plane named after French mathematician Rene
Descartes, who formalized its use in mathematics) is defined by two perpendicular number lines: the x -
axis, which is horizontal, and the y -axis, which is vertical. Using these axes, we can describe any point in
the plane using an ordered pair of numbers. The Cartesian plane extends infinitely in all directions. To
show this, math textbooks usually put arrows at the ends of the axes in their drawings. The coordinate
plane is a way to graph, or visually represent, two variables.
Ordered pairs / coordinates
The location of a point in the plane is given by its coordinates, a pair of numbers enclosed in parentheses: (x,y). The first number x gives the point's horizontal position and the second number y gives its vertical position. All positions are measured relative to a "central" point called the origin, whose coordinates are (0,0). For example, the point (6,4) is 6 units to the right of the origin and 4 units up, as shown in the figure. Negative coordinate numbers tell us to go left or down. In the figure to the right:
3. What are the coordinates of point B?
4. What are the coordinates of point C?
5. What are the coordinates of point F
6. What are the coordinates of point G?

Math 2 Coordinate Geometry part 1 Unit November 3, 2016
3
7. Which of the following best describes a triangle in the standard (x,y) coordinate plane with vertices at (-5, -1), (2,-2), and (4,2)? (Hint: make a graph and plot the points)
A. All three angles measure less than 90° B. All three sides are the same length C. Exactly two sides are the same length D. One angle measures 90° E. One angle measures more than 90°
8. In the standard (x,y) coordinate plane shown below, two circles of the same radius r are enclosed by rectangle ABCD. If the radius is 3 units, what are the coordinates of point C?
9. In the standard (x,y) coordinate plane shown in the figure, points A and B lie on line m, and point C lies below it. The coordinates of points A, B, and C are (0,5), (5,5), and (3,3), respectively. What is the shortest possible distance from point C to a point on line m? (Hint: the shortest possible distance is a line perpendicular to the original line [i.e. a vertical line]. What is the simplest way to find the distance of a vertical line?)

Math 2 Coordinate Geometry part 1 Unit November 3, 2016
4
10. In the (x,y) coordinate plane below, points P (6,2) and Q (1,4) are two vertices of ∆PQR. If angle PQR is a right angle, then which of the following could be the coordinates of R? (Hint: Plot the given points, would angle Q be a right angle?)
A. (4,-3) B. (3,0) C. (2,1) D. (2,4) E. (3,9)
Coordinates of reflections A reflection is an image or shape as it would be seen in a mirror. The line where the mirror would be placed is called the axis of reflection. In the image below and to the left, triangle abc has been reflected about the y axis; that means a 'mirror' was placed on the y axis and a new image was created patterned after the original one. The new triangle created is called triangle a'b'c'. It is a mirror reflection of the original triangle. In the image below and to the right, point A is at (2,1). Point A' is a reflection of point A over the x axis. The coordinates of point A' are (2, -1). In the bottom image, the line of reflection is a line y = x. In that graph, the original point is at (3,4) and the reflection is at (-3, -4).

Math 2 Coordinate Geometry part 1 Unit November 3, 2016
5
11. If the coordinates of point B are (2,3), what are the coordinates of point B' reflected about the x axis? (Hint: draw a diagram)
12. If the coordinates of point B are (2,3), what are the coordinates of point B' reflected about the y axis?
13. What are the coordinates of Q', the reflection of the point Q(r,s) over the y-axis?
A. (-r,s) B. (-r,-s) C. (s, -r) D. (r, -s) E. (-s, r)
Quadrants The Cartesian plane is divided into four quadrants. These are numbered from I through IV, starting with the upper right and going around counterclockwise. (For some reason everybody uses roman numerals for this). In Quadrant I, both the x- and y-coordinates are positive; in Quadrant II, the x-coordinate is negative, but the y-coordinate is positive; in Quadrant III both are negative; and in Quadrant IV x is positive but y is negative. Points which lie on an axis (i.e., which have at least one coordinate equal to 0) are said not to be in any quadrant. Coordinates of the form (x, 0) lie on the horizontal x-axis, and coordinates of the form (0, y) lie on the vertical y-axis.
In the figure to the right:
14. In which quadrant is point D?
15. Which points are in quadrant III?
16. Which points are in quadrant IV?
Math 2 Coordinate Geometry part 1 Unit November 3, 2016
6
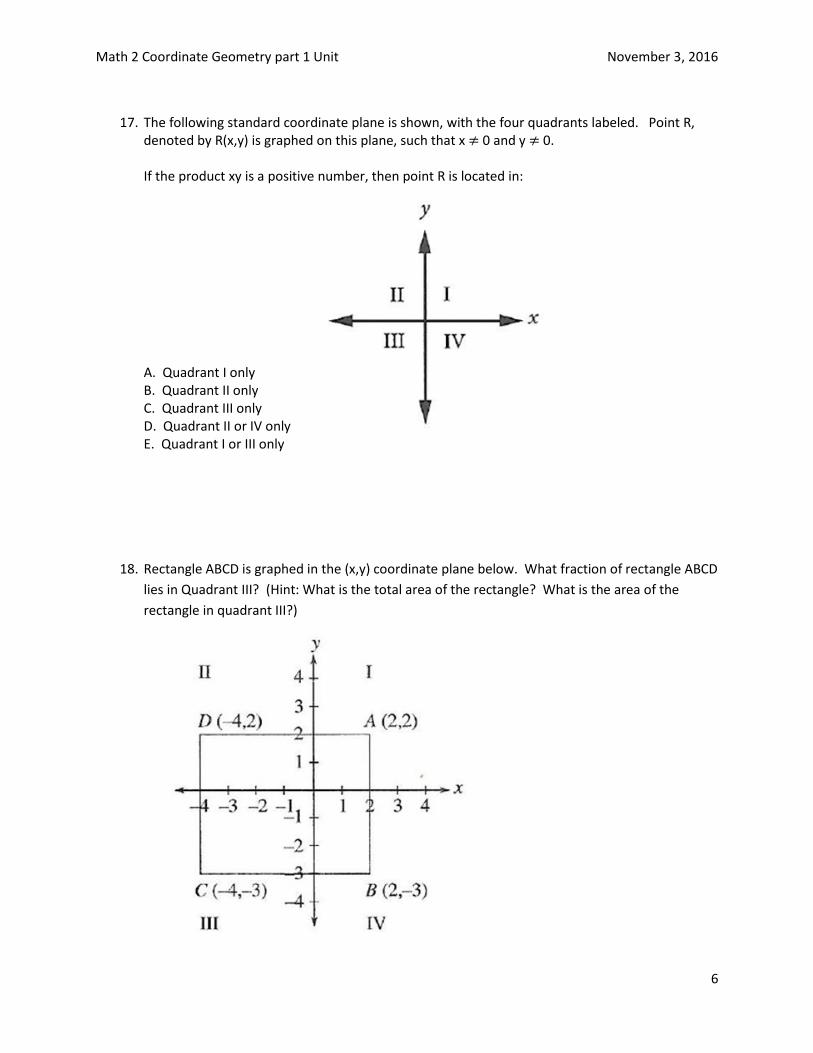
17. The following standard coordinate plane is shown, with the four quadrants labeled. Point R,
denoted by R(x,y) is graphed on this plane, such that x ≠ 0 and y ≠ 0.
If the product xy is a positive number, then point R is located in: A. Quadrant I only B. Quadrant II only C. Quadrant III only D. Quadrant II or IV only E. Quadrant I or III only
18. Rectangle ABCD is graphed in the (x,y) coordinate plane below. What fraction of rectangle ABCD
lies in Quadrant III? (Hint: What is the total area of the rectangle? What is the area of the
rectangle in quadrant III?)
Math 2 Coordinate Geometry part 1 Unit November 3, 2016
7
Linear functions
A function relates an input to an output. It is like a machine that has an input and an output and the
output is related somehow to the input. The classic way of writing a function is f(x). Like this f(x) = x + 1.
It can be written as a table to show the relationship between the input and the output. To find the f(x)
simply choose some values for x and plug them into the equation. On a coordinate plane, rather than
writing the function as f(x), we usually write y like this y = x + 1, but it can still be written f(x) = x + 1.
Either way it's written is okay.
x f(x) or y
1 2
2 3
12 13
26 27
19. A particular linear equation includes the (x,) pairs below. What is the value of b?
x f(x) or y
1 3
2 6
12 b
26 78
Domain and Range
A function has a domain and a range. The domain is the set of all possible x-values which will make the
function "work", and will output real y-values. The range is the set of all possible y-values which will
make the function "work." Some functions have a beginning point and an end point. In these cases, the
domain is simply the x values where it begins and where it ends. In
the graph to the right, the graph begins at x = -12 and ends at x = 8.
The domain of the graph is {-12 ≤ x ≤ 8}. Notice that it is ≤ not just
<. This is represented by the points at the ends. If the endpoint is an
"open" circle then everything up to that point is included, but the
point itself is not, so we use the term <. If the endpoint is a "closed"
circle, then the endpoint is also included so we use the term ≤.
The range is the values of y. For the graph at the right, the smallest y
value is 4 and the greatest y value is 8 so the range of this function is
{4 ≤ y ≤ 8}.

Math 2 Coordinate Geometry part 1 Unit November 3, 2016
8
The function at the right also has endpoints. Notice that one endpoint is
"open" and the other endpoint is "closed." The domain of this function is
{1< x ≤ 4}. It can also be written like this {x: 1< x ≤ 4}. All the x values that
will work for this function are between those two endpoints. The range of this
function is {1 < y ≤ 7}. It might also be written like this {y: 1 < y ≤ 7}. All the y
values that will work for this function are between those two endpoints.
Some functions don't have endpoints. For example, a line that goes on
forever in both directions. In this case, the domain (or x values) is the set
of all real numbers because any x will work. The range (or y values) is also
the set of all real numbers.
20. The graph below shows the function f(x) in the coordinate plane. Which of the following choices
best describes the domain of this function?
(Note: the domain is defined as the set of all values of x for which a function is defined.)
A. {0, 1, 2, 3, 4}
B. {0, 1, 2}
C. {x: 0 < x < 2}
D. {x: 0 < x < 4}
E. All real values of x

Math 2 Coordinate Geometry part 1 Unit November 3, 2016
9
Review of linear equations
Linear equations are functions that can be represented as a line on a graph. The x value is the input and
the y value is the output. It works sort of like this: When we have a question like this: 1 + 7 = Y, I know
the answer is 8. But if I have a question like this: 1 + X = Y. The answer is "it depends" because there is
more than one possible answer. For example if X = 0 then Y would be 1, but if X = 5 then Y would be 6.
There are an infinite number of possible answers. There is a way to find all the possible answers very
quickly. Because Y depends on what we choose for X, there is a relationship that can be written as a line
on a coordinate plane.
A linear equation in two variables describes a relationship in which the value of one of the variables
depends on the value of the other variable. In a linear equation x is the independent variable and y is
the dependent variable. When you assign a value to the independent variable, x, you can compute the
value of the dependent variable, y. You can then plot the points named by each (x,y) pair on a
coordinate grid.
The good news is that if you know 2 points, you can draw a line that includes all the other possible
answers. So finding many pairs of values that satisfy a linear equation is easy: Find two pairs of values
and draw a line through the points they describe. All other points on the line will provide values for x
and y that satisfy the equation.
For example the equation 3x + 2y = 6 is a linear equation. To find all the possible solutions we need to
find at least 2 answers. Since any two will do, I prefer to pick easy ones. If x = 0 then y has to be 3. We
have our first possible answer. We write this as an ordered pair (0,3). If y = 0 then x has to be 2. We
have a second possible answer. We write this as an ordered pair (2,0). Making a line through those two
points give us all the possible answers for the equation.

Math 2 Coordinate Geometry part 1 Unit November 3, 2016
10
21. A particular linear equation includes the (x,y) pairs below. Graph the points to make a line. What is
the value of b?
Examples of linear relationships
Katie notices that the textbooks for her past 3 math courses have the same length and width, but each year's textbook has more pages and weighs more than the previous year's textbook. Katie weighs the textbooks, to the nearest 0.1 ounce, for her past 3 math courses and wonders about the relationship between the number of pages in math textbooks and the weights of those textbooks. She graphs the number of pages and corresponding weights of her 3 math textbooks in the standard (x,y) coordinate plane, as shown below, and discovers a linear relationship among these 3 points. She concludes that the equation of the line that passes through these 3 points is y = 0.1x + 2.2. The points on the graph are (868, 89.0), (942, 96.4), and (1056, 107.8).
22. How much more, in ounces, does a math textbook with 1,056 pages weigh than one with 868 pages?

Math 2 Coordinate Geometry part 1 Unit November 3, 2016
11
23. According to Katie's equation, how much would a math textbook with 1,338 pages weigh, in ounces?
24. According to Katie's equation, how much would a math textbook with 1,338 pages weigh, to the nearest tenth of a pound? (Note: 16 ounces = 1 pound)
25. Tickets for the High School Talent Show are $3 for adults and $2 for students. To cover expenses, a total of $600 must be collected from ticket sales for the show. One of the following graphs in the standard (x,y) coordinate plane, where x is the number of adult tickets sold and y is the number of student tickets sold, represents all the possible combinations of ticket sales that cover at least $600 in expenses. Which graph is it?

Math 2 Coordinate Geometry part 1 Unit November 3, 2016
12
Slope
Distance = rate x time
In this equation, for any given steady rate, the relationship between distance and time will be linear. However, distance is usually expressed as a positive number, so most graphs of this relationship will only show points in the first quadrant. Notice that the direction of the line in the graph below is from bottom left to top right. Lines that tend in this direction have positive slope. A positive slope indicates that the values on both axes are increasing from left to right.
In the previous example, the rate is 25 miles per 1 hour. This rate is called the slope of the line. The slope tells you two things: how steep the line is with respect to the y axis and whether the line slopes up or down when you look at it from left to right. If the slope is positive then the line slopes up from left to right. If the slope is negative then the line slopes down from left to
right. It is written like this 𝑦
𝑥 or
𝑟𝑖𝑠𝑒
𝑟𝑢𝑛 . In the example above it would be
25 𝑚𝑖𝑙𝑒𝑠
1 ℎ𝑜𝑢𝑟.
When you're plotting data, slope tells you the rate at which the dependent variable is changing with respect to the change in the independent variable. It may have a positive slope where y is increasing as x is increasing, it may have a negative slope where y is decreasing as x is increasing, it may have a horizontal slope where y remains the same as x is increasing, or it may have a vertical slope. The slope of a vertical line is called "undefined."

Math 2 Coordinate Geometry part 1 Unit November 3, 2016
13
Below is the graph that a specialty automobile manufacturer uses to plot the speed tests done
on his new cars. The speed is recorded in units of 𝑚
𝑠 and is conducted for a period of 9 seconds.
26. From 0 to 4 seconds the speed is: a. increasing b. constant c. decreasing
27. A certain order of 3 of the following 6 actions describes the results of the speed test depicted in the graph above. Which order is it?
I. Constant speed for 1 second
II. Constant speed for 3 seconds
III. Speed increase for 4 seconds
IV. Speed increase for 9 seconds
V. Speed decrease for 2 seconds
VI. Speed decrease for 7 seconds
A. IV, II, VI
B. III, II, V
C. I, III, V
D. III, I, VI
E. V, I, II

Math 2 Coordinate Geometry part 1 Unit November 3, 2016
14
The recreation center has installed a swimming pool on level ground. The pool is a right circular
cylinder with a diameter of 24 feet and a height of 6 feet. A diagram of the pool and its entry ladder
is shown below.
28. A hose is used to fill the pool. After several hours a second hose is added. Twice as many
gallons of water per minute flow through the second hose than the first one. Both hoses
continue working until the pool is filled to the 5 foot mark. Which of the following graphs shows
the relationship between the time spent filling the pool and the height of the water in the pool?
Math 2 Coordinate Geometry part 1 Unit November 3, 2016
15
Using two points to find the slope
In mathematics, the slope of a line is often called m. We can find the slope if we have two points on the line. We'll call the first point (𝑥1, 𝑦1 ), and the second point (𝑥2, 𝑦2 ). To find the slope we make a fraction. Take the y value from the second point and subtract the y value from the first point for the numerator and take the x value from the second point and subtract the x value from the first point for the denominator.
slope = m = 𝑐ℎ𝑎𝑛𝑔𝑒 𝑖𝑛 𝑦
𝑐ℎ𝑎𝑛𝑔𝑒 𝑖𝑛 𝑥 =
𝑟𝑖𝑠𝑒
𝑟𝑢𝑛 =
𝑦2 – 𝑦1
𝑥2 – 𝑥1
The slope of the line that contains the points A (2,3) and B (0,-1) is
𝑦2 – 𝑦1
𝑥2 – 𝑥1 =
(−1) − (3)
(0) − (2) =
−4
−2 = 2
The slope of the line that contains the points A (-2,3) and B (0,-1) is
𝑦2 – 𝑦1
𝑥2 – 𝑥1 =
(−1) − (3)
(0) − ( −2) =
−4
2 = -2
29. What is the slope between (0,0) and (4,3)?
30. What is the slope between (3,7) and (4,2)?
31. In the coordinate plane a line runs through the points (3,3) and (2, 5). What is the slope of the line?
32. In the Cartesian plane, a line runs through the points (6, 7) and (2, -9). What is the slope of the line?
For a chemistry class, Kaleb is doing an experiment that involves periodically heating a container of liquid. The graph below shows the temperature of the liquid at different times during the experiment. Use the graph to answer the following questions.

Math 2 Coordinate Geometry part 1 Unit November 3, 2016
16
33. What is the rate of change from 0 minutes to 5 minutes?
34. What is the rate of change from 5 minutes to 71
2 minutes?
35. What is the rate of change from 71
2 minutes to 10 minutes?
36. What is the rate of change from 15 minutes to 171
2 minutes?
37. What is the average rate of change of temperature (in degrees Celsius per minute) during the times in which Kaleb is applying heat to this container? (Hint: What is the total rise in temperature? What is the total time where heat was applied? The average will be the total rise in temperature divided by the time heat was applied?)
38. The point (2,5) is shown in the standard (x,y) coordinate plane below. Which of the
following is another point on the line through the point (2,5) with a slope of −2
3 ?

Math 2 Coordinate Geometry part 1 Unit November 3, 2016
17
A. A (-1, 3)
B. B (0,8)
C. C (4,2)
D. D (5,3)
E. E (5,7)
Slope-Intercept Form
The equation of a line can be written many different ways. The following are all linear equations.
Notice that each has 2 variables and none of the variables have exponents.
2x + y = 3 1
2x - y - 5 = 0 x = 8 −
2
3𝑦 y = 3x -2
Each of these can be represented as a line on a graph. However there is one form that is the most
useful form for linear equations. It is called the slope-intercept form and it looks like this:
y = mx + b
For example in the equation y = 1
2x + 3, the m (or slope) in the equation would be
1
2 and the b (or y-
intercept) would be 3. The m value is the slope and the b value is the y-intercept. The y-intercept is
the point where the line crosses the y axis. In the graph below, the y-intercept is 3.
When graphing an equation in slope-intercept form, the y-intercept gives the first point. If the y
intercept is 3, then put a point on the 3 on the y axis. From there, the slope tells where to put the next
point. The numerator tells how far up (or down) to move and the denominator tells how far to move to
the right. For example, if the slope is 1
2 then you go up 1 and to the right 2. If the slope is negative,
−2
3
for example, then you move down 2 and to the right 3. If the slope is a whole number, convert it to a

Math 2 Coordinate Geometry part 1 Unit November 3, 2016
18
fraction. For example 2 is the same as 2
1 which means you move up 2 and to the right 1 and -5 is the
same as −5
1 which means you move down 5 and to the right 1.
39. What is the slope of the line y = 3
4 X - 4?
40. What is the slope of the line y = −4
5 X - 7?
41. What is the slope of the line y = -2X + 2?
42. What is the slope of the line y = X - 3
2?
43. What is the y-intercept of the line y = 4
5 X - 3?
44. What is the y-intercept of the line y = - 4
5 X -
1
2?
45. What is the y-intercept of the line y = −4
5 X -
7
2?
46. What is the y-intercept of the line y = -7X - 2?
47. What is the y-intercept of the line y = - 2
5X?
48. Which of the following is an equation for the graph in the following standard (x,y) coordinate plane?
A. y = -2x + 1

Math 2 Coordinate Geometry part 1 Unit November 3, 2016
19
B. y = x + 1 C. y = x + 2 D. y = 2x + 1 E. y = 2x + 2
49. Which of the following equations represents the linear relation shown in the standard (x,y)
coordinate plane below?
A. y = -5x B. y = -6x C. y = -2x + 2 D. y = -5x + 6 E. y = -2x + 6
50. Line l is graphed in the standard (x,y) coordinate plane as shown below. If the equation for line l is written in the form y = mx + b, which of the following is true about m and b?
A. m and b are both positive
B. m is negative and b is positive
C. m is positive and b is negative
D. either m or b must equal 0
E. m and b are both negative
51. The slope of the line with equation y = ax + b is greater than the slope of the line with equation
y = cx + b. Which of the following statements must be true about the relationship between a
and c?
A. a ≤ c

Math 2 Coordinate Geometry part 1 Unit November 3, 2016
20
B. a < c
C. a = c
D. a > c
E. a ≥ c + 1
Re-writing equations in slope-intercept form
To find the slope or y-intercept of a line that is not in slope-intercept form, re-write the equation in
slope-intercept form. For example, to find the slope of the line 6y - 3x = 18, re-write it so it looks like
y = mx + b
6y - 3x = 18 (start with the equation as given)
6y = 3x + 18 (add 3x to both sides)
y = 3𝑥+18
6 =
3𝑥
6 +
18
6 (divide both sides by 6)
y = 1
2x + 3 (simplify). Now I know that the slope of the line is
1
2 and the y-intercept of the line is 3.
52. At which y-coordinate does the line described by the equation y - 3x = 18 intersect the y-axis?
53. What is the slope of the line given by the equation 8 = 3y - 5x?
54. What is the slope of the line represented by the equation 10y - 16x = 13?
55. The formula for line q in standard form is 5x - y = 2. Which of the following gives the formula for
line q in slope-intercept form?
A. y = 5x + 2 B. y = 5x - 2 C. y = 2x - 5

Math 2 Coordinate Geometry part 1 Unit November 3, 2016
21
D. y = -5x - 2 E. y = -5x + 2
56. Which of the following is the graph of the equation y + 2 = 4x?
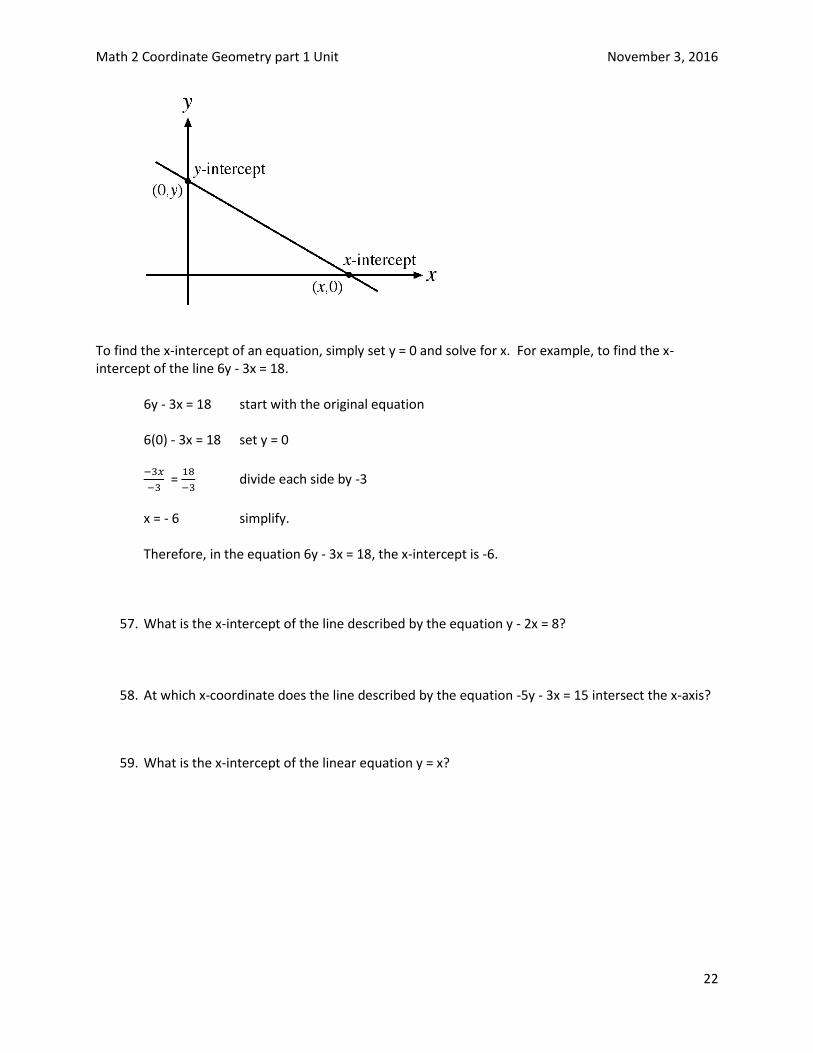
x-intercept The x-intercept of a line is the point where the lines crosses the x axis.
Math 2 Coordinate Geometry part 1 Unit November 3, 2016
22
To find the x-intercept of an equation, simply set y = 0 and solve for x. For example, to find the x-intercept of the line 6y - 3x = 18.
6y - 3x = 18 start with the original equation 6(0) - 3x = 18 set y = 0 −3𝑥
−3 =
18
−3 divide each side by -3
x = - 6 simplify. Therefore, in the equation 6y - 3x = 18, the x-intercept is -6.
57. What is the x-intercept of the line described by the equation y - 2x = 8?
58. At which x-coordinate does the line described by the equation -5y - 3x = 15 intersect the x-axis?
59. What is the x-intercept of the linear equation y = x?

Math 2 Coordinate Geometry part 1 Unit November 3, 2016
23
Answers:
1. -5 and 12
2. 25
3. (5, 3)
4. (-2, 1)
5. (-2, -4)
6. (2, -3)
7. E
8. (12, 6)
9. 2
10. E
11. (2, -3)
12. (-2, 3)
13. A
14. II
15. E, F
16. G, H
17. E
18. 2
5
19. 36
20. D
21. 7
22. 18.8
23. 136 ounces
24. 8.5 lbs
25. H
26. a
27. B
28. A
29. 3
4
30. -5
31. -2
32. 4
33. 8 degrees per minute
34. 0
35. 8 degrees per minute
36. 8 degrees per minute
37. 8 degrees per minute
38. D
39. 3
4
40. −4
5
41. -2
42. 1
43. -3
44. −1
2
45. −7
2
46. -2
47. 0
48. E
49. D
50. B
51. D
52. 18
53. 5
3
54. 8
5
55. B
56. A
57. -4
58. -5
59. 0