maternal and newborn health care behaviors and …
TRANSCRIPT

MATERNAL AND NEWBORN HEALTH CARE BEHAVIORS AND PRACTICES IN 115 L10K
DISTRICTS OF ETHIOPIA: BASELINE AND FOLLOW‐UP SURVEYS 2016–2017
Addis Ababa 2018

i

ii
CONTENTS ACKNOWLEDGEMENT ................................................................................................. iv
ACRONYMS ................................................................................................................. vi
EXECUTIVE SUMMARY ................................................................................................. 1
INTRODUCTION ............................................................................................................ 5
L10K 2020 (October 2015 – September 2017) ................................... 6
METHODOLOGY ........................................................................................................... 9
Study design ......................................................................... 9
Sample size .......................................................................... 9
Data collection ...................................................................... 9
Analysis .............................................................................. 10
RESULTS ..................................................................................................................... 11
Background characteristics ....................................................... 11
Antenatal care coverage and content .......................................... 13
Household visit by health worker during pregnancy ......................................... 13
Antenatal care, timing, and number of visits ..................................................... 15
Components of antenatal care........................................................................... 15
Birth preparedness ............................................................................................. 17
Family conversation ........................................................................................... 19
Childbirth and perinatal care .................................................... 24
Neonatal tetanus protected childbirths ............................................................. 24
Institutional delivery and skilled birth attendance ............................................ 25
Birth attendant handwashing ............................................................................ 25
Birth notification ................................................................................................ 27
Respectful maternity care ........................................................ 27
Postpartum care ................................................................... 32
Postnatal care of the mother ............................................................................. 32
Family planning counselling during PNC visits ................................................... 35

iii
Immediate newborn care ................................................................................... 35
Exclusive breastfeeding ........................................................... 37
CONCLUSION .............................................................................................................. 41

iv
ACKNOWLEDGEMENT JSI Research & Training Institute, Inc. (JSI) would like to thank the Bill & Melinda Gates Foundation for funding the Last Ten Kilometers (L10K) 2020 Project and the Federal Ministry of Health of the Ethiopian Government for supporting its implementation.
The implementation of the L10K 2020 baseline and follow‐up surveys was supported by the Regional Health Bureaus (RHBs) of Amhara, Oromia, Southern Nations, Nationalities and Peoples’ (SNNP) and Tigray regions; Amhara and Tigray Public Health Institutes; L10K 2020 implementing partners (Amhara Development Association, Bench Maji Development Association, Kaffa Development Association, Oromia Development Association, Sheka Peoples’ Development Association, and Relief Society of Tigray); the consultants who served as regional coordinators; and L10K 2020 team members.
We would like to thank the woreda health office staff, health center service providers, Health Extension Workers (HEWs) and the Women’s Development Army (WDA) members for their dedication that has bought about significant improvements in reproductive, maternal, newborn and child health care behaviors and practices in their communities.
Last but not the least, we would also like to thank the women, including the HEWs and WDAs, who took their time to respond to the survey questions. The information provided by them will be invaluable to all partners and stakeholders supporting the Government of Ethiopia’s Health Sector Transformation Plan, 2015–2020.

v

vi
ACRONYMS ANC Antenatal Care BMGF Bill & Melinda Gates Foundation CRC Caring, Respectful and Compassionate CBDDM Community‐Based Data for Decision Making FP Family Planning GPS Global Positioning SystemHEP Health Extension Program HEW Health Extension Worker HSTP Health Sector Transformation Plan IUCD Intrauterine Contraceptive Device JSI JSI Research & Training Institute, Inc. L10K Last Ten KilometersLAFP Long Acting Family Planning MNH Maternal Newborn Health MDG Millennium Development Goal PC‐Solutions Participatory Community Solutions PCQI Participatory Community Quality Improvement PDSA Plan‐Do‐Study‐ActPNC Postnatal Care PPC Postpartum Care PPFP Postpartum Family Planning PHCU Primary Health Care Unit QI Quality Improvement RHB Regional Health BureauRMNCH Reproductive Maternal Newborn Health SNNP Southern Nations, Nationalities and Peoples’ UNICEF United Nations Children's Fund WDA Women’s Development Army WHO World Health Organization

vii

1
EXECUTIVE SUMMARY
Introduction
The Last Ten Kilometers (L10K) 2020 Project of JSI Research and Training Institute, Inc. supports the Health Sector Transformation Plan (HSTP) 2015 – 2020 of Ethiopia to achieve its ambitiously target to reduce maternal, newborn and child mortalities by more than half. Between October 2015 and September 2017, L10K 2020 supported the health systems of 115 rural districts of Amhara, Oromia, Southern Nations, Nationalities and Peoples’ [SNNP], and Tigray regions, covering 17 million people, to implement the HSTP transformation agendas—woreda transformation, quality and equity of health services; caring, respectful and compassionate care; and information revolution. This study monitors the changes in the maternal and newborn health (MNH) care behavior and practice indicators during the first two years of L10K 2020 project.
Methods
Household surveys of women with children aged 0 to 11 months was conducted in February‐May 2016 and October‐November 2017 to measure the changes in MNH care behavior and practices in the L10K 2020 areas. The survey point estimates were weighted for survey design. Statistical tests were done to estimate statistically significant (p<.05) changes in the MNH care indicators between the baseline and the follow‐up surveys, and to assess statistically significant (p<.05) disparities in the MNH care indicators due to age, wealth, and geographical region during the follow‐up survey. Only the statistically significant findings are discussed.
Key findings
Antenatal care coverage and content
Between the baseline and follow‐up surveys, health workers visiting pregnant women’s household increased from 15 % to 20 %, pregnant women receiving at least one antenatal care (ANC) service increased from 83 % to 91 %, receiving ANC

2
during the first trimester (early ANC) increased from 21 % to 26 %, receiving at least four ANC services increased from 45 % to 52 %, and ANC services in the first and last trimester increased from 19 % to 25 %. Similarly, the receiving counseling on MNH care practices, the components of services provided during ANC, and taking any birth preparedness measure during pregnancy also increased between the two surveys.
There were no disparities in health workers visiting households of pregnant women due to age or household wealth of the women. However, receiving four or more ANC, ANC during the first trimester, ANC during the first and last trimester, and complete ANC (weight was taken, blood pressure measured, urine and blood tested) was higher among women from wealthier households; and receiving complete ANC was lower among younger women.
Childbirth and perinatal care
During the observation period neonatal tetanus protected childbirth increased from 58 % to 65 %, institutional delivery increased from 59 % to 66 %, and birth notification to ensure the early postnatal care (PNC) of the mother and the baby within 48 hours of delivery increased from 39 % to 50 %. However, there was no change in the handwashing practices of the birth attendants during that time.
Neonatal tetanus protected childbirth, institutional delivery, skilled birth attendance, and birth attendant hand‐washing were higher among women from the wealthier quintile. But birth notification among women who had a home delivery was more common among women from the poorer quintiles. However, birth notification among women who had a home delivery was lower among the younger mothers.
In 2017, the prevalence of any disrespectful or abusive behaviors of the service providers during childbirth at health facilities was low (below 10 %). However, disrespect or abuse was more likely to reported by women in the highest wealth quintile, and those who were from the Oromia region.
Postpartum care
Early postpartum care of the mother and early postnatal care of the newborn increased respectively from 25 % and 24 % during the baseline survey to 32 % and 30 % during the follow‐up survey. Similarly, during the same period, there were improvements in immediate newborn care practices, namely clean care of the

3
umbilical cord increased from 77 % to 81 %, applying chlorhexidine on the umbilical cord increased from 4 % to 17 %, and drying the baby immediately after birth increased from 71 % to 75 %. Interestingly, clean cord care, applied chlorhexidine on the cord, and initiated breastfeeding immediately after childbirth was higher among women from the higher wealth quintiles.
Conclusion
The study indicates that there were improvements in the coverage and quality of antenatal care services, coverage of neonatal tetanus protected childbirths, institutional deliveries, birth notification for early postnatal care, early postpartum care of the mother and early postnatal care of the baby, clean cord care, chlorhexidine application on the cord, and drying the baby immediately after birth in the intervention areas during the first two years of the L10K 2020 project. In general, disrespectful and abusive behaviors of the service providers were low.
Changes in MNH care behaviors and practices during the observation period were not observed for most of the birth preparedness measures, family conversation, handwashing of birth attendant, maintaining skin‐to‐skin care of the newborn, delay bathing the newborn, and exclusive breastfeeding; while there was a decline in the practice of initiating breastfeeding immediately after birth.
Disparities in MNH care indicators due to younger age of the mother were observed for quality of antenatal care services, and notification of births for early postnatal care. However, older women were less likely to initiate early breastfeeding.
Disparities favoring women from wealthier households were observed for antenatal care coverage indicators, quality of antenatal care services, taking any birth preparedness measures, neonatal tetanus protected childbirths, institutional deliveries including skilled birth attendance, birth attendant washing hands, early postnatal care of the mother and the baby, and initiating early breastfeeding.
Although wealthier women are likely to be more educated and more proactively seek MNH services and demand a better quality of services, minimizing wealth disparities, especially for the provision of quality of MNH care services will be essential to achieve the HSTP targets. Further studies will be needed to understand why some of the immediate newborn practices did not improve.

4

5
INTRODUCTION
Ethiopia’s Health Sector Transformation Plan (HSTP), 2015 – 2020, targets to reduce maternal mortality ratio (MMR) from 353 per 100,000 live births in 2015 to 199 per 100,000 live births in 2020, neonatal mortality rate (NMR) from 28 to 10 per 1,000 live births, and under‐5 mortality rate from 68 to 30 per 1,000.
In October 2015, the Bill & Melinda Gates Foundation (BMGF) provided a grant to JSI Research & Training Institute, Inc. to implement the Last Ten Kilometer’s (L10K) 2020 Project to support HSTP to achieve its ambitious maternal, newborn and child mortality reduction targets. Building on the experience from implementing community‐based reproductive, maternal, newborn and child health (RMNCH) interventions, L10K 2020, in harmony with other partners, supports the implementation of the HSTP transformation agendas—woreda transformation, quality and equity of health services, caring, respectful and compassionate care, and information revolution.
Between October 2015 and September 2017, L10K 2020 operated in the 115 rural woredas (i.e. districts) of Amhara, Oromia, Southern Nations, Nationalities and Peoples’ [SNNP], and Tigray regions covering about 17 million people, and worked closely with the country’s rural woreda (district) level health system to achieve the following five specific primary outcomes:
Outcome 1: Improved quality for and increased use of RMNCH services at scale;
Outcome 2: Improved health care seeking behaviors for early postnatal, newborn care (including newborn infections) and common childhood illnesses; equitable skilled birth attendance; and targeted family planning (FP);
Outcome 3: Increased quality of and demand for community‐based long‐acting FP (LAFP) methods;
Outcome 4: Demonstrate innovative mobile solutions to improve PNC in 48 hours;
Outcome 5: L10K 2020 experiences measured, learned, evaluated and disseminated.
This study was conducted to monitor the changes in maternal and newborn health (MNH) care behavior and practice indicators during the first two years of implementation of the L10K 2020 project.

6
L10K 2020 (October 2015 – September 2017)
The L10K 2020 strategies between October 2015 and September 2017 were:
Primary Outcome 1: The two major strategies for this outcome were I) institutionalization of community‐based data for decision making (CBDDM), and II) Participatory Community Solutions for better RMNCH outcomes (i.e., PC‐Solutions).
L10K 2020 partnered with five civil society organizations to implement its Platform strategy in 115 woredas. The Platform included CBDDM, an approach to ensure targeted RMNCH services; family conversation, a health education forum that promotes birth preparedness and emergency readiness; birth notification, a community‐based information system to ensure safe birthing, early postnatal care (PNC), and immediate newborn care; and, motivational support to the WDAs. The CBDDM institutionalization process fostered ownership of the strategy by the woreda health office.
PC‐Solutions introduced community engagement within the Plan‐Do‐Study‐Act (PDSA) cycles of the national quality improvement (QI) strategy. A QI team—led by the woreda health office that included health center service providers, HEWs, WDAs, representatives of the primary hospital, local stakeholders, and local administration—collated and analyzed health system data to organize and inform the plan and study forums of the PDSA cycles. PC‐Solutions was implemented in eight PHCUs in eight woredas, two woredas from each of the four regions.
Primary Outcome 2: This Primary Outcome was L10K 2020’s Social and Behavioral Change Communication (SBCC) strategy, i.e., Demand Generation, to address care‐seeking behaviors for the four relatively low performing indicators—at least four antenatal check‐ups (ANC), equitable coverage of skilled birth attendance, postnatal care (PNC) within 2 days from childbirth, demand for LAFP methods and postpartum family planning (PPFP). The primary focus of L10K 2020’s SBCC strategy included testing innovative multi‐pronged approaches geared to shift behaviors, practices, and norms; and to improve the knowledge and skills of the WDAs to effectively interact with households and communities to enhance critical RMNCH practices and behaviors. The Demand Generation strategies were implemented in eight PHCUs in eight woredas, two woredas in each of the four regions.
Primary Outcome 3: The strategies under this outcome aimed to increase the demand and quality of LAFP with a focus on PPFP and to improve access to and utilization of FP methods by young married adolescents. The activities include FP

7
counseling training for HEWs, comprehensive FP including postpartum IUCD insertion training of the health center staff, gap filling Implanon insertion training of HEWs, developing and supplying tools and job aids for HEWs, review meetings, and improving referral and linkages with the health center and health posts for LAFP and PPFP services. In 2017 the FP innovations, which were prototyped in eight PHCUs of eight woredas, were spread to 32 more PHCUs in 32 woredas.
Primary Outcome 4: This strategy uses mobile health solutions to improve coverage and quality of interaction for RMNCH services focusing on ANC, delivery, PPFP, PNC, possible severe bacterial infection of (PSBI) of the newborn, and immunization. The strategy, which is being prototyped in one woreda from each of the four agrarian regions, will be integrated into the electronic community health information platform of the HEP.
Primary Outcome 5: The strategy under this outcome documented program learning and gather evidence on what works and what does not so that promising project learnings can be applied locally and globally, to influence the community health systems’ and primary health care strategy in Ethiopia and provide evidence for supporting global RMNCH policies.

8

9
METHODOLOGY
Study design
Before‐and‐after cross‐sectional household surveys representing the 115 L10K 2020 woredas conducted in February‐May 2016 and October‐November 2017 was done to monitor the changes in MNH care behavior and practice indicators. Women children aged 0 to 11 months reported the MNH care behavior and practices associated with last pregnancy.
Sample size
The required sample size of women with children aged 0 to 11 months was 400 for each of the four regions and each of the intervention domains (FP, PC‐Solutions, Demand generation, and mobile health solutions). The sample size was estimated to detect at least 14 percentage‐points difference between baseline and follow‐up surveys for the MNH indicators of interest within a region (or a domain) with two‐sided alpha error set at 0.05, beta error set at 0.20, and cluster survey design effect set at 2.0.
During the follow‐up survey, the family planning and the mHealth intervention domains were not oversampled. Thus, the sample size was larger during the baseline survey compared to the follow‐up survey.
Data collection
Two‐stage cluster sampling stratified by region and intervention domain was implemented to obtain the required sample. At the first stage, kebeles were selected with each stratum with the probability of selection proportionate to its population size. At the second stage, kebeles were sub‐divided into three segments with approximately the same population size; and from each segment, the quota was to interview four target women using the WHO 30x7 EPI cluster survey method. Smartphones were used to collect data using the SurveyCTO platform of Doability.
Ethical clearances for the surveys were obtained from the ethical review boards of Amhara, Oromia, SNNP and Tigray Regional Health Bureaus and JSI.

10
Analysis
Household survey point estimates were weighted for sampling probabilities. The analysis was stratified by region, age group, and wealth quintile. Statistical tests, adjusted for cluster survey design effect, were done to estimate statistically significant (p<.05) differences in the MNH care indicators between the baseline and the follow‐up surveys, and assess the statistically significant (p<.05) disparities in the MNH care indicators by age group, wealth quintile, and geographical region during the follow‐up survey. Only the statistically significant findings are discussed in this report.

11
RESULTS
Background characteristics
A total of 4,054 and 2,724 women aged 15 to 49 years who had a live birth in the 12 months before the survey were interviewed during the baseline and follow‐up surveys, respectively. Table 1 shows the percent distribution the background characteristics of women in reproductive age who had a live birth in the 12 months before the survey.
Most of the respondents were aged 34 years or below (85 % in 2016 and 83 % in 2017). Majority of them had three or more children (56 % in 2016 and 60 % in 2017), did not have any education (61 % in 2016 and 58 % in 2017), and lived 30 minutes or further from a health facility (57 % in 2016 and 51 % in 2017). Majority of the respondents were Orthodox Christians (61 % in 2016 and 60 % in 2017), followed by Muslim (20 % in 2016 and 21 % in 2017), and then Protestant Christians (17 % in 2016 and 19 % in 2017). The proportion of respondents from Amhara region was the highest (34 %), followed by Oromia and SNNP (between 25 % and 26 %), and then Tigray (between 14 % and 15 %).
Differences in the background characteristics of the respondents were mainly observed for age group and parity. The age structure of the respondents was comparatively younger during the follow‐up survey; while the respondents during the follow‐up survey were more likely to have had three or more children.

12
Table 1: Background characteristics of the respondents, 2016 – 2017
Background characteristics Baseline (2016)
Follow‐up (2017)
Age group* 15‐19 7.6% 5.9%
20‐34 77.7% 77.0%
35‐49 14.7% 17.1%
No. of children* 1 24.8% 22.9%
2 19.0% 17.4%
3 16.4% 14.8%
4+ 39.8% 44.9%
Education No education 61.0% 57.7%
Primary 21.4% 21.8%
Higher 17.6% 20.5%
Religion Orthodox 61.6% 59.6%
Protestant 17.3% 18.8%
Muslim 20.2% 20.9%
Other 0.9% 0.8%
Distance to a <30 minutes 43.0% 49.1%
health facility 30 mins to <1 hour 33.1% 29.6%
1+ hours 23.9% 21.3%
Wealth quintile Lowest 21.6% 18.5%
Second 20.5% 19.4%
Middle 19.5% 20.5%
Fourth 19.4% 20.5%
Highest 19.0% 21.1%
Region Tigray 14.3% 14.5%
Amhara 34.4% 34.1%
Oromia 25.8% 26.2%
SNNP 25.5% 25.2%
No. of women 4,054 2,724*Statistically significant (p<.05) difference between 2016 and 2017

13
Antenatal care coverage and content
Household visit by a health worker during pregnancy
The proportion of respondents who were visited by an HEW during their last pregnancy increased by 4.2 percentage points, from 15.3 % in 2016 to 19.5 % in 2017; while the proportion of the respondents visited by a WDA during their last pregnancy increased by three percentage points, from 12 % in 2016 to 15 % in 2017 (Figure 1).
Figure 1: Antenatal care (ANC) coverage indicators, 2016 – 2017
Figures 2, 3, and 4 show household visits by a health worker during pregnancy and the ANC coverage indicators according to age group, wealth quintile, and region during the follow‐up survey. In 2017, women receiving household visits by a health worker and WDA during their last pregnancy varied significantly by region but not by age group or wealth quintile. The proportion of women visited by health worker was the highest in Tigray (34 %), followed by SNNP (24 %), Amhara (20 %), and then Oromia (7 %). Similarly, the proportion of women visited during their pregnancy by WDA was the highest in Tigray (28 %), followed by SNNP (20 %), Amhara (12 %), and then Oromia (6 %).

14
Figure 2: ANC coverage indicators by age group, 2017
Figure 3: ANC coverage indicators by wealth quintile, 2017
Figure 4: ANC coverage indicators by region, 2017

15
Antenatal care, timing, and number of visits
Figure 1 shows the ANC coverage indicators improved significantly between the baseline and the follow‐up surveys.
About 83 % of women who had a live birth in the last one year before the survey received ANC from a health facility at least once in 2016 and increased to 91 % in 2017 (an eight percentage points increase).
About 45.4 % of women aged 15‐49 with a birth in the last one year reported having received at least four ANC visits in 2016, while it was 52.3 % in 2017 (a seven percentage points increase).
The proportion of women that received ANC in the first trimester increased from 21 % in 2016 to 26 % in 2017 (a five percentage points increase).
The proportion of women that received ANC in the first and last trimester increased from 19 % in 2016 to 24 % in 2017 (a five percentage points increase).
In 2017, the ANC coverage indicators varied significantly by wealth quintile and region but not by age group (Figures 2, 3, and 4).
In general, all the four ANC coverage indicators were lower among women from relatively lower wealth quintiles. The disparities were very prominent for the coverage of four or more ANC visit (41 % in the lowest quintile and 62 % in the highest quintile), ANC visit during first trimester (22 % in the lowest quintile and 32 % in the highest quintile), and ANC visit during first and last trimester (20 % in the lowest quintile and 30 % in the highest quintile).
The coverage of any ANC visit was the lowest in Oromia (85 %) compared to the other three regions (which ranged between 92 % and 96 %). A similar pattern was for the coverage of ANC visit during the first trimester and ANC visit during the first and in last trimester.
Components of antenatal care
The critical elements of ANC are a physical examination, blood tests, urine test, tetanus toxoid injections, iron‐folic supplement and deworming medication. Between 2016 and 2017, all the different components of ANC that were received by women during their last pregnancy increased significantly (Figure 5). Between 2016 and 2017, the proportion of respondents during their previous pregnancy had: their weight measured increased from 77 % to 83 %, their blood pressure measured increased from 79 % to 87 %, their urine tested increased from 63 % to 75 %, their blood tested increased from 72 % to 81 %, received iron supplement increased from

16
75 % to 80 %, taken deworming medication increased from 10 % to 19 %, their HIV status tested increased from 56 % to 64 %, and complete ANC (i.e., the proportion of women who reported having had their weight taken, blood pressure measured, urine tested, and blood tested during their last pregnancy) increased from 49 % to 61 %.
Figure 5: ANC components, 2016 – 2017
Women receiving different components of counseling during the antenatal period of their last pregnancy increased between 2016 and 2017 (Figure 6). Between 2016 and 2017, the proportion of women who recalled being told about: breastfeeding increased from 42 % to 55 %; danger signs of pregnancy increased from 45 % to 58 %, postpartum family planning increased from 37 % to 52 %, and birth preparedness increased from 46 % to 58 %.
Figure 6: Counselling received during ANC, 2016 – 2017
17
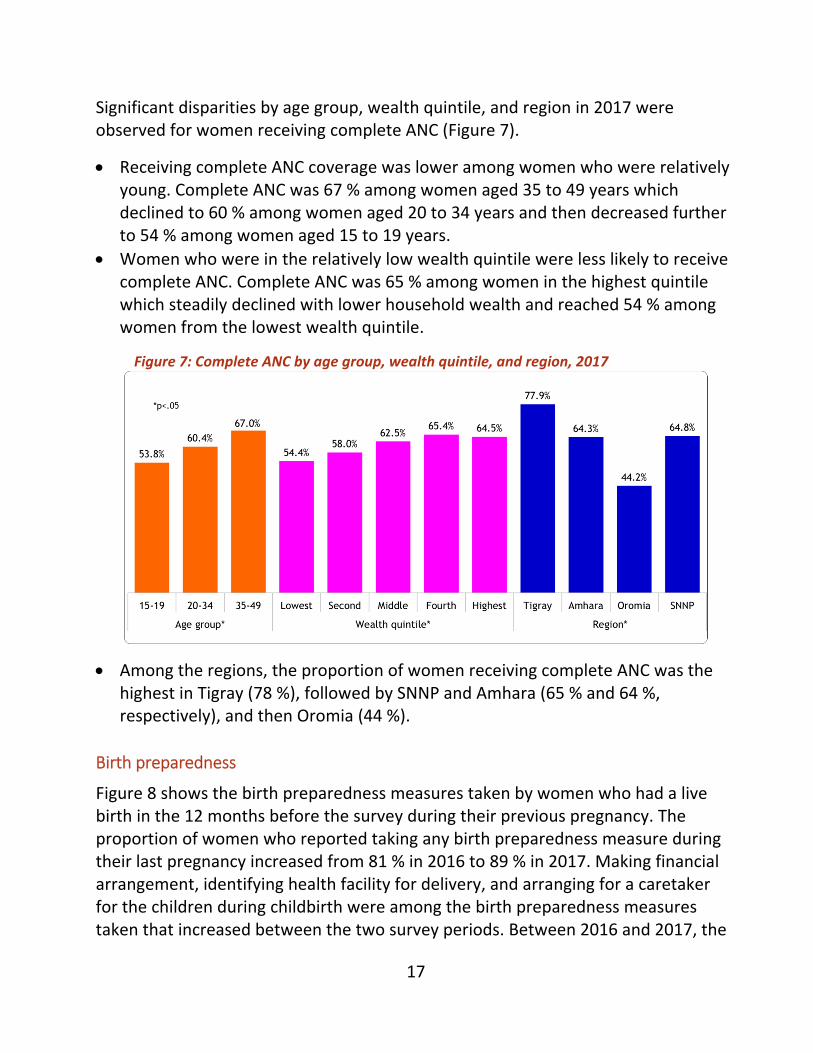
Significant disparities by age group, wealth quintile, and region in 2017 were observed for women receiving complete ANC (Figure 7).
Receiving complete ANC coverage was lower among women who were relatively young. Complete ANC was 67 % among women aged 35 to 49 years which declined to 60 % among women aged 20 to 34 years and then decreased further to 54 % among women aged 15 to 19 years.
Women who were in the relatively low wealth quintile were less likely to receive complete ANC. Complete ANC was 65 % among women in the highest quintile which steadily declined with lower household wealth and reached 54 % among women from the lowest wealth quintile.
Figure 7: Complete ANC by age group, wealth quintile, and region, 2017
Among the regions, the proportion of women receiving complete ANC was the highest in Tigray (78 %), followed by SNNP and Amhara (65 % and 64 %, respectively), and then Oromia (44 %).
Birth preparedness
Figure 8 shows the birth preparedness measures taken by women who had a live birth in the 12 months before the survey during their previous pregnancy. The proportion of women who reported taking any birth preparedness measure during their last pregnancy increased from 81 % in 2016 to 89 % in 2017. Making financial arrangement, identifying health facility for delivery, and arranging for a caretaker for the children during childbirth were among the birth preparedness measures taken that increased between the two survey periods. Between 2016 and 2017, the

18
proportion of women making financial measures for childbirth increased from 47 % to 59 %, identifying health facility for delivery increased from 20 % to 27 %, and arranging for caretaker during childbirth increased from 3 % to 6 %.
Figure 8: Changes in birth preparedness measure taken, 2016 – 2017
In 2017, there were significant disparities in taking any birth preparedness measure among women during their last pregnancy by age, wealth and region (Figure 9).
Taking any birth preparedness measure was the lowest among the women from the youngest age group (80 %), followed by women in the oldest age group (85 %), and then women in the middle age group (90 %).
Figure 9: Taken any birth preparedness measure by age, wealth quintile, and region, 2017

19
Family conversation
Family conversation is a forum where the HEW or the WDA or both discuss with an expecting mother and her family, usually husband and in‐laws, regarding birth preparedness, postnatal and postpartum care. There was no change in the proportion of women who had a family conversation during their last pregnancy between the two surveys, and it was only 10 % in 2017 (Figure 10).
Figure 10: Exposure to the family conversation and its source, 2016 – 2017
Figure 11 indicates that the proportion of women who reported having had a family conversation during their last pregnancy in 2017 was the highest in Tigray region (18 %), followed by SNNP (12 %) and Amhara (11 %), then Oromia (3 %). However, having a family conversation was not significantly different by age group or by wealth quintile.
Figure 11: Exposure to the family conversation intervention by age group, wealth quintile, and region, 2017

20
Antenatal care coverage and content indicators by survey period and by age group, wealth quintile, and region are given in Tables 2, 3, and 4.

21
Table 2: ANC coverage indicators and ANC components by age group, 2016 – 2017
Indicators 15‐19 20‐34 35‐49
2016 2017 2016 2017 2016 2017
Health worker visited 8.1% 10.9% 15.2% 20.0%* 19.3% 19.9%
WDA visited 6.1% 9.5% 11.6% 14.5% 11.4% 17.0%
ANC received 81.4% 88.5% 84.3% 91.7%* 76.8% 90.2%*
4+ ANC 43.1% 52.6% 46.8% 52.6%* 39.4% 50.6%*
ANC in first trimester 21.0% 18.8% 21.6% 27.2%* 17.5% 25.1%*
ANC in first & last trimester 20.5% 18.1% 19.9% 25.6%* 15.7% 22.3%*
Complete ANC 45.1% 53.8% 50.0% 60.4%* 46.7% 67.0%*
ANC components
Weight taken 70.3% 77.1% 78.4% 83.5%* 70.7% 83.7%*
BP measured 77.9% 82.5% 79.5% 86.8%* 74.0% 87.5%*
Urine tested 61.7% 66.9% 64.2% 75.2%* 56.4% 75.8%*
Blood tested 67.0% 76.1% 73.6% 80.9%* 64.2% 81.7%*
Iron supplement given 69.9% 72.1% 77.0% 80.5%* 70.0% 82.1%*
Deworming done 5.0% 12.6%* 9.4% 18.5%* 13.9% 22.4%*
HIV tested 51.3% 65.2%* 55.7% 62.7%* 59.0% 68.1%*
Told about ….
Breastfeeding 38.8% 43.2% 42.9% 54.9%* 39.2% 57.8%*
Danger signs 41.5% 50.7% 45.9% 58.0%* 41.8% 61.0%*
Postpartum FP 31.4% 46.3%* 38.4% 52.0%* 29.4% 56.5%*
Birth preparedness 41.4% 55.0%* 46.6% 57.6%* 43.2% 58.4%*
Birth preparedness taken 75.4% 80.5% 82.1% 90.2%* 78.7% 85%*
Family conversation
None 95.1% 94.2% 91.8% 90.0% 91.1% 87.2%
By WDA 0.0% 0.7% 1.3% 1.0% 0.8% 0.8%
By HEW 0.8% 2.4% 3.9% 4.9% 3.6% 6.8%
HEW & WDA 4.1% 2.7% 2.9% 4.1% 4.5% 5.2%
No. of women 299 170 3,115 2,072 640 482
*Statistically significant (p<0.05) difference between the survey periods
22
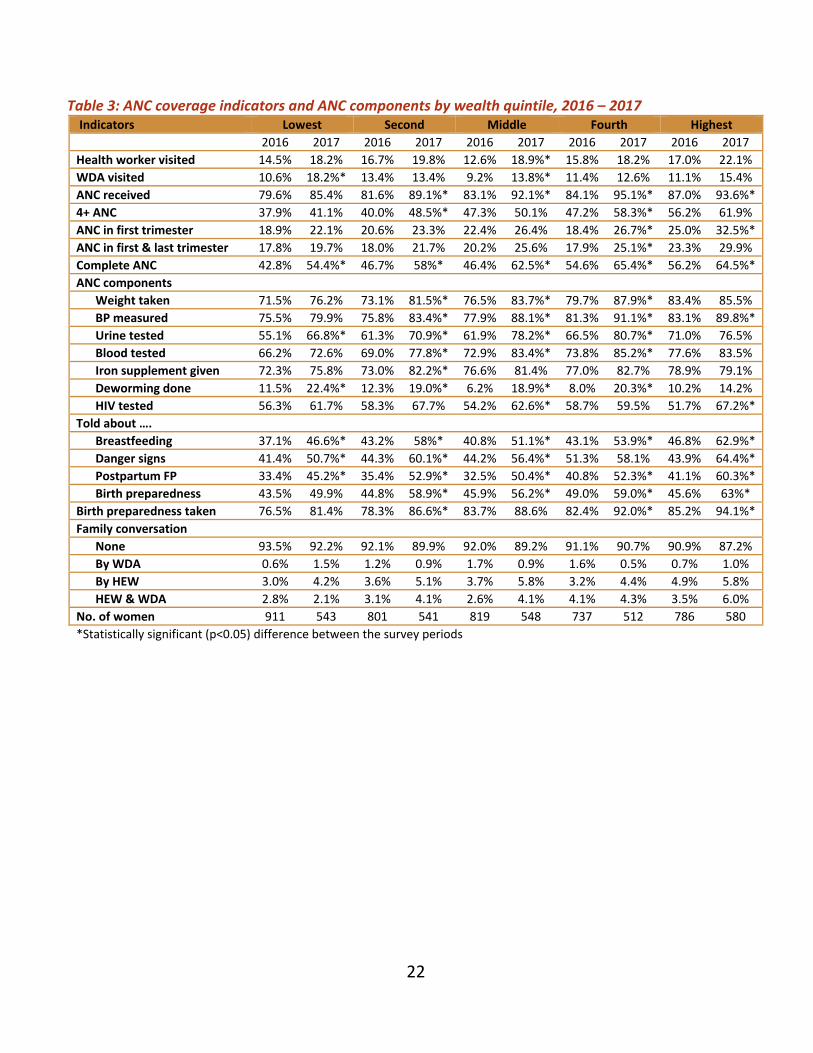
Table 3: ANC coverage indicators and ANC components by wealth quintile, 2016 – 2017 Indicators Lowest Second Middle Fourth Highest
2016 2017 2016 2017 2016 2017 2016 2017 2016 2017
Health worker visited 14.5% 18.2% 16.7% 19.8% 12.6% 18.9%* 15.8% 18.2% 17.0% 22.1%
WDA visited 10.6% 18.2%* 13.4% 13.4% 9.2% 13.8%* 11.4% 12.6% 11.1% 15.4%
ANC received 79.6% 85.4% 81.6% 89.1%* 83.1% 92.1%* 84.1% 95.1%* 87.0% 93.6%*
4+ ANC 37.9% 41.1% 40.0% 48.5%* 47.3% 50.1% 47.2% 58.3%* 56.2% 61.9%
ANC in first trimester 18.9% 22.1% 20.6% 23.3% 22.4% 26.4% 18.4% 26.7%* 25.0% 32.5%*
ANC in first & last trimester 17.8% 19.7% 18.0% 21.7% 20.2% 25.6% 17.9% 25.1%* 23.3% 29.9%
Complete ANC 42.8% 54.4%* 46.7% 58%* 46.4% 62.5%* 54.6% 65.4%* 56.2% 64.5%*
ANC components
Weight taken 71.5% 76.2% 73.1% 81.5%* 76.5% 83.7%* 79.7% 87.9%* 83.4% 85.5%
BP measured 75.5% 79.9% 75.8% 83.4%* 77.9% 88.1%* 81.3% 91.1%* 83.1% 89.8%*
Urine tested 55.1% 66.8%* 61.3% 70.9%* 61.9% 78.2%* 66.5% 80.7%* 71.0% 76.5%
Blood tested 66.2% 72.6% 69.0% 77.8%* 72.9% 83.4%* 73.8% 85.2%* 77.6% 83.5%
Iron supplement given 72.3% 75.8% 73.0% 82.2%* 76.6% 81.4% 77.0% 82.7% 78.9% 79.1%
Deworming done 11.5% 22.4%* 12.3% 19.0%* 6.2% 18.9%* 8.0% 20.3%* 10.2% 14.2%
HIV tested 56.3% 61.7% 58.3% 67.7% 54.2% 62.6%* 58.7% 59.5% 51.7% 67.2%*
Told about ….
Breastfeeding 37.1% 46.6%* 43.2% 58%* 40.8% 51.1%* 43.1% 53.9%* 46.8% 62.9%*
Danger signs 41.4% 50.7%* 44.3% 60.1%* 44.2% 56.4%* 51.3% 58.1% 43.9% 64.4%*
Postpartum FP 33.4% 45.2%* 35.4% 52.9%* 32.5% 50.4%* 40.8% 52.3%* 41.1% 60.3%*
Birth preparedness 43.5% 49.9% 44.8% 58.9%* 45.9% 56.2%* 49.0% 59.0%* 45.6% 63%*
Birth preparedness taken 76.5% 81.4% 78.3% 86.6%* 83.7% 88.6% 82.4% 92.0%* 85.2% 94.1%*
Family conversation
None 93.5% 92.2% 92.1% 89.9% 92.0% 89.2% 91.1% 90.7% 90.9% 87.2%
By WDA 0.6% 1.5% 1.2% 0.9% 1.7% 0.9% 1.6% 0.5% 0.7% 1.0%
By HEW 3.0% 4.2% 3.6% 5.1% 3.7% 5.8% 3.2% 4.4% 4.9% 5.8%
HEW & WDA 2.8% 2.1% 3.1% 4.1% 2.6% 4.1% 4.1% 4.3% 3.5% 6.0%
No. of women 911 543 801 541 819 548 737 512 786 580
*Statistically significant (p<0.05) difference between the survey periods

23
Table 4: ANC coverage indicators and ANC components by region, 2016 – 2017
Indicators Tigray Amhara Oromia SNNP
2016 2017 2016 2017 2016 2017 2016 2017
Health worker visited 35.4% 33.5% 15.4% 20.0% 4.7% 6.5% 14.6% 24.2%*
WDA visited 27.9% 28.1% 9.5% 11.8% 3.8% 5.8% 11.3% 19.7%*
ANC received 91.1% 95.5%* 83.1% 91.8%* 73.2% 84.6%* 88.1% 94.7%*
4+ ANC 59.5% 66.1% 35.0% 42.5% 34.6% 45.2%* 62.8% 64.5%
ANC in first trimester 22.3% 32.0%* 28.5% 29.3% 11.9% 17.0% 19.3% 28.7%*
ANC in 1st & last trimester 19.9% 31.5%* 26.4% 26.5% 10.6% 15.1% 18.6% 27.7%*
Complete ANC 69.7% 77.9%* 48.2% 64.3%* 40.5% 44.2% 47.8% 64.8%*
ANC components
Weight taken 87.0% 91.9% 74.8% 80.9% 66.3% 75.5%* 83.5% 88.8%*
BP measured 88.7% 93.8% 78.1% 87.0%* 67.2% 77.8%* 84.9% 91.3%*
Urine tested 81.5% 87.0%* 60.1% 74.2%* 50.7% 61.2%* 68.8% 82.7%*
Blood tested 85.0% 92.8%* 70.3% 81.5%* 59.4% 63.9% 78.7% 89.8%*
Iron supplement given 87.9% 87.8% 76.1% 87.5%* 60.1% 65.3% 82.6% 81.3%
Deworming done 9.5% 15.3%* 16.2% 35.1%* 3.2% 8.0%* 7.7% 10.2%
HIV tested 63.3% 73.6%* 66.7% 79.4%* 37.8% 36.2% 52.8% 63.2%*
Told about ….
Breastfeeding 60.7% 65.4% 41.0% 63.6%* 33.0% 35.8% 42.2% 56.0%*
Danger signs 62.1% 69.3% 47.8% 69.0%* 30.7% 38.1%* 45.8% 57.7%*
Postpartum FP 55.9% 66.4%* 35.7% 59.5%* 27.6% 34.0%* 35.8% 53.9%*
Birth preparedness 62.9% 69.8% 51.5% 67.1%* 30.4% 39.6%* 43.8% 56.3%*
Birth preparedness taken 92.3% 94.9% 79.6% 84.4% 75.7% 88.1%* 82.2% 91.7%*
Family conversation
None 74.7% 82.2% 93.7% 89.2%* 98.4% 96.8% 92.8% 87.7%
By WDA 2.8% 2.2% 1.8% 0.7% 0.0% 0.6% 0.5% 1.0%
By HEW 10.7% 10.7% 3.1% 6.0% 1.4% 1.7% 2.7% 4.3%
HEW & WDA 11.8% 5.0% 1.4% 4.1% 0.2% 0.9% 4.0% 7.0%
No. of women 961 612 1,044 708 1,027 708 1,022 696
*Statistically significant (p<0.05) difference between the survey periods

24
Childbirth and perinatal care
Neonatal tetanus protected childbirths
Protection of the newborn from neonatal tetanus depends on the number and timing of tetanus toxoid vaccination of the mother. A newborn baby is considered protected against neonatal tetanus if the mother has received any of the following: two tetanus toxoid injections during that pregnancy; two or more injections, the last one within 3 years of the birth; three or more injections, the last one within 5 years of the birth; four or more injections, the last one within 10 years of the birth; or five or more injections at any time prior to the delivery. In this study, the women aged 15‐49 who had a live birth in the last 12 months before the survey were asked about their vaccination history. Figure 12 shows that the proportion of women whose recent births were protected against neonatal tetanus increased from 58 % in 2016 to 65 % in 2017.
In 2017, there was a disparity in neonatal tetanus protected childbirth birth by wealth but not by age group or by region (Figures 13, 14 and 15). It was the lowest (58 %) among the women from the poorest wealth quintile and then gradually increased with wealth and was 69 % among women from the highest wealth quintile.
Figure 12: Neonatal tetanus protected birth, institutional delivery, skilled birth attendance, birth notification and birth attendant handwashing, 2016‐2017

25
Institutional delivery and skilled birth attendance
The proportion of the live births in the last one year before the survey that took place at a hospital or a health center (i.e., institutional or facility deliveries) has increased from 59 % in 2016 to 66 % in 2017 (seven percentage points increase; Figure 12).
Skilled birth attendance is birth delivered with the aid of doctors, nurse/midwives, health officers and health extension workers. In the last one year before the survey, live births that were delivered by a skilled provider have increased from 61 % in 2016 to 67 % in 2017 (six percentage points increase).
There were disparities in institutional delivery and skilled birth attendance rates due to wealth and region in 2017, but not by age group (Figures 13, 14 and 15).
Women in the higher wealth quintiles were more likely to have institutional deliveries and skilled birth attendance compared to women from the lower wealth quintiles. The proportions of women with institution delivery and the percentage that had skilled birth attendance were respectively 77 % and 78 % among the highest wealth quintile, while both of the indicators were 54 % among the lowest wealth quintile in 2017.
Institutional delivery and skilled birth attendance were the highest in Tigray region (84 % and 86 %, respectively), followed by SNNP (77 % for both indicators), and then Oromia and Amhara (ranged between 56 % and 59 %).
Birth attendant handwashing
Birth attendant handwashing can improve newborn survival in poor resource settings. The proportion of women who reported that the birth attendant washed his or her hands before assisting delivery of their last birth was 74 % in 2016 and 75 % in 2017 (Figure 12).
The proportion of women who reported that the birth attendant had washed his or her hands before assisting childbirth was associated with higher wealth and region in 2017 (Figures 13, 14, and 15).
Birth attendant washing their hands before assisting delivery was between 78 % and 80 % among women from the highest three wealth quintiles while it was 72 % among the second lowest wealth quintile and 66 % among the lowest wealth quintile.

26
Birth attendant washing their hands was the highest in the SNNP region (83 %), followed by Tigray (78 %) and Amhara (75 %), and then Oromia (65 %).
Figure 13: Neonatal tetanus protected birth, institutional delivery, skilled birth attendance, birth notification and birth attendant handwashing by age group, 2017
Figure 14: Neonatal tetanus protected birth, institutional delivery, skilled birth attendance, birth notification and birth attendant handwashing by wealth, 2017
Figure 15: Neonatal tetanus protected birth, institutional delivery, skilled birth attendance, birth notification and birth attendant handwashing by region, 2017

27
Birth notification
Birth notification is a program strategy by which HEWs are notified about childbirth taking place so that she can visit the mother and the baby for postnatal care (PNC) within 48 hours after childbirth. The notification is usually done by a family member of the women who gave childbirth. Figure 12 shows that birth notification of home deliveries among women during their last childbirth increased from 47 % in 2016 to 55 % in 2017 while birth notification for institutional deliveries increased from 39 % to 50 % during that period.
In 2017 notification of home deliveries varied by age group, wealth quintile, and region; while notification of hospital deliveries varied by region (Figures 13, 14, and 15).
The proportion of home births that were notified to the HEWs was higher among the women in the older age group than those younger (61 % among women 35 to 45 years, 55 % among women 20 to 34 years, and 44 % among women 15 to 19 years).
Interestingly birth notification was higher among women who were from relatively low wealth quintiles. It was 62 %, 58 %, 59 %, 50 %, and 48 % among the lowest to the highest wealth quintile, respectively.
Both home and institutional birth notification rate were the highest in Tigray (70 % and 68 % respectively), followed by SNNP (57 % and 55 %, respectively) and Amhara (57 % and 49 %, respectively), and then Oromia (38 % and 32 %, respectively).
Respectful maternity care
Figure 16 presents selected respectful maternity care indicators in 2016 and 2017s. The survey asked the respondents about the provider’s attitude during delivery. Overall, women reporting any disrespectful or abusive behaviors during childbirth were low (below 10 %). For example, only 8 % and 5 % of the respondents in 2016 and 2017 respectively reported that provider’s attitude during delivery care was disrespectful or somewhat disrespectful. Nonetheless, the proportion of women who stated that the provider did not seek permission before doing physical examination declined from 0.7 % in 2016 to 0.1 % in 2017, and the reporting of lack of privacy fell from 3 % to 1 %.

28
Figure 16: Respectful care indicators, 2016‐2017
Reporting any disrespectful or abusive behaviors of the service providers during childbirth was the highest among women from the highest wealth quintile and among women from the Oromia region in 2017 (Figure 17).
Figure 17: Any disrespect or abuse by age group, wealth and region, 2017
Neonatal tetanus protected childbirth, institutional delivery, skilled birth attendance, birth attendant handwashing, birth notification and respectful care indicators by survey period and by age group, wealth quintile and region are given in Tables 5, 6, and 7.

29
Table 5: Neonatal tetanus protected birth, institutional delivery, skilled birth attendance, birth notification, birth attendant handwashing and respectful care by age group, 2016‐2017
Indicators 15-19 20-34 35-49
2016 2017 2016 2017 2016 2017
Neonatal tetanus protected birth 63.9% 57.9% 58.3% 66.1%* 51.9% 60.7%*
Institutional delivery 67.3% 71.3% 58.7% 66.9%* 54.9% 60.5%
Skilled birth attendance 66.3% 71.1% 59.7% 68.0%* 55.7% 63.1%
Birth notification (institutional birth) 35.6% 44.5% 44.9% 54.7%* 48.8% 61.0%*
Birth notification (home birth) 31.4% 41.1% 39.9% 50.2%* 41.5% 54.8%*
Handwashing (birth attendant) 79.9% 71.1% 76.2% 72.7% 72.3% 67.5%
Provider attitude during care
Very respectful 4.5% 0.9% 4.3% 2.4% 2.4% 2.0%
Disrespectful 3.0% 4.3% 2.3% 2.6% 2.6% 2.8%
Somewhat disrespectful 0.1% 1.2%* 1.4% 0.5%* 0.4% 0.0%
Not much disrespectful 1.2% 0.1%* 1.3% 1.4% 0.0% 0.3%
Not disrespectful 91.2% 93.6% 90.7% 93.1% 94.5% 94.9%
Physically abused during care 1.2% 1.0% 2.1% 1.6% 0.0% 0.0%
Verbally abused during care 5.4% 3.3% 3.7% 3.6% 1.6% 1.1%
Did not seek consent 1.1% 0.0% 0.7% 0.0%* 0.4% 0.6%
Did not maintain privacy 3.4% 1.4% 2.8% 1.0%* 1.0% 1.1%
Confidentiality violated 5.7% 12.0% 8.3% 4.2%* 3.0% 4.3%
Left unattended 3.9% 2.9% 3.6% 2.6% 0.8% 2.2%
Community address disrespectful care 1.8% 5.1% 2.7% 5.0% 2.1% 2.6%
No. of women 299 170 3,115 2,072 640 482 *Statistically significant (p<0.05) difference between the survey periods

30
Table 6: Neonatal tetanus protected birth, institutional delivery, skilled birth attendance, birth notification, birth attendant handwashing and respectful care by wealth, 2016‐2017
Indicators Lowest Second Middle Fourth Highest
2016 2017 2016 2017 2016 2017 2016 2017 2016 2017
Neonatal tetanus protected birth 50.9% 58.1%* 54.6% 59.8% 57.6% 65.4%* 63.0% 66.3% 63.8% 72.7%*
Institutional delivery 49.0% 54.2% 56.4% 61.2% 60.3% 66.8% 63.4% 68.6% 68.6% 78.0%*
Skilled birth attendance 51.3% 54.3% 57.8% 63.5% 61.1% 67.2% 64.8% 71.9% 69.4% 78.3%*
Birth notification (institutional birth) 50.7% 62.4%* 49.9% 58.5% 39.1% 58.9%* 40.9% 50.3%* 43.0% 48.5%
Birth notification (home birth)
45.5% 55.8% 43.6% 52.7% 34.8% 53.8%* 36.3% 47.4%* 37.4% 45.0%
Handwashing (birth attendant)
72.0% 63.4%* 73.3% 69.3% 74.3% 75.3% 77.9% 75.6% 82.4% 74.5%
Provider attitude during care
Very respectful 4.2% 2.1% 3.1% 1.3% 4.8% 2.9% 4.6% 2.2% 3.7% 2.5%
Disrespectful 0.6% 0.0% 3.2% 1.7% 2.5% 2.1% 1.7% 2.2% 3.6% 6.1%
Somewhat disrespectful 0.3% 0.0% 0.0% 0.4% 1.2% 0.0% 1.7% 0.9% 2.2% 0.7%
Not much disrespectful 1.2% 1.7% 0.1% 0.7% 0.4% 1.1% 1.1% 0.4% 2.5% 1.9%
Not disrespectful 93.6% 96.2% 93.7% 96.0% 91.1% 93.9% 90.9% 94.3% 88.0% 88.8%
Physically abused during care 1.8% 1.6% 0.0% 1.0%* 0.9% 1.2% 2.9% 0.5%* 2.9% 2.1%
Verbally abused during care 3.3% 2.2% 1.3% 2.8% 2.9% 3.8% 5.1% 1.2%* 4.7% 5.4%
Did not seek consent 0.3% 0.0% 0.0% 0.0% 0.0% 0.0% 2.1% 0.4% 0.9% 0.0%*
Did not maintain privacy 4.4% 1.3% 1.0% 0.3% 0.6% 2.2% 3.7% 0.0%* 3.3% 1.4%
Confidentiality violated 6.6% 2.8% 5.1% 3.9% 8.5% 4.3% 8.9% 6.4% 7.5% 5.5%
Left unattended 1.9% 2.5% 1.8% 1.4% 3.4% 1.3% 4.3% 1.5% 4.5% 5.4%
Community address disrespectful care
1.0% 2.2% 1.3% 3.7% 0.6% 4.9%* 4.4% 2.5% 4.9% 8.5%
No. of women 911 543 801 541 819 548 737 512 786 580
*Statistically significant (p<0.05) difference between the survey periods

31
Table 7: Neonatal tetanus protected birth, institutional delivery, skilled birth attendance, birth notification, birth attendant handwashing, and respectful care by region, 2016‐2017
Indicators Tigray Amhara Oromia SNNP
2016 2017 2016 2017 2016 2017 2016 2017
Neonatal tetanus protected birth 60.2% 61.4% 47.8% 60.7%* 60.1% 67.9%* 67.6% 68.6%
Institutional delivery 80.0% 84.2%* 49.0% 56.2%* 58.6% 58.3% 62.6% 77.1%*
Skilled birth attendance 84.0% 86.6% 49.0% 57.3%* 58.8% 59.6% 64.6% 78.0%*
Birth notification (institutional birth) 52.3% 70.3%* 54.4% 57.4% 28.7% 37.8% 42.2% 57.1%*
Birth notification (home birth) 49.4% 68.7%* 47.0% 49.1% 24.8% 31.6% 37.1% 54.6%*
Handwashing (birth attendant) 74.5% 66.7% 79.3% 74.6% 70.0% 60.1%* 77.9% 81.3%
Provider attitude during care
Very respectful 4.4% 1.3%* 0.9% 3.4% 8.3% 3.7% 3.2% 0.6%*
Disrespectful 1.6% 0.6% 0.9% 0.4% 5.5% 8.9% 1.5% 1.4%
Somewhat disrespectful 0.9% 0.0%* 0.5% 0.0% 2.5% 1.9% 0.7% 0.0%*
Not much disrespectful 0.4% 0.6% 1.0% 1.3% 1.9% 1.2% 1.0% 1.4%
Not disrespectful 92.8% 97.5%* 96.6% 95.0% 81.8% 84.3% 93.7% 96.6%
Physically abused during care 0.9% 0.3% 2.0% 1.2% 0.9% 1.2% 3.0% 2.0%
Verbally abused during care 1.9% 3.0% 3.8% 1.8% 3.3% 5.9% 4.5% 2.6%
Did not seek consent 0.9% 0.0% 0.5% 0.0% 0.1% 0.0% 1.4% 0.3%
Did not maintain privacy 4.5% 0.9%* 2.0% 2.5% 2.0% 0.6% 2.5% 0.0%*
Confidentiality violated 4.5% 0.0%* 9.2% 4.1% 9.2% 11.1% 5.7% 3.4%
Left unattended 0.7% 1.0% 4.4% 3.4% 2.9% 5.4% 4.3% 0.4%*
Community address disrespectful care 2.6% 9.2% 2.5% 4.2% 4.5% 6.4% 0.8% 0.8%
No. of women 961 612 1,044 708 1,027 708 1,022 696
*Statistically significant (p<0.05) difference between the survey periods

32
Postpartum care
Postnatal care of the mother
Prompt postnatal care (PNC) for both the mother and her newborn is vital to timely identify and manage newborn illnesses and maternal complications that may arise from delivery. It is also an opportunity to provide mothers with valuable information on caring for herself and her baby. Women who were visited by the HEW during the postnatal period for a check‐up during their last pregnancy or women whose last birth was at a hospital or a health center and stayed in the health facility 24 hours or longer after giving birth were considered as having had postnatal care at the least once. Similarly, PNC of the baby was defined. In general, women who had a normal delivery at the health center are discharged after six hours after giving birth. Any PNC, PNC within 48 hours from childbirth, and PNC within seven days of childbirth are reported.
Figure 18: Postpartum care (PPC) of the mother and postnatal care (PNC) of the baby, 2016‐2017
The proportion of women during their last postnatal period who received any postpartum care (PPC), who received PPC within 7 days after childbirth, and who received PPC within 48 hours after delivery (early PNC) were respectively 36 %, 32 %, and 25 % in 2016 which increased to 42 %, 39 % and 32 %, respectively, in 2017 (Figure 18). Similarly, the proportion of women whose last newborn received any PNC, received PNC within seven days after birth, and received early

33
PNC were respectively 31 %, 28, and 24 % in 2016 which increased to 38 %, 35 %, and 30 %, respectively, in 2017.
The vast majority (> 84 %) of the early PNC of the mother and early PNC of her baby was due to the women staying at the health facility for 24 hours or more after giving birth. The proportion of women whose last childbirth took place at a health center or a hospital and who stayed at the health facility for 24 hours or more after their delivery was 21 % in 2016 and 27 % in 2017 (Figure 18).
In 2017, all the PPC coverage indicators for the mother and all the PNC coverage indicators for the baby varied with wealth quintile and region, but not by age group. Staying longer at the health facility after delivery differed only by region in 2017 (Figures 19, 20, and 21).
Early PNC coverage of mothers was the highest (38 %) among women in the highest wealth quintile and then gradually declined among women in the lower wealth quintiles and was the lowest (25 %) among women from the lowest wealth quintile. A similar pattern was observed for all the other PNC indicators for the mother and the baby. Early PPC coverage of the mother and the early PNC coverage of the baby within 48 hours from birth were the highest in Tigray (respectively 38 % and 39 %) and Oromia (respectively 39 % and 36 %) and the lowest in Amhara (respectively 23 % and 22 %).
In general, the coverage of mother and the coverage of baby receiving any PNC and PNC within seven days from birth was the highest in Tigray (ranged between 48 % and 55 %), and the lowest in Amhara (ranged between 27 % and 33 %).
Women staying at the health facility for 24 hours or more was the highest in Tigray and Oromia regions (32 % each), followed by SNNP (28 %), and then Amhara (19 %).

34
Figure 19: Postpartum care (PPC) of mother and postnatal care (PNC) of baby by age group, 2017
Figure 20: PPC of mother and PNC of baby by wealth quintile, 2017
Figure 21: PPC of mother and PNC of baby by region, 2017

35
Family planning counseling during PNC visits
Postnatal care is one of the opportunities to counsel mothers about family planning, among others. Only 12.9 % and 13.2 % of mothers were counseled about family planning during postnatal visits in 2016 and 2017, respectively (Figure 17). Postpartum family planning counseling was not associated with age group, wealth quintile, and region (Figures 19, 20, and 21).
Immediate newborn care
Immediate newborn care and infant breastfeeding practices in 2016 and 2017 are provided in Figure 22. Care for umbilical cord is a critical newborn care practice to prevent newborn infection. Clean cord care was considered if the umbilical cord of the newborn was cut with a sterile instrument, the cut end of the umbilical cord was tied with a sterile thread, and had applied nothing other than chlorohexidine on the cut end of the umbilical cord.
Figure 22: Newborn care practices and exclusive breastfeeding, 2016‐2017
The proportion of women who reported that the baby was dried or whipped before the placenta was delivered increased from 71 % in 2016 to 75 % in 2017. During the same period, there was a fourfold increase in the application of chlorhexidine on the cord (4.1 % in 2016 and 17.4 % in 2017). Clean cord practice was 77 % in 2016 and 81 % in 2017, putting the baby on mother’s belly or chest before the delivery of the placenta was 35 % in 2016 and 33 % in 2017, delay bathing the baby by 12 hours or more was 60 % in 2016 and 62 % in 2017, while initiating breastfeeding within an

36
hour from childbirth (i.e., immediately initiating breastfeeding) declined from 85 % in 2016 to 80 % in 2017.
Figure 23: Newborn care practices and exclusive breastfeeding by age group, 2017
Figure 24: Newborn care practices and exclusive breastfeeding by wealth quintile, 2017
Figure 25: Newborn care practices and exclusive breastfeeding by region, 2017
Significant regional variations were observed for all the immediate newborn care indicators in 2017 (Figures 23, 24, and 25). Clean cord care practice, application of

37
chlorhexidine on the cord, delay bathing the newborn and immediately initiating breastfeeding varied significantly by wealth quintile and region; dried baby immediately after childbirth and maintaining skin‐to‐skin contact with the baby varied significantly by region; while immediately initiating breastfeeding also differed by the age of the women.
Exclusive breastfeeding
The proportion of the infants aged five months or younger who were given only breastmilk during the 72 hours preceding the survey defined as exclusive breastfeeding was 98 % in 2016 and 95 % in 2017 (Figure 22). There were no significant disparities in exclusive breastfeeding by age group, wealth and region.
Newborn care practices and exclusive breastfeeding by survey period and by age group, wealth quintile, and geographical region are given in Tables 8, 9 and 10.

38
Table 8: Postpartum care (PPC) of mothers, postnatal care (PNC) off baby, newborn care practices, and exclusive breastfeeding for children by age group, 2016‐2017
Indicators 15-19 20-34 35-49
2016 2017 2016 2017 2016 2017
PPC of the mother in 48 hrs 20.3% 33.9%* 25.5% 32.5%* 27.1% 30.1%
PPC of the mother in 7 days 25.1% 34.7% 32.6% 39.7%* 32.7% 37.7%
Any PPC of the mother 26.8% 34.7% 36.4% 43.1%* 37.1% 40.3%
PNC of the baby in 48 hours 21.2% 31.9% 24.0% 30.3%* 24.3% 29.4%
PNC of the baby in 7 days 26.5% 32.6% 28.2% 35.6%* 29.8% 34.5%
Any PNC of the baby 28.4% 32.9% 31.4% 38.6%* 31.7% 37.2% Mother stayed at the facility more than 24 hours
19.2% 30.2% 21.3% 26.5%* 20.5% 26.1%
FP counselling provided during PNC 14.4% 8.6% 13.4% 14.6% 9.8% 7.0%
Clean cord care 81.8% 78.4% 77.6% 81.5%* 73.2% 79.8%
Applied chlorhexidine on cord 4.8% 17.3%* 4.3% 17.6%* 2.6% 16.8%*
Dried baby immediately after birth 71.0% 75.0% 70.6% 76.1%* 74.1% 70.2%
Maintained skin-to-skin care 36.2% 27.5% 35.2% 34.5% 33.3% 30.4%
Delayed bathing >12 hours 59.9% 58.0% 60.4% 62.8% 59.4% 59.4%
Immediately initiated breastfeeding 90.5% 81.4%* 85.4% 81.4%* 78.3% 74.6%
Exclusive breastfeeding 96.4% 94.0% 98.3% 94.2%* 96.4% 97.5%
No. of women 299 170 3115 2072 640 482 *Statistically significant (p<0.05) difference between the survey periods

39
Table 9: PPC of mothers, PNC off baby, newborn care practices, and exclusive breastfeeding for children by wealth quintile, 2016‐2017
Indicators Lowest Second Middle Fourth Highest
2016 2017 2016 2017 2016 2017 2016 2017 2016 2017
PPC of the mother in 48 hrs 22.4% 25.2% 25.6% 28.4% 23.1% 32.2%* 26.3% 35.8%* 29.8% 38.0%
PPC of the mother in 7 days 29.3% 31.6% 33.7% 33.7% 28.8% 38.7%* 31.2% 43.7%* 37.9% 46.3%*
Any PPC of the mother 32.1% 35.7% 37.6% 35.2% 33.5% 41.6%* 34.4% 47.5%* 41.7% 49.5%
PNC of the baby in 48 hours 20.9% 26.2% 24.8% 25.6% 20.7% 30.6%* 24.1% 31.7%* 29.0% 36.1%
PNC of the baby in 7 days 26.8% 30.8% 29.2% 29.9% 24.5% 34.7%* 27.9% 37.1%* 33.4% 42.7%*
Any PNC of the baby 29.9% 34.1% 31.4% 32.0% 27.4% 37.2%* 29.9% 40.4%* 37.8% 45.6%
Mother stayed at the facility more than 24 hours 17.8% 22.0% 21.3% 22.8% 18.7% 28.1%* 21.0% 29.0%* 26.9% 30.5%
FP counselling provided during PNC
11.2% 4.9% 8.4% 12.4% 18.8% 11.6% 13.8% 15.7% 13.7% 17.4%
Clean cord care 68.5% 70.8% 72.7% 78.4% 79.8% 81.7% 82.2% 85.8% 84.8% 87.3%
Applied chlorhexidine on cord
4.1% 14.8%* 2.9% 12.4%* 4.4% 18.3%* 4.1% 21.4%* 5.1% 20.0%*
Dried baby immediately after birth
68.0% 69.8% 70.0% 73.0% 72.5% 79.2%* 71.4% 77.6% 74.2% 74.9%
Maintained skin-to-skin care 30.5% 31.7% 32.8% 30.9% 38.8% 33.8% 37.6% 32.6% 36.0% 37.7%
Delayed bathing >12 hours 55.6% 54.9% 56.4% 59.5% 60.7% 63.1% 62.1% 60.2% 67.1% 70.9%
Immediately initiated breastfeeding
75.6% 72.7% 82.0% 75.8% 86.2% 78.8%* 90.3% 83.7%* 90.7% 88.8%
Exclusive breastfeeding 97.7% 95.3% 98.7% 95.9% 99.1% 94.8%* 97.5% 94.1% 96.4% 93.4%
No. of women 911 543 801 541 819 548 737 512 786 580
*Statistically significant (p<0.05) difference between the survey periods
40
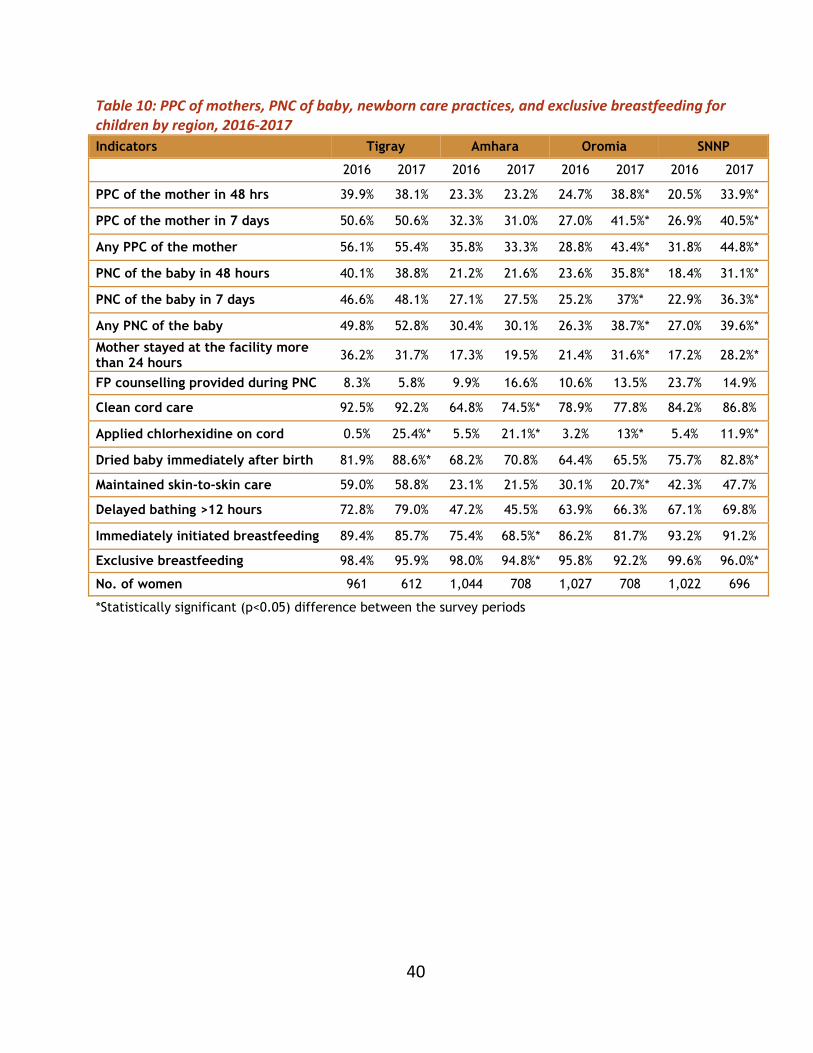
Table 10: PPC of mothers, PNC of baby, newborn care practices, and exclusive breastfeeding for children by region, 2016‐2017
Indicators Tigray Amhara Oromia SNNP
2016 2017 2016 2017 2016 2017 2016 2017
PPC of the mother in 48 hrs 39.9% 38.1% 23.3% 23.2% 24.7% 38.8%* 20.5% 33.9%*
PPC of the mother in 7 days 50.6% 50.6% 32.3% 31.0% 27.0% 41.5%* 26.9% 40.5%*
Any PPC of the mother 56.1% 55.4% 35.8% 33.3% 28.8% 43.4%* 31.8% 44.8%*
PNC of the baby in 48 hours 40.1% 38.8% 21.2% 21.6% 23.6% 35.8%* 18.4% 31.1%*
PNC of the baby in 7 days 46.6% 48.1% 27.1% 27.5% 25.2% 37%* 22.9% 36.3%*
Any PNC of the baby 49.8% 52.8% 30.4% 30.1% 26.3% 38.7%* 27.0% 39.6%*
Mother stayed at the facility more than 24 hours 36.2% 31.7% 17.3% 19.5% 21.4% 31.6%* 17.2% 28.2%*
FP counselling provided during PNC 8.3% 5.8% 9.9% 16.6% 10.6% 13.5% 23.7% 14.9%
Clean cord care 92.5% 92.2% 64.8% 74.5%* 78.9% 77.8% 84.2% 86.8%
Applied chlorhexidine on cord 0.5% 25.4%* 5.5% 21.1%* 3.2% 13%* 5.4% 11.9%*
Dried baby immediately after birth 81.9% 88.6%* 68.2% 70.8% 64.4% 65.5% 75.7% 82.8%*
Maintained skin-to-skin care 59.0% 58.8% 23.1% 21.5% 30.1% 20.7%* 42.3% 47.7%
Delayed bathing >12 hours 72.8% 79.0% 47.2% 45.5% 63.9% 66.3% 67.1% 69.8%
Immediately initiated breastfeeding 89.4% 85.7% 75.4% 68.5%* 86.2% 81.7% 93.2% 91.2%
Exclusive breastfeeding 98.4% 95.9% 98.0% 94.8%* 95.8% 92.2% 99.6% 96.0%*
No. of women 961 612 1,044 708 1,027 708 1,022 696
*Statistically significant (p<0.05) difference between the survey periods

41
CONCLUSION The study indicates that there were improvements in the coverage and quality of antenatal care services, coverage of neonatal tetanus protected childbirths, institutional deliveries, birth notification for early postnatal care, early postpartum care of the mother and early postnatal care of the baby, clean cord care, chlorhexidine application on the cord, and drying the baby immediately after birth in the intervention areas during the first two years of the L10K 2020 project. In general, disrespectful and abusive behaviors of the service providers were low.
Changes in MNH care behaviors and practices during the observation period were not observed for most of the birth preparedness measures, family conversation, handwashing of birth attendant, maintaining skin‐to‐skin care of the newborn, delay bathing the newborn, and exclusive breastfeeding; while there was a decline in the practice of initiating breastfeeding immediately after birth.
Disparities in MNH care indicators due to younger age of the mother were observed for quality of antenatal care services, and notification of births for early postnatal care. However, older women were less likely to initiate early breastfeeding.
Disparities favoring women from wealthier households were observed for antenatal care coverage indicators, quality of antenatal care services, taking any birth preparedness measures, neonatal tetanus protected childbirths, institutional deliveries including skilled birth attendance, birth attendant washing hands, early postnatal care of the mother and the baby, and initiating early breastfeeding.
Although wealthier women are likely to be more educated and more proactively seek MNH services and demand a better quality of services, minimizing wealth disparities, especially for the provision of quality of MNH care services will be essential to achieve the HSTP targets. Further studies will be needed to understand why some of the immediate newborn practices did not improve.

42