materials knowledge systems in python—a data science ... · materials knowledge systems in...
TRANSCRIPT

Integr Mater Manuf Innov (2017) 6:36–53DOI 10.1007/s40192-017-0089-0
RESEARCH
Materials Knowledge Systems in Python—a Data ScienceFramework for Accelerated Developmentof Hierarchical Materials
David B Brough1 ·Daniel Wheeler2 · Surya R. Kalidindi1,3
Received: 10 September 2016 / Accepted: 28 October 2016 / Published online: 15 March 2017© The Minerals, Metals & Materials Society 2017
Abstract There is a critical need for customized analyticsthat take into account the stochastic nature of the inter-nal structure of materials at multiple length scales in orderto extract relevant and transferable knowledge. Data-drivenprocess-structure-property (PSP) linkages provide a systemic,modular, and hierarchical framework for community-drivencuration of materials knowledge, and its transference todesign and manufacturing experts. The Materials Knowl-edge Systems in Python project (PyMKS) is the first open-source materials data science framework that can be usedto create high-value PSP linkages for hierarchical materi-als that can be leveraged by experts in materials science andengineering, manufacturing, machine learning, and data sci-ence communities. This paper describes the main functionsavailable from this repository, along with illustrations ofhow these can be accessed, utilized, and potentially furtherrefined by the broader community of researchers.
Keywords Materials knowledge systems · Hierarchicalmaterials · Multiscale materials · Python · Scikit-learn ·NumPy · SciPy · Machine learning
� Surya R. [email protected]
1 School of Computational Science and Engineering,Georgia Institute of Technology, Atlanta, GA 30332, USA
2 Materials Science and Engineering Division, MaterialMeasurement Laboratory, National Institute of Standardsand Technology, Gaithersburg, MD 20899, USA
3 George W. Woodruff School of Mechanical Engineering,Georgia Institute of Technology, Atlanta, GA 30332, USA
Introduction
Current practices for developing tools and infrastructureused in multiscale materials design, development, anddeployment are generally highly localized (sometimes evenwithin a single organization) resulting in major inefficien-cies (duplication of effort, lack of code review, not engagingthe right talent for the right task, etc.). Although it is wellknown that the pace of discovery and innovation signifi-cantly increases with effective collaboration [1–4], scalingsuch efforts to large heterogeneous communities such as thoseengaged in materials innovation has been very difficult.
The advent of information technology has facilitatedmassive electronic collaborations (generally referred to ase-collaborations) that have led to significant advances inseveral domains including the discovery of the Higg’s boson[5], the sequencing of the human genome [6], the Polymathproject [7], the monitoring of species migration [8, 9], andnumerous open-source software projects. E-collaborationsallow experts from complementary domains to createhighly productive collaborations that transcend geograph-ical, temporal, cultural, and organizational distances. E-collaborations require a supporting cyber-infrastructure thatallows team members to generate, analyze, disseminate,access, and consume information at dramatically increasedpace and/or quantity [10]. A key element of this emergingcyber-infrastructure is open-source software, as it elimi-nates collaboration hurdles due to software licenses and canhelp foster truly massive e-collaborations. In other words,even with collaborations involving proprietary data, open-source cyber-infrastructure provides a common languagethat can facilitate e-collaborations with large numbers ofteam members.

Integr Mater Manuf Innov (2017) 6:36–53 37
Several recent national and international initiatives [11–13] have been launched with the premise that the adoptionand utilization of modern data science and informaticstoolsets offers a new opportunity to accelerate dramaticallythe design and deployment cycle of new advanced materialsin commercial products. More specifically, it has been rec-ognized that innovation cyber-ecosystems [14] are neededto allow experts from the materials science and engineer-ing, design and manufacturing, and data science domainsto collaborate effectively. The challenge in integrating thesetraditionally disconnected communities comes from the vastdifferences in how knowledge is captured, curated, and dis-seminated in these communities [15]. More specifically,knowledge systems in the materials field are rarely capturedin a digital form. In order to create a modern materials inno-vation ecosystem, it is imperative that we design, develop,and launch novel collaboration platforms that allow auto-mated distilling of materials knowledge from large amountsof heterogeneous data acquired through customized pro-tocols that are necessarily diverse (elaborated next). It isalso imperative that this curated materials knowledge is pre-sented to the design and manufacturing experts in highlyaccessible (open) formats.
Customized materials design has great potential forimpacting virtually all emerging technologies, with signif-icant economic consequences [12, 13, 16–24]. However,materials design (including the design of a manufacturingprocess route) resulting in the combination of propertiesdesired for a specific application is a highly challenging
inverse problem due to the hierarchical nature of the inter-nal structure of materials. Material properties are controlledby the materials’ hierarchical internal structure as wellas physical phenomena with timescales that vary at eachof the hierarchical length scales (from the atomic to themacroscopic length scale). Characterization of the struc-ture at each of these different length scales is often inthe form of images which come from different experimen-tal/computational techniques resulting in highly heteroge-neous data. As a result, tailoring the material hierarchicalstructure to yield desired combinations of properties or per-formance characteristics is enormously difficult. Figure 1provides a collection of materials images depicting materi-als structures at different length scales, which are generallyacquired using diverse protocols and are captured in equallydiverse formats.
While the generation (from experiments and computersimulations) and dissemination of datasets consisting ofheterogeneous images are necessary elements in a modernmaterials innovation ecosystem, there is an equally criti-cal need for customized analytics that take into accountthe stochastic nature of these data at multiple length scalesin order to extract high-value, transferable knowledge.Data-driven process-structure-property (PSP) linkages [26]provide a systemic, modular, and hierarchical frameworkfor community engagement (i.e., several people makingcomplementary or overlapping contributions to the overallcuration of materials knowledge). Computationally cheapPSP linkages also communicate effectively the curated
Fig. 1 Heirarchical materials structure at multiple length scalesa Simulated graphene crystalline structure. b Simulated fivefold icosa-hedral Al-Ag quasicrystals. c High-resolution electron microscopyimage of delamination cracks in h-BN particles subjected to com-pressive stress in the (0001) planes (within a silicon nitride particu-late-reinforced silicon carbide composite). d Electron diffractionpattern of an icosahedral Zn-Mg-Ho quasicrystal. e Cross-polarised
light image of spherulites in poly-3-hydroxy butyrate (PHB). f Castiron with magnesium-induced spheroidised graphite. g SEM micro-graph of a taffeta textile fragment. h Optical microscopy image of across-section of an aluminum casting. i X-ray tomography image ofopen-cell polyurethane foam. Images courtesy of Core-Materials [25](Color figure online)
38 Integr Mater Manuf Innov (2017) 6:36–53
materials knowledge to design and manufacturing experts inhighly accessible formats.
The Materials Knowledge Systems in Python project(PyMKS) is the first open-source materials data analyticstoolkit that can be used to create high-value PSP linkagesfor hierarchical materials in large-scale efforts driven anddirected by an entire community of users. In this regard, itcould be a foundational element of the cyber-infrastructureneeded to realize a modern materials innovation ecosystem.
Current Materials Innovation Ecosystem
Open-access materials databases and computational toolsare critical components of the cyber-infrastructure neededto curate materials knowledge through effective e-collaborations [27]. Several materials science open-sourcecomputational toolsets and databases have emerged inrecent years to help realize the vision outlined in the Mate-rials Genome Initiative (MGI) and the Integrated Computa-tional Materials Engineering (ICME) paradigm [12, 13, 16–24]. Yet, the creation and adoption of a standard materialstaxonomy and database schema has not been established dueto the unwieldy size of material descriptors and heteroge-neous data. Additionally, the coupled physical phenomenathat govern material properties are too complex to model allaspects of a material simultaneously using a single compu-tational tool. Consequently, current practices have resultedin the development of computation tools and databases witha narrow focus on specific length/structure scales, materialclasses, or properties.
The NIST Data Gateway contains over 100 free and paidquery-able web-based materials databases. These databasescontain atomic structure, thermodynamics, kinetics, funda-mental physical constants, and x-ray spectroscopy, amongother features [28]. The NIST DSpace provides a cura-tion of links to several materials community databases [29].The NIST Materials Data Curation Systems (MDCS) is ageneral online database that aims to facilitate the captur-ing, sharing, and transforming of materials data [30]. TheOpen Quantum Materials Database (OQMD) is an open-source data repository for phase diagrams and electronicground states computed using density functional theory[31]. MatWeb is a database containing materials propertiesfor over 100,000 materials [32]. Atomic FLOW of Materi-als Discovery (AFLOW) databases millions of materials andproperties and hosts computational tools that can be usedfor atomic simulations [33]. The Materials Project (and thetool pyMatgen) [34, 35] provides open web-based accessto computed information on known and predicted materialsas well as analysis tools for electronic band structures. TheKnowledgebase of Interatomic Models (OpenKIM) hosts
open-source tools for potentials for molecular simulation ofmaterials [36]. PRedictive Integrated Structural MaterialsScience (PRISMS) hosts a suite of ICME tools and datas-torage for the metals community focused on microstructureevolution and mechanical properties [37]. Granta Materi-als and Citrine Informatics represent two of the for-profitefforts in these domains. Granta Materials Intelligence pro-vides enterprise-scale infrastructure for in-house materialsdata management, which can be integrated with design tools[38]. Citrine Informatics is a cloud-based platform that pro-vides access to multisource material databases as well asmachine learning tools [39, 40]. Citrine Informatics alsomaintains open-access databases as well as open-sourcesoftware projects [41].
SPPARKS Kinetic Monte Carlo Simulator (SPPARKS)is a parallel Monte Carlo code for on-lattice and off-latticemodels [42]. MOOSE is a parallel computational frame-work for coupled systems of nonlinear equations [43].Dream3D is a tool used for synthetic microstructure genera-tion, image processing, and mesh creation for finite element[44].
While there exits a sizable number of standard ana-lytics tools [45–54], none of them are tailored to createPSP linkages from materials structure image data and theirassociated properties. PyMKS aims to seed and nurturean emergent user group in the materials data analyticsfield for establishing homogenization and localization (PSP)linkages by leveraging open-source signal processing andmachine learning packages in Python. An overview of thePyMKS project accompanied with several examples is pre-sented here. This paper is a call to others interested inparticipating in this open science activity.
Theoretical Foundations of MaterialsKnowledge Systems
Material properties are controlled by their internal structureand the diverse physical phenomena occurring at multi-ple time and length scales. Generalized composite theories[55, 56] have been developed for hierarchical materialsexhibiting well-separated length scales in their internalstructure. Generally speaking, these theories either addresshomogenization (i.e., communication of effective proper-ties associated with the structure at a given length scale toa higher length scale) or localization (i.e., spatiotemporaldistribution of the imposed macroscale loading conditionsto the lower length scale). Consequently, homogeniza-tion and localization are the essential building blocks incommunicating the salient information in both directionsbetween hierarchical length/structure scales in multiscalematerials modeling. It is also pointed out that localization

Integr Mater Manuf Innov (2017) 6:36–53 39
is significantly more difficult to establish, and implicitlyprovides a solution to homogenization.
The most sophisticated composite theory available todaythat explicitly accounts for the full details of the mate-rial internal structure (also simply referred as microstruc-ture) comes from the use of perturbation theories andGreen’s functions [55, 57–68]. In this formalism, one usu-ally arrives at a series expansion for both homogenizationand localization, where the individual terms in the seriesinvolve convolution integrals with kernels based on Green’sfunctions. This series expansion was refined and gener-alized by Adams and co-workers [67, 69, 70] throughthe introduction of the concept of a microstructure func-tion, which conveniently separates each term in the seriesinto a physics-dependent kernel (based on Green’s func-tions) and a microstructure-dependent function (based onthe formalism of n-point spatial correlations [61–66]).
Materials knowledge systems (MKS) [71–77] comple-ments these sophisticated physics-based materials compo-site theories with a modern data science approach to createa versatile framework for extracting and curating multiscalePSP linkages. More specifically, MKS employs a discretizedversion of the composite theories mentioned earlier to gainmajor computational advantages. As a result, highly adapt-able and templatable protocols have been created and usedsuccessfully to extract robust and versatile homogenizationand localization metamodels with impressive accuracy andbroad applicability over large microstructure spaces.
The MKS framework is based on the notion of amicrostructure function. The microstructure function pro-vides a framework to represent quantities that describematerial structure such as phase identifiers, lattice orien-tation, chemical composition, defect types, and densities,among others (typically referred to as local states). Themicrostructure function, mj (h; s), represents a probabilitydistribution for the given local state, h ∈ H , at each posi-tion, s ∈ S, in a given microstructure, j [78–81]. Theintroduction of the local state space H (i.e., the complete setof all potential local states) provides a consolidated variablespace for combining the diverse attributes (often a combina-tion of scalar and tensor quantities) needed to describe thelocal states in the material structure. The MKS frameworkrequires a discretized description of mj , which is denotedhere as mj [h; s], where the [·; ·] represent the discretizedspace (in contrast to (·; ·), which defines the continuousspace). The “;” symbol separates indices in physical spaceto the right of “;” from indices in local state space to theleft of “;”. In most applications, S is simply tessellated intovoxels on a regular (uniform) grid so that the position canbe denoted by s → i, j, k in three dimensions.
As noted earlier, the local state space in most advancedmaterials is likely to demand sophisticated representations.
In prior work [73, 82, 83], it was found that spectral repre-sentations on functions on the local state space offered manyadvantages both in compact representation and in reduc-ing the computational cost. In such cases, h indexes thespectral basis functions employed. The selection of thesefunctions depends on the nature of local state descriptors.Examples include (i) the primitive basis (or indicator func-tions) used to represent simple tessellation schemes [71, 72,74–79, 84], (ii) generalized spherical harmonics used to rep-resent functions over the orientation space [73, 82], and (iii)Legendre polynomials used to represent functions over theconcentration space [83].
Homogenization
Comparing different microstructures is quite difficult evenafter expressing them in convenient discretized descriptionsmainly due to the lack of a reference point or a natural originfor the index s in the tessellation of the microstructure vol-ume. Yet the relative spatial distributions of the local statesprovide a valuable representation of the microstructure thatcan be used effectively to quantify the microstructure andcompare it with other microstructures in robust and mean-ingful ways [77–79, 81, 84]. The lowest order of spatial cor-relations with relative spatial information comes in the formof 2-point statistics and can be computed as a correlation ofa microstructure function such that
fj [h, h′; r] = 1
�j [r]
∑
s
mj [h; s]mj [h′; s + r], (1)
where r is a discrete spatial vector within the voxelateddomain specified by s, fj [h, h′; r] is one set of 2-pointstatistics for the local stats h and h′, and �j [r] is a nor-malization factor that depends on r [84]. The subscript j
refers to a sample microstructure used for analysis (i.e.,each j could refer to a microstructure image). The physicalinterpretation of the 2-point statistics is explained in Fig. 2with a highly simplified two-phase microstructure (the twophases are colored white and gray). If the primitive basisis used to discretize both the spatial domain and the localstate space then fj [h, h′; r] can be interpreted as the prob-ability of finding local states h and h′ at the tail and head,respectively, of a randomly placed vector r .
Two-point statistics provide a meaningful representationof the microstructure, but create an extremely large featurespace that often contains redundant information. Dimen-sionality reduction can be used to create low dimensionalmicrostructure descriptors from the sets of spatial corre-lations (based on different selections of h and h′) with

40 Integr Mater Manuf Innov (2017) 6:36–53
Fig. 2 The discretization scheme for both the microstructure func-tion and the vector space needed to define the spatial correlations,illustrated on a simple two-phase composite material. The discretizedvectors r describe the relative positions between different spatiallocations
principal component analysis (PCA). The PCA dimension-ality reduction can be mathematically expressed as follows:
fj [l] ≈∑
k∈K
μj [k] φ [k, l] + f [l]. (2)
In Eq. 2, fj [l] is a contracted representation of fj
[h, h′; r
]
as a large vector (i.e., l maps uniquely to every combinationof h, h′, and r deemed to be of interest in the analyses).The μj [k] are low dimensional microstructure descriptors(the transformed 2-point statistics) or principal componentscores (PC scores). The φ [k, l] are the calibrated principlecomponents (PCs) and the f [l] are the mean values from thecalibration ensemble of fj [l] for each l. The k ∈ K indicesrefer to the μj [k] in decreasing order of significance andare independent of l, l′, and r . The main advantage of thisapproach is that the fj [l] can be reconstructed to sufficientfidelity with only a small subset of μj [k] [85].
After obtaining the needed dimensionality reduction inthe representation of the material structure, machine learn-ing models can be used to create homogenization PSP link-ages of interest. As an example, a generic homogenizationlinkage can be expressed as follows:
peffj = F(μj [k]) (3)
In Eq. 3, peffj is the effective materials response (reflect-
ing an effective property in structure-property linkages oran evolved low dimensional microstructure descriptor inprocess-structure linkages), and F is a machine learningfunction that links μj [k] to peff
j .
Localization
MKS Localization linkages are significantly more com-plex than the homogenization linkages. These are usuallyexpressed in the same series forms that are derived in thegeneral composite theories, while employing discretizedkernels based on Green’s functions [55, 57–68]. Mathe-matically, the MKS localization linkages are expressed asfollows:
pj [s] =∑
h;rα[h; r]mj [h; s − r]
+∑
h,h′;r,r ′α[h, h′; r, r ′]mj [h; s − r]mj
[h′; s − r ′] + ... (4)
In Eq. 4, pj [s] is the spatially resolved (localized) responsefield (e.g., a response variable such as stress or strain ratein a structure-property linkage, or an evolved microstructurefunction in a process-structure linkage), and α[h; r] are theGreen’s function-based discretized influence kernels. Thesedigital kernels are calibrated using regression methods[71–74, 82, 83].
Figure 3 provides schematic overviews of the MKShomogenization and localization workflows. More detailedexplanations on the MKS homogenization and localizationlinkages can be found in prior literature [71–79, 83, 84].
Materials Knowledge Systems in Python
PyMKS is an object-oriented numerical implementation ofthe MKS theory developed in the literature [72]. It pro-vides a high-level, computationally efficient frameworkto implement data pipelines for classification, cataloging,and quantifying materials structures for PSP relationships.PyMKS is written in Python, a natural choice for scientificcomputing due to its ubiquitous use among the data sciencecommunity as well as many other favorable attributes [86].PyMKS is licensed under the permissive MIT license [87]which allows for unrestricted distribution in commercial andnon-commercial systems.
Core Functionality
PyMKS consists of four main components including aset of tools to compute 2-point statistics, tools for bothhomogenization and localization linkages, and tools fordiscretizing the microstructure. In addition, PyMKS hasmodules for generating data sets using conventional numer-ical simulations and a module for custom visualization ofmicrostructures. PyMKS builds on Scikit-learn’s pipelining

Integr Mater Manuf Innov (2017) 6:36–53 41
Fig. 3 The MKS homogenization workflow (left) consists of foursteps. 1. Discretize the raw microstructure with the microstructurefunction. 2. Compute 2-point statistics using local states (Eq. 1).3. Create low dimensional microstructure descriptors using dimen-sionality reduction techniques (Eq. 2). 4. Establish a linkage with
low dimensional microstucture descriptors using machine learning.(Eq. 3). The MKS localization workflow (right) consists of 2 steps.1. Discretize the raw microstructure with the microstructure func-tion. 2. Calibrate physics-based kernels using regression methods(Eq. 4) (Color figure online)
methodology to create materials-specific machine learningmodels. This is a high-level system for combining multipledata and machine learning transformations into a single cus-tomizable pipeline with only minimal required code. Thisapproach makes cross-validation and parameter searchessimple to implement and avoids the complicated book keep-ing issues associated with training, testing, and validatingdata pipelines in machine learning.
The starting point for an MKS homogenization analysisis to use 2-point statisics as outlined in Eq. 1 and provided inPyMKS by the MKSStructureAnalysis object, whichcalculates the objective low dimensional structure descrip-tors, μj [k]. The default dimensionality reduction techniqueis PCA, but any model that uses the transform fit ora “transformer” object can be substituted. After calculat-ing the descriptors, the MKSHomogenizationModel isused to create linkages between the μj [k] and the effectivematerial response, peff
j , as indicated in Eq. 3. The defaultmachine learning algorithm is a polynomial regression, butany estimator with the fit and predict methods can besubstituted to create the linkages between μj [k] and peff
j .The MKSLocalizationModel object provides the
MKS localization functionality. It calibrates the first-orderinfluence kernels α[h; r] used to predict local materialsresponses, pj [s], as outlined in Eq. 4. The calibration ofthe influence kernels is achieved using a variety of linearregression techniques described in numerous previous stud-ies [71–73, 83]. The MKSLocalizationModel objectuses fit and predict methods to follow the standardinterface for a Scikit-learn estimator object.
To use either the homogenization or the localizationmodels in PyMKS, the microstructure first needs to berepresented by a microstructure function, mj [h, s]. Thebases module in PyMKS contains four transformerobjects for generating the mj [h, s] using a varietly of dis-cretization methods [71–77, 83]. These four objects canbe thought of as materials-specific extension to the featureextraction module in Scikit-learn. A PrimitiveBasisobject uses indicator (or hat) functions and is well suitedfor microstructures that have discrete local states (e.g.,distinct thermodynamic phases). The LegendreBasisand FourierBasis objects create spectral representa-tions of microstructure functions defined on nonperiodicand periodic continuous local state spaces, respectively. Forexample, functions over a range of chemical compositionscan be described using LegendreBasis, while functionsover orientations in two-dimensional space can be describedusing FourierBasis. Furthermore, GSHBasis createscompact spectral representations for functions over lat-tice orientation space (such as those needed to describepolycrystalline microstructures) [88–99].
PyMKS contains modest data generation tools (inthe datasets module) that are used in both thePyMKS examples and the PyMKS test suite. TheMicrostructureGenerator object creates stochasticmicrostructures using digital filters. This assists users increating PyMKS workflows even when data is unavail-able. PyMKS has objects for generating sample datafrom both a spinodal decomposition simulation (usingthe CahnHilliardSimulation object) and a linear
42 Integr Mater Manuf Innov (2017) 6:36–53
elasticity simulation (using the ElasticFESimulationobject). PyMKS comes with custom functions forvisualizing microstructures in elegant ways (in the toolsmodule). These are used extensively in the PyMKS exam-ple notebooks to minimize incidental code associated withvisualization.
Underlying Technologies
PyMKS is built upon the highly optimized Python pack-ages NumPy [100], SciPy [101], and Scikit-learn [47].NumPy arrays are the primary data structure used through-out PyMKS and provide the basic vector and matrix manip-ulation operations. SciPy’s signal processing and numericallinear algebra functions are used to calibrate models andgenerate synthetic data. PyMKS is highly integrated withScikit-learn and mimics its simple API in order to leveragefrom Scikit-learn’s data pipeling methodology for machinelearning and data transformations. In addition, PyMKS usesthe Pytest framework to automate execution of the testsuite [102].
Optional packages that can be used with PyMKS includeSimple Finite Elements in Python (SfePy) [103], thepython wrapper for the FFTW library (pyFFTW) [104],
and the plotting package Matplotlib [105]. SfePy is usedto simulate linear elasticity to create sample response fielddata. PyFFTW is a highly optimized fast Fourier trans-form library that enhances the efficiency of PyMKS andenables parallel computations in PyMKS. Matplotlib is usedto generate custom microstructure visualizations.
Development Practices
PyMKS leverages from existing tools, standards, and webresources wherever possible. In particular, the developersare an open community that use GitHub for issue trackingand release management (see https://github.com/materialsinnovation/pymks). Additionally, a Google group is used asa public forum to discuss the project development, support,and announcements (see [email protected]).The Travis CI continuous integration tool is used to auto-mate running the test suite for branches of the code storedon GitHub. Code standards are maintained by follow-ing the Python PEP8 standards and by reviewing codeusing pull requests on GitHub. Detailed administrativeguidelines are outlined in the ADMINISTRATA.md doc-ument, and potential developers are encouraged to followthem.
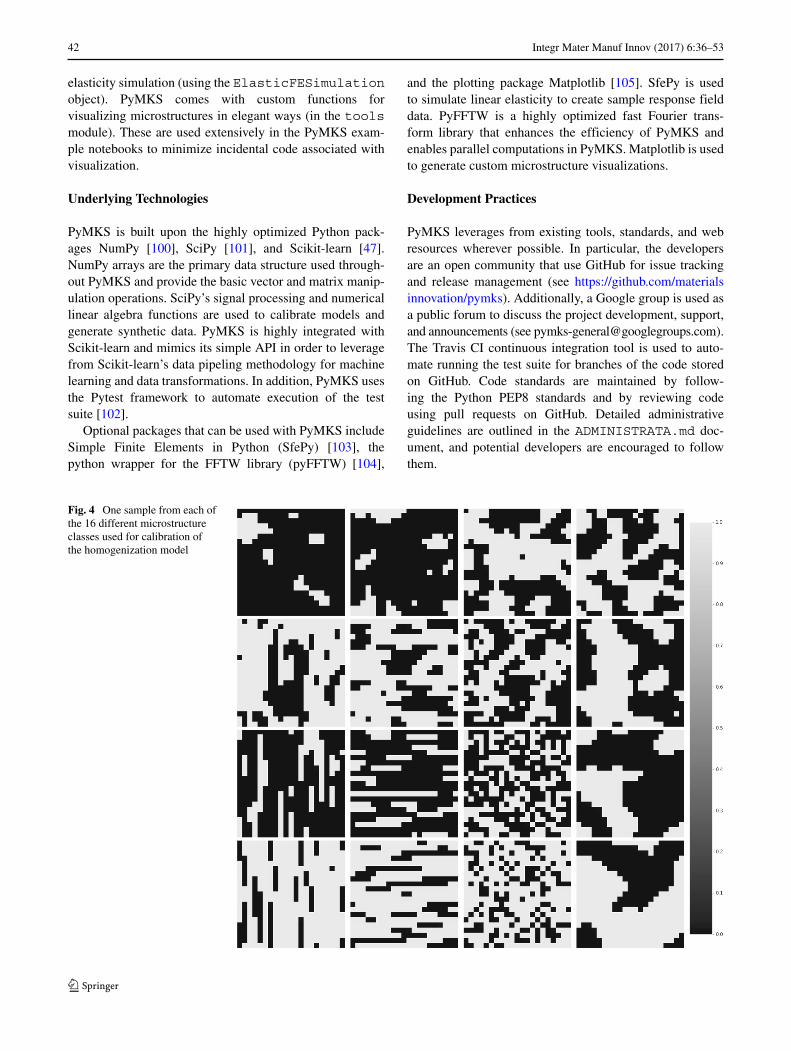
Fig. 4 One sample from each ofthe 16 different microstructureclasses used for calibration ofthe homogenization model

Integr Mater Manuf Innov (2017) 6:36–53 43
Examples of Homogenization and Localizationwith PyMKS
A demonstration of the MKS homogenization and localiza-tion workflows as shown in Fig. 3 is presented in this sectionusing PyMKS. Additional workflow examples can be foundon the PyMKS website pymks.org.
Prediction of Effective Stiffness with Homogenization
Generation of Calibration Data
In this example, the MKSHomogenizationModel isused to create a structure-property linkage between a 2-phase composite material and effective stiffness Cxx .
Multiple classes of periodic microstructures and theireffective elastic stiffness values can be generated by import-ing the make elastic stiffness function frompymks.datasets.
This function has several arguments. n samples is alist indicating the number of microstructures for each class.grain size and volume fraction are also lists thatspecify the average grain features and mean volumefractions for each of the microstructure classes. Vari-ance in the volume fractions for each class can be con-trolled using percent variance which specifies arange of volume fractions centered about the mean val-ues (i.e., volume fration ± percent variance).size indicates the dimensions of all the microstructures.elastic modulus and poissons ratio are used toindicate the material properties for each of the phases. Lastly,seed is used as the seed for the random number generator.
In this homogenization example, 50 samples from 16 dif-ferent microstructures classes with dimensions 21 × 21,and their effective stiffness values were created total-ing to 800 samples. Each of the 16 classes has differ-ent sized microstructure features and volume fractions.The make elastic stiffness function returns themicrostructures X and their associated stiffness values y.
44 Integr Mater Manuf Innov (2017) 6:36–53
An example microstructure from each of the 16 classescan be visualized by importing draw microstructures
function from pymks.tools. The output from drawmicrostructures can be found in Fig. 4.
Calibration of Homogenization Model
Before an instance of the MKSHomogenizationModelcan be made, an instance of a basis class is needed tospecify the discretization method for the microstructurefunctions (see Fig. 3). For this particular example, thereare only two discrete phases numerated by 0 and 1. It hasbeen shown that the primitive basis provides the most com-pact representation of discrete phases [71, 71, 74, 77–79,81, 84]. In PyMKS, the class PrimitiveBasis from
pymks.bases can be used with n states equal to 2and the domain equal to [0, 1].
The periodic axes as well as the set(s) of spatial corre-lations need to be specified in addition to the basis classfor the MKSHomogenizationModel. This is done usingthe arguments periodic axes and correlationsrespectively. In practice, the set of spatial correlations area hyper-parameter of our model that could be optimized,but for this example, only the two autocorrelations willbe used.
The default pipeline used to create the homogeniza-tion linkage uses PCA and polynomial regression objectsfrom Scikit-learn. Using GridSearchCV from Scikit-learn, cross-validation is used on the testing data to findthe optimal number of principal components and degreeof polynomial (based on the R-squared values) within adefined subspace for the hyper parameters for our model. A
dictionary params to tune defines the subspace. Forthis example, n components will be varied between 1 to13, and degree of the polynomial regression will be variedbetween 1 to 3. StratifiedKFold is used to ensure thatmicrostructures from each of the classes are used for eachfold during cross-validation. The array labels is used tolabel each of the classes.
Integr Mater Manuf Innov (2017) 6:36–53 45
The results of our parameter grid search can be examinedby either printing or creating visualizations. The parameters
and score of the best estimator can be printed as shownbelow.
Two different visualizations of the results fromGridsearchCV can be created using drawgridscores matrix and draw gridscores frompymks.tools.
draw gridscores matrix provides a visualiza-tion of two matrices for both the mean R-squaredvalues and their standard deviation. The output fromdraw gridscores matrix can be found in Fig. 5.
draw gridscores provides another view of the sameinformation with the mean values indicated by the points
and the standard deviation indication by the shared regions.The output from draw gridscores can be found in Fig. 6.

46 Integr Mater Manuf Innov (2017) 6:36–53
Fig. 5 Mean R-squared valuesand standard deviation as afunction of the order of thepolynomial and the number ofprincipal components
For the specified parameter range, the model with thehighest R-squared value was found to have a 2nd-orderpolynomial with 11 principal components. This model iscalibrated using the entire training dataset and is used forthe rest of the example.
Prediction of Effective Stiffness Values
In order to validate our model, additional data is gen-erated using the make elastic stiffness function
Fig. 6 The mean R-squared values indicated by the points and thestandard deviation indication by the shared regions as a function ofthe number of principal components for the first three orders of apolynomial function (Color figure online)
again with the same parameters with the exception ofthe number of samples and the seed used for the ran-dom number generator. The function returns the newmicrostructure X new and their effective stiffness valuesy new.
Effective stiffness values predicted by the model for thenew data are generated using the predict method.
A visualization of the PC scores for both the cal-ibration and the validation data can be created usingdraw components scatter from pymks.tools.

Integr Mater Manuf Innov (2017) 6:36–53 47
The output from draw components scatter can befound in Fig. 7.
Because both the validation and the calibration data weregenerated from the make elastic stiffness func-
Fig. 7 Low dimensional microstructure distributions (μj [k] fromEq. 2) for both the calibration and validation datasets (Color figureonline)
tion with the same parameters, both sets of data are differentsamples from the same distribution. Similar visualizationscan provide insights on differences between different datasources.
To evaluate our model’s predictions, a goodness-of-fitplot can be generated by importing draw goodnessof fit from pymks.tools. The results from draw
goodness of fit can be found in Fig. 8. Addition-ally, the R-squared value for our predicted data can beprinted.
Prediction of Local Strain Field with Localization
Generation of Calibration Data
In this example, the MKSLocalizationModel is used topredict the local strain field for a three-phase microstructure
with elastic moduli values of 80, 100, and 120 MPa;Poisson’s ratio values all equal to 0.3 and a macro-scopic imposed strain equal to 0.02. The model is cal-ibrated using delta microstructures (analogous to using a
Fig. 8 Goodness-of-fit plot for effective stiffness Cxx for the homog-enization model (Color figure online)

48 Integr Mater Manuf Innov (2017) 6:36–53
unit impulse response to find the kernel of a system insignal processing) [71]. The material parameters speci-fied above are used in a finite element simulation using
the make elasticFEstrain delta function frompymks.datasets. The number of Poisson’s ratio andelastic moduli values indicates the number of phases.
Fig. 9 Delta microstructure(right) and its associated strainfield (left). The deltamicrostructures and their localresponse fields are used tocalibrate the localization model(Color figure online)
Delta microstructures are composed of only two phaseswith the center of the microstructure being a different phasefrom the rest. All permutations of the delta microstruc-tures and their associated strain fields εxx are needed tocalibrate the localization model. A delta microstructure
and its strain field can be visualized using drawmicrostructure strain from pymks.tools. Theoutput from draw microstructure strain can befound in Fig. 9.
Calibration of the Localization Model
In order to make an instance of the MKSLocalizationModel, an instance of a basis class must first be created
to specify the discretization method for the microstructurefunction (see Fig. 3). For this particular example, there arethree discrete phases; therefore, the PrimitiveBasisfrom pymks.bases will be used. The phases are

Integr Mater Manuf Innov (2017) 6:36–53 49
Fig. 10 Calibrated influence kernels for the localization model (Color figure online)
enumerated by 0, 1, and 2; therefore, we have three localstates with a domain from 0 to 2. An instance of thePrimitiveBasis with these parameters can be used to
create an instance of the MKSLocalizationModel asfollows:
Fig. 11 Random microstructureand its local strain field foundusing finite element analysis(Color figure online)
With the delta microstructures and their strain fields, theinfluence kernels can be calibrated using the fit method.A visualization of the influence kernels can be generatedusing the draw coeff function from pymks.tools.The results from draw coeff can be found in Fig. 10.
Prediction of the Strain Field for a Random Microstructure
Model validation is done by comparing strain fieldscomputed using a finite element simulation and ourlocalization model for the same random microstructure.The make elasticFEstrain random function frompymks.datasets generates a random microstructureand its strain field results from finite element analysis.The output from make elasticFEstrain random is

50 Integr Mater Manuf Innov (2017) 6:36–53
Fig. 12 A comparison betweenthe local strain field computedusing finite element (left) andthe prediction from thelocalization model (right)(Color figure online)
visualized using draw microstructure strain andcan be found in Fig. 11.
The localization model predicts the strain field by pass-ing the random microstructure to the predict method. Avisualization of the two strain fields from both the local-ization model and finite element analysis can be createdusing draw strains compare from pymks.tools.The output from draw strains compare can be foundin Fig. 12.
These examples demonstrate the high-level code that cre-ates accurate and computationally efficient homogenizationstructure-property linkages using MKSHomogenizationModel and localization linkages using MKSLocalizationModel with PyMKS.
Conclusion
The MKS framework offers a practical and computation-ally efficient approach for distilling and disseminating the
core knowledge gained from physics-based simulations andexperiments using emerging concepts in modern data sci-ence. PyMKS is an open-source project with a permissivelicense that provides simple high-level APIs to access theMKS framework by implementing pipelines from Scikit-learn with customized objects for data from hierarchicalmaterials. PyMKS has been launched with the aim to nucle-ate and grow an emergent community focused on establish-ing data-driven homogenization and localization process-structure-property linkages for hierarchical materials.
Acknowledgments DBB and SRK acknowledge support from NSF-IGERT Award 1258425 and NIST 70NANB14H191.
References
1. Sawhney M, Verona G, Prandelli E (2005) Collaborating tocreate: the internet as a platform for customer engagement inproduct innovation. J Interact Mark 19(4):4–17
2. Edwards AM, Bountra C, Kerr DJ, Willson TM (2009) Openaccess chemical and clinical probes to support drug discovery.Nat Chem Biol 5(7):436–440
Integr Mater Manuf Innov (2017) 6:36–53 51
3. Bayne-Smith M, Mizrahi T, Garcia M (2008) Interdisciplinarycommunity collaboration: perspectives of community practition-ers on successful strategies. Journal of Community Practice16(3):249–269
4. Boudreau K (2010) Open platform strategies and innovation:granting access vs. devolving control. Manag Sci 56(10):1849–1872
5. Aad G, Abajyan T, Abbott B, Abdallah J, Khalek SA, AbdelalimA, Abdinov O, Aben R, Abi B, Abolins M et al (2012) Obser-vation of a new particle in the search for the Standard ModelHiggs boson with the ATLAS detector at the LHC. Phys Lett B716(1):1–29
6. Lander ES, Linton LM, Birren B, Nusbaum C, Zody MC,Baldwin J, Devon K, Dewar K, Doyle M, FitzHugh W et al(2001) Initial sequencing and analysis of the human genome.Nature 409(6822):860–921
7. Cranshaw J, Kittur A (2011) The polymath project: lessons froma successful online collaboration in mathematics. In: Proceed-ings of the SIGCHI Conference on Human Factors in ComputingSystems. ACM, pp 1865–1874
8. Dickinson JL, Zuckerberg B, Bonter DN (2010) Citizen scienceas an ecological research tool: challenges and benefits. Annu RevEcol Evol Syst 41:149–72
9. Hochachka WM, Fink D, Hutchinson RA, Sheldon D, Wong W-K, Kelling S (2012) Data-intensive science applied to broad-scalecitizen science. Trends Ecol Evol 27(2):130–137
10. Atkins D (2003) Revolutionizing science and engineeringthrough cyberinfrastructure: report of the National Science Foun-dation Blue-Ribbon Advisory Panel on Cyberinfrastructure
11. Anderson A (2011) Report to the president on ensuring Americanleadership in advanced manufacturing. Executive Office of thePresident. https://eric.ed.gov/?id=ED529992
12. National Science and Technology Council Executive Officeof the President: Materials Genome Initiative for GlobalCompetitiveness. http://www.whitehouse.gov/sites/default/files/microsites/ostp/materials genome/ initiative-final.pdf Accessed2011-06-30
13. Materials Genome Initiative National Science and Technol-ogy Council Committee on Technology Subcommittee onthe Materials Genome Initiative: Materials Genome Initia-tive Strategic Plan. http://www.whitehouse.gov/sites/default/files/microsites/ostp/NSTC/mgi strategic plan - dec 2014.pdfAccessed 2014-12-30
14. McDowell DL, Kalidindi SR (2016) The materials innovationecosystem: a key enabler for the materials genome initiative.MRS Bulletin 41(04):326–337
15. Kalidindi SR (2015) Data science and cyberinfrastructure: criti-cal enablers for accelerated development of hierarchical materi-als. Int Mater Rev 60(3):150–168
16. Ward C (2012) Materials genome initiative for global competi-tiveness. In: 23rd Advanced Aerospace Materials and Processes(AeroMat) Conference and Exposition. ASM
17. Allison J, Backman D, Christodoulou L (2006) Integrated com-putational materials engineering: a new paradigm for the globalmaterials profession. JOM 58(11):25–27
18. Allison J (2011) Integrated computational materials engineer-ing: a perspective on progress and future steps. JOM 63(4):15–18
19. Olson GB (2000) Designing a new material world. Science288(5468):993–998
20. Allison J (2008) Integrated computational materials engineering:a transformational discipline for improved competitiveness andnational security. National Academies Press, New York, NY
21. Schmitz GJ, Prahl U (2012) Integrative computational materialsengineering: concepts and applications of a modular simulationplatform. John Wiley & Sons, Hoboken, NJ
22. Robinson L (2013) TMS study charts a course to successfulICME implementation. Springer
23. Allison JE Integrated computational materials engineering(ICME): a transformational discipline for the global materialsprofession. Met Mater 223
24. Integrated computational materials engineering (ICME): imple-menting ICME in the aerospace, automotive, and maritime indus-tries. The Minerals, Metals and Materials, Society, PA. http://www.tms.org/icmestudy/
25. CORE-Materials (2009) CORE-Materials—a resource reposi-tory contains a large number of open educational resources(OERs) in materials science and engineering. https://www.flickr.com/people/core-materials/. [Online; accessed 6-April-2016]
26. Kalidindi SR (2015) Hierarchical materials informatics: novelanalytics for materials data. Elsevier, New York, NY
27. Bhat TN, Bartolo LM, Kattner UR, Campbell CE, Elliott JT(2015) Strategy for extensible, evolving terminology for thematerials genome initiative efforts. JOM 67(8):1866–1875
28. of Standards, N.I., Technology: NIST Data Gateway. http://srdata.nist.gov/gateway/Accessed2016-04-01
29. Laboratory, N.M.M.: NIST Repositories DSpace. https://materialsdata.nist.gov/dspace/xmlui/ Accessed 2016-04-01
30. of Standards, N.I., Technology: NIST Data Curation System.https://mgi.nist.gov/materials-data-curation-system Accessed2016-04-01
31. Saal JE, Kirklin S, Aykol M, Meredig B, Wolverton C (2013)Materials design and discovery with high-throughput den-sity functional theory: the Open Quantum Materials Database(OQMD). JOM 65(11):1501–1509
32. MatWeb L MatWeb—materials property data. http://www.matweb.com/ Accessed 2016-04-01
33. Curtarolo S, Setyawan W, Hart GL, Jahnatek M, Chepulskii RV,Taylor RH, Wang S, Xue J, Yang K, Levy O et al (2012) Aflow:an automatic framework for high-throughput materials discovery.Comput Mater Sci 58:218–226
34. Ong SP, Richards WD, Jain A, Hautier G, Kocher M, Cho-lia S, Gunter D, Chevrier VL, Persson KA, Ceder G (2013)Python Materials Genomics (pymatgen): a robust, open-sourcePython library for materials analysis. Comput Mater Sci 68:314–319
35. Jain A, Ong SP, Hautier G, Chen W, Richards WD, Dacek S,Cholia S, Gunter D, Skinner D, Ceder G, et al. (2013) Com-mentary: the materials project: a materials genome approach toaccelerating materials innovation. APL Materials 1(1):011002
36. Project K OpenKIM - The Knowledgebase of Interatomic Mod-els. https://openkim.org/ Accessed 2016-04-01
37. Project P PRedictive Integrated Structural Materials Sci-ence (PRISMS). http://www.prisms-center.org/#/home Accessed2016-04-01
38. Selector CP (2013) Granta material intelligence, Cambridge, UK39. Hill J, Mulholland G, Persson K, Seshadri R, Wolverton C,
Meredig B (2016) Materials science with large-scale dataand informatics: unlocking new opportunities. MRS Bulletin41(05):399–409
40. Seshadri R, Sparks TD (2016) Perspective: interactive materialproperty databases through aggregation of literature data. APLMaterials 4(5):053206
41. Michel K, Meredig B (2016) Beyond bulk single crystals: a dataformat for all materials structure-property-processing relation-ships. MRS Bulletin 41(8):617–623

52 Integr Mater Manuf Innov (2017) 6:36–53
42. Plimpton S, Thompson A, Slepoy A (2012) SPPARKS kineticMonte Carlo simulator
43. Gaston D, Newman C, Hansen G, Lebrun-Grandie D (2009)Moose: a parallel computational framework for coupled systemsof nonlinear equations. Nucl Eng Des 239(10):1768–1778
44. Groeber MA, Jackson MA (2014) Dream. 3D: a digital rep-resentation environment for the analysis of microstructure in3D. Integrating Materials and Manufacturing Innovation 3(1):1–17
45. Institute S (1985) SAS User’s guide: Statistics, vol 2. Sas Inst,California
46. Seabold S, Perktold J (2010) Statsmodels: econometric and sta-tistical modeling with Python. In: Proceedings of the 9th pythonin science conference, pp 57–61
47. Pedregosa F, Varoquaux G, Gramfort A, Michel V, Thirion B,Grisel O, Blondel M, Prettenhofer P, Weiss R, Dubourg V etal (2011) Scikit-learn: machine learning in Python. The J MachLearn Res 12:2825–2830
48. Albanese D, Visintainer R, Merler S, Riccadonna S, Jurman G,Furlanello C (2012) mlpy: Machine Learning Python. arXiv:1202.6548
49. Goodfellow IJ, Warde-Farley D, Lamblin P, Dumoulin V, MirzaM, Pascanu R, Bergstra J, Bastien F, Bengio Y (2013) Pylearn2:a machine learning research library. arXiv:1308.4214
50. McKinney W (2012) Python for Data Analysis: Data Wran-gling with Pandas, NumPy, and IPython. O’Reilly Media, Inc.,California
51. Muller AC, Behnke S (2014) Pystruct: learning structured pre-diction in Python. The J Mach Learn Res 15(1):2055–2060
52. Demsar J, Zupan B, Leban G, Curk T (2004) Orange: from exper-imental machine learning to interactive data mining. Springer,Berlin Heidelberg
53. Abadi M, Agarwal A, Barham P, Brevdo E, Chen Z, Citro C,Corrado GS, Davis A, Dean J, Devin M et al (2016) Tensor-flow: large-scale machine learning on heterogeneous distributedsystems. arXiv:1603.04467
54. Van Der Walt S, Schonberger JL, Nunez-Iglesias J, BoulogneF, Warner JD, Yager N, Gouillart E, Yu T (2014) scikit-image:image processing in Python. PeerJ 2:453
55. Hill R (1963) Elastic properties of reinforced solids: some theo-retical principles. J Mech Phys Solids 11(5):357–372
56. Hashin Z (1983) Analysis of composite materials—a survey. JAppl Mech 50(3):481–505
57. Brown WF Jr (1955) Solid mixture permittivities. The J ChemPhys 23(8):1514–1517
58. Kroner E (1986) Statistical modelling. In: Modelling small defor-mations of polycrystals. Springer, Netherlands, pp 229–291
59. Kroner E (1977) Bounds for effective elastic moduli of disor-dered materials. J Mech Phys Solids 25(2):137–155
60. Kroner E (1972) Statistical continuum mechanics. Springer,Vienna
61. Etingof P, Adams BL (1993) Representations of polycrystallinemicrostructure by n-point correlation tensors. Texture, Stress,and Microstructure 21(1):17–37
62. Adams BL, Olson T (1998) The mesostructure-properties link-age in polycrystals. Prog Mater Sci 43(1):1–87
63. Fullwood DT, Adams BL, Kalidindi SR (2008) A strong con-trast homogenization formulation for multi-phase anisotropicmaterials. J Mech Phys Solids 56(6):2287–2297
64. Torquato S (2013) Random heterogeneous materials: microstruc-ture and macroscopic properties, vol 16. Springer, New York
65. Li D, Saheli G, Khaleel M, Garmestani H (2006) Quantitativeprediction of effective conductivity in anisotropic heterogeneous
media using two-point correlation functions. Comput Mater Sci38(1):45–50
66. Milhans J, Li D, Khaleel M, Sun X, Garmestani H (2011)Prediction of the effective coefficient of thermal expansion ofheterogeneous media using two-point correlation functions. JPower Sources 196(8):3846–3850
67. Adams BL, Kalidindi S, Fullwood DT (2013) Microstructure-sensitive design for performance optimization. Butterworth-Heinemann, United Kingdom
68. Garmestani H, Lin S, Adams B, Ahzi S (2001) Statistical con-tinuum theory for large plastic deformation of polycrystallinematerials. J Mech Phys Solids 49(3):589–607
69. Adams BL, Gao XC, Kalidindi SR (2005) Finite approxima-tions to the second-order properties closure in single phasepolycrystals. Acta Mater 53(13):3563–3577
70. Binci M, Fullwood D, Kalidindi SR (2008) A new spectralframework for establishing localization relationships for elasticbehavior of composites and their calibration to finite-elementmodels. Acta Mater 56(10):2272–2282
71. Landi G, Niezgoda SR, Kalidindi SR (2010) Multi-scale mod-eling of elastic response of three-dimensional voxel-basedmicrostructure datasets using novel DFT-based knowledge sys-tems. Acta Mater 58(7):2716–2725
72. Kalidindi SR, Niezgoda SR, Landi G, Vachhani S, Fast T (2010)A novel framework for building materials knowledge systems.Computers, Materials, and Continua 17(2):103–125
73. Yabansu YC, Patel DK, Kalidindi SR (2014) Calibrated localiza-tion relationships for elastic response of polycrystalline aggre-gates. Acta Mater 81:151–160
74. Al-Harbi HF, Landi G, Kalidindi S (2012) Multi-scale mod-eling of the elastic response of a structural component madefrom a composite material using the materials knowledge system.Modell Simul Mater Sci Eng 20(5):055001
75. Kalidindi SR, Niezgoda SR, Salem AA (2011) Microstruc-ture informatics using higher-order statistics and efficient data-mining protocols. JOM 63(4):34–41
76. Gupta A, Cecen A, Goyal S, Singh AK, Kalidindi SR (2015)Structure-property linkages using a data science approach: appli-cation to a non-metallic inclusion/steel composite system. ActaMater 91:239–254
77. Cecen A, Fast T, Kumbur E, Kalidindi S (2014) A data-drivenapproach to establishing microstructure-property relationships inporous transport layers of polymer electrolyte fuel cells. J PowerSources 245:144–153
78. Niezgoda SR, Kanjarla AK, Kalidindi SR (2013) Novelmicrostructure quantification framework for databasing, visual-ization, and analysis of microstructure data. Integrating Materialsand Manufacturing Innovation 2(1):1–27
79. Niezgoda SR, Yabansu YC, Kalidindi SR (2011) Understandingand visualizing microstructure and microstructure variance as astochastic process. Acta Mater 59(16):6387–6400
80. Qidwai SM, Turner DM, Niezgoda SR, Lewis AC, Gelt-macher AB, Rowenhorst DJ, Kalidindi SR (2012) Estimat-ing the response of polycrystalline materials using sets ofweighted statistical volume elements. Acta Mater 60(13):5284–5299
81. Niezgoda SR, Turner DM, Fullwood DT, Kalidindi SR (2010)Optimized structure based representative volume element setsreflecting the ensemble-averaged 2-point statistics. Acta Mater58(13):4432–4445
82. Yabansu YC, Kalidindi SR (2015) Representation and calibra-tion of elastic localization kernels for a broad class of cubicpolycrystals. Acta Mater 94:26–35

Integr Mater Manuf Innov (2017) 6:36–53 53
83. Brough DB, Wheeler D, Warren JA, Kalidindi SR (2016)Microstructure-based knowledge systems for capturing process-structure evolution linkages. Curr Opin Solid State MaterSci
84. Cecen A, Fast T, Kalidindi SR (2016) Versatile algorithmsfor the computation of 2-point spatial correlations in quantify-ing material structure. Integrating Materials and ManufacturingInnovation 5(1):1–15
85. Hotelling H (1933) Analysis of a complex of statistical variablesinto principal components. J Educ Psychol 24(6):417
86. Perez F, Granger BE, Hunter JD (2011) Python: an ecosys-tem for scientific computing. Comput Sci Eng 13(2):13–21.doi:10.1109/MCSE.2010.119
87. The MIT License (MIT). https://opensource.org/licenses/mit-license.php. Accessed: 2016-05-18
88. Kalidindi SR, Duvvuru HK, Knezevic M (2006) Spectral cal-ibration of crystal plasticity models. Acta Mater 54(7):1795–1804
89. Shaffer JB, Knezevic M, Kalidindi SR (2010) Building tex-ture evolution networks for deformation processing of poly-crystalline fcc metals using spectral approaches: applications toprocess design for targeted performance. Int J Plast 26(8):1183–1194
90. Knezevic M, Levinson A, Harris R, Mishra RK, Doherty RD,Kalidindi SR (2010) Deformation twinning in AZ31: influ-ence on strain hardening and texture evolution. Acta Mater58(19):6230–6242
91. Al-Harbi HF, Knezevic M, Kalidindi SR (2010) Spectralapproaches for the fast computation of yield surfaces and first-order plastic property closures for polycrystalline materials withcubic-triclinic textures. Computers, Materials, and Continua15(2):153–172
92. Duvvuru HK, Knezevic M, Mishra RK, Kalidindi S (2007)Application of microstructure sensitive design to FCC polycrys-tals. In: Materials Science Forum, vol 546. Trans Tech Publ,pp 675–680
93. Li D, Garmestani H, Schoenfeld S (2003) Evolution of crystalorientation distribution coefficients during plastic deformation.Scr Mater 49(9):867–872
94. Li D, Garmestani H, Adams B (2005) A texture evolutionmodel in cubic-orthotropic polycrystalline system. Int J Plast21(8):1591–1617
95. Li D, Garmestani H, Ahzi S (2007) Processing path optimiza-tion to achieve desired texture in polycrystalline materials. ActaMater 55(2):647–654
96. Li DS, Bouhattate J, Garmestani H (2005) Processing path modelto describe texture evolution during mechanical processing. In:Materials Science Forum, vol 495. Trans Tech Publ, pp 977–982
97. Creuziger A, Hu L, Gnaupel-herold T, Rollett AD (2014) Crys-tallographic texture evolution in 1008 steel sheet during multi-axial tensile strain paths. Integrating Materials and Manufactur-ing Innovation 3(1):1
98. Sundararaghavan V, Zabaras N (2008) A multi-length scale sen-sitivity analysis for the control of texture-dependent properties indeformation processing. Int J Plast 24(9):1581–1605
99. Sundararaghavan V, Zabaras N (2007) Linear analysis of texture-property relationships using process-based representations ofrodrigues space. Acta Mater 55(5):1573–1587
100. Van Der Walt S, Colbert SC, Varoquaux G (2011) The numpyarray: a structure for efficient numerical computation. ComputSci Eng 13(2):22–30
101. Jones E, Oliphant T, Peterson P (2014) Scipy: open sourcescientific tools for Python
102. Pytest (2016) http://pytest.org103. Cimrman R (2014) SfePy—write your own FE application.
arXiv:1404.6391104. Frigo M, Johnson SG (1998) FFTW: an adaptive software archi-
tecture for the FFT. In: Proceedings of the 1998 IEEE Interna-tional Conference On Acoustics, Speech and Signal Processing,1998, vol 3. IEEE, pp 1381–1384
105. Hunter JD et al (2007) Matplotlib: a 2D graphics environment.Comput Sci Eng 9(3):90–95