materials and methods - shodhgangashodhganga.inflibnet.ac.in/bitstream/10603/7193/12/12_chapter...
TRANSCRIPT

CHAPTER – 3
MATERIALS AND METHODS

Materials and Methods 29
MATERIALS AND METHODS
The present study is aimed to analyse the existing pattern of water quality of river
Periyar and to assess its impact on haematological parameters and survival rate of the
selected fishes (P. sophore and H. brachysoma) in Periyar. The increased number of
industries on the banks of the river discharges the treated or partially treated or untreated
effluents into the water body. These discharges along with domestic waste and seepage
from septic tanks are responsible for the chief assault on the ecological system in the
receiving waters. When these waste materials are added to natural waters the effect on
the water quality depends entirely on the interaction of specific wastes with the delicate
balance of all the physical, chemical and biological factors of the natural aquatic
ecosystem.
3.1 Study Area
For the water quality assessment of Periyar, sampling and field studies were
carried out periodically at five locations (Collection Sites I to V) from Boothathankettu in
the upstream to Eloor (Fig. 1).
Collections of water samples were carried out during pre-monsoon, monsoon and
post-monsoon periods from April 2002 to December 2004 (April 2002 pre-monsoon, July
2002 monsoon, December 2002 post-monsoon, April 2003 pre-monsoon, July 2003
monsoon and December 2003 post-monsoon, April 2004 pre-monsoon, July 2004
monsoon and December 2004 post-monsoon). Water samples from different sites were
analyzed for physico-chemical parameters and the fishes were treated in polluted water
(Site-V) at varying concentrations for different durations to study the stress effect on the
haematological parameters. The mortality rates of the experimental fishes were recorded.
The rainfall data for the respective years were also noted (Table. 2 and 3).
The sampling sites were selected based on un-polluted area (upstream of the
river- Sites 1 to IV) and polluted area (down stream, Eloor industrial belt region - Site-V).

Materials and Methods 30
3.1.1 River Periyar
River Periyar is considered to be the longest river in Kerala, traversing 244 km
within the state (PWD, 1974; CESS, 1984). The river has a length of about 244 km and a
catchment area of about 5284 km2. The river originates form the Sivagiri hills of about
1830 m elevations above MSL and flows through all the three physiographic provinces -
the high lands (>75 m), midlands (8 - 75 m) and lowlands (<8 m) (main features of river
Periyar are shown in the Table -1). At Aluva the river bifurcates into Marthandavarma and
Mangalapuzha branches. The Mangalapuzha joins Chalakudy puzha and falls into the
Arabian Sea. The Marthandavarma splits into two, the major branch flows through the
industrial area (Eloor) and the minor goes through Manjummal. At Varapuzha both join the
Arabian Sea through the Cochin backwater system. Twenty five per cent of the state’s
industries are located along the banks of river Periyar in the Eloor region. These factories
depend on the river for uptake of water and disposal of effluents.
3.1.2 Collection Sites
Site I: Bhoothathankettu
Bhoothathankettu, situated east of Kothamangalam on the Aluva - Munnar route,
is perhaps the oldest irrigation project in Kerala. This area is already recognized as a
tourist centre due to pristine beauty. It belongs to Kuttampuzha panchayath, through
which two branches of Periyar flow (Plate 1. 1).
Site II: Paniely Poru
Paniely is about 8.5 km downstream of the barrage at Bhoothathankettu in
Ernakulam district. The site is accessible by motorable road, both from right and left bank
of the river. The left bank approach is from Kuruppampady near 21 km in the Aluva –
Munnar road. The site chosen is easily accessable at all times of the year except during
unusual heavy floods. The river at Paniely branches into two, forming an island in
between. The upstream side of the island is completely exposed rock. The entire island
will be submerged during unusual floods. (Plate 1. 2).

Materials and Methods 31
Site III: Kalady
Across the river at Kalady is the Sree Sankaracharya Bridge. Water is drawn for
the purpose of irrigation as well as drinking. The drinking water for Angamaly town is
drawn from here. Water scarcity is experienced by substantial part of the population here.
Small deltas have also been formed during recent years in the river at Kalady due to the
ruthless unauthorized sand mining. Small patches of islands have also been formed at
different areas of the river, which would become more prominent during summer (Plate 1 -
3).
Site IV: Chowara
It has a river boundary of 4km length. About one thousand households are settled
on the river banks. Very heavy sand mining is going on here, as the water level is very
low. There is one irrigation unit situated near the location besides a ferry (Plate 1. 4).
Site V: Eloor (Industrial area)
Eloor is the most industrialized zone of the river. Many hazardous industrial
effluents emerging from the nearby factories seriously threaten Eloor, situated on the side
of river Periyar. There are around 250 factories in this area, 125 of which are chemical
factories. Most of these industries are over 50 years old and are most polluting. The
industries take in large amounts of freshwater from the river and inturn discharge
concentrated effluents with nominal treatment. This leads to the large scale devastation of
aquatic life in the river and the farmlands in the region. There are more than 30 effluent
pipes spewing toxins into the river directly from the industry. Such criminal practices of the
companies in this largest industrial area of Kerala are jeopardizing the sources of drinking
water and food of the aquatic communities (Fig. 2 & 3), (Table. 4), (Plate 2 to 4).
3.2 Experimental Fishes The fishes selected for the study are Puntius sophore (Hamilton) and Horabagrus
brachysoma (Gunther). Puntius sophore comes under the family Cyprinidae of the order

Materials and Methods 32
Cypriniformes and Horabagrus brachysoma belongs to the family Bagridae of the order
Siluriformes. (Plate 5 A and B) (Jhingran, 1991).
Puntius sophore (Hamilton)
Colour in live state is beautiful silvery, back grey-green to brownish flanks with a
somewhat bluish lustier, underside white, a deep black round blotch at the base of caudal
fin, a similar black blotch on the central part of dorsal fin or also on the anterior part of
body adjacent to dorsal fin. Fin hyaline in mature females, anal and pelvic fins brick red in
mature males during breeding season. It is well known that they are particularly
susceptible to the oxygen content of the water and give a clear index of the state of water
(Srivastava, 2002).
Horabagrus brachysoma (Gunther)
Body is naked, not covered by scales. Mouth is sub terminal, and the jaws
containing viliform bands. Barbels two pairs, maxillary barbels extend posterior to pectoral
fin base and others shorter. Rayed dorsal fin is present with a strong, feebly serrated
spine. The adipose fin is short and the caudal fin is deeply forked. Color in live is greenish
yellow above, a deep round blotch on the shoulder surrounded by a light yellow ring.
Dorsal and anal fin are yellowish at their margins. Caudal fin is yellow with a semi lunar
thick black ring at caudal fin base in many cases (Templeton, 1995). This fish is endemic
to Kerala, which is being well relished as an important table fish.
3.3 Water Analysis
Surface water samples were collected in clean large polythene cans from the
selected five sites of the river Periyar using a country boat. The collected samples were
brought immediately to the laboratory to test the various physical and chemical
parameters. To estimate oxygen content, the samples were fixed in the BOD bottles at the
sites itself soon after collection. Standard procedures (APHA, 1998) were used for the
analysis of the physical and chemical parameters of the water samples. The mean values

Materials and Methods 33
of the results were calculated, which were then tabulated and graphically represented. The
results obtained were also compared with the standards (Appendix - I).
3.3.1 Physical parameters
Temperature (oC)
Temperature was measured at the sampling station itself, using centigrade thermometer.
Total Dissolved Solids (mg/l)
It was determined as the residue left after evaporation of the filtered sample.
Total Suspended Solids (mg/l)
Total Suspended Solids include insoluble matter. It was determined as the non-
filterable residue left after filtration of the sample.
3.3.2 Chemical parameters
pH
pH was measured using pH meter.
Total Alkalinity (as CaCO3 mg/l)
This is the measure of the capacity of the water to neutralize a strong acid. The
alkalinity in the waters is generally imparted by the salts of carbonates, bicarbonates,
phosphates, nitrates, borates, silicates etc., together with the hydroxyl ions in free state.
Total alkalinity was estimated by titrating the sample with a strong acid.
Acidity (as CaCO3 mg/l)
Acidity is due to the presence of uncombined carbon dioxide, salts of strong acids
and mineral acids. Acidity was estimated by titrating the sample with a strong base such
as NaOH using methyl orange or phenolphthalein as indicator.
Turbidity (NTU)
Turbidity is an expression of the optical property that causes light to be scattered
and absorbed rather than transmitted with no change in direction or flux level through the

Materials and Methods 34
sample. It was measured with the help of Nephelometer (Turbidity meter) and expressed
as Nephelometric Turbidity Units (NTU).
Total Hardness (as CaCO3 mg/l)
EDTA titrimetric method is used for the estimation of hardness. It is generally
caused by the calcium and magnesium ions present in water. Polyvalent ions of some
other metals like strontium, iron, aluminium, zinc and manganese etc. are also capable of
precipitating the soap and thus contributing to the hardness.
Dissolved Oxygen (DO) (mgO2 /l)
Dissolved oxygen was estimated by Winkler’s Iodometric method.
Chemical Oxygen Demand (COD) (mgO2 /l)
This determines the amount of oxygen required for chemical oxidation of organic
matter using a strong chemical oxidant such as Potassium dichromate. It represents
chemically oxidisable pollution load present in water and hence a reliable parameter for
judging the quantum of organic pollution in the aquatic system.
Chloride (mg/l)
For the determination of chloride, Argentometric method was used. Silver nitrate
reacts with chloride to form very slightly soluble white precipitate of AgCl. At the end point
when all the chlorides get precipitated, free silver ions react with chromate to form silver
chromate of reddish brown colour.
Nitrates (mg/l)
Ultraviolet spectrophotometric screening method was used for the determination of
nitrate.
Heavy metals
Aluminium (ppm)
Direct Nitrous Oxide – Acetylene flame method was adopted.

Materials and Methods 35
Iron (ppm)
Iron usually exists in natural water both in ferric and ferrous forms. It is converted
into ferrous state by boiling with hydrochloric acid and hydroxylamine. The reduced iron
chelates with 1, 10 - phenonthroline at pH 3.2 to 3.3 to form a complex of orange-red
colour. The intensity of this color is proportional to the concentration of iron and follows
Beer’s law, and therefore, can be determined using spectrophotometer.
Cadmium (ppm)
Anodic stripping voltammetric method was used.
Zinc (ppm)
Zinc was determined by Zincon method.
3.4 Experimental Details
The fishes were collected from river Periyar and brought to the laboratory without
mechanical injury. They were acclimated to laboratory conditions in cement tank for at
least 15 days prior to commencement of the experiment. Then the fishes were moved to
glass aquaria, where they were again acclimated for 7 days. Fishes were fed with Kijaro
floating pellet and groundnut oil cake twice a day. The cement systems and glass aquaria
were cleaned and water replenished once daily, in order to eliminate metabolites and
faecal detritus. Finally, individuals were transferred to experimental glass aquaria.
Measurements of the fishes were taken before the experiment.. The total length of the
fish was noted from the tip of the snout to the end of caudal fin and weight was taken
carefully using weighing balance. Average length, width and weight of the fishes were
showed in the Table 5 and 6.
The control fishes were treated with upstream water and the experimental fishes
were exposed to different concentrations of effluent contaminated water collected from
Site-V (Eloor industrial area) for various durations. The concentrations of effluent
contaminated water used to treat P. sophore were 5%, 10%, 15%, 20%, 25%, 30% and

Materials and Methods 36
H. brachysoma 10%, 20%, 30% 40%, 50%, 60%, 70%, 80%, 90%, 100%. Batches of ten
healthy fishes were used for the experiment.
Blood samples were collected from the control and experimental fishes directly
from the heart using disposable plastic syringe. The blood was kept in two vials, one
coated with anticoagulant EDTA for blood count and the other uncoated used for other
parameters. Blood samples were stored in a refrigerator and analyzed within 24hrs. Blood
samples were collected from P. sophore at the interval of 1, 2,4,6 hours of treatment and
H. brachysoma at the interval of 12, 24,48, 72 and 96 hours. The mortality / survival of fish
in the aquaria were recorded.
3.5 Analysis of Haematological parameters
Standard methods were used for the estimation of haematological parameters:
blood smear (Hesser, 1960), total erythrocyte counts (TECs) (Hendricks, 1952) and total
leucocytes counts (TLCs) (Shaw, 1930). Haemoglobin content was measured
spectrophotometrically as per the diagnostic protocol of Boerhinger Manheim GmbH using
the diagnostic kits made by BMK Laboratories. The mean values of the results for the
various parameters were found out, then tabulated and graphically represented.
Blood Cell Count
Red Blood Corpuscles (RBC) were counted by Neubauer double haemocytometer
using Hymen’s and Turk’s solution as diluting fluid described by Dacie and Lewis (1977).
White Blood Corpuscles (WBC) differential count was carried out after staining the smear
with Wright stain.
Haemoglobin
The Hb content of blood can be determined accurately by spectrophotometry. The
Haemoglobin is first converted to methaenohaemoglobin by potassium cyanide. The
optical density of the solution is read in a spectrophotometer at 540 nm or in a calorimeter
using a yellow green filter. A calibration graph is prepared when the procedure is first

Materials and Methods 37
started. For the preparation of calibration graph we should have a known concentration of
standard. These standard solutions are obtained commercially (Drabkin et al., 1932). The
wavelength scale and absorbance scale may be calibrated using the mercury emission
line.
Packed Cell Volume (PCV) or Haematocrit value
PCV may be defined as the volume of packed red cells in a given sample of blood
and is expressed in percentage. It was determined using Wintrobe’s method (3000rpm).
Erythrocyte Sedimentation Rate (ESR)
Westergren method was adopted. When anti-coagulated blood is allowed to stand
undisturbed for a period of time the cells tend to sink spontaneously to the bottom,
displacing plasma, which moves to the top. The rate at which the sedimentation takes
place is called ESR.
Mean Cell Haemoglobin (MCH) and Mean Cell Haemoglobin Concentration (MCHC)
These values, calculated from the results of the RBC count, Hb content and PCV
have been widely used in the classification of anaemia. MCH is deduced from the
haemoglobin and red cell count, whilst MCHC is calculated from the measured
haemoglobin and the deduced PCV (Baker and Silverton, 1976).
3.6 Mortality Rate
Observations of the state of the experimental fishes were done at fixed intervals, at
the beginning of the experiment and at 1, 2, 4 and 6 hours in P. sophore and at 12, 24, 48,
72 and 96 hours in the case of H. brachysoma. The number of fishes alive, overturned
and dead in each concentration was recorded. From the data, mortality rates were
deduced.

Materials and Methods 38
Morphology of RBC and WBC
Thin blood films were prepared, immediately after collection, on previously cleaned
glass slide. It was then air dried, fixed in methanol and stained using Wright stain
(Chinabut et al., 1991). Photographs of the blood cells were taken using Nikon microscope
(Model - Eclipse E 400) to study the morphology and structure of the blood cells.
Statistical Analysis
The data obtained for the various parameters investigated were statistically
analysed to determine the levels of significance, employing analysis of variance (ANOVA)
following Gomez and Gomez (1986).

39
TABLE - 1
MAIN FEATURES OF RIVER PERIYAR
Origin : Sivagiri Hills, Tamilnadu
Length : 244 km
Direction of flow : Westwards
Catchment area in Kerala : 5284 km2
Average rainfall in Catchment area : 400 cm /year –1
Rate of flow: Minimum : 9.66 m3 Sec-1
Maximum : 1364.66 m3 Sec-1
Maximum Width : 405 m
Utilization
Domestic : 260 Mm3
Irrigational : 450 Mm3
Industrial : 1844 Mm3
Number of impounded Reservoirs : 14
Number of Hydroelectric Schemes : 6
Source: CWRDM (1995)

40
Table 2 Rainfall Data (mm) of river Periyar basin from October 2002 to December 2003
2002 2003
Date Oct. Nov. Dec. Jan. Feb. Mar. Apr. May Jun. Jul. Aug. Sep. Oct. Nov. Dec.
1 3 1.4 17.2 58.3 74 5.4 6.4
2 2.3 8.2 18.6 22.8 2.4 4.2 33 21.2
3 0.5 12.4 25.4 10.5 0.2 17 84 55.6
4 0.1 65.1 12.6 8.2 15.6 35 7.1
5 0.6 42.6 20.2 47
6 20.4 2.1 37.4 8.4 1.6 88 3.2
7 65.7 3.4 5.2 14.1 64 54 13.4
8 5.4 14.2 2.8 50 3.6
9 0.6 52.8 6.2 4.2
10 23.8 0.6 8.2 18.6 5.4
11 0.3 4.4 13.2 0.2 5.8 2.6
12 12 19.4
13 2.1 25 8.9 6.7 6 4.2 1.6 12.4 3.2
14 27.3 39.2 4.2 55 36.4 12.6 0.5
15 2.4 25 4.6 10 64.2 54.2 36
16 46.1 2.4 37 20.1 65.4 3.2 32 3.1
17 21.8 3.6 28.6 47 34.8 7.1 7.4
18 5.6 1.1 14.2 9.2 6.4 10.3 7.4
19 26.8 14.2 29 24.1 4.4 3.5
20 48.2 81 0.3 3.2 26
21 32.4 48 0.7 23.6 46
22 0.3 18.8 89 12.2 105 32
23 65.4 14 36.4 48.4 6.2
24 10 37.1 34.2 10
25 7.3 28.7 5.1 12
26 37.4 5.4 20.5 2.4
27 12.1 34 36.4 1.2
28 6.5 40.3 35 39.3 3.6
29 0.2 4.6 19.6 2.4
30 1.2 125 5.8 20.2
31 3.2 7.4 4.2 Total 214 Nil Nil 29 93.6 108 385 163 534 600 611 185 621 138 Nil
(Source: Rain Gauge Station Keerampara, Periyar River Basin)

41
Table 3 Rainfall Data (mm) of river Periyar basin for the year of 2004
Months Date Jan. Feb. Mar. Apr. May Jun. Jul. Aug. Sep. Oct. Nov. Dec.
1 5.1 1.6 33.4 3.9 26
2 9.4 2.2 4.2 1.4 31
3 11 28. 7 72.4 15.6 39.4
4 9.2 130 50.1 140 26
5 0.6 22.4 101 74.2 39.6
6 28 60.2 4.6 2.3 69.2 18 36
7 2.6 90.5 18.8 5.4 21.5 2.6
8 18.4 11.2 17.2 10.6 1.5 12
9 22.5 47.6 11.5 10.3 5.3
10 30.2 43.7 43.7 0.5 15
11 1.6 48.4 33.2 33.2 19
12 2.1 12 39 8.2 24.5 2.3 2.3 8.2 4
13 5.2 32.8 6.4 30.6 10 3
14 2.4 1.3 28.4 6.1 29.5 8.2 0.5
15 25.4 18.1 36.2 19.7 7.9
16 6.2 10.2 55 46.4 13.5 13 1.5
17 16 32.6 24.2 40.1 17.2 2.6 40
18 24.2 18.7 7.1 4.5
19 25.4 3.2 20.2 20.2 3.8 10
20 18.2 3.9 36.4 3.9
21 10 7 5.6 1.3 16
22 2.4 46.4 6.1 6.9
23 5.2 12.2 37.2 3.9 12
24 24.6 10.4 24 1.2
25 11 26.2 4.2 26.2 3.8 13 14
26 5.4 16.7 9.1 0.5 4.5
27 13 7.2 3.5 8.5 3.7 22 20
28 1.2 1.5 49.6 30 13.7 56 26
29 24.2 30 35.4 27.1 3.4 1.3
30 47 4.7 1.2 31.2 48.3 0.5 17
31 11 4 3.9
Total 24.2 2.1 113 153 630 827 679 498 197 310 Nil
Nil
(Source: Rain Gauge Station Keerampara, Periyar River Basin)

42

43
Fig. 2 Sketch of effluent outlets into Periyar in Eloor - Edayar industrial region

44
Fig. 3 Eloor – Edayar Industrial Area

45
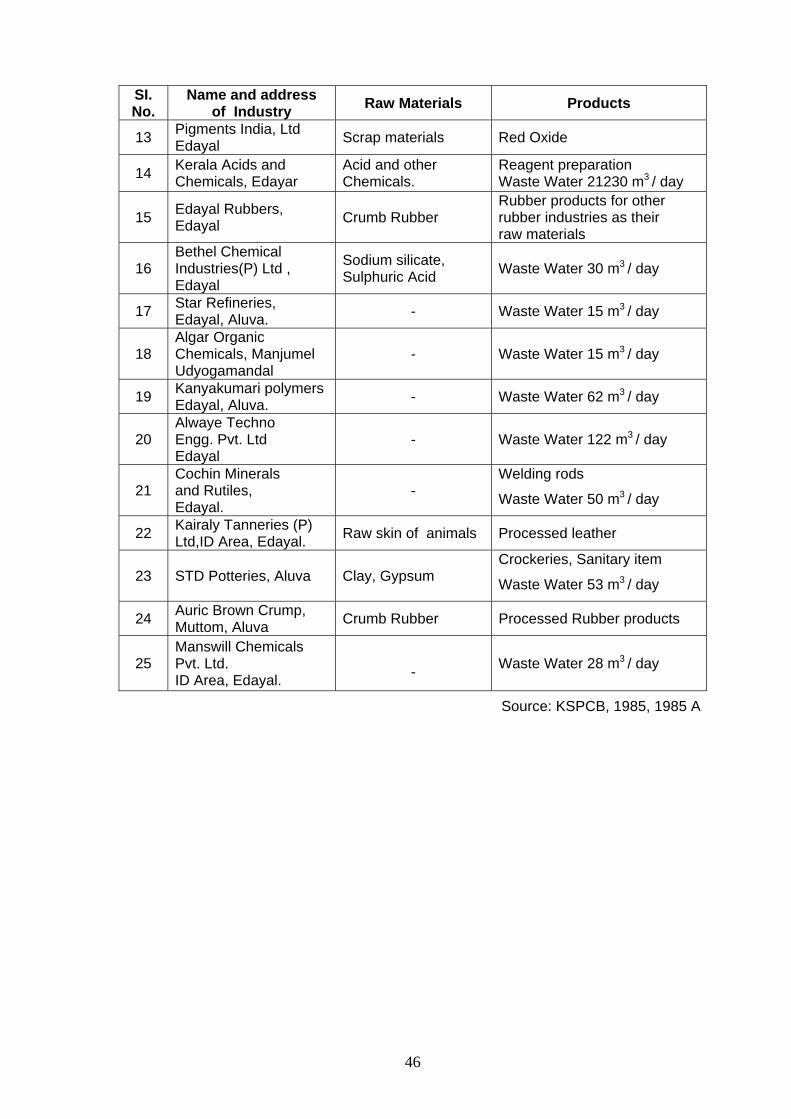
Table 4 Some Major Industries located in the Eloor - Edayar region along the shores of river Periyar
SI. No.
Name and address of Industry Raw Materials Products
1 Indian Aluminium Co. L t d, (IAC) Udyogamandal (1943)
Aluminium, Pitch, Aluminium, Fluoride, Cryolic
Aluminium rode, Al, ingots Al, Extension Waste Water 4110 x 10 lit /day
2
Travancore Chemicals Manufacturing Co. Ltd (TCMC) Kalamassery (1943)
Copper Scrap, Hel, Sulphuric Acid, Bauxite, Washed Granalite, Caustic soda, Sodium Chloride
Copper Oxychloride, Copper Sulphate, Sodium Aluminate, Aluminium Sulphate, Sodium Chloride, Potassiuum Chloride Waste Water 239.08 lit/day
3
Fertilizers and Chemicals Travancore Ltd (FACT) Udyogamandal, (1947)
Sulphur, Rock phos- phate, Naphtha, Hydrochloric acid
Ammonia, Ammonium sulphate, Ammonium phosphate, Ammonium Chloride, Sulphuric acid, Super - phosphate, Sulphur dioxide Water discharge 20658 x 106 lit / day
4 Travancore Cochin Chemicals Ltd, (TCC) (1951)
Sulphur, Soda, Ash, Barium carbonate, Caustic lime, Common salt.
Caustic soda, Sodium sulphide, Sodium hydrosulphate, Liquid chloride, Hel, Waste Water 3504 x 106 lit/day
5 Indian Rare Earths Ltd. (IRE) (1951)
Monozoic sand, Caustic Soda, Hydrochloric acid Chloride, Nitric acid
Trisodium earth, phosphon rare earths oxide, cerium oxide, Rare earths chloride.
6 Hindustan Insecticides Ltd (HIL) Udyogamandal (1951)
Benzene, Alcohol Chlorine
DDT, BHC, Endosulfan, Oleum.
7 Cominco Binani Zinc Ltd (CBZL) Binanipuram (1967)
Zinc, Zinc concentrate. Sulphuric acid, Cadmium
8 Periyar Chemicals Ltd Binanipuram (1965)
Sodium formate, Sulphuric Acid
Formic acid, Sodium sulphate, Waste water 844.96 lit / day
9 United Catalysts India Ltd, (UCI) Binanipuram (1970)
Alumina, Copper, Zinc, Iron scrap, Croplite, Sulphuric Acid, Sodium, Ammonia, Chloride, Carbon dioxide
Catalysts for Fertilizers and Petrochemical Industries Waste Water 125 x 106 lit/day
10 Sree Sakthi Paper Mills Ltd, Edaval
Waste paper, Case boards etc.
Craft paper, Waste Water 2200 m3 / day
11 Cropton Greaves, Athani
Tungsten, Epoxyresin, Aluminium cap.
Bulbs, Waste Water 220 m3 / day
12 Prime Agro products, I D Area, Binanipuram
Rice residue, Cereals, Salt.
Cattle feed Poultry feed
46
SI. No.
Name and address of Industry Raw Materials Products
13 Pigments India, Ltd Edayal Scrap materials Red Oxide
14 Kerala Acids and Chemicals, Edayar
Acid and other Chemicals.
Reagent preparation Waste Water 21230 m3 / day
15 Edayal Rubbers, Edayal Crumb Rubber
Rubber products for other rubber industries as their raw materials
16 Bethel Chemical Industries(P) Ltd , Edayal
Sodium silicate, Sulphuric Acid Waste Water 30 m3 / day
17 Star Refineries, Edayal, Aluva. - Waste Water 15 m3 / day
18 Algar Organic Chemicals, Manjumel Udyogamandal
- Waste Water 15 m3 / day
19 Kanyakumari polymers Edayal, Aluva. - Waste Water 62 m3 / day
20 Alwaye Techno Engg. Pvt. Ltd Edayal
- Waste Water 122 m3 / day
21 Cochin Minerals and Rutiles, Edayal.
- Welding rods
Waste Water 50 m3 / day
22 Kairaly Tanneries (P) Ltd,ID Area, Edayal. Raw skin of animals Processed leather
23 STD Potteries, Aluva Clay, Gypsum Crockeries, Sanitary item
Waste Water 53 m3 / day
24 Auric Brown Crump, Muttom, Aluva Crumb Rubber Processed Rubber products
25 Manswill Chemicals Pvt. Ltd. ID Area, Edayal.
- Waste Water 28 m3 / day
Source: KSPCB, 1985, 1985 A

47
Table 5 Length, Width and Weight of P. sophore used for the Experiment.
2002 2002 2002-03 2003 2003 2003-04 Body (Size)
Pre-monsoon Monsoon Post-monsoon Pre-monsoon Monsoon Post-monsoon
Length (cm) 7.2 - 8.5 6.8 - 8.3 7.5 - 8.8 6.5 - 8.2 6.9 - 8.4 7.1 - 8.6
Width (cm) 2.5 - 3.8 2.2 - 3.3 2.8 - 4 2.1 - 3.5 2.4 - 3.7 2.5 - 3.9
Weight (g) 11.3 - 18.8 9.8 - 17.8 12.8 - 20.1 10.5 - 17.6 10.3 - 16.8 12.4 - 18.5
Table 6 Length, Width and Weight of H. brachysoma used for the Experiment.
2002 2002 2002-03 2003 2003 2003-04 Body (Size)
Pre-monsoon Monsoon Post-monsoon Pre-monsoon Monsoon Post-monsoon
Length (cm) 15.2 - 22 18.8 - 24 14.2 - 23.2 12.6 - 22.4 16.5 - 24.3 13.7 - 23.2
Width (cm) 3.2 - 5.4 4.6 - 6.8 3.7 - 5.8 2.8 - 4.9 3.4 - 5.4 3.3 - 5.2
Weight (g) 35.4 - 80.2 40. - 90.5 32.8 - 84.6 28.7 - 76.5 38.3 - 93.2 33.3 - 86.4

PLATE 1: COLLECTION SITES
I. Bhoothathankettu
II. Paniely Poru III. Kalady IV. Chowara V.

PLATE 2: SITE-V INDUSTRIAL AREA
A. View of river Periyar from Eloor B. Close view of Industries near Periyar C. Industrial area of Eloor near the banks of river Periyar - I D. Industrial area of Eloor near the banks of river Periyar - II E.


PLATE 3: SITE-V INDUSTRIAL AREA (Continued)
E. Point source of effluent - 1
F. Point source of effluent - 2
G. Point source of effluent - 3
H. Colour change of water due to the effluent

PLATE 3
. -
k I.
3' I
( I .
r
. -

PLATE 4: SITE-V INDUSTRIAL AREA (Continued)
I. Spreading of the coloured effluent
J. Colour change of water due to the effluent
K. View of river Periyar 2 km down stream from Eloor

PLATE 4

PLATE 5: EXPERIMENTAL FISHES
A Puntius sophore (Hamilton) B Horabagrus brachysoma (Gunther)