material flow analysis of the city of hamburg -...
TRANSCRIPT

1
Material Flow Analysis of the City of Hamburg
Preliminary results
DRAFT VERSION
Mark Hammer, Stefan Giljum, Friedrich Hinterberger
Sustainable Europe Research Institute (SERI)
Schwarzspanierstraße 4/8, A-1090 Wien
Tel: +43 1 96 0728 14, Fax: +43 1 969 07 28 17, [email protected]
Paper presented at the Workshop “Quo vadis MFA? Material Flow Analysis –
Where do we go? Issues, Trends and Perspectives of Research for Sustainable
Resource Use“, Wuppertal, 9.–10. October 2003. *
Abstract
In this paper we present first results of a local MFA for the City of Hamburg. Material
flows have been accounted for the years 1992-2001. Material input and consumption
indicators for Hamburg increased during this last ten years. Material flows are almost overall
dominated by imports and a big share of the imports is re-exported again showing the role of
Hamburg as an international harbour. Material consumption per capita and per GDP is lower
in Hamburg than in overall Germany. But different to Germany where material inputs and
consumption stay stayed stable in per capita terms and declined in relation to GDP in
Hamburg material inputs and consumption per capita and per GDP increased.
Keywords: Material flow analysis (MFA), regional development, environmental
indicators, sustainability.
* This paper is part of the project “Nachhaltige Entwicklung zwischen Durchsatz und Symbolik“
(NEDS) (Sustainable development between throughput and symbolism), funded by the German
Ministry of Education and Research in the context of its program on socio-ecological research.
Contract number: SÖF (#624-40007-07 NGS 11).

2
1 Introduction
Issues of regional metabolism have already been discussed in the 1960s with a focus
on water use and water and air pollution of cities, for example by Wolman (1965). The fact
that cities are draining natural resources from their “Hinterland” has been discussed from an
ecological footprint perspective by Rees and Wackernagel (1996) and Luck et al. (2001). On
the one hand, they describe how Ecological Footprints are spatially distributed in a
heterogeneous way between urban areas and their surrounding regions and that cities can
not be sustainable within their boundaries. On the other hand they describe how the
population density of cities can facilitate solutions for certain environmental problems (e.g.
traffic or waste water treatment).
Several empirical MFA studies on regional or local levels have been carried out in the
past (Amann et al 2002, Barrett et al 2001 and 2002, Bringezu and Schütz 1996 a and b,
Brunner et al 1994, Daxbeck et al 1996, Gorree et al 2000, Hendriks et al 2000, IHOBE
2002, McEvoy 2001, Obernosterer et al 1998, Singh et al 2001). However, compared to the
large number of MFA studies on the national level, published studies on the regional or local
level are still very limited and a standardised method such as presented by Eurostat (2001)
for the national level does not exist yet. We consider material flow analysis on a regional or
local level as an important scientific tool on the way of regional and local sustainability
(Hinterberger 2000, Hinterberger and Schneider 2001).
In chapter 2 we will describe the methodology of material flow analyses. In chapter
three we will briefly describe the project within which this MFA has been carried out and
present the results of the MFA of Hamburg. Conclusions will be presented in chapter 4 and
the annex in chapter 5 gives a detailed description of calculation methods and data sources.
At the end of the paper one can find a summary of the data tables.
2 Description of the methodology
The principle concept underlying the economy-wide MFA approach is a simple model
of the interrelation between the economy and the environment, in which the economy is an
embedded subsystem of the environment and – similar to living beings – dependent on a
constant throughput of materials and energy. Raw materials, water and air are extracted from
the natural system as inputs, transformed into products and finally re-transferred to the
natural system as outputs (waste and emissions) (see Figure 1). To highlight the similarity to
natural metabolic processes, the terms “industrial” (Ayres, 1989) or “societal” (Fischer-
Kowalski, 1998a) metabolism have been introduced.

3
Figure 1: The basic model of material flow accounting and analysis (MFA)
According to the first law of thermodynamics (the law of the conservation of mass),
total inputs must by definition equal total outputs plus net accumulation of materials in the
system. This material balance principle holds true for the economy as a whole as well as for
any sub-system (an economic sector, a company, a household).
For a consistent compilation of an economy-wide material flow account, it is
necessary to define exactly, where the boundary between the economic and the
environmental system is set, as only resources crossing this border will be accounted for. As
described in the System of Environmental and Economic Accounts (SEEA) (United Nations,
1993, 2001), the economic sphere is defined in close relation to the flows covered by the
conventional System of National Accounts (SNA). Thus all flows related to the three types of
economic activities included in the SNA (production, consumption and stock change) are
referred to as part of the economic system. On the other hand, the environmental sphere
comprises all resources other than products traded within the market system.
Therefore, for MFA on the national level, two main boundaries for resource flows can
be defined. The first is the boundary between the economy and the domestic natural
environment, from which resources (materials, water, air) are extracted. The second is the
frontier to other economies with imports and exports as accounted flows.
2.1 Categories of material flows
Before outlining a comprehensive material balance scheme, we have to explain the
differences between the different types of material flows. In its methodological guide,
4
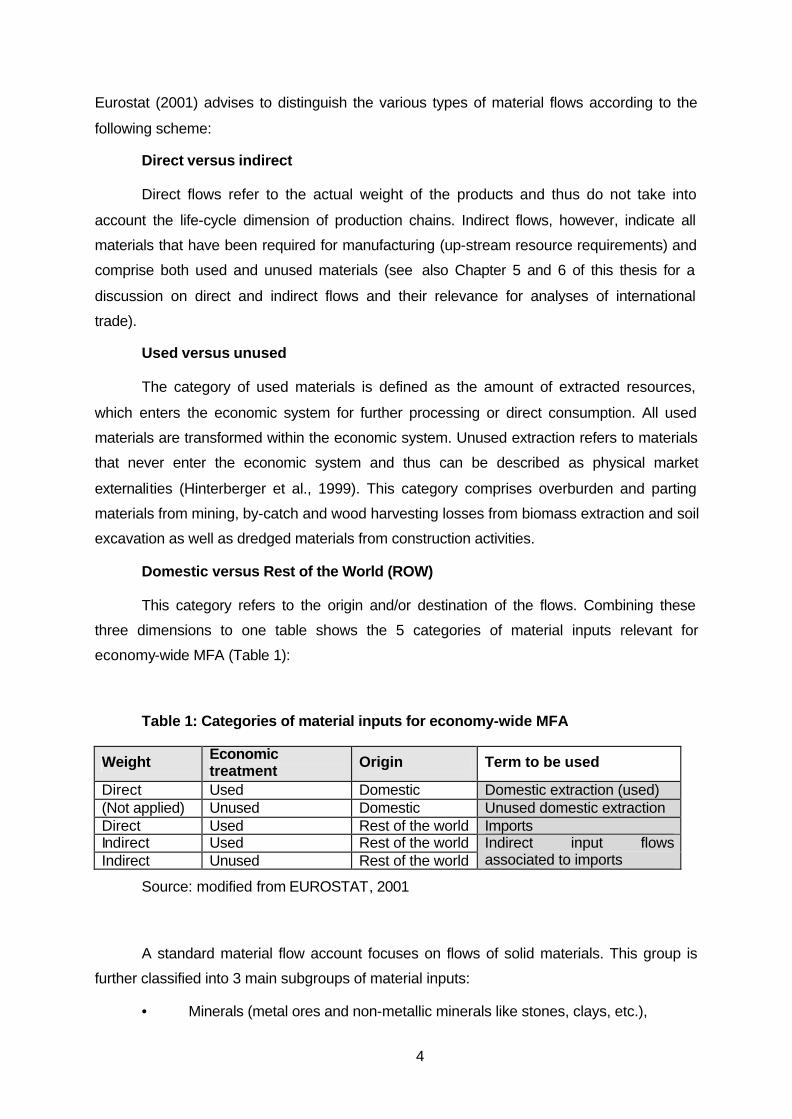
Eurostat (2001) advises to distinguish the various types of material flows according to the
following scheme:
Direct versus indirect
Direct flows refer to the actual weight of the products and thus do not take into
account the life-cycle dimension of production chains. Indirect flows, however, indicate all
materials that have been required for manufacturing (up-stream resource requirements) and
comprise both used and unused materials (see also Chapter 5 and 6 of this thesis for a
discussion on direct and indirect flows and their relevance for analyses of international
trade).
Used versus unused
The category of used materials is defined as the amount of extracted resources,
which enters the economic system for further processing or direct consumption. All used
materials are transformed within the economic system. Unused extraction refers to materials
that never enter the economic system and thus can be described as physical market
externalities (Hinterberger et al., 1999). This category comprises overburden and parting
materials from mining, by-catch and wood harvesting losses from biomass extraction and soil
excavation as well as dredged materials from construction activities.
Domestic versus Rest of the World (ROW)
This category refers to the origin and/or destination of the flows. Combining these
three dimensions to one table shows the 5 categories of material inputs relevant for
economy-wide MFA (Table 1):
Table 1: Categories of material inputs for economy-wide MFA
Weight Economic treatment Origin Term to be used
Direct Used Domestic Domestic extraction (used) (Not applied) Unused Domestic Unused domestic extraction Direct Used Rest of the world Imports Indirect Used Rest of the world Indirect Unused Rest of the world
Indirect input flows associated to imports
Source: modified from EUROSTAT, 2001
A standard material flow account focuses on flows of solid materials. This group is
further classified into 3 main subgroups of material inputs:
• Minerals (metal ores and non-metallic minerals like stones, clays, etc.),

5
• Fossil energy carriers (coal, oil, gas), and
• Biomass (from agriculture, forestry and fishery).
The material stock
From the viewpoint of physical accounting, the accumulation of a large physical stock
is one main characteristic of modern industrialised societies. Stocks in the MFA framework
mainly comprise man-made assets: infrastructure and buildings on the one hand and durable
consumption goods (like cars, household equipment) and investment goods (machinery) on
the other hand. Forests and agricultural plants are considered part of the environmental
system and are therefore not included in the physical stock, whereas harvests of timber and
crops are accounted as inputs to the socio-economic system. EUROSTAT (2001) suggests
treating waste deposited in controlled landfills as outputs of the economy to the environment
rather than a physical stock.
2.2 A general scheme for economy-wide MFA
After having explained the various categories of material flows and the importance of
the physical stock, a general balance scheme including all relevant input and output flows
can be presented (Figure 2). The material balance reveals the composition of the physical
metabolism of an economy and depicts domestic material extraction, imports and exports in
physical units, the physical growth of its infrastructure as well as the amount of materials
released back to nature.
Figure 2: General scheme for economy-wide MFA, excluding water and air flows

6
Source: EUROSTAT, 2001
Material inputs to the economic system comprise used domestic extraction of various
material groups (fossil fuels, minerals and ores, and biomass). In addition, material inputs
include so-called “unused domestic extraction (UDE)”. UDE comprises materials that had to
be moved during extraction activities, but do not enter the economic system for further
processing (such as cover material or overburden from mining and residuals from harvest in
agriculture). Consequently, unused flows do not have an economic value. These flows have
been termed “hidden flows” in earlier MFA publications, as they are not “visible” in the
monetary economy (for example, Adriaanse et al., 1997). Finally, material inputs include
physical imports and indirect flows associated with them.
Material inputs are (a) accumulated within the socio-economic system (net addition to
stock, such as infrastructure and durable consumer goods), (b) consumed domestically
within the accounting period (in most cases one year) and thus crossing the system
boundary as waste and emissions back to nature or (c) exported to other economies.
2.3 Indicators derived from economy-wide MFA
Within the internationally harmonised classification systems for environmental
indicators, like the pressure-state-response (PSR) framework of the OECD (1994) or the
extended Driving Forces-Pressures-State-Impact-Response (DPSIR) system of the
European Union (EUROSTAT, 1999), material-flow based indicators are part of the pressure
indicator group. These indicators identify and describe socio-economic activities, which
cause pressures on the environment. However, their ability to provide information on the
actual environmental impacts is very limited (see below).
7
A large number of resource-use indicators can be derived from economy-wide
material flow accounts as illustrated in Figure 2, providing a comprehensive description of the
biophysical metabolism of societies. These indicators can be grouped into (a) input, (b)
output and (c) consumption indicators and have been developed in international co-
operations in the course of the last 5-10 years (see, for example, Adriaanse et al. 1997,
Matthews et al. 2000).
The following section lists the main indicators of each indicator group and is based on
the suggestions in the methodological guide, published by EUROSTAT (2001).
Main input indicators:
• Direct material input (DMI) comprises all materials, which have economic
values and are directly used in production and consumption activities. DMI equals the sum of
domestic extraction plus imports.
• Total material input (TMI) is the DMI plus the unused domestic extraction.
• Total material requirement (TMR) includes - in addition to TMI - the indirect
(used and unused) flows associated to the imports of an economy. TMR thus is the most
comprehensive material input indicator, comprising all input flows illustrated in Figure 2.
Main output indicators:
• Domestic processed output (DPO) equals the flow „outputs to nature“ in
Figure 2 and comprises all outflows of used materials from domestic or foreign origin. DPO
includes emissions to air and water, wastes deposited in landfills and dissipative flows.
Recycled materials are not included in the DPO indicator.
• Total material output (TMO) includes additionally to the DMO also the
unused domestic extraction thus comprises all three categories of output flows shown in
Figure 2.
Main consumption indicators:
• Domestic material consumption (DMC) measures the total quantity of
materials used within an economic system, excluding indirect flows. Thus DMC is the closest
equivalent to aggregate income in the conventional system of national accounts. DMC is
calculated by subtracting exports from DMI.

8
• Total material consumption (TMC) includes, in addition to DMC, also the
indirect flows associated to imports and exports and can be calculated using either LCA-
oriented or input-output techniques (see also below). TMC equals TMR minus exports and
their indirect flows.
Physical Trade Balance (PTB): A PTB expresses whether resource imports from
abroad exceed resource exports of a country or world region and to what extent domestic
material consumption is based on domestic resource extraction or on imports from abroad. A
physical trade balance is compiled in two steps. A PTB for direct material flows equals
imports minus exports of a country or region. A comprehensive PTB can also be calculated
including indirect flows associated to imports and exports.
Net addition to stock (NAS) describes the annual accumulation of materials within
the economic system and thus could also be termed „physical growth of the economy“.
Materials forming the stock mainly consist of construction materials for new infrastructure
and durable goods, such as cars and industrial machinery.
3 Case study of the City of Hamburg
3.1 The NEDS project
This paper is part of the project “Nachhaltige Entwicklung zwischen Durchsatz und
Symbolik“ (NEDS) (Sustainable development between throughput and symbolism), funded
by the German Ministry of Education and Research in the context of its program on socio-
ecological research. The main objective of NEDS is integrating approaches of ecological
economics, environmental accounting (in particular material flow accounting - MFA),
discourse analysis (for the aspect of interlinking MFA with discourse analysis see Luks and
Hammer, unpublished) and constructivist aspects, in order to explicitly take into account the
complex relationship between science and policy1.
In the NEDS project, 3 European regions are selected as case studies for regional
MFAs. The regions are: the metropolitan region of Hamburg (the city of Hamburg and 6
NUTS 3 regions surrounding the city), the metropolitan region of Vienna (the city of Vienna
and two NUTS 3 regions) and the metropolitan region of Leipzig (including one NUTS 3
1 Further information on the project can be found in the internet at www.neds-project.de or
www.seri.at/neds.

9
region of surrounding area). The regions have been selected from a database of 73
European regions, which have been classified as active promoters of regional sustainable
development (BBR 2001). In the course of the project, parallel analyses of the biophysical
metabolism (assessed with an MFA approach) and the discourse on sustainability are carried
out in each of the selected regions, in order to identify their linkages and to formulate
possible paths towards a more efficient use of natural resources on the regional level.
The 3 regional MFA accounts compiled in the course of the project will as close as
possible be compiled in accordance with the standardized method of the Eurostat guide for
economy-wide material flow accounts (Eurostat, 2001). This is of importance, as, on the one
hand, regional MFAs can only enable the cross-checking with and completion of national
MFAs, when following the same methodological procedure. On the other hand, when
regional MFA data is not available and estimation methods have to be applied, national MFA
data can only serve as a starting point for estimations, when using the same classification of
material flows.
Given sufficient data availability, the regional material flow accounts will also include
unused domestic extraction and indirect flows associated to imports. If data concerning
unused domestic extraction (mainly overburden from mining activities) is not available from
official statistical sources, a first estimation of overburden should be obtained through
personal communication with the most important mining co-operations in the regions.
Indirect flows associated to imports will be estimated by applying “rucksack factors”
for the German economy, which have been calculated by the Wuppertal Institute and are so
far the most detailed data for indirect flows available world-wide (for example, Bringezu
2001). For the 2 regions located in Germany this procedure should deliver reliable results.
For the third region in another European country, the estimation is based on the assumption
of an identical import structure of the region compared to Germany. This procedure has been
used for a number of other MFA studies on the regional and national level (for example,
Hammer and Hubacek 2002, IHOBE 2002, Juutinen and Mäenpää 1999). However, one
should be aware of deviations from results based on country- or region-specific rucksack
factors for imports.
Provided a sufficient availability of data, the 3 regional MFAs will be compiled in a
time series from 1992-2001. We choose this period of 10 years, as, on the one hand, we can
expect that data availability will be the higher the more recent the time period of our
investigation is set. This is of particular importance, as data availability will be one of the
crucial points for the success of the regional MFA studies. On the other hand, a period of 10
years is long enough to capture recent changes in the metabolic profile of the regions and to
analyse impacts of changed political / discursive frameworks on regional material flows. A

10
detailed description of the methodology used for the projects MFAs can be found in Hammer
et. al. (2003).
3.2 Method and data sources
The method followed as far as possible the method of Eurostat (2001). For this paper
only the MFA of the City of Hamburg (without its surrounding regions) has been calculated.
The material inputs and outputs have been classified according to Eurostat (2001). Unused
domestic extraction and indirect flows associated to imports and exports have not been
calculated as material input data was available only highly aggregated which did not allow an
useful estimation of indirect flows. Material input data was in many cases available in tons.
Where this was not the case estimation had been made as far as possible. A detailed
description of the used data sources and the calculation of the MFA are given in the technical
annex of this paper.
3.3 Results
3.3.1 Material inputs and consumption per capita
Direct Material Input (DMI) in absolute numbers increased from about 98 million tons
in 1992 to about 117 million tons in 2002. Domestic extraction accounted for only
approximately 160.000 tons or 1,6 per mill of DMI. Therefore DMI is dominated almost
overall by imports. DMI per capita increased from 75,8 tons in 1992 to 68,3 in 2003. About 80
million tons of DMI have been exported again. Therefore direct Material Consumption (DMC)
is significantly lower than DMI with 10,9 tons per capita in 1992 and 18,9 tons per capita in
2002. These trends and a comparison with German MFA data (from Moll et al 2003) is
shown in Figure 3. DMI per capita for Hamburg was much higher than the German average
which is at approximately 20 tons per capita and year. On the other hand DMC per capita
was lower. The trends also show that material inputs and consumption of Hamburg
increased during the last decade whereas these indicators stayed more or less constant for
Germany. The importance of imports for material inputs is not very surprising as in a
metropolitan region like Hamburg no big extraction activities (mining, quarrying, agriculture)
exist. The high DMI and the large difference between DMI and DMC of Hamburg can be
explained by the so-called “harbour-effect” (Eurostat 2001). Hamburg is one of the big
European harbours receiving big amounts of raw materials and products from overseas

11
which are re-exported again. Due to this effect a comparison of material input indicators
alone is not scientifically sound.
Figure 3: DMI and DMC per capita
DMI/DMC per capita, Germany and Hamburg
0,0
10,0
20,0
30,0
40,0
50,0
60,0
70,0
80,0
1992
1994
1996
1998
2000
Years
tons
per
cap
ita
DMI per capitaHamburg
DMC per capitaHamburg
DMI per capitaGermany
DMC per capitaGermany
Source: Own calculations, for German data: Moll et. al. 2003.
3.3.2 Resource productivity or eco-efficiency
DMI per GDP stayed more or less constant around 1.600 tons per million Euros GDP
produced. DMC increased from 300 tons per million Euros to 460 tons. Therefore Hamburg
shows no trend of dematerialisation. Eco-efficiency stayed constant in terms of DMI and
even decreased in terms of DMC. A different picture can bee seen for overall Germany
where resource productivity slightly increased and a growing GDP could be produced with
less units of material input or consumption per unit of GDP. On the other hand resource
productivity (GDP produced by material use) in terms of material consumption is much higher
in Hamburg than in overall Germany. Much less material consumption has been used to
generate the GDP of Hamburg in comparison to Germany. A comparison based on the
material input is again not useful due to the above mentioned “harbour-effect”. The results
are shown in Figure 4.
Figure 4: DMI and DMC per GDP

12
DMI/DMC per GDP, Germany and Hamburg
0,000,200,400,600,801,001,201,401,601,80
1992
1994
1996
1998
2000
Years
1000
to
ns
per
mill
ion
eu
ro
1995
DMI per GDPHamburg
DMC per GDPHamburg
DMI/GDPGermany
DMC/GDPGermany
Source: Own calculations, for German data: Moll et. al. 2003.
3.3.3 Imports, exports and physical trade balance
Imports increased by approximately 20% from about 98 million tons in 1992 to 118
million tons in 2002. The biggest import category is ores and industrial minerals followed by
industry products, biomass and fossil fuels. The composition of imports changed slightly
during the past 10 years mainly due to the increase in imports of industry products.
Figure 5: Imports
Imports, City of Hamburg 1992-2001
0
20.000
40.000
60.000
80.000
100.000
120.000
140.000
1992
1994
1996
1998
2000
Years
1000
tons
Other imports
Other industryproducts
Chemical products
Fossils and fossilproducts
Ores and industrialminerals
Biomass and biomassproducts
Source: Own calculations.

13
Exports account for approximately 20% of the imports showing the importance of the
harbour of Hamburg as a centre of international trade. Exports showed a slower increase,
from 81 to 85 million tons between 1992 and 2002. The largest exports groups are ores and
minerals and chemical products. Exports show a more homogenous distribution between
export groups than imports.
Figure 6: Exports
Exports, City of Hamburg 1992-2001
0
20.000
40.000
60.000
80.000
100.000
1992
1994
1996
1998
2000
Years
1000
to
ns
Other exports
Other industryproducts
Chemical products
Fossils and fossilproducts
Ores and industrialminerals
Biomass and biomassproducts
Source: Own calculations
The physical trade balance shows that imports exceeded exports in every year
analysed. As for national economies the physical trade balance can differ remarkably
depending on the size of the country and the availability of natural resources within its
borders this result is not very surprising for a city as almost all of its material consumption
has to be feed by imports and natural resources that could expand exports are missing.
Therefore for the city of Hamburg the physical trade balance amounts for almost 100% of
DMC.
Figure 7: Physical Trade Balance

14
Physical Trade Balance, City of Hamburg 1992-2001
0
20.00040.000
60.000
80.000
100.000120.000
140.000
1992
1994
1996
1998
2000
Years
1000
ton
s
Imports
Exports
Physical TradeBalance
Source: own calculations
The physical trade balance shows large differences for the different commodity
categories traded as shown in Figure 8. As the physical trade balance has been calculated
by subtracting exports from imports a positive trade balance means that imports exceeded
exports. Only for to categories the exports have been bigger than the imports: for chemical
products and for a group called “other imports/exports” summarizing not specified imports
and exports. Chemical product showed a big negative trade balance but with a decreasing
trend as exports of chemical products declined during the observed period.
Figure 8: Physical trade balance by commodities
Physical Trade Balance, City of Hamburg 1992-2001
-15.000
-10.000-5.000
05.000
10.00015.000
20.000
1992
1994
1996
1998
2000
Years
1000
tons
Biomass andbiomass products
Ores and industrialminerals
Fossils and fossilproducts
Chemical products
Other industryproducts
Otherimports/exports
Source: Own calculations

15
3.3.4 “Domestic” extraction
Domestic extraction within a metropolitan region is certainly a special case for a MFA
as no remarkable extraction activities can exist within a densely built up area. No extraction
of ores or fossil fuels exists within the area of Hamburg. According to personal
communication with members of the statistical office of Hamburg extraction of minerals exists
(for example sand and gravel) but underlies secrecy as the number of extraction firms is very
low. Extraction of minerals normally builds up an important input category and therefore the
lack of this data is one of the weakest points for the results. There fore domestic extraction
data only was included for agriculture, forestry, fishery and was estimated for grazing
animals.
Figure 9: „Domestic extraction
"Domestic" extraction, City of Hamburg 1992-2001
020406080
100120140160180
1992
1993
1994
1995
1996
1997
1998
1999
2000
2001
Years
1000
ton
s
Fish
Grazing
Forestry
Agriculture
Source: Own calculations
Total domestic extraction amounted for about 160.000 tons in 2002 being
approximately 1 per mille of DMI. The largest input came from agriculture with approximately
100.000 tons. At the moment of the publication of this paper no data has been included for
agricultural extraction for the years 1992-1994. Data for domestic extraction of agricultural
biomass was for the most commodities not available in tons but had to be estimated from
area and yield data. The statistical source used also changed the output of reporting within
the observed period (summing up Berlin, Bremen and Hamburg in the statistics for the years
1997-1999 for some commodities). Therefore different calculation and estimation methods
had to be applied over the whole time period which results in huge fluctuations in MFA data
which are object for future revision.

16
4 Conclusions
The material flows of the city of Hamburg are almost overall dominated by its trade
flows. Direct extraction of materials does not play an important role. Hamburg as an
important international harbour shows much higher material inputs per capita than overall
Germany which is due to high imports which are to a big extend re-exported again. Material
consumption per capita in Hamburg is lower than in Germany. Also material consumption per
unit GDP produced is lower and both consumption indicators show an increasing trend.
Therefore neither absolute nor relative dematerialisation is taking place. At the moment
material intensity and consumption in Hamburg is lower than in Germany but the trend goes
into “materialisation”.
On the methodological point of view the following main problems occurred: Very
aggregated data did not allow the calculation of unused domestic extraction and indirect
flows associated to imports and exports. Important categories of domestic extraction (sand
and gravel) exist but underlie secrecy. Data sources changed in their quality and way of
reporting during the observed period. This made necessary estimations and extrapolations of
data for several material categories for several years.
5 Technical Annex
The technical annex describes the data sources and the methods of calculation used
for this study.
5.1 Domestic extraction of fossil fuels
No extraction of fossil fuels exists within the city of Hamburg (Statistical office of the
City of Hamburg, personal communication).
5.2 Domestic extraction of metal ores
No extraction of metal ores exists within the city of Hamburg (Statistical office of the
City of Hamburg, personal communication).

17
5.3 Domestic extraction of construction materials
Domestic extraction of construction materials exists (for example, sand and gravel)
but underlies secrecy as the number of extracting firms is very small (Statistical office of the
City of Hamburg, personal communication).
5.4 Domestic extraction of industrial minerals
No extraction of industrial minerals exists within the city of Hamburg (Statistical office
of the City of Hamburg, personal communication).
5.5 Domestic extraction of biomass from agriculture
Data was taken from (Statistisches Bundesamt various years-c).
Normally this source shows the area, yield and harvest for several agricultural
products. But for some agricultural products the statistics show data only for an area of some
hundred or thousand hectares in Hamburg but no data on yield or harvest. In those cases the
harvest was estimated by using the mean of the yields of Schleswig-Holstein and
Niedersachsen which are the provinces closest to Hamburg. For these provinces yields are
reported for every year for every agricultural product within the same table. If yields were
reported only for one of this provinces this value has been taken. If no yield was reported for
neither of these provinces the yield for Germany has been taken.
For some years and some products harvest for Hamburg was also reported in tons. In
that case these values have been used as primary data.
Data for some cereals and industrial plants for 1997 to 1999 was summarized in the
statistics for Berlin, Hamburg and Bremen, which also constitute German provinces
(“Stadtstaaten”). Therefore the harvest values for these commodities had to be estimated.
First for all commodity categories concerned the share of agricultural area of Hamburg of all
the cities was calculated from the shown areas in the separated statistics in the year 2000.
The harvest of Hamburg was estimated by dividing the reported harvest (in tons) for all three
cities with this share. If we compare this data with the data for earlier and later years we see
that this approach leads to a serious under estimation. Therefore the harvest for this years
has to be estimated again with another method in a revision.

18
For various vegetables, strawberries and garden plants2 only the used area has been
reported in our source (in sum: 1054 hectares for 2001). Yields or production are not
reported. No conversion into production has been made and therefore this group is not
included in the MFA data. For some industrial plants3 also only the area has been reported
(between 2 and 199 hectares for 2000 and 2001). Within the category of fodder plants under
“other fodder plants” only the area is stated (64 hectares for 2001; compared to 967 total
area for fodder plants) and no conversion into production has been made.
Fruits data contains only data for market production (”Marktobstanbau”). For most
fruits the statistics contain the number of trees instead of areas and the yield is reported in
yield per tree (kg/tree). If for the city of Hamburg only the number of trees was reported the
harvest was estimated by multiplying this number with the mean of the yields of
Niedersachsen and Schleswig-Holstein (or only one yield if both were not available).
For some berries (currants, gooseberries, raspberries) only the yield per bush was
reported. No conversion into harvest has been made.
For vegetables grown in greenhouses areas where reported for Germany an all
provinces. Harvest was reported only for Germany. Therefore, the area and harvest for
Germany was used to calculate a value for the yield which was also used for converting the
area of greenhouse agriculture in Hamburg into an estimated harvest for Hamburg.
Production of ornamental plants is also reported in the statistics used but only in
hectares of used area and numbers of plants produced. In 2000 more than 45 million plants
have been produced on an area of 81 hectares. No estimation for the weight of the plants
has been made and therefore they are not included in the material flow analysis.
5.6 Domestic extraction of biomass from forestry
In the (Statistisches Bundesamt various years-e) data for wood extraction is reported
in cubic meters. This data has been converted into weight units by factors taken from (FAO
2001). The data was reported from October of one year to September of the following year
and was for the calculation of the MFA allocated to the latter. At the moment of the
2 „Gemüse, Erdbeeren und Gartengewächse“: Gemüse, Spargel, Erdbeeren ohne Samenbau;
Blumen und Zierpflanzen einschließlich Stauden und Jungpflanzen ohne Samenbau;
Gartenbausämereien, Vermehrungsanbau von Blumenzwiebeln und Knollen.
3 Flachs, „andere Ölfrüchte“, Hopfen, Tabak, Rübsen und Gräser zur Samengewinnung, Heil-
und Gewürzpflanzen, „andere Arten“.

19
calculation no data was available for 2001. Data for 2001 has been estimated by
extrapolating data from the years between 1993 and 20004. Also No data has been available
for 1992. The value for 1992 has been estimated by extrapolating the trend between 1993
and 2000.
5.7 Domestic extraction of biomass – grazing
Biomass from grazing has been estimated using numbers of heads of animals from
(Statistisches Bundesamt various years-e) and factors for estimated daily biomass
consumption per animal. For the years 1997–1999 no new counting for cattle, poultry, sheep
and horses is listed in the source, instead the numbers from 1996 were taken.
5.8 Domestic extraction of biomass – hunting
The number of hunted animals per year is reported in (Statistisches Bundesamt
various years-e). No estimation for the weight of the hunted animals has been made and
therefore biomass from hunting is not included in the MFA.
5.9 Domestic extraction of biomass – fisheries
Data has been taken from (Statistisches Bundesamt various years-b). Data for
extraction of fish which was landed in Hamburg by ship was only available for single years
which made no useful estimation possible for other years. As the total of fish landed amounts
for approximately 250 tons per year out of approximately 1 million tons of Direct Material
Input we consider the mistake as neglectible.
5.10 Imports and exports
Data for imports and exports was available for different modes of transport. For each
mode of transport – except of air transport – data was available disaggregated by commodity
groups. For the MFA the data was then aggregated by commodity groups.
4 For extrapolations the automatic extrapolation function of excel has been used.

20
Data has been taken from the following sources: inland water transport (Statistisches
Landesamt der Freien und Hansestadt Hamburg various years-a), maritime goods traffic
(Statistisches Landesamt der Freien und Hansestadt Hamburg various years-b), railroad
traffic 1997-2001 (Statistisches Bundesamt various years-g), railroad traffic 1992-1996
(Statistisches Bundesamt various years-f)5, road traffic 2001-1997 (Statistisches Bundesamt
various years-g), air traffic (Statistisches Bundesamt various years-d)6.
Data for road traffic for 1994-1996 has been extrapolated from the trend between
1997 and 2001. Data for road traffic for 1992 and 1993 was also available from (Statistisches
Bundesamt various years-a). Here only a single number for total imports/exports has been
reported. As this number was significantly lower than the 1994 number estimated from the
trend between 1997 and 2001 (for example only the imports of stones and earth [“Steine und
Erden”] from the estimation for 1994 and its actual values in 1999-2000 was higher than the
total imports reported for 1992 or 1993). For railroad traffic for 1992 and 1993 data was only
available in total imports/exports. Therefore the values for these years have been
extrapolated from the trend of the detailed data for the years 1994-2001.
References
Adriaanse, A., Bringezu, S., Hamond, A., Moriguchi, Y., Rodenburg, E., Rogich, D., Schütz,
H. 1997. Resource Flows: The Material Base of Industrial Economies. World
Resource Institute, Washington.
Amann, C., W. Bruckner, M. Fischer-Kowalski, and C. M. Grünbühel (2002). Material Flow
Accounting in Amazonia. A Tool for Sustainable Development. Social Ecology
Working Paper. 63. Vienna: Institute for Interdisciplinary Studies of Austrian
Universities (IFF).
Ayres, R. 1989. Industrial metabolism. In: Ausubel, J. (Ed.) Technology and Environment.
National Academy Press, Washington, D.C.
5 The change in the source for railroad traffic was necessary as the series „Verkehr im
Überblick“ exists only since 1997 and the series „Eisenbahnverkehr“ contains a detailed report by
commodity groups only up to the year 1997. Therefore none of these sources could be used for the
whole time series.
6 As data for air traffic was only available in the two categories „freight traffic“ and „post traffic“
these values have been added to the category “other imports“.

21
Barrett J. , A. Scott (2001). An Ecological Footprint of Liverpool. Developing Sustainable
Scenarios. A Detailed Examination of Ecological Sustainability. Stockholm
Environment Institute – York, Sustainable Steps Consultants.
Barrett J., H. Vallack, A. Jones and G. Haq (2002). A Material Flow Analysis and Ecological
Footprint of York. Stockholm Environment Institute (York).
BBR (Bundesamt für Bauwesen und Raumordnung) (2001). Europe’s Regions on their Way
to Sustainable Development. CD-ROM.
Bringezu, S. and H. Schütz (1996a). Der ökologische Rucksack des Ruhrgebiets, Rep. No.
61. Wuppertal Institute, Wuppertal.
Bringezu, S. & Schütz, H. (1996b) Die stoffliche Basis des Wirtschaftsraumes Ruhr. Ein
Vergleich mit Nordrhein-Westfalen und der Bundesrepublik Deutschland. RuR, 6.
Brunner, P., Daxbeck, H., and Baccini, P. (1994). Industrial metabolism at the regional and
local level: A case-study on a Swiss region, in Ayres, R.U. and Simonis, U.E.
(eds) Industrial Metabolism: Restructuring for Sustainable Development, United
Nations University Press, Tokyo.
Daxbeck, H., Lampert, C., Morf, L., Obernosterer, R., Rechberger, H., Reiner, I., and
Brunner, P. (1996) Der anthropogene Stoffhaushalt der Stadt Wien, Technical
University of Vienna, Wien.
EUROSTAT. 1999. Toward environmental pressure indicators for the EU. Statistical Office of
the European Union, Luxembourg.
EUROSTAT. 2001. Economy-wide material flow accounts and derived indicators. A
methodological guide. Statistical Office of the European Union, Luxembourg.
FAO (2001). FAO Yearbook 1999. Forest Products. Rome. FAO Forestry Series No. 34.
FAO Statistics Series No. 157.Fischer-Kowalski, M. 1998a. Society´s Metabolism.
In: Redclift, G., Woodgate, G. (Eds.) International Handbook of Environmental
Sociology. Edward Elgar, Cheltenham.
Gorree, M., R. Kleijn and E. van der Voet (2000). Materiaalstromen door Amsterdam.
Amsterdam, CML.
Hammer, M., Giljum, S., Bargigli, S., Hinterberger, F. 2003. Material flow analysis on the
regional level: questions, problems, solutions. NEDS Working Paper. No. 2,
Hamburg.

22
Hammer, M., Hubacek, K. 2002. Material flows and economic development. Material flow
analysis of the Hungarian economy. Interim Report. No. 02-057. International
Institute for Applied Systems Analysis (IIASA), Laxenburg.
Hendriks, C., Obernosterer, R., Müller, D., Kytzia, S., Baccini, P., and P. Brunner (2000).
Material flow analysis: a tool to support environmental policy decision making.
Two case studies on the city of Vienna and the Swiss lowlands. Local
Environment, 5, pp. 311-328.
Hinterberger, F. (2000). Eco-efficiency of regions. How to emprove competitiveness and
create jobs by reducing environmental pressure. With contributions from: K.
Bamberger, C. Manstein, P. Schepelmann, F. Schneider and J. Spangenberg.
Commissioned by the government of Carinthia, supportet by the Austrian ministry
of agriculture, forestry, environment and water. Vienna.
Hinterberger, F., Renn, S., Schütz, H. 1999. Arbeit – Wirtschaft – Umwelt. Einige Indikatoren
sozialer, wirtschaftlicher und ökologischer Entwicklung im Zeitablauf. Wuppertal
Paper. No. 89. Jänner 1999, Wuppertal.
Hinterberger, F. and F. Schneider (2001). Eco-Efficiency of Regions: Toward Reducing Total
Material Input. 7th European Roundtable on Cleaner Production, Lund (Sweden).
IHOBE (2002). Total Material Requirement of the Basque Country, IHOBE.
Juutinen, A. and I. Mäenpää (1999). Time Series for the Total Material Requirement of the
Finnish Economy. Summary. Interim Report 15 August 1999. Oulu: University of
Oulu. Thule Institute.
Luck, M.A., G. D. Jenerette, J. Wu and N.B. Grimm (2001). The Urban Funnel Model and the
Spatially Heterogenous Ecological Footprint. In Ecosystems, 4, 782-796.
Luks, F., and M. Hammer (unpublished). Material Flow Analysis, Discourse Analysis and the
Rhetoric of (Ecological) Economics. Manuscript to be submitted to Ecological
Economics.
Matthews, E., Bringezu, S., Fischer-Kowalski, M., Huetller, W., Kleijn, R., Moriguchi, Y.,
Ottke, C., Rodenburg, E., Rogich, D., Schandl, H., Schuetz, H., van der Voet, E.,
Weisz, H. 2000. The weight of nations. Material outflows from industrial
economies. World Resources Institute, Washington.
McEvoy D., J. Ravetz and J. Handley (2001). 4 sight: Resource flow audit for sustainability. A
framework strategy for the North West, Centre for Urban and Regional Ecology,
University of Manchester.

23
Moll, S., Bringezu, S., Schütz, H. 2003. Resource Use in European Countries. An estimate of
materials and waste streams in the Community, including imports and exports
using the instrument of material flow analysis. European Environment Agency,
Kopenhagen.
Obernosterer, R., Brunner, P., Daxbeck, H., Gagan, T., Glenck, E., Hendriks, C., Morf, L.,
Paumann, R., and Reiner, I. (1998). Materials accounting as a tool for decision
making in environmental policy. Urban metabolism of Vienna, Technical
University of Vienna, Vienna.
OECD. 1994. Environmental Indicators, Core Set. OECD, Paris.
OECD. 2000. Special Session on Material Flow Accounting. History and Overview. OECD,
Paris.
Rees, W. and M. Wackernagel (1996). Urban Ecological Footprints: Why Cities cannot be
Sustainable – and why they are a Key to Sustainability. In: Environmental Impact
Assessment Review 16, 223-248.
Singh, S.J., C.M. Grünbühel, H. Schandl, and N. Schulz (2001). Social Metabolism and
Labour in a Local Context: Changing Environmental Relations on Trinket Island.
In: Population and Environment Vol. 23, No. 1, 71-104.
Statistisches Bundesamt (various years-a). Güterverkehr der Verkehrszweige. Wiesbaden,
Statistisches Bundesamt. Reihe 1 - Verkehr.
Statistisches Bundesamt (various years-b). Hochsee- und Küstenfischerei. Wiesbaden,
Statistisches Bundesamt. Reihe 4.5, Land- und Fortswirtschaft, Fischerei.
Statistisches Bundesamt (various years-c). Landwirtschaftliche Bodennutzung und
pflanzliche Erzeugung. Wiesbaden, Statistisches Bundesamt. Fachserie 3/Reihe 3,
Land- und Forstwirtschaft, Fischerei.
Statistisches Bundesamt (various years-d). luftverkehr. Wiesbaden, Statistisches
Bundesamt,. Fachserie 8 / Reihe 6 Luftverkehr.
Statistisches Bundesamt (various years-e). Statistisches Jahrbuch für die Bundesrepublik
Deutschland. Wiesbaden, Statistisches Bundesamt.
Statistisches Bundesamt (various years-f). Verkehr - Eisenbahnverkehr. Wiesbaden,
Statistisches Bundesamt. Fachserie 8 / Reihe 2.
Statistisches Bundesamt (various years-g). Verkehr im Überblick. Wiesbaden, Statistisches
Bundesamt.

24
Statistisches Landesamt der Freien und Hansestadt Hamburg (various years-a).
Binnenschiffahrt des Hamburger Hafens. Hamburg, Statistisches Landesamt der
Freien und Hansestadt Hamburg. Statistischer Bericht H II 1-j/02.
Statistisches Landesamt der Freien und Hansestadt Hamburg (various years-b). Seeverkehr
des Hafens Hamburg. Hamburg, Statistisches Landesamt der Freien und Hansestadt
Hamburg. Statistischer Bericht H II 2 - j/02.
United Nations. 1993. Handbook of National Accounting: Integrated Environmental and
Economic Accounting. Studies in Methods. United Nations, New York.
United Nations. 2001. System of Environmental and Economic Accounting. SEEA 2000
Revision. United Nations, New York.
Wolman, A. (1965). The Metabolism of Cities. In: Scientific American, Vol. 213, no. 3, 178-
193.

25
Data summary
CODE MATERIALS 1992 1993 1994 1995 1996 1997 1998 1999 2000 2001
I N P U T1 Water & Air 0 0 0 0 0 0 0 0 0 01.1 Water for homes and industry1.2 Air
2 Direct Material Input 97.632 97.931 99.430 102.706 102.285 106.130 105.712 116.450 105.191 117.8452.1 DOMESTIC EXTRACTION 68 71 56 168 167 110 119 129 169 1622.1.1 Biomass 68 71 56 168 167 110 119 129 169 162
Agriculture 0 0 0 105 111 55 59 70 113 102Forestry 21 24 14 21 15 14 18 17 12 13Grazing 47 47 42 42 41 41 41 42 44 48Fish 0 0 0 0 0 0 0 0 0 0
2.1.2 Minerals 0 0 0 0 0 0 0 0 0 0Metal ores 0 0 0 0 0 0 0 0 0 0Industrial minerals 0 0 0 0 0 0 0 0 0 0Construction minerals 0 0 0 0 0 0 0 0 0 0
2.1.3 Fossils 0 0 0 0 0 0 0 0 0 0Coal 0 0 0 0 0 0 0 0 0 0Crude oil 0 0 0 0 0 0 0 0 0 0Natual gas 0 0 0 0 0 0 0 0 0 0
2.2 IMPORTS 97.565 97.860 99.374 102.538 102.118 106.020 105.593 116.321 105.022 117.682Biomass and biomass products 17.982 17.487 18.313 19.453 19.014 18.208 19.354 21.369 19.725 20.512Ores and industrial minerals 33.494 33.503 33.297 33.774 31.392 32.028 31.294 34.490 29.480 32.775Fossils and fossil products 17.454 16.658 15.464 15.604 16.492 18.056 17.586 17.287 13.273 17.298Chemical products 9.823 9.671 10.144 9.627 9.225 9.672 9.869 10.074 9.406 9.877Other industry products 15.503 16.990 18.389 19.915 21.924 23.785 23.183 28.488 27.489 29.870Other imports 3.308 3.551 3.769 4.165 4.071 4.272 4.306 4.614 5.649 7.352
3. Indirect and Unused Flows 0 0 0 0 0 0 0 0 0 03.1 Indirect Flows of Imports 0 0 0 0 0 0 0 0 0 03.2 Unused Domestic Extraction 0 0 0 0 0 0 0 0 0 0
O U T P U T4. EXPORTS 79.200 78.562 80.659 81.186 78.585 78.821 81.628 86.362 81.534 85.250
Biomass and biomass products 7.125 6.584 7.431 8.618 7.507 7.051 8.199 10.439 11.913 10.807Ores and industrial minerals 23.307 22.683 22.329 22.342 21.001 21.697 20.895 20.846 18.315 19.396Fossils and fossil products 8.238 8.326 9.038 9.126 9.150 8.898 11.090 11.368 10.898 11.672Chemical products 23.081 22.134 22.088 21.209 20.463 19.011 19.578 21.712 16.012 16.470Other industry products 10.139 10.804 11.290 11.917 12.036 12.475 12.405 12.034 13.166 14.715Other exports 7.311 8.031 8.483 7.975 8.428 9.688 9.460 9.964 11.231 12.190
5. Indirect Flows of Exports 0 0 0 0 0 0 0 0 0 0
PHYSICAL TRADE BALANCE 18.365 19.298 18.715 21.353 23.533 27.200 23.965 29.960 23.488 32.432Biomass and biomass products 10.857 10.902 10.882 10.835 11.507 11.157 11.155 10.931 7.812 9.705Ores and industrial minerals 10.187 10.820 10.967 11.432 10.391 10.331 10.399 13.644 11.166 13.378Fossils and fossil products 9.217 8.332 6.426 6.478 7.342 9.158 6.496 5.919 2.375 5.626Chemical products -13.258 -12.463 -11.945 -11.581 -11.239 -9.339 -9.709 -11.638 -6.607 -6.593Other industry products 5.365 6.185 7.098 7.999 9.888 11.310 10.778 16.454 14.324 15.156Other exports -4.003 -4.479 -4.714 -3.810 -4.357 -5.416 -5.154 -5.350 -5.582 -4.838
I N D I C A T O R SDMI Direct Material Input 97.632 97.931 99.430 102.706 102.285 106.130 105.712 116.450 105.191 117.845DMC Domestic Material Consumption 18.432 19.369 18.771 21.520 23.700 27.309 24.084 30.089 23.657 32.595
C O M P A R I S O N I N D I C A T O R SPopulation (Thousands) 1688,785 1702,887 1705,872 1707,901 1707,986 1704,731 1700,089 1704,735 1715,392 1726,363DMI per capita Hamburg 57,8 57,5 58,3 60,1 59,9 62,3 62,2 68,3 61,3 68,3DMC per capita Hamburg 10,9 11,4 11,0 12,6 13,9 16,0 14,2 17,6 13,8 18,9Gross National Product (million euro 1995) 62219 62214 62734 63456 64156 65392 66861 68076 70098 70994DMI per GDP Hamburg 1,57 1,57 1,58 1,62 1,59 1,62 1,58 1,71 1,50 1,66DMC per GDP Hamburg 0,30 0,31 0,30 0,34 0,37 0,42 0,36 0,44 0,34 0,46
Germany (from Moll et al 2003)DMI 1.734.442 1.730.359 1.838.614 1.798.803 1.780.408 1.767.794 1.756.092 1.770.845 1.737.384DMC 1.530.214 1.528.788 1.615.440 1.574.108 1.542.150 1.518.481 1.496.180 1.505.403 1.463.860DMI per capita Germany 21,5 21,3 22,6 22,0 21,7 21,5 21,4 21,6 21,1DMC per capita Germany 19,0 18,8 19,8 19,3 18,8 18,5 18,2 18,3 17,8GDP (million euro 1995) 1825720 1805887,7 1848266,2 1880206,6 1894611,1 1921019,4 1958596,4 1998678,5 2055774,7DMI/GDP Germany 0,95 0,96 0,99 0,96 0,94 0,92 0,90 0,89 0,85DMC/GDP Germany 0,84 0,85 0,87 0,84 0,81 0,79 0,76 0,75 0,71
Remarks on data summary: At the moment of the publication of this paper domestic extraction of
agriculture for the years 1992-1994 has not yet been included. Domestic extraction of agriculture for the other
years shows remarkable irregularities due to different estimation methods. No corrections have been made until
the time of publication. However, it has to be mentioned that domestic extraction of agriculture accounts only for
about 1 per mille of total DMI and therefore this mistake seems negligible for general conclusions and a
comparison with German MFA indicators. Data for extraction of minerals underlies secrecy.