material and methods - mediatum.ub.tum.de
TRANSCRIPT


wileyonlinelibrary.com/ETC © 2021 The Authors
Environmental Toxicology and Chemistry—Volume 40, Number 5—pp. 1463–1476, 2021Received: 30 April 2020 | Revised: 7 August 2020 | Accepted: 18 January 2021 1463
Hazard/Risk Assessment
Moving Toward Standardized Toxicity Testing Procedureswith Particulates by Dietary Exposure of Gammarids
Astrid Götz, Hannes K. Imhof, Juergen Geist, and Sebastian Beggel*
Aquatic Systems Biology Unit, TUM School of Life Sciences, Technical University of Munich, Freising Weihenstephan, Germany
Abstract: Ecotoxicological effect assessment of particulate materials and sparingly soluble substances is an emerging field.Current standard toxicity tests of aquatic organisms are based on soluble substances which are added to the aqueous phase.Although soluble substances distribute homogeneously, particles can form aggregates, resulting in inhomogeneous dis-tribution and unpredictable exposure. Therefore, test scenarios need to be adapted to overcome these uncertainties. Wepresent a dietary particle exposure tool for the toxicity testing of sparingly soluble substances or particles in combinationwith a standardizable food source for gammarids based on decomposition and consumption tablets (DECOTABs). Four foodsupplements in the DEOCOTAB formulation were compared to test their influence on the energy reserves of gammarids.Although feeding rate was constant for most supplements, mortality and energy reserves revealed clear differences. Tabssupplemented with algae‐based phyll or animal protein–based trout food best met all of the requirements. Fluorescentplastic microparticles (10–65 µm) were homogenously distributed and stable in the DECOTABs. Constant feeding wasobserved, and the number of ingested microparticles by Gammarus roeseli was quantified in relation to the consumed food.The developed method provides a realistic and methodologically reliable uptake from the oral pathway and allows thequantification of inner exposition via feeding rate, providing a promising tool for standardized dietary exposure scenarioswith particles. Environ Toxicol Chem 2021;40:1463–1476. © 2021 The Authors. Environmental Toxicology and Chemistrypublished by Wiley Periodicals LLC on behalf of SETAC.
Keywords: Ingestion; Particle; Toxicity testing; Oral pathway; Feeding rate; Dietary exposure
INTRODUCTIONIn the context of environmental risk assessment, it is nec-
essary to conduct standardized ecotoxicological bioassays thatcan be linked to realistic exposure scenarios (Connonet al. 2012). Such investigations are well established for manyorganisms from aquatic environments and are available asOrganisation for Economic Co‐operation and Developmentguidelines, mainly for cladocera, algae, and fish. However, thepresent guidelines target the exposure with soluble sub-stances, limiting their applicability for toxicity testing of par-ticles or sparingly soluble substances. In contrast to solublesubstances, particles or sparingly soluble substances have
other chemical properties, resulting in entirely different dis-tribution in the test medium and therefore affecting uptakeroutes (Rufli et al. 1998; Hartmann et al. 2015; European Centrefor Ecotoxicology and Toxicology of Chemicals 2018; Eitzenet al. 2019). In addition, reliable methods for prediction of re-sulting particle distributions and exposure are lacking (Rist andHartmann 2018; Eitzen et al. 2019). This lowers the generalcomparability of the aquatic ecotoxicological studies on par-ticle effects (Hartmann et al. 2015) and stresses the need forecotoxicological bioassays that account for particle‐specificproperties. With respect to sparingly soluble substances, it ismore likely that exposure via the food is the main uptake routecompared to the surrounding water column (Cole et al. 2011;Bundschuh et al. 2019; Toussaint et al. 2019), which is therebyoften neglected.
Therefore, a testing procedure which allows a standardizedand systematic testing of particulates or chemicals via the oralpathway is needed (Bundschuh et al. 2019). Such a dietaryexposure system would need to fulfill specific prerequisites toensure a standardized and quantifiable uptake of the sub-stances during the feeding process. This includes comparability
This article includes online‐only Supplemental Data.This is an open access article under the terms of the Creative CommonsAttribution‐NonCommercial License, which permits use, distribution andreproduction in any medium, provided the original work is properly cited and isnot used for commercial purposes.
Published online 20 January 2021 in Wiley Online Library(wileyonlinelibrary.com).DOI: 10.1002/etc.4990
* Address correspondence to [email protected]

in production, homogeneity of the substrate, stability, andminimal weight variation during the test. Further prerequisitesare a homogenous distribution of the sparingly soluble sub-stances in the food without aggregate formation, adjustabledosimetry, and minimal leaching of embedded sparinglysoluble substances. Also, constant feeding by the test organ-isms is necessary to allow quantification of embedded andingested particulates.
Decomposition and consumption tablets (DECOTABs;Kampfraath et al. 2012) can meet these prerequisites and havebeen successfully used as a food source in aquatic toxicity tests(Straub et al. 2017; Raths et al. 2020). It was recommended bythe authors, and applied by several studies, that DECOTABscan be amended by adding food supplements for specificapplications or loading them with chemicals during production(Kampfraath et al. 2012). Some exposure studies have alreadyused loaded tabs (Zhai et al. 2018) or similar matrices (Imhofet al. 2013; Hämer et al. 2014; Imhof and Laforsch 2016; Fenoyet al. 2020; Yardy and Callaghan 2020). Therefore, DECOTABsare a promising tool for a standardized toxicity testing proce-dure with organisms from different functional feeding groupssuch as shredders and grazers.
Decomposition and consumption tablets already meetsome of the stated prerequisites such as minimal weightvariation and quantifiable uptake, which helps to ensurea high comparability between different experimental runs(Kampfraath et al. 2012). Nevertheless, a deeper examinationconcerning the needs of the targeted organism regarding nu-tritional value and survival by adding food supplements is stillrequired. Subsequent upcoming prerequisites are stability ofthe supplemented DECOTABs, the distribution of the particlesin the DECOTABs, and the leaching of particles to thesurrounding medium.
In the present study, we focus on a river organism becausemany sensitive organisms of lotic environments are under-represented in established guidelines (Feiner et al. 2016).Suitable organisms for ecotoxicity testing of riverine ecosys-tems are Gammarus spp., which are already often examinedand known to be sensitive to many pollutants (Gerhardtet al. 2011; Brock and van Wijngaarden 2012). The character-istics of Gammarus spp., like a wide trophic repertoire, foragingplasticity, and migration ability, make this keystone species inthe food web a representative benthic river organism (Gerhardtet al. 2011; Boeker and Geist 2015). In addition, a basicguideline for ecological testing with gammarids is provided bythe US Environmental Protection Agency (2016).
With the objective of moving toward a standardized pro-tocol for toxicity testing with gammarids, we first evaluated thesuitability of DECOTAB formulations with different food sup-plements as a food source for Gammarus roeseli. This wastested based on food source properties, gammarid response infeeding behavior, and energy content. In a second step, toadapt the protocol for testing with particulates, we evaluatedthe applicability of the test system as a dietary exposure tool ofparticles or with regard to aggregates and homogeneous dis-tribution sparingly soluble substances by testing the practic-ability of loading the adjusted food source with microparticles
and the constant and quantifiable supply of particles over theoral exposure pathway.
MATERIAL AND METHODSEvaluation of DECOTABs with food supplements
To examine a nutritionally valuable and standardizable foodsource for toxicity testing with gammarids, G. roeseli were fedover the course of 21 d with different formulations based on theDECOTAB as originally described by Kampfraath et al. (2012).This formulation, filled with cellulose and 4 DECOTAB for-mulations modified with specific food supplements, was testedfor variability in weight, based on size and initial dry weight,and stability over time. Stability in water was measured during awatering experiment for 3 and 4 d. Next to mortality and thefeeding behavior of the gammarids, their energy reserves weremonitored by the measurement of lipids, glycogen, andglucose.
The DECOTABsFormulation and preparation. The DECOTABs (Kampfraathet al. 2012) were produced with 80mL distilled water and 1.6 gagar (Sigma‐Aldrich). This mixture was heated for approx-imately 1.5min until it foamed and homogenized with anagitator. Then 4.8 g cellulose (Sigma‐Aldrich) was addedand homogenized for 1min. The mixture was poured into50 cylindrical molds of 1 cm diameter and 0.5 cm height(custom‐built stainless steel device; Chair of Process SystemsEngineering, Technical University of Munich). The supernatantwas scraped using an even scraper. After 15min in the re-frigerator at 6 °C, the DECOTABs were removed from themolds and dried in a drying cabinet (U 40; Memmert) at 45 °Cfor 24 h. After this, the DECOTABs were placed into a desic-cator for 30min, and initial dry weight (dwI) was measuredwith a Sartorius R200D Analytical Balance (Sartorius;0.01± 0.02mg). Before the transfer to the experiment, theDECOTABs were prewetted in the test medium for 48 h in theclimate chamber at 13± 0.5 °C.
For the modified DECOTABs, the same procedure wasused, but 70% of the cellulose weight was replaced with theparticular food supplement. This results in 1.44 g cellulose and3.36 g of the food supplement added to 80mL distilled water.The following 4 DECOTAB formulations with specific foodsupplements were tested in addition to the cellulose‐tab, solelycontaining cellulose and agar: phyll‐tabs (ground flakes of thealgae‐based fish food Phyll; Tetra), gammarus‐tabs (powdereddried gammarids; Dehner), trout food‐tabs (ground pellets ofthe commercial trout food Advance, 0.2–0.3mm; AlltechCoppens), and beech‐tabs (dried and powdered beech leaves;Figure 1).
Variability (size, volume, dry wt). To evaluate the effect ofdrying and prewetting on the DECOTABs and to evaluate dryweight stability, 150 cellulose‐tabs were weighed at differentsteps of handling using a fine scale (Sartorius; 0.01± 0.02mg).Initial wet weight (wwI) of freshly prepared but not dried
1464 Environmental Toxicology and Chemistry, 2021;40:1463–1476—A. Götz et al.
© 2021 The Authors wileyonlinelibrary.com/ETC

DECOTABs was measured for 3 production iterations (n= 50)to evaluate wet weight variation. In addition, the dwI and thefinal dry weight (dwF) after 48 h prewetting were measured toexamine the dry weight variation within and between the dryweight states. Further, the wet weight after prewetting of driedDECOTABs for 24 and 48 h was measured to verify whethertheir ability to absorb the water again.
Stability in water. Weight loss of the different DECOTABformulations in water without further impact was monitoredto evaluate the stability during bioassays. Therefore,14 DECOTABs of each food supplement were weighed toexamine dwI, transferred into tap water, and prewetted for 2 din the climate chamber (13± 0.5 °C) prior to the experiment. Tomimic the food replacement cycle of the bioassay with gam-marids, the experimental procedure was as follows. After pre-wetting, 7 DECOTABs of each food supplement were placedinto glass beakers (1 L) filled with 500mL tap water, 3 glassstones for hiding, but no gammarids and kept in a climatechamber with a 16:8‐h light:dark cycle and 13± 0.5 °C. After4 d, the DECOTABs were replaced for another 3 d by the re-maining 7 DECOTABs. After the experiment, the DECOTABswere dried again for 24 h, placed into a desiccator for 30min,and weighed with a Sartorius R200D Analytical Balance (0.01±0.02mg) to measure the dwF. The difference between dwI anddwF as a percentage per day gives the stability for each DE-COTAB formulation and allows comparisons between thetreatments. In addition, the dry weight difference in milligramsper day was used as an adjustment factor for the feeding rate ofthe gammarids.
The bioassay. Gammarus roeseli were caught from the RiverMoosach at the Aquatic Systems Biology Unit in Freising,
Germany, with plant‐filled traps and trout food as bait inNovember 2019. Subsequently, gammarids were size‐selected(9.9± 1.5mm, n= 534) by sieve passage (Beggel et al. 2016),and their body size was determined as described below (seeGammarid length and dry wt).
To assess their natural energy reserve state, 100G. roeseliwere directly transferred to liquid nitrogen and stored at−20 °C until further analysis.
For acclimatization to the test conditions, 500 gammaridswere evenly allocated to the 5 treatments and transferred toaerated 5‐L glass beakers with 5 L of tap water and glassstones. Acclimatization occurred in a climate chamber for 1 wkwith a 16:8‐h light:dark cycle and 13± 0.5 °C. The 100 gam-marids per treatment were fed ad libitum with 10 DECOTABsof the formulation corresponding to the treatment. For deter-mination of energy reserves after the acclimatization period(acclimatization state), 20 randomly chosen gammarids fromeach treatment were transferred to liquid nitrogen and storedat −20 °C until further analysis.
After the acclimatization period, 3 randomly chosen gam-marids were placed into each of the 21 glass beakers (1 L) pertreatment filled with 500mL tap water, 3 glass stones forhiding, and one dried and preweighed DECOTAB. The ex-periment took place under the same conditions as the accli-matization period, except aeration. Instead, water change wasconducted once per week and oxygen content, conductivity,temperature, and pH were monitored. All parameters wereconstant throughout the experiment, and oxygen concen-tration was always >7.8mg/L. Gammarids were fed with oneDECOTAB of the corresponding formulation per experimentalbeaker in an alternating exchange interval of 4 and 3 d. Be-cause the remains of approximately 67± 7% of the DECOTABswere found in the glasses after 3 or 4 d, ad libitum feeding can
FIGURE 1: Prepared decomposition and consumption tablets before first drying. (A) Cellulose‐tabs, (B) beech‐tabs, (C) phyll‐tabs,(D) gammarus‐tabs, and (E) trout food‐tabs.
Dietary exposure tool for toxicity testing with G. roeseli—Environmental Toxicology and Chemistry, 2021;40:1463–1476 1465
wileyonlinelibrary.com/ETC © 2021 The Authors

be anticipated. Mortality was controlled daily, and dead gam-marids were removed from the beaker and stored at –20 °Cuntil further examination.
After 1, 2, and 3 wk, 7 replicates were removed from theexperiment; and the corresponding individuals were trans-ferred to liquid nitrogen and stored at –20 °C until measure-ment of the energy reserves. In addition, 42 gammarids werestarved for 16 d, then transferred to liquid nitrogen, and storedat –20 °C until further examination of the energy reserves fromstarvation state.
Feeding rate. To determine the feeding rate, DECOTABswere dried for 24 h to measure dwI, then they were wateredagain for 48 h prior to the transfer to the experimental beakers.The DECOTABs were replaced by new ones in an alternatingcycle of 4 and 3 d. The used DECOTABs were again dried for24 h to determine dwF. The feeding rate (FR) per day andgammarid (gd) was calculated with dwI and dwF of the specificDECOTAB, adjusted by the number of feeding days and themeanmilligrams of weight loss per day (MWL) calculated from thestability measurement:
×=
−
( )
( ) − ( )⎡⎣⎢
⎤⎦⎥
⎡⎣⎢ ⎤⎦⎥FR
mggd day
MWL
n living gammarids
dw mg dw mgfeeding days
mgday
I F
(1)
Gammarid length and dry weight. Prior to further proc-essing of the gammarids, samples were defrosted, and pictureswere taken with a stereomicroscope (M3Z; Wild Heerbrugg;equipped with an SC180 camera; Olympus). The size of thegammarids was determined by measuring the length from thebase of the first antenna to the end of the uropod by a polylinealong the gut using an image analysis system (CellSens Entry,Ver 1.18; Olympus) according to Burgherr and Meyer (1997).After the measurements, gammarids were dried at 45 °C for24 h, placed into a desiccator for 30min, and weighed with aSartorius R200D Analytical Balance (0.01± 0.02mg) to examinegammarid dry weight.
Energy reserve determination. The energy storage assayfollowed the original protocol by van Handel (1985) and themodifications by Charron et al. (2014), with some further ad-justments. The assay for lipids and the carbohydrates glycogenand glucose is described in brief; a schematic view is availablein the Supplemental Data. Dried gammarids were frozen withliquid nitrogen in a 1.5‐mL centrifuge tube and ground to a finepowder with a stainless‐steel pistil. Powdered gammarids weresuspended in 900 µL methanol. Aliquots were transferred intonew 1.5‐mL tubes for the lipid assay and the glucose/glycogenassay. Energy reserves were calculated according to de Coenand Janssen (1997) using the energy per milligram of storagesubstance with 39 500mJ/mg lipids and 17 500mJ/mg glucoseor glycogen.
Lipid assay. Chloroform was added to the lipid aliquot(2:1 ratio) to extract the lipids from the powder. After mixingthoroughly, the suspension was cooled for 20min at 4 °C, and
600 µL were transferred to glass test tubes. The suspension washeated for 5min at 95 °C until the solvent evaporated. Afteradding 200 µL sulfuric acid (95% v/v), the suspension washeated again at 95 °C for 10min and cooled in an ice bath. Byadding 5mL vanillin‐phosphoric acid a color change from col-orless to pink was achieved. Photometric measurement wasperformed using a UVIKON 930 photometer at 525 nm againstthe reagent as blank. The amount of absorption shows theamount of lipids on the basis of a calibration curve. Lipids werecalculated in micrograms per milligram dry weight.
Glucose and glycogen assay. Sodium sulfate (2%, 200 µL)was added to the glucose/glycogen aliquot to precipitate theglycogen. After mixing thoroughly, the suspension was cooledfor 20min at 4 °C and centrifuged for 4min at 11 000 g(Centrifuge 5430R; Eppendorf). The supernatant with the glu-cose was transferred into a new 1.5‐mL tube. The remainingglycogen pellet was resuspended with 400 µL distilled water.Then, 400 µL from each suspension were separately transferredto glass test tubes. After the addition of 5mL anthron reagent,the suspensions were heated at 95 °C for 17min. A colorchange from yellow to green allowed a photometric measure-ment. Photometric measurement was performed using aUVIKON 930 at 625 nm against the reagent as blank. Theamount of absorption shows the amount of glucose and gly-cogen on the basis of a calibration curve. Glycogen and glu-cose were calculated in micrograms per milligram dry weight.
DECOTABs as an oral exposure tool for particlesDecomposition and consumption tablets were examined as
a dietary exposure tool for particle testing. Therefore, a sus-pension of red fluorescent polystyrol microparticles (10–65 µm)was prepared and added to the DECOTABs during prepara-tion. These particles were tracked in sections of the DECOTABsby fluorescence microscopy, and the concentration per milli-gram and volume was calculated. Afterward, gammarids wereexposed to blue fluorescent microparticle‐filled phyll‐tabs, andthe inner particle concentration was monitored by gut dis-section and subsequent fluorescence microscopy. Sphericalfluorescent polystyrol nanoparticles of 1000 nm were likewiseembedded in phyll‐tabs and imaged to get first impressions ofnanoparticle distribution.
Particle distribution in the DECOTABs. To receive redfluorescent polystyrene microplastic particles with a fraction of10 to 65 µm, 200mg of fluorescent microparticles generated bycentrifugal milling (0–125 µm, Ultra Centrifugal Mill TypeZM 200; Retsch) were suspended in 54mL ethanol (96%,undenatured) and centrifuged according to Correia andLoeschner (2018) for 44 s at 8.5 g to separate particles at 65 µm.The supernatant was transferred into new centrifuge tubes andcentrifuged again for 1min at 95 g (Labofuge 400; HeraeusInstruments). Supernatant with the 10‐ to 65‐µm particles wasremoved by pipetting, and the pellet was resuspended in 8mLethanol to a concentration of approximately 31 particles/µL.
1466 Environmental Toxicology and Chemistry, 2021;40:1463–1476—A. Götz et al.
© 2021 The Authors wileyonlinelibrary.com/ETC

The size distribution (Supplemental Data, Figure 1SI) was veri-fied using a Mastersizer S longbed (Malvern).
Stock suspension (3200, 1600, or 160 µL) was added duringthe DECOTAB production after the homogenization of theformulation for 1min (for detailed production, see above, TheDECOTABs). The suspension was again homogenized for ap-proximately 30 s and poured into the molds. Further DECOTABhandling was as described.
One to 3 horizontal sections with 50 µm thickness from2 dried DECOTABs for the lowest and middle and 3 from thehighest concentration were generated with a microtome cryo-stat HM 505 E (Microm) and from one DECOTAB perconcentration in the vertical direction. Sections were mountedon microscopic slides with the use of VECTASHIELD AntifadeMounting Medium (Vector Labs) and imaged under a LeicaDMi8 with a CoolLED Pe4000 light source (Leica Microsystems)with green fluorescent protein excitation for green phyll‐tabfluorescence and rhodamine (Rhod) excitation for red particlefluorescence. Images were exported, and extended depth‐of‐field was calculated from the approximately 20 Z‐planes toproject all particles into one single layer using FiJi (Schindelinet al. 2012) and the method of Forster et al. (2004). Fluo-rescence channels were merged and stitched using the methodof Preibisch et al. (2009). The number of fluorescent micro-plastic particles was counted to particles per cubic millimeterand particles per milligram dry weight, and their distributionwithin the sections was analyzed.
For an exemplary examination of the distribution of poly-styrene beads in the DECOTABs, 250 µL of a 5 wt% polystyrol1000 nm (nominal mean, mean diameter 1294 nm) fluorescentbeads solution (BS‐Partikel) was added during phyll‐tab pro-duction. One horizontal section with resulting 10 µm thicknesswas cut with the microtome (adjusted to 2 µm slice thickness)and imaged with the Leica Thunder imaging system (DM6B‐Zmicroscope, DFC9000GT camera, and LAS X software, Ver3.0.2.7506) with large‐volume computational clearing.
Particle leaching from the DECOTABs. Six particle‐loadedphyll‐tabs with polystyrene microparticles with a fraction of10 to 65 µm, were dried, transferred into tap water, and pre-wetted for 2 d in the climate chamber (13± 0.5 °C) prior to theexperiment. After prewetting, the loaded phyll‐tabs wereplaced into glass beakers (1 L) filled with 500mL tap water,3 glass stones for hiding, but no gammarids and kept in aclimate chamber with a 16:8‐h light:dark cycle and 13± 0.5 °C.After 4 d, the DECOTABs were removed and the water wasfiltered through a 0.8‐µm filter (47 Ø; Merck Millipore). Beakersand filter stations were flushed twice with distilled water toremove particles attached to the glass. The whole surface ofeach filter was examined with a fluorescence microscope(Laborlux S; Leitz; equipped with a DP74 camera with CellSensStandard, Ver 1.18) to count the leached particles.
Uptake of the particles via DECOTABs. Phyll‐tabs wereloaded with blue fluorescent polystyrene microparticles of10 to 60 µm with 1% particle weight of tab weight, resulting inapproximately 40 000 particles per tab. Estimation is based on
particle concentration and the amount of stock suspensionused. Loaded phyll‐tabs were used in an exposure experimentwith G. roeseli to characterize the particle uptake and compareit with the feeding rate. Therefore, gammarids were exposed to1) particle‐free phyll‐tabs as a negative control, and 2) particle‐loaded phyll‐tabs as a positive control. This experiment wasconducted under the same conditions as described in above(see The Bioassay), only the starvation during the acclimatiza-tion was conducted as recommended by the US EnvironmentalProtection Agency (2016).
After 1 wk of acclimatization, 3 randomly chosen individualswere placed in each beaker with 500mL tap water and 3 glassstones for hiding. Dried and preweighed DECOTABs werechanged every day to measure the feeding precisely. Also,gammarids were transferred to new beakers in daily rhythm tominimize the uptake of leached particles from the surroundingmedium. Every day for 2 wk, 5 replicates were taken from thenegative and the positive controls, and the gammarids wereanesthetized with carbon dioxide and fixed in 7.5% form-aldehyde with 7.5 g/100mL glucose. Used particle‐loadedphyll‐tabs were dried and weighed again. Feeding rate wascalculated as described above (see The Bioassay) and com-pared between the negative and positive controls. Guts wereremoved from fixed gammarids, mounted on microscopicslides with VECTASHIELD Antifade Mounting Medium, andimaged with a stereomicroscope (M3Z; Wild Heerbrugg;equipped with an SC180 camera; Olympus) to measure the gutlength with CellSens Entry (Ver 1.18). The ingested particleswere counted under fluorescence excitation at 340 to 380 nm(Laborlux S; Leitz; equipped with a DP74 camera with CellSensStandard, Ver 1.18). Further, feeding rate and particles percentimeter of gut were set in relation to validate whetherthe inner particle concentration can be calculated by themeasurement of the mean mass eaten alone.
Statistical analysisStatistical analyses were conducted with Rstudio (RStudio
2015). Normal distribution was tested with the Shapiro‐Wilktest, followed by the robust Fligner test for homogeneity ofvariance. Gammarid dry weight per millimeter body length wasnormally distributed and homogeneous in variance; therefore,further analysis was conducted with analysis of variance. Allother endpoints including feeding, lipids, glucose content,glycogen content, and energy reserves as well as ingestedparticles were tested with the Kruskal‐Wallis test, followed by apost hoc pairwise Wilcoxon test with the Benjamini‐Hochbergcorrection (Benjamini et al. 1998). Differences in risk for mor-tality were tested by survival analysis with the Kaplan‐Meiermodel and log‐rank test using Jamovi (Jamovi Project2019) based on the R language. Particle distribution in theDECOTABs was examined based on the XY coordinates withPAST, Ver 4.01 (Hammer et al. 2001) and point pattern analysiswith nearest neighbor classification and wrap‐around edgecorrection. Clustered points give ratio R< 1, Poisson patternsgive R of approximately 1, whereas overdispersed points giveR> 1. Correlation of particles per centimeter of gut and
Dietary exposure tool for toxicity testing with G. roeseli—Environmental Toxicology and Chemistry, 2021;40:1463–1476 1467
wileyonlinelibrary.com/ETC © 2021 The Authors

feeding rate was conducted with Rstudio with the Kendallmethod. A correlation coefficient of r= 0 implies no correlation,whereas r= 1 or −1 shows a strong positive or negativecorrelation, respectively. The p values for summarized com-parisons are given as a minimum p value for nonsignificantcomparisons and a maximum p value for significantcomparisons.
RESULTSThe DECOTABsVariability (size, volume, weight). The size of the freshlyprepared DECOTABs was 10mm in diameter and 5mm inheight before drying. When dried, they shrank to 4.0 to 4.5mmin diameter and 2.0 to 2.5 mm in height but nearly retainedtheir shape. The production iteration of cellulose‐tabs revealedvariable wwI (8.5% relative standard deviation) within the iter-ations (p= 0.004), but the dwI remained stable (p= 1.000) andwas on average 10.5± 0.5% of the wwI.
A comparison of the dry weight of the cellulose‐tabs withthe other formulations revealed that the cellulose‐tabs variedmore in dry weight than the modified tabs (p< 0.001;Supplemental Data, Table 1SI). Trout food‐tabs were lightest,and variation of the dry weight was lowest. The dry weight ofphyll‐, gammarus‐, and beech‐tabs was nearly the same as forthe cellulose‐tabs (p= 0.061); but the dry weight variation ofphyll‐tabs was 50% smaller than the variation of the cellulose‐tabs. Beech‐ and gammarus‐tabs had medium dry weights andvariations 75% lower than the cellulose‐tabs.
If watered again, the DECOTABs readsorbed water andreached a maximum wet weight of 60% compared to the wwI
independent of the watering duration (p= 0.461). When drieda second time after watering, the dwF of the DECOTABs wasstill 10.1% of the wwI and thus, the dry weight before and afterwatering was the same (p= 0.747).
Stability in water. All DECOTABs were relatively stable inwater, with a daily weight loss between 2.0± 2.2 and 8.1±1.8% (Supplemental Data, Table 1SI). Cellulose‐ and beech‐tabs revealed the lowest weight loss per day (p< 0.001). Theleast stable DECOTABs were those with gammarus as a sup-plement (p= 0.003). Phyll‐ and trout food‐tabs lost weight tothe same extent of approximately 6.3% (p= 0.324) and are thusin the middle between the other DECOTABs. Remarkably, thetrout food‐tabs had the lowest variation in weight loss per day.
The BioassayMortality. Feeding the gammarids with cellulose‐tabs re-sulted in the lowest risk for mortality over the course of 3 wk,with 11.5% after 21 d (Supplemental Data, Figure 2SI). The riskfor mortality was also very low for gammarids fed with phyll‐tabs (23.3%, p= 0.061). Feeding gammarids with trout food‐tabs resulted in nearly the same low risk for mortality as thosefed with phyll‐tabs (26.4%, p= 0.684). Although the survival forgammarids fed with beech‐tabs was similar to phyll‐ and troutfood‐tab‐fed gammarids in the first 2 wk, the risk for mortality
increased to 61.6% after the experimental duration of 21 d.Feeding gammarids with gammarus‐tabs resulted in highmortality of approximately 40% already within the first 2 wk. Atthe end of the experiment a similar high risk for mortalitycompared with beech‐tab‐fed gammarids of 53.4% was seen(p= 0.334).
Feeding rate. All gammarids accepted the offered DE-COTAB formulations as a food source, though no tab was fullyconsumed after feeding periods of 3 or 4 d. Constant feedingrates were observed in the 3 treatments with beech‐tabs(p= 1.000, 0.31± 0.29mg/d), trout food‐tabs (p= 0.140,0.34± 0.41mg/d), and phyll‐tabs (p= 0.059, 0.40± 0.49mg/d).This resulted in an equal amount of food eaten after 21 d(p= 0.410) of 12.60± 5.59mg in sum for trout food‐tab‐fed,12.60± 2.32mg in sum for phyll‐tab‐fed, and 10.00± 4.43mgin sum for beech‐tab‐fed gammarids.
Although, the highest DECOTAB mass was consumed fromthe gammarus‐tabs with 27.10± 11.10mg (p< 0.001), thefeeding rate was very variable and decreased or increased overtime (p< 0.001), with minimum feeding of 0.352± 0.240mg/din week 1 to a maximum feeding of 1.99± 1.11mg/d in week2 (Supplemental Data, Figure 3SI). Likewise, the feeding rateon the cellulose‐tabs increased from the beginning (0.44±0.29mg/d) until the end (2.39± 0.69mg/d, p< 0.001) of theexperiment. After 21 d, gammarids were in sum consuming thesecond highest amount of the cellulose‐tabs (p= 0.052,25.30± 7.66mg).
Additional weight loss occurred for the cellulose‐tabsbecause they lose material if touched under water, for ex-ample, by the gammarids while swimming or feeding. Also,gammarids were observed pulling bigger pieces of thegrounded beech leaves out of the beech‐tabs but not ingestingthem afterward. This weight loss was not calculable and is stillincluded in the results; thus, it rather mirrors a shredding ratethan a consumption rate.
Gammarid dry weight. The dry weight per millimeter ofgammarid length decreased for the beech‐tab‐fed gammaridswithin 21 d (p= 0.045) and resulted in the lowest dry weight permillimeter at the end of the experiment (Table 1). Reduction indry weight per millimeter over time was also observed forcellulose‐tab‐fed gammarids (p= 0.044), but at the end of theexperiment they still had the same dry weight as the othertreatments. The gammarids fed with phyll‐ (p= 0.865),gammarus‐ (p= 0.577), or trout food‐tabs (p= 0.664) did notchange in milligrams of dry weight per millimeter within the3 wk (Table 1) and had comparable dry weight per millimeter atthe end of the experiment (p= 0.135). Overall, the dry weightper millimeter of all 5 treatments was between the dry weightper millimeter of the natural and the starved states (p= 0.126).Only the natural‐state gammarids had a higher weight than thestarved ones (p< 0.001).
Energy reserve determinationEnergy reserves. The energy reserves per milligram of dryweight were the same for all acclimatization treatments and the
1468 Environmental Toxicology and Chemistry, 2021;40:1463–1476—A. Götz et al.
© 2021 The Authors wileyonlinelibrary.com/ETC
natural‐state gammarids (p= 0.130). The starved gammaridshad approximately 35% less energy reserves than the natural‐state gammarids and the gammarids acclimatized with beech‐,trout food‐, phyll‐, or cellulose‐tabs (p= 0.007). In contrast,those fed with gammarus had with 3260± 1173mJ/mg dryweight the same energy reserves as both states (p= 0.108).Beside the differences in the natural and starvation states, theenergy reserves between the treatments were the same for theacclimatization state (p= 0.193; Supplemental Data, Figure 4SI)at approximately 3500± 235mJ/mgdry weight.
Comparing the treatments after 3 wk, only the phyll‐ and thetrout food‐tab‐fed gammarids still had 30% more energy re-serves per milligram of dry weight than the starved gammarids(p= 0.035). The treatments with gammarus‐ and cellulose‐tabsled to energy reserves in the gammarids between the natural(p= 0.560) and starvation (p= 0.067) states. It has to be notedthat beech‐tab‐fed gammarids lost 40% of their energy re-serves compared to the acclimatized gammarids (p= 0.002)and had the lowest energy reserves out of the 5 treatments(Table 1). This results in lower energy reserves than the naturalstate (p= 0.031) and is comparable to starved organisms(p= 0.551).
Glucose. All treatments, including the natural‐state gam-marids, had from 90 to 320% more glucose per milligram of dryweight than the starved ones (p= 0.001; Table 1). The gam-marids acclimatized with cellulose‐tabs or those with beechleaves, phyll, or trout food had at least 50% more glucose thanthose in the natural state (p= 0.011); but those acclimatized ongammarus‐tabs had the same glucose content as those in thenatural state (p= 0.806). The gammarids acclimatized on thecellulose‐tabs had the most glucose per milligram of dryweight, approximately 40% more compared to the other ac-climatization treatments (p= 0.065), except for the gammaridsacclimatized with beech‐tabs (p= 0.501), which had onlyslightly lower glucose content. Gammarus‐tab‐acclimatizedgammarids had 16.0± 10.7 µg glucose/mg dry weight andtherefore the lowest glucose content (Table 1).
After 3 wk, glucose content in gammarids was stable for3 out of 4 treatments (p= 0.113). The gammarids fed with troutfood‐ or gammarus‐tabs had 80% more glucose per milligramof dry weight than those in the natural state (p= 0.028) and235% more than those in the starvation state (p< 0.001). Inaddition, phyll‐tab‐fed gammarids had 21.0± 10.6 µg glucose/mg dry weight and, thus, 180% more glucose than those in thestarvation state (p< 0.001) and the same as those in the naturalstate (p= 0.087). Overall, gammarids from all 3 treatments hadsimilarly high glucose content (p= 0.463).
The glucose content of the beech‐tab‐fed gammarids wasreduced by up to 80% (p= 0.002) and, thus, was the same asthose in the starvation (p= 0.616) and lower than those in thenatural state (p= 0.033). Also, gammarids fed with cellulose‐tabs contained after 3 wk 40% less glucose than after accli-matization (p= 0.018) and consequently the same amount asthose in the natural state (p= 0.125) yet still more glucose thanthe starved gammarids (p< 0.001). Overall, beech‐tab‐fedgammarids contained 6.4± 3.0 µg glucose/mg dry weight andhad the lowest glucose content compared to the other treat-ments at the end of the experiment (p= 0.007).
Glycogen. In sum, natural‐state and starved gammarids hadthe same glycogen content (p= 0.969) of approximately9.2± 5.4 µg glycogen/mg dry weight, and 4 out of the 5 ac-climatization treatments had more than twice the amount ofglycogen than both states (p< 0.001). The glycogen content(13.5± 7.2 µg/mgdry wt) of gammarus‐tab‐fed gammarids waslowest but still the same as for those in the natural state(p= 0.066). Glycogen per milligram of dry weight was highestfor gammarids acclimatized with cellulose‐tabs (p< 0.001).
After 3 wk, the cellulose‐fed gammarids contained30.6± 12.7 µg glycogen/mg dry weight and had still thehighest glycogen content compared to the other treatments(p= 0.013), including the natural and starvation states(p= 0.003). As with the glucose content, the gammarids fedwith trout food‐, gammarus‐, or phyll‐tabs had all approx-imately 84± 14% more glycogen than those in the natural and
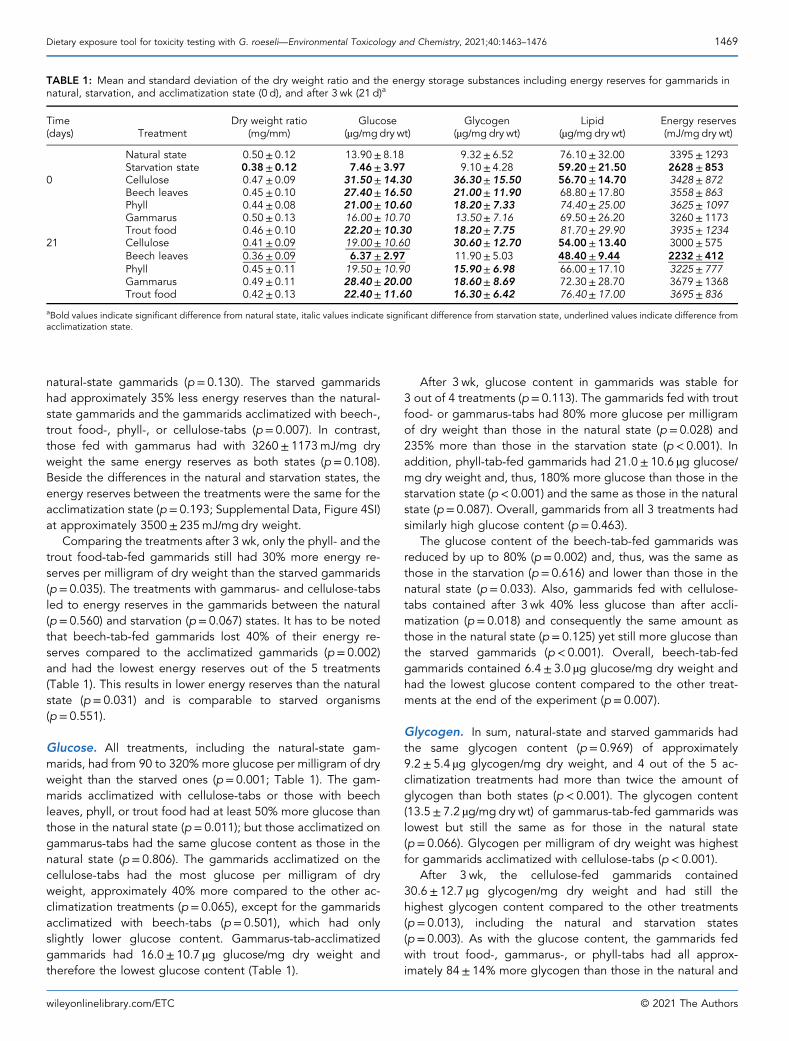
TABLE 1: Mean and standard deviation of the dry weight ratio and the energy storage substances including energy reserves for gammarids innatural, starvation, and acclimatization state (0 d), and after 3 wk (21 d)a
Time(days) Treatment
Dry weight ratio(mg/mm)
Glucose(µg/mgdry wt)
Glycogen(µg/mg dry wt)
Lipid(µg/mg dry wt)
Energy reserves(mJ/mg dry wt)
Natural state 0.50± 0.12 13.90± 8.18 9.32± 6.52 76.10± 32.00 3395± 1293Starvation state 0.38± 0.12 7.46± 3.97 9.10± 4.28 59.20± 21.50 2628± 853
0 Cellulose 0.47± 0.09 31.50± 14.30 36.30± 15.50 56.70± 14.70 3428± 872Beech leaves 0.45± 0.10 27.40± 16.50 21.00± 11.90 68.80± 17.80 3558± 863Phyll 0.44± 0.08 21.00± 10.60 18.20± 7.33 74.40± 25.00 3625± 1097Gammarus 0.50± 0.13 16.00± 10.70 13.50± 7.16 69.50± 26.20 3260± 1173Trout food 0.46± 0.10 22.20± 10.30 18.20± 7.75 81.70± 29.90 3935± 1234
21 Cellulose 0.41± 0.09 19.00± 10.60 30.60± 12.70 54.00± 13.40 3000± 575Beech leaves 0.36± 0.09 6.37± 2.97 11.90± 5.03 48.40± 9.44 2232± 412Phyll 0.45± 0.11 19.50± 10.90 15.90± 6.98 66.00± 17.10 3225± 777Gammarus 0.49± 0.11 28.40± 20.00 18.60± 8.69 72.30± 28.70 3679± 1368Trout food 0.42± 0.13 22.40± 11.60 16.30± 6.42 76.40± 17.00 3695± 836
aBold values indicate significant difference from natural state, italic values indicate significant difference from starvation state, underlined values indicate difference fromacclimatization state.
Dietary exposure tool for toxicity testing with G. roeseli—Environmental Toxicology and Chemistry, 2021;40:1463–1476 1469
wileyonlinelibrary.com/ETC © 2021 The Authors

starvation states (p= 0.003). In contrast, the beech‐tab‐fedgammarids were not different in their glycogen content fromnatural‐state and starved gammarids (p= 0.221), having thelowest glycogen content compared to the other treatments(Table 1). Overall, glycogen content was stable in all 5 treat-ments over the course of 3 wk (p= 0.074).
Lipids. Gammarids from the natural state and acclimatizationfed with trout food‐ or phyll‐tabs had approximately 30% morelipids per milligram of dry weight than those from the starvationstate (p= 0.042; Table 1). In contrast, the lipid content ofgammarids acclimatized with cellulose‐, gammarus‐, or beech‐tabs was the same as for those in the starvation state(p= 0.080). Beside these differences, the 5 treatments weremainly similar (p= 0.061), except trout food‐tab‐ and cellulose‐tab‐fed gammarids (p= 0.024). This is because trout food‐tab‐fed gammarids contained the most lipids (81.7± 29.9 µg/mgdry wt), and those fed with cellulose‐tabs contained the lowestamount (56.7± 14.7 µg/mgdry wt).
After 3 wk, the lipid content of the gammarids was stablewithin the 4 treatments (p= 0.487). Only the beech‐tab‐fedgammarids lost 30% lipids per milligram of dry weight overthe course of 3 wk (p= 0.026). The lipid content of gammaridsfed with beech‐ or cellulose‐tabs was approximately 51.2±11.4 µg/mg dry weight, which was the lowest and similar to thestarvation state (p= 0.444). The gammarus‐, trout food‐, orphyll‐tab‐fed gammarids had same amount of lipids per milli-gram of dry weight as those in the natural state, but only troutfood‐tab‐fed gammarids had a higher lipid content than thosein the starvation state (p= 0.024; Table 1). Nevertheless, thegammarids of these 3 treatments had together the highestamount of lipids per milligram of dry weight (p= 0.217) ofapproximately 66± 17.1 to 76± 17 µg lipids/mg dry weight.
DECOTABs as oral exposure tool for particlesPhyll‐tabs were loaded with red fluorescent polystyrene
microparticles of a size range from 10 to 65 µm. Randomlyselected DECOTABs were sliced into 50‐µm layers to evaluatethe particle distribution and concentration. Further, adultG. roeseli were fed with the particle‐loaded DECOTABs, andthe feeding rate as well as the particles per centimeter of gutwere measured to examine the usability of the DECOTABs as adietary exposure tool.
Particle distribution in the DECOTABs. Analysis of theparticle distribution in the particle‐loaded DECOTABs revealeda random distribution or overdispersion. In all vertical slices(n= 1–3 per concentration), the particles were found dis-tributed in a random pattern over the entire height of theDECOTAB (p= 0.129) for all tested particle concentrations(Figure 2; Supplemental Data, Figure 5SI). Overdispersion oc-curred in only one (1600 µL) out of the 7 sections (p= 0.017,R= 1.123).
In 50% of the horizontal sections at each concentration(n= 1–3 per concentration), particle distribution was random
(p= 0.062; Supplemental Data, Figure 5SI) and 42% revealedoverdispersion (p= 0.004–0.042). Only one horizontal sectionout of 14 contained clustered but not aggregated particles(p< 0.001, R= 0.827).
Because the particles were randomly distributed oroverdispersed, it was possible to calculate the numberof particles per DECOTAB dry weight out of the number ofparticles per slice of 50 µm thickness. The addition of3200 µL of the particle stock suspension to the DECOTABformulation resulted in a final particle concentration of 456±124 particles/mm³ and 381± 103 particles/mg dry weight of theDECOTAB. Preparation with 1600 µL reduces the particleconcentration to 243± 48 particles/mm³ and 203± 40 particles/mg dry weight, which is a reduction of 53% compared to thehighest concentration and corresponds to the added amountof particles. Also, the addition of 160 µL (5% of the highestamount added) resulted in 17± 8 particles/mm³ and 14±6 particles/mgdry weight, which is approximately 3.6% of thehighest concentration.
The section from the tab loaded with fluorescent 1000‐nmbeads revealed also a homogeneous particle distribution,which has to be verified with further statistics. At first sight,neither agglomerations nor clustered particles were observed(Figure 3).
Particle leaching from the DECOTABs. No leached par-ticles were detected after the prewetted DECOTABs were leftfor 4 d in water.
Uptake of the particles via the DECOTABs. The feedingrate of gammarids exposed with microparticle‐loaded phyll‐tabs was like the feeding rate of gammarids fed with particle‐free tabs (p= 0.192). Further, the feeding rate in both treat-ments did not change over time (p= 0.127 for control,p= 0.057 for particle treatment), except for the first day whenfeeding rate was higher (p= 0.035; Figure 4A).
As expected, no particles were detected in the gammaridsfed with particle‐free tabs (negative control, p= 1.000),whereas a significant amount of particles (70± 35 particles/cmgut) was found in the guts of the gammarids fed withparticle‐loaded tabs (p= 0.042; Figure 4B) within 1 d. Thenumber of particles per centimeter of gut was stable overtime (p= 0.189) and proportional to the feeding rate(p< 0.001, r= 0.33).
DISCUSSIONEvaluation of DECOTABs with food supplements
We were able to identify 2 food supplements that allow anincrease of the nutritional value of the cellulose‐tabs originallypublished as DECOTABs by Kampfraath et al. (2012) to facili-tate their use as suitable food in ecotoxicological short‐ andlong‐term bioassays. Best‐suited supplements for G. roeseliwere the algae‐based phyll and the animal protein–basedaquaculture trout food. This was demonstrated by dietaryproperties and behavioral responses including mortality andconstant feeding of gammarids as well as the characteristics of
1470 Environmental Toxicology and Chemistry, 2021;40:1463–1476—A. Götz et al.
© 2021 The Authors wileyonlinelibrary.com/ETC

the supplemented DECOTABs themselves. Important pre-requisites of using the tabs in standardized dietary exposureexperiments such as stability, low dry weight variation, thehomogenous distribution of embedded particles, and thepossibility to calculate the feeding rate with high accuracymake them a suitable tool for controlled ecotoxicologicalexperiments.
The main need for the supplementation of the cellulose‐tabswas to increase the nutritional value and adapt it to the needsof shredding organisms like gammarids to minimize a loss infitness and mortality. The nutritional value was determined bythe change of the organismal wide level of lipids, glucose, andglycogen. While glucose and lipids are primarily metabolizedby gammarids during starvation for 14 d, glycogen seems to beutilized only when glucose is nearly depleted (Semsar‐Kazerouni et al. 2020). The cellulose‐tabs were not able tomeet the nutritional demand because gammarids lost weightper millimeter when feeding on them for 3 wk and had to usetheir glucose reserves, although they were fed ad libitum. Thesame was true for the gammarids fed with tabs supplementedwith beech leaves, although conditioned leaf discs are an
established standard food in Gammarus spp. assays (Blockwellet al. 1998; Gergs and Rothhaupt 2008; Blarer and Burkhardt‐Holm 2016). This observed reduction of the glucose level wassimilar to reduction after a starvation period of 16 d in our ex-periments and was likewise observed by Charron et al. (2014)after a starvation period of 23 d.
Phyll‐, gammarus‐, or trout food‐tabs were chosen as alter-native food supplements because they are based on algae oranimal proteins. Although gammarids fed nearly twice as muchon the gammarus‐ than on the trout food‐ or phyll‐tabs, theydid not build up more energy reserves. This indicatesthat gammarus as a food supplement provides a lower foodquality compared to the algae‐based phyll or animal protein–based trout food, which might be compensated by higherfeeding rates (Bärlocher and Kendrick 1975; Gergs andRothhaupt 2008; Agatz et al. 2014). Next to the lower foodquality, a fast increasing risk for mortality up to >50% within the21 d when fed with gammarus‐tabs highly exceeded theacceptable range.
In contrast to the cellulose‐tabs or the supplementation withbeech leaves or ground and dried gammarids, trout food or
FIGURE 2: Particle distribution in one horizontal section of 50 µm thickness from a phyll‐tab filled with 3200 µL of the prepared 10‐ to 65‐µmmicroplastic suspension. This section contained 376 particles. (A) Brightfield image of the phyll‐tab with red fluorescent polystyrol particles. (B)Fluorescence microscopic image of phyll‐tab with red fluorescent particles with extended depth‐of‐field calculation of 15 Z‐sections. (C) Nearestneighbors method plot. Dots mark particle position, and gray scaling shows particle density. (D, E) Magnification of (B).
Dietary exposure tool for toxicity testing with G. roeseli—Environmental Toxicology and Chemistry, 2021;40:1463–1476 1471
wileyonlinelibrary.com/ETC © 2021 The Authors

phyll proved suitable for long‐term feeding of G. roeseli. Afterfeeding on DECOTABs with both supplements, the gammaridswere able to build up energy reserves higher than starvedgammarids, and the feeding rate was constant over 21 d.
Another remarkable fact is the slowly increasing and low riskfor mortality up to a maximum of 25% after 3 wk, which isparticularly crucial in establishing valid control groups in anyecotoxicological testing.
FIGURE 3: Exemplary examination of one horizontal slide (10 µm) of a decomposition and consumption tablet loaded with 1000‐nm beads.Fluorescence images were taken under a Leica Thunder imaging system (DM6B‐Z microscope, DFC9000GT camera, and LAS X software, Ver3.0.2.7506) with large‐volume computational clearing. Cyan fluorescent protein (CFP) excitation was used for the blue fluorescent particles (cyan)and Texas red (TxRed) excitation for the underlying red fluorescence of the phyll‐tab (magenta). (A) Overview image with maximum projectionimaged with a ×20 HC PLAPO CS2 20×/0.75 IMM UV objective. Cutout represents a magnified extract with 2 × 2 tiles imaged with a ×63 HC PLFLUOTOAR 63×/1.10 IMM and 81 Z‐planes. (B,C) Volume visualization (3D) of a small 2 × 2 area of the slide imaged with a ×63 HC PL FLUOTOAR63×/1.10 IMM and 81 Z‐planes.
1472 Environmental Toxicology and Chemistry, 2021;40:1463–1476—A. Götz et al.
© 2021 The Authors wileyonlinelibrary.com/ETC

The addition of food supplements can lead to a varyingweight loss when exposed to water or a variation in dry weightafter production, which interferes with the aim of a highstandardization. Moreover, stability in dry weight of the foodtabs during exposure is essential for the application of em-bedded substances and the determination of feeding rates.Although beech‐ and cellulose‐tabs were the most stable onescompared to the other formulations when submerged intowater, both revealed an incalculable weight loss when gam-marids were feeding on them. The dried cellulose‐tabs werevery brittle and had a tendency to lose material solely throughtouching by the gammarids. The beech‐tabs still containedlarger leaf parts, which were entirely removed from the tab bythe gammarids but not ingested. In contrast, the tabs supple-mented with phyll, gammarids, or trout food revealed a con-sistent dry weight after production; and no additional weightloss was observed during feeding experiments with organisms.This would make phyll, trout food, and gammarus suitable asfood supplements with an acceptable material loss in theaquatic environment of only 6 to 8% if only the stability ofthe DECOTABs is considered as an important prerequisite.In contrast, beech and cellulose were inappropriate in thisrespect.
An additional positive aspect of trout food or phyll is thecommercial availability of these supplements. On the onehand, this ensures a constant quality and subsequently re-producible feeding rates. On the other hand, it greatly in-creases comparability between different exposures andlaboratories. The latter is a strong advancement in contrast tothe common use of conditioned leaf discs as a food source.Herein, a strong variation in food quality can occur becauseconditioning is typically performed by using stream water(Blarer and Burkhardt‐Holm 2016), organically enriched dech-lorinated water (Blockwell et al. 1998), or bacterial cultures(Agatz and Brown 2014). Because of the high nutritional valuegammarids can gain from the tabs with phyll or trout food as a
supplement, no pretreatment of the DECOTABs is necessary,making their use easier and more convenient. Overall, sup-plementation of the DECOTABs with phyll or trout foodpromises the best conditions for standardized toxicity testing.
DECOTABs as an oral exposure toolDuring aqueous exposure, every particle or other sparingly
soluble substance distributes differently (Cole et al. 2011;Oliveira and Almeida 2019), leading to fundamental problemsin toxicity testing of an inhomogeneous distribution in themedium and the wrong assumption of equilibrium between themedium and the organism (European Centre for Ecotoxicologyand Toxicology of Chemicals 2018; Eitzen et al. 2019). Actually,the uptake of a particle in aqueous exposure–oriented experi-ments is mainly random (Cole et al. 2011; Bartonitz et al. 2020)and therefore not calculable. This is further complicated bythe often incomplete or unfeasible tracking of the particles inthe exposure system (Tiede et al. 2009; Correia and Loeschner2018; Triebskorn et al. 2019). We wanted to explore an alter-native way to aqueous exposure focusing on the oral exposureof organisms with their food, which bypasses these toxicity‐testing problems targeting particles or sparingly soluble sub-stances. Moreover, oral exposure is a more realistic pathwayfor the uptake of such substances because they tend to adsorbto surrounding material (Werner et al. 2002; Bundschuhet al. 2019). Different approaches of particle exposure via afood matrix can be found, for example, for the mudsnailPotamopyrgus antipodarum (Imhof 2013; Imhof and Laforsch2016), the amphipod Gammarus pulex (Imhof 2013), and theisopod Idotea emarginata (Hämer et al. 2014), however withoutdeeper evaluation of the properties of the matrix and theirrespective influences on the uptake of the tested substances.Therefore, we demonstrated the fulfilled prerequisites for suchan oral exposure tool regarding homogenous distribution of
FIGURE 4: (A) Feeding rate of the provided decomposition and consumption tablets by one gammarid per day and (B) mean particle count ingammarid gut over the course of 2 wk. Feeding rates for the first 3 d were calculated with a batch‐specific tab standard weight (initial dry wt=33.4± 0.2mg, n= 330).
Dietary exposure tool for toxicity testing with G. roeseli—Environmental Toxicology and Chemistry, 2021;40:1463–1476 1473
wileyonlinelibrary.com/ETC © 2021 The Authors

particles as well as their permanent fixation in the matrix. Also,the necessary predictable and constant particle exposurebased on the feeding rate was verified.
We were able to prove the applicability of loaded tabs as adietary exposure tool by adding fluorescent polystyrene mi-croparticles with a size of 10 to 65 µm. Examination of tab slicesrevealed homogenous distribution of the microparticleswithout aggregation in phyll‐tabs. The same seems true for1000‐nm PS beads, as shown by exemplary visualization in thepresent study. Because of the standardized production proce-dure and formulation of the DECOTABs, it was possible toensure a comparable and quantifiable exposure of G. roeseliwith particles based on the feeding rate calculation and theparticle concentration in the DECOTAB. Particle preparationbefore addition to the tabs is a remaining challenge that stillshould be harmonized and standardized (Hartmann et al. 2015;Eitzen et al. 2019), but no complex particle presuspensionseems nessecary for particles like those used in the presentstudy where an oral exposure tool is used.
The exposure of G. roeseli with microparticle‐loadedDECOTABs led to a constant inner particle concentration re-sulting from a steady and fast ingestion as well as from acontinuous egestion of the particles with the food. Completeegestion of particles with a size of 10 to 65 µm from the gut wasobserved, corresponding with the limited transfer of this size ofparticles into cells (Triebskorn et al. 2019). For the particles inthe nanometer size class, such a transfer and resulting accu-mulation are more likely and need to be examined. Finally, wewere able to verify that the dietary exposure as performed byZhai et al. (2018) and Yardy and Callaghan (2020) solves theoften claimed inhomogeneous distribution and unpredictableexposure of the particles in aquatic toxicity tests.
Further, we were able to link the feeding on themicroparticle‐loaded tab with the amount of particles in the gutof the gammarids, enabling a more realistic dose–responseassessment. The inner particle concentration can be determinedwithout a direct examination of the gut content, which can onlybe quantified at the end of the experiment (e.g., Straubet al. 2017). Instead, the inner particle concentration, which ismore relevant for the observed effects than the outer particleconcentration (European Centre for Ecotoxicology and Tox-icology of Chemicals 2018), becomes continuously calculablevia the feeding rate. This gains an adjustable dosimetry for eachexperiment, which is of great advantage not only for a stand-ardized particle testing via the oral pathway but also for a morerealistic dose–effect assessment for particulate substances.
Nevertheless, leaching of particulates or other embeddedchemicals from the DECOTAB into the surrounding mediumshould be considered because it can affect the exposurepathway. The DECOTABs suggested in the present study didnot leach any particles when watered for several days, wherebyit must be recognized that gammarids are shredding their foodduring feeding and, thus, DECOTAB pieces with particles canspread in the test vessel. However, in our experiments, uptakevia this route was negligible. Concerning the exposure withsoluble substance via DECOTABs or if particles with adsorbedpollutants are embedded, a validation of potentially leached
substance via chemical analysis of the medium is highly rec-ommended because the partitioning between food source,medium, and organism might vary (Moermond et al. 2013; USEnvironmental Protection Agency 2016).
Another essential prerequisite for oral application is that theembedded substance does not influence the uptake by theorganism. This could be proven as the embedded micro-particles did not change the feeding of the gammarids on theparticle‐loaded phyll‐tabs compared to particle‐free ones. Weobserved a higher feeding rate on day 1, which can be in-terpreted as a response to starvation during the acclimatizationperiod. This consequently leads to the conclusion that the ac-climatization and the test periods should be conducted with aconstant ad libitum feeding. Despite the compensatory feedingafter starvation, the feeding rate normalized within 1 d andremained constant with and without microparticles during theentire test period.
Recommendations for future studies usingDECOTABs as an advanced food sourceand/or oral exposure tool
With regard to the applicability in further studies, we want togive some recommendations concerning test duration, feedingtime, and tab handling as well as the possibility of using thetabs for other organisms.
The test duration is mainly dependent on the feeding be-havior of the test organism. The organisms should feed at leastseveral days on the tabs to allow a reliable detection of tab dryweight changes. For 1‐d exposures, the weighing error andweight loss are sometimes higher than the feeding of thegammarids, which may lead to undetectable effects on thefeeding behavior (Bartonitz et al. 2020). Further, if the transferof particles is intended, a certain amount of time is necessary toallow subsequent exposure of the particles. In addition, ex-periments with particulates often require a longer durationbecause no acute toxicity has been shown so far (Triebskornet al. 2019).
The maximum feeding time on one DECOTAB can be ex-tended. In our experiment, the DECOTABs were stable for over4 d. However, to enable ad libitum feeding, the DECOTABshould be replaced on a regular basis depending on their dryweight before they are eaten completely. We replaced themafter 3 or 4 d, which corresponds to a weight loss of11.5± 3.6 mg with 3 untreated gammarids (∼30% of our phyll‐tab dry wt). Considering the overall duration of the experiment,no constraints exist if the DECOTABs are replaced regularlyconsidering the above‐mentioned minimum and maximumexposure times of a single DECOTAB. Most important formeasuring the feeding rate is the use of the individual tabweight before and after the experiment because this increasesthe sensitivity of the endpoint instead of using an averagestandard weight. Calculation of feeding rate should include themean daily weight loss of the tabs and the initial and final dryweight for every single tab. We also recommend the exami-nation of a suitable food supplement for the investigatedorganism including stability of the resulting tab.
1474 Environmental Toxicology and Chemistry, 2021;40:1463–1476—A. Götz et al.
© 2021 The Authors wileyonlinelibrary.com/ETC

Although not specifically tested in the present study, it islikely that supplemented DECOTABs can also be used to feedorganisms other than G. roeseli (Kampfraath et al. 2012).Decomposition and consumption tablets with and withoutsupplements were already successfully used to feed otheramphipods, like Gammarus fossarum (Straub et al. 2017) or inexperiments with Hyalella azteca (Raths et al. 2020) and mi-crobes (Hunting et al. 2017); but standardization of productionand homogeneous distribution of the particles and tabs as asufficient nutrient supply were not extensively tested. Also,mixtures containing similar ingredients and supplements weresuccessfully used to provide food for the caddisfly Allogamusmortoni (Fenoy et al. 2020). Consequently, we assume thesuitability of the DECOTABs supplemented with either phyll ortrout for gammarids or even another species‐dependent sup-plement during short‐ and long‐term exposures for multiplefunctional feeding groups, particularly for shredder and grazerorganisms in aquatic and terrestrial environments.
CONCLUSIONIn the present study we describe a step toward a more
standardized operational framework for toxicity testing proce-dures with particulate substances during short‐ and long‐termbioassays with aquatic organisms. Focusing on the oral ex-posure pathway, we were able to provide an alternative to in-homogeneous aqueous particle exposure, which is difficult tostandardize because of inhomogeneous distribution and un-predictable uptake. Moreover, a more realistic dose–responseassessment of dietary particle exposures over the course of theentire experiment is feasible by combining the advantages ofthe homogenous distribution of particles and sparinglysoluble substances in a stable food matrix with the possibilityof a reliable feeding rate determination and consequentlycontrollable exposure.
Supplementation of DECOTABs to meet the requirements ofa test organism is already common practice. However, thedeeper evaluation of the nutritional value in the present studyprovides one of the most standardized and verified food sourceswhich is adapted to the specific needs of gammarids. It allowsshort‐ and long‐term bioassays while maintaining a healthy stateof the test organisms. Regular application of such supplementedDECOTABs in ecotoxicity testing procedures will improve thedetermination of feeding rates as a sensitive endpoint becauseof the high stability and low dry weight variation of the tabs. Italso will increase comparability between studies by providinga constant health status and lowering possible stress of thegammarids, resulting in more realistic endpoint measurementand effect assessment. By varying the supplementation, tabshave a great potential of being used in toxicity tests with severalorganisms from different functional feeding groups.
Future research should focus on establishing clear relation-ships between the bioavailable fraction of particles or sparinglysoluble substances in aquatic environments and observed ef-fects. Studies concerning the partitioning of particles and othersparingly soluble substances to digestible sources are rare aswell as particle concentration in the organism and subsequently
real particle exposure for each functional feeding group. Wefurther emphasize the mandatory comparison between an-thropogenic plastic particles and natural particles, to avoid theconfusion of mechanical and chemical effects. In addition, theuptake pathways (oral, dermal, pulmonal) of particles andsparingly soluble substances clearly must be considered inecotoxicological research because exposure from the watercolumn is negligible, and guidelines must be updated ac-cordingly (Bundschuh et al. 2019; Oliveira and Almeida 2019).Our approach provides a template for further studies in thisdirection.
Supplemental Data—The Supplemental Data are available onthe Wiley Online Library at https://doi.org/10.1002/etc.4990.
Acknowledgment—The present study was funded by theGerman Federal Ministry of Education and Research in theproject SubµTrack (grant 02WPL1443A) and the BavarianResearch Foundation in the project MiPAq (grant AZ‐1258‐16).We thank S. Kefer, who generated fragments of fluorescentpolystyrene microparticles and determined the size distribution.We also thank C. Gutjahr and M. Pfaffl from the Technical Uni-versity of Munich (TUM) for providing us access to their micro-scope equipment. Also, practical assistance in the laboratory byG. Thomas, K. Bichler, and F. Biefel is highly appreciated. OpenAccess funding enabled and organized by Projekt DEAL.
Disclaimer—The authors certify that they have no affiliationswith or involvement in any organization or entity with anyfinancial or nonfinancial interest in the subject. They have noconflicts of interest to declare. The submitted manuscript wasnot previously published elsewhere. Furthermore, they declarethat the manuscript is not under consideration by any otherjournal. They certify compliance with the journal's policy anddeclare that the submitted images are created by an authorand have never been publish elsewhere.
Author Contributions Statement—A. Götz: conceptualization,data curation, formal analysis, investigation, methodology,visualization, writing–original draft, review and editing; J.Geist: conceptualization, supervision, resources, writing–review and editing; H.K. Imhof and S. Beggel: conceptualiza-tion, formal analysis, methodology, supervision, writing–reviewand editing.
Data Availability Statement—Data, associated metadata, andcalculation tools are available from the corresponding author([email protected]).
REFERENCESAgatz A, Ashauer R, Brown CD. 2014. Imidacloprid perturbs feeding of
Gammarus pulex at environmentally relevant concentrations. EnvironToxicol Chem 33:648–653.
Agatz A, Brown CD. 2014. Variability in feeding ofGammarus pulex: Movingtowards a more standardised feeding assay. Environ Sci Eur 26:15.
Bärlocher F, Kendrick B. 1975. Leaf‐conditioning by microorganisms.Oecologia 20:359–362.
Dietary exposure tool for toxicity testing with G. roeseli—Environmental Toxicology and Chemistry, 2021;40:1463–1476 1475
wileyonlinelibrary.com/ETC © 2021 The Authors

Bartonitz A, Anyanwu IN, Geist J, Imhof HK, Reichel J, Graßmann J, DrewesJE, Beggel S. 2020. Modulation of PAH toxicity on the freshwater or-ganism G. roeseli by microparticles. Environ Pollut 260:113999.
Beggel S, Brandner J, Cerwenka AF, Geist J. 2016. Synergistic impacts byan invasive amphipod and an invasive fish explain native gammaridextinction. BMC Ecol 16:32.
Benjamini Y, Hochberg Y, Stark PB. 1998. Confidence intervals with morepower to determine the sign: Two ends constrain the means. J Am StatAssoc 93:309–317.
Blarer P, Burkhardt‐Holm P. 2016. Microplastics affect assimilation efficiencyin the freshwater amphipod Gammarus fossarum. Environ Sci Pollut ResInt 23:23522–23532.
Blockwell SJ, Taylor EJ, Jones I, Pascoe D. 1998. The influence of freshwater pollutants and interaction with Asellus aquaticus (L.) on thefeeding activity of Gammarus pulex (L.). Arch Environ Contam Toxicol34:41–47.
Boeker C, Geist J. 2015. Effects of invasive and indigenous amphipods onphysico‐chemical and microbial properties in freshwater substrates.Aquat Ecol 49:467–480.
Brock TCM, van Wijngaarden RPA. 2012. Acute toxicity tests with Daphniamagna, Americamysis bahia, Chironomus riparius and Gammarus pulexand implications of new EU requirements for the aquatic effect assess-ment of insecticides. Environ Sci Pollut Res Int 19:3610–3618.
Bundschuh R, Bundschuh M, Otto M, Schulz R. 2019. Food‐related ex-posure to systemic pesticides and pesticides from transgenic plants:Evaluation of aquatic test strategies. Environ Sci Eur 31:3290.
Burgherr P, Meyer EI. 1997. Regression analysis of linear body dimensionsvs. dry mass in stream macroinvertebrates. Arch Hydrobiol 139:101–112.
Charron L, Geffard O, Chaumot A, Coulaud R, Jaffal A, Gaillet V, Dedourge‐Geffard O, Geffard A. 2014. Influence of Molting and Starvation onDigestive Enzyme Activities and Energy Storage in Gammarus fossarum.PLoS ONE 9(4):e96393.
Cole M, Lindeque P, Halsband C, Galloway TS. 2011. Microplastics ascontaminants in the marine environment: A review. Mar Pollut Bull62:2588–2597.
Connon R, Geist J, Werner I. 2012. Effect‐based tools for monitoring andpredicting the ecotoxicological effects of chemicals in the aquatic en-vironment. Sensors 12:12741–12771.
Correia M, Loeschner K. 2018. Detection of nanoplastics in food by asym-metric flow field‐flow fractionation coupled to multi‐angle light scat-tering: Possibilities, challenges and analytical limitations. Anal BioanalChem 410:5603–5615.
de Coen WM, Janssen CR. 1997. The use of biomarkers in Daphnia magnatoxicity testing. IV. Cellular energy allocation: A new methodology toassess the energy budget of toxicant‐stressed Daphnia populations.J Aquat Ecosyst Stress Recov 6:43–55.
Eitzen L, Paul S, Braun U, Altmann K, Jekel M, Ruhl AS. 2019. The challengein preparing particle suspensions for aquatic microplastic research.Environ Res 168:490–495.
European Centre for Ecotoxicology and Toxicology of Chemicals. 2018.
Feiner M, Beggel S, Geist J. 2016. Miniature circulatory systems: A newexposure system for ecotoxicological effect assessments in riverineorganisms. Environ Toxicol Chem 35:2827–2833.
Fenoy E, Moyano FJ, Casas JJ. 2020. Warming and nutrient‐depleted food:Two difficult challenges faced simultaneously by an aquatic shredder.Freshw Sci 39:393–404.
Forster B, van de Ville D, Berent J, Sage D, Unser M. 2004. Complexwavelets for extended depth‐of‐field: A new method for the fusion ofmultichannel microscopy images. Microsc Res Tech 65:33–42.
Gergs R, Rothhaupt KO. 2008. Feeding rates, assimilation efficiencies andgrowth of two amphipod species on biodeposited material from zebramussels. Freshw Biol 53:2494–2503.
Gerhardt A, Bloor M, Mills CL. 2011. Gammarus: Important taxon in fresh-water and marine changing environments. Int J Zool 2011:1–2.
Hämer J, Gutow L, Köhler A, Saborowski R. 2014. Fate of microplastics in themarine isopod Idotea emarginata. Environ Sci Technol 48:13451–13458.
Hammer Ø, Harper DAT, Ryan PD. 2001. PAST: Paleontological statistics soft-ware package for education and data analysis. Palaeontol Electronica 4:9.
Hartmann NB, Jensen KA, Baun A, Rasmussen K, Rauscher H, Tantra R, CupiD, Gilliland D, Pianella F, Riego Sintes JM. 2015. Techniques and pro-tocols for dispersing nanoparticle powders in aqueous media—Is there a
rationale for harmonization? J Toxicol Environ Health B Crit Rev18:299–326.
Hunting ER, Barmentlo SH, Schrama M, van Bodegom PM, Zhai Y, VijverMG. 2017. Agricultural constraints on microbial resource use and nichebreadth in drainage ditches. PeerJ 5:e4175.
Imhof HK, Ivleva NP, Schmid J, Niessner R, Laforsch C. 2013. Contaminationof beach sediments of a subalpine lake with microplastic particles. CurrBiol 23:R867–R868.
Imhof HK, Laforsch C. 2016. Hazardous or not—Are adult and juvenile in-dividuals of Potamopyrgus antipodarum affected by non‐buoyant mi-croplastic particles? Environ Pollut 218:383–391.
Jamovi Project. 2019. Jamovi. Sydney, Australia.
Kampfraath AA, Hunting ER, Mulder C, Breure AM, Gessner MO, KraakMHS, Admiraal W. 2012. DECOTAB: A multipurpose standard substrateto assess effects of litter quality on microbial decomposition and in-vertebrate consumption. Freshw Sci 31:1156–1162.
Moermond CTA, Korkaric M, Agerstrand M, Kase R. 2013. Reliability andrelevance evaluation of ecotoxicity studies for use in risk assessment ofchemicals. Working version.
Oliveira M, Almeida M. 2019. The why and how of micro(nano)plastic re-search. Trends Analyt Chem 114:196–201.
Preibisch S, Saalfeld S, Tomancak P. 2009. Globally optimal stitching of tiled3D microscopic image acquisitions. Bioinformatics 25:1463–1465.
RStudio. 2015. RStudio. Boston, MA, USA.
Raths J, Kuehr S, Schlechtriem C. 2020. Bioconcentration, metabolism, andspatial distribution of 14C‐labeled laurate in the freshwater amphipodHyalella azteca. Environ Toxicol Chem 39:310–322.
Rist S, Hartmann NB. 2018. Aquatic ecotoxicity of microplastics and nano-plastics: Lessons learned from engineered nanomaterials. In Wagner M,Lambert S, Besseling E, Biginagwa FJ, eds, Freshwater Microplastics:Emerging Environmental Contaminants? Vol 58. Springer Open, Cham,Switzerland, pp 25–49.
Rufli H, Fisk PR, Girling AE, King JM, Länge R, Lejeune X, Stelter N, Stevens C,Suteau P, Tapp J, Thus J, Versteeg DJ, Niessen HJ. 1998. Aquatic toxicitytesting of sparingly soluble, volatile, and unstable substances and inter-pretation and use of data. Task Force of the European Centre for Eco-toxicology and Toxicology of Chemicals. Ecotoxicol Environ Saf 39:72–77.
Schindelin J, Arganda‐Carreras I, Frise E, Kaynig V, Longair M, Pietzsch T,Preibisch S, Rueden C, Saalfeld S, Schmid B, Tinevez J‐Y, White DJ,Hartenstein V, Eliceiri K, Tomancak P, Cardona A. 2012. Fiji: An open‐source platform for biological‐image analysis. Nat Methods 9:676–682.
Semsar‐Kazerouni M, Boerrigter JGJ, Verberk WCEP. 2020. Changes in heatstress tolerance in a freshwater amphipod following starvation: The roleof oxygen availability, metabolic rate, heat shock proteins and energyreserves. Comp Biochem Physiol A Mol Integr Physiol 245:110697.
Straub S, Hirsch PE, Burkhardt‐Holm P. 2017. Biodegradable andpetroleum‐based microplastics do not differ in their ingestion and ex-cretion but in their biological effects in a freshwater invertebrateGammarus fossarum. Int J Environ Res Public Health 14:774.
Tiede K, Hassellöv M, Breitbarth E, Chaudhry Q, Boxall ABA. 2009.Considerations for environmental fate and ecotoxicity testing tosupport environmental risk assessments for engineered nanoparticles.J Chromatogr A 1216:503–509.
Toussaint B, Raffael B, Angers‐Loustau A, Gilliland D, Kestens V, Petrillo M. 2019.Review of micro‐ and nanoplastic contamination in the food chain. FoodAddit Contam Part A Chem Anal Control Expo Risk Assess 36:639–673.
Triebskorn R, Braunbeck T, Grummt T, Hanslik L, Huppertsberg S, Jekel M.2019. Relevance of nano‐ and microplastics for freshwater ecosystems: Acritical review. Trends Analyt Chem 110:375–392.
US Environmental Protection Agency. 2016. OCSPP 850.1020: Gammaridamphipod acute toxicity test: Ecological effects test guidelines. EPA712‐C‐16‐012. Washington, DC.
van Handel E. 1985. Rapid determination of total glycogen and sugars inmosquitoes. J Am Mosq Control Assoc 1:299–301.
Werner I, Geist J, Okihiro M, Rosenkranz P, Hinton DE. 2002. Effects ofdietary exposure to the pyrethroid pesticide esfenvalerate on medaka(Oryzias latipes). Mar Environ Res 54:609–614.
Yardy L, Callaghan A. 2020. What the fluff is this? Gammarus pulex preferfood sources without plastic microfibers. Sci Total Environ 715:136815.
Zhai Y, Brun NR, Bundschuh M, Schrama M, Hin E, Vijver MG, Hunting ER.2018. Microbially‐mediated indirect effects of silver nanoparticles onaquatic invertebrates. Aquat Sci 80:12968.
1476 Environmental Toxicology and Chemistry, 2021;40:1463–1476—A. Götz et al.
© 2021 The Authors wileyonlinelibrary.com/ETC