master's thesis - diva portalltu.diva-portal.org/smash/get/diva2:1023002/fulltext02.pdf ·...
TRANSCRIPT

MASTER'S THESIS
Local Job Multiplier of the Mining Industryin Northern Sweden
An Econometric Study
Thomas Moritz2015
Master of Science in Business and Economics (Civilekonom)Business and Economics
Luleå University of TechnologyDepartment of Business Administration, Technology and Social Sciences

Local job multiplier of the mining industry in
northern Sweden An econometric study
Thomas Moritz Luleå University of Technology
Economic Unit
SE-971 87 Luleå, Sweden
ABSTRACT
The purpose of this study is to assess the effects of the mining industry in northern Swe-
den by examining the job multiplier. The multiplier shows how many jobs that are
created in other sectors in the region, as one new job in the mining industry is created.
The job multiplier will be estimated for different parts of northern Sweden. To estimate
the job multiplier an econometric model introduced by Moretti (2010) will be applied.
Data on the number of employees in different sectors in northern Sweden was collected
from the Central Bureau of Statistics in Sweden. The result shows that between 0.492
and 0.662 new jobs in the private service sector is created for each new job in the
mining sector. The results vary depending on which municipalities in northern Sweden
that are included. It also shows that totally between 0.852 and 0.989 new jobs are
created for each new mining job, when all sectors are combined into one sector. Finally,
the study shows that municipalities with mining employees are more affected by the
mining industry than municipalities without mining workers.
SAMMANFATTNING
Syftet med den här studien är att analysera effekterna av gruvindustrin i norra Sverige
genom att undersöka hur många jobb som skapas i övriga samhället då ett nytt jobb
inom gruvindustrin skapas. Studien kommer att undersöka detta för olika delar av norra
Sverige. För att genomföra studien valdes en ekonometrisk modell för att estimera jobb
multiplikatorn. Data över antalet anställda i olika sektorer i norra Sverige hämtades in
från statistiska centralbyrån i Sverige. Resultaten visar att det skapas mellan 0,492 och
0,662 nya jobb inom privat servicesektor för varje nytt jobb i gruvsektorn, beroende på
vilka kommuner i norra Sverige som inkluderas. Resultaten visar även att det totalt
skapas mellan 0,852 och 0,989 nya jobb för varje nytt jobb i gruvan till alla sektorer.
Slutligen så visar studien att kommuner med anställda inom gruvan påverkas mer av
gruvindustrin än kommuner utan anställda i gruvindustrin.

ACKNOWLEDGEMENT
I would like to express my gratitude to my supervisor Linda Wårell for her valuable
comments and engagement throughout the whole process of this thesis. I also want to
thank everyone in my environment that supported me and have given me valuable
comments throughout the process.
TABLE OF CONTENTS
CHAPTER 1 INTRODUCTION ............................................................................................... 1
1.1 BACKGROUND .......................................................................................................... 1
1.2 PURPOSE .................................................................................................................. 2
1.3 METHODOLOGY ....................................................................................................... 2
1.4 SCOPE AND LIMITATIONS ......................................................................................... 3
1.5 OUTLINE .................................................................................................................. 3
CHAPTER 2 MINING INDUSTRY IN SWEDEN ................................................................. 4
2.1 HISTORICAL DEVELOPMENT ..................................................................................... 4
2.2 MARKET STRUCTURE ............................................................................................... 5
2.3 COMMODITY BOOM .................................................................................................. 6
2.4 DEVELOPMENT IN NORTHERN SWEDEN ................................................................... 7
CHAPTER 3 LITERATURE REVIEW .................................................................................. 9
3.1 SEARCH STRATEGY .................................................................................................. 9
3.2 PREVIOUS LITERATURE ............................................................................................ 9
3.2.1 Input-output model .......................................................................................... 9
3.2.2 Econometric model ........................................................................................ 11
3.3 CONCLUSIONS BASED ON THE LITERATURE REVIEW ............................................... 14
CHAPTER 4 THEORETICAL FRAMEWORK .................................................................. 16
4.1 STAPLE THEORY ..................................................................................................... 16
4.2 JOB MULTIPLIER ..................................................................................................... 17
4.2.1 Multiplier for the non-tradable sector ........................................................... 18
4.2.2 Multiplier for the tradable sector .................................................................. 18
4.3 DISCUSSION ........................................................................................................... 19
CHAPTER 5 METHODOLOGY ........................................................................................... 20
5.1 METHODS TO ESTIMATE THE LOCAL JOB MULTIPLIER ............................................. 20
5.2 ECONOMETRIC SPECIFICATION ............................................................................... 22
CHAPTER 6 DATA SOURCES .............................................................................................. 24
6.1 EMPLOYMENT DATA .............................................................................................. 24
CHAPTER 7 EMPIRICAL RESULTS AND ANALYSIS ................................................... 29
7.1 EMPIRICAL RESULTS .............................................................................................. 29

7.2 ANALYSIS .............................................................................................................. 32
CHAPTER 8 CONCLUDING REMARKS ............................................................................ 36
REFERENCES .......................................................................................................................... 38

LIST OF TABLES AND FIGURES
Table 1: Production of metals 5
Figure 1: Iron ore monthly price in US dollars per dry metric ton 7
Table 2: Overview of Relevant Literature 13
Figure 2: The rAps-model 20
Table 3: Number of jobs in Norrbotten and Västerbotten 2003-2013 25
Table 4: Population Norrbotten and Västerbotten 2003-2013 26
Table 5: Number of jobs in northern Sweden div in sectors 2003-2013 26
Table 6: Number of jobs in Norrbotten and Västerbotten 2003-2013 27
Table 7: Number of jobs in mining industry 2003-2013 27
Table 8: Elasticity and job multiplier combined sector 30
Table 9: Job multiplier in all municipalities in northern Sweden 31
Table 10: Job multiplier in municipalities with mining workers 31
Table 11: Elasticity and job multiplier in Norrbotten 32
Table 12: Elasticity and job multiplier in Västerbotten 32

1
CHAPTER 1
INTRODUCTION
1.1 Background
The mining industry is an important industry for Sweden, which can be exemplified by
the former Prime Minister Fredrik Reinfeldt’s statement that “the mining industry for
Sweden is what the oil industry is for Norway” (SvD, 2012). Even if this might be
slightly exaggerated, as the oil industry in Norway represents a much larger share of the
country’s economy, this shows that the mining industry is considered as a very
important industry for Sweden. In Europe, Sweden is a large mining country and
especially so regarding iron ore where 90% of the production comes from Sweden
(SGU, 2014). This is also reflected in Swedish exports, since the mining industry
including steel, represents about 10% of Sweden’s gross exports and around 60% of net
exports (Mineralriket, 2014).
The mining industry is important for the entire country, but especially for the most
northern county’s, Norrbotten and Västerbotten, where a majority of the mines are
located. In 2013, 70% of the employees in the mining sector worked in Norrbotten and
around 15% in Västerbotten. Thus, in total 85% of all mining jobs in Sweden are in
these two counties. Most of the workers in Norrbotten work in the large iron ore mines
in Kiruna and Gällivare (Statistics Sweden, 2015). Of the total exports from Norrbotten
over 64% are mineral products, and the largest share of these represents iron ore
products. If we look at the whole of Sweden, over 83% of the total export value from
mining comes from Norrbotten (Ibid). Ejdemo (2014) has estimated the location ratio
for different industries in Norrbotten. The location ratio is a measure to see if the county
is self-sufficient or not regarding different products. If the ratio is equal to one it means
that the county is self-sufficient, and everything over one are exported outside the
county. Extraction of minerals has a location ratio of 19.27, which indicates that most of
the minerals are exported. The second largest ratio is for repair and installation of
machinery and equipment with a ratio of 1.86. The fact that Norrbotten is over 19 times

2
self-sufficient in minerals is a strong indicator of how specialized Norrbotten’s industry
is on the mining sector.
Due to the recent commodity boom, with accompanying high mineral prices,
investments in the industry have been very high. A large part of the total industrial
investments in Sweden are in the mining industry in northern Sweden (Swedish
minerals strategy, 2013). Furthermore, there are future plans to increase the production
of iron ore, by opening new mines, which will lead to even more investments in the
industry (Mineralriket, 2014). Generally the mining industry is an industry that requires
large capital investments, while the number of direct employment is relatively low
compared to the capital investment. However, when an industry requires a lot of capital
it will spill-over to the rest of the society and have positive effect on other sectors.
Regarding this knowledge, it is important to find out the indirect effect of the mining
industry and understand how the mining industry affects other sectors in the society.
One way to investigate the indirect impacts from the mining industry on other sectors is
to estimate the job multiplier (Moretti, 2010). The job multiplier describes how many
jobs that will be created in other sectors, when one new job in the mining industry is
created. This implies that we can find out how many non-mining jobs that are being
created by the mining sector.
1.2 Purpose
The purpose of this study is to assess the job multiplier of the mining industry in
northern Sweden.
1.3 Methodology
The method used in this study to estimate the local job multiplier of mining is based on
an econometric model that Moretti introduced 2010. The simple econometric model
estimates the local job multiplier of mining, by estimating the change in the number of
employees in the non-mining sector, when one new job in the mining sector is created.
In order to use the model, data on the number of employees in the non-mining sectors
and in the mining sector are collected. The regressions are made for two five year
periods, 2003-2008 and 2008-2013, which means that data for 2003, 2008 and 2013 are
3
used. Data is collected from the Central Bureau of Statistics in Sweden and are from all
the 29 municipalities in Norrbotten and Västerbotten.
1.4 Scope and limitations
This study aims to investigate the effect of the mining industry in northern Sweden. The
study is thus geographically limited to northern Sweden, which is represented by the
two most northern county’s Norrbotten and Västerbotten, mainly because this is where
most of the Swedish mines are located. The study only considers the effect from the
mining industry in form of new jobs and does not directly take into consideration for
example environmental aspects, mainly because of the time limit of this study. This
study is also limited to investigate the change in the number of jobs during the time
period 2003 to 2013. Furthermore, the study uses only data from Statistics Sweden and
no data is retrieved from another sources. This is because Statistics Sweden is a well-
used source when it comes to statistics for research and the statistics are therefore
considered as reliable.
1.5 Outline
This study has 8 chapters and starts with this introduction chapter. Chapter two provides
a background of the mining industry. In chapter three a literature review is presented
where earlier literature on the subject are presented and discussed. Then in chapter four
the theoretical framework are described, and in chapter five the method and
econometric model is presented. In chapter six the data and the data sources are
presented in form of tables and text. Then in chapter seven the result is presented and
analyzed. And in the last chapter, chapter eight, the concluding remarks are made.
4
CHAPTER 2
THE MINING INDUSTRY IN SWEDEN
This chapter begins by describing the historical development of the Swedish mining
industry. Then the market structure is presented and discussed. The chapter then
continues with describing the commodity boom from the beginning of the 2000s.
Finally, the development of the mining industry in the northern Sweden is discussed.
The chapter has a clear focus on iron ore, this because iron ore is the most important
mineral for northern Sweden.
2.1 Historical development
In order to describe the mining industry, we start with a historical perspective. The
mining industry in Sweden has a long history that goes back to the early 1000’s when
the first mine was opened. Until today there have been more than 3000 active mines in
Sweden, and the majority of these have been located in Bergslagen in the central parts
of Sweden. The large iron ore reserves in Norrbotten was discovered in 1660, and 1890
the government owned company LKAB was founded (SGU, 2015). Since then, the
mining industry has been an important part of the Swedish society. The large iron ore
reserves in Norrbotten are located in the northern part of Norrbotten and thus far from
the coast, which meant that the problem with transportation needed to be solved. In
order to export the iron ore, efficient transports was needed. A railway between Luleå -
Malmberget - Kiruna solved this problem. The railway was completed in the late 1880s
and made it possible to transport iron ore from the mines to Luleå, for further transport
by boat (SGU, 2015). Since most of the minerals are exported the transports are
important in order to efficiently compete against other competitors on the world market.
In the end of 1910 there were over 500 active mines in Sweden that produced around 8
million tons of ore. Today there are just over 15 active mines that produce 80 million
tons of ore (Ibid).
5
Large parts of our society are based on knowledge about how to extract and utilize
minerals. From minerals all metals that are important for our society are produced, for
example iron. However, ore is actually not a geological term, it is a commercial term
that means a geological shared setting of one or more metal minerals that are
economically profitable to mine. Iron ore is one or more minerals that can be used for
the production of iron and steel (SGU, 2014). Most of the iron ore in Sweden are mined
by LKAB, and they do not sell iron ore directly, instead they processes iron ore into
different types of iron ore products, mostly pellets and fines. Pellets is a ball that is
about 10 millimeters and it is created in a pellets plant. Fines are milled iron ore sand
that is lumped together into a larger mass when it is used in steel mills (LKAB, 2015a).
2.2 Market structure
The world population increases and urbanization with it, which implies that more and
more people choose to live in cities and the number of megacities is predicted to
increase. This places high demand on the supply of metals and minerals, not the least
iron ore that is important in order to produce steel (Swedish mineral strategy, 2013).
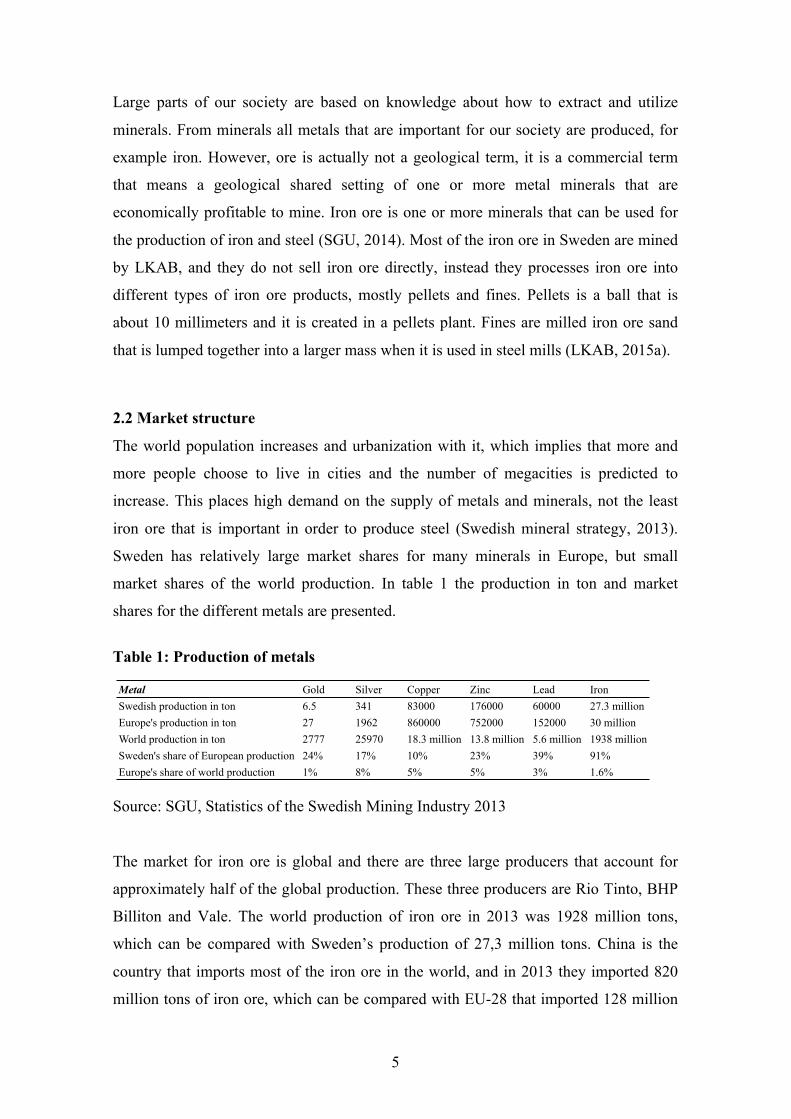
Sweden has relatively large market shares for many minerals in Europe, but small
market shares of the world production. In table 1 the production in ton and market
shares for the different metals are presented.
Table 1: Production of metals
Source: SGU, Statistics of the Swedish Mining Industry 2013
The market for iron ore is global and there are three large producers that account for
approximately half of the global production. These three producers are Rio Tinto, BHP
Billiton and Vale. The world production of iron ore in 2013 was 1928 million tons,
which can be compared with Sweden’s production of 27,3 million tons. China is the
country that imports most of the iron ore in the world, and in 2013 they imported 820
million tons of iron ore, which can be compared with EU-28 that imported 128 million
Metal Gold Silver Copper Zinc Lead IronSwedish production in ton 6.5 341 83000 176000 60000 27.3 millionEurope's production in ton 27 1962 860000 752000 152000 30 millionWorld production in ton 2777 25970 18.3 million 13.8 million 5.6 million 1938 millionSweden's share of European production 24% 17% 10% 23% 39% 91%Europe's share of world production 1% 8% 5% 5% 3% 1.6%
6
tons (SGU, 2014). The global demand for iron ore is therefore based on China and how
much iron ore they need. When it comes to other base metals the production in the
world are increasing with a couple of percent per year. The largest producing countries
of base metals are China, Australia and Indonesia. As with iron ore, it is China who
demand most of the base metals and therefore the price for the base metals are
depending on the Chinese market. Precious metals, such as gold and silver, have also
increased production in recent years, slightly larger increase for gold than for silver.
Gold is mostly produced in Asia and North America and silver mostly in North and
South America. The prices of gold and silver are mainly depending on the US dollar
(SGU, 2014).
Sine the Swedish mining companies are relatively small they act as price takers and can
not influence the price level by increasing or decreasing the quantity. When it comes to
iron ore, most of the reserves in the world are located relatively close to the surface,
which means that they can be extracted by open pit mining. Most of the iron ore in
Sweden are located further down, which implies the use of underground mines to
extract the minerals. The mining industry has generally large economies of scales and
high entry barriers in terms of capital and infrastructure. The iron ore market has a
structure where a few companies supply a large part of the market. For markets that
have this type of structure, one way for smaller companies to compete is through
specialization. See e.g. LKAB, they have specialized on producing high-quality pellets,
which is an upgrade of the ore to make it more attractive.
2.3 Commodity boom
From the early 2000s it has been a commodity boom in the world due the rapidly
growing economies in Asia. The increase in demand for many minerals has led to
increased profits for mining companies, and as a result new companies has entered the
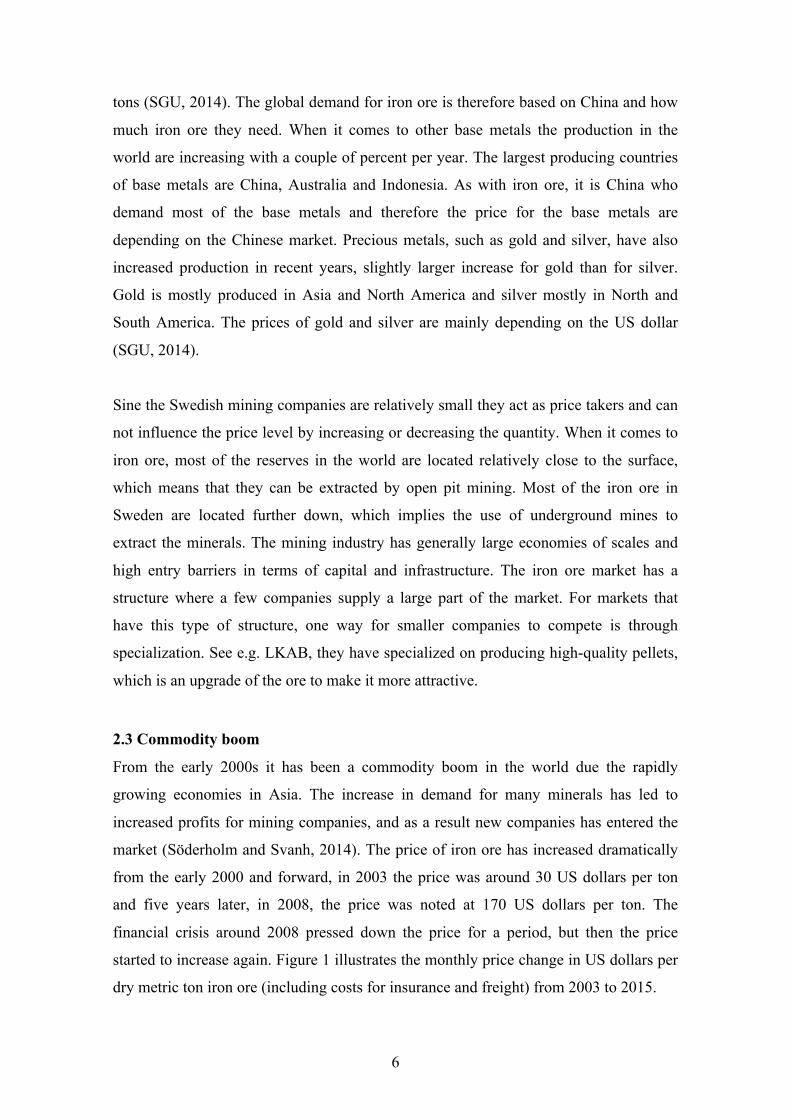
market (Söderholm and Svanh, 2014). The price of iron ore has increased dramatically
from the early 2000 and forward, in 2003 the price was around 30 US dollars per ton
and five years later, in 2008, the price was noted at 170 US dollars per ton. The
financial crisis around 2008 pressed down the price for a period, but then the price
started to increase again. Figure 1 illustrates the monthly price change in US dollars per
dry metric ton iron ore (including costs for insurance and freight) from 2003 to 2015.

7
Figure 1: Iron ore monthly price in US dollars per dry metric ton
Source: Indexmundi (2015)
During the period of price increases it has become more lucrative to extract iron ore,
and the existing mining companies has increased their production and new mines has
opened in northern Sweden. Employment in the mining sector has also increased and
new jobs have been created. However, over the past year the prices on iron ore has
fallen and the consequence of that have been reduced revenues for the iron ore
companies. Two companies in Sweden, Northland Resources and Dannemora mineral,
have gone bankrupt and the only remaining iron ore company in Sweden is now LKAB
and even those are facing major savings due to decreases in the price of iron ore
(LKAB, 2015).
2.4 Development in northern Sweden
In 2013 there were 12 active mines in northern Sweden, five in Norrbotten and seven in
Västerbotten. In Norrbotten, Kirunavaara, Gruvberget, Malmberget and Tapuli are
extracting iron ore and Aitik is extracting base metals, mainly copper. In Västerbotten,
Björkdal, Kankberg and Svartliden extracts gold and Renström, Norrliden, Maurliden
and Kristineberg extracting base metals (SGU, 2014). As described earlier in this
8
chapter the price of iron ore has decreased the last years and the mine in Pajala, Tapuli,
has been closed. However, the mining industry in northern Sweden has increased
considerably over the last decade. For example, the number of employees in the mining
sector increased over 30% between 2003 and 2013 (Statistics Sweden, 2015). During
the commodity boom investments in the mining industry in northern Sweden has been
considerable, and a large part of total industry investments in Sweden are made in
northern Sweden (Swedish mineral strategy, 2013). The production of ore is planned to
increase by 75% to 2020, from the level produced in 2011 (ibid). Based on this the
future for the mining industry in northern Sweden looks very positive. However, there
is a concern for the effects of the current price decreases, implying that the future for the
mining in northern Sweden is more uncertain than it was a few years ago.
9
CHAPTER 3
LITERATURE REVIEW
The objective of this chapter is to present previous research in the area. The overview
concentrates on the most relevant articles and begins with the search strategy that were
used to find the articles, and then continues with a brief review of each article, followed
by a table with short information of each article. Finally, conclusions based on the
literature review are presented.
3.1 Search strategy
In order to find relevant literature several databases have been used, the most frequently
used databases are Google Scholar and Scopus. In addition to that, several studies have
been found by going through references in interesting studies to find more similar
articles. These studies have then been found by searching the web for the references.
The words used in searches for literature are:
• Benefit-sharing
• Local multiplier
• Job multiplier
• Input-output model
• Mining industry
3.2 Previous literature
Below is a brief summary of relevant articles. The summary is divided into two types of
articles, first the articles that use an input-output model and then the articles that use an
econometric model.
3.2.1 Input-output model
The input-output model describes flows from industries and institutions and how an
input in one industry can be an output in another. The model describes how the different
10
parts of the society are dependent of each other, and it combines economic and
demographic variables. An example of an input-output model is the Swedish model
rAps that are based on five different modules. The first module is population, where a
baseline for the future population is calculated. The outline from module 1 produce
input to module 2, the labor market, which estimates the size of the workforce. Module
3 is the regional economy, which includes calculation of production, incomes and
demand for labor. Module 4 is the housing market, which is based on results from
module 1, population. Several interactions between module 2 and 3 is made in order to
balance the labor market with the regional market. The last is module 5, the
municipality, where the results breaks down into details, and the income and
expenditures for the municipality is calculated with respect to taxes (Sweden statistics,
2015). The model then produces a job multiplier, which can for example be calculated
as the effects of a new mine.
Ejdemo and Söderholm (2010) investigate the impacts on the regional economy when a
relatively large iron ore mine opens up in a small town in the northern Sweden (Pajala).
They estimate the local job multiplier with the rAps model discussed above. The model
is delivered by the Swedish agency for economic and regional growth, with data from
the Central Bureau of Statistics in Sweden. The study shows that the job multiplier is
between 2 and 2.5 for the maximum production phase, which implies that for each new
mining job created, two to two and a half new jobs are created in other sectors.
Hansson et al. (2010) investigate the future need of workers in the three mining
communities in Norrbotten, Gällivare, Pajala and Kiruna. In order to do this, the
authors’ counts the numbers of jobs directly needed in the mining industry in the future
and then they multiply that number with the job multiplier to get the total number of
labor needed. To find out the job multiplier they use the same rAps input-output model
that Ejdemo and Söderholm used. The result shows a job multiplier between 0.5 and 1.7
depending on which municipality they estimate the job-multiplier for. It is estimated
that the multiplier for Pajala is between 1.4 and 1.5, which is lower than the result
Ejdemo and Söderholm get in their study. The difference depends mostly on different
assumptions made by the author’s. Hansson gives an example for the mines in Pajala,
assuming that all goods and services that the mine demand can be supplied by the local
society and do not need to be imported from other parts of the country. For example,
11
there is a local manufacture that makes the mining machines instead that these machines
are imported from other parts of the country. Then the multiplier would increase to 2.5
for the mine in Pajala. Depending on how strong the assumptions are regarding how
much the local society supplies the demand from the mines, the higher will the
multiplier be.
Leaming (2007) study the expected direct and indirect benefits from the Rosemont
copper mine in Arizona, USA. The mine is located in the Helvetia and Rosemont
mining district, which is in the eastern Pima County, Arizona. Direct and indirect
benefits for three regions are examined, first the impacts in the local economy in Pima
county, then in the whole Arizona, and finally across the whole United States. The
direct impacts are calculated from the direct income for workers at the mining company,
income to other businesses due to the establishment of the mine, and the direct revenue
to the local government in form of taxes. In this study, like the two studies above the
indirect number of jobs created from the mining are calculated using the job multiplier,
the way the job multiplier is estimated is also the same and it is through an input-output
model. The results indicate that Pima County will get around 500 jobs directly and in
total near 1700 jobs, in the entire Arizona 2950 new jobs will be created, and in the
entire United States around 11 000 jobs. This translates into a job multiplier of 3.4 for
Pima County, 5.9 for Arizona and 22 for the entire country. The two Swedish studies
above have not calculated the multiplier for the whole country.
3.2.2 Econometric model
The articles described below use an alternative way, compared to the input-output
model, to estimate the local job multiplier, as they use a simple econometric model. The
econometric model measures the elasticity of employment change for a specific sector
with respect to change in another sector over a certain time period. This elasticity is
then multiplied by a ratio in order to get the specific job multiplier.
Fleming and Measham (2014) examine the local job multiplier of mining in Australia
by using an econometric model. The econometric model measures the difference in
employment in a specific sector with respect to the difference in employment in the
mining sector. There are two different samples for the study, one with all sub-state

12
regions in Australia and one that is limited to the mining regions, in order to see if there
are any differences between the mining regions and other regions. To estimate the
multiplier the author use statistics on the number of employment in the mining sector
and in other sectors over two time periods. The data is then put into the econometric
model and the result show that the elasticity for the sectors that are statistically
significant is between 3 and 13% for the full sample and for the limited sample between
12 and 23%. The job multiplier is around 7 for the full sample and 1.4 for the limited.
For the full sample the 1.4 new jobs from the limited sample are included plus all other
new jobs created in the country because of the mining industry.
Moretti (2010) examines how the employment changes over time in the tradable and
non-tradable sectors due to an increase in the number of jobs in the tradable sector from
an exogenous parameter. In the tradable sector the produced goods are traded at the
international market, and the price of the goods cannot be determined locally. In a non-
tradable sector the price is set locally, and it can for example be education or a real-
estate broker. The objective of this study is to estimate the local job multiplier in the
tradable and non-tradable sector when an increase in the number of jobs in the tradable
sector occurs. The results show that the multiplier is different depending on the type of
job that is created. For a new job in manufacturing there will be 1.6 new jobs in the non-
tradable sector, and for a new skilled job there will be 2.5 new jobs in the non-tradable
sector. The results of the study indicate that the local job multiplier is higher for skilled
jobs than for non-skilled jobs.
Moretti and Thulin (2012) examine what happens when a local economy attracts a new
business that creates jobs to the local society. When a new job is created in the tradable
sector it will lead to new jobs in the non-tradable sector. The author’s estimates the
local job multiplier in order to see how many other jobs that will be created. The
multiplier is found by comparing the change in the number of jobs in the tradable and
the non-tradable sector. The study has been made both in Sweden and the US, and the
results from Sweden and US are compared to se if there are any differences in the two
countries. The results from the study indicate that the multiplier is larger in the US than
it is in Sweden, since an increase of one job in the tradable sector in Sweden gives 0.48
new jobs in the non-tradable sector and in the US the same increase lead to around 1.6
new jobs in the non-tradable sector. Both in Sweden and the US the job multiplier of

13
adding one high skilled worker is higher than for a normal worker, around 2.5 new jobs
in the non-tradable sector in the US and around 3 new jobs in Sweden.
Van Dijk (2014) criticizes Moretti and the studies he made 2010, and the one in 2012
that he made together with Thulin. Van Dijk repeats Morettis estimates and get
approximately the same results. However, he also creates a new estimate with the same
data where he changes five things to improve the estimate. The changes are:
• “Remove industries from the analysis that are not observed in every period”
• “Do not treat mining and agriculture as non-tradable industries”
• “Use a more shift-share instrument”
• “Weigh both time intervals in the dataset equally”
• “Provide a more accurate estimate for the relative size of the non-tradable sector
to the tradable sector.”
When Van Dijk makes these changes, he still concludes that there is a positive job
multiplier, but it is significantly smaller than the one Moretti calculated. A new job in
the tradable sector will result in 1.02 new jobs in the non-tradable sector, compared to
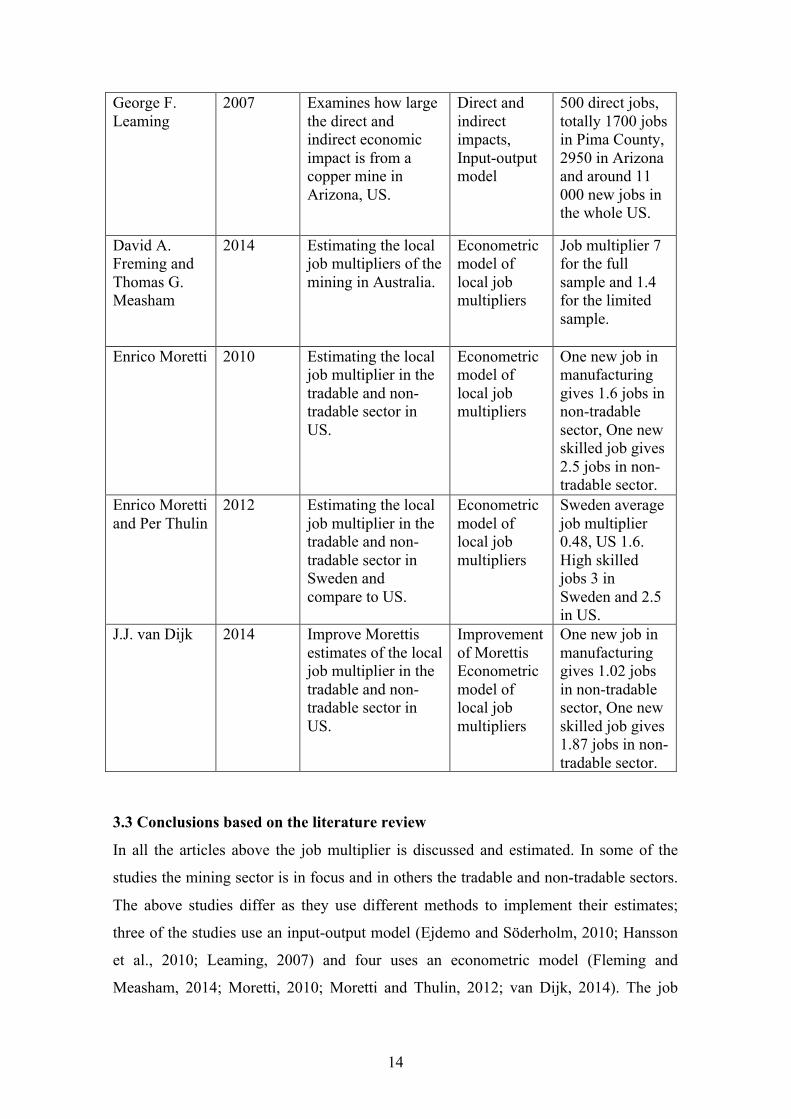
1.6 that Moretti estimated. Table 2 below summarizes the literature described in this
chapter.
Table 2: Overview of Relevant Literature
Author Publishing Year
Objective Method Results
Thomas Ejdemo and Patrik Söderholm
2011 Evaluate the regional economic impacts of a iron ore mine in the northern Sweden.
Input-Output model rAps
Average job multiplier of 2-2.5 during maximum production.
G. Hansson, A-K. Lundström, P. Malmsten, C. Anderstig, J. Börjesson and C. Annetorp Hörnsten
2010 Examines future labor needs in three mine sites in the northern Sweden.
Input-Output model rAps
Local job multiplier between 0.5 and 1.7.
14
George F. Leaming
2007 Examines how large the direct and indirect economic impact is from a copper mine in Arizona, US.
Direct and indirect impacts, Input-output model
500 direct jobs, totally 1700 jobs in Pima County, 2950 in Arizona and around 11 000 new jobs in the whole US.
David A. Freming and Thomas G. Measham
2014 Estimating the local job multipliers of the mining in Australia.
Econometric model of local job multipliers
Job multiplier 7 for the full sample and 1.4 for the limited sample.
Enrico Moretti 2010 Estimating the local job multiplier in the tradable and non-tradable sector in US.
Econometric model of local job multipliers
One new job in manufacturing gives 1.6 jobs in non-tradable sector, One new skilled job gives 2.5 jobs in non-tradable sector.
Enrico Moretti and Per Thulin
2012 Estimating the local job multiplier in the tradable and non-tradable sector in Sweden and compare to US.
Econometric model of local job multipliers
Sweden average job multiplier 0.48, US 1.6. High skilled jobs 3 in Sweden and 2.5 in US.
J.J. van Dijk 2014 Improve Morettis estimates of the local job multiplier in the tradable and non-tradable sector in US.
Improvement of Morettis Econometric model of local job multipliers
One new job in manufacturing gives 1.02 jobs in non-tradable sector, One new skilled job gives 1.87 jobs in non-tradable sector.
3.3 Conclusions based on the literature review
In all the articles above the job multiplier is discussed and estimated. In some of the
studies the mining sector is in focus and in others the tradable and non-tradable sectors.
The above studies differ as they use different methods to implement their estimates;
three of the studies use an input-output model (Ejdemo and Söderholm, 2010; Hansson
et al., 2010; Leaming, 2007) and four uses an econometric model (Fleming and
Measham, 2014; Moretti, 2010; Moretti and Thulin, 2012; van Dijk, 2014). The job

15
multiplier has been estimated by the econometric model in Sweden, but only for the
tradable and non-tradable sectors (Moretti and Thulin, 2012). No previous attempts to
estimate the job multiplier for the mining industry in Sweden with the econometric
approach have to the best of our knowledge been performed. This approach has though
been applied to the mining industry in Australia. The job multiplier for the Swedish
mining industry has previously been estimated with the traditional input-output model.
One general conclusion from these studies is that the results vary considerably
depending on the assumptions made. The econometric method Moretti (2010) presented
gives an alternative way to estimate the job multiplier. This method avoids some of the
potential error specifications that can occur with the input-output model. However, Van
Dijk argues that there are some drawbacks with the method, mainly since it is possible
that the method overestimates the job multiplier when it examines the impact of a
change in the employment in the tradable sector on the employment in the non-tradable
sector. The criticism is especially true when using the econometric approach to estimate
the tradable and non-tradable, which not is the objective of this study. Since the
econometric approach has not been used to estimate the job multiplier of the mining
industry in Sweden there is a gap in the previous literature that this study aims to fill.

16
CHAPTER 4
THEORETICAL FRAMEWORK
The objective of this chapter is to present the theoretical framework of this study, which
is mainly the theories behind the linkage between the mining sector and other sectors,
the job multiplier and Moretti’s theoretical framework behind the multiplier.
4.1 Staple theory
Staple theory describes the economic linkages between the mining industry and the
local economy. The theory is used to analyze the local effects of extracted natural
resources, which are exported outside the region (Gunton, 2003). The mining industry
in northern Sweden provides a good example of an industry where the resource is
exported, but where the extraction creates spillovers to the rest of the society. In staple
theory, the linkages of the effects from the industry are divided into four different
sectors: Forward, backward, demand and fiscal linkages.
• Forward linkages means that the mineral from the mining industry can be used
as a raw material in another local industry. An example of this is that the mining
industry in Norrbotten delivers iron ore to the steel industry in Norrbotten.
• Backward linkages are the production of inputs that are used in the mining
industry. For example, suppliers needed for investments and services for
example machinery and infrastructure. According to Ejdemo (2011) these types
of impacts can be reduced because of the fly-in-fly-out practices of the mining
sector.
• Demand linkages refer to the production of goods that are being produced
because of the increased demand from employed in the mining industry, for
example consumer goods.
• Fiscal linkages, which is the enlargement of the public revenues when taxes
from the mining industry goes directly to the local government. This means that
the local government has more money to spend and invest in the local communi-
ty.
17
The size of the spillover from the mining industry will depend on how well the local
community can take advantage of the opportunities offered by the mining industry. An
example of this is that the job multiplier will be greater for a larger area, if there is one
new job created in the local area because of the mines and totally two new jobs in the
whole country, the local community have only been able to take advantage of some of
the spillover (Leaming, 2007).
4.2 Job multiplier
A multiplier is the marginal effect that occurs when one economic variable changes
because of a change in another economic variable. In this case the change is in the
employment in the mining sector, and the other economic variable is the change in
employment in other sectors. This implies that the job multiplier in this case describes
how many jobs that will be created in other sectors of the economy, when one new job
in the mining sector is created.
The framework for the theory that Moretti (2010) use to estimate the local job multiplier
is based on an econometric model, which determines the impact on the employment in
the non-tradable sector when an exogenous change in the number of jobs in the tradable
sector occurs. The tradable sector represents the industries that trade goods at the
international market and the prices of the produced products are set internationally.
Non-tradable sector is the sector that is available locally and where prices are set
locally, such as housing brokers, health care and education. It is assumed that the local
community are an own competitive economy that produce traded goods x1, x2, x3,….xn
that are traded on the international market and the price are set there, and non-traded
goods z1, z2, z3,…..zn where the price are set locally. It is further assumed that labor can
move between sectors in the local community and that labor is perfectly mobile, which
is an assumption that is likely to hold in the long run. The model thus assumes that
workers are free to move between cities, and that the local labor supply has an upward
slope that depends on the valuations of leisure, how the residents are distributed and
how mobile people are between cities. The higher the mobility is geographically, the
higher is also the elasticity of labor supply. Suppose now that there is an exogenous
shock to the market and the demand for labor increases permanent in x1. The direct
effect of this is that the number of employees in x1 increases. The indirect effect is what
18
happens for the rest of the traded good markets x2, x3,….xn and the non-traded good
markets z1, z2, z3,…..zn.
4.2.1 Multiplier for the non-tradable sector
When the exogenous shock occurs and employment in x1 increases, the budget in the
local community increases, both because of higher local taxes and because of more
workers and higher wages. When the budget constraint increases, the demand for non-
traded goods z1, z2, z3,…..z increases and the number of employees in restaurants,
health care, education and other similar jobs increase. These new jobs are divided
between people that are moving to the area and people who already live there. How the
distribution looks depends on the degree of mobility. The size of the multiplier effect
depends on three factors:
• The technology, since a labor-intensive technology provides a higher
multiplier. It will also depend on the preferences for the non-tradable goods
locally.
• The type of jobs that are created in the tradable sector, since high skilled jobs
with higher wages will generate a larger multiplier and create more jobs in the
non-tradable sector. This because the higher wage give the workers more
money to spend on local services.
• The opposing effects on wages and prices since the exogenous shock increases
the cost of labor, which can lead to a decline in the supply of local services.
This decrease can partially equalize the increase that occurred in local ser-
vices. If the supply of labor is elastic the crowding out effect will be smaller
and the multiplier will be larger.
4.2.2 Multiplier for the tradable sector
The external shock to x1 may also effect the other tradable sectors x2, x3,….xn. It is
though unclear if the effect will be positive or negative. The effect will however depend
on three different forces:
• When the cost for labor increases locally because of the new jobs in x1 that will
have a negative effect on the other actors at the market x2, x3,….xn due to higher
costs. Unlike the non-tradable sectors, the prices are set internationally and it is
not possible to change them locally. In the long term this can cause business in

19
the tradable sector to move their production to places where the labor are less
expensive.
• The increased output of x1 may lead to an increasing demand for intermediate
goods and services. This can affect the other companies in the tradable sector,
depending on how dependent they are to the international market. If they are not
completely dependent on the international market this can give a positive effect.
• Companies that are similar or have related activities tend to place their business
close to each other, which can have a positive effect in the tradable sector.
4.3 Discussion
As this study is intended to examine the job multiplier of the mining industry in
northern Sweden it is important to understand the linkages from the mining industry to
the rest of the society. The staple theory illustrates these linkages and shows which
types of connections there are between mining and other actors in the society. The
theoretical framework that explains how an exogenous shock creates new jobs can
easily be adapted to the mining industry. The mining industry is dependent on the price
of the resource that they are extracting, which can explain the increases in sales the last
ten years and also an increase in the number of employees. The theoretical framework is
related to the method applied in the study, since the study will use the basic idea of how
an exogenous shock in the mining industry affects the rest of the local society. The
econometrics will be performed with data from a time period when the number of
mining employment increased mainly because of increased prices.

20
CHAPTER 5
METHODOLOGY
The objective with this chapter is to present the methodology and the econometric
model used to estimate the job multiplier from the mining industry to other sectors in
the local economy in northern Sweden.
5.1 Methods to estimate the local job multiplier
When estimating the local job multiplier either an input-output model or an econometric
model can be used. The most frequently used method is an input-output model. The
input-output model is a model that produces local multipliers in regional economies due
to different exogenous effects. Input-output models are based on large amounts of data
that are combined in order to describe the linkages between different industries and
local markets. The combinations will together represent the local economy (Ejdemo and
Söderholm, 2011). In Sweden there is an input-output model called rAps provided by
Statistics Sweden. Figure 2 shows a schematic overview of the rAps-model in order to
provide an example of what an input-output model can look like.
Source: Statistic Sweden (2015)
Figure 2: The rAps-model
21
However, there are some drawbacks with the input-output model and there are studies
that show that the method often cannot generate reliable estimates (Fleming and
Measham, 2014). One drawback is that input-output models are based on strong
assumptions, e.g., that regional suppliers, including labor, are perfectly elastic (Weber,
2012). Another limitation of the input-output model is that it is based on equations that
define present conditions, which means that it cannot predict changes over time
(Kilkenny and Partridge, 2009). The models also ignore that there may be a reduced
number of jobs in other sectors, because the labor has become more expensive. And one
last drawback is that they also ignore that businesses that are similar often position
themselves close to each other.
However, the econometric model also has drawbacks. One drawback that van Dijk
(2014) discusses is that the model can overestimate the job multiplier when applied on
the tradable and non-tradable sectors. One reason for this is that industries can be a part
of different sectors during the time periods. To avoid this, this study use the SNI 2007
as a base for the data during the whole time period. Another issue is that the mining
industry and agriculture are treated as non-tradable sectors, which not is an issue in this
study because it does not treat any industry as non-tradable sector. As the drawbacks
arise when the model is used in the tradable and non-tradable sectors, and not on the
mining industry, it is not possible to do all the changes that Van Dijk suggests.
Because of the shortcomings with the input-output model and also because the input-
output model earlier have been applied in northern Sweden, this study will use the
econometric method that Moretti (2010) presented. The original method uses two types
of sectors, the tradable and non-tradable sectors. This study will use the mining sector
and other sectors, similar to the Fleming and Measham (2014) study. To find out how
many jobs the mining industry in Norrbotten generates to other sectors, data for 2003,
2008 and 2013 are collected. The data are then used to create two time periods 2003-
2008 and 2008-2013. Two time periods are used to see if there is any difference
between them. The time period 2003 to 2013 has been chosen because of the increase in
the number of employees in the mining industry during this time period. If no increase
in the number of jobs in the mining industry had occurred during the time period, it is
not meaningful to estimate the job multiplier. All data were collected from the Central
22
Bureau of Statistics in Sweden. The data represents employment in the mining sector in
municipalities in northern Sweden and in other sectors in the same municipalities.
5.2 Econometric specification
The econometric model used to estimate the relationship between the changes over time
in mining employment in a region and change over time in non-mining employment in
the same region is given by the model that Flemming and Measham (2014) use to
estimate the multiplier of the mining industry in Australia 2014. This is the same
econometric model that Moretti (2010) started to use, but designed for the mining
industry. The model estimates how many jobs in the non-mining sectors that are created
when one new job in the mining sector is created. This is also called the local job
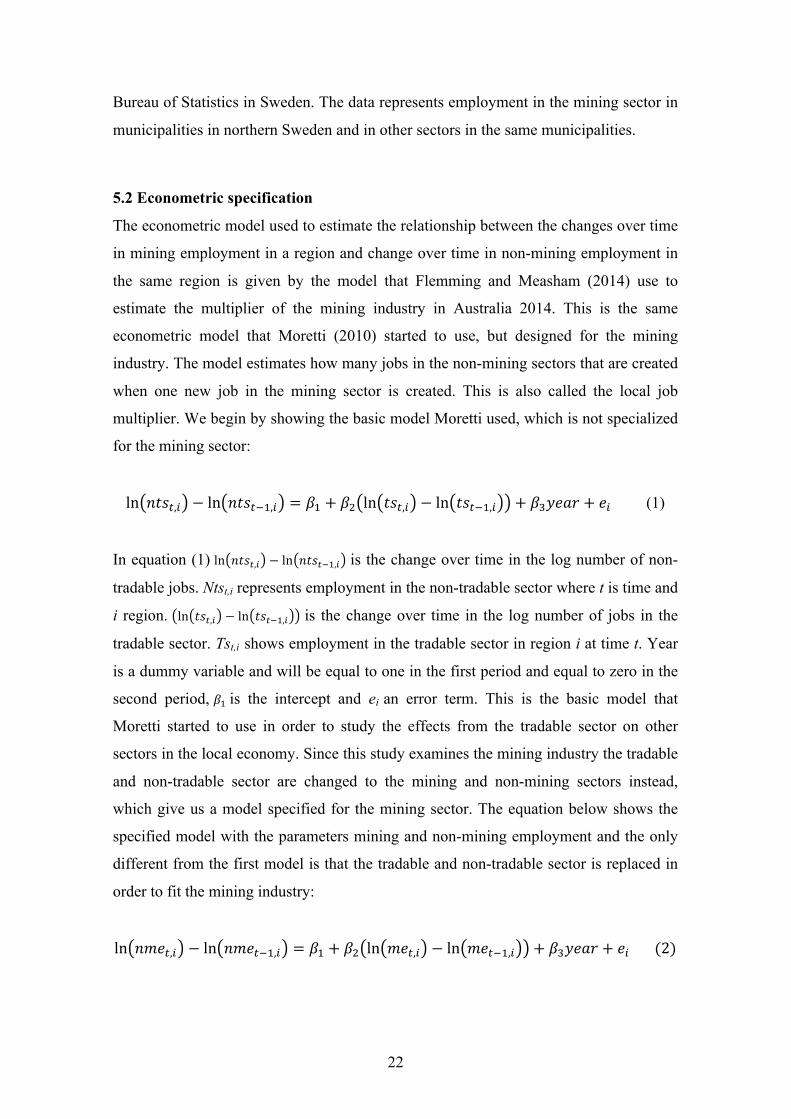
multiplier. We begin by showing the basic model Moretti used, which is not specialized
for the mining sector:
ln 𝑛𝑡𝑠!,! − ln 𝑛𝑡𝑠!!!,! = 𝛽! + 𝛽! ln 𝑡𝑠!,! − ln 𝑡𝑠!!!,! + 𝛽!𝑦𝑒𝑎𝑟 + 𝑒! (1)
In equation (1) ln 𝑛𝑡𝑠!,! − ln 𝑛𝑡𝑠!!!,! is the change over time in the log number of non-
tradable jobs. Ntst,i represents employment in the non-tradable sector where t is time and
i region. ln 𝑡𝑠!,! − ln 𝑡𝑠!!!,! is the change over time in the log number of jobs in the
tradable sector. Tst,i shows employment in the tradable sector in region i at time t. Year
is a dummy variable and will be equal to one in the first period and equal to zero in the
second period, 𝛽! is the intercept and ei an error term. This is the basic model that
Moretti started to use in order to study the effects from the tradable sector on other
sectors in the local economy. Since this study examines the mining industry the tradable
and non-tradable sector are changed to the mining and non-mining sectors instead,
which give us a model specified for the mining sector. The equation below shows the
specified model with the parameters mining and non-mining employment and the only
different from the first model is that the tradable and non-tradable sector is replaced in
order to fit the mining industry:
ln 𝑛𝑚𝑒!,! − ln 𝑛𝑚𝑒!!!,! = 𝛽! + 𝛽! ln 𝑚𝑒!,! − ln 𝑚𝑒!!!,! + 𝛽!𝑦𝑒𝑎𝑟 + 𝑒! (2)
23
In the model above ln 𝑛𝑚𝑒!,! − ln 𝑛𝑚𝑒!!!,! is the change over time in the log number of
jobs in the non-mining sector. Nmet,i shows employment in another sector in time t and
region i. ln 𝑚𝑒!,! − ln 𝑚𝑒!!!,! is the change over time in the log number of jobs in the
mining sector. Met,i represents employment in the mining industry in region i at time t.
Year is a dummy variable and will be equal to one in the first period and equal to zero
in the second period, 𝛽! is the intercept and ei is an error term.
This econometric specification will be estimated for a number of sectors in northern
Sweden. The same econometric specification will be used to estimate the relationship
between different sectors, and then all other sectors except the mining sector are put
together in order to find the total effect. This estimation will give the elasticity for each
non-mining sector to a change in the mining employment. From the estimated
elasticities it is then possible to calculate the local multiplier for every sector, which is
done by multiplying their value by the ratio, the ratio is obtained by the following
equation:
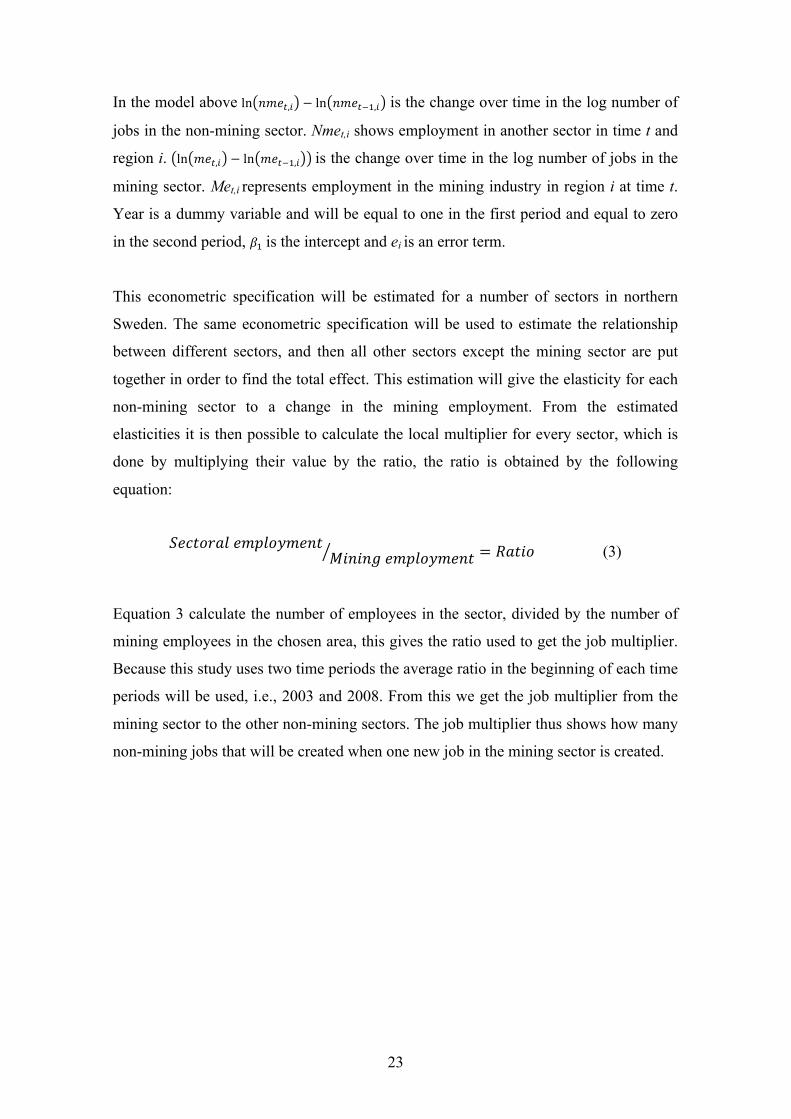
𝑆𝑒𝑐𝑡𝑜𝑟𝑎𝑙 𝑒𝑚𝑝𝑙𝑜𝑦𝑚𝑒𝑛𝑡
𝑀𝑖𝑛𝑖𝑛𝑔 𝑒𝑚𝑝𝑙𝑜𝑦𝑚𝑒𝑛𝑡 = 𝑅𝑎𝑡𝑖𝑜 (3)
Equation 3 calculate the number of employees in the sector, divided by the number of
mining employees in the chosen area, this gives the ratio used to get the job multiplier.
Because this study uses two time periods the average ratio in the beginning of each time
periods will be used, i.e., 2003 and 2008. From this we get the job multiplier from the
mining sector to the other non-mining sectors. The job multiplier thus shows how many
non-mining jobs that will be created when one new job in the mining sector is created.
24
CHAPTER 6
DATA SOURCES
The purpose of this chapter is to discuss the data sources that have been used to collect
data for this study. The chapter will also present the collected data in forms of tables
and text.
6.1 Employment data
In order to estimate the local job multiplier with the econometric model presented in the
previous chapter, data over the number of employees in different sectors has been
collected. Data on the number of employees in the mining sector has then been
compared against the data in other sectors, as suggested by Moretti (2010). To get the
number of employees in different sectors in different towns in Sweden, data from the
Central Bureau of Statistics are used. This is the most common way to collect this type
of data and previous studies have used similar data see e.g., Ejdemo and Söderholm
(2011) who used data from the Central Bureau of Statistics in Sweden and Fleming and
Measham (2014) who used data from The Central Bureau o Statistics in Australian.
The collected data from the Central Bureau of Statistics are divided into 17 different
sectors. One of the sectors represents the mining sector and the other 16 sectors are
divided after SNI2007. SNI stands for standard for Swedish classification of economic
activities, which is a standard classification of sectors in Sweden. SNI2007 is the
newest standard from Statistics Sweden, which replaced the previous standard SNI2002
a few years ago. SNI2007 is divided into the following 16 sectors; agriculture, forestry
and fishing, manufacturing and mining, energy and environment, contraction, retail
trade, transport, hotels and restaurants, information and communication, credit
institutions and insurance companies, real estate, business services civil authorities and
military, education, health and social care, personal and cultural services and finally
unknown. The manufacturing sector also includes mining, therefore mining has been

25
subtracted from this category in order not to double counted when mining is an own
sector.
Northern Sweden, in this case Norrbotten and Västerbotten are divided into 29
municipalities, for each of these municipalities data over the 16 sectors plus the mining
sector are collected. The total number of employment in the different sectors in
Norrbotten and Västerbotten for the year, 2003, 2008 and 2013 are presented in table 3
below.
Table 3: Number of jobs in Norrbotten and Västerbotten 2003-2013
Source: Central Bureau of Statistics in Sweden (2015)
As we can see in the table, the total number of employees increases during the time
periods in most of the individual sectors, except a few. The sector that most clearly
decreases during the time periods is manufacturing, and especially between 2008 and
2013. One reason for this could be the financial crisis that occurred late in 2008. There
are also sectors that stand out in a positive sense, where the increase in number of
employees has been large, e.g., agriculture, forestry and fishing where the number is
more than doubled. In order to see the change in total population during the time period
from 2003 to 2013 the total population for Norrbotten and Västerbotten are presented in
Number of jobs in sectors in Norrbotten and Västerbotten 2003-2013Economic sector 2003 2008 2013Mining 3845 4449 5622Agriculture, forestry and fishing 4482 5908 9519Manufacturing 30699 30967 26615Energy and environment 2821 3030 3425Contruction 13642 17940 19973Retail trade 20655 22742 22893Transport 11989 11998 12347Hotels and restaurants 5285 6443 7450Information and communication 5768 6007 6170Credit institutions and insurance companies 3001 2994 3001Real estate 2763 3273 3453Business Services 14245 19875 22188Civil authorities and military 14099 14155 15895Education 29920 28365 28852Health and social care 45344 46781 49023Personal an cultural services 9155 9339 9939Unknown 2905 2842 3301Total 220618 237108 249666
26
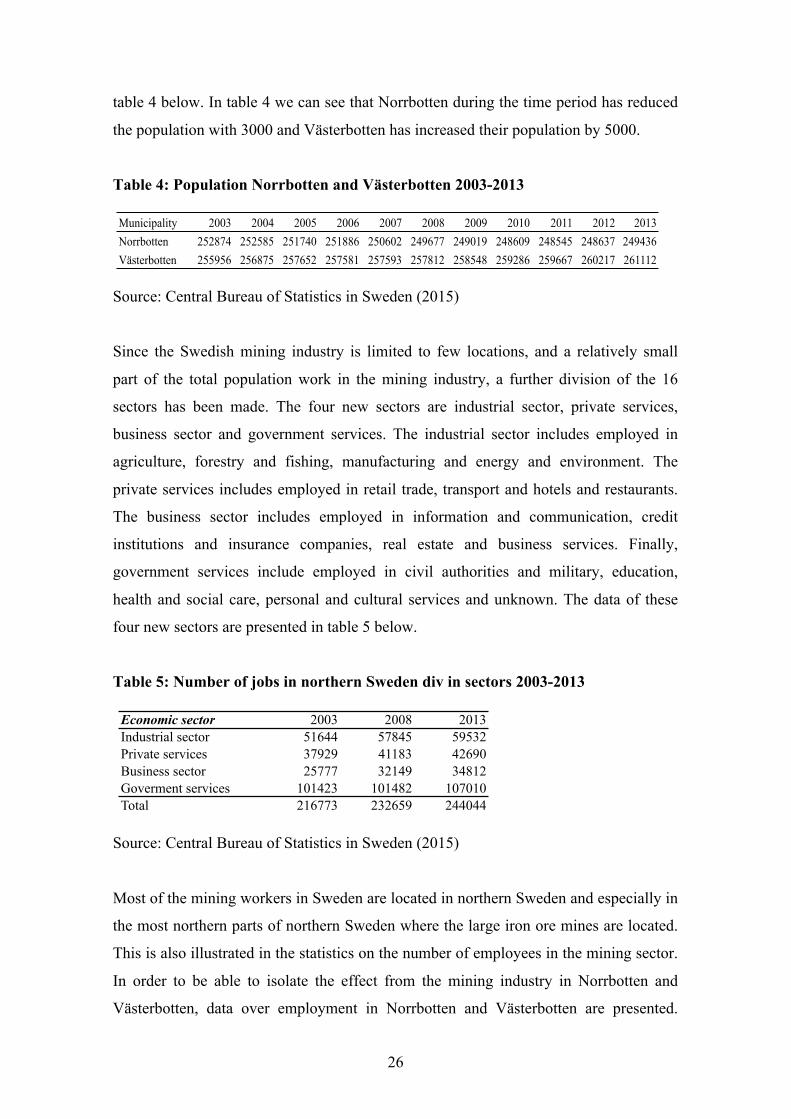
table 4 below. In table 4 we can see that Norrbotten during the time period has reduced
the population with 3000 and Västerbotten has increased their population by 5000.
Table 4: Population Norrbotten and Västerbotten 2003-2013
Source: Central Bureau of Statistics in Sweden (2015)
Since the Swedish mining industry is limited to few locations, and a relatively small
part of the total population work in the mining industry, a further division of the 16
sectors has been made. The four new sectors are industrial sector, private services,
business sector and government services. The industrial sector includes employed in
agriculture, forestry and fishing, manufacturing and energy and environment. The
private services includes employed in retail trade, transport and hotels and restaurants.
The business sector includes employed in information and communication, credit
institutions and insurance companies, real estate and business services. Finally,
government services include employed in civil authorities and military, education,
health and social care, personal and cultural services and unknown. The data of these
four new sectors are presented in table 5 below.
Table 5: Number of jobs in northern Sweden div in sectors 2003-2013
Source: Central Bureau of Statistics in Sweden (2015)
Most of the mining workers in Sweden are located in northern Sweden and especially in
the most northern parts of northern Sweden where the large iron ore mines are located.
This is also illustrated in the statistics on the number of employees in the mining sector.
In order to be able to isolate the effect from the mining industry in Norrbotten and
Västerbotten, data over employment in Norrbotten and Västerbotten are presented.
Municipality 2003 2004 2005 2006 2007 2008 2009 2010 2011 2012 2013Norrbotten 252874 252585 251740 251886 250602 249677 249019 248609 248545 248637 249436Västerbotten 255956 256875 257652 257581 257593 257812 258548 259286 259667 260217 261112
Economic sector 2003 2008 2013Industrial sector 51644 57845 59532Private services 37929 41183 42690Business sector 25777 32149 34812Goverment services 101423 101482 107010Total 216773 232659 244044
27
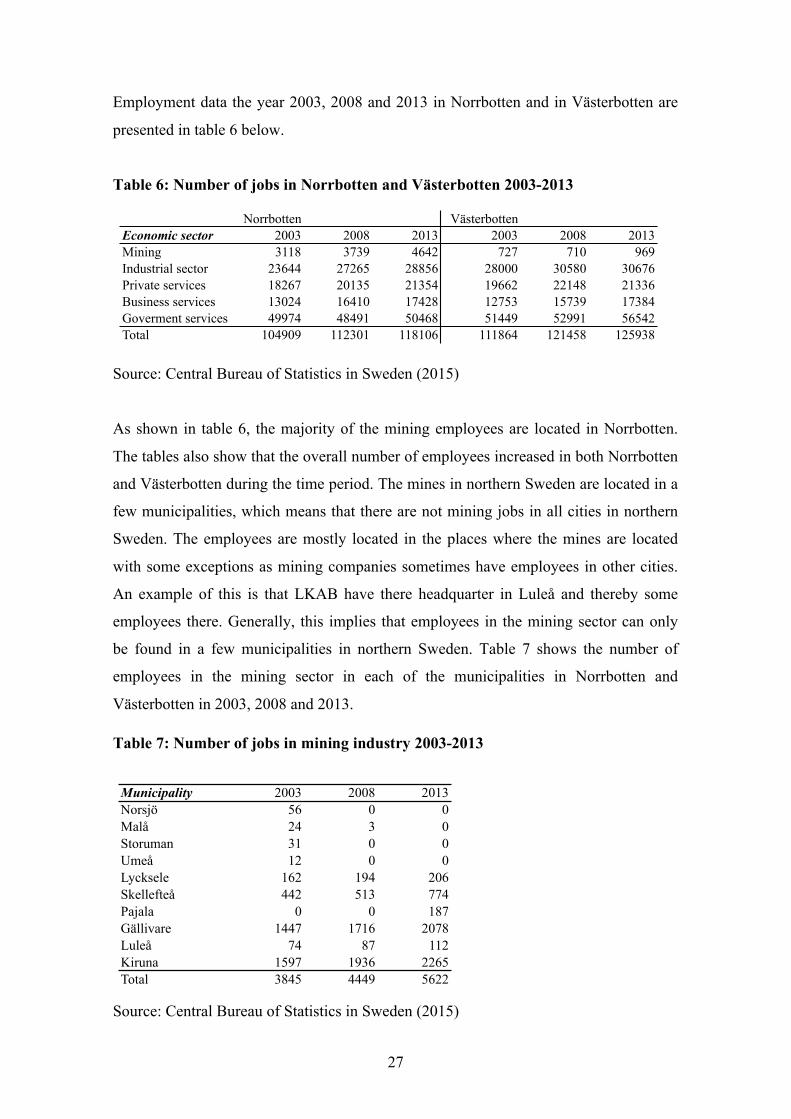
Employment data the year 2003, 2008 and 2013 in Norrbotten and in Västerbotten are
presented in table 6 below.
Table 6: Number of jobs in Norrbotten and Västerbotten 2003-2013
Source: Central Bureau of Statistics in Sweden (2015)
As shown in table 6, the majority of the mining employees are located in Norrbotten.
The tables also show that the overall number of employees increased in both Norrbotten
and Västerbotten during the time period. The mines in northern Sweden are located in a
few municipalities, which means that there are not mining jobs in all cities in northern
Sweden. The employees are mostly located in the places where the mines are located
with some exceptions as mining companies sometimes have employees in other cities.
An example of this is that LKAB have there headquarter in Luleå and thereby some
employees there. Generally, this implies that employees in the mining sector can only
be found in a few municipalities in northern Sweden. Table 7 shows the number of
employees in the mining sector in each of the municipalities in Norrbotten and
Västerbotten in 2003, 2008 and 2013.
Source: Central Bureau of Statistics in Sweden (2015)
Norrbotten VästerbottenEconomic sector 2003 2008 2013 2003 2008 2013Mining 3118 3739 4642 727 710 969Industrial sector 23644 27265 28856 28000 30580 30676Private services 18267 20135 21354 19662 22148 21336Business services 13024 16410 17428 12753 15739 17384Goverment services 49974 48491 50468 51449 52991 56542Total 104909 112301 118106 111864 121458 125938
Municipality 2003 2008 2013Norsjö 56 0 0Malå 24 3 0Storuman 31 0 0Umeå 12 0 0Lycksele 162 194 206Skellefteå 442 513 774Pajala 0 0 187Gällivare 1447 1716 2078Luleå 74 87 112Kiruna 1597 1936 2265Total 3845 4449 5622
Table 7: Number of jobs in mining industry 2003-2013

28
Table 7 illustrates that the people who are employed in the mining sector can only be
found in a few places, and thus most of the municipalities in northern Sweden have no
mining workers. The table shows that Gällivare and Kiruna have the most mining
employees, which is natural since this is where the largest mines in Sweden are located.
From the table it can also be seen that the number of employees has increased during
the time period and there are only in four municipalities in Västerbotten where the
number of employees has decreased.
29
CHAPTER 7
EMPIRICAL RESULTS AND ANALYSIS
In this chapter the econometric results from the different regressions will be presented.
In the end of this chapter an analysis and discussion of the results will be performed.
7.1 Empirical results
As described in the previous chapter, an econometric model has been used to estimate
the results presented in this chapter. The model is used on different data sets in various
combinations to produce the results for different parts of northern Sweden. To begin
with, a regression on all the 29 municipalities in Norrbotten and Västerbotten has been
performed, according to equation (2). This is then done on smaller parts of northern
Sweden in order to get the multiplier for different areas of northern Sweden. In order to
determine the overall impact of the mining industry in northern Sweden, four
regressions where the effect of new mining jobs on all other sectors has been performed.
One with all municipalities in Norrbotten and Västerbotten, one with municipalities
where the mining employees are located in Norrbotten and Västerbotten, one with the
municipalities in Norrbotten only and one with municipalities in Västerbotten only.
There are in total 10 municipalities in Norrbotten and Västerbotten with mining
employees and this regression is made in order to investigate how the mining sector
affects the municipalities where there really are mining employees working. The one for
Norrbotten are made on all fourteen municipalities and are made because the largest
mines are located there, and as shown in the previous chapter most of the mining
employees are located in Norrbotten. For this reason, it is interesting to see how the
effect is specific for Norrbotten. The results from these four different regressions are
presented in table 8 below.
30
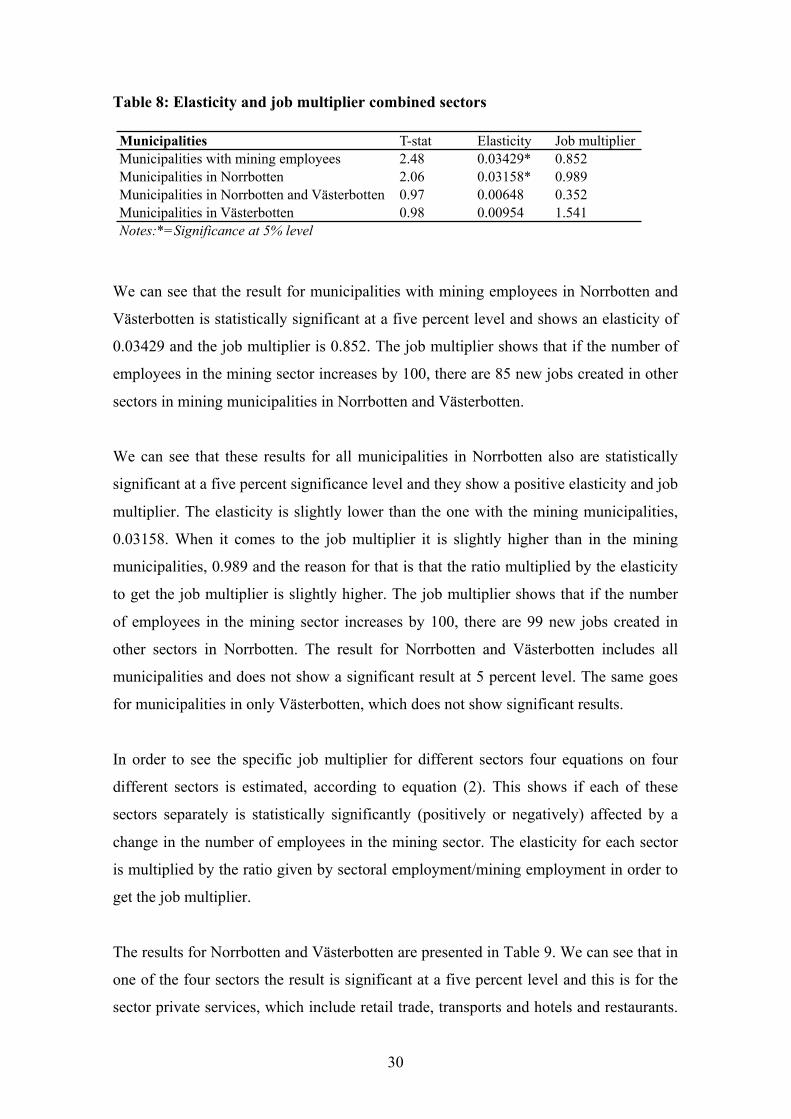
Table 8: Elasticity and job multiplier combined sectors
We can see that the result for municipalities with mining employees in Norrbotten and
Västerbotten is statistically significant at a five percent level and shows an elasticity of
0.03429 and the job multiplier is 0.852. The job multiplier shows that if the number of
employees in the mining sector increases by 100, there are 85 new jobs created in other
sectors in mining municipalities in Norrbotten and Västerbotten.
We can see that these results for all municipalities in Norrbotten also are statistically
significant at a five percent significance level and they show a positive elasticity and job
multiplier. The elasticity is slightly lower than the one with the mining municipalities,
0.03158. When it comes to the job multiplier it is slightly higher than in the mining
municipalities, 0.989 and the reason for that is that the ratio multiplied by the elasticity
to get the job multiplier is slightly higher. The job multiplier shows that if the number
of employees in the mining sector increases by 100, there are 99 new jobs created in
other sectors in Norrbotten. The result for Norrbotten and Västerbotten includes all
municipalities and does not show a significant result at 5 percent level. The same goes
for municipalities in only Västerbotten, which does not show significant results.
In order to see the specific job multiplier for different sectors four equations on four
different sectors is estimated, according to equation (2). This shows if each of these
sectors separately is statistically significantly (positively or negatively) affected by a
change in the number of employees in the mining sector. The elasticity for each sector
is multiplied by the ratio given by sectoral employment/mining employment in order to
get the job multiplier.
The results for Norrbotten and Västerbotten are presented in Table 9. We can see that in
one of the four sectors the result is significant at a five percent level and this is for the
sector private services, which include retail trade, transports and hotels and restaurants.
Municipalities T-stat Elasticity Job multiplierMunicipalities with mining employees 2.48 0.03429* 0.852Municipalities in Norrbotten 2.06 0.03158* 0.989Municipalities in Norrbotten and Västerbotten 0.97 0.00648 0.352Municipalities in Västerbotten 0.98 0.00954 1.541Notes:*=Significance at 5% level
31
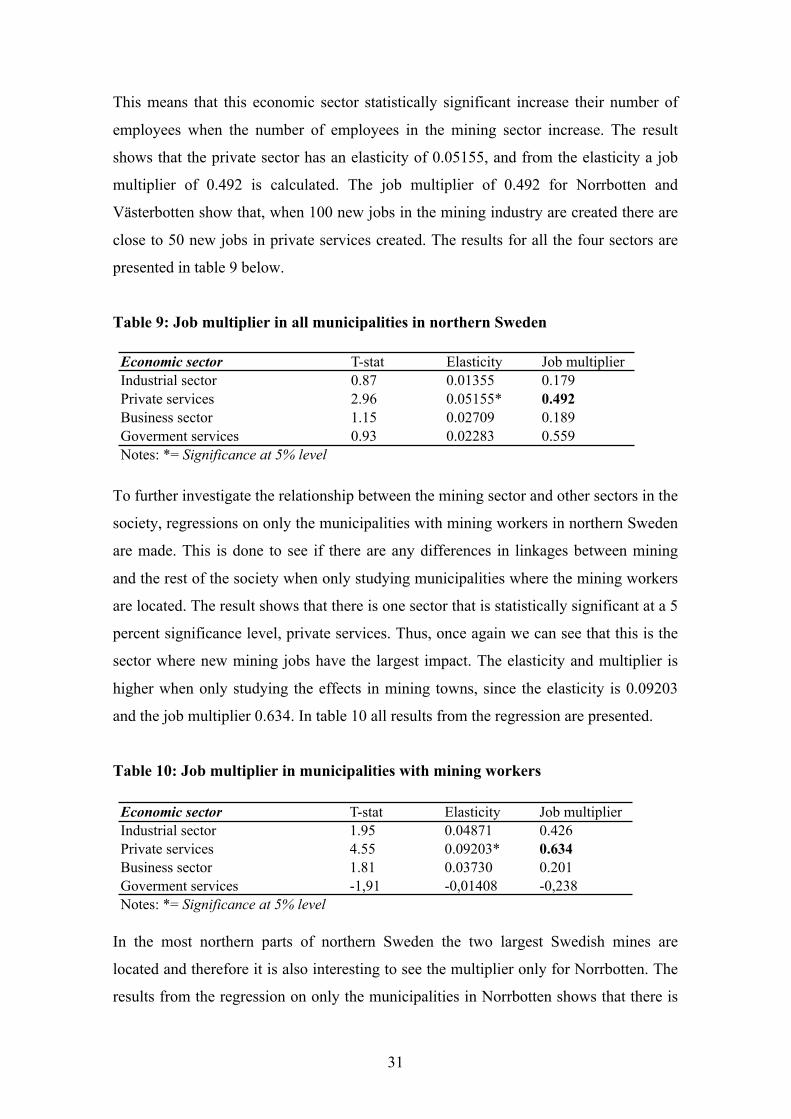
This means that this economic sector statistically significant increase their number of
employees when the number of employees in the mining sector increase. The result
shows that the private sector has an elasticity of 0.05155, and from the elasticity a job
multiplier of 0.492 is calculated. The job multiplier of 0.492 for Norrbotten and
Västerbotten show that, when 100 new jobs in the mining industry are created there are
close to 50 new jobs in private services created. The results for all the four sectors are
presented in table 9 below.
Table 9: Job multiplier in all municipalities in northern Sweden
To further investigate the relationship between the mining sector and other sectors in the
society, regressions on only the municipalities with mining workers in northern Sweden
are made. This is done to see if there are any differences in linkages between mining
and the rest of the society when only studying municipalities where the mining workers
are located. The result shows that there is one sector that is statistically significant at a 5
percent significance level, private services. Thus, once again we can see that this is the
sector where new mining jobs have the largest impact. The elasticity and multiplier is
higher when only studying the effects in mining towns, since the elasticity is 0.09203
and the job multiplier 0.634. In table 10 all results from the regression are presented.
Table 10: Job multiplier in municipalities with mining workers
In the most northern parts of northern Sweden the two largest Swedish mines are
located and therefore it is also interesting to see the multiplier only for Norrbotten. The
results from the regression on only the municipalities in Norrbotten shows that there is
Economic sector T-stat Elasticity Job multiplierIndustrial sector 0.87 0.01355 0.179Private services 2.96 0.05155* 0.492Business sector 1.15 0.02709 0.189Goverment services 0.93 0.02283 0.559Notes: *= Significance at 5% level
Economic sector T-stat Elasticity Job multiplierIndustrial sector 1.95 0.04871 0.426Private services 4.55 0.09203* 0.634Business sector 1.81 0.03730 0.201Goverment services -1,91 -0,01408 -0,238Notes: *= Significance at 5% level
32
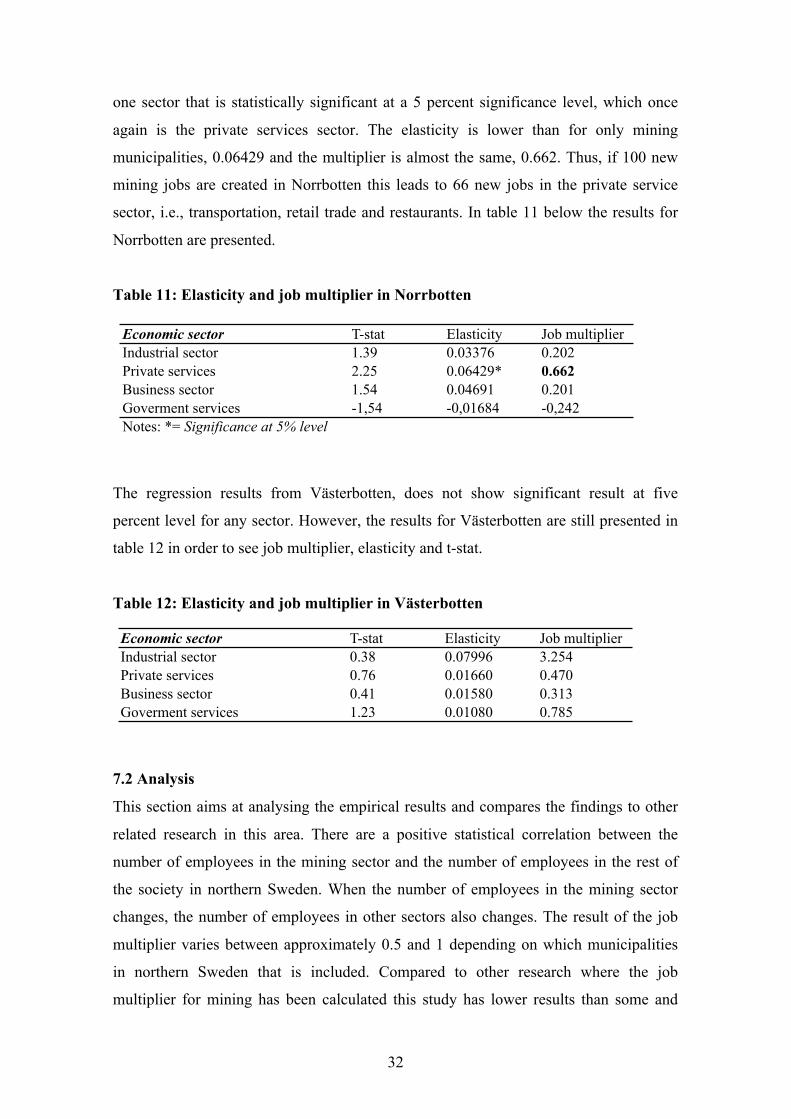
one sector that is statistically significant at a 5 percent significance level, which once
again is the private services sector. The elasticity is lower than for only mining
municipalities, 0.06429 and the multiplier is almost the same, 0.662. Thus, if 100 new
mining jobs are created in Norrbotten this leads to 66 new jobs in the private service
sector, i.e., transportation, retail trade and restaurants. In table 11 below the results for
Norrbotten are presented.
Table 11: Elasticity and job multiplier in Norrbotten
The regression results from Västerbotten, does not show significant result at five
percent level for any sector. However, the results for Västerbotten are still presented in
table 12 in order to see job multiplier, elasticity and t-stat.
Table 12: Elasticity and job multiplier in Västerbotten
7.2 Analysis
This section aims at analysing the empirical results and compares the findings to other
related research in this area. There are a positive statistical correlation between the
number of employees in the mining sector and the number of employees in the rest of
the society in northern Sweden. When the number of employees in the mining sector
changes, the number of employees in other sectors also changes. The result of the job
multiplier varies between approximately 0.5 and 1 depending on which municipalities
in northern Sweden that is included. Compared to other research where the job
multiplier for mining has been calculated this study has lower results than some and
Economic sector T-stat Elasticity Job multiplierIndustrial sector 1.39 0.03376 0.202Private services 2.25 0.06429* 0.662Business sector 1.54 0.04691 0.201Goverment services -1,54 -0,01684 -0,242Notes: *= Significance at 5% level
Economic sector T-stat Elasticity Job multiplierIndustrial sector 0.38 0.07996 3.254Private services 0.76 0.01660 0.470Business sector 0.41 0.01580 0.313Goverment services 1.23 0.01080 0.785
33
about same result as some. The previous studies to estimate the job multiplier for the
mining industry in Sweden use the input-output model. Tillväxtanalys (2010) estimated
a job multiplier between 0.5 and 1.7 depending on which municipality in Norrbotten
they where analysing. There results are similar to the results of this study and the results
also differ depending on the analysed municipality. Ejdemo and Söderholm (2011)
estimate a higher multiplier, 2-2.5 and in the report from Mineralriket (2014) the
average job multiplier based on several Swedish studies is 2.
One reason that the multiplier is higher in these studies is another method is used. A
disadvantage with the input-output model used in the earlier studies is that they do not
calculate if the mining industry has a negative impact on other sectors. This is done
when using the econometric model that has been used in this study, and this can be a
reason why the multiplier is lower than in some of the earlier studies. Another reason
why the average multiplier is higher than the multiplier in this study is that this study
examines only the multiplier for northern Sweden and smaller parts of northern Sweden.
Some of the other studies estimate the multiplier for the whole country and therefor the
multiplier is higher.
The results for the 4 separate sectors where private services are statically significant for
Norrbotten and Västerbotten, for municipalities with mining workers and for only
Norrbotten show positive elasticities. That private services are affected by the mining
industry seems logical. Private services include retail trade, and when more people will
be employed in the mining sector, they have more money to spend on retail trade, which
thus increase the number of employees in the retail trade sector. Transports are also
included in private services, and when the mine expands demand for transportation
increases because more goods need to be transported to and from the mine. And the
third sector that is included in private services is hotels and restaurants, and when more
people have money to spend on restaurants and some people visit the mines it is natural
that hotels and restaurants will see an increase.
The elasticity for Norrbotten and Västerbotten together is 0.05155, for municipalities
with mining workers 0.09203 and for Norrbotten 0.06429. The higher elasticity, the
higher the percentages increase in the number of workers in the private sector when the
numbers of mining workers increase. This means that when the number of mining
34
employees double, the number of employees in private services increases by 5.155%,
9.203% and 6.429%. The highest percentage increase is found in the municipalities with
mining employees, which is reasonable as these locations are closest to the mines and
should be most affected by the new mining jobs. A higher elasticity for Norrbotten than
for both Norrbotten and Västerbotten is also natural since the number of mining
employees is larger in Norrbotten than in Västerbotten and therefore Norrbotten should
be more influenced.
The elasticity is then multiplied by a ratio (sectoral employment/mining employment) to
find the job multiplier for the 3 different subdivisions of municipalities. For Norrbotten
and Västerbotten together the job multiplier is 0.492, for municipalities with mining
employees it is 0.634 and for Norrbotten 0.662. Higher job multiplier for the mining
municipalities and for Norrbotten can be explained in the same way as the elasticity,
i.e., these places are more affected because they are closer to the mines.
There could of course be several reasons why only one sector is statistically affected of
the mining sector. In Fleming and Measham (2014) they divide the regression in sixteen
sectors and get four sectors that are affected by the mining sector. To use sixteen sectors
in this study was not an alternative, because the mining sector in Sweden is much
smaller than the Australian one. Anyway, one reason why only one of four sectors in
this study was statistically significant can be that the mining industry in Sweden are
relatively small and does not affect the other sectors in a statically visible way. If the
number of municipalities with mining workers in northern Sweden had been more there
would probably have been more sectors that had been affected by the change of
employees in the mining sector.
The results for all sectors except the mining sector show that municipalities with mining
employees in Norrbotten are affected by a change in the number of employees in
mining sector. The elasticity 0.03429 for the municipalities with mining workers and
0.03158 for the municipalities in Norrbotten indicate that there is a positive correlation
between the increase in the number of jobs in the mining sector and the number of jobs
in the society totally. This means that mining industry has a positive effect on the rest of
the society when it comes to number of employees. From these elasticities, a positive
job multiplier has been calculated for municipalities with mining worker (0.852) and for

35
Norrbotten (0.989) and show that nearly one new job is created in the rest of the society
when a new job in mining sector is created. During the period 2003 to 2013 when the
number of employees in the mining sector increased with around 1800 people, a lot of
new jobs in other sectors was created because of the mining sector.
Finally the study made by Van Dijk (2014) argued that the econometric model that
Moretti (2010) use overestimate the job multiplier. Morettis econometric model are also
used in this study. Based on the results of the job multiplier earlier in this chapter and
compared to other studies made in northern Sweden this multiplier does not seem to be
overestimated. The multiplier is rather lower than in other previous studies. An
important difference between the econometric method and input-output method is that
the econometric method looks at what actually has happened. The input-output method
is based on different assumptions about the future. This may be a reason why the input-
output method sometimes estimates higher results, when assumptions about the future
are to optimistic.
36
CHAPTER 8
CONCLUDING REMARKS
The objective of this chapter is to show the main results of the study and present the
concluding remarks of the study and of the method that the study has used. The purpose
of this study has been to assess the job multiplier of the mining industry in northern
Sweden This study has estimated the job multiplier and thus how many non-mining jobs
that been created when one new mining job creates.
The overall results shows that there are clear linkages between the increased mining
jobs in northern Sweden to the rest of the local/regional society. The study shows that
when the number of mining employees increases, the number of employees in other
sectors also increases. Municipalities with mining employees are more affected by
changes in the number of mining employees. When studying the effects of mining jobs
on four different sectors in municipalities with mining employees the multiplier in the
private service sector is (0.662), and for the entire northern Sweden it is (0.492).
Regarding the results from mining jobs on all sectors in the society we find that if 100
new jobs are created in the mining industry, about 85 new jobs are created in in the
mining municipalities, and roughly 100 new jobs in Norrbotten totally. In mining
municipalities the mines are not only important because of the direct jobs, this study
show that the mines create a significant amount of indirect jobs because of the new jobs
in the mining industry. This means that for the municipalities with mining workers in
northern Sweden the society have been highly influenced by the mining industry.
Although the society in Norrbotten and Västerbotten in total is affected by the mining
industry, the mining industry is providing the community with benefits in form of extra
jobs. This study show that the effect of the indirect jobs to the local society are smaller
than it is in some other studies that uses the input-output model. This indicates that the
econometric way of estimating the job multiplier can give lower multiplier than with the
input-output model. However, this study still finds a positive multiplier that shows that
the mining industry is important for northern Sweden and especially for the cities where

37
the mines are located. Another concluding remark of the used method is that the
econometric model cannot estimate the effects on too many sectors because of the
limited number of municipalities with employees in the mining sectors. Finally, the
advantage of the econometric method used in this study is that it estimates what actually
happened, the real change in the number of jobs. This is an advantage because we do
not need to make uncertain assumptions about the future, which we need to do when the
input-output method is used.
For future research it would be interesting to use more than two time periods or longer
time periods than five years. It would also be interesting to use this type of model on
other sectors in Sweden.

38
REFERENCES
Ejdemo, T., Söderholm, P. and Ylinenpää, H. (2014). Norrbottens roll i
samhällsekonomin. Länsstyrelsen Norrbotten, nr. 10/2014.
Ejdemo, T. and Söderholm, P. (2011). Mining investment and regional development: A
scenario-based assessment for northern Sweden. Resources Policy, vol. 36, pp. 14-
21.
Flemming, D.A. and Measham, T.G. (2014). Local job multipliers of mining. Resources
Policy, vol. 41, pp. 9-15.
Government Offices of Sweden (2013). Swedens Mineral Strategy. Swedish Minis-
try of Enterprise, Energy and Communications. N2013.06.
Gunton, T. (2003). Natural resources and regional development: an assessment of de-
pendency and comparative advantage paradigms. Economic Geography, vol. 79, pp.
67-94.
Hansson, G., Lundström, A-K., Malmsten, P., Anderstig, C., Börjesson, J., Annetorp
Hörnsten, C. (2010). Malmfälten under förändring. Tillväxtanalys, report 2010:05.
Kilkenny, M. and Partridge, M. (2009). Export Sectors and Rural Development.
Agricultural Economics, Vol. 91, nr. 4, p.p. 910-929.
Indexmundi. (2015-04-01). Monthly price iron ore price 2003-2015.
http://www.indexmundi.com/commodities/?commodity=iron-ore (2015-05-03).
Leaming, G. (2007). The impact of the Rosemont mine on the economies of Pima
County, Arizona and the United States. Western Economic Analysis Center, Aug
20, 2007.
LKAB – Luossavaara-Kiirunavaara Aktiebolag. (2015-02-13). LKAB:s bokslutskommu
niké 2014. Pressmeddelande, http://www.lkab.com/sv/Allanyheter/ Koncernny-
heter/?ni=7692&c=&m (2015-03-16)
LKAB – Luossavaara-Kiirunavaara Aktiebolag. Pellets.
https://www.lkab.com/sv/om-oss/Koncernoversikt/Foradling/Pelletisering/ (2015-
05-01)
Mineralriket. (2014). Mineralriket – tillväxtmotor för Norrbotten. Luleå
Moretti, E. (2010). Local multipliers. American Economic Review, Papers & Proceed-
ings, vol. 100, pp. 1-7.
Moretti, E and Thulin, P. (2012). Local Multipliers and Human Capital in the US and
Sweden. IFN Working Paper, No. 914.

39
SCB – Statistic Sweden. RAMS, number of gainfully employed SNI 2007, 2003-2013.
SGU – Geological Survey of Sweden. Historical mines.
http://www.sgu.se/mineralnaring/svensk-gruvnaring/historiska-gruvor/ (2015-04-
07)
SGU – Geological Survey of Sweden. (2014) Statistics of the Swedish mining industry,
publishing SGU, http://resource.sgu.se/produkter/pp/pp2014-2-rapport.pdf (2015-
03-16).
Svenska dagbladet. (2012). Klondikesstämning I hela Norden. 5 maj 2012.
Svenska dagbladet. (2012). Satsning på gruvor i budgeten. 5 september 2012.
Söderholm, P. and Svahn, N. (2014) Mining, regional development and benefit-sharing:
Review of the research literature and experiences from developed counties.
Research report, Luleå University of technology, Luleå.
Van Dijk, J.J. (2014). Local employment multipliers in U.S. cities. University of Oxford,
department of economics discussion paper series. ISSN 1471-0498
Weber, J. (2012). The effects of a natural gas boom on employment and income in Col-
orado, Texas and Wyoming. Energy economics, vol. 34, p.p. 1580-1588.