masters in telecommunication engineeringcomunicacioneselectronicas.com/downloads/rosatseng.pdf ·...
TRANSCRIPT

MASTERS IN TELECOMMUNICATION ENGINEERING
OPTICAL NETWORK AS EARTHQUAKES EARLY WARNING SYSTEM
(R.O.S.A.T.S)
Author: Eng. MIGUEL ANGEL IBAÑEZ
Thesis Director: Dr. RICARDO DUCHOWICZ (CIOp – U.N.L.P.)
Version 10.
2012


ACKNOWLEDGMENTS:
To the authorities of Argentine Republic, President Cristina Fernández de Kirchner for approving the deployment the Optical Fiber Network plan that enabled to elaborate this thesis as a blueprint and simple contribution that surely will add another and allow in expand the project "Argentina Conectada" irreversibly improving telecommunications in the Argentine Republic, with social impact in actual times and for future argentine generations of XXI century.
Authorities and staff of the National Institute of Seismic Prevention (INPRES) ARSAT SA, University of La Plata (UNLP), Optical Research Center (CIOp) and National Telecommunications Commission (CNC), for the provision of information.
A different important actor of optical / education area in Latin America such as; FTTH Council G. Guitarte and E. Jedruck, Telcon-Prysmian Group, Mr. S. Ragusa, GIKO Group, Mr. J. Sanchis, IDETEL C. Marín, FOETRA O. Iadarola, UTN BA Ing. G. Oliveto and OIC SA D. Hereñú for their interest and continued support for research and development of new telecommunications technologies.
To my teachers in different universities for listening and guiding my "infinite" inquiries, proving that curiosity are the first thing that a teacher has to encourage. My appreciation and ensure that I practice their example and I am confident that my students also will do it.
All students, friends and colleagues of Argentina and Latin America who provided support for some time in the different optical networks projects I took part. My appreciation and thanks for being there, and always shared a passion for telecommunications, which have participated directly or indirectly in the implementation of this proposal.
To my parents, José and “Pepa” for their infinite love and patience. To my children, Florencia, Javier and Alejo, daily love, no words just a feeling of gratitude for the happiness of seeing them well grow leaning on each project with interest and curiosity.
Eng. Miguel Angel Ibañez.
Mat Copitec Nro. 2693
August 2012.


SUMMARY
Optical telecommunications networks were developed in thousands of kilometers in Argentina by dominant firms in the business between 1993 and 2003, mainly oriented as transport links between cities of high GDP, economically attractive. In 2010 the national government launched the project "Argentina Conectada” which includes the construction of the "Optical Fiber Federal Network" will cover over 40,000 km covering most of the territory and provide a high speed link, low latency and have high safety from design with redundant physical paths in optical fiber and radio systems used in this "National Optical Backbone".
In parallel with the telecommunications development in Argentina described above earthquakes and natural disasters in various parts of the world of high impact in terms of loss of human lives and material destruction happen. Just remember the last event in the region on February 27th 2010 that hit Chile, that violence and speed caused a major disaster. In Argentine Republic we remember San Juan earthquakes on 1944 and Caucete 1980 without prior warning to the population of that province and that, if this would be repeated in the area today would be possible to have an "early warning alert system ", automatic and massive in communication systems such as, cellular, TDA, TV would provide greater opportunity to survive the inhabitants of the affected area and reduce damage to take actions to emergency services such as, gas, electricity, fuel, etc.
In the above context, this work presents, analyzes and proposes innovative way to use-with minimal additional cost-optical transport networks telecommunications currently being built across the country (REFEFO), as an earthquakes early warning network, thus adding value to the initial project "Argentina Conectada", as UIT suggested in its document "Trends in Telecommunication Reform 2012", (1), incorporating environmental sensors also optical and local manufacture (UNLP-CIOP) and integrating current seismic systems managed by INPRES (National Institute of Seismology Study) that are distributed (150 approx.) radio connected sensors by radio to potentially have more than 1500 measurement of optical links REFEFO (lower installation cost and maintenance that actual by radio) coinciding with the areas described in the current seismicity map of Argentina, establishing a high security optical modern network of early warning for natural disasters to interact / warn the inhabitants of the

territory by different telecommunications terminals, such as: cell / SMS /TDA / TV / CCTV / radio / specific terminals as sky alert etc. and also with neighboring nations connection, forming staged a "mesh of earthquakes early warning in South America."
(1) Chapter 2, "Creation of nac Broadband Plans", Table 1, item 2 Goals and Objectives / Developing countries / "Goals and most sophisticated …

INDEX
1. - INTRODUCTION ...............................................................................................................9
2. -TECHNOLOGY STATUS ................................................................................................19
2.1 OPTICAL TRANSPORT NETWORK AND ACCESS:
OPERATING PRINCIPLE, CONSTRUCTIVES TOPOLOGIES AND
ASSOCIATED MATERIALS ...........................................................................................20
2.2 OPTICAL TRANSPORT NETWORK: OPTICAL FIBER FEDERAL NETWORK PROJECT.............................................................................................................40
2.3 NATIONAL NETWORK OF SEISMIC ARGENTINE STATIONS.......................51
2.4 SCADA SURVEY AND CONTROL OF MULTIVARIABLE OPTICAL NETWORK SYSTEM……………..…………………………………….......................................67
2.5 OPTICAL ENVIRONMENTAL SENSORS AND ITS APPLICATIONS........................................................................................................................72
3. – WORKING HYPOTHESIS.............................................................................................77
3.1 GENERAL OBJECTIVE..................................................................................................79
3.2 SPECIFIC OBJECTIVES..................................................................................................79
3.3 SCOPE……………………………………………………………………………………………..80
4. -PROPOSED SOLUTION...................................................................................................81
4.1 COMPARISON OF ARGENTINE SEISMOGRAPHIC NATIONAL NETWORK
AND OPTICAL FIBER FEDERAL NETWORK PROJECTED FOR TELECOMMUNICATIONS .................................................................................83
4.2 TECHNOLOGICAL CONVERGENCE BETWEEN REFEFO, AND
EXISTING NETWORK OF SEISMIC STATIONS (REFEFO) AS

DETECTOR AND TRANSPORT WORKING IN SEISMIC RISK AREAS (PRIORITIES).……………………………………………………………………………………..87
4.3 TECHNOLOGICAL CONVERGENCE CREATING EARLY WARNING NETWORK DIRECT TO RESIDENTS (INTERNET, MOBILE PHONE SMS, TDA, CATV, RADIOS,) ……………………………………………………………………………...... 87
4.4 CONVERGENCE MODEL –OPTICAL NETWORK INTEGRATION -PROPOSAL-BASIC ASSEMBLY DETAIL...................................................................... 92
4.4.1 Graphic of the proposed scheme "ROSATS" from the op. detector -Tx FO-to node……………………………………………………………………………..………........ 93
4.5 SOCIO-ECONOMIC IMPACT ANALYSIS OF THE PROPOSAL IMPLEMENTATION……………………………………………………………………………….94
5. - OPTICAL SENSORS ....................................................................................................... 95
5.1 INTRODUCTION………………………………………………………………………………96
5.2 MAIN PARAMETERS…………….................................................................................. 97
5.3 SENSORS DESIGN. ANALYSIS …..……..................................................................... 98
5.4 VIBRATION SENSOR DEVELOPMENT FOR EARTHQUAKE MONITORING. ……………………………………………….…………………………………………………………115
CASE 1: FIZEAU SENSOR…...……………………………..……………………………….116
CASE 2: BRAGG GRATING (FBG) ….......................................................................... 120
BRAGG GRATING ENGRAVING ................................................................................ 122
5.5 LABORATORY TESTING (CIOp)
5.5.1 SENSOR CONSTRUCTION.................................................................................... 126
5.5.2 SENSITIVITY DETERMINATION....................................................................... 128
5.5.3 WORKING RANGE SENSOR DETERMINATION ......................................... 129
5.6 RESULTS OF OPTICAL SENSORS TEST............................................................. 129
6. - CONCLUSIONS ............................................................................................................. 131

7. – FUTURE RESEARCH………………………................................................................. 135
8. – BIBLIOGRAPHY…………………………………………………………………………..…139
9. - APPENDIX I .................................................................................................................. 143
9.1 SEISMIC PHENOMENON.......................................................................................... 144
9.2 SEISMOLOGY STUDIO MEDIA……........................................................................ 146
9.3 MAGNITUDE SCALES - INTENSITY …................................................................ 147
9.4 EARTHQUAKE PREDICTION…….......................................................................... 150
10. – ANNEXES II……………………………………………………………..…………………..153
1.1 RING OF FIRE ……………............................................................................................ 154
10.2 TECTONIC PLATES………....................................................................................... 156
10.3 GEOGRAPHICAL LOCATION JAPAN CASE..................................................... 158
10.4 GEOGRAPHICAL LOCATION CHILE CASE...................................................... 159
10.5 EARLY WARNING SYSTEMS ENVIRONMENT IN THE RISK REDUCTION PROCEDURE………………………………………………………............................................. 159
10.6 WARNING DISSEMINATION................................................................................ 161
10.7 EARLY WARNING SYSTEMS IN THE WORLD ............................................. 166
11. - APPENDIX III ............................................................................................................. 177
11.1 GENERAL DESCRIPTION OF TRANSMISSION PRINCIPLES ABOUT OPTICAL FIBER……………………...................................................................................... 178

1. INTRODUCTION
1. INTRODUCTION
In recent years and throughout the timeline of our time, there have been a series of events linked to multiple natural disasters that have ample evidence of the power of nature and when these happen, remind us the low reactive power that human has against that.
Man's life since ancient times, has experienced flooding, the strength of hurricanes and tornadoes, violence of volcanic eruptions and earthquakes, year after year, natural disasters, bring about a greater number of loss of life and materials. The causes of this increase of the losses are related to the largest number of world population, increasing urbanization, the type of economic activities, population settlement in hazardous locations and lack of early warning networks that demand natural disasters interconnected using new technologies in computing telecommunications.
Each year there are millions earthquakes in the world, a large percentage takes place in unpopulated areas, several thousand are recorded by seismographs throughout the world, some hundreds are perceived by the general population, causing some damage to cities (population or constructions), less than a dozen are of such a magnitude to be considered of magnitude greater than 8 on the Richter scale, most occur within the "Fire Ring" (see Annex 9.1) and there is no place on the planet that can be considered completely free of earthquakes although Antarctica registered a few and low magnitude.
Next, as the context of the thesis, we present a brief narration of the earthquakes, which marked their passage in recent times, cases:
• Japan 2011,
• Chile 2010 and
• Argentina 1944:

JAPAN.
• The Great East Japan Earthquake of 2011 (see Annex 10.3), in Tohoku region, was of magnitude 9.0 MW [1], reaching an intensity of IX [2] on the Mercalli scale, which triggered waves tsunami of up to 40.5 meters and this happened at 14:46:23 local time (5:46:23 UTC [3]) on March 11th of this year. The epicenter of the quake was in the sea, off the coast of Honshu, 130 km east of Sendai. At first we calculated the magnitude at 7.9 MW which was subsequently increased to 8.8 MW8.9 MW then according to the records of the Geological Survey (USGS). Finally reaching 9.0 MW confirmed by the Japan Meteorological Agency and the USGS and lasted about 6 minutes.
U.S. Geological Survey explained the earthquake occurred because of a shift in the area near the interface between subduction plates [4] between the Pacific Plate and the North American plate. Two days ago, this earthquake was preceded by another major quake, but of minor magnitude, occurred on Wednesday, March 9th, 2011, at 2:45:18 UTC on the same area of the east coast of Honshu, and had a magnitude of 7.2 MW, at a depth of 14.1 km Also that day the authorities of the Japan Meteorological Agency gave a tsunami warning, but only local to the east coast of the country. On February 1st the volcano became active in Shinmoe, Miyazaki province, this indicates a tectonic reactivation pre-earthquake.
The magnitude of 9.0 MW made it the most powerful earthquake suffered on Japan's history to date and the fourth most powerful in the world.
DATE
TYPE
MAGNITUDE
INTENSITY
DEPTH
LENGTH
AFECTED AREAS
VICTIMS
Picture 1. Japan Hearthquake and tsunami Data
March 11th 2011
Inverse interplate fault Pacific, North American)
9,0 ML (Richter seismological scale )
15.836 death 3.650 missing and 5.948 injured
IX Mercalli
32 Km
6 min.
Japan and Pacific basin
9,0 Mw (Seismological scale moment magnitude)
Source: Author's calculations based on data from the U.S. Geological Survey (USGS)
[1] Seismic scale moment magnitude is a logarithmic scale used to measure and compare earthquakes, based on the measurement of the total energy, which is released in an earthquake.
[2] Mercalli Earthquake Scale is 12-degree scale developed to assess the intensity of earthquakes through the effects and damage to various structures.

[3] Coordinated Universal Time is the time zone of reference to calculate all other areas of the world.
[4] Plates subduction is a process of sinking of a lithospheric plate under another at a convergent boundary, according to the theory of tectonics plate.
Source: Author's calculations based on data from the U.S. Geological Survey (USGS)
CHILE.
• The 2010 Chile earthquake happened at 3:34:14 pm (UTC-3), on Saturday February 27th, 2010, which reached a magnitude of 8.8 MW. The epicenter was located in the Chilean sea, opposite the towns of Curanipe and Cobquecura 150km northwest of Concepción (see Annex 9.4), at a depth of 30.1 km below the earth's crust. The quake lasted 3 minutes 25 seconds, at least in Santiago. It was felt across much of the Southern Cone with different intensities, in places like Buenos Aires and São Paulo in the east.
In the regions of Maule and Bio Bio, the earthquake reached an intensity of IX on the Mercalli scale, wiping out much of the cities and Constitution, Concepción, Cobquecura and Talcahuano port. In the regions of La Araucanía, O'Higgins and Metropolitan, the quake reached an intensity of VIII causing major destruction in the capital, Santiago de Chile, Rancagua and rural localities. A strong tsunami struck the coast of Chile as a result of the earthquake, destroying several villages already devastated by the earthquake impact.
Total victims 525, nearly 500 thousand homes are severely damaged and are estimated to total 2 million homeless, the worst natural disaster in Chile
DATE
TYPE
MAGNITUDE
INTENSITY
DEPTH
DURATION
AFECTED AREAS
VICTIMS
Picture 2. Chile earthquake and tsuname date
February 27th 2010
Interplates inverse fault (Nazca, South America )
8,8 MW (Seismologic scale moment magnitude)
525 death and 25 missing
IX Mercalli
30,1 Km
3 min 25 seg.
Valparaíso, Metropolitana, O'Higgins and Maule areas
Biobío and La Araucanía, Chile
Source: Author's calculations based on data from the U.S. Geological Survey (USGS)

ARGENTINA.
• The San Juan earthquake happened on January 15th, 1944 at 20:50 local time, reaching a magnitude 7.8 degrees on the Richter scale, with a surface wave magnitude of 7.4 Ms [5] and a maximum intensity of IX on the Mercalli scale. The epicenter was located 20 km north of the city of San Juan, La Laja town, Albardón department, at 30 km depth.
Peak area was spread and covered approximately 200 km ². Mendoza was also damaged, especially in the department of Las Heras. The quake was felt in the cities of Cordoba and Buenos Aires.
The earthquake destroyed almost the entire city of San Juan, where we can say that the disastrous effects of the earthquake were due, not only to the violence of the quake, but also the precarious buildings that existed years ago. While early estimates spoke of 12,000 victims, subsequent studies indicated that total death in this earthquake may have reached 20,000.
DATE
TYPE
MAGNITUDE
INTENSITY
DEPTH
DURATION
AFECTED AREAS
VICTIMS
7,4 Ms (Seismologic scale of superficial waves magnitude)
Picture 3. San Juan - Argentina earthquake data
January 15th 1944
Liquefaction phenomena associated with earthquakes
7,8 ML ( Richter seismologic scale)
10.000 deaths
IX Mercalli
30 Km
Ro records
San Juan and Mendoza areas
Source: Author's calculations based on data obtained from INPRES
[5] Seismic magnitude scale of surface waves, is a scale based on the maximum amplitude caused by the Rayleigh surface wave period in the range 18 to 22 seconds
________

EARLY WARNING SYSTEMS.
Introduction
The national civil protection institutions currently operate national warning systems in case of large-scale phenomena, such as earthquakes. In these systems, the national weather agency carries out the monitoring of the evolution of the phenomenon and recommends national institution issuing alerts for regions that follow. With this information, the national institution issues a press release alerting the public, which calls mass media, radio and television.
The main aspects to consider different types of early warning systems are:
• Systems must be integrated into better way to national and/or civil protection institutions and must consolidate an interaction between the national monitoring system and local systems to achieve an integral development of mutual benefit.
• Local systems are barely known by national scientific monitoring, so should encourage interaction and plan with integral national and continental vision depending on how is it defined: local / national / regional.
• It is necessary to introduce the various communications media the dissemination of information regarding such systems to raise awareness and reach most of the population to protect.
Operating principles.
Early warning systems (EWS) have as aim to alert the public in case of a natural disaster of such proportions that can cause damage. It is detailed more properly and extension in Annex 10.7.
Any system of this kind must satisfy the operating criteria to provide an advance alert so that people can take the minimum precautions needed in approaching the phenomenon. These are integrated systems based on three components:

• Monitoring of conditions related to the related phenomenon.
• Events forecast and daily and historical backup record
• Alert to different terminals and response of the national entity
Major technological advances made during the last twenty years in communications, can generate high capacity links, which are transmitted by telephone, video signals and data at the speed of light through optical networks with propagation velocity of 150.000km/sec against propagation of mechanical waves of an earthquake in the order of meters / second so if the detection is efficient, with very detailed geographic network could lead early warning signals of communication terminals to local inhabitants with seconds in advance to the effect that gets rougher and thus provide greater chance of survival not to receive any notice.
Simultaneously with the advance in optical transport networks, important developments were generated at different sensor technologies for determining various interest parameters: vibration, pressure, etc. The confluence of both industries (communications and sensors) can generate an early warning system in case of an earthquake but it is perfectly applicable to other variable of interest you want to achieve network monitor protecting people, reducing loss of life to quickly seek protection and material, to be able to make emergency action such as closing circuit gas, electric, etc.
The value of the obtained information by the optical sensors backbone allows, for example:
• Early detection of earthquakes or volcanic movements.
• Generation of alarm signals and systems for mitigating effects (power failure, stop or slow moving vehicles speed, lift scheduled scan, etc.).
• Control of damage due to weather events on structures such as buildings or bridges.
• Generation of information and predictive models.
• Planning of agricultural systems and land use.
• Crop selection, determination of planting and harvest.

• Programming and irrigation control.
• Etc.
Early warning systems are key in disasters like earthquakes in our case to alert and prevent further possible losses. The Federal Network of Optical Fiber will provide predictive information in real time through the early warning system for earthquakes interacting with meteorological agencies, regional governments and institutions for the civilian’s protection.
The early warning system for earthquakes implemented a minimum resource of the Federal Network of Optical Fiber will integrate the entire Argentine Republic, reduce human and material losses of great magnitude, because the vision of this thesis is to create a modern first pillar civil protection throughout the country, creating the Earthquake Early Warning (Earthquakes Early Warning, EEW) and adding a number of mandatory alerts media, generated automatically, no matter what is being broadcast in the media.

2. STATE OF TECHNOLOGY

2. STATE OF TECHNOLOGY
INTRODUCTION:
Individually the following describes the principle of operation and status of each technology and then in the next item 3 develop these elements based on the proposed integration of optical networks, detection, transport and automatic alerts sent to local centers / national and regional (Latin America).
Technologies are described below:
2.1 - Optical transport networks and access. Operating principle.
2.2 - Optical Network "REFEFO" project "Argentina Conectada".
2.3 - seismology networks of Argentina Republic, operated by INPRES.
2.4 - SCADA networks, monitoring & remote control.
2.1 OPTICAL TRANSPORT NETWORK AND ACCESS: OPERATING PRINCIPLE, CONSTRUCTIVE TOPOLOGIES AND ASSOCIATED MATERIALS.
A telecommunications system consists of a physical infrastructure or not (wireless) called Link through which information is conveyed emitted from a source (Node A), to the final destination (Node B or "client"). On this basic infrastructure carry telecommunications services received by the customer (Pic. 1). This infrastructure is also called the "Telecommunications Network".

Text picture 1: Nodes-links, terminal equipment
Picture 1: Network and Terminal Equipment.
The generic definition of previous telecommunications network has two specific segments either transporting information between network nodes, called "transmission" and the transport of information between a node and clients (Terminal) known here as " Access Network ".
To receive a telecommunications service, user uses a computer "Terminal" by which get wired or wireless connection to the telecommunications network.
Each telecommunication service has different characteristics, may use different access networks and transport, therefore, may require different user terminals. For example, to access to the telephone network, the required terminal equipment is a telephone set; for receiving the cell phone service, the terminal equipment consists of cellular phones, to receive TV service air, etc.

2.1.1 Network Element: Link. - The set of links and nodes form a communication network and it shows two segments linking physical or intangible clearly differentiated dedicated to transport links and links access-dedicated.
2.1.1.1 Definition of Transport and Access Network. - For illustrative INPRES, we can establish an analogy between telecommunications and transport. In transport, network consists of all the roads of a country and what where vehicles run, which in turn serve to transport persons or goods. In telecommunications data is transported via data transmission networks. When a communications network:
• Connect nodes together is called: Transport Network.
• Connect nodes with customers, is called: Access Network.
The main reason to developed telecommunications networks is the cost of establishing a unique link or "dedicated" between any two users on a network would be very high, especially considering that not all the time all users communicate to each other. It is better to have a dedicated connection for each user to have access to the network through their computer terminal, but once inside the "transmission network” information / messages will use links that are shared with other communications by other users.
Comparing again to transport, in all houses there is a street where a car can run and in turn lead to a road, but not all homes are located on a road dedicated to exclusively servicing a single vehicle. Streets play the role of the access channels and highways the shared channel (transport).
In general it can be said that a telecommunications network consists of three elements:
• A set of nodes in which information is processed
• A set of links or channels that connect the nodes to each other and through which information is sent to and from the nodes
• Terminals where customer receives and sends his/her information.
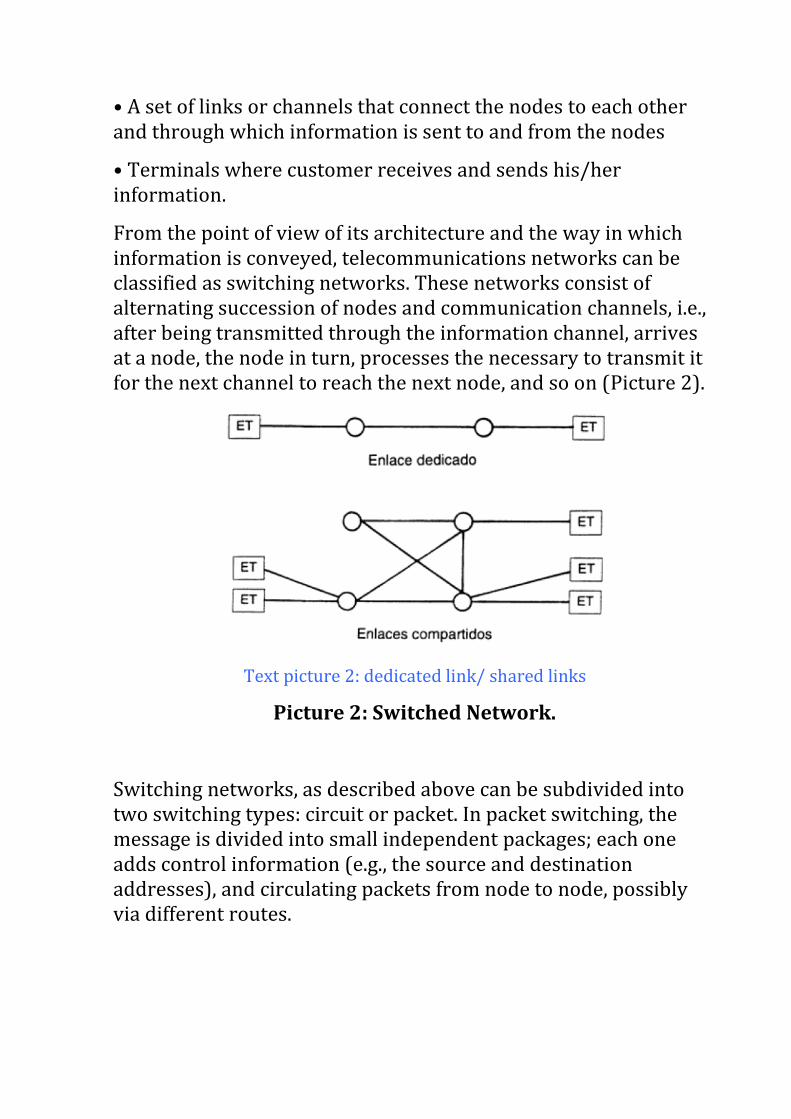
From the point of view of its architecture and the way in which information is conveyed, telecommunications networks can be classified as switching networks. These networks consist of alternating succession of nodes and communication channels, i.e., after being transmitted through the information channel, arrives at a node, the node in turn, processes the necessary to transmit it for the next channel to reach the next node, and so on (Picture 2).
Text picture 2: dedicated link/ shared links
Picture 2: Switched Network.
Switching networks, as described above can be subdivided into two switching types: circuit or packet. In packet switching, the message is divided into small independent packages; each one adds control information (e.g., the source and destination addresses), and circulating packets from node to node, possibly via different routes.

When arriving at the node to which destination the user is connected, the message is delivered (Figure 3). This technique can be explained by means of an analogy with the postal service. We suppose that it is desired to send a complete book from a point to geographically separated to other. The commutation of packages is equivalent to separate the book in its leaves, put each of them in on an envelope, put to each on the origin address/destiny and later to leave all the envelopes in a postal mailbox. Each envelope receives an independent treatment, following, probably, “different physical routes” to arrive at its destiny; but once all of them have arrived at their destiny, the complete book can be reassembly.
Text figure 3: Message consistent on three packages
Origin=node 1, destination=node 3
Message – Destination
Figure 3: Package Switching.
Moreover, in circuit switching is seeks a trajectory between users, a communication is established and maintained this path for as long as you are transmitting the information or not, with permanent occupation of the bond until it produces disconnecting the circuit (Picture 4).

Text 4: Information-Node 1/2/4
Figure 4: Circuit Switching.
To establish communication with this technique a signal is required to reserve different segments of the route between both users, and during communication channel will be reserved exclusively for this pair of users.
2.1.1.2 Transmission Means. - Transmission means are physical or intangible means through which information travels from one point to another within the communications network. The characteristics of a medium are critical for effective communication because of them depends largely on the quality of the signals received at the destination or intermediate nodes in a route. The transmission means are divided into two classes:
a) Guided Transmission Means. E.g. copper cables, coaxial cables and optical fibers. For these types of channels can be transmitted the following data rates:
Physical Media Referential Transmission Speed
Copper Cable (braiding pair) Up to 10/100 Mbps
Cable Coaxial 500/1000 Mbps

Optical Fiber >20 Tbsp.
Copper cables are, doubtlessly, the most used means in analogical transmissions as much as digitals. They continue being the base of the urban wire networks. Materials that are made (copper) produces attenuation in the signals, in such a way that a distances among 2 and 6 km a relay station must be placed. Coaxial cables have a shield that in the transmission isolates the central conductor of the noise. They have been used in communications of long distance and in distribution of television signals and one is also used in data communications network. The distance between relay stations is similar to the one of copper cables, because a greater transmission band is used, which allows to majors rates in the digital communications (Picture 5).
Text Figure 5: Metallic cable- isolation-Metallic netting-Isolation- Wire
Figure 5: Types of wire ropes.
Optical fibers also transmit optical signals (photons) instead of the electrical ones (electrons) on two previous cases. They are lighter that those of metallic cords and allows to transmit higher rates
than the first. In addition, although signals are affected by noise, they are not altered by noise of the electromagnetic type and can support longer distances between relay station (about 100/1000/5000 km). Their main applications are the long distance connections, metropolitan connections and local networks. In progressive form, optics fibers will be releasing traditional services on copper overturned optician, or optician plus copper cable of reduced length (topology FTT” X”), that allows maintaining the high speed of transmission and minimum operating expenses. The fundamental difference between the transmissions that use optics fibers and those of purely electrical nature is in the fact that, in first, the information controls to optics signals, that is to say, information modulates some characteristic of an optics signal. The advantages of this type of transmissions are multiple: they are less sensible to the noise of the electrical type, and by the space that the optics signals occupy in the phantom, the capacity is greater than the one that offer systems based on metallic cables.
Optics fibers have been of extraordinary importance in the transoceanic transmissions. The demand of this type of transmissions has grown to rates of about 24% a year in the Atlantic, with also expansion to the Pacific, Caribbean and Mediterranean. The cable for this class of applications consists of having devices of high trustworthiness, great bandwidths and few losses. This originated that, around 1980, came up the first proposal from a transoceanic system based on optics fibers, that, as well, allowed in 1988 install the first system of this type.
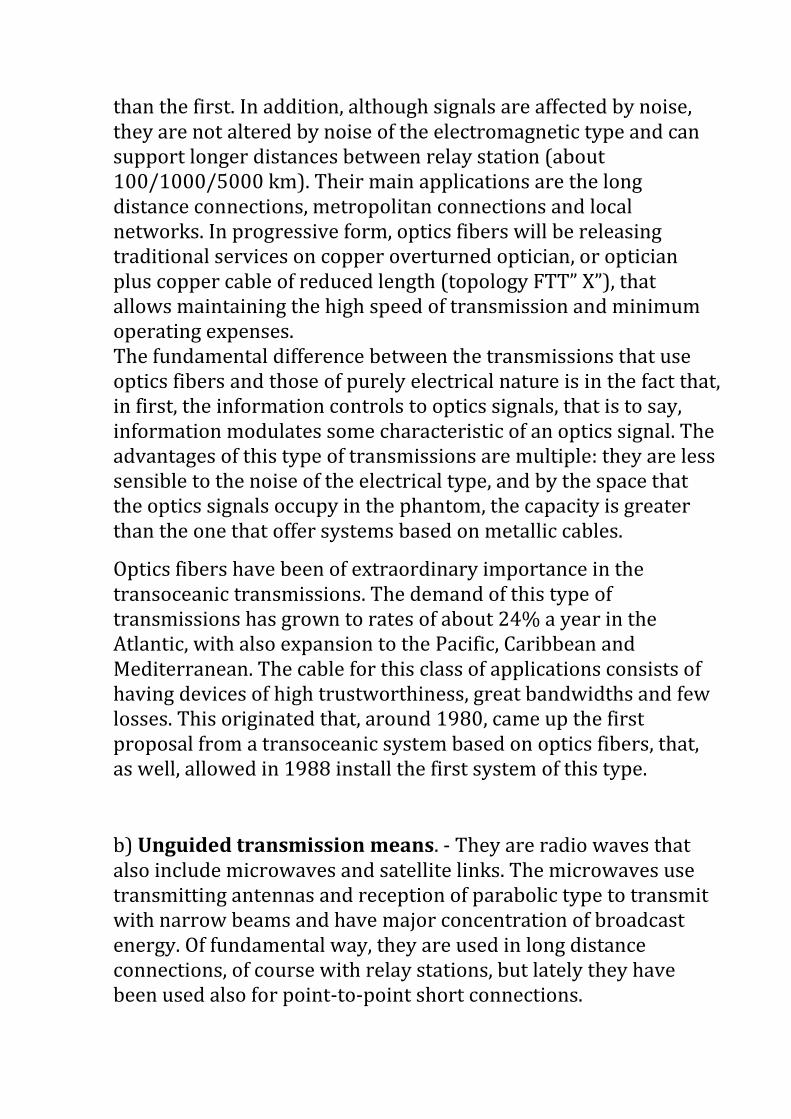
b) Unguided transmission means. - They are radio waves that also include microwaves and satellite links. The microwaves use transmitting antennas and reception of parabolic type to transmit with narrow beams and have major concentration of broadcast energy. Of fundamental way, they are used in long distance connections, of course with relay stations, but lately they have been used also for point-to-point short connections.

Satellite links work of a very similar way to the microwaves: a satellite receives in a band the signals of an earth station, amplify and transmits them in another frequency band. The principle of the satellites operation is simple, although with the course of the years it has become more complex: radio signals are sent from an antenna towards a satellite parked in a fixed point around the Earth (called “geostationary”). Satellites have a reflector oriented towards the sites where are wanted to make arrive the reflected signal; and in those points, also had antennas whose function is, indeed, to catch the signal reflected by the satellite. Of this point in future, the signal can be processed so that, finally, it is given to its destination.
The advantages of the via satellite communications are evident: great distances without concerning the topography or the orography of the land, and antennas that have ample geographic covers, of way like many earth receiving stations can be used simultaneously to receive and distribute the same signal that was transmitted at the time. Also, the communications via satellite have been used for multiple applications: from the transmission of telephone conversations, the transmission of television and the videophone conferences to the data transmission.
The transmission rates of can be from very small (32 Kbps) to about Mbps. Requirements about the multiple access, handling of diverse types of traffic, establishment of networks, integrity of the data and security are satisfied with the possibilities offered by technology VSAT (very small opening terminals).
Among the services that may be offered through VSAT technology are: radio broadcasting and distribution services, databases, weather and stock market, stocks, facsimile, news and music programming, advertising, air traffic control, TV entertainment, education, data collection and monitoring, weather, maps and images, telemetry, two-way interactive service, credit card authorizations, financial transactions, database services, reservation service, library service, interconnection of local

networking, email, emergency messages, compressed videoconferences , etc.
In order to understand the operation of the systems based on via satellite transmissions, and its association with satellite antennas, next the principle of this type of antennas is based: the geometry of a parabola is like an emission that arrives at the parallel parabola to its axis is reflected happening through its center, and an emission that leaves its center, when affecting the parabolic surface, is reflected parallel to its axis (Picture 6).
Text:
Satellite signal Axis pointing to the satellite
Focus-reflected signal Parabola
Figure 6: Operation of a satellite dish.
Applying these ideas to the telecommunications, it can be observed that if the axis of the satellite dish is oriented towards the satellite, the originating emissions of this one will arrive at the parallel antenna to its axis, and those originating emissions of the center of the parabola will follow a parallel trajectory to the axis of the parabola until arriving at the satellite. Consequently, in the center of the parabola an energy collector must be placed that catches everything what comes from the satellite, that was reflected by the parabola, and sends and it to the processing

circuits. In that same point, transmitter must be located, whose function consists of getting the information towards the satellite so that this one, as well relays, it retransmit until its final destiny.
It will have been possible to observe that there are in many points of a city antennas of parabolic type, whose directions are more horizontal than those than they aim towards a satellite. One is a microwave antenna, in which the same principle of directionality already described is used. It is possible to emphasize that the main difference between microwave and radio transmissions consists of which first they are omnidirectional (in all the directions), whereas second they are unidirectional (in a unique direction); therefore, the radio does not require antennas of parabolic type. Although, strictly speaking, the term `radio' includes all the electromagnetic transmissions, the applications of the radio are assigned in agreement with the bands of the phantom in which the transmissions are realized. As the wavelength of a signal depends on its frequency, to speak of a spectral segment specifically is equivalent to speak of the rank in which is the length of the waves in that segment. For example, to frequencies between 1GHz and 300 GHz (1 GHZ= 1000 MHz) are called microwaves: the wavelengths are contained in a rank of 100 cm1 mm10 mm even though the segment between 30 GHZ and 300 GHZ (corresponding to wave longitudes between 10mm and 1 mm) also are known as millimetric waves.
In the following picture, the applications of the different ranks from the phantom appear.
Band Name Applications
30-300 KHz LF Low frequency Aerial and maritime navigation
300-3000 KHz MF –medium frequency
Navigation, radio, commercial AM, privates link, fixed and mobile
3-30 MHz HF high frequency Broadcasting, short
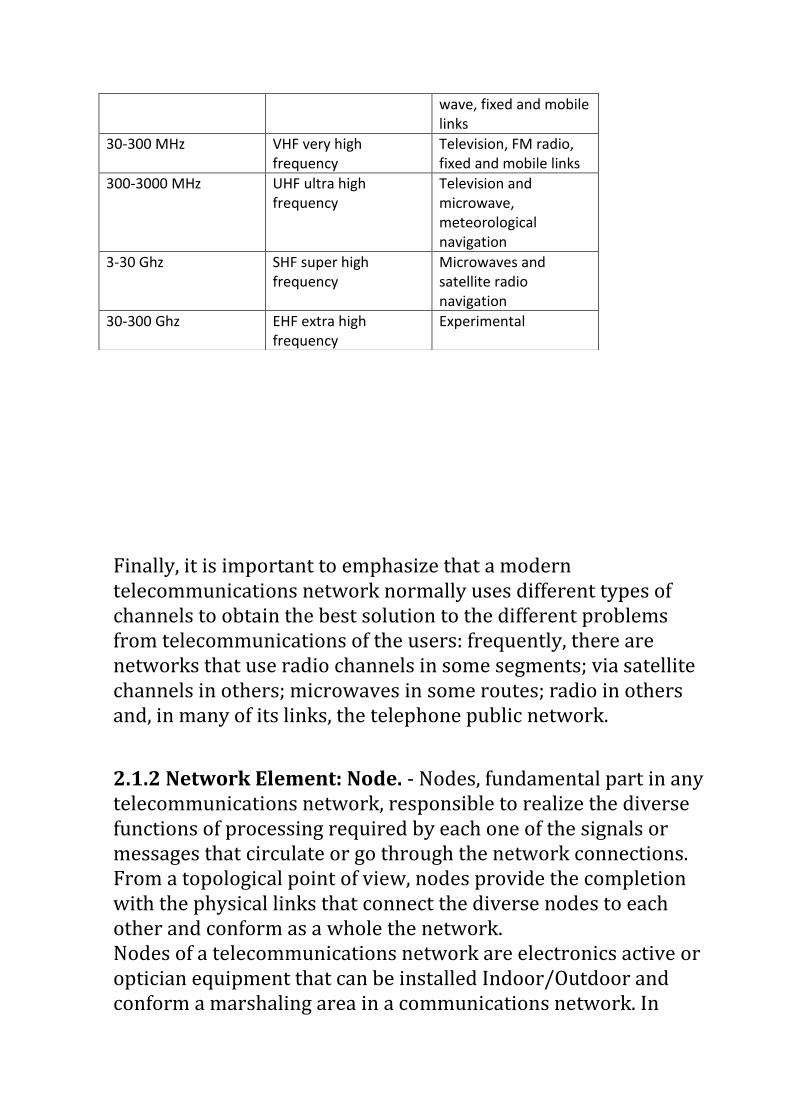
Finally, it is important to emphasize that a modern telecommunications network normally uses different types of channels to obtain the best solution to the different problems from telecommunications of the users: frequently, there are networks that use radio channels in some segments; via satellite channels in others; microwaves in some routes; radio in others and, in many of its links, the telephone public network.
2.1.2 Network Element: Node. - Nodes, fundamental part in any telecommunications network, responsible to realize the diverse functions of processing required by each one of the signals or messages that circulate or go through the network connections. From a topological point of view, nodes provide the completion with the physical links that connect the diverse nodes to each other and conform as a whole the network. Nodes of a telecommunications network are electronics active or optician equipment that can be installed Indoor/Outdoor and conform a marshaling area in a communications network. In
wave, fixed and mobile links
30-300 MHz VHF very high frequency
Television, FM radio, fixed and mobile links
300-3000 MHz UHF ultra high frequency
Television and microwave, meteorological navigation
3-30 Ghz SHF super high frequency
Microwaves and satellite radio navigation
30-300 Ghz EHF extra high frequency
Experimental

networks they are called POTS “Centrals”, to be associate to the classic commutation, also known as “Internal Plant” in a traditional network scheme.
Their functions are:
a) Establishment and protocol verification. The
telecommunications network nodes realize the different
processes from communication in agreement with a set of
rules that allow them to communicate to each other. This set
of rules is known with the name of communication protocols,
and they are executed in the nodes to guarantee successful
transmissions to each other, using the channels that connect
them.
b) Transmission. It is necessary to make an efficient use of the
channels, thus, the nodes of the network adapt the
information to the channel, or the messages in which is
contained, for their effective transport through the network.
c) Interfaces. In this function, the node is in charge to provide
the channel the signals that will be transmitted, in agreement
with the means of which is formed the channel. If the
channel is a radio, signals will have when coming out to be
electromagnetic of the node, independent of the form that
they have had to its entrance and, also, of which the
processing in the node has been by means of electrical
signals.

d) Recovery. If during a transmission is interrupted the
possibility of successful finishing the transference of
information from a node to another, the system, through its
nodes, must be able to recover and resume as soon as
possible the transmission of those parts of the message that
were not transmitted successfully.
e) Format. When a message travels throughout a network, but
mainly when an interconnection between networks exists
that handle different protocols, it can be necessary that in
the nodes the format of the messages modifies, so that all the
network nodes (or the networking) can successful work with
this message. This is known as format or reformat if the
format is due to modify with the format it arrives to a node.
(Picture 7).
Text: Start signal Address Control Information Error detection End
Picture 7. Typical package format
f) Routing. When a message arrives at a node of the
telecommunications network, necessarily it must have
information about the origin users (emitting) and destiny
(receiving). Nevertheless, whenever the message travels by a
node - and considering that in each node there are several
connections linked, by which, at least in theory, the message

could be sent to anyone of them, in each node must make the
decision from which must be the following node to whom
must be sent the message, to guarantee that it arrives quickly
at its destiny. This process is denominated routing through
the network. The selection of the route in each node depends,
among others factors, of the instantaneous situation of
congestion of the network, that is to say, the number of
messages that at every moment are in process to be
transmitted through the different connections from the
network.
g) Repetition. Protocols exist that, among its rules, have a
forecast by means of which the receiving node detects if
there has been some error in the transmission. This allows
the destiny node to ask for the previous node that relays the
message until it arrives without errors, and the receiving
node can, simultaneously, relay it to the following node.
h) Address. A node requires the capacity to identify directions
to make arrive a message at its destiny, mainly, when the end
user is connected to another telecommunications network.
i) Flow control. All communication channel has a certain
capacity to handle messages, and when a channel is
saturated, no messages must be send by means of that
channel until the messages previously sent have been
delivered to their destinies.
j) Depending on the complexity of the network, the number of users whom it has connected and to those whom the service is provided, it is not indispensable that all the telecommunications networks have orchestrated all the preceding functions in their nodes. For example, if a network only consists of two nodes each of as diverse users are connected, it is evident that functions are not required both such as address or routing in nodes that form the network.

k) Once exhibited the components of a network of telecommunications, it is possible to emphasize that what really gives value to the telecommunications is the set of services that are offered by means of the networks and that are put at the disposal of the users. That value depends on the type of communication that can establish a user and on the type of information that can send through the network
For example, through the telephone network to provide telephone services and business people. Among these services for oral communication are local telephone service (both residential and commercial and industrial), phone service and long distance phone service for international long distance, but in recent years may also be made by the network fax transmissions and data. Through a cable television network can provide distribution of television signals to homes in general, but lately have started services restricted to certain types of users, such as services such as "pay per view". It is possible that, thanks to technological advances in various fields, in a near future are interconnected telephone networks with cable television, and through this interface users can simultaneously exploit the vast processing power with the telephone networks.
2.1.3 Network Element: Terminal. - Terminals, a key part in any telecommunications network, are the teams receive / send information from the client to the communications network and vice versa must be appropriate to the various processing functions that require each of the signals or messages circulating or passing through the network links.

Text: Terminals
Evolution towards next network generation
Picture 8: Terminals - evolution towards next generation networks.
This and other elements of a communications network has evolved over time from the first telegraph terminal, via the phone, reaching far with multiservice terminals (telephony, data, TV) and denominating broadly Network Terminal or "NT" active device termination of the communication network in the customer's home and it connects the terminal end that would provide the required service to the customer (e.g. POTS analog telephone network, ISDN digital phone, IP phone packet network).

Text: Individual network for each service- PSTN Cell Networks, Data Network (IP, ATM, FR)- Broadcast Network. Voice, data, TV, early alert
Picture 9: convergence of networks and services - Evolution used by the "Early Warning System Earthquake" on REFEFO.
2.1.4 Analysis: Light as information medium in Communications. -
It can be admitted that in the communications an energy exchange is put into play that can be classified of different ways. One of them is the spectral one. In this concept, two parameters are related: space and temporal.
Spatial parameter we will relate to the “wavelength” since this reflected space propagation (periodic) and the other parameter which is the temporal frequency are called.

Text: Spectral of electromagnetic waves
Infrared-Ultraviolet-X rays Gamma Rays-Cosmic Rays
Extremely low frequencies- Radio electric waves-Microwaves-Visible spectrum
RED-ORANGE-YELLOW-GREEN-BLUE-VIOLET
Non- ionizing radiation-Ionizing radiation –Thermic effects
Thermic Effects
Frequencies-Frequency bands- Wavelength
Figure 1.9 Electro magnetics waves spectrum
Figure 9: Electro magnetics waves spectrum.
If we were placed in the temporary parameter (frequency), and analyze its propagation in the metallic conductors of pairs we can transmit energies around 1000MHz in theoretical form, which differs from the practice, where are reached 100MHz (UTP STD). In the case of the radio links, it is reached not more than 20/40GHz in the practice (the theoretical value is until 10
11Hz).

If both previous signals are used like “transport” to apply on them frequency modulation techniques (useful information), these will be the “carriers”, and if these are used on transmission channels of a determined bandwidth, an optimization of this one will be obtained, which will allow transmitting a greater amount of signals than without this technique.
In systems on which optics fibers like transmission means are used, optics spectral zone, frequency is around 10
14Hz, and if techniques of frequency modulation were used, it could get a transmission capacity of 10
7 times greater than of a metallic conductor, about of 10
4 times the one of a radio link.
About the expressed in the previous paragraph, the physical justification of the increasing use of optics fibers in all the systems of loss telecommunication resides low/middle and high transmission capacity, where no “ceiling” or speed limit of the side of “means of transmission or connects optician” is observed, being only limited by the optics active equipment used at the ends of the connection and that evolves year after year.
Text: Transmission –Transmission media –Copper-Optical Fiber-Radio (air-emptiness) Receptor
Based on this canonical model forms the basic communication model:

Text: Node-link-terminal
Making a comparison between the canonical model and the basic one, we can say that the means of transmission of one happen to be the connection of the other, and the transmitter and the receiver migrate to which node and terminal are called, respectively. But following in what location are the transmitter and the receiver, they will vary the importance and the capacity of information that they issue. For example, in a node, they will be communications equipment of high capacity, and in a terminal, a telephone or modem, in agreement with the service.
If we put together several basic models, a real communications network forms, as it shows the following figure:
Generic Telecommunications network Basic layers
Figure 10: Telecommunications Network. Basic block diagram
2.1.6 Why Optical Fiber? - One of the objectives in the telecommunications world was looking for a physical transmission medium capable of carrying large amounts of information and that it may suffer less deterioration over long distances. In that search were found as copper conductors (coax, twisted pair), the optical fiber and the same air (radio links, satellite), obtaining all these different strengths and weaknesses for application in the field of telecommunications. Physical media
EQUIPMENT
PHYSICAL A
SERVICE SEIO
EQUIPMENT
PHYSICAL B
SERVICE

capable of delivering information mentioned stands out: the optical fiber, either by the cost of implementation, cheaper than a link or satellite link, as the information-carrying capacity, higher bandwidth than Radio and copper links to great lengths to link. The advantages of optical fiber as the transmission medium are:
a) Low Attenuation: Optical fibers are the physical transmission medium with lower attenuation, since it can establish direct links, i.e. without repeaters, about 100 to 200 km, thereby increasing the reliability and reducing the cost of electronic equipment.
b) High Bandwidth: The transmission capacity is very high transmission systems on a single wavelength. This capacity can be increased by methods multiplexed wavelengths, such as WDM systems (Wavelength Division Multiplexing). For example two optical fibers can carry all the telephone conversations of a country, provided that the transmission equipment to be able to handle so much information (between 100Mhz/Km to 10Ghz/Km).
c) Reduced weight and size: The diameter of an optical fiber is similar that a human hair. A cable of 60 optical fiber has a total diameter of 15 to 20 mm and an average weight of 250 Kg / Km, instead of copper wire pairs 900 0.4 gauge has a diameter ranging between 40 and 50 mm and a average weight of 4.000 Kg / Km, if we compare these values can be deduced that the fiber optic cable increases the ease and cost of installation.
d) High flexibility and available resources: optical fiber cables can be constructed totally with dielectric materials and the raw material is implemented in the manufacture of silicon dioxide (SiO2), which is one of the most abundant resource in the surface Earth.

e) Electrical insulation: the absence of metal conductors can not induce currents in the cable (valid for optical fiber cables without armor), can therefore be installed in places where there are dangers of power cuts.
f) Absence of radiation: optical fibers carry light and emit electromagnetic radiation that may interfere with electronic equipment is not affected by radiation emitted by other means surrounding it, by the thus constitutes a secure transmission means for transporting information high quality to be implemented at sites where the emission of electromagnetic radiation is not accepted.
g) Cost and Maintenance: Optical fiber cables and the technology associated with the manufacture and installation has fallen sharply in recent years, which is why today the cost of building a plant fiber is comparable plant copper. Another important point is the maintenance of the plant, which in one fiber plant requires almost no maintenance or are significantly lower compared with copper.
Therefore, it can be concluded that the optical fiber, depending on the requirements of the particular communication may constitute the best physical medium for transporting large amounts of information without suffering damage it by external agents.

2.2 OPTICAL TRANSPORT NETWORK: OPTICAL FIBER FEDERAL
NETWORK PROJECT.
Broadband is the essential infrastructure of XXI century as it was created dirt roads first and then the railroad a century ago is a platform of opportunities to stimulate economic growth, innovation and equal opportunities.
In today's world we live in the new developments in electronic communications are evolving continuously adapting to the demands of human permanent, changing the way we educate our children, provide health care, manage energy, compromising the government, to ensure public safety and civil protection by providing new ways to ask for help and receive emergency information quickly and efficiently.
As part of the national telecommunications Argentina Conectada, Federal Network of Optical fiber, is born, a project of national infrastructure whose primary purpose connectivity throughout the territory of the Argentine Republic, covering regions not currently have this type of infrastructure and reaching areas that incumbents do not cover by commercial decisions.
Argentina Conectada, defines the state a leading role in the field of telecommunications, promoting the creation of a national telecommunications operator, ARSAT SA Argentina satellite solutions company to administer the Federal Network Optical Fiber from its central node built in Benavidez, Province of Buenos Aires, where remotely will be coordinated and controlled all primary and secondary nodes of the network.

In the wholesale market, the role of ARSAT S.A. involves the management and marketing of services to provide cooperatives, SMEs and local operators the bandwidth necessary to ensure the provision of quality services to users around the country.
The Federal Network Optical Fiber is divided into nine regions, this network of 18,000 km in a first stage, will allow the interconnection of individual provincial operations centers and provincial access points to the network with the national operations center and the national point of network access that is located in Benavidez as mentioned above, this run is complemented with12, 000 km belonging to other suppliers, which added to the provincial networks will total one ultimate goal of more than 60,000 km long, and together with satellite services also provided by ARSAT SA will ensure the inclusion of all the inhabitants of the territory. Among the implications presented by this network, there is the contribution of technological change that this project will generate transformer across our land, ranking this as a strategic pillar for continuous improvement of governance and regional connectivity.

Federal Network Optical Fiber. Provincial Network Optical Fiber
Source:http://www.argentinaconectada.gob.ar/contenidos/red_federal_de_fibra_optica.html
The Federal Network of Optical Fiber has two stages:
Stage I: Using existing optical fiber networks in Argentina. Stage II: Building backbone and Provincial
o Federal Backbone: Building in 9 regions. o Networks and provincial rings

2.2.1 Stage I: Using existing optical fiber networks
IRU `s 12,000 km. approx. (Contracts of Irrevocable Right of Use).
Text: IRU´s operator Distribution-Partial KM-Localities-Total KM
Distribucion de IRU´s por
operadorKM Parcial Localidades KM totales
A 447 Bs As - M del Plata 2016
560 Tres Arroyos - 9 de Julio
532 BB Neuquen
477 M del Plata BB
B 381 Usuhaia Pampa del rincon 1845
352 Posadas Pasos de los libres
322 Posadas Corrientes
351 Zarate Concordia
208 Cordoba Serrezuela
231 Catamarca Tucuman
C 537 Cordoba Tucuman 2804
326 Tucuman Salta
100 Salta Jujuy
425 V Mercedes (SL) Lincoln
402 Catrilo Chivilcoy
217 Bariloche P del Aguila
231 Bariloche V la Angostura
566 Bs As - M del Plata
D 611 S Tome P de los Libres 1287
S Tome Rafaela
S Fransisco Rafaela
S Fransisco Arroyito
Arroyito Rio Primero
Rio Primero Cordoba
239 Cordoba Rio Cuarto
E Benavidez Resistencia 1125
F Abasto Malargue 2060
11137
437

2.2.2 Phase II: Construction in 9 regions, 17,100Km Main.
Text: Number. Region-Main Km per region-Provinces- Main stretches km per province- Provincial stretches per province. Derivations Km.
Region:
East Centre-West Centre-Misiones Region-NWA South-NEA North-NEA South-North Patagonia-South Patagonia
New stretches to be built, which are defined regions of Federal Network Optical Fiber Project:
a) Central East Region.
Nro Provincias: 5
Troncal: 2.410 Km
Derivaciones: 748 Km
Provincial: 5373 Km
DATOS RELEVANTES

Texto: Important Data. Number of provinces. Stretch-Derivations-Provincial
SOURCE: http://www.prensario.net/1691-El-gobierno-argentino-presenta-la-red-federal-de-fibra-optica.note.aspx
Picture 11: East Centre Region.
b) East Centre Region
Texto: Important Data. Number of Provinces. Stretch-Derivations-Provincial
SOURCE: http://www.prensario.net/1691-El-gobierno-argentino-presenta-la-red-federal-de-fibra-optica.note.aspx
Picture 12: Central Region.
Note: This fiber optic network is especially important for use two hair fiber for remote measurement of earthquakes and covering an
Nro Provincias: 4
Troncal: 2.823 Km
Derivaciones: 321 Km
Provincial: A definir
DATOS RELEVANTES

area of high seismic potential (see Argentina earthquake map on page 50 Figure No. 3).
SOURCE: http://www.prensario.net/1691-El-gobierno-argentino-presenta-la-red-federal-de-fibra-
optica.note.aspx
Texto: Important Data. Number of provinces. Stretch-Derivations-Provincial
Picture 13: Misiones Region.
a) NWA North region.
SOURCE: http://www.prensario.net/1691-El-gobierno-argentino-presenta-la-red-federal-de-fibra-
optica.note.aspx
Nro Provincias: 1
Troncal: 694 Km
Derivaciones: 196 Km
Provincial: A definir
DATOS RELEVANTES
Nro Provincias: 3
Troncal: 2.168 Km
Derivaciones: 430 Km
Provincial: A definir
DATOS RELEVANTES

Texto: Important Data. Number of provinces. Stretch-Derivations-Provincial
Picture 14: NWA North Region.
Note: This fiber optic network is especially important for use two hair fiber for remote measurement of earthquakes and covering an area of high seismic potential (see Argentina earthquake map on
page 50 Figure No. 3).
e) NEA South Region
SOURCE: http://www.prensario.net/1691-El-gobierno-argentino-presenta-la-red-federal-de-fibra-optica.note.aspx
Texto: Important Data. Number of provinces. Stretch-Derivations-Provincial-to define
Picture 15: NWA South Region.
Nro Provincias: 5
Troncal: 2.520 Km
Derivaciones: 720 Km
Provincial: 1.078 Km
DATOS RELEVANTES

Note: This fiber optic network is especially important for use two hair fiber for remote measurement of earthquakes and covering an area of high seismic potential (see Argentina earthquake map on
page 50 Figure No. 3).
f) NEA North Region.
SOURCE: http://www.prensario.net/1691-El-gobierno-argentino-presenta-la-red-federal-de-fibra-optica.note.aspx
Texto: Important Data. Number of provinces. Stretch-Derivations-Provincial
Picture 16: NEA North Region
g) NEA South Region
Nro Provincias: 6
Troncal: 2.731 Km
Derivaciones: 492 Km
Provincial: 2.517 Km
DATOS RELEVANTES

SOURCE: http://www.prensario.net/1691-El-gobierno-argentino-presenta-la-red-federal-de-fibra-optica.note.aspx
Texto: Important Data. Number of Provinces. Stretch-Derivations-Provincial
Picture 17: NEA South Region.
h) North Patagonia Region
SOURCE: http://www.prensario.net/1691-El-gobierno-argentino-presenta-la-red-federal-de-fibra-optica.note.aspx
Texto: Important Data. Number of provinces. Stretch-Derivations-Provincial
Picture 18: North Patagonia Region
Nro Provincias: 6
Troncal: 2.731 Km
Derivaciones: 492 Km
Provincial: 2.517 Km
DATOS RELEVANTES
Nro Provincias: 6
Troncal: 2.731 Km
Derivaciones: 492 Km
Provincial: 2.517 Km
DATOS RELEVANTES

i) South Patagonia Sur and Tierra del Fuego Region
SOURCE: http://www.prensario.net/1691-El-gobierno-argentino-presenta-la-red-federal-de-fibra-optica.note.aspx
Texto: Important Data. Number of provinces. Stretch-Derivations-Provincial
Picture 19: South Patagonia region.
Texto: Important Data-Stretch- Submarine FO
Nro Provincias: 2
Troncal: 2.193 Km
Derivaciones: 100 Km
Provincial: 763 Km
DATOS RELEVANTES
Troncal
FO Submarino: 40 Km
DATOS RELEVANTES

Picture 20: South Patagonia and Tierra de Fuego Region (Strait of
Magellan crossing).
General scheme of the Federal Network Optical Fiber
Texto: International connections- Argentine Republic-NAP National (Access network point) –Regional NAP-Locality –
Province- International Network-Provincial Network- Stretch Network-Metropolitan Network –Last mile Network
Remote Measurement of Federal Network Optical Fiber to ensure minimum repair time

The lack of early detection to a degradation / fiber optic backbone cut is the main reason for non-compliance with SLA in optical transport networks of high level.
Federal Network Optical Fiber will use as a constitutive part a remote network of optical measurement in real time with GPS positioning so that before a degradation of this optical link is detected, recorded in a database and a ticket issued so NOC automatically from the Master of Benavidez, with replies to the region of the country where the problem has occurred.
The above definition will:
- Act ASAP, fulfilling the contracted SLA by ARSAT with different agencies / provinces / entities in the country, using their services. - Generate quality record of the optical parameters of the Federal Network as "historic" and thus preventive actions to keep the Federal Network in optimal conditions of information transport.
-Reduce investment in optical instruments maintenance in both federal and provincial network, to make the determination of faults remotely without the need for optical instruments or transported in bulk. Is illustrated as example in the picture below the basic scheme of remote measurement "Federal Network of Optical Fiber", based on OTDR in each node connected to a data network to a dedicated server.

Picture 21: Basic Remote Measurement Scheme for Federal and Provincial Network of Optical Fiber.
Summary: - There is an optical network with a range of thousands of miles and high capillarity (2500 cities) covering a high percentage of the Argentine Republic thus fulfilled its goal of generating high-quality national connectivity (low latency and minimum BER 10E-12) combined with high security by having multiple routing paths for traffic in each node (4-9 degrees of freedom per node) makes it a suitable infrastructure for use in optical networks for early warning of earthquakes or other natural disaster, for example.
-The main connection nodes by region (number 7) makes possible the connection of local sensors and local activation of early warning messages in the event, with direct outputs to cellular terminals or regional TV also directly through an alarm management system with access unified communications service to each intended to be used as a link with the inhabitants (e.g. phone / TV) 2.3 NATIONAL NETWORK OF SEISMIC ARGENTINE STATIONS

National Institute of Seismic Prevention (INPRES.) - INPRES has primary responsibility conducting studies and basic applied research in seismology and seismic engineering, for the prevention of earthquake risk by issuing regulations to make optimal stability and permanence existing civil structures in seismic areas of the country.
National Network of seismic stations is composed by fifty (50) stations distributed throughout the country. For topographical reasons and interconnectivity, distribution is integrated forming five areas of seismic risk and grouped into three zones namely North Zone network, Central Zone network and South Zone network.
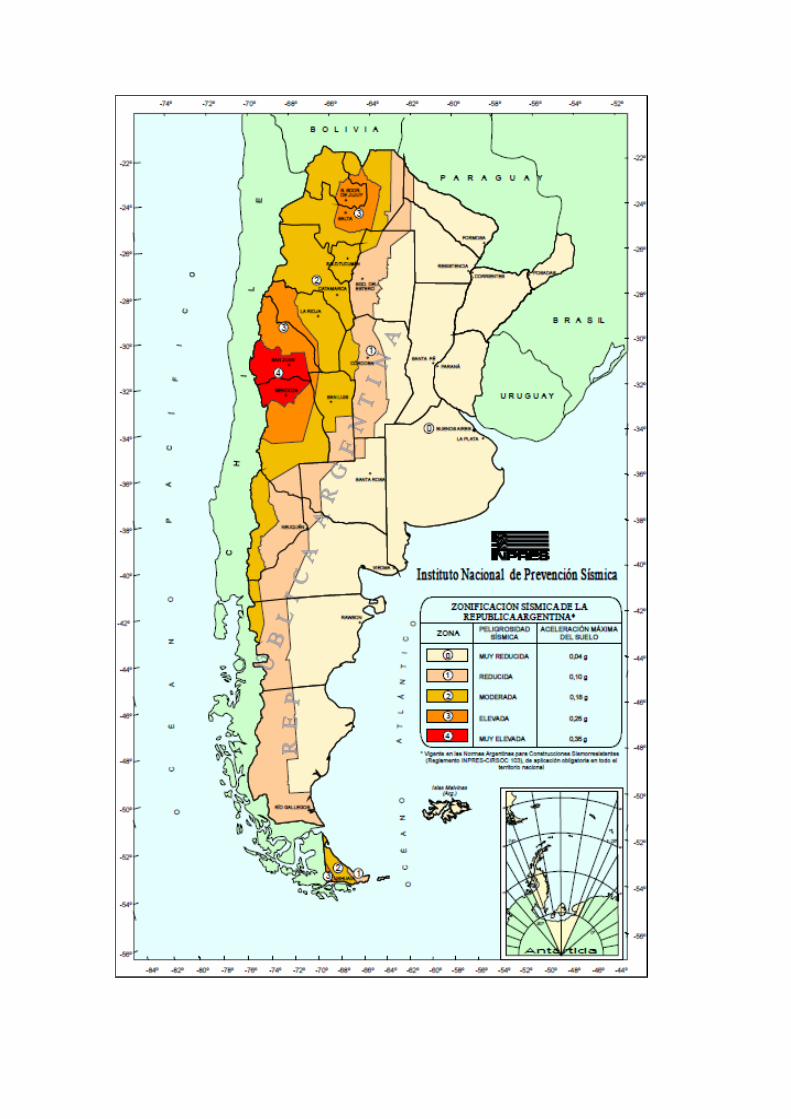

Picture 1: Zoning of Argentina according to the degree of seismic hazard.
SOURCE: INPRES
Argentina is divided into five zones according to the degree of seismic hazard, in agreement to the following table:

ZONAS PROVINCIAS LOCALIDADES
Calingasta - Ullún - Albardón - Angaco -Zonda - Rivadavia
Chimbas - Capital -Santa Lucía - San Martín - Pocito
ZONA 4 SAN JUAN Parte de Caucete - Rawson - 9 de Julio - Sarmiento
25 de Mayo
MENDOZA Las Heras -Parte de Lavalle - Godoy Cruz - Luján de Cuyo
Capital - Guaymallén - Maipú - San Martín - Junín
Parte de Orán - La Caldera - Gral. Güemes - Capital
SALTA Parte de Rosario de Lerma Chicoana - Cerrillos - Metán
Parte de Anta - Parte de Guachipas
Parte de Tumbaya - Tilcara - Valle Grande
JUJUY Capital - Ledesma - San Antonio - El Carmen
San Pedro - Santa Bárbara
Parte de Independencia - Gral. Sarmiento - Gral. La Madrid
LA RIOJA Parte de Gral. Juan Facundo Quiroga - Gral. Lavalle
ZONA 3 Parte de Rosario Vera Peñaloza
Parte de Lavalle - Tupungato - Rivadavia - Tunuyán
MENDOZA Santa Rosa - Parte de La Paz - San Carlos
Parte de San Rafael
SAN JUAN Parte de Caucete - Iglesia - Jáchal - Valle Fértil
SAN LUIS Parte de Ayacucho - Parte de Belgrano
TIERRA DE FUEGO Parte de Río Grande - Parte de Ushuaia
Famatina - San Blas de los Sauces - Chilecito - Arauco
Castro Barros - Sanagasta - Capital - Gobernador Gordillo
LA RIOJA Parte de Independencia - Gral. Belgrano - Gral. Ocampo
Gral. Angel V. Peñaloza - Parte de Rosario Vera Peñaloza
Parte de Gral. Juan Facundo Quiroga - Gral. San Martín
CATAMARCA En su totalidad
CORDOBA Cruz del Eje - Minas - Pocho - San Alberto - San Javier
MENDOZA Parte de La Paz - Gral. Alvear - Parte de San Rafael
Parte de Malargüe
NEOQUEN Minas - Chos Malal - Ñorquín - Loncopué - Picunches
Aluminé - Huiliches - Lácar - Los Lagos
RIO NEGRO Parte de Pilcaniyeu - Bariloche -Parte de Ñorquinco
ZONA 2 Santa Victoria - Iruya - Parte de Orán - Parte de Rivadavia
Gral. José de San Martín - Los Andes - La Poma - Cachi
SALTA Parte de Rosario de Lerma - Molinos - SanCarlos - Cafayate
Parte de La Viña - Candelaria - Rosario de la Frontera
Parte de Anta - Parte de Guachipas
CHUBUT Parte de Cushamen - Parte de Futaleufú
JUJUY Santa Catarina - Yavi - Rinconada - Cochinoca
Susques - Humahuaca - Parte de Tumbaya
STGO DEL ESTERO Parte de Pellegrini - Parte de Copo
Parte de Ayacucho - Junín - Parte de Belgrano - Capital
SAN LUIS Coronel Pringles - Libertador Gral. San Martín - Chacabuco
Parte de Gral. Pedernera
TIERRA DE FUEGO Parte de Río Grande - Parte de Ushuaia
Text: Zones-Provinces-Localities
Source: Authors based on INPRES (Regulation INPRES - CIRSOC 103)

ZONES PROVINCES LOCALITIESCalingasta - Ullún - Albardón - Angaco -Zonda - Rivadavia
Chimbas - Capital -Santa Lucía - San Martín - Pocito
ZONE 4 SAN JUAN Part of Caucete - Rawson - 9 de Julio - Sarmiento
25 de Mayo
MENDOZA Las Heras -Parte de Lavalle - Godoy Cruz - Luján de CuyoCapital - Guaymallén - Maipú - San Martín - Junín
Part of Orán - La Caldera - Gral. Güemes - Capital
SALTA Part of Rosario de Lerma Chicoana - Cerrillos - Metán
Part of Anta - Parte de Guachipas
Part ofTumbaya - Tilcara - Valle Grande
JUJUY Capital - Ledesma - San Antonio - El Carmen
San Pedro - Santa Bárbara
Part of Independencia - Gral. Sarmiento - Gral. La Madrid
LA RIOJA Part of Gral. Juan Facundo Quiroga - Gral. Lavalle
ZONE 3 Part of Rosario Vera Peñaloza
Part of Lavalle - Tupungato - Rivadavia - Tunuyán
MENDOZA Santa Rosa - Parte de La Paz - San Carlos
Part of San Rafael
SAN JUAN Part of Caucete - Iglesia - Jáchal - Valle Fértil
SAN LUIS Part ofAyacucho - Parte de Belgrano
TIERRA DE FUEGO Part of Río Grande -Part of Ushuaia
Famatina - San Blas de los Sauces - Chilecito - Arauco
Castro Barros - Sanagasta - Capital - Gobernador Gordillo
LA RIOJA Part of Independencia - Gral. Belgrano - Gral. Ocampo
Gral. Angel V. Peñaloza -Part of Rosario Vera Peñaloza
Part of Gral. Juan Facundo Quiroga - Gral. San Martín
CATAMARCA Totaly
CORDOBA Cruz del Eje - Minas - Pocho - San Alberto - San Javier
MENDOZA Part of La Paz - Gral. Alvear - Part of San Rafael
Part of Malargüe
NEOQUEN Minas - Chos Malal - Ñorquín - Loncopué - Picunches
Aluminé - Huiliches - Lácar - Los Lagos
RIO NEGRO Part of Pilcaniyeu - Bariloche -Part of Ñorquinco
ZONE 2 Santa Victoria - Iruya - Part of Orán - Part of Rivadavia
Gral. José de San Martín - Los Andes - La Poma - Cachi
SALTA Part of Rosario de Lerma - Molinos - San Carlos - Cafayate
Part of La Viña - Candelaria - Rosario de la Frontera
Part of Anta - Part of Guachipas
CHUBUT Part of Cushamen - Part of Futaleufú
JUJUY Santa Catarina - Yavi - Rinconada - Cochinoca
Susques - Humahuaca - Part of Tumbaya
STGO DEL ESTERO Part of Pellegrini - Part of Copo
Part of Ayacucho - Junín - Part of Belgrano - Capital
SAN LUIS Coronel Pringles - Libertador Gral. San Martín - Chacabuco
Part of Gral. Pedernera
TIERRA DE FUEGO Part of Río Grande -Part of Ushuaia
Source: Authors based on INPRES (Regulation INPRES - CIRSOC 103)
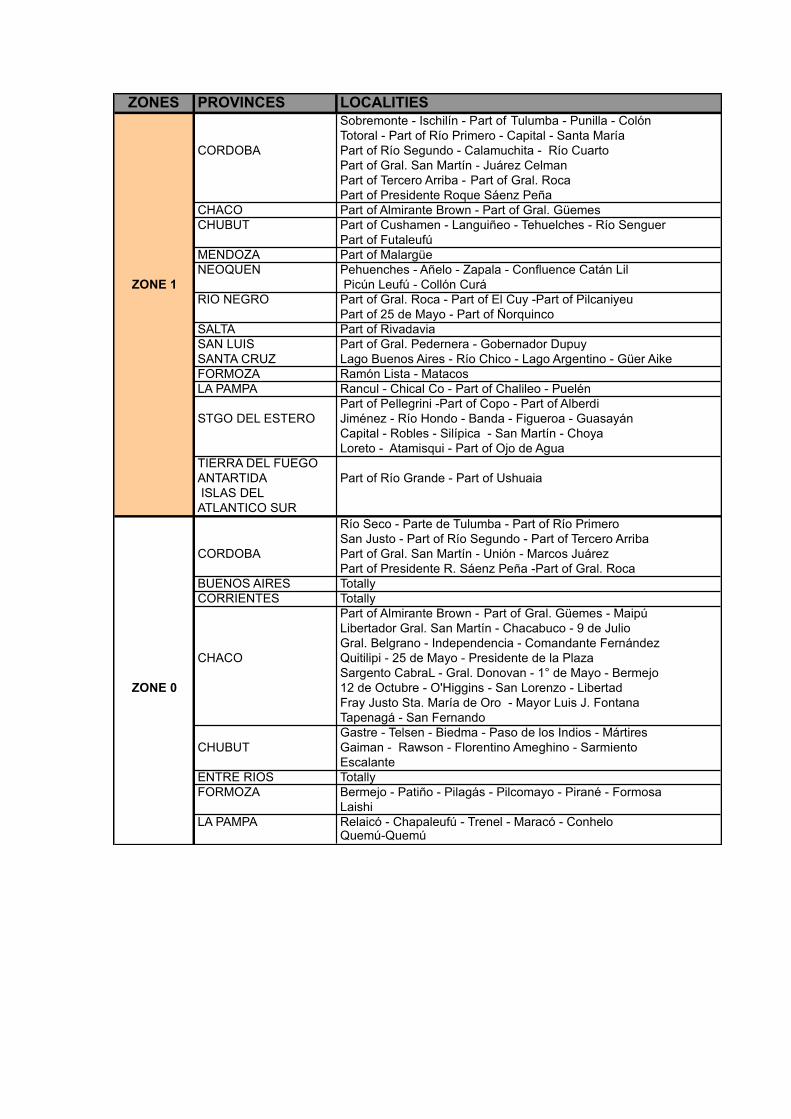
ZONES PROVINCES LOCALITIESSobremonte - Ischilín - Part of Tulumba - Punilla - Colón
Totoral - Part of Río Primero - Capital - Santa María
CORDOBA Part of Río Segundo - Calamuchita - Río Cuarto
Part of Gral. San Martín - Juárez Celman
Part of Tercero Arriba - Part of Gral. Roca
Part of Presidente Roque Sáenz Peña
CHACO Part of Almirante Brown - Part of Gral. Güemes
CHUBUT Part of Cushamen - Languiñeo - Tehuelches - Río Senguer
Part of Futaleufú
MENDOZA Part of Malargüe
NEOQUEN Pehuenches - Añelo - Zapala - Confluence Catán Lil
ZONE 1 Picún Leufú - Collón Curá
RIO NEGRO Part of Gral. Roca - Part of El Cuy -Part of Pilcaniyeu
Part of 25 de Mayo - Part of Ñorquinco
SALTA Part of Rivadavia
SAN LUIS Part of Gral. Pedernera - Gobernador Dupuy
SANTA CRUZ Lago Buenos Aires - Río Chico - Lago Argentino - Güer Aike
FORMOZA Ramón Lista - Matacos
LA PAMPA Rancul - Chical Co - Part of Chalileo - Puelén
Part of Pellegrini -Part of Copo - Part of Alberdi
STGO DEL ESTERO Jiménez - Río Hondo - Banda - Figueroa - Guasayán
Capital - Robles - Silípica - San Martín - Choya
Loreto - Atamisqui - Part of Ojo de Agua
TIERRA DEL FUEGO
ANTARTIDA Part of Río Grande - Part of Ushuaia
ISLAS DEL
ATLANTICO SUR
Río Seco - Parte de Tulumba - Part of Río Primero
San Justo - Part of Río Segundo - Part of Tercero Arriba
CORDOBA Part of Gral. San Martín - Unión - Marcos Juárez
Part of Presidente R. Sáenz Peña -Part of Gral. Roca
BUENOS AIRES Totally
CORRIENTES Totally
Part of Almirante Brown - Part of Gral. Güemes - Maipú
Libertador Gral. San Martín - Chacabuco - 9 de Julio
Gral. Belgrano - Independencia - Comandante Fernández
CHACO Quitilipi - 25 de Mayo - Presidente de la Plaza
Sargento CabraL - Gral. Donovan - 1° de Mayo - Bermejo
ZONE 0 12 de Octubre - O'Higgins - San Lorenzo - Libertad
Fray Justo Sta. María de Oro - Mayor Luis J. Fontana
Tapenagá - San Fernando
Gastre - Telsen - Biedma - Paso de los Indios - Mártires
CHUBUT Gaiman - Rawson - Florentino Ameghino - Sarmiento
Escalante
ENTRE RIOS Totally
FORMOZA Bermejo - Patiño - Pilagás - Pilcomayo - Pirané - Formosa
Laishi
LA PAMPA Relaicó - Chapaleufú - Trenel - Maracó - ConheloQuemú-Quemú

Picture 2: Map of Maximum currents in Argentina

SOURCE: INPRES

Picture 3: Map of Seismicity of Argentina
SOURCE: INPRES
2.3.1 Seismic Network. - Seismic networks are composed of field and central registration stations. The instruments are at different stations can detect speed (traditional network) or acceleration (called strong motion network) on the ground before a seismic event.
a) Field Stations: houses the sensor or geophone that detects and amplifies the ground motion, equipment needed to convert the mechanical signal ground in an electromagnetic signal that can be transmitted to the central recording station, the antenna that emits the signal, the batteries that provide power to the other elements and a solar panel accompanied by a regulator that keeps the batteries charged. Modern sensors are basically pendulum-damped oscillations, which can be converted into an electrical signal. The pendulum swings can work in a vertical plane or in a horizontal depending on how the pendulum mass is subjected, in the first case would have a vertical sensor (normally called component Z), the second case we have two freedom degrees, giving sensor in a North-South (NS component) and finally a sensor East-West (EW component).
Picture 4: geophones or modern sensors, horizontal sensors

(Components NS - EW) and Vertical Sensor (Component Z)
Besides sensors can detect the speed and acceleration of the ground, the first ones (NS – EW components) are designed to detect moderate seismic activity are basic requirements for seismic monitoring of an area, the second (Z component) receive the special name of "accelerometers", and are prepared to detect strong seismic activity, being almost insensitive to moderate and small scale.
Seismometers are characterized by the “characteristic response” (Alguacil, 1986; Payo, 1986; Kulhanek, 1991), it reflects the overall behavior of the seismometer and therefore the appearance of the seismogram. The characteristic response is not more than a graph, which depicts the amplification of the seismometer, detects movement versus frequency of oscillation, which disrupts the instrument.
The field stations are deployed in an area of interest for its seismic activity. They are located in remote parts of the "seismic noise", i.e. towns, roads, lush vegetation, and coastal enclaves that are not sheltered from adverse weather events, such as the wind. Besides field stations may be fixed or mobile, in the first case, computers that run continuously from the same point and with little technical maintenance and in the second case, it is ad hoc teams displaced in a zone eventual interest itself (for example, in the case of swarm which is the occurrence of a seismic event set in a specific area during a period of time).
b) Registry Central Station receives and records information detected and sent by the field stations. The electrical signal reaches the central recording station suffers two treatments:

• Again it is converted into a mechanical signal and is recorded by a tape print medium web (analog recording)
• It is digitized and recorded on a computer means (digital recording)
The records are called, respectively, analog or digital seismograms are fundamental data that the researcher can extract information about the seismic event, and treatment and the same process are crucial part of any seismologist information.
2.3.2 Analog stations with IN-SITU. - This group consists of the first stations were installed in the country and its configuration can record one, three or six components of ground motion. They are equipped with analog seismic systems, typical of the technology of the time; the seismic signal is amplified and plotted on a strip of paper during 24 hours. The record obtained is called "seismogram". These records, in addition to capturing seismic waves have a timestamp, indispensable for analysis, the time signal is incorporated into the record from a high-precision clock, located in the station, which is daily corrected by radiofrequency from Central INPRES.
2.3.3 Telemetric stations. - This type of stations are classified into two main classes:
a) Analogic telemetry stations. - These stations, which are also known as "remote stations" analog seismic signals, from sensors deployed in the same, are amplified and conditioned to be transmitted by radio links, with continuously without interruption, either directly or via relay stations, to a distant receiving station, where it is incorporated and the time signal is digitized and transferred to a test system. Remote

stations can register, one or three components as applicable, to which have an analogue amplification and transmission of information in real time to enable such alternatives. In radio links are used radio equipment in the VHF or UHF frequency modulation (FM), to ensure good fidelity to that information. See Figure No. 5 with drive system "dial up".
Text: Remote Station- Public telephonic line-Digital Registry for the seismic activity
INPRES Central- Central Station of registry-Place City of San Juan
Analysis System
References: GPS-Seismometer triaxial of Broad Band-Data acquisition System (Digital) with DIAL-UP Telephonic modem (2 wire/28800 bps)

Available analysis system in INPRES
Picture 5: Telemetric Instrumentation Station
Remote Monitoring of seismic activity DIAL-UP
Source: INPRES.
b) Digital telemetry stations. - In this System of digital data acquisition are used. These are programmable computers, microprocessors using latest generation ultra low power and high reliability. They have enough memory drive for storing programs and operational control instructions allow for the incorporation of additional operational commands that allow you to work as intelligent remote station transmitting the information acquired in real time via two-way radio links VHF or UHF frequency modulation (FM).
The registration information of the hour, minutes and seconds to the identification of events, from a very high stability built-in clock, with a precision of about one part per million (PPM) / ° C for temperatures from -20 to + 60 ° C, with a displacement of less than 10msec per month, which is synchronized, to others in a time signal of universal time, through a system of automatic adjustment schedule satellite (GPS). This watch delivers a coded signal of year, day, and hour, minute and second, which is setting the time and automatically adjusted. It is like a clock pattern used in optical transmission systems SDH technologies.
To avoid loss of information acquired, before an interruption of communications, data acquisition equipment digital storage medium used as a magnetic carrier, the capacity of the order of 3Gb. This configuration allows the team to gain further information for a sufficient period, until the link is restored or the

inconvenience that caused the stoppage of the transfer of information.
2.3.3 Sub-centers. – Sub-centers, as the name implies, are the sites where records are obtained from the remote stations that make up a Network Zone, communication from these stations to the sub-center is done by two-way radio links in electric VHF or UHF bands and down towards the telephone Central (Dial-Up). The equipment installed consists of a data acquisition system with high-capacity storage, RF modem, a telephone modem and communications programs for two routes.
2.3.4 Collection Center, Processing and information Analysis. - This center is located in the Institute's headquarters, where all the information is stored, sorted, processed and analyzed.
2.3.5 Mobile Team. - As its name implies, is made up of a number of portable seismic stations, which are installed, for a period of time, in strategic locations to obtain records of seismic activity in a specific area for perform special studies, such as:
• Replicas detection: Determining accurately, seismic activity after the occurrence of an earthquake of great proportions, by installing several teams in the affected area. This action complements the information obtained from the National Network of Seismic Stations.
• Studies of seismicity in certain areas.
• Determination of seismic activity induced by the filling of dams.
• Determination of the seismic activity of a geological fault.
• Determination of the seismic noise, for site selection and location of sensitive vibration equipment.

Portable stations, available in the Institute, are classified into two types:
a) Portable stations with analogue technology: These stations are made with:
o a seismometer. o a continuous recording channel. o a high stability clock. o an amplifier with gain and selectable filter. o a drum or paper registration, the registration may be made
of ink on smoked paper. The recording chart speed is selectable.
A battery system incorporated, independently of about 72 hours.
b) Portable stations with digital technology: These stations are made with:
o A data acquisition system programmable to record six channels with corresponding seismometers.
o Broadband amplifiers and filters programmable of high dynamic range.
o 24-bit digitizers. o High stability clock controlled by GPS. o Magnetic media for storing registers. o Incorporated batteries, with range of up to a month,
depending on the recording mode. o Radio transmission systems, if include remote sensors for
greater coverage area are required.
2.3.6 National Institute of Seismic Prevention (INPRES)
Among its main features we can mention the following:

• Plan and conduct the seismicity study of the national territory, assessing the seismic risk in every zone of the country.
• Operate throughout the country the National Network of Seismological Stations, National Network of accelerometers and, at the headquarters of the National Institute, the Laboratory of Earthquake Resistant Structures.
• Plan and provide regulations that rule the construction of each seismic zones of the country.
• Project and make technological studies and provide technical assistance regarding construction materials and seismic systems.
• Conduct awareness campaigns at all levels, to create an awareness of the seismic problem and its solutions and conduct
technical extension publications.
• Provide technical assistance in specific disaster caused by earthquakes, in order to solve the problems arising from the
destruction of buildings and civil infrastructures.
• Act as local validation authority, from the seismic point of view, in large infrastructure projects such as hydroelectric plants,
mining facilities, power plants, etc. Installed or being installed in the country.
• Implement the National Seismic Prevention Policy.
INPRES, is responsible for the installation and maintenance of the National Network accelerometer (RNA) Actually has 143 devices distributed nationwide. With the last 70 installed, have joined the
greatest technological advances in the field, such as digital recording, data acquisition directly through a personal computer
(PC), obtaining high definition records, and the possibility of remote operation, via modem (communication with the device
installed anywhere in the country by telephone from headquarters INPRES through a computer).
Cuadro
Texto: Telephonic communication (Modem)-Personal Computer

Accelerometer-accelerometer
Picture 6: RNA Components
Source: own elaboration


Picture 7: Map of the National Network accelerometer (143 Points)
SOURCE: INPRES.
Table: Location accelerometer sites in Argentina
PROVINCES LOCALITIESCalingasta - Ullún - Albardón - Barreal -Zonda - Rivadavia - CauceteChimbas - Encon - Jachal - Las Flores - Media Agua - Pie de Palo
SAN JUAN Pocito - Rawson - Rode - San Juan - San Martin - Santa Lucia Tamberias - Valle Fertil
El Carrizal - Gnral. Alvear - La Paz - Las Heras - Malargue - Mendoza
MENDOZA Lavalle - Godoy Cruz - Luján de Cuyo - Guaymallén - Maipú - TunuyanSan Rafael - San Martín - Uspallata
Cafayate - Chachapoya - San Ramon de la Nueva Orán - El Tunal
SALTA Guemes - La Merced - Laviña - Metán - Rosario de la Frontera - SaltaSalvador Maza - San Lorenzo - Tartagal - Cnel. Moldes
Carlos Paz - Cordoba - Cosquin - Dean Funes
CORDOBA Rio Cuarto - Rio Tercero - Salsacate Sampacho - Villa Dolores
Burruyacu - Concepcion - El Cadillal
TUCUMAN J.B. Alberdi - Tucuman - Tafi del Valle
San Pedro de Colalao
Anillado - Capial - Chilecito
LA RIOJA Chamical - Chepes
La Rioja - Patquia
Belen - Catamarca
CATAMARCA Choya - Santa MariaTinogasta
Humahuaca - Jujuy
JUJUY La Quiaca - San MartinSan Pedro
SAN LUIS Merlo - QuinesSan Luis - Villa Mercedes
NEOQUEN Alta Barda - Buta RanquilPiedra de Aguila - Zapala
STGO DEL ESTERO Frias - Santiago del Estero - Termas de Rio Hondo
LA PAMPA Colonia 25 de Mayo - Santa Isabel
CORRIENTES Ituzaingo - Yacyreta
RIO GRANDE Bariloche
CHUBUT Esquel
Source: Compilation based INPRES
Summary:
- Shows an INPRES network of sensors distributed in seismic quakes, more than 100, connected to a central node by radio
(VHF) or copper telephone lines exist through dial up.
- Have more measurement points gives more information collected by the system and ensures INPRES best record seismic
events, thus having more number of sensors is useful but its connection from the ground instead of the node sampling remains
a complex point as it registers isolated areas and to date (2012) INPRES had no other networks to reach the central node and acquire data. Today it is possible to improve this information
collection network using REFEFO as we will see later.
2.4 SCADA SURVEY SYSTEMS AND MULTIVARIATE CONTROL APPLIED TO OPTICAL NETWORKS.
Supervisory Control Systems and Data Acquisition (SCADA) are applications designed to control and monitor geographically dispersed data as environmental sensors. These systems are
based on the acquisition and transmission between a host computer and a number of SCADA remote terminal units (RTUs)
and / or programmable logic controllers (PLC), the central operator terminals and improving the efficiency of the monitoring
process and Control.
These systems can be relatively simple, such as monitoring of environmental conditions of a small office building (Picture 1) or
too complex monitoring a nuclear plant or seismic activity of a sectored country.

Picture 1: Environmental sensors.
Source: DPS TELECOM.
Traditionally, SCADA systems have made use of the public switched network (PSTN) for control purposes or radio systems,
typically VHF. Today many systems are monitored using the infrastructure of local area network (LAN) and wide area networks (WAN). Wireless technologies are being widely
deployed for monitoring purposes.
A SCADA application has two elements:
a) The process / system / machinery to monitor or control is required, this can be a power plant, a water system, a network, a
system of traffic lights or anything that you want monitor.
b) A network of intelligent devices, which are connected with the first system via sensors and control outputs.

A SCADA system execute four functions:
• Data Acquisition.
• Network Data Communications.
• Data presentation.
• Control.
The four SCADA functions are performed by four kinds of SCADA components:
a) Sensors (digital or analog) and control relays that interact directly with the managed system.
b) Remote Telemetry Units (Remote Telemetry Units, RTUs). These electronic devices which interconnect microprocessor controlled physical world objects via data transmission, these
devices are deployed in specific sites, where acquisition points of local data receive sensors status and deliver commands to control
relays.
c) SCADA Master Units (Master Units, MTU). They are large computer servers that serve as the central processor in the SCADA system. Master units provide a human interface (Human Machine Interface, HMI) to support the communications system, monitor and remotely control located field data in the interface devices.
d) The communications network is which connects the SCADA master unit to remote telemetry units (RTUs).

Picture 2: Schematic SCADA.
Source: GLOBALSCADA.
Texto: A typical SCADA scheme
Remote sensors and RTUs- Communication channel- Master Station
2.4.1 Discrete versus analog alarms. - Some sensors detect on / off conditions which are reported as on and off, as in the case of a
building access system as shown in picture 4, which is accessed by fingering a single card or personal authentication code, which can
be represented as an analogue value that crosses a threshold, other sensors measure more complex situations, where accurate
measurement is very important and precision as in the case of seismic thresholds for classification of alarms.

Picture 3: Building Access System (BAS)
Source: DPS TELECOM.
For most analog measurements, the ideal is to keep the desired value between a medium and higher level. For example, you may
want the temperature in a server room remains continuous values between 16 and 22 Celsius degrees, or also may want to monitor
an industrial plant variables driving voltage, temperature, pressure, gas emanation, etc. Immediately notifying if sensors
detect conditions outside that range.

Picture 4: Thresholds values.
Source: DPS TELECOM.
In more advanced systems, there are four threshold detectors see figure 4 or more user-defined values to help you distinguish the "
alarms severity ", indicating when certain value had exceeded another, such as an alert minimum seismicity and province,
outside the threshold range that threatens the population, set by INPRES.
One of the main advantages of using "analog sensors" for environmental monitoring is the ability to control the change of analog values in real time. This helps to take quick decisions and
prioritized for any eventuality previously located the critical measurement points of distributed centralized seismicity of the
affected area.
2.4.2 Sensors power. - Main options for the sensor supply SCADA system:
a) Commercial Energy. - This is a simple implementation of SCADA sensors energy. However, when the remote sites experience a power outage, so do their sensors and are
unprotected from a power surge.

b) RTU Energy. - The ideal way to provide power to the sensors is through a secure supply redundant power. Using SCADA and power supply, sensors are protected from commercial power
failures because they are running on the same battery protection.
5.2 ENVIRONMENTAL OPTICAL SENSORS AND APPLICATIONS.
Optical fibers have strongly contributed to the development of the telecommunications industry and in the sensors area for over
three decades. Because you need to keep getting better use of the special features that fiber has, optical devices have been built as
DWDM couplers (Dense Wavelength Division Multiplexing), amplifiers and environmental sensors that have contributed the
ongoing development of our networks because they are inherently low loss and can be interconnected networks that
transport different complex signals. With these systems, called "All Fiber" has dropped one of the constraints for any system of
long-distance communication, which is the loss of signal attenuation.
Photonics covers a broad spectrum of activities related to the phenomena study of light interaction with pure or doped
materials with atoms or molecules, which act as optically active centers, examines the light emission processes, propagation,
deflection transmission, amplification and detection. Photonics has dramatically boosted the search for materials that may have
application in optical communication technologies, radiation detectors, fluorescent color screens, optical filters, optical drives,
as active media for lasers coordinated frequency in devices optoelectronics, information transmitting means, routers and
optical radiation controllers, optical memories, etc.

Sensors based on this technology can be used to measure many different parameters, such as temperature, pressure,
displacement, electric field, refractive index, rotation, position, vibration, volcanic emissions, etc. The design includes various
multiplexed types (WDM, TDM, etc.) and signal coding methods similar to those used in electronic devices, which reduces
substantially the cost of the systems. Different variants enable the development of discrete sensors e.g... Twenty sensors in a fiber (in
certain applications up to thousand sensors per fiber) or continuous (Picture. 5)
Picture 5: Distribution of optical sensing with a continuous cable.
Source: ESANDS.com
Among discrete sensors can mention interferometry’s fiber optic sensors and particularly to those generated by refractive index
variations of periodic type generated in the core of a

photosensitive fiber (Bragg grating, long period networks), which have many advantages over other optical fiber sensors.
One of the main advantages of the sensors based on Bragg grating is attributed to the identification by wavelength of the external parameter information transmitted by the network. Since the
wavelength is an absolute standard, signals reflected by the FBG (Fiber Bragg Grating) can be processed so the information
remains immune to power fluctuations along the optical path. This inherent characteristic of FBG sensors makes it very attractive for applications in harsh environments, smart structures and in situ
measurements. They are widely used in the development of optical sensing techniques, acting as precise monitoring sensors in
real time, thanks to the multiple advantages including unlimited bandwidth and noise immunity.
As mentioned sensing types can be classified as:
a) PRECISE SENSING: A single sensor for each fiber strand, located at a particular interest point.
b) ALMOST DISTRIBUTED SENSING: Various sensors on a single fiber strand, interrogated by multiplexing (e.g. FBG technology)
c) DISTRIBUTED SENSING: Measuring system in which the same fiber acts as a distributed sensor capable of sensing at all points along the link based on non-linear effects (Raman or Brillouin
effect).
The general advantages presented by the fiber optic sensors are the following:

Immunity to electromagnetic interference, applicable:
• Electromagnetic fields or high voltage environments.
• explosive, corrosive or chemically aggressive.
• High and low temperatures.
• Environments exposed to nuclear radiation / ionizing.
Lightweight, small size, flexible, low thermal conductivity. Electrical insulation, low-loss transmission of signals over
long distances without repeaters (remote sensing). Electrically liabilities. Chemically inert. Easy to install.
Ability to remote interrogation, fiber working as transducer element and transmission medium.
Big wavelength
Fiber optic sensors accelerate the transition of the entire telecommunications industry in its transition from the world of
digital electronics digital photon.
2.5.1 Particular advantages of sensors based on FBG.
We can mention the following:
Multiplexing Capability (Sensor Networks) of several transducers to share expensive terminal equipment and
reduce the amount of required wiring. Embedded Installation ("smart structures")
Wavelengths coding. Mass production at reasonable cost.
High strains resistant.

High and low temperatures resistant (from 4 degrees Kelvin to 1000 degrees Celsius).
Ability to achieve long distances between sensors and data acquisition devices.
FBG technology provides higher multiplexing capacity, compared with higher precision technology and distributed measurement
encoded as absolute parameter signals wavelength are (self-referencing). It can be implemented with FBG:
• Temperature sensors
• Strain gauges
• Accelerometers
• Pressure sensors
• Inclinometers
• Displacement sensors
2.5.2 Industrial applications. - FBG technology can be used in the following areas:
• Monitoring of civil structures: Bridges, Tunnels, Dams, and Highways. Important variables such as deformation, displacement,
pressure, temperature and beams vibration, columns, platforms, bridges, retaining walls and other structural elements. The most important requirement, which must be, met deformation sensors is the long-term stability of the system output data, which can be achieved by a measurement system calibration almost as free of
FBG technology.

• Oil wells monitoring: located both on land and the bottom of the sea. Important variables such as: temperature, pressure and
fluid.
• Pipelines transportation monitoring: one of the most critical structures in the world, since most are in places difficult to access and require close monitoring to prevent environmental disasters. If any damage occurs, the real-time monitoring of FBG sensors can
help to reduce the time and repair costs, since it is possible to know the exact location of the damage. Variables such as strain
and temperature.
• Oil storage tanks monitoring: to identify leaks and fluids that can contaminate soil or water because of possible oil spills.
Variables such as leak detection.
• Hydroelectric plant monitoring: Variables such as vibration and temperature.
• Power cables monitoring. Variables such as vibration.
• Power transformers monitoring. Insulating material degradation between windings, calculation mistake of electric
thermal behavior, the effect of power surges generate temperature increases, which in turn can lead to malfunction of
the processor, or if it is located in a substation, generate blackouts over wide geographical areas. Variables such as vibration and
temperature.

3. WORKING HYPOTHESIS
3.1. GOAL. – Its proposal is interconnect telecommunication network of the project "Argentina Conectada" with the national network of seismology INPRES and add to this the use of new optical sensors developed by CIOP, Universidad de la Plata, to create a "Early Warning Alert system" with automatic alarm outputs via: SMS / AD / CATV / Radio / etc. creating a new application for the "Federal Network Optical Fiber " wide
coverage and territorial / regional capillarity with minimal additional cost and contributing to improving INPRES network to
expand the amount of monitoring points.
This hypothesis can be later extended to other risk variables that define its monitoring convenient national and interconnected with
other regional countries / Latin American creating on stages a network of early warning of earthquakes or other natural risks.
3.2. Specific objectives. - To achieve the general hypothesis of previous work the following objectives are set:
• Use Federal Network Optical Fiber as the fundamental basis of the system.
• Add to the existing network of new INPRES accelerometer most (1500) points monitors in critical areas (Northeast and Cuyo) for
its high potential for earthquakes and install sensors at critical points.
• Develop and use the above proposed network new optical sensors to detect ground vibrations, transmitting information through optical communications links to processing centers,

receiving, recording and analyzing data through a permanent centralized datacenter.
• Detecting and Managing Information Risk with backup datacenter.
• Manage alarms in a concentrated and avoiding false alerts by priority or make announcements before confirmed detection.
3.3. SCOPE. - The following paper describes the main features to create an early warning system in general, and it focuses on
developing sensors that require specific for operational test and evaluation by INPRES, so limit is set as the this document the
following aspects:
• Analyze and confirm or not the feasibility of using optical telecommunications networks of the "Argentina Conectada" as
new support and integration with existing networks INPRES accelerometers. No interconnections costs are assessed to each
company until define the final model integrated network.
• Analyze, select and propose suitable optical detector sensitivity but not only for operational ease to integrate with REFEFO. Field
tests exceed this first study but are recommended in "future research",
• Generate an open and modular proposal for further critical analysis of each actor and later generation of specific work plans
that analyze Hw and SW: specific project requirements, milestones, cost, time being of interest realization. The previous
points were treated on this ground in this document.

4 – PROPOSED SOLUTION

4 – PROPOSED SOLUTION
INTRODUCTION
Described below networks and elements to be integrated produce the innovation proposed.
Finally a comparison table of the main definitions will be make are then presented as conclusions and future research, focusing on
the practical part of the lab performed for the case of optical sensors listed in item 5 separately to present in more detail the
benefits of working with next-generation sensors to be manufactured locally and multiple applications in the industrial
field, surpassing its timely implementation as accelerometers in a network of earthquake detection and early warning
The topics are described below:
4.1 - Comparison of seismographic network and optical fiber network (REFEFO).
4.2 - convergence of telecommunications networks and seismic measurements.
4.3 - proposed integration model and basic mounting detail
4.4 - social and economic impact analysis of the proposal.
4.1 COMPARISON OF ARGENTINE SEISMOGRAPHIC NATIONAL NETWORK AND OPTICAL FIBER FEDERAL NETWORK PROJECTED FOR
TELECOMMUNICATIONS
The National Network accelerometer 44 seismic stations installed in:

PROVINCIA NUMERO DE ESTACIONES SISMOLOGICASSAN JUAN 12
MENDOZA 6
LA RIOJA 5
JUJUY 4
SALTA 4
SAN LUIS 2
CORDOBA 2
TUCUMAN 1
CATAMARCA 1
SANTA FE - PARANA 1
CORRIENTES 1
POSADAS 1
BUENOS AIRES - LA PLATA 1
NEOQUEN 1
VIEDMA 1
USHUAIA 1
TOTAL INSTALADAS 44
SOURCE AUTHOR IMPRES BASED
Today the National Network of Seismic Stations is composed of 50 (fifty) stations distributed throughout the country,
Now we analyze the Federal Network Fiber Optic. Adding the above concepts and forming a single structure: integrated by:
• 54 federal optical network segments, (grouped into five rings).
• 8 main nodes
• 485 nodes
• 8 international outputs (7 Terrestrial and 1 Submarine cable).
• North South of the entire Los Andes coverage.
• 1000 junction boxes on NW seismic zone and Cuyo that can contain optical vibration sensors (Bragg grating) on 10,000 junction boxes of optical fiber to a total of 40,000 km optical
network of the country.
• 3 or more freedom degrees or physical connection on each node, with high security by optical path redundancy.
• Convergent optical physical network into two traffic concentration points and thus national alarm handling in/out to

"validate alarm center" with registration datacenter security level and where it will connect to the national management system
INPRES, responsible for managing the national network of accelerometers Argentina, obtaining: detectors concentration and alarms in single node (two node one east and one west side of the
country), better data security and reduced operating and maintenance costs.
• use the same optical fiber network transport-REFEFO-as optical detector + optical transport to the node on a single pair of hairs to
allow optical sensors and connection in series without losing its unique identification to be "recorded Bragg grating with a
specified lambda ", that identifies the entire optical network, with lower installation costs and maintenance that a sensor connected
VHF radio.
• use DWDM transport transmission channels and forwarding measurement since the earthquake wave travels approx. 5km/sec and detection and transmission to the master node and from there
to the areas where the seismic impact through optical fiber network (REFEFO) and associated equipment- 200.000km/sec (v
= 2E8 m / s L = 2,000km t = 1 m sec) where notice anticipatory, seconds before reaching the hazardous event.


OPTICAL STRUCTURE OF THE "FEDERAL NETWORK OPTICAL FIBRE "-REFEFO-
Source: REFEFO Project presentation ARSAT -SA 23/09/11
In the previous map are shown 54 stretches grouped in five (V) rings, which connect the Argentinian territory as follows:
ANILLO TRAMO NUMERO PROVINCIA1,2,3 TIERRA DE FUEGO
I 4,5,6 SANTA CRUZ
7,8 CHUBUT - PARTE DE RIO NEGRO
8,9,34,35,36 RIO NEGRO - NEOQUEN
II 41,42,47,48 PARTE DE LA PAMPA - PARTE DE BUENOS AIRES
49,50,5354 PARTE DE MENDOZA
27,28,35,36,37,38 PARTE DE LA PAMPA - PARTE DE BUENOS AIRES
III 39,40,41,43,44,47 PARTE DE MENDOZA - SAN LUIS - CORDOBA - PARTE DE SAN JUAN
50,51,52,54 PARTE DE LA RIOJA - PARTE DE SANTA FE
16,17,18,19,20 PARTE DE :CORDOBA - LA RIOJA -SAN JUAN - CATAMARCA
IV 21,22,23,24,25,26 SANTIAGO DEL ESTERO - PATE DE SALTA - PARTE DE JUJUY
27,29,30,32,33,39,46 PARTE DE SNATA FE - PARTE DE CHACO - PARTE DE FORMOSA
10,11,12 MISIONES
V 13,14,15 CORRIENTES
37,38,45 ENTRE RIOS
SOURCE: PREPARED ON THE BASEIS OF PREVIOUS REFEFO PROJECT
4.2 TECHNOLOGICAL CONVERGENTE "REFEFO-SEISMIC NETWORK." DEFINITION OF OPTICAL TRANSPORT NETWORK
(REFEFO) USE DEPENDING ON SEISMIC RISK AREAS.
In the Federal Fiber Optic Network about the zoning by the degree of seismic hazard and the National Network of Seismic Stations,
can focus as critical to take into account the facilities of our optical sensors in the first instance, the following distribution:

Ring III, covers the area of locations zone: 4 - 3 - 2 - 1 - 0, as seismic zoning map, and can be connected and work
together with the seismic stations: San Luis - Cordoba - Mendoza - San Juan - La Rioja Buenos Aires.
Ring IV covers the area of locations zone: 4 - 3 - 2 1 as
seismic zoning map, and can be connected and work together with the seismic stations: Tucumán- Catamarca -
Salta - Jujuy - La Rioja - San Juan.
Ring II, covers the area of locations zone: 4 - 3 - 2 1 - 0, as seismic zoning map, and can be connected and work
together with the seismic stations: Rio Neuquén Black - La Pampa (Santa Rosa) - Mendoza and new stations being
installed.
Ring I, covers the area of locations zone: 0 - 1 -2 - 3 as seismic zoning map, and can be connected and work together with the seismic stations: Tierra de Fuego
(Ushuaia) - Santa Cruz (Rio Gallegos) - Chubut (Rawson) and new stations being installed.
Finally ring V, covers the area of locations zone: 0 1-2 as seismic zoning map, and can be connected and work
together with the seismic stations: Corrientes - Misiones (Posadas) - Santa Fe and Catamarca and new stations being
installed
4.3 TECHNOLOGICAL CONVERGENCE CREATING EARLY WARNING NETWORKS DIRECT TO THE RESIDENTS
(INTERNET, CELL BY SMS AND TELEVISION AD, CATV, RADIOS).
Introduction.
It is noted that the hypothesis of the thesis presents three settings of network integration described above:
. - Integration of existing sensor network INPRES added or converted to optical connection (today VHF radio connection) and connected to REFEFO. Also be available to connect from junction boxes (quantity 1500 in NWA and Cuyo) Federal Network Optical Fiber as possible points detector of fiber placement and welded to
transport fiber cable that would connect the main optical vibration sensor with nearest node either ARSAT SA or IMPRES,
whichever is convenient for distance, node-detector.
- Integration of transport network: using Federal Network Optical Fiber as transmission of data collected on a secondary node,
remote or current IMPRES network working with more than 100 accelerometers.
-Integration of alarm management and alarm notice to other networks such as: mobile (SMS Priority), Digital Television
Broadcasting (TDA), closed Community Television (CCTV), radios, etc., which will be present all the above services on Benavidez
Master node, facilitating connection with the destination network of earthquake alert signaling.
A further possibility is to concentrate on Benavidez Master node and then out- by optical transmission - retransmitting
detection/alarms- to IMPRES building in San Juan province,

whichever is convenient at the detection time, and alarm triggering.
As for the alarms reception in the terminals of the inhabitants, we note that it is immediately application is possible in cellular
networks for its wide dissemination in the country and worldwide. Its significant development is known that has taken the market of
mobile phone in the world, according to the International Telecommunication Union in 2011 was estimated about 6,000 million subscribers, representing a penetration rate of 86.7%
worldwide, In our country there are approximately 57.87 million subscribers (1.44 per habitant, INDEC) reaching a penetration of
117%, on the other hand, the needs of mobile data communications have enabled cellular networks that were
originally designed for voice transport, provide a higher rate of data transfer, providing new services to the user, which is
proposed as a channel to send earthquake early warning via SMS or through a government application installed on all 2G, 3G or LTE
next generation terminals.
Another automatic communication alarm channel is Open Digital Television. Currently the deployment of Open Digital Television
continues to increase with the installation of new transmission of digital terrestrial television in different parts of the country as
shown in Picture 1 and relevant description on Table 1.

Picture 1: TDT Coverage map
SOURCE: tda.tvdigitalargentina.gob.ar

TRANSMITTING PLANNED
Buenos Aires city (MOP) Fronteer Sta. Fe province
Buenos Aires city (Edificio ALAS) Río Turbio, Sta. Cruz province
Villa Martelli, Buenos Aires province Cte. Piedrabuena, Sta. Cruz province
La Plata, Buenos Aires province Comodoro Rivadavia, Chubut province
Campana, Buenos Aires Province Santo Tomé, Prov. de Corrientes
Baradero, Buenos Aires Province Lago Puelo, Chubut province
Cañuelas, Buenos Aires Province Ushuaia, Tierra del Fuego province
Pinamar, Buenos Aires Province Neuquén, Neuquén province
San Clemente del Tuyú,Buenos Aires Province Viedma, Río Negro province
Coronel Suárez, Buenos Aires Province Jachal,San Juan province
Mar del Plata, Buenos Aires Province Villa Angela, Chaco province
Luján, Buenos Aires Province Caleta Olivia, Sta. Cruz province
San Nicolás, Buenos Aires Province Quimili, Santiago del Estero province
Dolores,Buenos Aires Province Puerto Deseado, Sta.Cruz province
Necochea, Buenos Aires Province Pico Truncado, Sta. Cruz province
Olavarría, Buenos Aires Province
Salta, Salta Province
Resistencia, Chaco Province
San Salvador de Jujuy, Jujuy Province
Formosa, Formosa Province
Córdoba, Córdoba Province
Villa María, Córdoba Province
Leones, Córdoba Province
La Rioja, La Rioja Province
San Juan, San Juan Province
San Carlos de Bariloche, Río Negro Province
San Miguel de Tucumán, Tucumán Province
Paraná, Entre Ríos Province
Posadas, Misiones Province
Río Gallegos, Santa Cruz Province
Villa Gobernador Galvez, Santa Fe Province
Santo Tomé,Santa Fé Province
Santiago del Estero, Santiago del Estero Province
Santa Rosa, La Pampa Province
San Luis,San Luis Province
Mendoza (Cerro Arco), Mendoza Province
Chascomús, Buenos Aires Province
Las Flores, Buenos Aires Province
Navarro, Buenos Aires Province
Brandsen, Province Buenos Aires
Azul, Buenos Aires Province
Arrecifes, Buenos Aires Province
Cañada De Gómez, Santa Fe Province
Trenque Lauquen, Buenos Aires Province
Rafaela, Santa Fe Province
Catamarca, Catamarca Province
Añatuya,Santiago del Estero Province
Viedma, Río Negro Province
Villa Dolores, Córdoba Province
La Matanza, Buenos Aires province
reinforcement of 2,000,000 inhabitants coverage

Picture 1: City with Transmission coverage and TDA
Source: tda.tvdigitalargentina.gob.ar
Technological convergence between different technologies described as Federal Network Optical Fiber will obtained data
from optical sensors and INPRES from Benavidez, will be responsible for data distribution to the inhabitants of the country in sectors requiring guidance on how to proceed through different
types of audible and text alarms, activating contingency plans, interacting with cellular networks of interconnectivity agreement,
generating data from these networks via SMS or mobile broadband by state applications for users with smart terminals
and information transmission from digital terrestrial TV networks / mobile systems to take control and direct television
transmission ARSAT could interrupt programming processes enabling interactive information of what is happening, thus establishing a national converged network natural disaster
emergency that integrates new generation features (NG911) and multimedia communications to support emergency personnel
throughout the country.
4.4 CONVERGENCE MODEL –OPTICAL NETWORK INTEGRATION -PROPOSAL-BASIC ASSEMBLY DETAIL
Based on the concepts earlier proposed:
- Gather and integrate from the optical sensor and accelerometer that records vibrations from the ground where it is installed by
the Federal Network Optical Fiber by using an optical fiber dedicated to the measurement and recording of earthquakes in a
series circuit of optical detectors recorded by Bragg grating by providing unique identification to each "hair fiber" and
- A mechanical assembly to allow work this "pig tail recorded fiber " from each junction box REFEFO on INPRES indicated as the most
convenient for its location on the ground and

- Distances to nodes of about 50km by the required power of the light source detector to coincide with the REFEFO transmission
scheme having optical jumps of approximately 100km so, sensor would link the intermediate positions to ensure transmission to
the secondary or regional node and from there by a DWDM channel transmission system to achieve overall seismic target
nodes: a) Master node Benavidez b) connection node for INPRES current network.
- Then nodes transmission signal would drop to a management system with dual function: a) recording of measurements
collected as total country 7x 24 x 365 days and b) input of the alarm system that would perform the functions of notice, sent areas / entities / linked communications networks (Internet /
phone / AD) according to the instructions "stored" in the appropriate program and level earthquake such as PTO
prioritizing actions, Example: warning to energy companies, gas, electricity, etc. to emergency closing its facilities in areas that will
be affected in the next seconds.
Text: REFEFO Node
Light source-Detector- coupler

OF Network REFEFO (cable+sensor+Bragg)
Two FO hair of network TX
Picture 13: Scheme of a measurement system with Bragg grating in optical fiber.
The sensors are analyzed, base choice and detailed design in chapter 5, p. 122
Chart 4.4.1 proposed scheme "ROSATS".
4.5 ANALYSIS SOCIO-ECONOMIC IMPACT OF THE PROPOSAL IMPLEMENTATION
The seismic alert system for a country, region or locality may inform people about impending danger; reduce death, injury and property

damage. Here are some aspects considered in relation to the socio-economic impact of the proposal:
• Reducing loss of life.
• Integrate telecommunications networks nationwide with seismic sensing networks and obtain synergy between both, added early warning to society, facilitated by the use of new technologies and
contributing concretely to the care and safety of the inhabitants of a country by the state.
• Availability of immediate real-time information for the prevention and mitigation in case of earthquakes or other natural events.
• Integration between meteorological agency, INPRES, state and entities involved in cases of earthquakes, which will inform the media,
through a validation alarm center, for example, Benavidez (NOC Master of ARSAT SA) all media for civil alert.
• Vital protection for civil society that provides a modern state.
• Lower costs for repair and damage nationwide.
• Actively contribute to seismic risk localities.
• Effectively distribute messages and alerts and ensure continual development of the most risky towns because of its location on the INPRES seismic map and earthquake statistics. Example: San Juan
province.
• Perform technological upgrade of existing accelerometers developed new optical generation in the country.

5 – OPTICAL FIBER SENSORS
5.1 Introduction
Advances in photonic technology as a result of telecommunications and the characteristics of fiber technology have enabled the
development of multiple devices of interest in this area [1-3]. Many of these devices were generated for the optical fiber sensors field in
sectors or "application niches" where traditional sensors are not working properly or not functioning. So is being used in environments with high electromagnetic fields (e.g. power generation stations), or
in the environment where the generation of electrical signals is dangerous. (E.g. pipelines, biogas plants, airplanes), or in applications
that require small size systems and compatible with the object or body to be measured (e.g. biomedical sensors) or in places where the temperature is so high that traditional sensors do not work properly
due to multiple factors (e.g., steel mills, foundries, welding).
The general configuration of a sensor of this type is shown in Picture 1 and as shown in the diagram, comprises a light source, a sensing system and an optical detector interconnected with optical fiber.
Picture 1: Basic scheme of an optical fiber sensor.
Text: Optical fibers – Light source-sensing system-detector

Depending on how the measurement of the external disturbance is made is usually classified in two main classes: extrinsic and intrinsic.
In the diagrams in Picture 2 are simply shown their fundamental difference.
a) Extrinsic sensors. - Includes those applications in which the fiber acts as a waveguide only bringing light to a "black box", which
modulates the beam in response to the parameter being measured. Under this approach, modulated or prints information by any
particular method the fiber and is used to drive only the radiation from the source and to the sensor device. This information may be
encoded in intensity, phase, frequency, polarization, spectral content, etc. (Picture 2D)
b) Intrinsic sensors. - Also called "all-fiber sensors", use the optical fiber as waveguide where the interest magnitude is to be measured,
but unlike the previous case, external disturbance acts directly on the fiber. Light remains in the fiber at any time (Picture. 2b).
Text: Optical fiber -perturbation -sensor module- optical fiber-
perturbation- optical fiber
Figure 2: Basic types of optical fiber sensors: a) extrinsic b) intrinsic
Since light provides a means for measuring an external disturbance into the optical fiber sensor may be many types of sensors as wave
properties are possible to modulate.

5.2 MAIN PARAMETERS
The equation with which usually represents the electric field vector of an electromagnetic wave, shows all properties that can be
modulated by an external shock:
0 ( )E E sen t kx (5.1)
where E0 is the wave amplitude
is the angular frequency
k is the wave number equal to 2π / λ (wavelength λ)
φ is the phase constant
The simplest type of sensor which can be built is one in which the perturbation directly modify the light amplitude, resulting in a
change of intensity at the detector (related to its square). The major challenge in this type of design and its major limitation is to separate
the fluctuation in intensity due to the external disturbance from other causes fluctuation generated spurious (light variation from the
source, power supply variation, etc.).
Interferometry sensors are instead disaffected to this limitation as external perturbation generates a phase difference between two
light waves. Thus the encoded information is insensitive to variations in intensity, an example in which a measurement can be performed
from the phase modulation. Designs are considerably more complex, but provide very high resolutions.

The frequency or light wavelength has a decisive role in the above two cases, because they have a functional relationship with both the
absorption and reflection due to the interferometry phase shift dependent on the wavelength.
The vector nature of the light is used very efficiently with polarimetric type sensors where the state of polarization of the wave
is affected by the external disturbance [3]
5.3 SENSOR DESIGNS
Different types of sensors are adaptable design of the structural vibration monitoring, and particularly position and interferometric.
We will focus particularly on these.
5.3.1 intensity sensors. - In some cases, the simplest type of sensor construction is that based on the intensity modulation. Sensors are
inherently simple, requiring a few elements and electronic components.
In Picture 3 shows a sensor consisting of two optical fibers arranged close to each other, in this case forms a vibration sensor. The light
propagating along the fiber forms a light cone angle, which depends on the difference of the refractive indices of the core and the
covering or cladding.
Light can be captured by the other end of the fiber will also depend own acceptance angle and distance "d" of separation between the
two fibers. When this distance changes, either a vibration or a
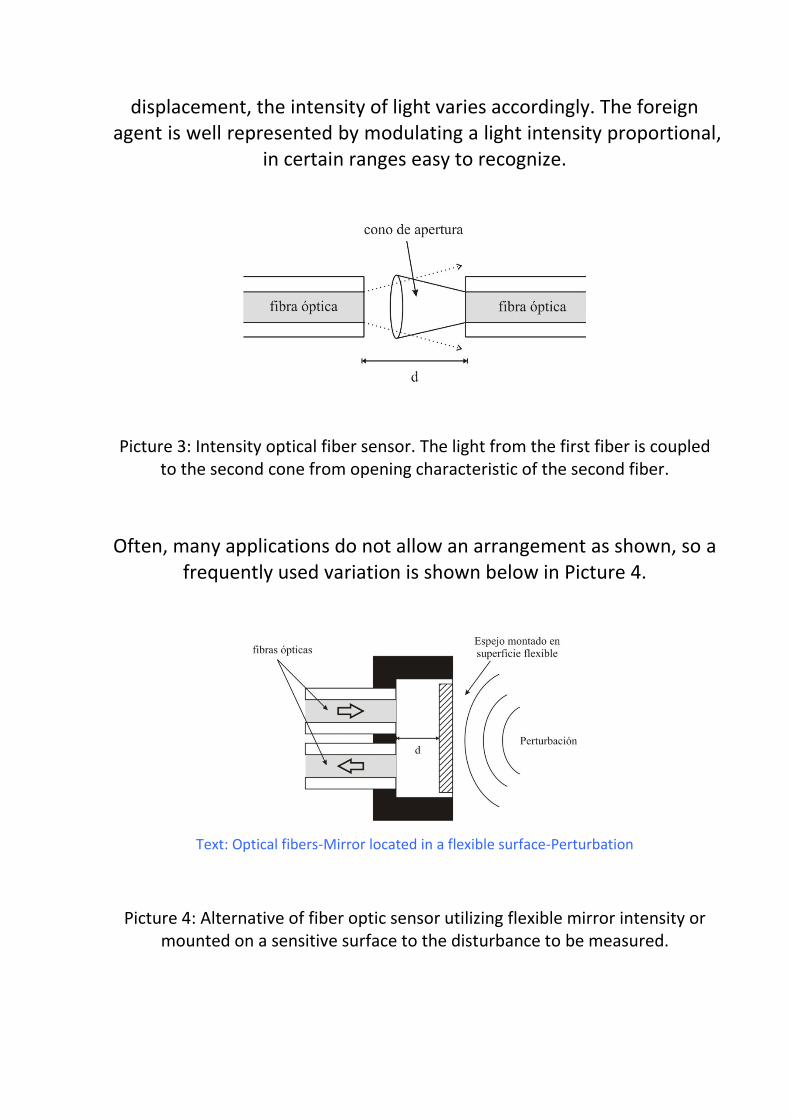
displacement, the intensity of light varies accordingly. The foreign agent is well represented by modulating a light intensity proportional,
in certain ranges easy to recognize.
Picture 3: Intensity optical fiber sensor. The light from the first fiber is coupled to the second cone from opening characteristic of the second fiber.
Often, many applications do not allow an arrangement as shown, so a frequently used variation is shown below in Picture 4.
Text: Optical fibers-Mirror located in a flexible surface-Perturbation
Picture 4: Alternative of fiber optic sensor utilizing flexible mirror intensity or mounted on a sensitive surface to the disturbance to be measured.

This configuration uses a mirror, or simply a mirrored surface or polished enough that can respond to an external shock, such as the
pressure of a sound wave. In this scheme the light injected by one of the fibers is expanded and reflected from the mirror then being
coupled to the second part. The degree of coupling depends on the distance of separation between the fibers and the mirror, and the
acceptance angle of the fiber output.
As the mirror or reflector varies its relative position because of the disturbance, effective separation is amended, generating intensity
modulation in the second fiber. This type of sensor is especially useful in applications where you want to know a binary type of
information (on / off, lock doors, interlocks, etc.). However, depending on the quality of the mechanical design, can be used, and
is suitable for detecting similar measurements as vibrations and sound waves, pressure, displacement and distance.
5.3.2 intensity by bending sensors. - A more complex way in which light passing through the fiber module is by a decreased intensity due
to losses in the core by bending or "bending". If an optical fiber is subjected to a curvature greater than the allowed (known as bending radius parameter), degrades the essential condition for transmission
via total internal reflection between the core and the coating, causing light loss. The best practical results have been achieved with micro-
folds, locally generating controlled and convenient useful for pressure measurement, vibration and other environmental effects [4-
7].
Picture 5 shows the typical scheme consisting of a light source, a fiber optic line within a section of a device with a profile such that it can conveniently modular external disturbance from micro curvatures
controlled not to destroy the fiber.

Text: Light source-Detector Inductor system of micro distortion
Picture 5: Fiber Optic Sensor modulated in intensity by micro bending.
This is an example of intrinsic fiber optic sensor, because the fiber that modifies the way in which light is transmitted. Such sensors have
a very good performance in the linear region, one in which the curvatures are approximated along the core as a sinusoid. Special care should be taken in the design to avoid irreversible damage to the guide. Corke et al. [8] have made a review of this technique,
while Giles et al. [9, 10] reported 1% linearity improvements using optical switching techniques.
5.3.3 Interferometric Optical Fiber Sensors. - Interferometric sensors occupy much of the attention of scientists and engineers for decades.
Its properties and versatility have positioned in the varied types of applications ranging from simple temperature measurements, to the
intelligent control of large structures such as bridges and buildings and the aerospace industry. Since require a very stable assembly, are
highly sensitive to vibrations.
In this type of sensor, fiber is closely related to the measuring mechanism, since the light can remain within the nucleus to interact with the field to be measured. The optical phase of light propagating
is modulated by the parameter to be detected, and then being

detected inters ferometrically compared with the phase of a reference light.
Besides the inherited advantages of fiber optics, have additionally: the geometric versatility as a sensor, large dynamic range, low loss
and extremely high sensitivity.
Interferometric based in optical fibers can be divided into two broad categories: those in which two interfering beams, as Michelson type configurations, Sagnac and Mach-Zehnder, and the multiple beam
interferometer, mainly represented by Fabry –Perot cavity.
5.3.3.1 Mach-Zehnder and Michelson inter ferometric sensors. - The bender-beam interferometers allow the measurement of changes in the extremely small phase difference generated by the disturbance.
To a first approximation, the optical phase delay that light undergoes when passing through an optical fiber is:
nkL (5.2)
where n is the refractive index of the fiber core, k is the wave vector in the vacuum (k = 2π / λ, λ being the wavelength), and L is the length
of the fiber span. "nL" magnitude is therefore the "optical path".
Picture 6 shows the basic elements, which form a Mach-Zehnder Interferometer: a light source, usually an isolated laser diode, large
enough coherence length. A first single mode directional coupler which divides the incident radiation, generating two light beams of equal intensity in general that are coupled to the two arms of the

sensor, one of which is the sensor itself, and the other is used as reference.
The transducer located in the sensing arm is suitably designed for measuring an environmental effect of isolating the reference arm of
the external disturbance, thereby generating one optical path difference between the two beams.
Text: Light source- coupler- Sensed fiber reel- Reference fiber reel- coupler-Detectors
Picture 6: Mach-Zehnder interferometer.
These two signals are recombined by a second coupler, to form an interference signal that is detected by respective photodiodes.
Assuming coupling coefficients of k1 and k2, couplers, and optical fibers α1 and α2 in each of the fiber sections, can be written the
equations of the electric field as each arm as:
1 0 1 1 2 0 1
2 0 2 1 2 0 21 1
E E k k cos t
E E k k cos t
(5.3)
Taking into account that the optical intensity averaged temporarily for periods bigger than 2π/ω0, can be expressed as:

2 2
1 2 1 22I E E E E (5.4)
and further that the coefficients of coupling should choose them are such that k1 = k2 = 0.5, while the losses in the fiber may approximate as α1 = α2 = α, (pp. 274-277, [1]), then Eq. (5.4) takes the following
expression:
0
0
12
´ 12
II cos
II cos
(5.5)
Where l and l ' represent the outputs of both arms of the interferometer, with l' complementary output (replacing k2 by 1- k2, and vice versa), I0 is the average intensity of the light beam, and Δφ =
φ1 - φ2 is the phase delay suffered between the two roads.
Finally, considering that the phase variation can be separated into two members, that is:
( )d sd sen t (5.6)
and it is assumed that the differential phase shift dφ has some amplitude φs and frequency ω, while φd represents a slow variation,
then Eqs. (5.5) can be re-written as:

0
0
1 ( )2
´ 1 ( )2
d s
d s
II cos sen t
II cos sen t
(5.7)
These signals can be converted to electrical signals by the photodiodes and detectors combined with differential amplifiers:
0( )́ ( )d si I I I cos sen t (5.8)
where ε is the photo detectors responsibility. By simple mathematical treatment, as shown in Chap. 10 of reference [11], we conclude:
0 ( )d sdi I sen sen t (5.9)
The eq. is significant and shows a limiting factor because it amplitude depends on the sen (φd) occurs that φd is dependent on many
factors of the environment, e.g. temperature, if it approximates a multiple of π tend to fade the signal, whereas for odd multiples of π /
2 will be high.

Picture 7: Transfer generated in-fiber interferometers.
Picture 7 graphically explains the problem, from a curve of intensity as a function of the relative phase of the light beams in each arm of
the device. It is noted that for a given phase difference, the output of
the device may be reduced because of the sensitivity degradation (φ
d → nπ, fading effect).
A usual way of overcoming this drawback is to introduce one of the arms in a piezoelectric device that stretches the fiber, thus inducing an increase in the optical path to compensate the effects of spurious
measurements.
For the demodulation of the interfering signals are basically two homodyne techniques: active and passive. In which the reference is
derived from the same original source before being modulated, however numerous schemes have been used in which the
heterodyne demodulation technique is thus makes a shake signal with another self-test commonly known as " local [12].
a) active homodyne detection. – Consists on generating the drift compensation systems to bring the square before collecting data. In
the early years of interferometry with fibers investigators added constructed compensating fiber windings piezoelectric rings, so that by applying a voltage around the fiber is subjected to an increasing stretching the effective length of the reference arm. In its beginning
this control was performed manually, and then enhanced by an electronic feedback system. This approach was then supplemented
by other routes, such as the variation of the supply current of the LED laser, since in some cases these sources of near-infrared
semiconductor exhibit a drift of the center wavelength with respect

to the power supply (only a few GHz / mA) [13], which allows a variation ΔL of a few centimeters.
A significant improvement to this method is that no simplifications and approximations, and the output are linear phase, providing
better dynamic range [14]. Nevertheless, active detection has two major questions that almost necessarily limit its application to
laboratory limiting the dynamic range of the feedback elements need restoration or "reset" that complicates the system's ability to detect
phase changes in order micro-radians.
The second reason is that the complicated scheme implementation in multiplexed systems, since the source can only maintain a balanced interferometer, compromising the stability of the rest. Because of all
this is that the passive homodyne detection, but uses certain simplifications and approximations, has a wider application and
acceptance.
b) Passive homodyne detection. - The basic approach and one of the first used involves the generation of two signals optically phased by
90º [15], so that now the signals are:
0
0
12
´́ 12
Ii cos
Ii sen
(5.10)
And its response to small changes in the phase will therefore
0
0
2
´́2
Idi d sen
Idi d cos
(5.11)

From these equations and Picture 8, can be seen that when one signal is at a minimum, the complement is maximal and vice versa. The results used in this technique results in a direct measure of the
phase difference.
Picture 8: Two signals generated with a 90 ° difference in phase, for quadrature detection.
As can be seen in either situation, it is always possible to rescue one of the signals. There are several ways to handle these two outputs to
avoid the problem of fading, one of the first and simplest is to sum the squared differential and then take the square root
2 2 0´́2
Ii di di d
(5.12)
Should be noted that in all these procedures is assumed dφ << 1, for any other situation, the treatment becomes more complex and is
excluded from this introduction. More information can be obtained in references [15-17].
The diagram of Picture 9 shows another classic dual beam interferometers, which may be implemented in optical fiber. In this

case there is only one beam splitter, used both to split and to recombine the beam. Like the previous case, the light propagating from the source is split into two arms, the reference and sensor.
Once routed along the arms, light turns to feed back by mirrors by willing the end of each fiber. The same now beam splitter recombines the signal and, like the previous case, generates two complementary
outputs: one directly available from the fourth port of the splitter where the photo detector, and the other coupler re injected into the
inlet by which houses the source [18].
Picture 9: Typical configuration for a Michelson interferometer in optical fiber.
This interferometer is called Michelson and is often considered by many as a Mach-Zehnder "fold" interferometer in the middle. From
this point of view, the optical losses are similar and so does the output signal.
The differences of the Michelson configuration are that it requires only one optical fiber coupler and a single optical detector.
Furthermore, because the routed distance by light in both arms is bender, the optical phase change per unit length of optical fiber is
also affected equally. From the practical viewpoint, the interferometer is easier to assemble and implement (although
obviously depends on the application) [19.20]

As disadvantages could be mentioned the need for mirrors, which are formed in the transverse face of the fiber, which are not readily
available commercially. In contrast, both built with couplers that are common and widely available.
5.3.3.2 sensors acting in the spectral domain. - Fiber optic sensors have a number of current limitations of variable losses in the system, which are not related to the effect to be measured. There are several
potential error sources as connector’s losses, excessive bending of the cables, misalignments, whether mechanical or sources and
detectors.
The fiber optic sensors based on the spectral domain and to provide a solution that depends on a modulated light beam wavelength or by
some external disturbance effect. We will discuss two fiber interferometer cases a) Fabry-Perot type and b) recorded Bragg
grating in fiber.
a) Fabry-Perot sensor. - The potential of the Fabry-Perot (F-P) interferometer on optical fiber is widely known for submicron
precision provided in operation in applications such as temperature measurement [4], pressure, displacement or vibration [5-8]. Its use is
widespread in applications such as optical microphones [9], filters [10], and other applications [21-22].
When the finesse of a Fabry-Perot cavity made with optical fiber components is low (normally less than 5) or the length of the cavity formed by the surfaces of the reflective elements (mirror surface,
screened fiber face, etc.) is larger than the core diameter of the fiber used (so that only the first order beam reflected from the fiber end

and a small portion of the transmitted beam of the first order that is retro-reflected by the second reflecting element coupled back into
the fiber, contribute to signal interference), the device may be properly called Fizeau interferometer extrinsic. Due to the simplicity of this interferometer, numerous applications were conceived over
the years, both for the industry and the biomedical area [23-25].
Being an incident A0 wave that normally affect on the cavity to the surface by generating a sequence of transmitted and reflected beams.
Picture 10: Scheme for the theoretical derivation of a cavity multiple beam interference between two generic surfaces with reflection and transmission
coefficients r1, r2 and t1, respectively.
This beam will propagate diffracting to be reflected by the second mirror and coupled back to the source fiber
2 2 1 1 0' iA r t t A e (5.13)
φ angle of this modulation takes into account the phase shift caused by the difference in path taken by the various beams and is defined
as
04 n d
(5.14)

where n0 is the refractive index of the medium in the cavity (being air, usually n0 ≈ 1), λ is the working wavelength, d the distance between
the cavity surfaces. The parameter β, known as optical coupling efficiency is equal to [16]:
2
2
1
1d
k
with: ( )
2
a
ln
nk
(5.15)
depending on the distance of d cavity, the radius of the core of the optical fiber a, the wavelength λ and normalized frequency υ.
In this case, where single mode fiber is used, can be accepted as valid the Gaussian propagation assumption within the core, so that ω is
the beam waist coincident with the fiber radius a [17].
Analysis of multi reflections that generates the device produces an output given by the equation:
2
0 1 2 1 1 2 11 2 1RI I R R R R R R cos
(5.16)
Where we have taken into account the intensity and the real part of the expression
*
R R RI A A (5.17)
The eq. 5.16 can be expressed more simply as

0RI I a bcos (5.18)
where a and b are
2
1 2 1
1 2 1
1
2 1
a R R R
b R R R
(5.19)
In order to reach a normalized expression of the transfer may set the following relation out
0
0
R
medio
I a bcosI a bcos
I I a b a b a b
(5.20)
or as
1 2 1
2
1 1 2
2 11
1
R
N
R R RIcos
I R R R
(5.21)
With IN = I0.a. Assuming a variation in a direction away from maximum spacing equals λ / 2, showing that its sensitivity is less than this
value (about 0.1μm) [26, 27].

Picture 11: Output signal without standardization for a continuous scrolling.
b) Sensor based on Bragg gratings fiber recorded.
In this type of sensors, although they may be classified as spectral sensors, have very specific characteristics that deserve treatment
separately. In these devices the optical fiber has a central role: not only behaves as safe waveguide with low loss, but the structure itself
is used for the spectral coding parameter to be measured.
The optical fiber core has a periodic perturbation (or aperiodic), the effective refractive index (Pic. 12). This disturbance usually extends
longitudinally from a few millimeters to a few centimeters, with periods ranging from tens of microns to fractions of a millimeter in
the case of long-term networks.
The disturbance causes kernel reflection of light in a very narrow range of wavelengths, for which satisfies the Bragg condition,

whereas the remaining are not practically affected. The central wavelength of reflection of a Bragg grating is
2B B efn (5.22)
where B is the period of the perturbation and nef the effective refractive index of optical fiber core. The bandwidth of these
networks, typically less than the nanometer, depends on both the length and the profile of the index modulation.
Picture 12: Bragg grating.
For manufacturing, is needed to work the core to form a particular structure. The basic technique, broadly speaking, is always the same:
a beam interference pattern in the UV range is projected, on an optical fiber whose refractive index is photosensitive. There are two ways to do this: either by interference of two coherent beams, or a
phase mask. The last one is imposed by the simplicity and robustness of the experimental scheme, but is expensive than the first, less
versatile serves as a mask for one type of network, and requires a shorter laser wavelength (244 nm), with pulses short and high energy.

Actually recorded on fiber networks are widespread and many firms marketed, while many optical laboratories are able to build for their own use and applications. They have an important role in the design of communication systems fiber optics, which may be used as filters
in multiplexers, DE multiplexers, add-drop filters [28-31], with comparable sensitivities and even better than the conventional
"strain- gauges ".
Since the wavelength dependent reflectivity plus higher temperature and mechanical deformation (photo-elastic properties of the fiber) [32], Bragg gratings are also widely used to form deformation and temperature sensors. For example the transverse stress applied in
induces birefringence and thus the Bragg wavelengths of the polarization dependent [33, 34]. For Bragg gratings centered at 1300
nm, can achieve sensitivities to 1 pm per 1 με and / or 0.1 ° C [35], which requires special demodulation techniques, including those employing include etalons and interferometers [36.37], among
others.
Text: Modulated reference network. Light source-Detector-coupler

Network 1 /2
Picture 13: Diagram of a measurement system with Bragg gratings in optical
fibers.
Picture 13 illustrates a usual well-known scheme, where many network are used as independent sensors each having a different
Bragg wavelength, while the other provides a reference Bragg grating positioned between the output coupler and the input of the detector. The broadband source is applied to all sensors acting with reflectors for each of the respective wavelengths. The response of each sensor
depends on the conditions to which it is subject.
Each network reflects this wavelength and corresponding variations. It can be observed in a simple manner, such as modifying the initial
spectrum of the source as it propagates in each network. The interesting thing about this design is that each reflection in his
counter-propagation networks can cross above without suffering considerable losses.
Thus, at the output of coupler are present all wavelengths corresponding to each sensor. To access information of every one of them may be resorted to a spectrometer, in which case it is possible
to know the state of "n" simultaneous measurement points.
This technique, very convenient, is not always possible because of the high cost of instruments. However, there is another way involving
witty detection sweep wavelength within the working window system. It requires some additional considerations, but is a much
more economical solution.

In the case of the picture, is used another Bragg grating as reference that can be used as a tuner, adjusting its response by mechanical methods such as piece electric actors, micrometric screws, etc.
Several studies and practical implementations have been achieved with this technique, reaching accurate demodulation systems built
closed loop [31.36]
5.4 VIBRATION SENSOR DEVELOPMENT FOR EARTHQUAKE MONITORING.
As mentioned, both position sensors, as many interferometric are simple adaptation to vibration monitoring. We will discuss two cases:
Fabry-Perot and Bragg grating. In both cases the various blocks of sensing systems can be condensed into three basic subsystems: the instrumentation unit consists of an optical source and monitoring
system based on optoelectronic unit for analysis, a microprocessor and computer components; an optical fiber is used for transmission
of the point light beam and sensing (containing information), transmitted or reflected from that point toward the monitoring
system and, finally, the optical transducer as a Fabry Perot (if one of the mirrors is of low reflectivity is called Fizeau), a Bragg grating (both fiber) etc. and prepared components for measuring the parameter of
interest and located at the sensing point.
5.4.1 Case 1: Next, we will mention an application of a Fizeau type sensor of contraction in the study of polymers applicable in actual chemical industry. This application will be an example to introduce
this technique [27]:

Text: Inter ferometric optical Fiber Fizeau- FC Led- acquisition sheet- cured source-Resin fissure-Magnetic field- Power amplifier-sweep signal generator-
Shot-Computer
Picture 14: Experimental scheme for the analysis of polymer contraction
The rod excitation was produced by a small coil or solenoid (1 cm in diameter and 25 turns of copper wire of 0.2 mm diameter
approximately), located at the free end of the rod and weight compared to the weight negligible bar. This solenoid was placed in
the proximity of a permanent magnet in such a way that its magnetic field can be regarded as a uniform density for the winding
dimensions.
Under these conditions, a variation in the solenoid excitation current generates a magnetic force that is applied on the beam, forcing a
disturbance (vibrations) proportional to it. In this case, the winding is fed with a variable frequency sinusoidal current and peak current of 300 mA is generated in the beam vibrations between a few tenths to tens of microns, and were detected using the Fizeau inter ferometric
sensor constructed in optical fiber, located at 1.4 cm from the free end.

Some inter ferogram cycles were acquired for each excitation frequency, precisely selected with a signal generator. To follow and
correct fit resonance certain material, which varied as occurred curing a polymer located in the groove in the bar generated,
frequency sweeps were generated (Frequency Sweeping) fired in a controlled manner by the plate acquisition, connected to a specific
input of the generator (external trigger).
Furthermore, this excitation scheme provides a simple and practical way to sweep frequency within the range of interest in order to dynamically locate the resonance and its evolution in time. At all
times, said the current on the solenoid always kept constant amplitude and undistorted to rule out spurious variations in
measurement.
Picture 15 shows a typical inter ferogram, which obtains the resonance graphs. This is the typical appearance of an
interferometric signal when the surface being measured sine wave oscillates.
0,000 0,002 0,004 0,006 0,008
2,2
2,4
2,6
2,8
3,0
3,2
3,4
5
4
3
2
Ten
sio
n [
Vo
lts]
Tiempo [seg
1

Picture 15. Inter ferogram corresponding to the bar vibration with uncured resin at 349.65 Hz
The marked points correspond to the maximum and minimum positions of the swing. If we continuously change the frequency
values can be found cantilever resonance + polymer, which depends on the degree of polymerization. For a fixed state, we get the
following response.
1,6
2,0
2,4
2,8
3,2
300 302 304 306 308 310 312 314
200
300
400
500
Señ
al [
Vo
lts]
f [H
z]
Tiempo [s]
t = 4 s
Text: time(s)
Picture 16: A method of dynamic measurement of the resonance frequency. Above: interfering signal corresponding to the continuous sweep. Bottom:
Frequency sweep profile used (f0 ≈ 360 Hz).
Picture 16 explains the concept in detail. In the sample lower part the profile that varied the solenoid excitation frequency, thereby to apply a vibration beam to measure the resonance shown in the upper part.
Notably rod passing through the resonance, when experiences its greatest amplitude. For the dimension of the beam used no gap
between the vibration and the excitation frequency. That is, if it is determined the working window (4 seconds) and from then on is

timed for which maximum signal is obtained, then we can simply calculate the frequency when this occurs.
This same system, without the polymer or the excitation of magnetic type, making possible to detect oscillations of the cantilever (bar) due to structural effects and seismic buildings and applied in this thesis.
Measurement of small vibrations: If the sensor is subjected to a surface that is vibrating within the supported range (up to
approximately 300 microns), inter ferograms change slightly showing a breakdown of symmetry phase marking their sides. If the break can be determined with certainty, it is possible to reconstruct the original vibration, bearing in mind that in every break you have to invest on
the meaning depending on whether a contraction or expansion.
0 10 201,50
1,75
2,00
2,25
Señ
al
de s
ali
da [
Vo
lts]
Tiempo [s]
(a)
0 10 201,50
1,75
2,00
2,25
2,50(b)
Señ
al
de s
ali
da [
Vo
lts]
Tiempo [s]
Picture 17: Inter ferograms for sinusoidal vibration (a)
and triangular (b), both of 20 s period and constant amplitude.
Picture 17 shows interferograms obtained oscillating sine wave and triangular respectively.

0 5 10 15 20
0
2
4
6
8
10
12
14(b)
Tiempo [s]
Condición:
Frec: 50mHz
Ampl: 50 mV
Am
pli
tud
[
m]
To achieve these small oscillations are arranged a transducer constituted by a solenoid in the presence of a magnetic field
appropriately suspended and secured to the surface, whereby a current is conveniently made from a suitable signal generator. A 1310
nm laser generates bands whose maxima are separated λ / 2 = 655 nm.
There was a constant amplitude and oscillation frequency of 50 MHz sinusoidal type (Fig. 17 a) and triangular (Fig. 17 b). Both are remarkable symmetry breaking and zero-derivative points.
Processing, similar in terms of their development, involved determining the times for which these breaks occurred, to change the increasing direction dD = λ / 2. The results are shown in picture
18a and picture 18b respectively. It can be appreciate the good reconstruction of oscillation in both its amplitude and frequency. The
results shown errors are less than the size of the points.
0 5 10 15 20
-2
0
2
4
6
8
10
Am
pli
tud
[
m]
Tiempo [s]
Condición:
Frec: 50mHz
Ampl: 50 mV
(a)
Picture 18: Results of the processing of the signals shown in picture 17.

5.4.2 Case 2:
Within this range of technological interest optical devices, “Bragg” grating development (FBG) recorded on photosensitive fiber, by using a laser in the ultraviolet region, is a specific example. The
dimensions of these networks can be a few millimeters to several centimeters of fiber and are used in current communications systems
in various applications. They are used as filters, dispersion compensators; systems "add and drop" type signal to links WDM
(wavelength division multiplexing), etc. Moreover, their properties are ideal for the development of fiber sensors: transducers of
deformations, vibrations, temperature, etc.; as elements of the cavity in the development of coherent sources (generally lasers fibers), etc...
This is due to its spectral properties (both in reflection and in transmission) allowing, for example, filtering of signals within a
bandwidth of less than 0.1 nm with very low power loss due to its low insertion loss.
In this sense, optical sensing systems based on Bragg gratings recorded in optical fibers, combining a high level of reliability,
accuracy, resolution and stability, sensors based on these components are being installed worldwide in a variety of
environments Operating with a great diversity of applications.
Its advantages include intrinsic type sensing, remote sensing, being electrically passive (being a non-sparking dielectric material and can
be used in explosive environments), can operate at high temperatures, has capacity multi-point sensing using same fiber (e.g.,
use only a hair's fiber optic transport link), sensing various parameters; telecommunications common components which means
lower costs, etc.

Bragg granting (periodic variations of the refractive index of the material) are intrinsic elements can be recorded in the core of a
photosensitive optical fiber by UV radiation. The recorded length is about a few centimeters. When a beam of broadband light is
transmitted by the fiber, the network produces a narrow band reflection where the wavelength is proportional to the period of the spatial modulation of the refractive index (spacing between fringes). The remaining light passes through the evenly network and can be
used to interrogate other networks recorded at different wavelengths. This feature makes Bragg networks an important
component for the telecommunications industry, because it serves as the basis for multiplexing wavelength division multiplexing (WDM),
creating the ability to carry multiple channels of data simultaneously by a single fiber. For continuous monitoring purposes, the WDM
technology allows multiple optical sensor assembly by a single fiber.
Its application as sensor is based in changes in both temperature variations as a result of the effort recorded in the fiber network. In
both cases the material can expand or compress, producing the same effect on the spacing of the network. Since the wavelength of the
reflected beam depends on said parameter, the Bragg grating translates longitudinal deformations thermal variations or variations
in wavelength (or optical frequency) proportionately. Thus, these devices can be used as an optical strain gauge. By appropriate design,
can generate a vibration sensor in a wide range of frequencies.
5.4.1 Bragg gratings recorded
One of the most effective methods for registering Bragg gratings in photosensitive fiber technique is the phase mask (Hill et al., 1993;
Othonos and Lee, 1995). This technique employs a diffractive optical

element (the phase mask, a diffraction grating basically works by transmission) for spatially modulating the UV writing beam. By
irradiating this element with a single UV beam (typically at ~ 240-260 nm spectral region where the fiber photosensitization process is
more efficient optics), the light diffracted by the first two orders form to interfere, a pattern of intensity newspaper and high contrast
photo-prints refractive index modulation of the optical fiber core.
The contrast of the intensity distribution is strongly dependent on the coherence length of the beam to be an interferometric phenomenon. Laser sources have a continuous emission greater than the coherence length down, thereby allowing greater depths networks modulation
index and therefore higher reflectivity.
When a UV light beam incident on a phase mask, it is diffracted by several orders m = 0, ± 1, ± 2, The incident and diffracted orders
satisfy the following condition:
(5.23)
Where Λpm is the period of the mask phase, λuv is the wavelength of the incident UV beam, θm / 2 is the angle of the diffracted order m
and θi is the angle of incidence on the mask. If the UV beam incident perpendicularly, the diffracted orders are only m = 0, ± 1. Typically phase masks are designed so as to minimize the order 0. Thus, the phase mask acts as a precision grating whose two output beams create an interference pattern in the region of space where they
overlap.
The period of the phase mask is related to the period of the index modulation in the fiber generated (Λred) and with the Bragg
wavelength (λBragg) as follows:

(5.23)
Where neff is the effective refractive index of the fiber core. For example, a Bragg grating is designed to operate in the region of ~ 1.5
m will have a period of about 500 nm.
Focusing on the orders -1 and +1, the output of the mask forms a normal interference pattern whose periodicity is the same
independent of the wavelength of the incident UV laser beam. Placing a photosensitive fiber and in contact behind the mask, and focusing its corrugations perpendicular to the axis of the fiber core
are recorded on the desired modulation of the refractive index (FBG) as shown in picture 19.
Text: Order +2/+1 Incident UV beam- Fase Mask (Period Amp) Photo sensible Fiber- order -2/-1
Periodical modulation of refraction index of the node
Picture 19: Schematic diagram of FBG etching process with phase mask.
The experimental scheme is shown in Picture 20. UV source is a Nd-YAG laser capable of delivering 650 mJ pulses at 1064 nm, with a

maximum repetition frequency of 10 Hz using two frequency benders crystals obtained at 266 nm emission. However, since the efficiency of the crystals is not 100%, the output beam contains some infrared
radiation (1064 nm) and visible (532 nm, output from the first bender). Using a prism-Brocca Pellin be separated angularly energy contained in the different wavelengths, and use only that portion
corresponding to the UV. After being expanded and collimated beam incident on a cylindrical lens mounted on a micro positioner (MP1), generating a horizontal line at the focal distance of the lens, which
places the phase mask. In contact with the face of the mask through which the beam emerges from the optical fiber is placed
photosensitive trying to ensure uniform support along the network. Both the mask and fiber are mounted on a micro positioner XY (MP2)
in order to align the system and to focus the beam on the mask.
To achieve the etching process monitoring by connecting one end of the photosensitive fiber (using FC-APC connector) to a network
interrogator 4 channels, high resolution and accuracy. Through this instrument remote connection to a PC, it monitors the evolution of
the observing network recorded in the computer monitor the reflection spectrum of the same. This information in-situ is very
important as it gives an overview of how to instantly produce the etching process, allowing to make if necessary, appropriate
adjustments to optimize the operation. The relevant characteristics assessed were: spectral width, maximum reflectance, center
wavelength, side lobe suppression, etc. Picture 21 shows photographs of the station implemented for etching in fiber Bragg
gratings.

Text: Nd-YAG laser-First and second bender-Pellin-Broca prism-Expansion optic and confirmation-Cylindrical lens- Phase mask-Photo sensible optical fiber-
Optical rail- Micro positioned MP1 and MP2
Picture 20: Schematic experimental etching system of Bragg gratings in optical fiber
Picture 21: Experimental setup of the network print.
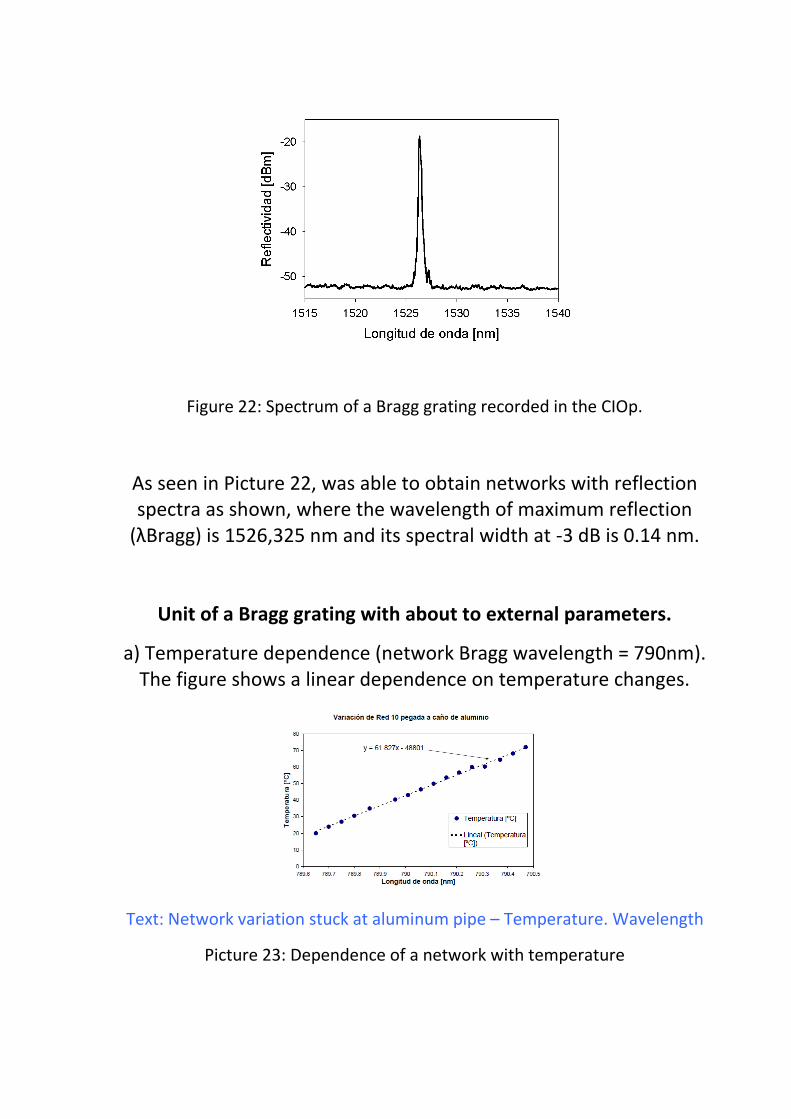
Figure 22: Spectrum of a Bragg grating recorded in the CIOp.
As seen in Picture 22, was able to obtain networks with reflection spectra as shown, where the wavelength of maximum reflection
(λBragg) is 1526,325 nm and its spectral width at -3 dB is 0.14 nm.
Unit of a Bragg grating with about to external parameters.
a) Temperature dependence (network Bragg wavelength = 790nm). The figure shows a linear dependence on temperature changes.
Text: Network variation stuck at aluminum pipe – Temperature. Wavelength
Picture 23: Dependence of a network with temperature

b) Unit with the deformation
Figure 24: Linear Response deformation
5.5 TESTING ON OPTICAL SENSORS AT CIOP ARGENTINA LAB
5.5.1 Sensor construction. – We used two separately high reflectivity networks slightly separated (one fixed and the other with the
possibility of being deformed through stresses on the cantilever generated by vibrations.
Cuadro
Texto
Circulator-fixed network- fixed in cantilever network-fixed structure-cantilever-Optical fiber-Light source-detection system
Deformación [strain]
0 20 40 60 80 100
[nm
]
0.00
0.02
0.04
0.06
0.08
0.10

Picture 25: Experimental setup of the sensor system.
Picture 26 reflectivity spectra of used Network and transfer function (theoretical)
When browsing network 2 spectrally distorted by the oscillation of the cantilever, changes the degree of overlap between the two,
changing the reflected intensity received by the detector.
[nm]
-0.4 -0.2 0.0 0.2 0.4 0.6
0.0
0.2
0.4
0.6
0.8
1.0
Red 1 Red 2
Red 1 x Red 2
Separación entre maximos [nm]
0.0 0.1 0.2 0.3 0.4 0.5 0.6
Am
plit
ud
[u.a
.]
0
5
10
15
20
25

Picture 27: System Response (intensity vs. spectral separation of networks)
It is seen that the response is linear with wavelength variation and hence on the deformation generated by the vibrating cantilever, as
such variation does not exceed the spectral half width of the network.
5.5.2 Determination of the sensitivity degree of the optical device
Changes in both parameters (temperature and strain) generate proportional changes (linear) in the Bragg wavelength. For the
initially proposed scheme implies that both networks should be kept in the same environment so that the temperature variations do not
affect the method (run simultaneously).
The deformation in the network support translates directly into an oscillation that can be displayed on an oscilloscope. The sensitivity is dependent on the optical source, the cantilever type and size used
and the sensitivity of the optical detection system. Since the frequency is low, high signal values can be obtained (some W/pm)
Text: vibrations measure
Picture 28
Experimental Example proposal

Picture 29: reflectivity spectra of networks used and transfer function
Picture 29 shows the reflectivity spectra recorded in the CIOp networks (R1 and R2) and the transfer function of the reflective
system ((R1.R2) 1/2). R1 corresponds to a network mounted on a cantilever, which can vibrate, and R2 to a fixed network.
Picture 30: Signal monitored with the system to generate a pulse to the cantilever and its Fourier transform.
Longitud de onda [nm]
1526.0 1526.2 1526.4 1526.6 1526.8 1527.0
R1
R2
(R1.R2)1/2
Tiempo [s]
0 50 100 150 200 250
Inte
ns
ida
d [u
.a.]
0
20
40
60
80

5.5.3 Working range sensor determination (continuous / discontinuous monitoring)
Work range is dependent of the assembly which networks are located. E.g. In the case of temperature measurement, the slope
depends on whether the network is fully adhered to a support or not (e.g. aluminum), as it depends directly from the thermal expansion
coefficient of the material.
5.6 Results of first tests of optical sensors
The obtained results show a substantially linear transfer of analyzed transducers. In the studies lasers have been used (interferometric sensors) or sources of broadband type LED (Bragg grating sensors) even the high response of the transducers the intensity of these
sources is typically not limiting. Bandwidth depends on the sensor assembly, but easily exceeds the requirements set for this application.
Moreover, the optical systems are inexpensive and can be adequately compacted. Its multiplexing is an additional advantage.
References.
1. Udd E., Fiber Optics Sensors – An introduction for Engineers and Scientists, ed. E. Udd. 1991: John Wiley & Sons.

2. Yu F. T. S. and Yin S., Fiber Optic Sensors. 2002: CRC Press.
3. Udd E. Fiber Optic Sensors. 1992. Boston, Massachusetts.
4. Snow, J.W. A fiber optic fluid level sensor: Practical considerations. in Proc. SPIE. 1983.
5. D. R. Miers, D. Raj, and J.W. Berthold, Design and characterization of fiberoptic accelerometers. Proc. SPIE, 1987. 838: p. 314-317.
6. Berthold J. W., Ghering W. L., and Varshneya D., Design and characterization of a high temperature, fiber optic pressure transducer. IEEE J. Lightwave Tech., 1987. LT-5: p. 1-6.
7. Rui H., Shenfang Y., Yun J., and Baoqi T., Intrinsic microbend fiber optic sensors, in Proceedings of SPIE, the International Society for Optical Engineering. 2002. p. 148-153
8. M. Corke, F. Gillham, A. Hu, D.W. Stowe, and L. Sawyer, Fiber optic Pressure Sensors Employing Reflective Diaphragm Techniques. Proc. SPIE, 1988. 985: p. 164-171.
9. Giles et al, pp 233-239., Self- Compensating Technique for Remote Optic Intensity Modulated Transducers. SPIE Fibre Optics' 85 (Sira), 1985. 522: p. 233-239.
10. I. P. Giles, S. McNeill, and B. Culshaw, A Stable Remote Intensity Based Optical Fibre Sensor. J. Phys. E (GB), 1985. 18(6): p. 502-504.
11. Dandridge, A., Fiber Optic Sensors Based on the Mach-Zehnder and Michelson Interferometers, ed. E. Udd. 1991. 273-277.
12. Dandridge A., Fiber optic sensors based on the Mach-Zehnder and Michelson interferometers, in Fiber Optic Sensors: An Introduction for Engineers and Scientists, Eric Udd, ed. 1991.
13. Dandridge A. and Goldberg L., Current-induced frequency modulation in diode lasers. Electron. Lett., 1982. 18(7): p. 302-304.
14. Marfal, L.A.P., J.V.F. Leao, G. Nader, E.C.N. Silva, R.T. Higuti, and C. Kitano, Analysis of Linearity and Frequency Response of a New Piezoelectric Flextensional Actuator Using a Homodyne Interferometer and the J1-J4 Method, in
Instrumentation and Measurement Technology Conference, Proceedings of the IEEE. 2005. p. 1048 - 1053.
15. Sheem S. K., Giallorenzi T. G., and Koo K., Optical techniques to solve the signal fading problem in fiber interferometers. Appl. Opt., 1982. 21(4): p. 689-693.
16. Dandridge A. and Tveten A., Thermal phase compensation in fiber-optic interferometers. J. Lightwave Tech., 1984. 2(2): p. 73- 75.
17. Cole J., Danver B., and Bucaro J., Synthetic-heterodyne interferometric demodulation. IEEE J. Quantum Electron., 1982. 18(4): p. 694-697.
18. M. Corke, A. D. Kersey, and D.A. Jackson, All Fibre Michelson Thermometer. Electronic Lett., 1983. 19: p. 471.
19. Tsuda H., Koo J.-H., and Kishi T., Detection of simulated acoustic emission with Michelson interferometric fiber-optic sensors. J. Mater. Sci. Lett., 2001. 20(1): p. 55-56.
20. Yuan L., Yang J., Liu Z., and Sun J., In-fiber integrated Michelson interferometer. Opt. Lett., 2006. 31(18): p. 2692-2694.
21. Omega, High Temperature Blackbody Calibrators, in www.omega.com. 2007.
22. Berthold III J. W., Industrial Applications of Fiber Optic Sensors. 1991: p. 414.
23. Christensen D. A. and Ives J. T., Fiber optic temperature probe using a semiconductor sensor. Proc. NATO Advanced Studies Institute, Dordrecht, The Netherlands, 1987: p. 361.
24. www.oceanoptics.com/products/sensors.asp, Ocean Optics Optical Sensors.
25. Woerdeman D. L. and Parnas R. S., Model of a Fiber-Optic Evanescent-Wave Fluorescence Sensor. Appl. Spectrosc., 2001. 55(3): p. 331-337.

26. Arenas, G.F., Russo, N. Duchowicz, R. "Fiber optic based interferometric methods applied to photopolymerization analysis"En Interferometry Principles and Applications Editors: Mark E. Russo, Nova Publishers, New York, USA,
ISBN: 978-1-60741-050-8, 2011
27. Duchowicz R., Arenas G. and Vallo C. "Determination of dental composites properties by using a FIZEAU fiber interferometer". en “Handbook of Interferometers; Research, Technology and Applications”. Halsey David and Raynor William, Eds. Nova Publishers, New York, USA,ISBN: 978-1-60741-050-8, 2009 (Hardcover y e-Book)
28. E. J. Post, Sagnac Effect. Rev. Modern Physics, 1967. 39: p. 475.
29. H. J. Arditty and H. C. Lefevre, Sagnac Effect in Fiber optic Gyroscopes. Opt. Lett., 1981. 6: p. 401.
30. Ulrich R. and Johnson M., Fiber-ring interferometer: polarization analysis. Opt. Lett., 1979. 4(5): p. 152-154.
31. Ulrich R., Fiber-optic rotation sensing with low drift. Opt. Lett., 1980. 5(5): p. 173-175.
32. Kintner E. C., Polarization control in optical-fiber gyroscopes. Opt. Lett., 1981. 6(3): p. 154-156.
33. Fredricks R.J. and Ulrich R., Phase error bounds of fibre gyro with imperfect polariser/depolariser. Electron. Lett., 1984. 20(8): p. 330-332.
34. Fiber Optic Sensors, ed. Yu F. T. S. and Yin S. 2002, USA: CRC Press.
35. G. D. Peng and P. L. Chu, Optical Fiber Hydrophone Systems, Cap. 9, ed. Francis T. S. Yu and S. Yin. 2002.
36. G. W. Day, K. B. Rochford, and A. H. Rose, Fundamentals and problems of fiber current sensors. Optical Fiber Sensors, Capítulo 11 1996: p. 124-128.
37. Y. N. Ning, B. C. B. Chu, and D. A. Jackson, Rev. Sci. Instrument. 1992. 63: 57-71.

6 -CONCLUSIONS
CONCLUSIONS

• It is observed in the sample of seismic events analyzed that
epicenter relationship with respect to the distance in miles to
the main urban centers that have high population density
(thus increased risk human and material), present distance
of 150km and earthquake mechanical wave that travels at -30
5km/ sec. in this example- reaches densely populated
populations and impact them.
• An analysis of the optical transport network of
telecommunications of national projects such as "Argentina
Conectada", the "Federal Network Optical Fiber " (REFEFO)
provide an opportunity to cover in km most of the country
(60.000km) with a high-capacity network, capillarity,
security and extension, with transmission times of 1-2 mil.
Sec. every 1000km approx.-for-optical fiber so it exceeds in
magnitude orders the rate of propagation of the quake
mechanical wave and would create an "early warning system
for earthquakes" with direct reporting to the impact zone via
cell / TDA etc. It adds value to its original project as proposed
ITU national network (see p.5, Ref.1) at minimum cost
including the use of modern optical sensors locally
manufactured (CIOP UNLP) that complete the "Optical
Network and Early Earthquake Warning System "concretely
and complementing current INPRES network of sensors

connected by radio to optical fiber connection, reducing costs,
mainly maintenance.
• Detection of the sensors would be managed at different
levels as; local alarms/ municipal / provincial / national and
even regional (e.g. a country Argentina alerts in real time and
automatically to Chile and Bolivia) creating the concept of
“Optical Network and Early Earthquake Warning System”
with the potential to be scalable and reach South America as a
whole, provided notice to people who today do not have that
vital information
• The alarm call would be provided through direct interfaces
from principal / secondary nodes and ARSAT SA central to all
terminals (SMS / AD / radio) the area of the incident with
lowest priority to distance from the epicenter as it will the
people who will be protected as soon as possible and take
action (close / disconnection) on local services of gas,
electricity, etc. to avoid critical damage.
• It remains the task process modeling to follow the
directives of the entity responsible for managing the network
of seismology INPRES and safety directives to natural

disasters, and then pour it into a manager (soft + hard) to
execute those actions necessary to ensure early warning,
which will impact the various communications services in the
region but with holistic-national vision, and having a
validator alarm center next to the public.
• Defined the previous point can exploit in detail for each
REFEFO link the cost of adding sensors, plus the sensor
transmission equipment to the secondary node and then
through dedicated interface to the alarm system (not shared
with other critical service) by DWDM TX will reach the
primary regional node (Example Cuyo) to manage and
backup alarm 7 x 24 x 365 days, extending the national
INPRES network adding: a) more samples from the field and
b) new optical detection locally manufactured c) high
security for extra connections d) reducing installation and
maintenance costs going from active sensors in sensor radio
nodes and passive optical network to the node.

7. FUTURE RESEARCH

7.FUTURE RESEARCH
- Make a plan of scientific-industrial development associated
with the category "Optical Sensors" for the future of this
interesting product and because Argentina have the technical
capacity to add immediate development and thus, new
technical resource / economic to the country.
For decades, the technology of fiber optic sensors has undergone a
revolution with the growth of fiber optic products for
telecommunications. These new areas of potential opportunities
include replacing most existing environmental sensors, and the
opening of markets where there are no sensors with comparable
capacity. These new technologies, combined with advances in
optical transducers have enabled remote monitoring of vibration
using compact instrument packages including portable type in
critical environments. Also, optical fiber sensors can offer
contactless and undisturbed measurements.
Have now been enhanced as a promising technology in various
applications where excel, and monitoring of natural seismic
processes, the exploration of oil and gas. For the past couple of
years CIOp has started the experimental design of a geophone

seismic networks-based on optical fiber Bragg recorded (SG-BGS).
These networks are in turn recorded in the same laboratory.
The next step is to implement an engineering model suitable for
field application requiring Argentina industry and Latin American.
The figure shows the growth of sensor technology vibration by
Bragg grating through the number of publications on the subject
for years.
Picture 1: Plot published in Journal of Sensors, Volume 2010, and Article ID
936487 Hindawi Publishing Corporation "Vibration Detection Using Optical
Fiber Sensors" (Review Article) Authors: Y. Rodrıguez Garcıa, J. M. Corres,
and J. Goicoechea
- Perform full field test detector with integrated optical
circuit-node - TX DWDM namely:

a) evaluation of sensor by Bragg grating placed at REFEFO
junction box in measurement points recommended by
INPRES
b) analyze the inclusion and type of optical amplifier to
transmit the signal of the detector to the nearest ARSAT SA
concentrator node and management node of the received
signal based on the specific Soft early warning network.
c) detection sending by TX DWDM channel to primary node
for automatic backup.
d) determine delay (Delay) of the signal from each sensor
node to establish the downtime detection and remote
management action to identify a hazardous event
(earthquake bigger than 4 for example)
- Make proposal to standardize detection technology in Latin
American countries to establish unique coding of alarms and
managers to simplify the task and avoid delays in the future
to connect one country to another.
- Make a research and output normalization of the alarm for
all terminals (SMS / AD / radio) the area of the incident with
the priority to the nearest from the epicenter as they will be

the people who will be protected as soon as possible and take
action on local services of gas, electricity, etc. to avoid critical
damage.
- Perform system-modeling tasks process must follow the
directives of the body responsible for safety against natural
disasters, and then pour it into an interface (soft + hard)
according to the necessary actions to ensure early warning
and impact on different communications services in the
region but with national- integral vision.

8 - Bibliography

REFEFO. 2012. Red Federal de Fibra Óptica:
[Online] www.argentinaconectada.gob.ar
INPRES.2012. Instituto Nacional de Prevención Sísmica:
[Online] www.inpres.gov.ar
UNESCO. 1ra Edición, Barcelona: Blume, 1980. Terremotos: evaluación y
mitigación de su peligrosidad.
UNESCO, 2011. CONCEPTOS Y HERRAMIENTAS SOBRE SISTEMAS DE ALERTA
TEMPRANA Y GESTIÓN DEL RIESGO PARA LA COMUNIDAD EDUCATIVA:
[Online] www.unesco.org
UNESCO, 2007. MANUAL SOBRE SISTEMAS DE ALERTA TEMPRANA:
[Online] www.unesco.org
NACIONES UNIDAS, 2012. ESTRATEGIA INTERNACIONAL PARA LA REDUCCION DE
DESASTRES – CAP 5.5 SISTEMAS DE ALERTA TEMPRANA.
[Online] www.eird.org/vivir-con-el-riesgo
CENTRO DE INSTRUMENTACIÓN Y REGISTRO SÍSMICO a.c. 2012. Sistema
de Alerta Sísmica (SAS) de la ciudad de México - Sistema de Alerta Sísmica de
Oaxaca SASO.
[Online] www.cires.org.mx
BANGASH, M Y H. Editorial: SPRINGER-VERLAG W, Edición: 2010.
Earthquake Resistant Buildings: Dynamic Analyses, Numerical Computations,
Codified Methods.
DR. MIGUEL HERRÁIZ SARACHAGA. Editorial CISMID, febrero 8, 2011.
Conceptos Básicos de Sismología para Ingenieros: ORIGEN DE LOS TERREMOTOS - FALLAS
Y ONDAS SÍSMICAS - PROCESO EN EL FOCO, APROXIMACIÓN DE FOCO PUNTUAL - FOCO EXTENSO. MODELOS
COMPLEJOS - PARÁMETROS DE LOCALIZACIÓN - PARÁMETROS DE TAMAÑO - DISTRIBUCIÓN ESPACIAL Y
TEMPORAL DE TERREMOTOS - MICROSISMICIDAD, APLICACIONES -TRANSMISIÓN DE ONDAS SÍSMICAS:
ATENUACIÓN Y ESPARCIMIENTO - REGISTROS EN EL CAMPO PRÓXIMO: ACELEROGRAMAS, ESPECTROS DE
RESPUESTA PELIGROSIDAD Y RIESGO SÍSMICO
NADC, La National Data Buoy Center - NOAA, La National Oceanic and
Atmospheric Administration
[Online] www.ndbc.noaa.gov

http://www.unesco.org
ANTONIO M. POSADA CHIMCHILLA. Departamento de Física Aplicada
Universidad de Almería e Instituto Andaluz de Geofísica y Prevención de
Desastres Sísmicos, Almería 1994. Estudios Sismológicos con Redes Sísmicas
Locales.
Ingeniería de Fibra Óptica. Teoría y Práctica. Autor: Ing. Miguel Ángel Ibáñez.
ISBN 978 987 33 2322-5


9 - Annex I
Seismic events. -

9. ANNEX II
9.1 Seismic events. -
The deformation of rock materials produces different types of
seismic waves. A sudden slip along a fault, for example, produces
longitudinal waves push-pull (P) and transverse shear (S). P wave
trains, compression, set by a push (or pull) in the direction of
wave propagation, causing jerks back and forth on the surface
formations. Sudden shear displacement moving through the
material at a speed less than the wave planes shaken up and down.
When P and S waves found a limit as Mohorodovicic discontinuity
(Moho), which lies between the crust and mantle of the Earth,
reflected, refracted and transmitted in part and divide in some
other types of waves that pass through Earth. Propagation
intervals dependent on changes in the speeds of compression and
S wave passing through materials with different elastic properties.
Cortical granitic rocks show typical P wave velocities of 6 km / s,
while the underlying mafic and ultramafic rocks (dark rocks with
increasing content of magnesium and iron) have speeds of 7 to 8
km / s respectively.

Text: Type of waves-Primary wave o compression wave-Secondary wave or
cizalla-Epicenter-Waves collision
Picture 1: FOCUS - EPICENTER – WAVES COLLISION
Besides P and S waves (volume or body waves), there are two
surface waves, Love waves, named after British geophysicist
Augustus E. H. Love, which produce horizontal soil movements
and Rayleigh waves, by British physicist John Rayleigh, producing
vertical motions and waves are known as R. These waves travel at
high speed and propagation occurs on the earth surface.
Seismology is the branch of geophysics that studies earthquakes
and related phenomena. Furthermore, investigates the internal
structure of the earth, by analyzing the propagation of seismic
waves through the interior and the surface.
The origin of earthquakes according to the theory of "elastic
rebound" (Reid, 1911), which is illustrated in picture 2, provides

that certain preferential areas of the earth's crust (picture A)
which slowly accumulate great efforts that are supported by
materials (rocks) that constitute it. These efforts causing rocks in
increasing elastic deformations (picture. b) until it overcomes the
resistance of the same (picture C), and then a release occurs
almost instantaneously accumulated energy over time.
Picture 2: Theory of elastic rebound
The result of this mechanism is the spread of the energy released
in the form of seismic waves and the return to a state of
equilibrium of the elastic pre-stress-bearing zone in the presence
of a geologic fault or fracture, often visible in the surface of the
earth.

This mechanical model that explains the origin of earthquakes
was accepted immediately, but was unclear why the existence of
preferential areas of stress concentration.
9.2 SEISMOLOGY MEDIA STUDIO. - Seismic waves longitudinal,
transversal and superficial cause vibrations reaching the earth's
surface. Seismic instruments are designed to detect these
movements with electromagnetic or optical methods. The main
instruments called seismographs have been improved following
the development by German Emil Wiechert seismograph of a
horizontal, in the late nineteenth century. Some instruments, such
as electromagnetic pendulum seismometer employ
electromagnetic records, that is, the voltage induced by an electric
amplifier passes to a galvanometer. Registrars sweep at high-
speed photographic film leaving marks of motion versus time.
Waves of refraction and reflection are recorded on magnetic tapes
that allow its use in computer analysis.

Picture 3: RUSSIAN ELECTROMAGNETIC SEISMOMETER TYPE GALIZIN
Picture 4: REGISTRATION SYSTEM IN INK ON PAPER
Tension seismographs employ electronic measuring voltage
change of the distance between two concrete columns separated
by about 30 m. They can detect compression and rebound
responses in soil for seismic vibrations. Benioff linear
seismograph detects voltage tensions related tectonic processes
associated with the propagation of seismic waves and periodic

movements, or tidal, solid Earth. More recent inventions include
the rotational seismometers, inclinometer, broadband
seismographs and long period ocean bottom seismographs.
There are similar seismographs on worldwide stations for
recording signals from earthquakes and underground nuclear
explosions. The World Standard Seismographic Network
comprises around 125 stations.
9.3 MAGNITUDE SCALES - INTENSITY. - One of the biggest
problems for the measurement of an earthquake is the initial
difficulty to coordinate the records obtained by seismographs
located at different points ("Seismic Network"), so it is not
unusual that the information discordant are preliminary and
based on reports that showed different wavelengths. Determine
the total area covered by the quake may take several hours or
days of greater movement analysis and its aftershocks. The
prompt diagnosis is paramount to start up support mechanisms in
such emergencies.
Each earthquake has assigned a unique magnitude value (Richter),
but the evaluation is done, when there aren´t a sufficient number
of stations, mainly based on records that were not necessarily
made at the center but close points. Hence, different values are

assigned to each town or city and interpolating the achieved
numbers located in the epicenter.
Once data are coordinated the various stations, it is common that
there is a difference bigger than 0.2 degrees assigned to the same
point. This may be more difficult to perform if earthquakes occur
close in time or area. Although each earthquake has a unique
magnitude, its effect will vary greatly depending on the distance,
the condition of the land, building standards and other factors.
a) Magnitude (Richter Scale.) - measures the energy released at
the focus of an earthquake. It is a logarithmic scale with values
between 1 and 9, an earthquake of magnitude 7 is ten times
stronger than a magnitude 6, one hundred times more than
magnitude 5, a thousand times more than a magnitude 4 and thus
in cases analogs. It is estimated that occur annually in the world
about 800 earthquakes with magnitudes between 5 and 6, some
50,000 with magnitudes between 3 and 4, and only 1 with
magnitude between 8 and 9. In theory, Richter scale has no peak,
but until 1979 it was believed that the most powerful earthquake
magnitude would be 8.5. However, since then, progress in seismic
measurement techniques has enabled seismologists redefine the
scale 9.5 now considered the practical limit.

TABLE I: MAGNITUDE - RICHTER SCALE
Richter Scale Earthquake Effects
Magnitude
Less than 3.5 Generally not felt, but recorded
3.5 - 5.4 Often felt, but only causes minor damage
5.5 - 6.0 causes light damage to buildings
6.1 - 6.9 can cause severe damage in populated areas.
7.0 - 7.9 Big Earthquake. Cause serious damage
8 or bigger Great earthquake. Total destruction to
nearby communities.
b) Intensity (Mercalli Scale.) - measures the intensity of an
earthquake with gradations from I to XII. Since surface seismic
effects decrease with distance from the focus, Mercalli extent
depends on the position of the seismograph. A current I is defined
as an event perceived by few, while intensity XII is assigned to the
catastrophic events that cause destruction. It is expressed in
Roman numerals and is proportional, so that a current is twice IV
II, for example.

TABLE II: Intensity - Mercalli scale
Grade I Shaking felt by very few under especially favorable
conditions.
Grade II Shaking felt only by few persons at rest, especially on
upper floors of buildings. Suspended objects may swing.
Grade III Shaking clearly felt in the interior, especially on upper
floors of buildings, many people do not associate it with a shudder.
Parked motor vehicles may move slightly. As vibration caused by
the passage of a heavy truck. Duration estimable
Grade IV Shaking felt during the day for many people in the
interiors, for few outside. At night some awakened. Vibration of
dinner service, glass windows and doors, the walls creak.
Sensation of a heavy truck crashing into a building, parked motor
vehicles clearly sway.
Grade V Shaking felt almost everyone, many awakened. Some
pieces of crockery, glass windows, etc., are broken, few cases of
cracking flattened; falling objects. Disturbances are observed on
trees, poles and other tall objects. They stop the clocks.
Grade VI Shaking felt by everybody; many frightened people
fleeing out. Some heavy furniture change places; few examples of
drop flattened or damaged chimneys. Light damages.

Grade VII. Felt by everybody. People flee abroad. Minor damage in
buildings of good design and construction. Slight damage in well-
built ordinary structures, considerable damage to weak or poorly
planned, some chimneys broken. Estimated driving by people
moving vehicles.
Grade VIII Slight damage in especially good designed structures;
considerable in ordinary buildings with partial collapse; weakly
built large structures. The walls leave their armor. Fall of
chimneys, stacks of products in the stores of factories, columns,
monuments, and walls. Heavy furniture overturned. Sand and
mud in small amounts projected. Change in the water level of the
wells. Loss of control in people guiding motor vehicles.
Grade IX Considerable damage in good design structures; armor
well planned structures collapse, major damage to strong
buildings, with partial collapse. The buildings leave their
foundations. The ground cracks significantly. The underground
pipes are broken.
Grade X Destruction of some well-built wooden structures, most
masonry structures are destroyed and armor yet and foundations,
cracking of the ground. Railroad tracks are twisted. Considerable
land slides in riverbanks and steep slopes. Invasion of river water
on their margins.

Grade XI Hardly any masonry structure still standing. Bridges
destroyed. Wide cracks in the ground. Underground pipelines are
out of service. Subsidence and landslides in soft ground. Ample
railways torsion.
Grade XII Total destruction. Visible waves on the ground.
Disturbances of the level dimension (rivers, lakes and seas).
Objects thrown upward into the air.
The intensity can be different in different locations reported for
the same earthquake (Richter magnitude, however, is just one)
and depend on the following:
• The energy of the earthquake.
• The distance of the fault where the earthquake struck.
• The way the waves arrive at the site is recorded.
• The geological characteristics of the underlying material from
the site where the intensity is recorded.
• How people felt or did the earthquake records.
Tremors intensities between II and III are almost equivalent to the
magnitude of between 3 and 4 on the Richter scale, while levels in
the eleventh and twelfth Mercalli scale may be associated with the
magnitudes 8 and 9 on the Richter scale.

9.4 EARTHQUAKE PREDICTIONS. - Attempts to predict when
and where earthquakes will occur have had some success in
recent years. At present, China, Japan, Soviet Union and the United
States are among the countries supporting this research. One of
the clues that can lead to a prediction is a series of low-intensity
tremors, shakes called precursor. Other tracks are potential
buckling of inclination or the land surfaces and changes in the
terrestrial magnetic field, water levels in the wells and even
animal behavior. There is also a new method based on the
measurement study of the change of the crust stresses. Based on
these methods, we study predicted many earthquakes, but these
predictions are not always right and there is to date (2012),
proven scientific methodology.

10 - Annex II
Earthquakes, backgrounds.

Annex II:
10.1 Ring of Fire. - The Ring of Fire or Circum Pacific Belt (See
Figure 1) is located on the shores of the Pacific Ocean and is
characterized by concentrating some subduction zones [1] in the
world, causing intense seismic and volcanic activity in the areas
covered and includes (in counterclockwise) to Chile from
Argentina, part of Bolivia, Peru, Ecuador, Colombia, Central
America, Mexico, the United States, parts of Canada, then folds up
to the Aleutian Islands and down the coasts and Russia Islands,
Japan, Taiwan, Philippines, Indonesia, Papua New Guinea and New
Zealand.
Picture 1: RING OF FIRE

SOURCE: http://en.wikipedia.org/wiki/Pacific_Ring_of_Fire
[1] The plate subduction is a process of sinking of a lithospheric plate under
another at a convergent boundary, according to the theory of plate tectonics.
The Pacific Ocean layer rests on several tectonic plates, which are
in constant friction, which in turn accumulate tension when
released causes earthquakes belt countries. Furthermore, the area
constantly concentrates volcanic activity. In this area plates of the
earth's crust sink at high speed (several centimeters per year), yet
accumulate enormous tensions to be released as earthquakes.
The Ring of Fire extends about 40,000 km across the Pacific, has
452 volcanoes and concentrates more than 75% of active and
inactive volcanoes in the world. About 90% of the world's
earthquakes and 80% of the world's largest earthquakes occur
along the Ring of Fire. The second most seismic region (5-6% of
earthquakes and 17% of the world's largest earthquakes) is the
ring Alpide, which extends from Java to Sumatra through the
Himalayas, the Mediterranean to the Atlantic. The belt of Meso
Atlantic ridge is the third most seismic region.
The Ring of Fire is a direct result of tectonics plates, the
movement and collisions of crustal plates. The eastern section of

the belt is the result of the subduction of the Nazca Plate and the
Cocos plate beneath the South American plate moving westward.
The Cocos Plate is sinking beneath the Caribbean plate in Central
America.
A portion of the Pacific Plate along with the small Juan de Fuca
plate sinks beneath the North American plate. Along the northern
portion of the ring, the Pacific plate, which moves to the
northwest, is being subducted beneath the Aleutian Islands arc.
Further west, the Pacific plate is subducted along the arcs of the
Kamchatka Peninsula in the south beyond Japan. The southern
part is more complex, with a number of smaller tectonic plates in
collision with the Pacific plate from the Mariana Islands,
Philippines, Bougainville, Tonga, and New Zealand. Indonesia lies
between the Ring of Fire along the northeastern islands adjacent,
including New Guinea, and the ring Alpide along the south and
west of Sumatra, Java, Bali, Flores and Timor.
10.2 TECTONIC PLATES. - The theory of tectonic plates states
that the lithosphere (the upper portion and rigid cooler Earth) is
fragmented into a series of plates that move over the
asthenosphere (see PICTURE 2). The Earth's lithosphere is
divided into macro and micro plates where there is a
concentration of seismic activity, volcanic and tectonic these
edges and this results in formation of large chains and basins.

PICTURE 2: Fragmentation of the lithosphere
SOURCE: http://en.wikipedia.org/wiki/Plate_tectonics
The areas of the plates adjacent to the boundaries, the plate edges
are the most active geological internal regions of the planet. They
concentrate:
• Volcanism: Most active volcanism is generated in the dorsal axis
in divergent boundaries. Being underwater and fluid type, some
violent, goes very unnoticed. Behind regions are located adjacent
to the nasal side of the plate not subducts.
• Orogeny: i.e. emergence of mountains. Is simultaneous
convergence of plates, in two areas: a) where subduction occurs.
They rise volcanic arcs and mountain ranges such as the Andes,

rich in volcanoes, b) within the limits of collision, where little or
no volcanism and seismicity is particularly intense.
• Seismicity: intraplate earthquakes happen some in fractures
generally stable and central regions of the plates, but the vast
majority comes from plate boundaries. The circumstances of
climate and history have focused much of the world's population
in highly seismic continental regions, which form orogenetics
belts, along convergent boundaries.
Picture 3: Tectonic Plates
SOURCE :: http://en.wikipedia.org/wiki/Pacific_Ring_of_Fire
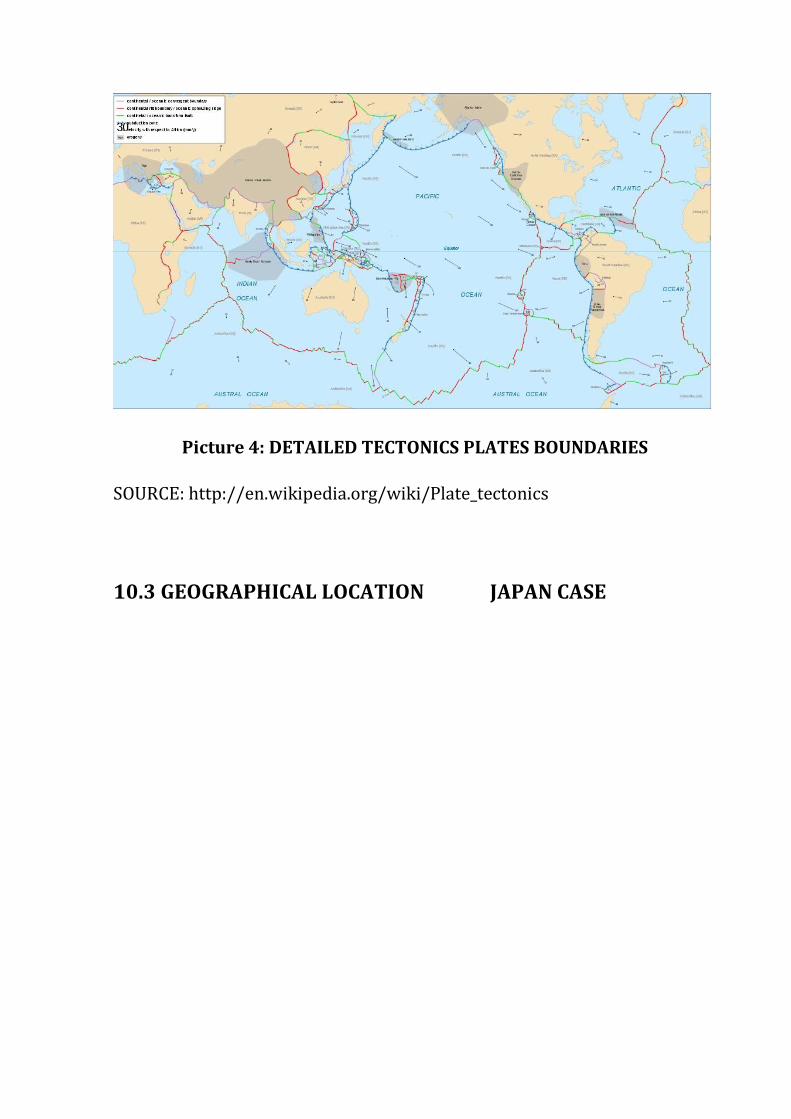
Picture 4: DETAILED TECTONICS PLATES BOUNDARIES
SOURCE: http://en.wikipedia.org/wiki/Plate_tectonics
10.3 GEOGRAPHICAL LOCATION JAPAN CASE

PICTURE 5: EARTHQUAKE AND TSUNAMI
SOURCE: www.wikipipedia
10.4 GEOGRAPHICAL LOCATION CHILE CASE

PICTURE 6: EARTHQUAKE OF CHILEAN COAST
SOURCE: www.wikipedia
10.5 EARLY WARNING SYSTEMS ENVIRONMENT IN THE RISK
REDUCTION PROCEDURE - In the conceptual framework associated
with the theme of disaster risks are defined as the combination of
social threats and vulnerabilities. The risk as a process that is
generated by building vulnerable social environments (housing,
infrastructure, services, energy, communication,
telecommunication, etc.) over many years, in areas where threats
are manifested in different types. As expected, the result of this
process is the disaster, which occurs when the threat becomes in
event or natural phenomenon of such proportions that causes

multiple damage to the social environment. Recognizing that
reducing disaster risks should be reduced, it should reduce
vulnerabilities and minimize exposure as much as possible threats.
From the previous definition, we can deduce the following:
RISK = THREAT X VULNERAILITY X PREPARATION DEFICIENCIES
As noted, the risk increases according to threats and
vulnerabilities and the extent to which the population is not
adequately prepared to face the events when they occur. However,
the risk can be decreased by implementing measures to prepare
the population to respond appropriately in the event of a natural
disaster.
In this definition Readiness activities focused set of measures
taken before and during a natural phenomenon, which aim to
reduce the impact. Early warning systems (EWS) in the case of
events of different nature (hurricanes, earthquakes, tsunamis,
etc.) are a typical example of such measures, which aim to alert
members of the regions, on possible catastrophic events before
they occur.

Prevention can be defined as the set of measures taken to reduce
or minimize exposure to natural hazards. In contrast Mitigation
approaches the set of measures taken to reduce vulnerability.
Although prevention and mitigation measures are helpful in
reducing the risks, there are natural phenomena for which there
are no simple prevention measures. In these cases, it is necessary
to prepare and organize the population in some way so that you
can minimize the damage caused by these phenomena and to
avoid material losses and especially human owing to such
phenomena. In this case, one speaks of measures designed in the
preparation context.
Text: Prevention-Threat-Reduced threat Vulnerability-Reduced vulnerability
Mitigation

PICTURE 7: IMPLEMENTATION OF PREVENTION AND MITIGATION
As shown in the graph, the threat and vulnerability are reduced
through prevention and mitigation respectively.
6.10 WARNING DISSEMINATION. - One of the three main
components of any early warning system is the issuing of
warnings to the regions that will be affected by the events.
Therefore, it is necessary to develop schemes issuing of warnings
and protocols to standardize the alerts report.
The warning dissemination aims to end the execution of
preparedness activities, aimed at mobilizing local structures and
the general population. In the case of local structures, the alerts
begin implementing emergency plans, which account for activities
such as search and rescue, installation and operation of shelters or
shelters, first aid and general coordination activities. For the
population, alerts are intended to awaken a response involving
efficient evacuation in some cases or implementing protective
measures.
It is expected that when National Committees are consolidated
Emergency Operations with operational protocols, to that extent
will begin a strengthening of Early Warning Systems-SATs-
existing through the drafting and implementation of protocols for
warning dissemination.

The warning dissemination protocols should focus on the
following aspects:
• Pre-existing conditions that should trigger the issuing of alerts.
• Terms determinants to spread the different types of alerts
(green, yellow, orange and red)
• Contents of the messages that are broadcast alerts, reporting
formats: newsletter, press conferences, reporting entities of
regional or national level, etc.
• Warning dissemination through media (mass media or the use of
sirens in local communities, etc.)
• Log of notices
The following describes in more detail each of these points relate
to the alerts dissemination.
a) Pre-existing conditions for warning emissions. - Once the
committee or unit responsible for analyzing and forecasting the
imminent presence manifests a natural phenomenon, it is the
responsibility of the system operator responsible for initiating
activities for the dissemination of alerts. To facilitate the
operation of this phase of the early warning system requires the
operator responsible for the system to have a procedures manual,
which should include:

• To whom or who should be notified about a possible event.
• How should the notice of the possible event be.
• When should proceed to the notification.
• Where should make the notification.
Typically this information is to be found in the manual or
procedures manuals accompanying the SAT.
b) The different types of alerts. - Recognizing that some
phenomena like earthquakes can be predicted with some time in
advance, you can then develop protocols for the issuance of four
different types of alerts:
• Green when there are general conditions that arises phenomena.
• Yellow: When general condition is creating the conditions for a
potentially serious phenomenon.
• Orange: When you have specified the conditions for which this
phenomenon and only a matter of minutes and hours to manifest
the phenomenon.
• Red: when the phenomenon is shown and has caused or is
causing damage.

In any of these four cases is necessary to count with protocols that
indicate what activities are to be executed, what procedures
should be implemented and how to give a follow up to the event. It
is important that the procedures manual indicates:
• Who should be notified according to the type of alert to be
issued.
• How should the notification regarding the type of alert to be
issued.
• When should proceed to the notice of the type of alert in
question.
• Where the notification must be made in each case.
c) Messages content for different types of alerts: formats. -
Recognizing that information emanating from SAT alerts about
has to come to the authorities and different types of institutions, it
is necessary that any message is clear, concise and contains the
information needed to explain the situation that is occurring.
Although the format of writing messages is not regulated, it is
recommended to have the support of the national institution of
civil protection or civil defense for the drafting of texts and
messages to achieve the objectives set in the previous paragraph.
The message must contain the following information:

• Date, day and time at which the message is issued.
• Source or person issuing the message.
• Type of event that is being presented, dimension or impact.
• Suggested action or needed to be taken, which may include the
initiation of institutional coordination.
• Verification Status.
As seen, the message should explain what kind of situation is
occurring and what kind of action to take as a result of the
message. Using preset formats is typical in this activity and later
as valuable for evaluating the effectiveness with which activated
the municipal committees and local emergency during the event,
as well as other institutions and different media.
Recognizing that an event involves the step response of different
people and institutions in the SAT operations manual should be
regulated when the messages should be issued and who, in order
to institutionalize SAT operation and legitimacy.
d) Alerts Dissemination: Mass Media. - Knowing that
information emanating from SAT alerts about has to reach the
population at risk, you can make use of mass media such as radio,
television or the press for this. The medium to be used depends on
the degree of advance with which the alert has to diffuse. For
example, in the case of hurricanes, you have enough time from

that form to use different media to disseminate information on the
phenomenon. However, in the case of flash floods, as falling
outside the periodic alert means. In these cases, the radio and
television can play a leading role. However, a critical point is
always in control of the means to that alert without causing crisis
and create panic in the population. In practice, there are some
more resources available to support the institutions of defense or
civil protection warning dissemination especially following preset
guidelines for the entity. However, it should be recognized
between competitiveness by means of the first to report a story or
message of this type. Therefore, it is recommended to regulate the
disclosure of information in newsletter INPRES pre-established
schedule, thereby avoiding favoring one medium over another if
there are several in the region where the alert is broadcast.
Similarly, it is recommended to use messages with pre-established
formats to avoid confusion in the information.
As in the previous case, the press bulletin should contain the
following format:
• Headline: Bulletin Number
• Date, day and time at which the message is issued
• Source or person issuing the message
• Type of event that is occurring, or expected impact dimension

• Suggested action or needed to be taken, which may include the
initiation of institutional coordination
• Verification Status
The media have access to information sources via the Internet and
international media sources type (CNN, AP, Reuters, etc.), so it is
necessary that the SATs earn the trust of the media via an
attachment to transmission times and by transmit messages that
strengthen confidence in the information generated by the SAT
operators.
To achieve this goal can invite the press to know all the ins and
outs of the SAT, its structure and function in non-critical times. It
is recommended that these activities be supported by the national
civil defense institution to consolidate the legitimacy of the SAT
and the accuracy of the information it generates.
e) Messages and warnings blog. - The management of
information in a systematic way is an indicator of the
professionalism with which SAT operates. Therefore, it is
necessary to provide SAT operators with a blog in which all
messages are archived emanating therefrom. Using the log turn
allows operators to perform three types of activities:
• Operation regulated with quality control based on information
broadcast.

• Generating historical cases, which can help more fluid
operations based on previous experiences or practices.
• Evaluation of the routine operation and in case of SAT events for
recognition of critical points, shortcomings and possible
improvements.
10.7 EARLY WARNING SYSTEMS IN THE WORLD. - Japan was
the first country to install early warning systems against tsunamis.
A wide network of buoys connected by satellite (Iridium
Constellation) with ground; detect any disturbance that together,
is similar to quake under the ocean floor, indicating an impending
tsunami.

PICTURE 8: TSUNAMI BUOY DETECTOR IN THE PACIFIC OCEAN
SOURCE: http://www.ndbc.noaa.gov/dart.shtml
To ensure early tsunamis detection and to acquire critical data in
real time to the forecast, National Oceanic and Atmospheric
Administration (NOAA) has the ocean assessment and reporting
stations Tsunami, called DART, at sites regions with a history of
generating destructive tsunamis.
Originally developed by NOAA [1], as part of the U.S. National
Tsunami Hazard Mitigation (NTHMP), DART project was an effort
to maintain and improve the capacity for early detection and real-
time information of tsunamis in the open ocean.
These DART stations currently constitute a fundamental element
of NOAA Tsunami Program. Tsunami Program is part of a
cooperative effort to save lives and protect property through
hazard assessment, warning guidance, mitigation, research
capabilities, and international coordination. The National Weather
Service (NWS) of NOAA is responsible for the overall
implementation of the Tsunami Program. This includes the
operation of Tsunami Warning Centers of America (TWC) and the
leadership of Mitigation Program National Tsunami Hazard. Also
includes the acquisition, operation and maintenance of observing
systems needed to support the tsunami warning, as DART, local

networks of seismic detectors coastal and coastal flooding. NWS
also supports the observations and data management through the
National Data Buoy Center
PICTURE 9: DART EXISTING STATIONS
SOURCE: http://www.ndbc.noaa.gov/dart.shtml
[1] NOAA, the National Oceanic and Atmospheric Administration is a federal agency
focused on the state of the oceans and atmosphere
[2] DART stations are deep ocean Assessment and Reporting of Tsunamis deployed
throughout the Pacific Ocean
DART consist of a pressure recorder anchored seafloor bottom
(BPR) and a buoy anchored to the surface for real-time
communications. An acoustic link transmits data of the BPR on the
seabed to the surface buoy. The BPR, also known as tsunameter,
collects the pressure and temperature data at intervals of 15
seconds. The system has two modes, standard data reporting and
events. The system operates routinely in standard mode,

obtaining four values of the data point in 15 minutes per level of
the estimated sea surface, which reports on the scheduled
transmission times. When the software identifies the sensor
detection inside a case, the system ceases standard mode
reporting and begins event mode transmissions, where values are
transmitted 15 seconds during the initial few minutes, followed by
updates every minute. Event messages contain so also the time of
the initial appearance of the event. Once the event mode, an
immediate alert is sent to the buoy, causing lights Iridium
transceivers for immediate transmission of data to warning
centers. The event message in the first mode contains the exact
time that the event has been detected, a message ID, as well as the
average height of the water column that caused the event mode.
In the first DART generation, DART I, are systems that had a
communication via of the tsunameter to Tsunami Warning
Centers (TWC) and the National Data Buoy Center (NDBC)
through the Geostationary Operational Environmental (GOES
West).
DART systems operate since 2003. Subsequently the National
Data Bouy Center had replaced all DART I systems with second-
generation DART systems, currently DART II, in early 2008. The
DART II transmit data in standard mode once an hour and one of
its most important capabilities is the two-way communication

between the tsunameter and Tsunami Warning Centers (TWC)
and the National Data Buoy Center (NDBC) using the Iridium
commercial satellite communications system.
Picture 10: Components of a system DAR
SOURCE: http://www.ndbc.noaa.gov/dart.shtml
Two-way communications allow Tsunami Warning Centers set
stations in event mode in anticipation of possible tsunamis or high

resolution retrieve (15-s intervals) data in one-hour blocks for
detailed analysis. DART II has data transmission systems in
standard mode, which estimates the sea level height observations
at intervals of 15 minutes, once every six hours. Two-way
communications allow real-time troubleshooting and diagnostic
systems. DART buoys have two independent communication
systems and redundant. National Data Buoy Center distributes
data from both transmitters under transmitter IDs separated. Also
receives data from DART II systems, data formats grouped by
ocean basins, for a list of headings for each identifier ads used
transmission, and then delivers them to the National Weather
Service Telecommunications door link (NWSTG), which then
distributes real-time data to the Tsunami Warning Centers
through communications and the National Weather Service of
nationally and internationally through the Global
Telecommunications System.
Japan has other early warning through Urgent System of
Earthquake Detection on Japanese trains. Japan Railways is one of
the largest and most important companies in the world trains,
operating the famous Shinkansen. Moving a bullet train network
through a giant earthquake like the one that occurred in the
Earthquake - Tsunami of March 11th, 2011, is high risk. So they
created UrEDAS (Urgent Earthquake Detection and Alarm System).

Picture 11: SENSOR UrEDAS
SOURCE: Seismic Laboratory Berkeley.
It is an intelligent and unique alarm system, which includes three
seismometers. It is a single-station system that needs no extra
organization for creating networking. Immediately after the
arrival of the P wave, which gives information on the size, location
and depth of the earthquake within four seconds. Then the
damage is estimated based on the computed magnitude, epicenter
distance and depth. Using a similar approach, by relating the
magnitude and hypo central depth distance between the offshore
and the coastline, is also possible to estimate the potential damage
of a tsunami.
Quickly in relation to possible earthquake situation, the activation
of the alarm can be issued within a few seconds for those areas
that are vulnerable to earthquakes and tsunamis. Needless to say,

in order to effectively use this approach, together with the first
alarm, it is also necessary to educate and prepare people to follow
the procedures for disaster reduction in large and destructive
earthquakes. Its main feature is to be able to detect, in four
seconds from the start of the earthquake, magnitude, epicenter
and depth. It analyzes the movement of the shock wave and
determines which areas of the country will be stronger and what
trains should stop immediately. This combined with various
seismographs and instruments installed on the train stop all
movement on the Japan Railways network (JR).
UrEDAS system was so successful avoid disasters and derailments
that was converted to civilian use throughout the country,
creating the Earthquake Early Warning (EEW). The EEW adds a
number of obligatory alerts on Television, generated
automatically, regardless of what is being transmitted, and an
immediately system of alerts to cell that all residents receive.
Another SAT precedent analyzed was the Seismic Alert System
(SAS) of Mexico City, operates continuously since August 1991
and aims to advance warnings of seismic alert to Mexico City,
where earthquakes occur in the region covered by the sensor
stations in Guerrero. The seismic alert earthquake sensor has 12

stations on the coast of Guerrero to estimate the prognosis of the
extent of local seismic activity and sent by radio to the central
station of record in the Federal District. With this information, the
computer control system automatic issuance seismic warning
notices that are broadcast in the Valley of Mexico and Toluca to
anticipate the arrival of the effect of the earthquake energy. SAS
can provide warnings seismic in the valley of Mexico when it
recognizes the onset of large earthquakes occurring at Guerrero
coast.
In Federal District with a distance slightly more than 320 km from
the coast of Guerrero, the most destructive effects of an
earthquake can be alerted with a chance about 60 seconds, thanks
to the different distance and velocity of propagation of seismic
waves and radio.
DISTRIBUTION OF THE SAS SENSOR STATIONS TYPICAL SAS SENSOR STATION
SOURCE: Instrumentation Center and Seismic Record Source: Instrumentation Center

and Sist Registration
The seismic alert is automatically activated when the sensor
stations notified and confirm the start of a major earthquake.
Advance notice of the start of a major earthquake with a time of
about 60 seconds, the impact of its effect on the Valley of Mexico
and Toluca, which gives the opportunity to perform procedures
and actions that increase our advantage to reduce the possibility
of developing a new seismic disaster. A seismic early warning sign
is valuable where prevention drills are tested for protection and
safeguarding of persons and to ensure hazardous industrial
processes.
Since its launch, the seismic alert has been an ongoing program of
activities to ensure their strategic service. It is also essential
performance of routine operation and maintenance activities,
assessing daily functioning and analyze the results to improve
their effectiveness, test solutions to various technical problems
that have come or may end in failure, as well as improve their
procedures and integrate new technologies to ensure its future
viability.
Figure 12: SEISMIC WARNING SYSTEM MEXICO CITY
SOURCE: Cires alerta sismica

The seismic alert is automatically activated when the sensor
stations notified and confirm the start of a major earthquake.
Advance notice of the start of a major earthquake with a time of
about 60 seconds, the impact of its effect on the Valley of Mexico
and Toluca, which gives the opportunity to perform procedures
and actions that increase our advantage to reduce the possibility
of developing a new seismic disaster. A seismic early warning sign
is valuable where prevention drills are tested for protection and
safeguarding of persons and to ensure hazardous industrial
processes.
Since its launch, the seismic alert has been an ongoing program of
activities to ensure their strategic service. It is also essential
performance of routine operation and maintenance activities,
assessing daily functioning and analyze the results to improve
their effectiveness, test solutions to various technical problems
that have come or may end in failure, as well as improve their
procedures and integrate new technologies to ensure its future
viability.

Text: Recognition of strong earthquake-Epicenter-Seismic area-Seismic
sensors-Seismic focus- Alert notice- transmission network by radio- Notice
emission control- Public notices of seismic alert- radio diffusion and
commercial TV and dedicated radios
Picture 12: SEISMIC WARNING SYSTEM MEXICO CITY
SOURCE: Cires alerta sismica
SAS provides a public alerting service to people of the valleys of
Mexico and Toluca, in 2007 the cities of Acapulco and
Chilpancingo were incorporated as system users.
Users of Mexico City stands the Secretariat of Public Education,
which encourages its schools, listen to radio broadcasts from
stations that group the Broadcasters Association of the Valley of
Mexico. Announcements are used in SAS: Metro, Civil Protection
Federal District and the State of Mexico, in the TV channels 7, 11,
13, 22, 34 and 40, the Ministry of Works and Services DF,
Universidad Nacional Autonoma of Mexico, Universidad
Autónoma Metropolitana, the Housing Unit "El Rosario", among
others.

Source: Instrumentation Centre and Seismic Record
Just as there is SAS also Seismic Alert System of Oaxaca SASO was
created, with 29 of 36 seismic stations projected sensor, which are
located on the coast of Oaxaca to the north and center of the state,
which estimate the magnitude forecast local seismic activity and
sent by radio to the central station in the state capital. With this
information, the computer control system of the automatic issuing
warning notices seismic spread to Oaxaca city, to anticipate the
arrival of the effect of the earthquake energy. The Seismic Alert
System of the Oaxaca State, broadcast Preventive Alert automatic
notices to users connected to the system, when more than one
sensor station in Oaxaca predicts that the earthquake energy is
Moderate. Commercial radio stations in Oaxaca broadcast a public
alert when the forecast is Strong quake. Use a team called SASPER,
custom device to spread the seismic warning signal, which is
currently installed in public schools and local radio stations. Thus,

when SASO detects an earthquake, it sends a radio signal to
SASPER teams, signal that will be heard in the places mentioned
above.
SARMEX is a radio receiver to alert a range of possible risks with
different quick response functions, including sound Seismic Alert
System. Responds quickly to email, is designed to give greater
arousal time before the hazard warning issued by the authority, as
an approaching earthquake. It is noteworthy that the receiver is
designed to operate with warning systems Seismic Mexico City
SAS and Oaxaca SASO and warning systems with other various
risks.
Text: Danger detector by the authorities
Source: Instrumentation Centre and Seismic Record
It is designed for silent monitoring of the seven frequency
channels specified by the National Oceanic and Atmospheric
Administration and generates an audible alert when the risk is
next. Provides spoken and written explanation of what is
happening either through alarm tone or content issued by the

receiving station. In addition, the radio can trigger other warning
devices (such as a bell or strobe). To verify that the equipment is
tuned, SAS issues a monitoring every 3 hours at the following
times 2:45, 5:45, 8:45, 11:45 14:45, 17:45, 20:45, 23 : 45 hrs. The
receiver on receiving this message, the text displayed on the
screen "REQUIRED WEEKLY TEST" and activates the yellow
ADVISORY, which stays on for 3 hours to receive the following
message monitoring, this message does not generate sound. When
SAS generates an alert, the receiver outputs the official audio
"Seismic Alert" which lasts 50 seconds on screen displays the
message "Seismic Alert" and the red alert WARNING is activated
for 15 minutes.
Alert Sky launches, exclusive to Mexico, three different models of
Satellite Seismic Alert:
SKYALERTPERSONAL USB, 4GB USB personal device
designed to receive, via satellite, Satellite Seismic Alert
about 60 seconds prior to the arrival of the earthquake to
the Valley of Mexico. It is ideal for all types of people, with
extra USB functionality, with 4GB memory, which not only
takes your information with you, but also the Seismic Alert.

SKYALERT PRO is a critical messaging device designed to
receive, via satellite, Satellite Seismic Alert with up to 60
seconds prior to the arrival of the earthquake to the Valley
of Mexico. Ideal for residential or work areas (offices,
shops). When receiving the seismic alert, makes a loud
noise (93 decibels), displaying the intensity of the
earthquake on the screen, followed by a voice message
announcing that intensity, that allows the message to be
received when the device is not in the visual field of people.
SKYALERTPLUS, automatic reaction device in an
earthquake, can perform up to 8 commands specific case of
receiving the Seismic Alert Satellite and operate self-

protection mechanisms to prevent possible accidents on
site. Among its applications can be: Stop elevators, closed or
open gas valve or gas liquid element, opening doors, turning
on hazard lights, stop the operation of machinery, and many
more. It is ideal for use in industrial, corporate and
residential buildings in high-risk operations.
Text; sky alert plus reacts automatically to protect

11. Annexes III.
Overview of the Principles of Optical Fiber
Transmission.

11.1 OVERVIEW OF PRINCIPLES ON OPTICAL FIBER
TRANSMISSION.
a) Construction. - The optical fiber cable comprises extremely
thin wires ultra-pure silicon designed to transmit light signals.
Picture 1 shows the construction of a glass fiber that is the basic
component of the optical fiber cable. The center of the fiber strand
is called the 'core'. The core guide light signals that are
transmitted.
Text: Core-Sheathing- Sheathing or buffer
Picture 1: Cross-section of an optical fiber.
A glass layer called 'liner' surrounding the core. Sheathing
confines the light in the core. The outer region of the fiber is the
sheathing, usually a plastic material, which provides protection
and maintains the strength of the glass fiber. A typical OD for
sheathing is 125 micrometers (μm) or 0.125 mm. The core
diameter optical fiber cable commonly used in the local

infrastructure is 9, 50 or 62.5 μm. Single-mode fiber has a smaller
diameter with a nominal value of 9μm, the largest diameters of 50
and 62.5 μm defines multimode fiber types.
b) Reflection and refraction. - The operation of the optical fiber
is based on the principle of total internal reflection. Picture 2
shows this principle when light travels from air to water. When
the light hits the water surface with an angle of incidence less than
the critical angle, it moves in the water, but changes direction at
the boundary between air and water (refraction). When a beam of
light hits the water surface with an angle greater than the critical
angle, the light is reflected at the water surface. Each material is
characterized by a refractive index represented by the symbol n.
This ratio, also called refractive index is the ratio between the
speed of light in vacuum (c) and in a medium specific speed (v).
n = c / v
The refractive index in vacuum (outer space) is 1 (v = c). The
refractive index of air (n1) is 1.003 or slightly above the vacuum
while the index of refraction for water is 1.333. A higher value of
the index of refraction "n" of a material indicates that light travels
slower in this material. Light travels faster in air than in water.

Text: A) Incidence angle B) Critical angle C) Total reflection
Picture 2: Total reflection principle.
The core of an optical fiber has a slightly higher refractive index
than the cladding. The light reaching the boundary between the
core and the cladding at an angle of incidence greater than the
critical angle is reflected and continues to travel within the core.
This total reflection principle is the basis for the operation of the
optical fiber. The critical angle is a function of the refractive
indexes of the two media, in this case the core glass and the
cladding. The refractive index of the core is typically about 1.47
while the refractive index of the coating is approximately 1.45.
Because of this principle, we describe an imaginary cone with an
angle related to the critical angle (see Picture 3). If light enters the
fiber end from the interior of the cone, is subjected to total
reflection and travels through the core. The concept of this cone is
related to the numerical aperture end, the ability to collect light

from the fiber. The light that reaches the fiber end outside this
cone is refracted in the coating when it encounters the core-
cladding boundary, and not inside the nucleus.
Text: Cone refraction index n1= 1,47
Sheathing refraction index n2= 1,45
Picture 3: Numerical Aperture and total reflection: The light entering
the fiber at an angle within the core moves.
c) Signaling. - Local area networks such as Ethernet and
Channel Fiber transmit pulses representing digital
information. Bit - short for binary digit - is the basic unit of
digital information. This unit can only take two values: 0 or 1.
The numerical data are transformed into a digital number.
Other data are encoded as characters in a string of bits. A
status of 'On' or 'Off' electronically represents the value of a
bit. Also, a string of consecutive light pulses representing
digital information that is transmitted via an optical fiber

link. The state "On" represents a bit set to 1 and the state
'Off' represents a bit set to 0. Picture 4 represents a sample
of the digital information as transmitted through an optical
fiber cable.
Text: High status (ON)-Low Status (OFF) Time –Groove time of a bit
Picture 4: Pulse train depicting typical digital data.
The representation of the pulse in Picture 4 is "idealized". In the
real world, pulses have reduced times up and down. Picture 5
describes the main characteristics of a pulse. The rise time
indicates the amount of time needed to change the light to the
"On" usually corresponds to the time required to transition from
10% to 90% of the amplitude. The fall time is the opposite of the
rise time and represents the duration of the light switch 'On' to
'Off'. The rise and fall times are critical parameters, determines
the upper limit of the speed at which the system may generate and
transmit pulses.

Text: wide-width, ascent time-descent time.
Figure 5: Pulse analysis.
When transmitting one billion bits per second or more (data rate
of 1 Gbps or more), because LED light sources can not be used due
to 5 times the rise and fall of LED sources. These systems use
single faster laser light sources. A common source networks in
buildings is the VCSEL (Vertical Cavity Surface Emitting Laser,
Laser emission or vertical cavity surface), which transmits light
wavelength of 850 nm.
d) Requirements for reliable transmission. - The fiber optic
link to transmit a pulse train signal with sufficient fidelity for the
detector in the receiving device can detect each pulse with its true
value 'On' or 'Off'. At least two things are necessary to ensure
reliable reception and transmission, which are:

Channel Insertion Loss: The maximum signal loss or
signal attenuation allowed in the transmission medium
from the transmitter to the receiver device. The term
'channel' defines the transmission medium to finish
between transmitter and receiver. Signal loss is composed
of accumulated losses in the optical fiber cabling and every
connection or splice.
Signal dispersion: light pulses have a tendency to spread
as they travel through the fiber link due to dispersion. The
spread must be limited to prevent pulses arriving together
or overlapping the receiving end. Both parameters, channel
loss and signal dispersion, play a critical role in the
establishment of a reliable and free of transmission errors.
The dispersion cannot be measured in the field. Network
standards define a maximum channel length for the optical
fiber; the maximum length is a function of data rate and
bandwidth-index optical fiber. The bandwidth rate, in turn,
is based on laboratory measurements to characterize the
modal dispersion in multimode optical fibers.
Attenuation: The loss or attenuation has been a well-
established performance parameter in the wiring standards
and network implementation. The signal must reach the

end of the optical fiber link and the input to the detector in
the receiver device, with sufficient power to be correctly
detected and decoded. If the detector does not "see" clearly
the signal transmission, no doubt, has failed.
The attenuation or loss of signal in optical fiber is produced by
several intrinsic and extrinsic factors. Two factors are the
scattering and intrinsic absorption. The most common form of
dispersion, called 'Rayleigh scattering', is caused by microscopic
no uniformities of the optical fiber. These non-uniformities, which
cause light beams partially, disperse when traveling along the
fiber core and therefore, causes some power light lost.
Rayleigh scattering is responsible for about 90% of the loss
inherent in the modern optical fiber. Has bigger influence when
the size of the impurities in the glass is comparable to the light
wavelength. The longest wavelengths, therefore, are less affected
than shorter wavelengths and are subject to less loss.
Extrinsic causes attenuation tension during manufacturing
includes wiring and fiber curvature. We can distinguish two
categories of curvature: micro curvature and macro curvature.
Micro curvature is caused by microscopic imperfections in the
geometry of the fiber resulting from the manufacturing process, as

the asymmetry of rotation, minor changes in the core diameter, or
uneven boundaries between the core and cladding. The
mechanical stress, tension, pressure or torsion of the fiber can
also cause micro curvature. Picture 6 depicts the micro curvature
in fiber and its effect on the light path.
Picture 6: micro curvature in an optical fiber causes some light to
escape from the core, which is added to the signal loss.
The main cause of macro curvature is a small radius of curvature.
The standards describe the bending radius limits as follows: "The
cables with four or fewer fibers destined Cabling Subsystem 1
(horizontal cabling or centralized) admit a bending radius of
25mm (1 inch) when not subjected to load tension. Cables with
four or fewer fibers intended to be laid in ducts during installation
permitted bend radius of 50mm (2 inches) under a tensile load of
220 N (50 lbf). All other optical fiber cables permitted bend radius
of 10 times the cable diameter when not subjected to tensile load
and 20 times the outer diameter when subjected to tension load to
the limit nominal cable ".

Figure 7: A macro curvature or bend with a small radius of curvature
causes light modes of higher order multimode core escape and,
therefore, causes signal loss.
The figure above shows the effect of a bending with a smaller
radius in the path of light in the fiber. Part of the light in the
groups of higher order modes is no longer reflected and guided
within the core. The length of the fiber and the light wavelength
traveling through the fiber primarily determined attenuation
value.
The loss in an installed optical fiber link is composed of the loss in
the fiber plus the lost connections and splices. The losses in
connections and splices comprise the most of losses in shorter
fiber links, typical of the building network applications. A tool for

problem solving in an Optical Time Domain reflectometer (OTDR)
to measure and verify the loss of each connection or splice.
Dispersion: The dispersion describes as scatter light pulses
when travel along the optical fiber. Dispersion limits the
bandwidth of the fiber, thereby reducing the amount of data
that can transmit fiber. Confine the discussion of the
dispersion to modal dispersion in multimode fibers.
The term 'multi-mode' refers to the fact that many modes
simultaneously propagating light beams through the core.
Picture 8 shows how the principle of total internal reflection to
index multimode optical fiber jump. The term 'jump index "refers
to the fact that the refractive index of the core is a step ahead of
the coating index. When light enters the fiber is separated in
different ways, known as modes.

Text: Cone refraction index n1= 1,47
Sheathing refraction index n2= 1,45
Picture 8: The principle of total internal reflection.
One-way travels directly through the center of the fiber, other
modes traveling at different angles and bounce up and down due
to internal reflection. The more bounce modes are called the
"higher order modes." The little bouncing modes are the "lower
order modes." The shortest path is a straight line. All other paths
taken by light (modes) are longer than the straight line - The
steeper the angle, the more rebounds occur and the longer the
journey.
According varies the length of the route and travel time varies to
reach the end of the link. The disparity between the arrival times
of the different rays of light also known as differential mode delay
(Differential Mode Delay, DMD), is the reason for the dispersion or
spreading of a pulse as transmitted along the fiber link.
The scattering effect increases with the length of the optical fiber
link. According pulses travel further increases the difference in
path length and therefore increases the difference in arrival times
and pulse dispersion growing. The effect is that the light pulses
arrive at the end of the fiber link longer mutually overlaps and
that the receiver cannot distinguish between them, and is not able
to decode the state (value). Higher data rates involve sending

short pulses in rapid succession. Dispersion limits the rate at
which pulses may be transmitted. In other words, the dispersion
limits the wiring bandwidth
.
Picture 9: The net effect of the dispersion
Make transmitted pulses traveling together and overlap at the end of the
link (Check the detector). The detector cannot recognize and decode the
state of the individual pulses.
To compensate the inherent dispersion in multimode fiber jump
index could develop the graded index multimode fiber. The
"graded index" refers to the fact that the core refractive index
gradually decreases as it moves away from the center of the core.
The glass in the center of the core has the highest refractive index
that makes the light in the core center to the lower speed travel.
The light travels the shortest path through the fiber travels at a
slower speed. This construction allows the core to all light beams
reaching the receiving end approximately at the same time
reducing the modal dispersion in the fiber. As shown below in
Picture 10, the light in graded index multimode fiber and does not
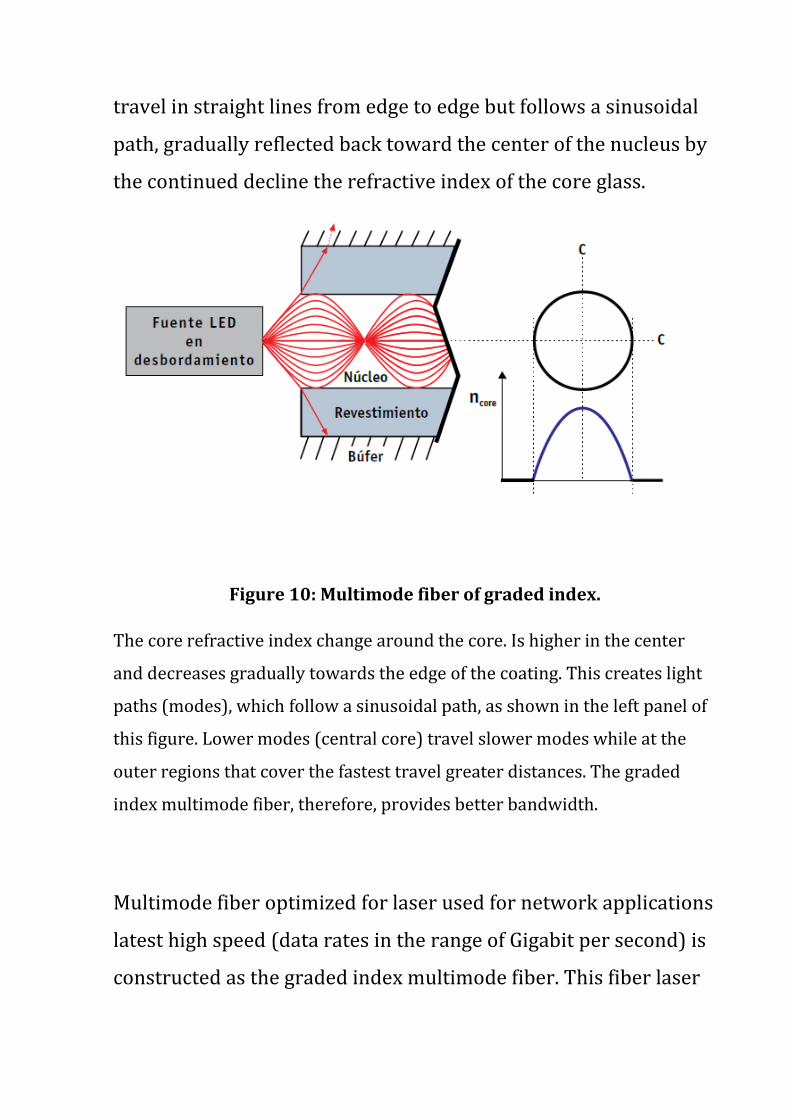
travel in straight lines from edge to edge but follows a sinusoidal
path, gradually reflected back toward the center of the nucleus by
the continued decline the refractive index of the core glass.
Figure 10: Multimode fiber of graded index.
The core refractive index change around the core. Is higher in the center
and decreases gradually towards the edge of the coating. This creates light
paths (modes), which follow a sinusoidal path, as shown in the left panel of
this figure. Lower modes (central core) travel slower modes while at the
outer regions that cover the fastest travel greater distances. The graded
index multimode fiber, therefore, provides better bandwidth.
Multimode fiber optimized for laser used for network applications
latest high speed (data rates in the range of Gigabit per second) is
constructed as the graded index multimode fiber. This fiber laser

optimized multimode also uses the smaller core diameter of 50 μm.
The smaller core diameter also diminishes the effect of the fiber
dispersion in limiting the number of modes. The 'single mode'
fiber, as its name indicates, allows only one mode of propagation
at a wavelength greater than the wavelength of 1 break. The
wavelength of 1,310 nm using most corporate network
applications over single mode fiber (9 μm core diameter) was well
above the cutoff wavelength that is between 1,150 nm and 1,200
nm. Mono mode fibers using longest wavelengths retain the
fidelity of each light pulse over longer distances not accuse modal
dispersion (caused by using various modes). Thus, more
information can be transmitted per unit time over longer
distances (less than the intrinsic loss at longer wavelength). This
gives mono mode fibers increased bandwidth compared to
multimode fiber. Single mode fiber design has also evolved over
time. There are other mechanisms of dispersion and
nonlinearities will not cover as they play a much less important
role in optical fiber applications in building networks. Single-
mode fiber has some disadvantages. The smaller core diameter
hinders the coupling of light in the core. Joints and connectors
tolerances are more demanding mono mode to achieve good
alignment of the small core. In addition, laser light sources longer
wavelength are more expensive than the VCSEL operating at 850
nm.

Bandwidth: A key performance property of fiber is the
bandwidth or information carrying capacity of optical fiber.
In digital terms, bandwidth is expressed in a bit rate at which
signals can be sent over a given distance without interfering
a BIT with one before or after BIT. The bandwidth product is
expressed in MHz • km. The interference is caused by the
dispersion phenomenon discussed earlier.
The bandwidth can be defined and measured in several ways.
The three Standard specifications for bandwidth and
measures applicable are Overflow Bandwidth, Bandwidth
Restricted and Bandwidth, Laser or Effective Modal Bandwidth
(Effective Modal Bandwidth, EMB). The reason for these different
Methods come from the differences in the characteristics of the
light sources used to transmit information.
The traditional light source for a 10 Mbps Ethernet and 100 Mbps
is the LED (Light Emitting Diode, LED), an excellent choice for
applications operating at speeds up to 622 Mbps LEDs produce a
uniform light output completely fills the core of the optical fiber
and uses all its modes. To better predict the bandwidth of
conventional multimode fibers when used with LED light sources,
the industry employs a method called Overfilled Bandwidth

(Bandwidth overfilled, OFL). As mentioned above, LEDs can be
modulated not fast enough to pass the billion or more pulses per
second required for Gbps data rates common light source to
support Gigabit data rates in optical networking applications
buildings is the VCSEL (Vertical Cavity Surface Emitting Laser) at a
wavelength of 850μm. Unlike an LED, the light output of a VCSEL
is not uniform. Change from VCSEL to VCSEL through the end of
the optical fiber. As a result, the lasers do not use all modes in
multimode fiber but rather a restricted set of modes. And it may
be more important that each laser fills a different set of fiber
modes with different power values in each mode.
An optimum method for ensuring the bandwidth in optical fiber
links for implementing Gigabit speeds measurement is DMD
(differential mode delay)

