masterarbeit - othes.univie.ac.atothes.univie.ac.at/34904/1/2014-10-31_0952436.pdf · statistically...
TRANSCRIPT

MASTERARBEIT
Titel der Masterarbeit
„ The Determinants of Capital Structure:
Evidence from Romanian traded firms“
Verfasst von
Marian-Ionel Cutoi
angestrebter akademischer Grad
Master of Science (MSc)
Wien, 2014 Studienkennzahl lt. Studienblatt: A 066 914 Studienrichtung lt. Studienblatt: Masterstudium Internationale Betriebswirtschaft Betreuer / Betreuerin: Univ.-Prof. Ph.D. Gyöngyi Lóránth

2
Abstract
This study analyses the factors that may influence the capital structure decisions of
Romanian traded firms. The sample includes 776 firms, all listed firms on Bucharest
stock exchange in the period from 2003-2012. All debt ratios, short-term, long-term
and total debt, were included in this analysis in order to understand better capital
structure decisions. The factors with possible impact in capital structure included in
this study are the most common in the capital structure literature, namely asset
tangibility, size, profitability, liquidity, interest rate, industry and taxes. The
empirical results for the whole sample show that the most important factors which
influence the capital structure of Romanian traded firms are tangibility, profitability,
liquidity and size. The impact of these factors for all debt ratios is negative, except
for the influence of tangibility in long-term debt which is positive. The impact of
interest rate and tax is not statistically significant for all debt ratios. Industry type is
statistically significant for long-term debt ratio with a negative influence. The second
regression analysis including large firms indicates that industry type, interest rate,
tangibility, profitability and liquidity have a negative influence on debt ratios while
size and tax impact positively on the leverage.
3
Table of content
Abstract………………………………………………………………………………2
1. Introduction ………………………………………………………………………..7
2. Literature Review and Theoretical Framework …………………………………...9
2.1 Modigliani-Miller Theory ………………………………………………..9
2.2 The Trade-off Theory …………………………………………………...10
2.3 The Pecking Order Theory ……………………………………………...10
2.4 The Agency Costs Theory ………………………………………………11
2.5 The Signalling Theory ………………………………………………….12
2.6 Market timing theory …………………………………………………...13
3. Determinants of Leverage ………………………………………………………..15
3.1 Size ……………………………………………………………………...15
3.2 Asset Tangibility ………………………………………………………..16
3.3 Liquidity ………………………………………………………………...17
3.4 Profitability ……………………………………………………………..17
3.5 Interest rate ……………………………………………………………. 18
3.6 Industry …………………………………………………………………19
3.7 Taxes ……………………………………………………………………21
4. Methodology, data and variables definition ……………………………………..23
4.1 Methodology ……………………………………………………………23
4.2 Data ……………………………………………………………………..24
4.3 Variables definition …………………………………………………….24
4.3.1 Dependent variable …………………………………………...24
4.3.2 Independent variables ………………………………………...24
5. Empirical findings ……………………………………………………………….27
5.1 Descriptive statistic …………………………………………………….27
5.2 Correlations …………………………………………………………….31
5.3 Regression analyses …………………………………………………….35
6. Conclusions ……………………………………………………………………...40
Bibliography ……………………………………………………………………….42
4
Appendix …………………………………………………………………………...45
List of figures
Figure1 Romanian traded firms by industry structure ……………………...21
Figure2. Debt ratios and interest rate evolution 2003-2012 ……………….28
Figure3. Firm size …………………………………………………………..30

5
List of tables
Table1. Dependent variable mode of calculation …………………………...24
Table2. Independent variable mode of calculation ………………………...26
Table3. Expected signs of the relationship between variables according to
trade-off and pecking-order theories …………………………………….… 26
Table4. Descriptive statistics for the whole sample ………………………27
Table5. Debt ratios by firm size ……………………………………………30
Table6. Correlation between dependent and independent variables
for the whole sample …………………………………………………..……31
Table7. Correlation between variable for the large enterprises …………….33
Table8. Correlation between variable for SME …………………………….34
Table9. Regression results for whole sample ……………………………….35
Table10. Regression results for SME and large enterprises ………………..37
Table11. The expected signs for the variable and the results obtained
in the analysis………………………………………………………….….…39
6
List of abbreviations
SIC- standard industrial classification
IR- interest rate
TANG- asset tangibility
PROF- profitability
LIQ- liquidity
TAX- taxes
SIZE- firm size
SHORTD- short-term debt ratio
LONGD-long-term debt ratio
TOTALD- total debt ratio
SME- small and medium size enterprises
7
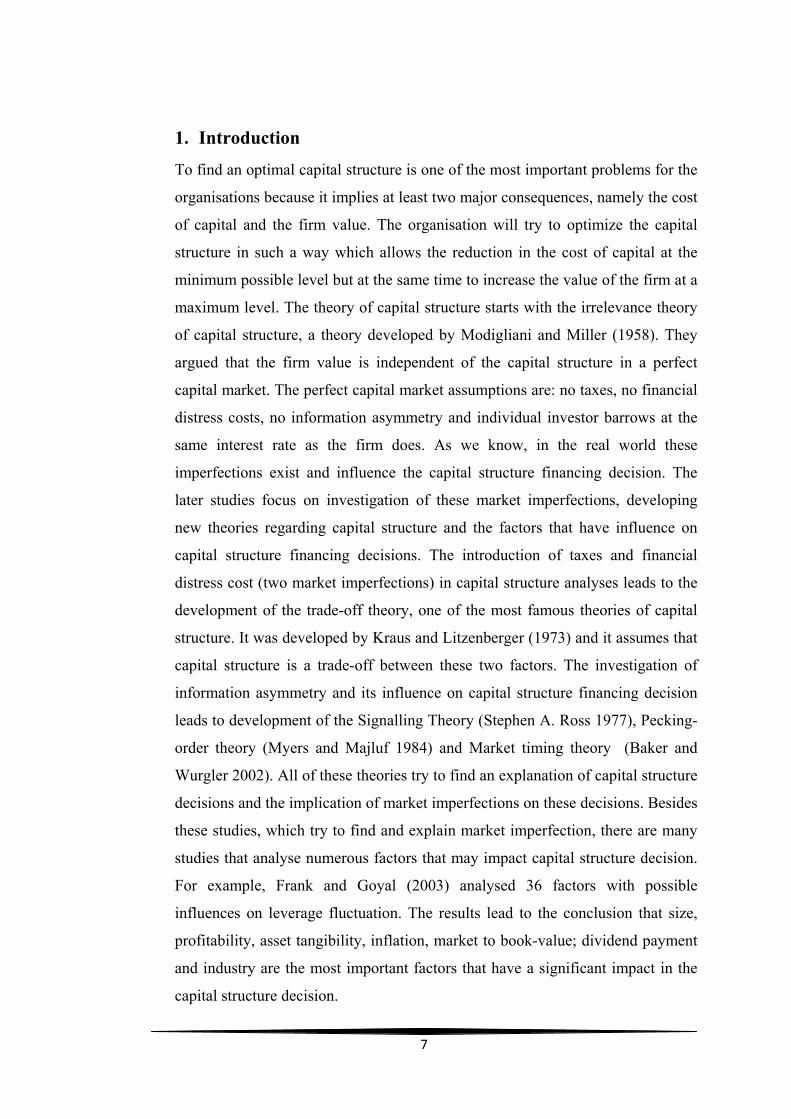
1. Introduction
To find an optimal capital structure is one of the most important problems for the
organisations because it implies at least two major consequences, namely the cost
of capital and the firm value. The organisation will try to optimize the capital
structure in such a way which allows the reduction in the cost of capital at the
minimum possible level but at the same time to increase the value of the firm at a
maximum level. The theory of capital structure starts with the irrelevance theory
of capital structure, a theory developed by Modigliani and Miller (1958). They
argued that the firm value is independent of the capital structure in a perfect
capital market. The perfect capital market assumptions are: no taxes, no financial
distress costs, no information asymmetry and individual investor barrows at the
same interest rate as the firm does. As we know, in the real world these
imperfections exist and influence the capital structure financing decision. The
later studies focus on investigation of these market imperfections, developing
new theories regarding capital structure and the factors that have influence on
capital structure financing decisions. The introduction of taxes and financial
distress cost (two market imperfections) in capital structure analyses leads to the
development of the trade-off theory, one of the most famous theories of capital
structure. It was developed by Kraus and Litzenberger (1973) and it assumes that
capital structure is a trade-off between these two factors. The investigation of
information asymmetry and its influence on capital structure financing decision
leads to development of the Signalling Theory (Stephen A. Ross 1977), Pecking-
order theory (Myers and Majluf 1984) and Market timing theory (Baker and
Wurgler 2002). All of these theories try to find an explanation of capital structure
decisions and the implication of market imperfections on these decisions. Besides
these studies, which try to find and explain market imperfection, there are many
studies that analyse numerous factors that may impact capital structure decision.
For example, Frank and Goyal (2003) analysed 36 factors with possible
influences on leverage fluctuation. The results lead to the conclusion that size,
profitability, asset tangibility, inflation, market to book-value; dividend payment
and industry are the most important factors that have a significant impact in the
capital structure decision.
8
In this study I try to analyse the capital structure of Romanian traded firms and
the factors that may have an influence on capital structure decisions. This
analysis includes a large sample, 776 firms listed on the Bucharest stock
exchange for the period between 2003-3012. The factors with possible impact on
the capital structure of Romanian listed firms analysed in this study are the most
common factors mentioned in the capital structure literature: asset tangibility,
size, profitability, liquidity, industry, interest rate and taxes. It will be interesting
to observe how the results for Romanian traded firms look in comparison to the
other results and to the assumptions made by the most important theories of
capital structure mentioned above since Romania is a developing country with a
relatively young market where quite a few changes have been made in the last
two decades. The Bucharest stock exchange has a long and tumultuous history. It
was opened officially in 1882, but for five decades during communism was
closed (1941-1995). The stock market was reopened in 1995 when the first firms
owned by the government were privatised. After ten years, in 2005, Bucharest
stock exchange and electronic stock market RASDAQUE merged, increasing the
number of the traded companies by 700. The Bucharest stock exchange market is
not developed at its real potential, being one of the weakest markets in the EU
markets with a market capitalisation of 25 billion €. The larger firms owned by
the government are not traded. Some of them were listed in 2013 and 2014,
increasing the capitalization at 28 billion.
9
2. Literature Review and Theoretical Framework
In this chapter I present the basic theories of capital structure starting with the
famous irrelevance theory developed by Modigliani and Miller (1958). It continues
with the later developed theory regarding the capital structure decision and its
determinants. These theories are trade-off, pecking-order, agency cost, signalling and
market timing.
2.1. Modigliani and Miller Theory
Franco Modigliani and Merton Miller developed in 1958 two theorems that
have become the most famous and practically the basis for the modern theory
regarding capital structure and return on common stock. According to Proposition 1,
the structure of capital does not influence the market value of the firm. The value of
the firms is the result of the capitalised returns generated by the real assets owned by
the firm and no combination in the capital structure (Debt/Equity) can increase or
decrease the value of the firm. Proposition 1 can be extended to all aspects regarding
firm´s financial policy, e.g. investments, dividend policy, buyback policy, short
versus long debt financing. Proposition 2 is derived from Proposition 1 and states
that future return on stock are not influenced by the structure of capital. The return
on stock for a leveraged firm is equal to the return on the stock of an unleveraged
firm, plus an additional premium for financial risk. The share market price being
given by its capitalised future returns and is not influenced by the way a firm
finances its operation. The weighted average cost of capital (WACC) developed by
Modigliani and Miller states that the expected returns increase with the debt-equity
ratio, but is offset by the increase in financial risk premium.
The propositions developed by Modigliani & Miller assume that financial
markets are perfect. A perfect market means that there are no taxes, no financial
distress costs, no information asymmetry and individual investor barrows are at the
same interest rate as the firm. This means that the propositions they formulated
cannot be applied in the real world because in the real world there are the
organisation faces transaction costs, bankruptcy costs, taxes and information
asymmetry. The MM´s propositions tell us when the capital structure may count,
especially in the presence of the market imperfections (bankruptcy costs, taxes,
information asymmetry).
10
2.2 Trade-off Theory
The classical MM´s theory of capital structure irrelevance supposes a perfect
financial market without transaction costs, bankruptcy costs, information asymmetry
and agency cost, but in the real world the market is imperfect and firms try to find an
optimal capital structure that maximise firm value. The Trade-off Theory was
developed by Kraus and Litzenberger (1973) when they introduced the taxations on
corporate profits and bankruptcy costs on a valuation model. They stated that capital
structure of the firm is a trade-off between tax advantages of debt and cost of
financial distress. Using debts instead of equity financing has its advantages because
of debt´s tax advantages but if the cost of bankruptcy exceeds the tax benefits of debt
than the firm should use equity. The literature regarding this theory is vast and the
results are sometimes different or even contradictory. Miller (1977) argues that the
optimal capital structure depends on the investor type since the tax rate is different
among investors. A firm who has more institutional investor (e.g. pension funds)
with low or free tax rate may use equity instead of debt because the tax advantages of
debt are reduced. Using equity the firm will have a low debt ratio and a lower
financial distress risk. DeAngelo and Masulis (1980) found that leverage ratio varied
across firms and industries and that the leverage increases, with an increase in
corporate tax rates and decrease in corporate bankruptcy costs. Titman and Wessels
(1988), Rajan and Zingales (1995) findings show that firms with high profitability
and those with high cash flow should use more debt because the tax advantage of
debt is higher (profitable firm can borrow at a lower interest rate) and the cost of
bankruptcy is lower. The Trade-off theory assumes that the corporation has a target
leverage ratio. The survey made by Graham and Harvey (2001) brings evidence that
firms take into account a target ratio when the financing decisions are discussed. To
always be at the target firms must adjust the ratio issuing/buying back equity and
debts. This is not always possible since it implies transaction cost. The firm will
adjust the leverage ratio when the transaction costs are low and will let the ration
float when transaction costs are high.
2.3. Pecking Order Theory
The Pecking Order Theory of capital structure describes a hierarchical preference of
financing sources when the firm takes financing decisions. The financing sources

11
preference was analysed by Myers and Majluf (1984) under the assumption that
managers of the firms have more information than investors. Thus, information
asymmetry and transaction costs are the factors which influence the financing
decision. According to this theory, internal fund is preferred over external funds,
making cheaper and avoiding transaction costs. Another assumption of Pecking
Order is that the firm does not have a target leverage ratio assumed in the trade-off
model. If the management decides to go into a new investment, it should use first
retained earnings in order to avoid dividend payment that can reduce the internal
available financial resources. If the firm decides to use external financial resources, it
should first use safety debt, then risky debt and the last option is issuing equity.
Issuing equity is perceived by the market as a negative signal, considering that the
stock market price is over appreciated and will be followed by a price fall. Fama and
French (2002) stated that if the firm follows the Pecking Order model, the variation
on leverage will not be influenced by the cost and benefits of debt as it is in a trade-
off model, but by the firm net cash flow. According to Sunder and Myers (1999), the
Pecking Order model explains much more the changes in leverage ratio over time
than a trade-off model with its assumption of a target leverage ratio. Moreover they
found that the Trade-off model can be applied when the firm follows the Pecking
Order model in financing decisions and not the other way around.
2.4 Agency Costs Theory
The Agency Cost Theory was developed by Jensen and Meckling (1976) in an
attempt to identify the effects that arise from the ownership and control separation
and their influence on the capital structure fluctuation. Separation of ownership and
management control usually suppose a contractual agreement between the Principal,
represented by the shareholders, and the Agent, represented by Managers. The major
problem in the relationship between the Agent and the Principal is represented by the
interest of both parties. The Agent tries to maximise its interest represented by
growth opportunities investing in new risky projects and will act against the interest
of the Principal represented by pay-out cash. The Agent does not always act in the
interest of the Principal. If the Principal wants to limit the Agent´s actions
(something that can dissipate its interest), then he must commit some expenses which
are defined as Agency Costs. According to Jensen and Mackling (1976) the Agency
12
Costs are represented by costs of monitoring, bonding costs and residual loss. In an
attempt to reduce the conflict between owner and manager, the Principal can impose
to the Agent objectives and behavioural limits and by monitoring his action with
involved costs, he can limit the mismanagement. Bonding costs are represented by
the payments as compensation made to the Agent in exchange of guarantees that he
will not go into projects that can affect the Principal´s interests. Residual Loss
represents losses supported by the Principal which are generated by the divergence
between Agent and Principal.
Jensen’s (1986) findings show that free cash-flow and growth opportunities are two
factors that influence the level of Agency costs. The Principal will prefer that the
excess cash is paid out in the form of dividends or at least invested in positive net
present value investments. If the cash is used to pay dividends to shareholders it will
reduces the amount of money that is at the manager´s disposal, which can be invested
in risky or negative net present value projects. The Agent will prefer to invest the
surplus of cash in new investments even if these are negative present value projects.
The Agent takes such risks because he wants to accomplish his own interest, the
growth of his wealth. Another method to reduce the manager aversion of investing in
risky projects recognised by Jensen (1986) is the use of debt. In this case the excess
cash will be used to pay back debts and afferent interests. The use of debt
nevertheless can lead to other costs that can affect the financial stability of the firm.
A high debt level can generate financial distress costs. Even if the debts are preferred
to reduce the management investments intentions, the firms should be careful and
keep an optimal level of the capital structure.
2.5 Signalling Theory
The Signalling Theory starts with the assumption that the firm´s manager owns
superior information than outside investors. According to this theory, managers will
use financial policy instruments to convey information to the market about the actual
financial situation or future earnings in order to reduce the information asymmetry
between management and investors. The Signalling Theory begins with the study
made by Stephen A. Ross (1977) in which he analyses the use of debt as a signalling
instrument to show if the firm is a bad or good. The results of the study state, firstly,
13
that managers of a good firm will choose to use a minimum possible debt ratio to
convey information to the market that their firm is a good one. Secondly, the
managers will want to increase debt level in order to convince the investors about the
future cash-flow and profitability, confirming that the future expected earnings will
be able to cover the actual increase in debt level. Bhattacharya (1979) using an
asymmetric information model stated that firms use dividends as a signal for the
present and future expected earnings. According to Bhattacharya (1979) outside
investors do not have information about the performance of the productive assets
owned by the firms. Firms will use a costly dividend to transfer the information
about the firm´s performance to the investors. In the survey made by Graham,
Harvey, Michaely and Brav (2005) they find that managers avoid to cut the dividend
level. Investors perceived the reduction in dividend payments as a negative signal
about the future performance of the firm. The findings sustain that managers try to
keep a constant dividend and that any dividend increase transmit information about
the expected future financial performance of the firm. An interesting result of the
study is the use of the repurchase program that became more popular in the last
decades. Both dividends and share repurchase are perceived as positive signals by the
investors generating an increase in stock market price. But according to the
manager’s answer, they prefer repurchase programs over dividends because it is
more flexible. Once the firm starts to pay dividends it should keep at least a constant
dividend otherwise the market will perceive it as a negative signal regarding the
firm´s future performance which results in a decrease in stock market price. While
the dividends must be at least constant, repurchase program reduction are not
perceived that bad by the market. Dividends and share repurchase may convey
different information to the market, for example dividend payments are made from a
permanent increase in cash-flow, future performance while share repurchase can be
done from temporary excess cash. Firms nevertheless should use one of these payout
instruments in order to keep the confidence of investors high.
2.6 Market Timing Theory
The Market Timing theory is one of the recent theories regarding capital structure
and it presupposes that a firm will issue equity when it is over appreciated and
repurchase when the equity is under evaluated, Baker and Wurgler (2002). There are

14
two main explanations behind the timing between stock market prices and equity
issue, the first one is argued by information asymmetry (Korajczyk, Lucas and
McDonald, 1990) and the other one is sustained by the cost of equity (Baker and
Wurgler, 2002). Information asymmetry argued by Korajczyk, Lucas and McDonald
(1990) refers to superior information owned by managers and explains the equity
issue as a transfer of valuable information to the investors. Managers of the firm
know the real value of the shares, namely the book value, and when the market price
exceeds this value they use equity issuance to reveal the real value of the shares to
the market. Baker and Wurgler (2002) argued that the cost of equity is one of the
reasons behind equity issuance stating that the firm will issue equity when it faces a
low cost level and repurchase when the costs are high, exploiting the advantages
given by the equity cost fluctuations. Graham and Harvey (2001) find in their survey
that a high majority of managers consider the over evaluated or under evaluated
stock price as a very important factor when they decide to issue equity or repurchase,
recognising the market timing.

15
3. Determinants of capital structure
Capital structure and financing mode choice are essential factors for the firm because
it can influence the firm value, increasing the market value, or in a negative
perspective, it can lead the firm into bankruptcy. In the capital structure literature
there are many empirical studies that analyse factors that can influence the leverage
but in many cases the results contradict each other. Harris and Raviv (1991) analysed
the available literature concerning the capital structure and in regards to the factors
that influence the leverage they found that in general, the literature agrees about the
positive relation between leverage and asset tangibility, growth opportunity, firm
size, and non-debt tax shield. These results contradict Titman and Wessels (1988)
who found a negative correlation between leverage and size, non-debt tax shield, and
growth opportunities. Frank and Goyal (2003) made an analysis in which they took
in 36 factors with possible influences on leverage fluctuation. The results show that
seven factors have an important impact on leverage variations over time. These
factors are the most common leverage factors met in the literature namely size,
profitability, asset tangibility, inflation, market to book value, dividend payment, and
industry. Most of the studies focus on developed countries and even in this case the
results are quite different. It will be interesting to find how the results founded in
developed countries will match to a market, namely Romania. In this study I will
analyse the influence of size, asset tangibility, liquidity, profitability, interest rate,
industry type and taxes on the leverage fluctuation of the Romanian traded firms.
3.1 Size
The size of the firm is an important factor when the firm decides to use debt in order
to finance a new investment. It will be much easier for a large firm to access funds
from a financial institution and under better conditions compared to a small firm
(Rajan and Zingales 1995). Marsh (1982) found that the larger firms prefer long-term
debt while the smaller firms prefer short-term debt, argued by the information
asymmetry which is more present in the case of smaller firms, raising the problem on
accessing long-term debt. According to Titman and Wessels (1988), a large firm has
a low probability to go into bankruptcy than a smaller firm because it is more
diversified. This leads to a higher credit rating for the larger firms, evidently

16
implying a lower interest rate for the funds they raise. Fama and French (2002) state
that between size and leverage there is a positive relation. This means that the
leverage increases with the size of the firm. They argued that a larger firm has a
stable and predictable net cash flow and earnings volatility, giving it some
advantages when the firm needs to borrow money. Not all agree however with the
positive relation between size and leverage. Kester (1986), Khaplinsky and Niehaus
(1990) found a negative relationship between size and leverage. Titman and Wessels
(1988) state that between firm size and short-term debt is a negative relationship.
3.2 Asset Tangibility
The structure of the firm´s asset is a determinant factor for the firm for at least two
main reasons. First of all, according to the capital structure irrelevance theory stated
by Modigliani and Miller (1958), the productive assets and the cash-flow they
generate give the real value of the firm and not the structure or the way the firm
finances its activity. Second of all the structures of assets, especially the fixed assets,
have a real impact on capital structure. If the firm owns a high proportion of tangible
assets, this can increase the level of leverage because it can use these assets as
guarantees to borrow from financial institutions. It is known that financial
institutions accept in a high proportion only tangible asset as guarantees. The reason
for this is that creditors want a low risk for the amount of money they borrow and
tangible assets are the best way to get back the money in case the firm goes into
bankruptcy. If the value of the asset used as warrant equals the value of the money
borrowed the creditors will recover their investment because the market price of the
fixed assets remains unaffected by the financial situation of the firm. In conclusion, it
can be stated that asset tangibility and the leverage of the firm should be positively
correlated. The empirical evidence brought support for this statement. Titman and
Wessels (1988), Marsh (1982), Long and Malitz (1985) and Rajan and Zingales
(1995) find a positive relationship between asset tangibility and leverage. Booth et al.
(2001) also find an interesting relationship between tangible assets and leverage. The
findings show a positive correlation between asset tangibility and long-term debt, but
a negative relation between leverage and short-term debt. An increase in the asset
tangibility of the firm will lead to an increase in long-term debt ratio but to a

17
decrease in short-term and total debt ratio. The reason this happens is because the
short-term debt is replaced by long-term debt with the increase in asset tangibility.
3.3 Liquidity
Liquidity refers to all amounts of money owned by the firm and to the assets that can
be easily converted into cash in a short period of time. If the firm owns a high level
of liquidity than the probability to access external funds in order to finance its
investments will be very low. When we analyse financing order preference described
by Myers and Majluf (1984), it can be concluded that the firm will use first internal
funds to finance new investments or other projects before it accesses external
financing resources. According to this theory, the relationship between liquidity and
leverage should be negative. Chaplinsky and Niehaus (1990), Deesomsak, Paudyal
and Pescetto, (2004) found that the leverage decreases with the increase in internal
funds, the firms following pecking order of financing decision preference, the
liquidity owned by the firm being preferred before the external financing. The reason
one would use internal resources is justifiable; the firm will face no transaction costs
and having a low debt ratio level it will be kept out of future distress costs and their
impact on firm value. The owners (shareholders) of the firm may disagree to raise
debt since they are the last ones who are paid if the firm goes into bankruptcy.
Another reason to first use internal resources to access external financing can be
argued by information asymmetry which states that managers prefer to keep the
information inside the organisation. Once the external funds are accessed, they must
transfer information to the financial institution.
3.4 Profitability
Profitability of the firm brings into conflict the most important two theories of capital
structure, trade-off and pecking order theories. According to Myers (1984) when the
firm follows a trade-off model, adjusting its leverage to a target level, the risky firms
should use a low leverage ratio. The debt capacity of the firm increases with its
profitability suggesting a positive relation between profitability and leverage. A
higher profitability leads to a low risk on the debt holder side, lower cost and easier
18
access to financial markets for the debt issuers. Following this rationality means that
the firm with higher profitability should use more debts to finance new investments.
The Pecking order theory sustains that the firm follows an order preference when it
goes into new investments: retaining earnings are used first and just as a second
option safety debt is used, followed by risky debts and finally new equity issuance
(Myers and Majluf 1984). The most important reason behind this order preference is
that using internal funds to finance its investments the firm avoids any costs induced
by accessing debt and eliminates eventual bankruptcy cost. This theory leads to the
conclusion that the more profitable is a firm, the lower level of leverage should be
used, suggesting a negative relationship between profitability and leverage of the
firm. The evidence brought by the empirical studies show more support for the
pecking order theory. The results of Titman and Wessels (1988), Kim and Sorensen
(1986), Kester (1986) and Booth et al. (2001) confirm a negative relationship
between firm profitability and leverage. Long and Malitz (1985) find that
profitability is significantly positively correlated with the leverage of the firm
sustaining the firms used a trade-off model.
3.5 Interest rate
The interest rate is the major factor that establishes the total costs of the debt raised
by the firm. It is a deductible expense for the firm. In this case it is expected that the
firm will raise debt in order to finance its projects especially when the internal
financing is not possible. This being said, it cannot use debt without limit because it
will increase the financial distress cost. Being the most important component in the
cost of borrowed capital, a high interest rate level can increase the cost of capital for
the firm affecting its market value. Interest rate level is influenced by more factors.
The size of the company can influence the rate at which it borrows. Rajan and
Zingales (1995) state that for the larger firms it is easier to access financial markets
and in advantageous condition (lower interest rate) than for a smaller firm. Titman
and Wessels (1988) bring show that there is a lower financial distress risk for the
large firms because they are more diversified, leading to a high credit rating for the
debt issues which is associated with lower interest rate in comparison to smaller
firms. Asset tangibility is another factor that can influence the interest rate at which

19
the firm can borrow. Tangible assets owned by the organisation can be used as
collateral. If the firm owns a high proportion of tangible assets it can negotiate an
improved interest rate because the risk assumed by the creditor is reduced. Assuming
that a high interest rate increases the cost of borrowed capital, it should be expected
that interest rate will have a negative impact on leverage. A high interest rate will
force the firm to borrow less money and that will be made for a short period of time
while a low interest rate will have a positive influence on the amount of debt raises
by the firm, encouraging the long-term debt contracts.
3.6 Industry type
Industry can be one of the factors that influence the capital structure of the firm. It
was mentioned above that some factors as asset tangibility, profitability, liquidity and
size (risk dilution caused by activity diversification), have an impact on a firm´s
leverage. All these factors can be analysed from the organisation and the creditors’
perspective. From the organisation side, it is very important in which industry the
firm activates. Asset tangibility, liquidity and profitability differ across the industries.
Revenues of the firm who activate in Agriculture are characterised by seasonality
and are exposed to higher natural risks, services firms are characterised by low asset
level, oil & gas and technological industries have a high profitability, construction
and engineering have a high return on asset compare to other industries,
pharmaceutical and retail industries have a high liquidity. All these industry
characteristics have an impact on the leverage ratio which is very different across the
industries. Industries with high profitability and liquidity like oil and gas,
technological industry, mining industry and pharmaceutical have a low leverage
ratio, while utilities, transportation and manufacturing industries have a high debt
ratio. In the case of public utilities firms the reason behind the high leverage can be
the guarantee that is assumed by the government. Bradley et al. (1984), found a high
leverage for utilities and transport firms; Kester (1986) and Long and Malitz (1985),
found a low leverage ratio for the pharmaceutical and technological firms; Bradley et
al. (1984) found a low leverage for the firms who activate in pharmaceutical, mining,
technology and food industries. From the creditors’ side, according to Moodys, the
credit rating they give for the firms is influenced by the industry and its
characteristics (asset tangibility, liquidity, profitability) where the firm activates.

20
Pharmaceutical, technology and oil industry firms have a high credit rating. A high
credit rating assumes an easier access to financial markets and a lower interest rate
for the firm. The interest rate represents the cost of capital raised by the firm in order
to finance its project in the absence of internal financing and influence the value of
the firm and the structure of the capital. The creditors avoid financing the firms’ whit
a low credit rating or who activate in industries with high potential risks. In the
analysed country, Romania, it is very difficult for a firm that activates in agriculture
to raise debt while for a firm that activates in the oil industry, like Petrom, it is not
difficult to raise a 500€ million from 9 financial institutions. Two important reasons
can be observed in regards to the influence which industry can have on capital
structure. Firstly, credit ratings have a direct impact on the cost of capital and a
firm´s value differs across the industries being influenced by the industry
characteristics in which the firm activates. Secondly, the leverage ratios fluctuate
across the industries, argued by the differences that exist between the industries
regarding asset size, profitability, liquidity and business risks. Concluding, industry
type can be a determinant factor for the organisation on accessing external financial
resources with a direct impact on capital structure. The firms with a facile access to
external financial resources will tend to have a high leverage ratio while the firm
with difficulties in accessing external resources will have a low leverage ratio. This
situation can be observed in the case of Romanian traded firms, especially for the
firms who activate in agriculture who face a serious problem in raising external
financing. The group of the firms which activate in agriculture are around 130 and
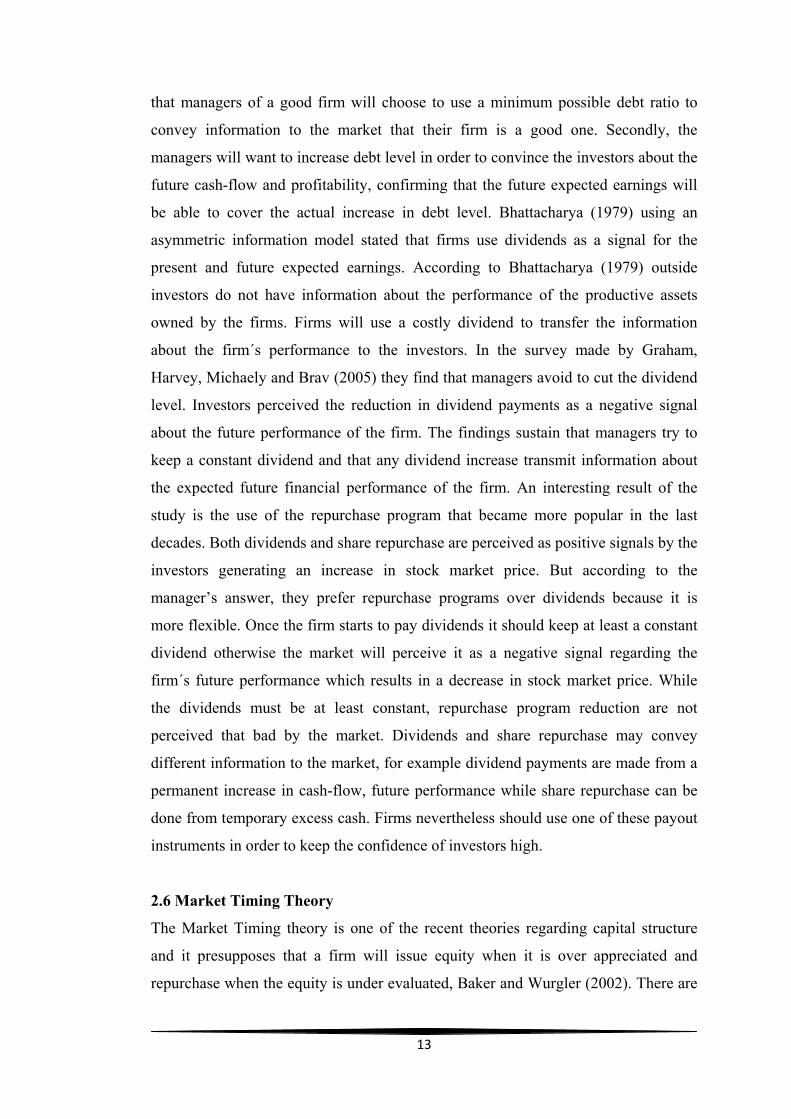
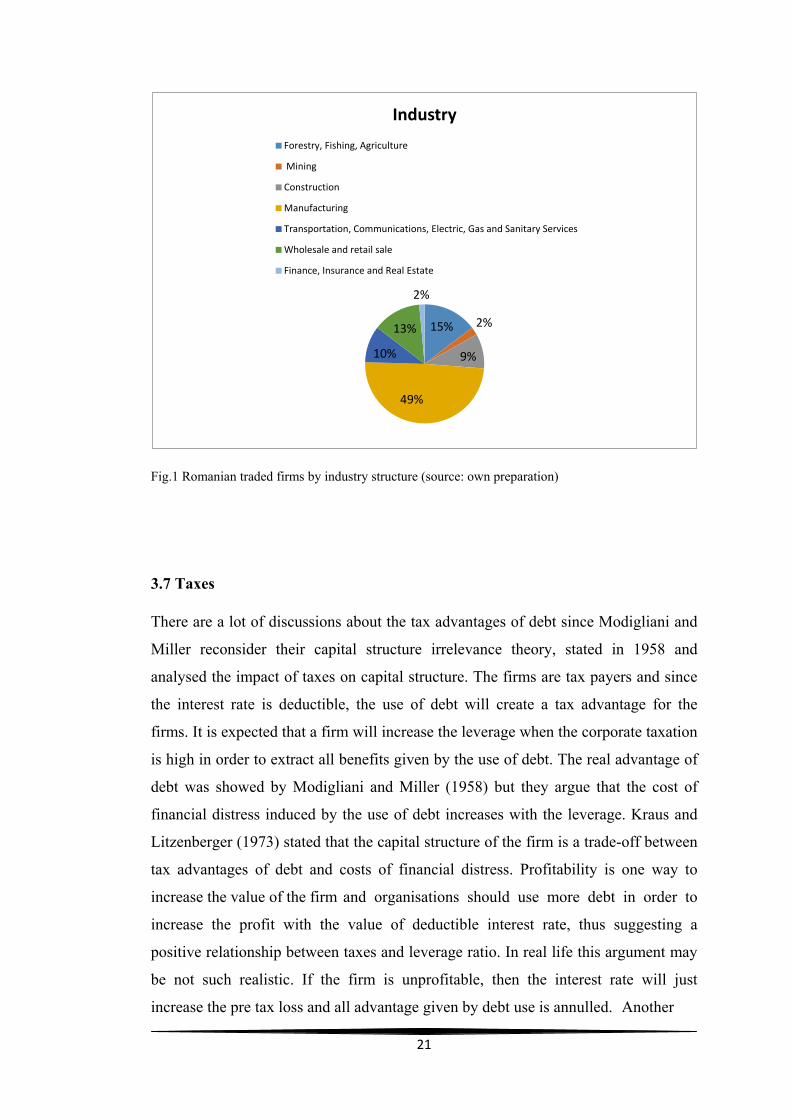
represent 15% of the sample. Industry structure for the Romanian traded firms can
be observed in Figure 1. A very large proportion in the sample is represented by
manufacturing firms (49%) followed by agricultural industry (15%). Taking into
consideration their proportion of the analysed sample and the difficulty in accessing
external financing for the agricultural firms, it is expected that this industry sector
may have a significant impact on the regression analysis, having a negative influence
on leverage. These assumptions suppose a negative correlation between industry type
and leverage for the Romanian traded firms.
21
Fig.1 Romanian traded firms by industry structure (source: own preparation)
3.7 Taxes
There are a lot of discussions about the tax advantages of debt since Modigliani and
Miller reconsider their capital structure irrelevance theory, stated in 1958 and
analysed the impact of taxes on capital structure. The firms are tax payers and since
the interest rate is deductible, the use of debt will create a tax advantage for the
firms. It is expected that a firm will increase the leverage when the corporate taxation
is high in order to extract all benefits given by the use of debt. The real advantage of
debt was showed by Modigliani and Miller (1958) but they argue that the cost of
financial distress induced by the use of debt increases with the leverage. Kraus and
Litzenberger (1973) stated that the capital structure of the firm is a trade-off between
tax advantages of debt and costs of financial distress. Profitability is one way to
increase the value of the firm and organisations should use more debt in order to
increase the profit with the value of deductible interest rate, thus suggesting a
positive relationship between taxes and leverage ratio. In real life this argument may
be not such realistic. If the firm is unprofitable, then the interest rate will just
increase the pre tax loss and all advantage given by debt use is annulled. Another
15% 2%
9%
49%
10%
13%
2%
Industry
Forestry, Fishing, Agriculture
Mining
Construction
Manufacturing
Transportation, Communications, Electric, Gas and Sanitary Services
Wholesale and retail sale
Finance, Insurance and Real Estate
22
issue is that a profitable firm, according to the pecking order theory, tends to use
more internal financing instead of external funds, meaning that between taxes and
leverage ratio there could be a negative relationship. The empirical results regarding
the relation between tax and leverage are different. Some empirical studies like
Bradley et al. (1984) and Chaplinsky and Niehaus (1990) found a positive correlation
between tax and leverage. Kim and Sorensen (1986) found that leverage and tax are
negative correlated.

23
4. Methodology, data and variables definition
In this section of the thesis I describe the methodology used, the sources of data, the
sample, the period analysed and I define the variables chosen for this study. The
methodology and the variables chosen are the most common mentioned and used in
literature regarding the capital structure determination.
4.1 Methodology
Most of the firms are leveraged during the business life at some degree because of
various reasons. Some firms are using debt in order to finance its current operation,
other use debt in order to benefit from the debt tax advantages over the internal
financing. One thing is clear; the leverage fluctuates over time being influenced by
various factors. In this study I looked at the most common factors used in the
literature, namely leverage as dependent variable and size, tangibility, profitability,
liquidity, industry type, interest rate and taxes as independent variables. This means
that the variation of dependent variable leverage is a result of the influence caused by
the independent variables mentioned above. The independent variables influence the
capital structure of the firm, leading to a situation where the firm must decide some
degree of leverage, considered as optimal and a result of the mix between the
independent variable it gives the lowest cost for the firm and maximises the firm’s
value. It will be interesting to find which of the independent factors mentioned above
fit the Romanian traded firms, taking into consideration that Romania is a developing
country with a relatively young open economy and trading market. The technique for
which I use in order to find the correlation between dependent and independent
variables is linear regression, a widely used technique regarding the estimation of
capital structure. The linear regression was used with the help of Data analyses and
Statistical Software provided by StataCorp LP.
The equation regression used in order to find the relationship between dependent and
independent variables is:
Debt Ratio it = α i + β1 Industry + β2 Interest rate + β3 Tangibility + β4 Profitability +
Β5 Liquidity + β6 Tax + β7 Size + ε it
24
Where Debt Ratio represents the leverage ratio for the firm “i”, (i= 1-776) and period
“t”, (t= 2003-2012). βx represent the coefficients for each independent variable. = αi
and ε it represent the unknown intercept, that is the error term. The regression
equation will be calculated separate for each dependent variable, namely total debt
ratio, short-term debt ratio and long-term debt ratio.
4.2 Data
For this study I chose to focus on the selection of the firms on Romanian listed firms
because there is a lack of studies regarding the capital structure choices and the
factors which may have an influence on firm´s financing decisions. There are only a
few studies which enhance a small number of firms from a single industry. The
sample includes all Romanians firms listed on the Bucharest Stock Exchange. I
analysed in the study the financial data for 776 firms, the financial firms being
excluded because of their different capital structure and financing behaviours. The
financial information includes the main financial indicators reported yearly and was
provided by ORBIS and BVB. The period which made the object of the study refers
to the time period between 2003 and 2012.
4.3 Variables definition
The purpose of the study is to find which factors have an impact on capital structure
and financing decision of Romanian firms. In order to receive an adequate answer to
this question, the most mentioned factors in financial literature and presented in
Chapter 3 were included in the analyse. The leverage ratio of the firm was taken as
dependent variable, while size, asset tangibility, liquidity, profitability, interest rate,
industry type and taxes as independent variables.
4.3.1 Dependent variables
The dependent variable which made the object of this study is Leverage ratio
calculated separated for all debt ratios and presented in the form of the following
three variables: total debt ratio, long-term debt ratio and short-term debt ratio. The

25
reason to analyse all debt ratio is argued by the impact of the independent variables
on each debt ratio, which can be different for total debt, long-term debt and short-
debt ratio, as was found in many studies. For example Booth et al. (2001) found a
different influence of asset tangibility on short-term debt ratio and long-term debt
ratio, being positively correlated with long-term ratio and negatively correlated with
short-term debt ratio.
The leverage ratios (total debt ratio, long-term debt ratio and short-term debt ratio)
are calculated as ratios of total liabilities, long-term liabilities and short-term
liabilities to total assets. The dependent variables and the mode of calculation are
presented in Table1.
Dependent Variable Mode of calculation
Total debt ratio total liabilities/ total asset
Short-term debt ratio short-term liabilities/total asset
Long-term debt ratio long-term liabilities/total asset Table1. Dependent variable mode of calculation
4.3.2 Independent variables
In order to run the regression analyses and to establish the relationship between the
dependent and independent variables, first we must obtain the values for the
independent variables which make the object of the study. The independent variable:
size, asset tangibility, liquidity, profitability and tax were calculated with the help of
the financial indicators obtained from the yearly balance sheet, financial information
provided by Orbis and BVB.ro (Bucharest Stock Exchange). The variable interest
rate was taken at the average monthly rate and it was provided by Romanian
National Bank (BNR). Variable SIC represent the Standard Industrial Classification
code and it was provided by BVB.ro. The independent variables and the mode of
calculation are represented in the Table2.

26
Independent variable Mode of calculation
Size Log of annual turnover
Asset tangibility Fixed asset/total asset
Liquidity Current asset/short-term liabilities
Profitability EBIT/total asset
Interest rate Average monthly rate
Industry type SIC
Tax Taxable income/EBIT Table2. Independent variable mode of calculation
In the following table we have the signs of the expected relationship between
dependent and independent variables according to the main two capital structure
theories, trade-off theory and pecking order theory.
Variable Trade-off theory Pecking-order Theory
Size + +
Asset tangibility + -
Profitability + -
Liquidity + -
Interest rate + -
Industry type
Tax + + Table3. Expected signs of relationship between variables according to trade-off and pecking-order
theories
27
5. Empirical findings
In this chapter I present and analyse the meaning of the results obtained from
descriptive statistics, correlation analyses and panel data regression for both,
dependent variable (leverage) and independent variables (tangibility, size,
profitability, liquidity, industry type, interest rate and tax) for Romanian traded firms.
In the first section the results of descriptive statistics are presented and analysed.
Descriptive statistics will be analysed, including the whole sample, and will continue
with the debt ratios analysis of the firms divided by size in four classes (large,
medium-size, small and micro firms). The analysis continues with the correlation
results and finally there is a presentation in regards to the results of panel data
regression which was separated for all debt ratios and the expected relationship
between variables according to the Trade-off and the Pecking-order theories
compared with the regression results.
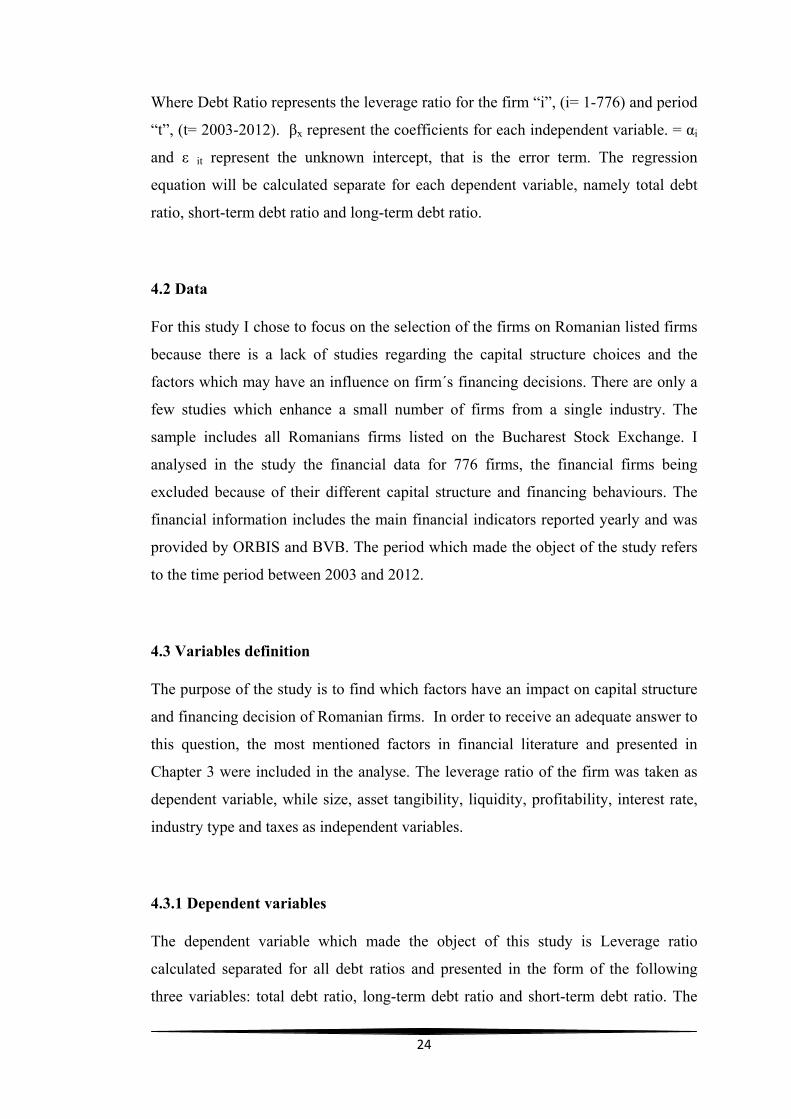
5.1 Descriptive statistics
The results of descriptive statistics for the overall sample are presented in Table4.
Mean Maximum Minimum Standard Deviation
Total debt ratio 0,4664 23,3136 0,0000 0,6610
Short debt ratio 0,3585 23,3136 0,0000 0,6212
Long term ratio 0,1078 5,3087 0,0000 0,2279
Tangibility 0,5299 0,9999 0,0000 0,2760
Size 5,5332 8,5390 0,9979 1,9103
Profitability 0,0107 3,5953 -5,8888 0,2296
Liquidity 2,8936 245,6798 0,0000 8,1301
Tax ratio 0,7323 131,6810 -96,2391 4,1175
Interest rate 9,9600 18,8300 5,3300 4,5986 Table4. Descriptive statistics for the whole sample (source: own preparation)
From the information presented in Table 4 it can be observed an average ratio of total
debt of 0, 4664. The average of the total debt ratio for Romanian traded firms for the
period between 2003 and 2012 is under 0.5. This has at least two major

28
consequences and implications. First, Romanian traded firms have an average debt
ratio which is situated under maximum recommended limit of 0.6-0.7 for the total
debt ratio mentioned in the financial literature. This means that overall, Romanian
traded firms keep a relative low degree of leverage in order to avoid financial distress
risk and the implied costs. Another consequence of the total debt level being under
0.5 is that most Romanian traded firm´s assets are financed through equity.
The long-term debt shows a 0.10 level while the short-term debt ratio is 0.358,
meaning that Romanian traded firms prefer to use short-term debt over the long-term
debt in order to finance their assets and current activity. The reasons for the short-
term debt preference may be a high level interest rate, long-term commitment
avoidance and/or country culture.
The interest rate at which level the firm can raise debt is one important factor when
the firm decides to access external financing because it will affect the cost of capital
and the long-run performance. It will be interesting to analyse the evolution of
interest rate and debt ratios for the analysed time interval. In figure 2 we see the
evolution of debt ratios and interest rate for the period between 2003 and 2012.
Figure2. Debt ratios and interest rate evolution 2003-2012 (source: own preparation)
In this graphic we can observe that short-term debt and total debt follow the same
shape. It is not surprising considering that short-term debt represents 76% of the total
0%
10%
20%
30%
40%
50%
60%
2003 2004 2005 2006 2007 2008 2009 2010 2011 2012
total debt
long-term debt
short-term debt
interest rate

29
amount of debt raised by the firm for the analysed interval. Secondly, the graphic
shows a positive correlation between short-term debt and interest rate and a negative
correlation between long-term debt and interest rate. At the end of 2003 when the
interest rate started to go down, we see an increase in long-term debt and a decrease
in short-term debt. This repeats in 2008 when the interest rate increases by 2%,
leading to an increase in short-term debt level and to decrease in long-term debt. We
would not err if we conclude that in the case of Romanian traded firms, any change
in the interest rate level leads to a change in total-debt ratio. Moreover, a change in
the interest rate level produces a change in debt structure. When interest rate level
increases, Romanian firms tend to use more short-term debts, meanwhile when the
interest rate decreases the firms tend to increase the long-term debt level. This can be
argued by the implication which a high interest rate has on cost of capital, increasing
the cost of capital and leading in many cases a firm into bankruptcy. Romanian
traded firms seem to wait for the period when the interest rate is lower in order to
establish a long-run commitment. An interesting aspect is the trend followed by debt
ratios in the analysed time period. All debt ratios fluctuate over time, short-term and
total debt in the same direction with interest rate and the long-term ratio contrary to
the interest rate. No debt ratios have a constant increasing or decreasing trend.
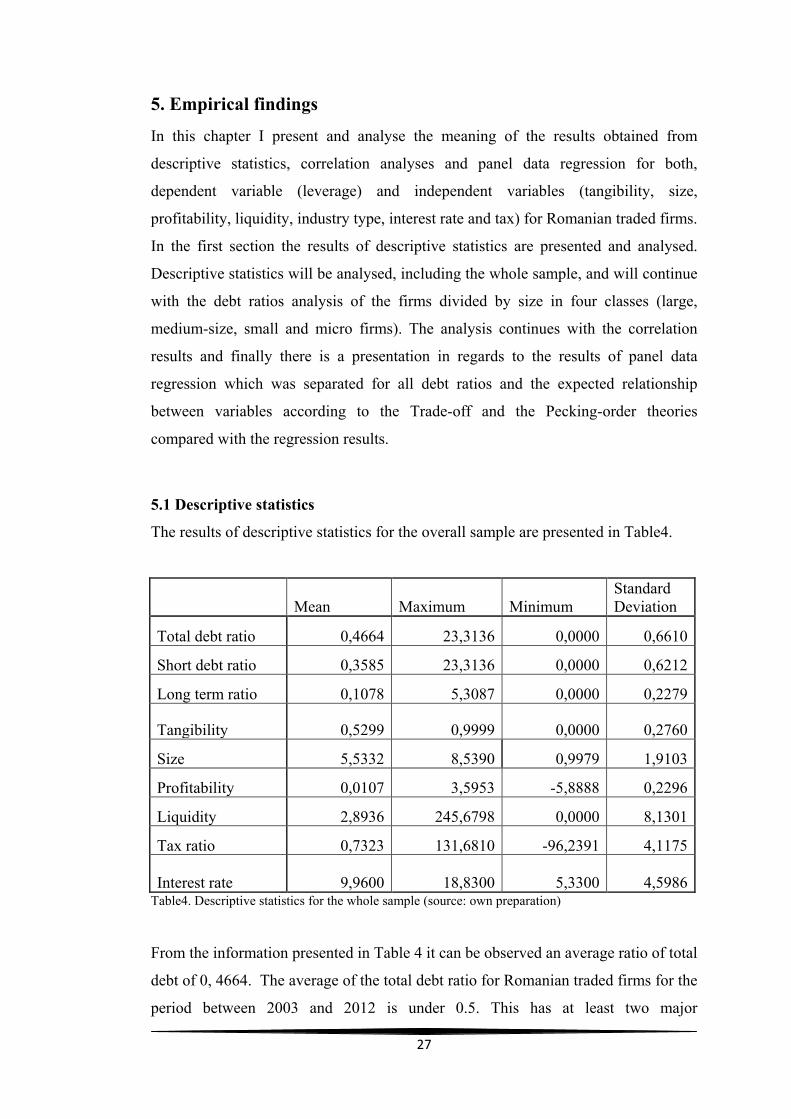
In the next part of the descriptive analysis the firms are divided by variable size in
order to understand better the differences in financing behaviour and capital structure
between large and small enterprises. The classification was made, conform to the
regulations of the European commission, dividing the firms in four categories, large
(turnover > 50 million), medium-size (turnover < 50 million), small (turnover <10
million), and micro enterprises (turnover < million). The structure of Romanian trade
firms divided by variable size is presented in the Figure 3.
30
Figure3. Firm size
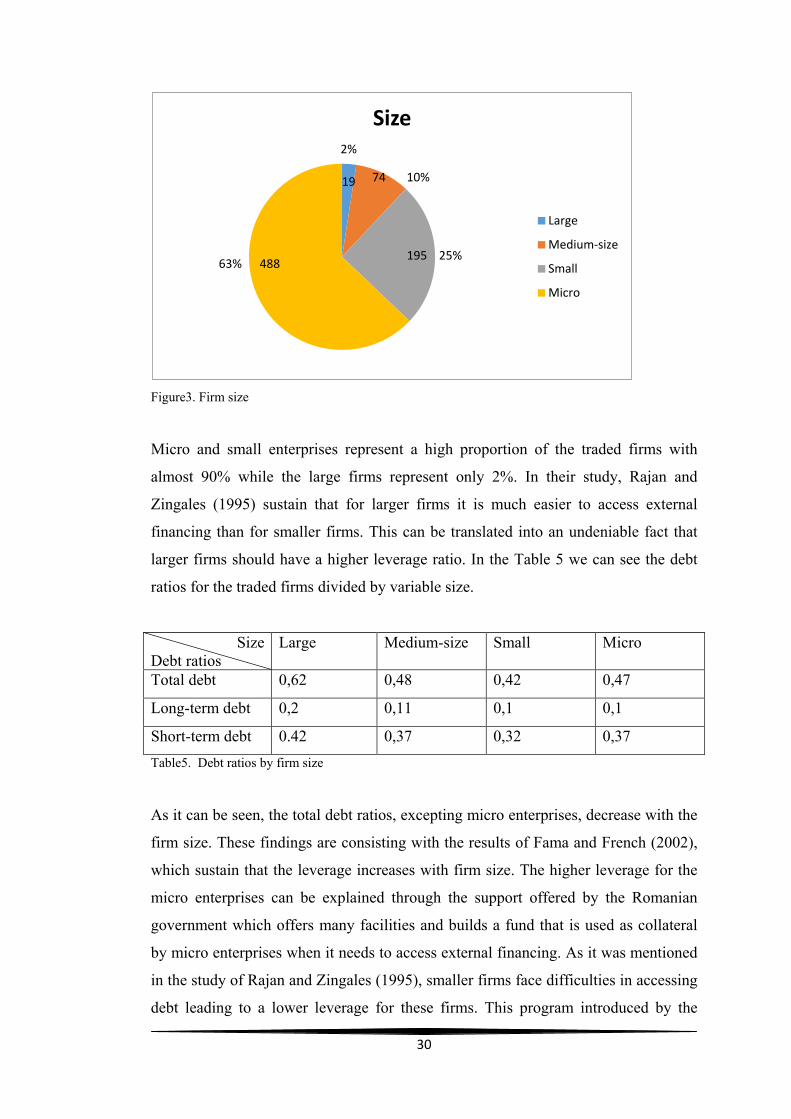
Micro and small enterprises represent a high proportion of the traded firms with
almost 90% while the large firms represent only 2%. In their study, Rajan and
Zingales (1995) sustain that for larger firms it is much easier to access external
financing than for smaller firms. This can be translated into an undeniable fact that
larger firms should have a higher leverage ratio. In the Table 5 we can see the debt
ratios for the traded firms divided by variable size.
Size Debt ratios
Large Medium-size Small Micro
Total debt 0,62 0,48 0,42 0,47
Long-term debt 0,2 0,11 0,1 0,1
Short-term debt 0.42 0,37 0,32 0,37 Table5. Debt ratios by firm size
As it can be seen, the total debt ratios, excepting micro enterprises, decrease with the
firm size. These findings are consisting with the results of Fama and French (2002),
which sustain that the leverage increases with firm size. The higher leverage for the
micro enterprises can be explained through the support offered by the Romanian
government which offers many facilities and builds a fund that is used as collateral
by micro enterprises when it needs to access external financing. As it was mentioned
in the study of Rajan and Zingales (1995), smaller firms face difficulties in accessing
debt leading to a lower leverage for these firms. This program introduced by the
2%
19 74 10%
195 25% 63% 488
Size
Large
Medium-size
Small
Micro
31
government came to sustain the micro enterprises and the development of these types
of enterprises. This can be easily observed by the high proportion (63%) of micro
enterprises in the traded firms sample and by total debt ratio (47%) which is much
higher in comparing to small enterprises (42%). A second observation that stands out
from the data presented in Table 5 is the level of long-term debt ratio. While the
micro, small and medium-size enterprises have almost the same debt ratio (10-11%),
larger firms have long-term debt ratio that is two times higher (20%). These results
are consistent with the Marsh (1982) findings, which sustain that larger firms prefer
long-term debt while smaller firms prefer short-term debt.
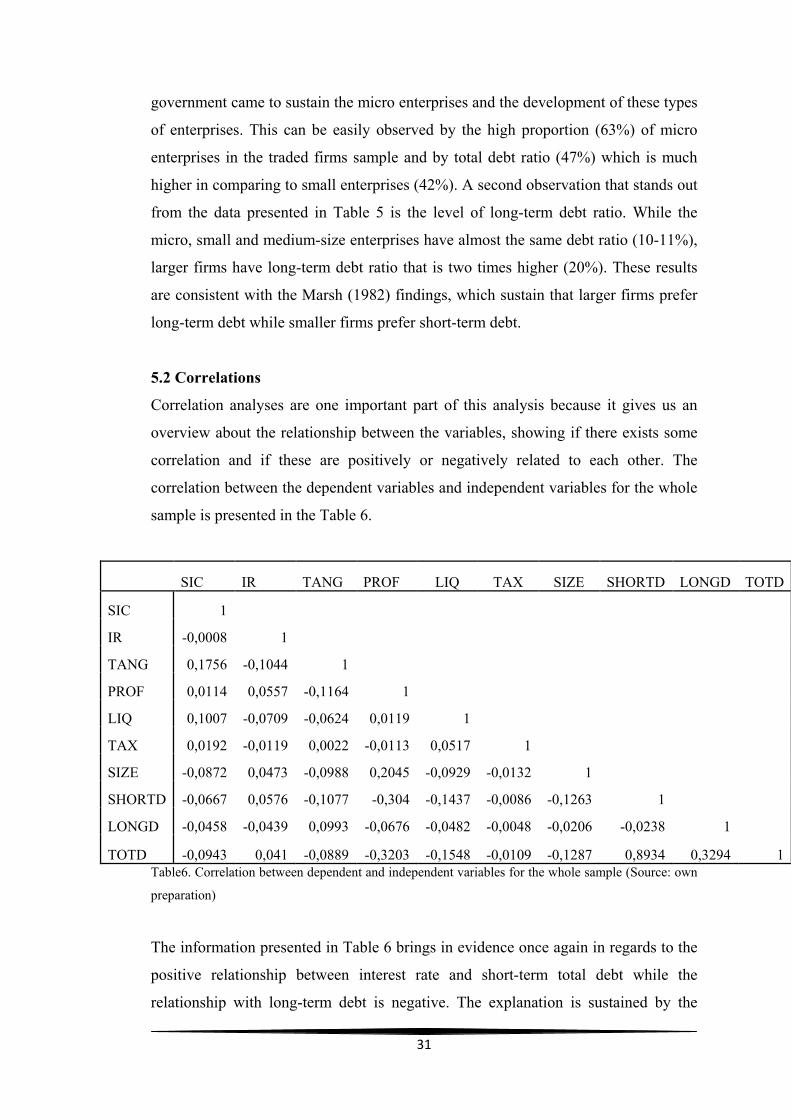
5.2 Correlations
Correlation analyses are one important part of this analysis because it gives us an
overview about the relationship between the variables, showing if there exists some
correlation and if these are positively or negatively related to each other. The
correlation between the dependent variables and independent variables for the whole
sample is presented in the Table 6.
SIC IR TANG PROF LIQ TAX SIZE SHORTD LONGD TOTD
SIC 1
IR -0,0008 1
TANG 0,1756 -0,1044 1
PROF 0,0114 0,0557 -0,1164 1
LIQ 0,1007 -0,0709 -0,0624 0,0119 1
TAX 0,0192 -0,0119 0,0022 -0,0113 0,0517 1
SIZE -0,0872 0,0473 -0,0988 0,2045 -0,0929 -0,0132 1
SHORTD -0,0667 0,0576 -0,1077 -0,304 -0,1437 -0,0086 -0,1263 1
LONGD -0,0458 -0,0439 0,0993 -0,0676 -0,0482 -0,0048 -0,0206 -0,0238 1
TOTD -0,0943 0,041 -0,0889 -0,3203 -0,1548 -0,0109 -0,1287 0,8934 0,3294 1 Table6. Correlation between dependent and independent variables for the whole sample (Source: own
preparation)
The information presented in Table 6 brings in evidence once again in regards to the
positive relationship between interest rate and short-term total debt while the
relationship with long-term debt is negative. The explanation is sustained by the
32
interest rate level which is relatively high a reality that consequently forces firms to
use debt for a short period of time in order to avoid long term commitment at a high
cost of capital which can affect the long-run performance of the organisation. The
positive relationship between interest rate and total debt can be explained by the
proportion of 76% represented by short-term debt in total debt.
Asset tangibility shows a negative relationship with short-term and total debt but a
positive impact on long-term debt. A similar relationship between asset tangibility
and debt ratios was found by Booth et al. (2001). The explanation is that long-term
debt increases with the asset tangibility of the firm, replacing short-term debt. This
means that once the firm owns more valuable assets it can go into long-run
commitment and it can replace short-term debt using these assets as collateral.
Profitability and liquidity show an indirect correlation to all debt ratios contradicting
the assumptions of Trade-off theory which sustain that the firms with high
profitability and liquid assets should use more debt.
Taxes are negatively correlated to all debt ratios being in contradiction with the
Trade-off theory. According to the Trade-off theory, the firm should increase the
debt ratio when taxes rise in order to benefit from the debt tax advantages. This does
not seem to be the case for Romanian trade firms. The argument for the negative
correlation between tax and debt ratios can be the tax level. The most important tax
for the firms is corporate tax which faces a relative low level in Romania being
around 16%, one of the lowest in the EU. Combining this argument with the interest
rate level on average for the all time interval of 10%, which is the subject of
deduction, it may result that taxes are not a determinant factor for the Romanian
firms to raise debt in order to benefit from their tax advantages.
Firm size seems to be negative correlated to all debt ratios which is a conclusion
consistent with the findings of Kester (1986) and Khaplinsky and Niehaus (1990).
In the second part of the correlation analysis I divided the firms into two categories,
large enterprises and SME, using classification according to European Commission
regulation. Large firms are considered those enterprises that realise over 50 million
annual turnover while SME are those who realise an annual turnover less than 50
33
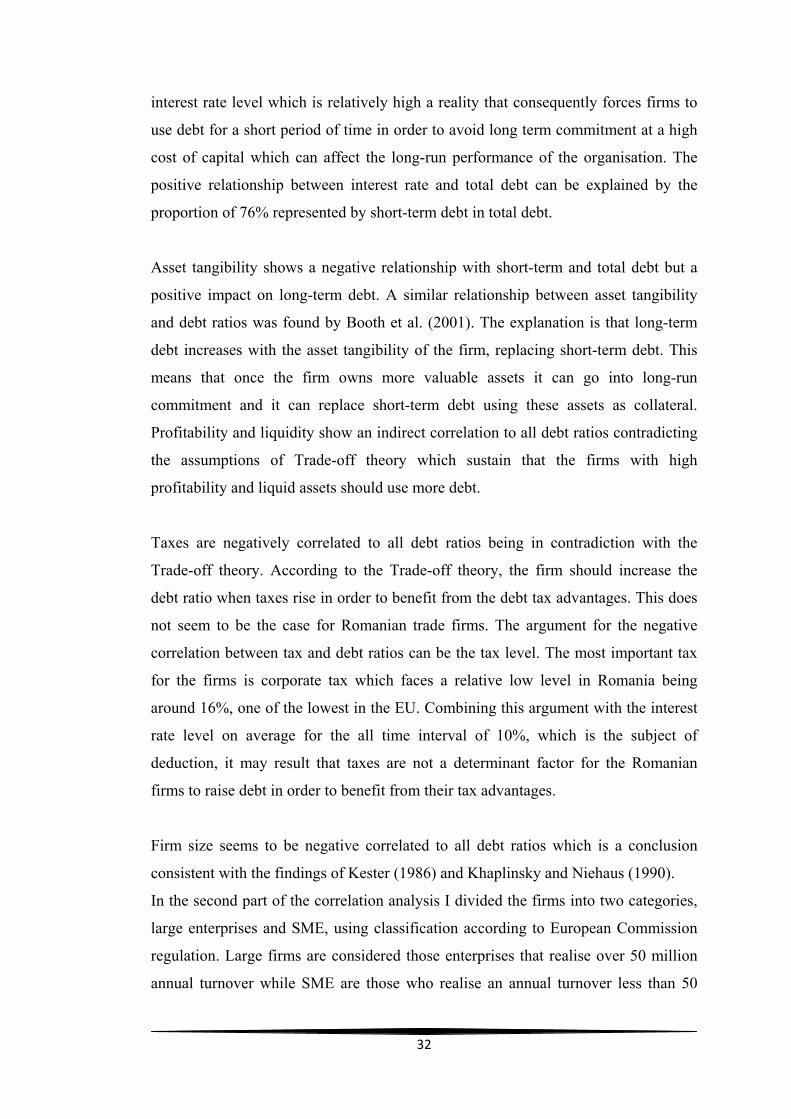
million. I decided to analyse the correlation between variables for two distinct firm
category (large and SME) in an attempt to find if large firms and SME establish a
different relationship between variables according to their financing behaviour as it
was mentioned in the literature by Fama and French (2002) and Rajan and Zingales
(1995).
The relationship between independent variables and dependent variables for the large
enterprises is presented in Table 7.
Table7. Correlation between variable for the large enterprises (source: own preparation)
The results for the large enterprises appear to be different from those obtained for the
whole sample. Interest rate seems to be negatively correlated to total debt comparing
to previous results where it was positively correlated, while the relationship between
interest rate and short-term debt remain unchanged. The reason for this difference is
argued by the proportion of 98% SME in the whole sample which influences the
results and by higher long-term debt ratio (20%) in case of large firms which is
negative correlated and two times higher than for SME.
Taxes and size are directly related to all debt ratios for the large enterprises. It means
that for the large firm category the leverage increases with the increase in size and
large firm SIC IR TANG PROF LIQ TAX SIZE SHORTD LONGD TOTALD
SIC 1,0000
IR 0,0053 1,0000
TANG -0,0569 0,0337 1,0000
PROF 0,2260 -0,0539 -0,0969 1,0000
LIQ 0,5143 -0,0518 -0,1201 0,4260 1,0000
TAX 0,0599 -0,0961 -0,0390 -0,0864 0,0113 1,0000
SIZE 0,1606 -0,0511 0,0257 0,0378 -0,0037 0,0684 1,0000
SHORTD -0,4029 0,0226 -0,2407 -0,4413 -0,6539 0,0318 0,0439 1,0000
LONGD -0,2571 -0,0657 -0,1132 -0,1809 -0,3330 0,1967 0,1529 0,4352 1,0000
TOTALD -0,3936 -0,0229 -0,2125 -0,3746 -0,5915 0,1301 0,1129 0,8630 0,8304 1,0000
34
taxes. The large firms increases the leverage in order to finance their assets when the
taxes rise motivated by debt tax advantages. Size appears to be an important factor
for the large firms regarding capital structure, influencing positive the leverage.
These results are consistent with the findings written in Fama and French (2002),
which argue for a positive relationship between size and leverage.
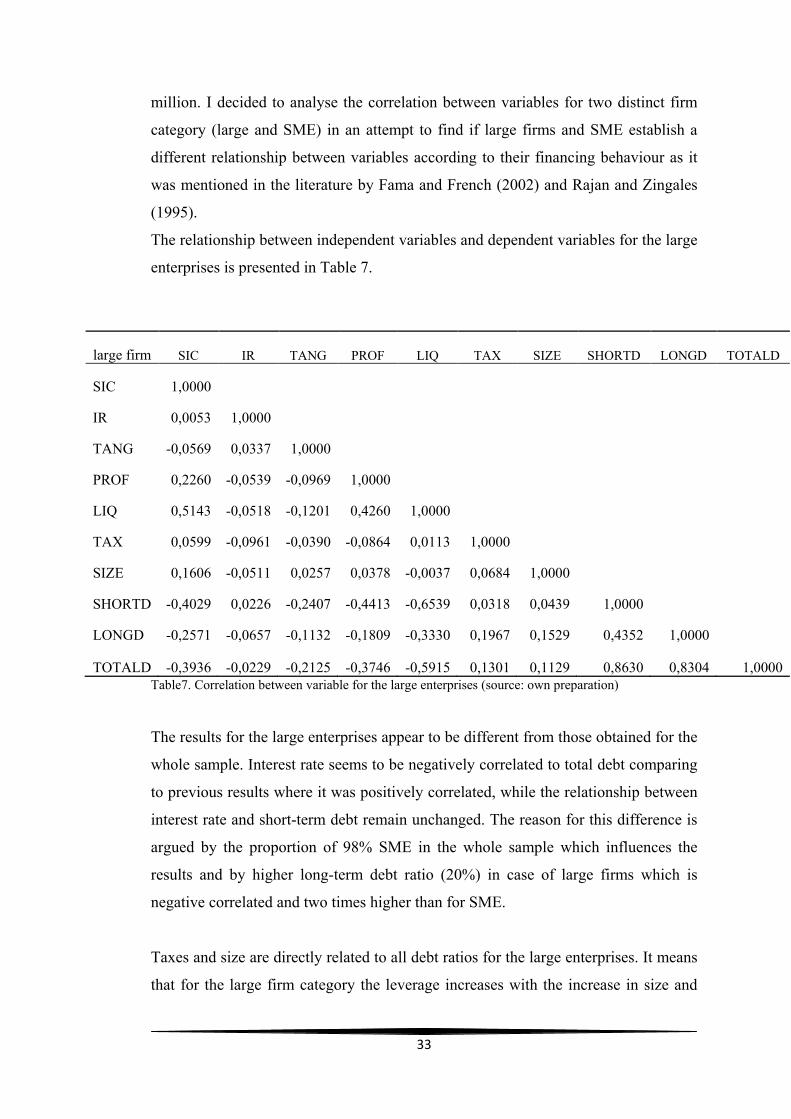
SME represent 98% of Romanian traded firms, a proportion similar to those recorded
in the European Union. Because SME sector can be considered the economic
engine, it becomes very important how the development of these enterprises is
stimulated. As it was mentioned above, micro enterprises are strongly supported by
the government funds and small enterprises have some financial stimulation at
disposal. It will be interesting to observe how the dependent and independent
variable are related to each other in this case for SME. The correlation between
variables can be observed in the Table 8.
SME SIC IR TANG PROF LIQ TAX SIZE SHORTD LONGD TOTALD
SIC 1
IR -0,0009 1,0000
TANG 0,1796 -0,1048 1,0000
PROF 0,0095 0,0569 -0,1165 1,0000
LIQ 0,1000 -0,0717 -0,0629 0,0115 1,0000
TAX 0,0197 -0,0117 0,0033 -0,0110 0,0521 1,0000
SIZE -0,0876 0,0498 -0,0983 0,2077 -0,0902 -0,0147 1,0000
SHORTD -0,0643 0,0578 -0,1069 -0,3033 -0,1431 -0,0093 -0,1317 1,0000
LONGD -0,0402 -0,0430 0,1044 -0,0670 -0,0457 -0,0086 -0,0397 -0,0310 1,0000
TOTALD -0,0901 0,0421 -0,0876 -0,3204 -0,1537 -0,0129 -0,1413 0,8950 0,3173 1,0000 Table8. Correlation between variable for SME (source: own preparation)
The results presented in the Table 8 are similar to those obtained for the whole
sample with a single difference, namely, asset tangibility is positively correlated to
long-term debt. It means that Romanian SME use the assets as collateral when they

35
enter into a long-run commitment. This relationship is similar to that obtained by
Booth et al. (2001) who found a positive relationship between asset tangibility and
long-term debt but a negative one between tangibility and short-term debt.
5.3 Regression analyses In this part of the chapter the results of the standard regression analyses with short-
term debt, long-term debt and total debt as dependent variables will be presented and
discussed. The regression is included in the first part of the analysis in regard to debt
ratios for the whole sample. It continues with the regression analyses where the
sample is divided in two parts, large firms and SME. The argument behind the
second analysis is to observe if large firms and SME behave differently when they
establish their capital structure under the influence of the observed factors. Towards
the end of the analysis the expected results will be presented (according with Trade-
off and Pecking-order theories), comparing them to the results obtained in this study.
The results of standard regression which include the whole sample and all debt ratios
as dependent variables can be observed in Table 9.
Variable SHORTD LONGD TOTALD
SIC -.0000104
.0077337
-.4232013
-.8439639
-.0120252
-.0006237
-7.15
-.0017044
.096616
-.0514887
-.0010875
-.0001696
-.000021
.0057
-.3071
-.8902
-.0127
-.0008
IR
TANG
PROF
LIQ
TAX
SIZE -.0591111
1.000401
0.1476
7155
-.0016301
.1177
0.19
7155
-.0601
1.14
0.15
7155
Constant
R2
Observation
Table 9. Regression results for whole sample (source: own preparation)
36
The dependent variable short-term debt seems to be negatively influenced by the
independent variables: industry, tangibility, profitability, liquidity, tax and size but
positively influenced by the interest rate. The level of variables industry, tax and
interest rate is situated under 1%, meaning that their impact on short-term debt is not
significant. Profitability by -0.84 shows a negative significant impact on the short-
term debt ratio. This result is consistent with the pecking-order theory which sustains
that the firms have a financing order preference and the firms will first use internal
resources over external financing. In the case of Romanian traded firms this means
than the higher the profitability the lower will be the short-term debt ratio.
Tangibility has a negative impact on the short-term debt ratio. The explanation is that
for short-term debt the organisation needs easier convertible asset as collateral, fixed
asset is usually being used for long-term engagements. The size (-0.05) has a
negative impact on the short-term debt ratio. A reason may be the size of Romanian
traded firms, 98% being represented by SME, influencing this result in a negative
way.
Long-term debts are negative impacted by industry, interest rate, profitability,
liquidity, size and taxes while tangibility shows a positive influence. Interest rate,
liquidity, tax and size have less than 1% level meaning that the influence of these
variables is not significant. Profitability has a significant level (-0.05), influencing
negative the long-term debt ratio. A high profitability level leads to a low long-term
debt level meaning that the Romanian traded firms follow in this case the pecking-
order theory and use the retained earnings to finance the assets instead of external
financing. Tangibility (0.09) has a significant positive influence in long-term debt
leading to the conclusion that Romanian firms use fixed assets as collateral to raise
long-term debts. Industry type has a strong negative impact in long-term debt ratio.
The leverage ratio varied across the industries influenced by industry characteristics.
It seems that industry characteristics have a strong negative impact in long-term debt
ratio for Romanian firms.
The total debt variable is negatively influenced by industry, tangibility, profitability,
liquidity tax and size, meanwhile interest rate has a positive influence. The results are
influenced by the proportion of the short-term debt (76%) in total debt, being almost
37
similar to the results for short-term debt. The following factors have an insignificant
level: industry, interest rate and tax. Profitability has a negative significant influence
on total debt variation, a signal that the Romanian firms use retained earnings before
to raise debts. Size and tangibility are negatively related to total debt ratio variation,
which can be explained by the high proportion of SME in the whole sample. These
results contradict the Fama and French (2002) and Rajan and Zingales (1995)
findings that brought a strong support for a positive relationship between size and
leverage, tangibility and leverage in particular.
Because the SME represent a very high proportion (98%) in the analysed sample and
seem to have a strong influence on the final results, I divided the sample in two parts,
in an attempt to find if the large firms have similar financing behaviour and if the
relationship between dependent and independent variables remain unchanged. The
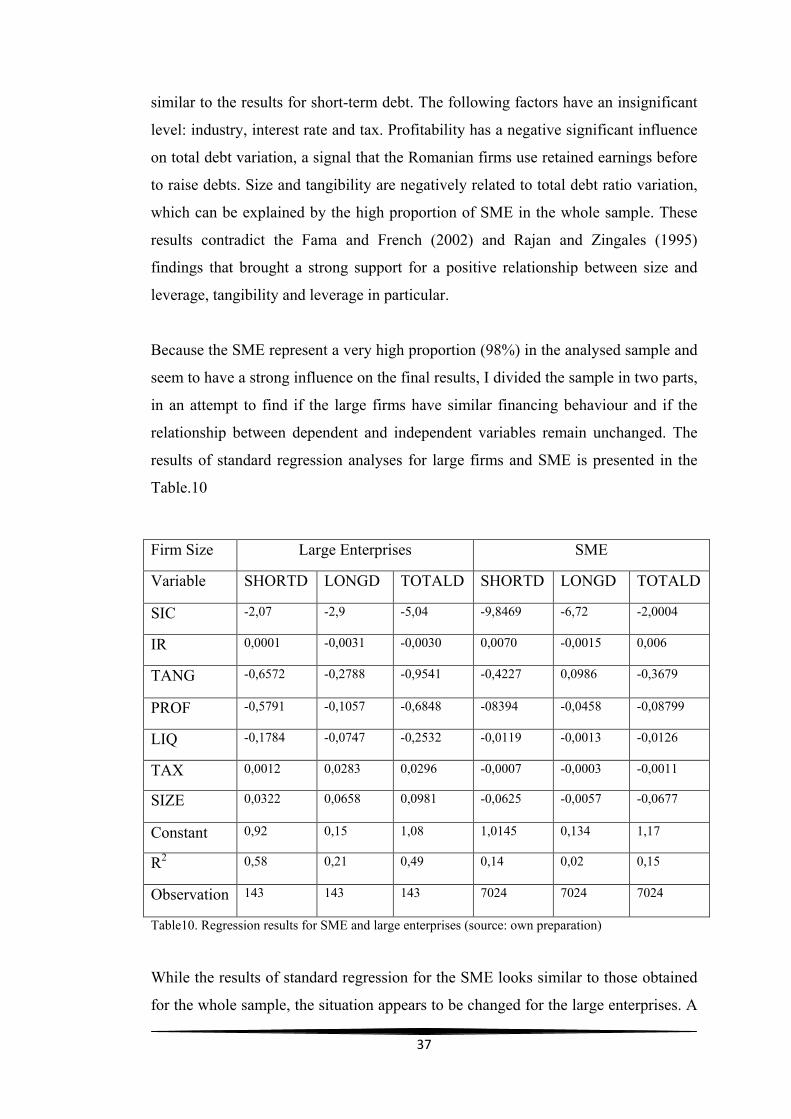
results of standard regression analyses for large firms and SME is presented in the
Table.10
Table10. Regression results for SME and large enterprises (source: own preparation)
While the results of standard regression for the SME looks similar to those obtained
for the whole sample, the situation appears to be changed for the large enterprises. A
Firm Size Large Enterprises SME
Variable SHORTD LONGD TOTALD SHORTD LONGD TOTALD
SIC -2,07 -2,9 -5,04 -9,8469 -6,72 -2,0004
IR 0,0001 -0,0031 -0,0030 0,0070 -0,0015 0,006
TANG -0,6572 -0,2788 -0,9541 -0,4227 0,0986 -0,3679
PROF -0,5791 -0,1057 -0,6848 -08394 -0,0458 -0,08799
LIQ -0,1784 -0,0747 -0,2532 -0,0119 -0,0013 -0,0126
TAX 0,0012 0,0283 0,0296 -0,0007 -0,0003 -0,0011
SIZE 0,0322 0,0658 0,0981 -0,0625 -0,0057 -0,0677
Constant 0,92 0,15 1,08 1,0145 0,134 1,17
R2 0,58 0,21 0,49 0,14 0,02 0,15
Observation 143 143 143 7024 7024 7024
38
short-term debt ratio is positively influenced by interest rate, tax and size and
negative by industry, tangibility, profitability and liquidity. Variable tax (0.001) and
interest rate (0.0001) have an insignificant impact in short-term debt ratio variation.
Profitability and liquidity have a negative relationship with short-term debt ratio,
meaning that the large firms use retained earnings and current assets to finance their
business instead of external financing. Size (0.03) is positively related to short-term
debt ratio in case of large firms. It is known that larger firms are business diversified
leading to a low business and bankruptcy risk. A lower risk seems to be a factor that
impact positively in short-run the leverage.
The influence of Size (0.065) and Tax (0.028) is much stronger in the long-run debt
ratio than in short-debt. The size, by low business risk, appears to be one of the most
important factors that influence positive the long-term debt ratio. According to these
results the long-term leverage ratio increases with the firm size, results which
conclude with the findings of Fama and French (2002). Tax is positively related to
long-term debt ratio for the large firms comparing to SME. It means that larger firms
are raising debts in order to benefit from their tax advantages. A surprising result is
the negative impact that tangibility has in long-term debt ratio (-0.27), but much
lower than in case of short-run debt (-0.65) leading to conclusion that fixed asset are
used a lot more in the long-run.
The results for total debt are similar. Once again, the leverage is positively
influenced by tax and size, while industry, profitability, liquidity, tangibility are
negatively related. The interest rate has an insignificant impact on total debt ratio.
The negative relation between tangibility and leverage, contradict the findings of
Titman and Wessels (1988), Marsh (1982), Long and Malitz (1985) and Rajan and
Zingales (1995) which show a positive relationship. In the case of Romanian larger
firms, the size of the firm characterised by lower business risk and bankruptcy risk
appears to be more important than the fixed assets owned by the firm. One
explanation may be the specificity of the assets owned by the larger firms, a factor
that raises difficulties by conversion in liquidities and leading to a non-acceptance as
collateral by creditors.

39
In the following table we can be observe the expected signs according to trade-off
and pecking-order theories in comparison to the signs of independent variables
obtained in the study.
Table11. The expected signs (total leverage) for the variables according to trade-off and pecking-order
theory and the results obtained in the analysis
According to these findings it can be stated that large Romanian firms follow closely
the pecking-order financing decision while the results of small and medium-sized
Romanian firms show a financing order that is closer to pecking-order than trade-off
financing order.
Variable
Trade-off
theory
Pecking-
order theory
Whole
sample
Large firms SME
SIC - - -
IR + - + - +
TANG + - - - -
PROF + - - - -
LIQ + - - - -
TAX + + - + -
SIZE + + - + -

40
6. Conclusions
This study tries to find the most influent factors on the capital structure decision of
Romanian traded firms. In this regard, short debt ratio, long debt ratio and total debt
as dependent variable has been investigated. In order to identify the influent factors
that may impact the capital structure decision of Romanian traded firms, the most
common used factors in the capital structure literature were analysed as independent
variable. These variables are: asset tangibility, firm size, profitability, liquidity,
interest rate, industry type and taxes. This study contains in the first part the analysis
of the whole sample for the period from 2003-2012. In the second part, the sample
was divided in two parts, large firms and SME, in order to understand if larger firms
behave differently as it was mentioned in the capital structure literature.
In order to better understand the capital structure and its fluctuation, all debt ratios
were analysed. The results show that Romanian firms have an average overall period
of 0, 46 total debt ratios which is under the maximum recommended level (0.6-0.7).
Romanian firms appear to have a preference for short-term debt, a proportion of 76%
of all debt being for short time. The reason for this is the lack of tangible assets
which could allow the enterprises to enter into long-term commitments. The findings
bring in evidence of an interesting relationship between debt ratios and interest rate,
the short debt follows the same trend with the interest rate while long debt on the
contrary. Any increase in interest rate leads to an increase in short debt and to a
decrease in long debt. The firms avoid raising long debt when interest rate is higher
because this increases their cost of capital and the risks.
The empirical results for the whole sample indicate that most important capital
structure factors for Romanian firms are tangibility, profitability, liquidity and size.
Excepting the asset tangibility which has a strong positive impact in long-term debt,
these factors have a strong negative impact on the capital structure decision. The
results were statistically insignificant for interest rate, industry type and tax.
The second regression analyses indicate that, comparing to the whole sample, size
and tax have a strong positive influence in the capital structure decision. The size, by
risk dilution, seems to lead larger firms to have an easier access to external financing.

41
Romanian large enterprises appear to use debt in order to benefit from debt tax
advantages influencing positively the leverage.
Overall, Romanian traded firms follow a Pecking-order financing decision, using
internal funds to finance their assets before to raise debt.
The results of this study are relevant because they include a large sample (776 firms)
for a ten year period (2003-2012). It shows that the capital structure changes over the
time and which are the most determinant factors of total, long and short debt for the
whole sample on the one hand, and for the large firm and SME on the other. For the
future research, analyses should be done separately for each industry type because in
this study the differences across the industries may have had a negative influence for
the results. Moreover, it should use more analytical methods in order to find which
model fits for Romanian firms and in order to identify better the determinants of
capital structure decisions.

42
References Baker, M. & Wurgler, J. (2002). Market timing and capital structure. Journal of Finance, 57(1), 1-32. Brav, Alon, John R. Graham, Campbell R. Harvey and Roni Michaely( 2005) . Journal of Financial Economics, 77(3), 483-527. Chaplinsky S. & Niehaus, G. (1990). The tax and distributional effects of leveraged ESOPs. Review of Financial Studies, 11, 281–308.
DeAngelo, H. & Masulis, R. W. (1980). Optimal capital structure under corporate and personal taxation. Journal of Financial Economics, 8 (1), 3–29. Deesomsak, R., Paudyal, K. & Pescetto, G. (2004). The Determinants of Capital Structure: Evidence from the Asia Pacific Region. Journal of Multinational Financial Management 14(4-5): 387-405. Fama, F., & French, K. (2002). Testing Trade-Off and Pecking Order Predictions about Dividends and Debt. The Review of Financial Studies, 15(1), 1-33. Frank, M. Z., & Goyal, V. K. (2003). Testing The Pecking Order Theory of Capital Structure. Journal of Financial Economics, 67(2), 217-248.
Graham, J.R. & Harvey, C.R. (2001). The theory and practice of corporate finance: Evidence from the field. Journal of Financial Economics, 60(2), 187-243. Jensen, M. C. & Meckling, W. (1976). Theory of the firm: Managerial behaviour, agency costs, and ownership structure. Journal of Financial Economics, 3(4), 305-360. Jensen, M. C. (1986). Agency costs of free cash flow, corporate finance and takeovers. American Economic Review, 76(2), 323-339.
Kester, W. C. (1986) Capital and Ownership Structure: A Comparison of United States and Japanese Manufacturing Corporations. Financial Management 15, 5–16. Kraus, A. and Litzenberger, R. H. (1973). A state-preference model of optimal financial leverage. Journal of Finance, 28(4), 911-922. Laurence Booth, Varouj Aivazian, Asli Demirguc-Kunt and Vojislav Maksimovici (2001). Capital structure in developing countries. Journal of finance, 56(1), 87-130. Michael Bradley, Gregg A. Jarrell, E. Han Kim (1984). On the Existence of an Optimal Capital Structure: Theory and Evidence. Journal of Finance, 39(3), 857-878.

43
Michael S. Long, Ileen B. Malitz (1985). Investment Patterns and Financial Leverage. University of Chicago Press, 85(1), 325 – 352. Miller, M. H. (1977). Debt and Taxes. Journal of Finance, 32(2), 261-276.
Milton Harris; Artur Raviv (1991). The Theory of Capital Structure. Journal of
Finance, 46 (1), 297-355.
Modigliani, F., & Miller, M. H. (1958). The Cost of Capital, Corporation Finance and the Theory of Investment. American Economic Review, 48(3), 261–297. Moodys (2006). The Distribution of Common Financial Ratios by Rating and Industry For North American Non-Financial Corporation. Myers, S. C. & Majluf, C. S. (1984). Corporate financing and investment decisions when firms have information that investors do not have. Journal of Financial Economics, 13(2), 187-221 Orbis-Bureau van Dijk, international company database Paul Marsh (1982). The Choice between Equity and Debt: An Empirical Study. Journal of Finance, 37(1), 121–144.
Rajan, R. G., & Zingales, L. (1995). What Do We Know about Capital Structure? Some Evidence from International Data. Journal of Finance, 50(5), 1421–1460. Robert A. Korajczyk, Deborah Lucas, Robert L. McDonald (1990). Understanding Stock Price Behavior around the Time of Equity Issues. University of Chicago Press. 90(1), 257 – 278.
Shyam-Sunder, L. & Myers, S.C. (1999). Testing static tradeoff against pecking order models of capital structure. Journal of Financial Economics, 51(2), 219-244. Stephen A. Ross (1977). The Determination of Financial Structure: The Incentive-Signalling Approach. The Bell Journal of Economics, 8(1), 23-40. Stewart C. Myers (1984). The Capital Structure Puzzle. Journal of finance, 39(3), 574-592. Sudipto Bhattacharya (1979). Imperfect Information, Dividend Policy, and "The Bird in the Hand" Fallacy. The Bell Journal of Economics, 10(1), 259-270. Titman, S., & Wessels, R. (1988). The Determinants of Capital Structure Choice. Journal of Finance, 43(1), 1–19.
44
Wi Saeng Kim and Eric H. Sorensen (1986). Evidence on the Impact of the Agency Costs of Debt on Corporate Debt Policy. Journal of financial and quantitative analyses, 21(2), 131-144.

45
Appendix
Table1. Dependent variable mode of calculation
Dependent Variable Mode of calculation
Total debt ratio total liabilities/ total asset
Short-term debt ratio short-term liabilities/total asset
Long-term debt ratio long-term liabilities/total asset
Table2. Independent variable mode of calculation
Independent variable Mode of calculation
Size Log of annual turnover
Asset tangibility Fixed asset/total asset
Liquidity Current asset/short-term liabilities
Profitability EBIT/total asset
Interest rate Monthly rate average
Industry type SIC
Tax Taxable income/EBIT Table 2. Independent variable mode of calculation

46
Table3. Expected signs of relationship between variables according to trade-off
and pecking-order theories
Variable Trade-off theory Pecking-order Theory
Size + -
Asset tangibility + -
Profitability + -
Liquidity + -
Interest rate + -
Industry type
Tax + +
Table4. Descriptive statistic for the whole sample (source: own preparation)
Mean Maxim Minim Standard Deviation
Total debt ratio 0,4664 23,3136 0,0000 0,6610
Short debt ratio 0,3585 23,3136 0,0000 0,6212
Long term ratio 0,1078 5,3087 0,0000 0,2279
Tangibility 0,5299 0,9999 0,0000 0,2760
Size 5,5332 8,5390 0,9979 1,9103
Profitability 0,0107 3,5953 -5,8888 0,2296
Liquidity 2,8936 245,6798 0,0000 8,1301
Tax ratio 0,7323 131,6810 -96,2391 4,1175
Interest rate 9,9600 18,8300 5,3300 4,5986
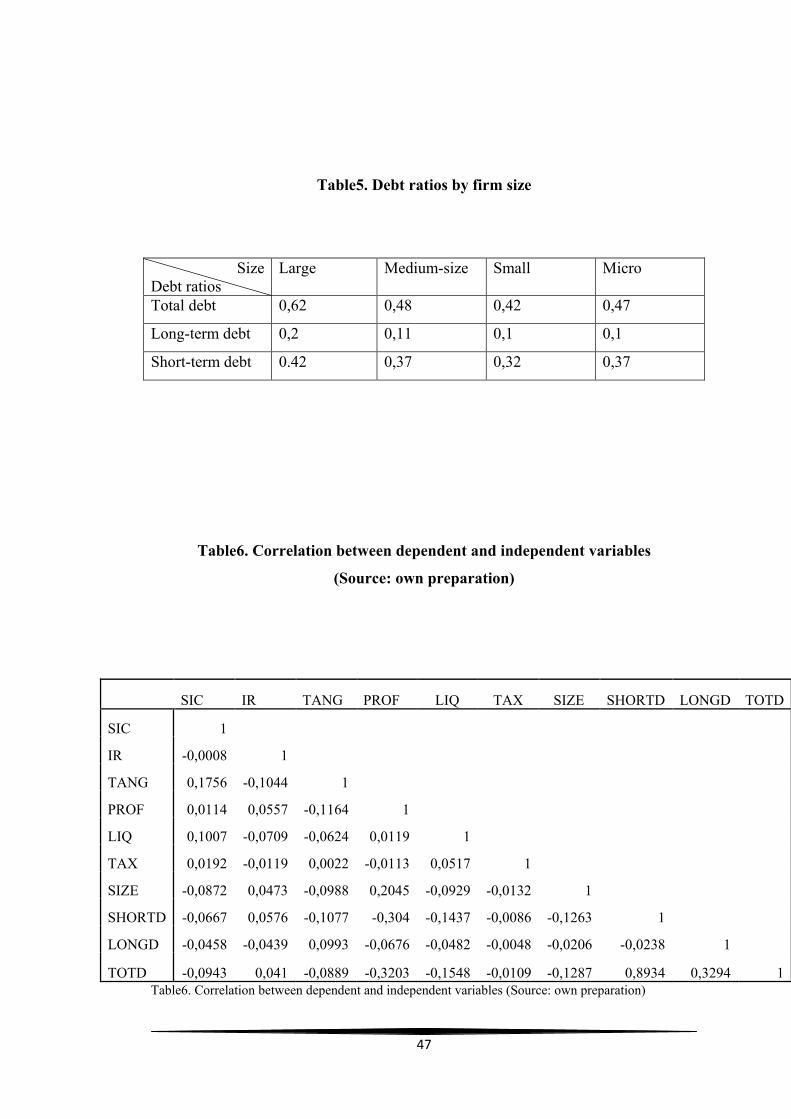
47
Table5. Debt ratios by firm size
Size Debt ratios
Large Medium-size Small Micro
Total debt 0,62 0,48 0,42 0,47
Long-term debt 0,2 0,11 0,1 0,1
Short-term debt 0.42 0,37 0,32 0,37
Table6. Correlation between dependent and independent variables
(Source: own preparation)
SIC IR TANG PROF LIQ TAX SIZE SHORTD LONGD TOTD
SIC 1
IR -0,0008 1
TANG 0,1756 -0,1044 1
PROF 0,0114 0,0557 -0,1164 1
LIQ 0,1007 -0,0709 -0,0624 0,0119 1
TAX 0,0192 -0,0119 0,0022 -0,0113 0,0517 1
SIZE -0,0872 0,0473 -0,0988 0,2045 -0,0929 -0,0132 1
SHORTD -0,0667 0,0576 -0,1077 -0,304 -0,1437 -0,0086 -0,1263 1
LONGD -0,0458 -0,0439 0,0993 -0,0676 -0,0482 -0,0048 -0,0206 -0,0238 1
TOTD -0,0943 0,041 -0,0889 -0,3203 -0,1548 -0,0109 -0,1287 0,8934 0,3294 1 Table6. Correlation between dependent and independent variables (Source: own preparation)
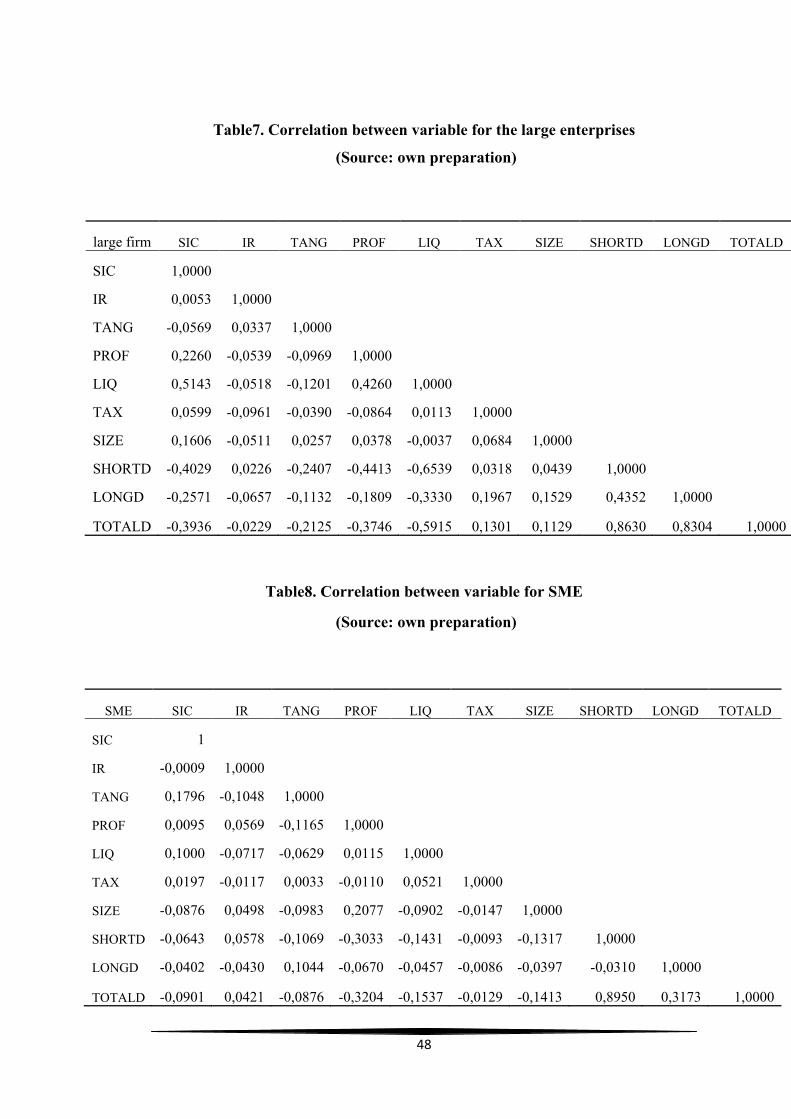
48
Table7. Correlation between variable for the large enterprises
(Source: own preparation)
Table8. Correlation between variable for SME
(Source: own preparation)
SME SIC IR TANG PROF LIQ TAX SIZE SHORTD LONGD TOTALD
SIC 1
IR -0,0009 1,0000
TANG 0,1796 -0,1048 1,0000
PROF 0,0095 0,0569 -0,1165 1,0000
LIQ 0,1000 -0,0717 -0,0629 0,0115 1,0000
TAX 0,0197 -0,0117 0,0033 -0,0110 0,0521 1,0000
SIZE -0,0876 0,0498 -0,0983 0,2077 -0,0902 -0,0147 1,0000
SHORTD -0,0643 0,0578 -0,1069 -0,3033 -0,1431 -0,0093 -0,1317 1,0000
LONGD -0,0402 -0,0430 0,1044 -0,0670 -0,0457 -0,0086 -0,0397 -0,0310 1,0000
TOTALD -0,0901 0,0421 -0,0876 -0,3204 -0,1537 -0,0129 -0,1413 0,8950 0,3173 1,0000
large firm SIC IR TANG PROF LIQ TAX SIZE SHORTD LONGD TOTALD
SIC 1,0000
IR 0,0053 1,0000
TANG -0,0569 0,0337 1,0000
PROF 0,2260 -0,0539 -0,0969 1,0000
LIQ 0,5143 -0,0518 -0,1201 0,4260 1,0000
TAX 0,0599 -0,0961 -0,0390 -0,0864 0,0113 1,0000
SIZE 0,1606 -0,0511 0,0257 0,0378 -0,0037 0,0684 1,0000
SHORTD -0,4029 0,0226 -0,2407 -0,4413 -0,6539 0,0318 0,0439 1,0000
LONGD -0,2571 -0,0657 -0,1132 -0,1809 -0,3330 0,1967 0,1529 0,4352 1,0000
TOTALD -0,3936 -0,0229 -0,2125 -0,3746 -0,5915 0,1301 0,1129 0,8630 0,8304 1,0000
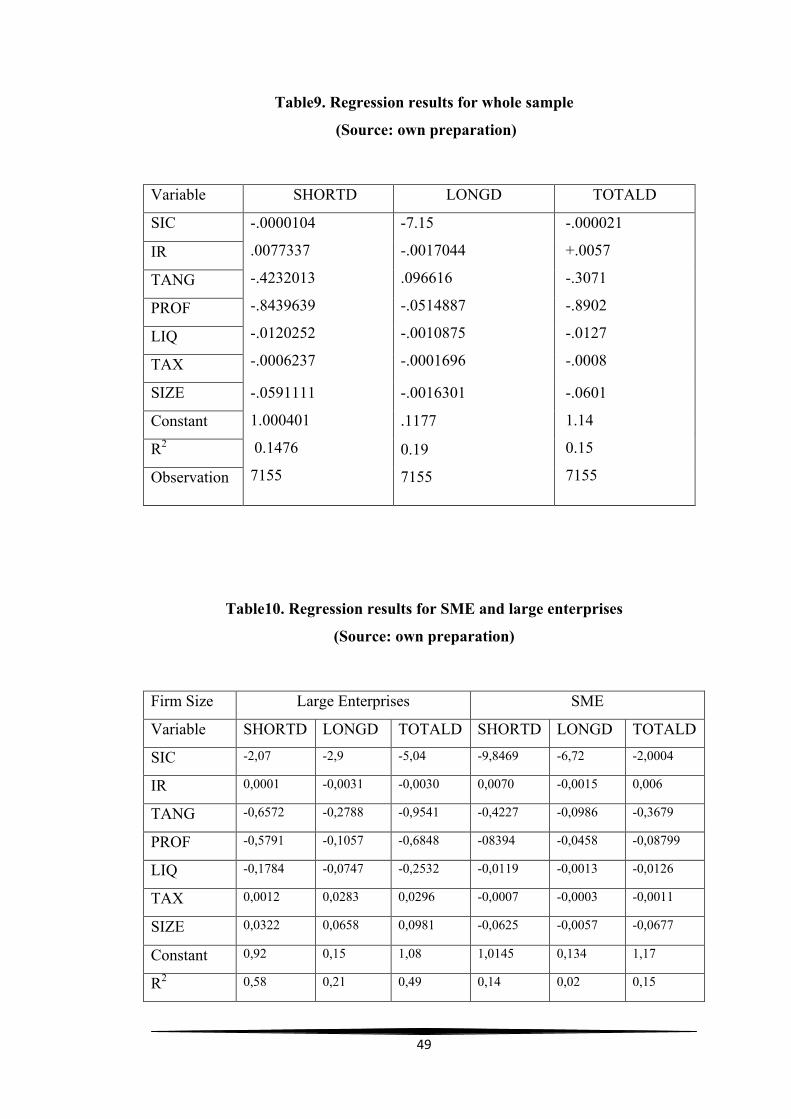
49
Table9. Regression results for whole sample
(Source: own preparation)
Variable SHORTD LONGD TOTALD
SIC -.0000104
.0077337
-.4232013
-.8439639
-.0120252
-.0006237
-7.15
-.0017044
.096616
-.0514887
-.0010875
-.0001696
-.000021
+.0057
-.3071
-.8902
-.0127
-.0008
IR
TANG
PROF
LIQ
TAX
SIZE -.0591111
1.000401
0.1476
7155
-.0016301
.1177
0.19
7155
-.0601
1.14
0.15
7155
Constant
R2
Observation
Table10. Regression results for SME and large enterprises
(Source: own preparation)
Firm Size Large Enterprises SME
Variable SHORTD LONGD TOTALD SHORTD LONGD TOTALD
SIC -2,07 -2,9 -5,04 -9,8469 -6,72 -2,0004
IR 0,0001 -0,0031 -0,0030 0,0070 -0,0015 0,006
TANG -0,6572 -0,2788 -0,9541 -0,4227 -0,0986 -0,3679
PROF -0,5791 -0,1057 -0,6848 -08394 -0,0458 -0,08799
LIQ -0,1784 -0,0747 -0,2532 -0,0119 -0,0013 -0,0126
TAX 0,0012 0,0283 0,0296 -0,0007 -0,0003 -0,0011
SIZE 0,0322 0,0658 0,0981 -0,0625 -0,0057 -0,0677
Constant 0,92 0,15 1,08 1,0145 0,134 1,17
R2 0,58 0,21 0,49 0,14 0,02 0,15

50
Table11. The expected signs (total leverage) for the variables according to
trade-off and pecking-order theory and the results obtained in the analyse
Variable
Trade-off
theory
Pecking-
order theory
Whole
sample
Large firms SME
SIC - - -
IR + - + - +
TANG + - - - -
PROF + - - - -
LIQ + - - - -
TAX + + - + -
SIZE + - - + -
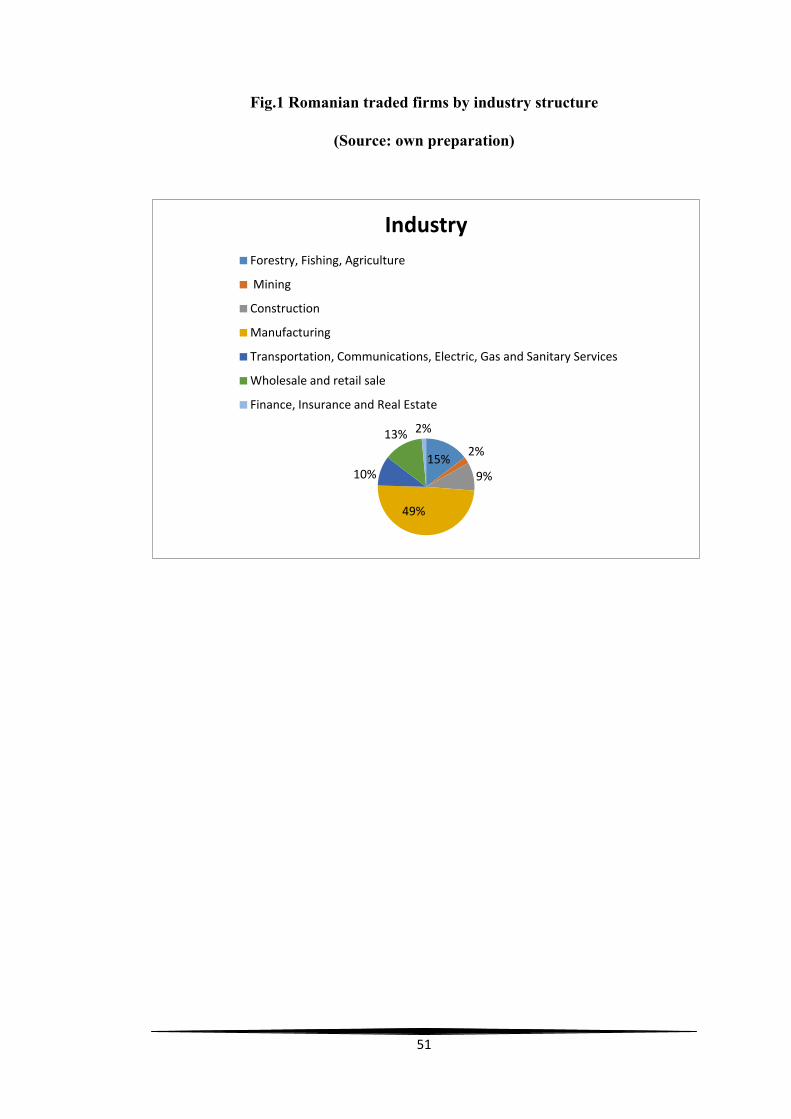
51
Fig.1 Romanian traded firms by industry structure
(Source: own preparation)
15% 2%
9%
49%
10%
13% 2%
Industry Forestry, Fishing, Agriculture
Mining
Construction
Manufacturing
Transportation, Communications, Electric, Gas and Sanitary Services
Wholesale and retail sale
Finance, Insurance and Real Estate
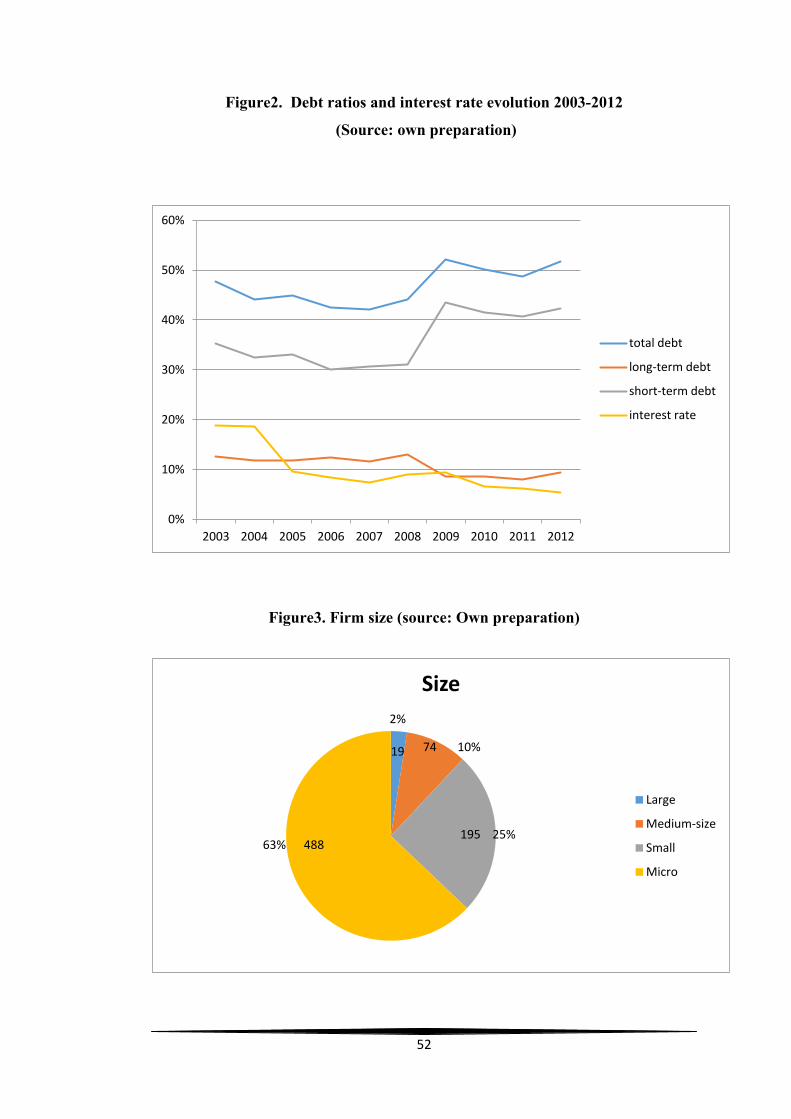
52
Figure2. Debt ratios and interest rate evolution 2003-2012
(Source: own preparation)
Figure3. Firm size (source: Own preparation)
0%
10%
20%
30%
40%
50%
60%
2003 2004 2005 2006 2007 2008 2009 2010 2011 2012
total debt
long-term debt
short-term debt
interest rate
2%
19 74 10%
195 25% 63% 488
Size
Large
Medium-size
Small
Micro
53
1996-2000
Lebenslauf
Grundschule in Rumänien mit Matura 2001-2006
Hauptfächer
2011-2014
Hauptfächer
Wirtschaft Bachelor, Babes-Bolyai Universität Cluj-
Napoca
Ausbildung Schwerpunkt: Controlling
IBW Masterstudium- Universität Wien
Corporate Finance, International Logistics, Market
Entry Strategies, International Economics, International
Financial Management, International Accounting,
Industrial Organisation, Financial Econometrics