master thesis the e ect of co eeshops on school dropouts
TRANSCRIPT

Master Thesis
The effect of Coffeeshops on School Dropouts
Tom Vleeschhouwer
Exam Number: 353341
Email: [email protected]
September 14, 2015
Supervisor: Prof. dr. H.D. Webbink
Department of Economics
Erasmus School of Economics
Erasmus University Rotterdam

Abstract
This thesis investigates the relationship between the prevalence of coffeeshops
and dropout rates of teenage and adolescent students in the Netherlands. As
the distribution of coffeeshops is not random, the distance of the coffeeshop to
the Dutch border is used as an instrument in a 2SLS approach. Two datasets
are used; one with data of intermediate education students (MBO), and one
with high school students. The data on MBO students suggest that no signifi-
cant relationship between coffeeshops and dropout rates exists, while the data
on high school students suggests that it in fact does. This may be due to the
fact that not only soft drug usage, but also the additional effects of coffeeshop
prevalence seem to have a negative effect on school performance.
i

Contents
Abstract i
Table of Contents ii
List of Tables iii
1 Introduction 1
2 Theory and related literature 3
2.1 Soft drugs policies in the Netherlands . . . . . . . . . . . . . . . 3
2.2 The effect of soft drugs on school performance . . . . . . . . . . 4
2.3 Coffeeshops and crime . . . . . . . . . . . . . . . . . . . . . . . 6
2.4 The two channels . . . . . . . . . . . . . . . . . . . . . . . . . . 7
3 Data and Methodology 9
3.1 Data . . . . . . . . . . . . . . . . . . . . . . . . . . . . . . . . . 9
3.2 Empirical Strategy . . . . . . . . . . . . . . . . . . . . . . . . . 12
4 Main estimation results 19
4.1 General results . . . . . . . . . . . . . . . . . . . . . . . . . . . 19
4.2 Estimation results using the absolute number of coffeeshops . . 22
4.3 Comparison: High school students . . . . . . . . . . . . . . . . . 25
5 Conclusion 29
Bibliography 31
ii

List of Tables
1 Summary statistics of total MBO participants and dropouts per
year . . . . . . . . . . . . . . . . . . . . . . . . . . . . . . . . . 12
2 Percentage of average number of dropouts . . . . . . . . . . . . 13
3 Average number of coffeeshops per 10.000 citizens . . . . . . . . 14
4 OLS and 2SLS estimations of equations 1, 2, 3 and 4 . . . . . . 20
5 OLS and 2SLS estimations of equations 1, 8 and 10 . . . . . . . 21
6 OLS and 2SLS estimations of equations 1, 5, 6 and 7 . . . . . . 23
7 OLS and 2SLS estimations of equations 1, 5, 6 and 7 with gender
effect . . . . . . . . . . . . . . . . . . . . . . . . . . . . . . . . . 24
8 Dataset on High School students, proportion of dropouts . . . . 26
9 Estimation results for High school data . . . . . . . . . . . . . . 28
iii

1 Introduction
The Netherlands has a rather liberal policy when it comes to soft drugs, when
compared to other western countries (Spapens et al., 2015). Contrary to the
view taken in most European countries, the Dutch government does not regard
soft drugs use as a criminal issue, but rather as a health issue. Middelburg
(2001) has assessed however, that the supply of soft drugs has been increas-
ingly organised by Amsterdam criminal organisations. Furthermore, since the
implementation of the Schengen Agreement in 1995, drugs tourism from neigh-
bouring countries has increased dramatically (Spapens, 2008); for example:
Maastricht, located close to the border, received 2.7 million foreign coffeeshop
visitors in 2011 (van der Torre et al., 2013). Private use of soft drugs is in
principle prohibited, but not punished, and therefore de facto legal. Contrary
to soft drugs purchase, the large scale purchases of soft drugs for resale by
coffeeshops is enforced, and this leads to an increase in criminal activity sur-
rounding coffeeshops.
Coffeeshops act as a regulatory instrument to guide consumers when con-
suming soft drugs, and aim at making high quality drugs available to con-
sumers, reeling soft drugs usage out of criminal activity (Government, 2015).
This does mean, however, that soft drugs are easily accessible, both for adults
as well as for teenagers, who can gain access to soft drugs through their older,
18+ friends (Harrison et al., 2007). The effect of soft drug use by teenagers
and adolescents on their school performance and social indicators has been
researched widely: literature reviews by Lynskey and Hall (2000), Fergusson
and Horwood (1997) and Townsend et al. (2007) all point to a negative rela-
tionship between drug use and educational attainment. However, the effect of
prevalence of coffeeshops on education has not been researched. Theoretically,
the prevalence of coffeeshops in a city can have multiple effect on teenagers
and adolescents. First, because the wholesale of soft drugs is criminal activity,
1
teenagers and adolescents are more likely to come in contact with criminal
activity, and are therefore more likely to become involved in criminal activ-
ity (Trapman and Verheul, 2014). Second, because soft drugs are more easily
available, soft drugs usage of teenagers and adolescents is more likely to oc-
cur (Lynskey and Hall, 2000). Therefore, it may be that the prevalence of
coffeeshops has a negative effect on the school performance of teenagers and
adolescents. Policy makers currently have no information regarding the effect
of allowing coffeeshops to exist within a city on school performance of children
within their municipality.
This thesis will try to map the effects of the prevalence of coffeeshops in
a city on the dropout rate of schools in that city. Because coffeeshops are
not randomly distributed across the country (and neither are schools), but are
often located in larger cities and close to the border (to attract foreign cus-
tomers), an ordinary regression analysis is not able to identify the causal effect
due to this selection bias. Instead, the random variation of the distance be-
tween a city and the distance to the border can be exploited in an instrumental
variable approach. There appears to be a quadratic relationship between the
distance of a city to the border and the number of coffeeshops in a city. Us-
ing this variation, 2SLS estimation is used to predict the effect of coffeeshops
prevalence on dropout rates. Using data on intermediate education students,
no significant effect can be identified. When comparing the results with high
school students, a significant effect is observed, though: if the coffeeshops per
10.000 citizens ratio increases with one, the proportion of students that drops
out is predicted to increase with 1 percentage point.
In the next section, the literature relating coffeeshops, soft drug use and high
school performance will be surveyed. Also in section 2, the theoretical frame-
work will be discussed, while section 3 will describe the data and the empirical
strategy. Section 4 describes the obtained results, after which a conclusion will
be drawn in section 5.
2

2 Theory and related literature
This section will explain the soft drugs policy of the Netherlands and survey
the literature on coffeeshops, soft drugs usage and education. It will show that
there are two channels through which coffeeshops may influence educational
attainment. The first is through increased availability of soft drugs, which
increases usage of it, and in turn worsens school performance. The second
channel is through criminal activity; the literature suggests that coffeeshops
attract criminal activity, which increases exposure of students to criminal ac-
tivity, causing them to engage in criminal activity themselves, and inducing
them to drop out of school.
2.1 Soft drugs policies in the Netherlands
In the Netherlands, soft drug sale is prohibited, but not prosecuted. The
Opium Law prohibits the sale, ownership and usage of several psychoactive
substances. These substances are mentioned on two separate lists, list I and
list II. List II is colloquially referred to as ‘soft drugs’, and it is these substances
that can be resold by coffeeshops. However, only the possession of no more
than 5 grams of cannabis or the possession of no more than 5 cannabis plants
is not prosecuted. Therefore, in practice, coffeeshops only resell cannabis.
Furthermore, coffeeshops must adhere to the ‘AHOJ-G’-criteria:
• Coffeeshops cannot advertise
• Coffeeshops cannot resell hard drugs
• Coffeeshops cannot cause nuisance
• Coffeeshops cannot sell to minors
• Coffeeshops cannot stock more than 500 grams of soft drugs
Municipalities can decide themselves how many coffeeshops they allow
within their borders (Government, 2015), and they can set further rules next
to the AHOJ-G criteria. Although reselling soft drugs is not prosecuted, pro-
ducing soft drugs is in fact prosecuted.
3

2.2 The effect of soft drugs on school performance
A recent study by the Dutch police, using survey data and crime statistics,
found that in the Netherlands, cannabis use is not higher than in other Euro-
pean countries (Jansen, 2012); 26% of the respondents had ever used cannabis.
However, when specifically looking at the age group 15 to 24 years, about 5%
of this group uses cannabis on a regular basis.
Lynskey and Hall (2000) survey the literature on cannabis use and school per-
formance. They formulate several hypotheses that have been researched in the
literature which could explain a relationship between cannabis use and school
dropout:
• Cannabis use produces an ‘amotivational’ syndrome;
• Cannabis use may produce cognitive deficits;
• Early cannabis use leads to precocious adoption of adult roles.
The literature finds little support for the first hypothesis. Hall et al. (1998)
use standardised performance measures and fail to identify a decline in perfor-
mance due to cannabis use. They then conclude, after reviewing the literature
on this hypothesis, that
“[t]he evidence for an amotivational syndrome among adults is, at
best equivocal. The positive evidence largely consists of case his-
tories, and observational reports. The small number of controlled
field and laboratory studies have not found compelling evidence for
such a syndrome... It nonetheless is reasonable to conclude that
if there is such a syndrome, it is a relatively rare occurrence, even
among heavy, chronic cannabis users.”
As far as the second hypothesis goes, Solowij (1998) has observed adults us-
ing cannabis, and concluded that cognitive deficits do not regularly occur in
4

cannabis users. He did conclude that long-term cannabis users (those using
cannabis on a daily basis for over 10 years) suffer from an impairment of se-
lective attention.
The third hypothesis is tested for example by Fergusson and Horwood
(1997), and they find that cannabis use often occurs in individuals with a dif-
ficult socio-economic background, which can in turn explain a higher dropout
rate in these individuals. However, the context in which cannabis is used and
obtained may also reinforce this effect. Fergusson and Horwood (1997) con-
clude that
“[m]ost of the elevated risk seen among early onset cannabis users
is likely to arise from factors that were antecedent to the deci-
sion to use cannabis, rather than as a consequence of cannabis
use. Nonetheless, early onset usage is not without risks and those
engaging in these behaviours may be more vulnerable to later psy-
chosocial problems as a result of the social context within which
cannabis is used and obtained.”
Fergusson and Horwood (1997) conclude that cannabis use often occurs in
friend groups that reject conventional values, and that socioeconomic factors
alone cannot explain the relationship between cannabis use and dropping out
of school. Bray et al. (2000) find that the use of cannabis makes high school
students 1.4 to 3.9 times more likely to drop out. Mackleod et al. (2004) do
a literature review of 48 studies, and find that most studies find a consistent
relationship between cannabis use and lower educational attainment. They do
note that most studies either suffer from selection biases, small samples, a lack
of controlling for confounders, or a combination of these factors.
5

Townsend et al. (2007) do a literature review as well. They survey 46 em-
pirical studies, and signal the same design issues as Mackleod et al. (2004),
pointing out that most studies fail to identify confounding factors. Never-
theless, they point out that most studies find a negative relationship between
cannabis use and educational attainment.
Harrison et al. (2007) investigate how minors (students aged 14-17 years)
get access to alcohol and cannabis. They conduct a case study where they
analyse survey databases. In these surveys, students were questioned about
drug use and purchase on 39 sites located in Philadelphia, Toronto, Montreal
and Amsterdam. In all cities but Amsterdam, minors often buy drugs or al-
cohol from adults on the street. In Amsterdam however, cannabis is often
obtained through other students at school.
Given what is known in the literature, it seems as if there is sufficient
evidence to conclude that cannabis usage by teenagers and adolescents has a
negative effect on their educational attainment. Criminal activity also seems to
be tied to coffeeshops. The relationship between coffeeshops and educational
attainment is unclear, however. In the subsequent sections, this thesis will try
to identify this effect.
2.3 Coffeeshops and crime
Trapman and Verheul (2014) emphasise the abrasive nature of the Dutch cof-
feeshop policy: on the one hand coffeeshops can ‘legally’ resell soft drugs,
which creates a demand for this product and pulls it out of criminal circuits.
However, when coffeeshops try to restock their inventory, they have to rely on
illegal suppliers, as the legal limit of 5 plants is not enough to supply all cus-
tomers. Trapman and Verheul argue that this creates an even larger criminal
sector, as demand has increased through legalised reselling, and supply can
6

only be increased through illegal activities. A study by Bieleman and Snippe
(1999) found that in Amsterdam, about 25% of the coffeeshops were violating
the rules set by the government; often regulations about stock were violated,
but coffeeshops were also found to have XTC, stolen goods, weapons and coun-
terfeit products present. Huisman et al. (2003) further found that criminals
often meet in coffeeshops. Bieleman and Goeree (2005) further analysed all
Amsterdam coffeeshop owners, and found that 79% of them had a history of
organised crime convictions. In other Dutch cities, Venlo and Enschede, this
percentage was 60% and 76% respectively. A case study of the Dutch city
Enschede found that an extra coffeeshop in a neighbourhood increased the
number of crime reports per 100 households with 0.63 (Galien, 2014). Galien
uses data from the Residential Burglary Database Enschede and regional po-
lice department covering the 2004-2008 period. These datasets contain data
on the number of reported criminal incidents in Enschede, a Dutch city. While
this research fails to control for relevant crime indicators, nor addressing pos-
sible endogeneity in this design, it is one of the few studies which directly tries
to identify the effect of coffeeshops on crime prevalence.
The question rises why the government has not legalised soft drugs usage and
reselling. The Dutch parliament has proposed to do so, however the minister
of Safety and Justice has explained that this is not possible without break-
ing international treaty obligations (Peeperkorn, 2003). It seems that these
conflicting rules maintain the criminal activity surrounding coffeeshops.
2.4 The two channels
Based on the literature, reviewed above, the effect of coffeeshops on educa-
tional attainment is twofold. On the one hand, an increase in the amount of
coffeeshops makes softdrugs easier to buy. This means that adolescents can
get their hands on soft drugs, which increases usage of soft drugs in this age
group. Soft drugs usage decreases school performance (as suggested by Bray
7

et al. (2000), Mackleod et al. (2004) and Townsend et al. (2007)), which should
be observed in the dropout rates. Not only should we expect to see this effect
for 18+ students; the literature seems to suggest that coffeeshop prevalence
also induces a secondary (black) market, where adults buy soft drugs and then
resell these to minors, either on the street or at school (Harrison et al., 2007).
The second channel is through crime rates; the literature suggests that cof-
feeshop owners and those supplying to coffeeshops are often involved in crim-
inal activities (Bieleman and Goeree, 2005). Furthermore, criminals also tend
to meet in coffeeshops (Huisman et al., 2003). This means that those visit-
ing coffeeshops, but also those living near coffeeshops are more easily drawn
into criminal activity themselves. This should then also have an effect on the
dropout rate.
It is difficult to disentangle these effects when the effect of coffeeshops on
dropout rates is investigated in the following sections; there is no data that
indicates which students use soft drugs. It is therefore difficult to distinguish
between soft drugs-related dropouts and criminal behaviour-related dropouts.
8

3 Data and Methodology
3.1 Data
To investigate the effect of the presence of coffeeshops on dropout rates, data
on the location of coffeeshops, the number of dropouts per school and the
distance from the coffeeshops to the Dutch border have been collected. In
this section, this data will be discussed and explored. The location of cof-
feeshops has been collected by the research bureau ’Intraval’, commissioned
by the Dutch ministry of safety and justice (Bieleman et al., 2013). This data
comprehends the number of coffeeshops per municipality, ranging from 1999
to 2012, and has been gathered by approaching each municipality and regis-
tering the number of coffeeshop permit they had given for that year. No data
on 2008 is collected, and data on 2009 have only been collected if municipal-
ity had indicated that they had changed their policy on coffeeshops between
2007 and 2009. Therefore a gap in the data may exist. However, out of all
the 415 municipalities, only 4 of them experienced a change in the number
of coffeeshops between 2007 and 20091. It seems unlikely that a full dataset,
containing data on all municipalities in 2008 and 2009, would yield very differ-
ent results. The distance between a municipality and the closest Dutch border
has been calculated by the Netherlands Bureau for Economic Policy Analysis
(CPB). This dataset also contains data on the type of road connecting the city
to the border, as well as indicators of urbanisation, such as acreage, number of
inhabitants, and population density. Note that the data has been graphically
described in figure 1 (Bieleman et al., 2013). From this data the instruments
distance and distance2 are obtained, as well as the explanatory variable of
interest: the number of coffeeshops.
1These are Amsterdam, Bergen op Zoom, Beverwijk and Breda. All but Amsterdamexperienced a change of 1 shop.
9

Figure 1: Density of coffeeshops per x citizens (Bieleman et al., 2013)
No coffeeshop
1 coffeeshop per x number of citizens> 40.00020.000 - 40.000
10.000 - 20.000
5.000 - 10.000
< 5.000
10
Data on the number of dropouts is published by the Dutch ministry of
education, culture and science. Schools register the number of children in a
certain year, and also keep track of the number that drop out. There are
two datasets available; one dataset contains data of one of the three forms of
intermediate and higher education, MBO schools, while the other one contains
data on dropouts in all forms of secondary education. The data on secondary
education is less informative, as children in secondary education are aged 12
to 18, and are therefore not allowed into coffeeshops. Three types of secondary
education exist: vmbo, havo and vwo. Obtaining a vmbo diploma is the only
diploma that does not lift the obligation to pursue education. Children usually
finish this education at age 16, and then have to continue pursuing education.
Therefore, MBO schools are the only higher education institution that report
dropout rates. Students are usually aged 18 to 22, so that part of the student
can enter a coffeeshop, and the other part cannot. Therefore, for the main
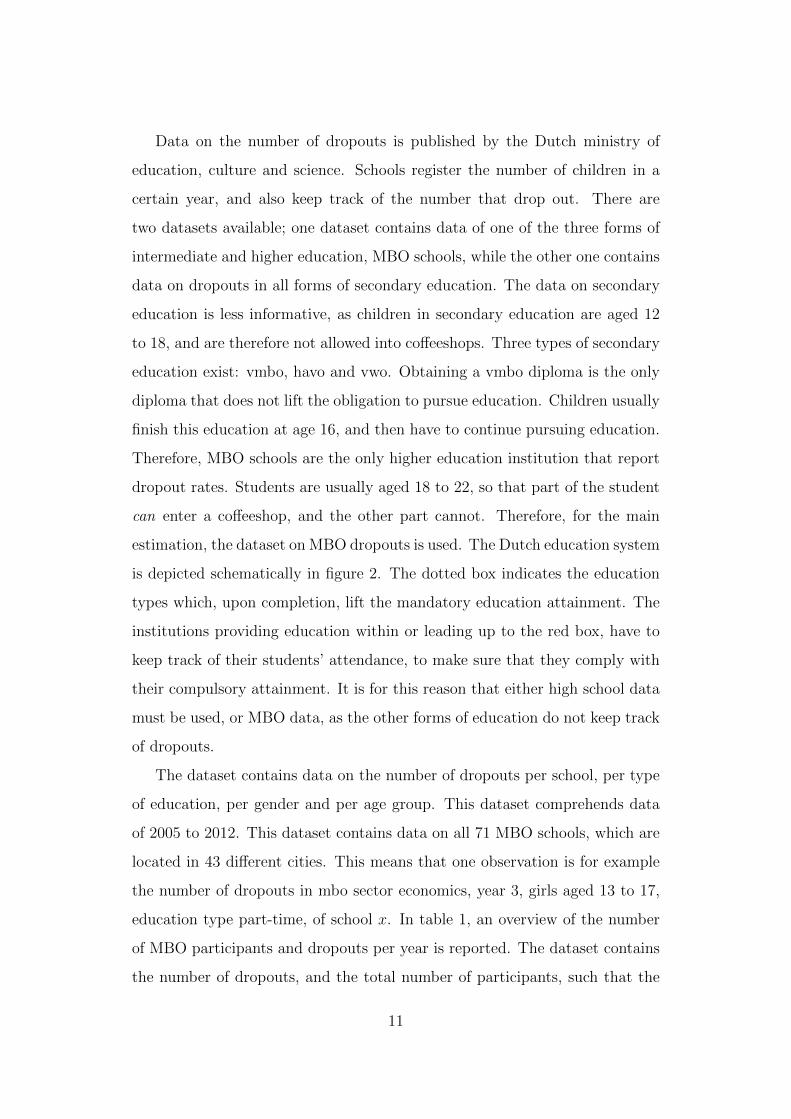
estimation, the dataset on MBO dropouts is used. The Dutch education system
is depicted schematically in figure 2. The dotted box indicates the education
types which, upon completion, lift the mandatory education attainment. The
institutions providing education within or leading up to the red box, have to
keep track of their students’ attendance, to make sure that they comply with
their compulsory attainment. It is for this reason that either high school data
must be used, or MBO data, as the other forms of education do not keep track
of dropouts.
The dataset contains data on the number of dropouts per school, per type
of education, per gender and per age group. This dataset comprehends data
of 2005 to 2012. This dataset contains data on all 71 MBO schools, which are
located in 43 different cities. This means that one observation is for example
the number of dropouts in mbo sector economics, year 3, girls aged 13 to 17,
education type part-time, of school x. In table 1, an overview of the number
of MBO participants and dropouts per year is reported. The dataset contains
the number of dropouts, and the total number of participants, such that the
11

mbo(upper
secondaryvocationaleducation)
hbo(higherprofes-sional
education)
wo(universityeducation)
mavo(lowergeneral
secondaryeducation)
lbo(pre-
vocationalsecondaryeducation)
havo(highergeneral
secondaryeducation)
vwo(pre-
universityeducation)
Figure 2: Schematic chart of the Dutch education system
Table 1: Summary statistics of total MBO participants and dropouts per year
Year Participants Dropouts2005 381,965 39,093 10,23%2006 388,664 38,794 9,98%2007 388,527 37,194 9,57%2008 386,997 33,522 8,66%2009 388,733 33,286 8,56%2010 386,904 32,614 8,31%2011 385,058 30,238 7,85%
outcome variable can be constructed: the proportion of dropouts.
Using the datasets described above, we can thus examine the 2005 to 2012
period. In table 2, the percentage of dropouts is set out against the number
of coffeeshops. In figure 3, a scatterplot of the number of coffeeshops per city
and the number of dropouts is given. Both indicate that there is a positive
correlation between coffeeshops and dropouts.
3.2 Empirical Strategy
We would like to investigate the effect of coffeeshops on the number of dropouts,
using the proportion of dropouts as the outcome variable, and the number of
12

Figure 3: Scatterplot of averagenumber of dropouts per city againstnumber of coffeeshops
Figure 4: Scatterplot of figure 3without Amsterdam, Rotterdamand Utrecht
Table 2: Percentage of average number of dropouts
Number of Percentage Standarddropouts of dropouts deviationNo coffeeshops 8.2% 2.3%1 to 5 11.7% 8.7%6 to 10 8.9% 2.2%
coffeeshops as the explanatory variable of interest. The most straightforward,
OLS estimation would look like equation 1
dikj = β1 + β2ci + β3sector + β4type+ β5year + β6age+ β7province+ εi (1)
Here, d would be the proportion of dropouts of school k in municipality j,
while c would be the number of coffeeshops. The control variables include
age, year of the observation, province, type of education2 and sector of educa-
tion3. This OLS estimation would only hold under the very strong assumption
that coffeeshops locate randomly across the country and between cities. How-
ever, coffeeshops do not exist in Belgium or Germany, countries bordering the
Netherlands, nor do these countries allow the sale of soft drugs. Therefore, cof-
feeshops have an incentive to locate themselves in cities closer to the border,
2There are two types of MBO education: BBL and BOL, where BBL involves workingwhile studying, while BOL does not
3Sectors include for example health, economics and craftmanship
13

as they can attract foreign customers. This would break the OLS assumption
and bias the results.
Therefore, it is better to use an instrumental variable approach, in which ex-
ogenous variation is used to describe the effect of coffeeshops on dropouts.
As mentioned earlier, coffeeshops may want to locate closer to the border to
attract foreign customers. As the location of the border is exogenous, this pro-
vides variation which can be exploited in an instrumental variable analysis. By
using the distance to the border as an instrument, there is exogenous variation
in the location of coffeeshops. The assumption is of course that the distance
to the border is randomly distributed. Furthermore, it is assumed that MBO
schools do not locate themselves based on the distance to the border. Later
on, an extra instrument will be added; Amsterdam has a very large number
of coffeeshops (over 250) compared to other cities. It is likely that this large
amount of coffeeshops is also due to tourism, but this cannot be explained by
its distance to the border. Therefore, a dummy variable indicating whether an
international airport is located near that city is added as an extra instrument.
The assumption is that there is no endogeneity here: coffeeshops locate near
aiport because tourists will visit and buy soft drugs, but it is assumed that
airport do not locate themselves in a specific city because it has a lot of cof-
feeshops. When we look at table 3, we see that in cities with an airport, there
are almost three times more coffeeshops per 10.000 inhabitants than in those
without an airport.
Table 3: Average number of coffeeshops per 10.000 citizens
No airport 0.507Airport 1.150Eindhoven 0.750Rotterdam 0.798Groningen 0.818Maastricht 1.199Amsterdam 3.157
14

It should be noted that it is unclear which explanatory variable should be
used: on the one hand, one could argue that the relative number of coffeeshops
is the most important variable: if a city inhabits relatively more coffeeshops per
citizen, then it is more likely that students will enter such a shop, that they will
encounter the negative effects of soft drugs, and thus drop out. On the other
hand, one could argue that the absolute number of coffeeshops should be used
as independent variable, as having a coffeeshop in a city creates the possibility
of encountering negative effects of soft drugs, and therefore the size of the city
is irrelevant to the number of coffeeshops. In this thesis, both variables will
be used separately; in section 4.1, the relative number of coffeeshops will be
used, while section 4.2 will use the absolute number of variables.
The regression that will be estimated is:
First Stage:
ci = γ1ki + γ2k2i + γ3sector + γ4type+ γ5year + γ6age+ εi (2)
First Stage including airport as instrument:
ci = γ1ki + γ2k2i + γ3airport+ γ4sector + γ5type+ γ6year + γ7age+ εi (3)
Second stage:
dikj = β1ci + β2sector + β3type+ β4year + β5age+ ηi (4)
Here, ci denotes the number of coffeeshops per 10.000 citizens, ki denotes
te distance to the border in kilometers and dikj denotes the proportion of
dropouts of school k at school j in municipality i.
When the absolute number of coffeeshops is used, the estimated equations are
quite alike:
15

First stage:
Ci = γ1ki + γ2k2i + γ3sector + γ4type+ γ5year + γ6age+ εi (5)
First Stage including airport as instrument:
Ci = γ1ki + γ2k2i + γ3airport+ γ4sector + γ5type+ γ6year + γ7age+ εi (6)
Second stage:
dikj = β1Ci + β2sector + β3type+ β4year + β5age+ ηi (7)
Note that everything is the same as in equation 2, 3 and 4, though the absolute
number of coffeeshops is now denoted by Ci.
Apart from these estimation, the effect of coffeeshops on dropouts is also
estimated separately for boys and girls. This requires us to calculate the inter-
action effect between the number of coffeeshops and a gender dummy. How-
ever, the number of coffeeshops is endogenous, while gender is exogenous. This
creates an interaction variable which is partly endogenous. Bun and Harrison
(2014) analyse the occurrence of such effects, and find that in general, instru-
mental variable estimation using 2SLS still gives unbiased estimates when the
interaction term is included as an endogenous variable, while also instrument-
ing for the interaction between the initial instruments and the exogenous part
of the interaction term. Therefore, the two endogenous variables are the num-
ber of coffeeshops, and the number of coffeeshops interacted with gender. The
instruments are distance to the Dutch border and this distance squared (and
the airport dummy), as well as both variables interacted with gender, such
that we end up with 4 instruments. The regression that is estimated changes
too:
16

First stage regression for the number of shops:
ci = γ1ki + γ2k2i + γ3gender + γ4ki × gender + γ5k
2i × gender
(+ δ1airport
+δ2airport× gender)
+ γ6sector + γ7type+ γ8year + γ9age+ γ10province+ εi
(8)
First stage regression for shops × female:
ci × female = γ1ki + γ2k2i + γ3gender + γ4ki × gender + γ5k
2i × gender
(+ δ1airport
+δ2airport× gender) + γ4sector + γ5type+ γ6year + γ7age+ γ8province+ εi
(9)
Second stage:
dikj = β1ci+β2ci × female∧
+β3sector+β4type+β5year+β6age+β7province+ηi
(10)
Figure 5: Scatterplots of # of coffeeshops per 10.000 citizens and distance toborder in meters
(a) With Amsterdam (b) Without Amsterdam
Figures 5a and 5b show the scatterplot for the number of coffeeshops per
10.000 citizens and the distance to the border in meters. We will estimate
the regression with and without Amsterdam, to test whether it is an outlier.
Around 230 coffeeshops are located in Amsterdam, but its distance to the
17

Dutch border seems irrelevant to that number of coffeeshops. It may be that
coffeeshops locate in Amsterdam for (drugs)tourism too, but not because of its
distance to the Dutch border, but because it is visited frequently by tourist that
come in by plane. When we exclude Amsterdam, there seems to be a negative,
quadratic relationship between the distance and the number of coffeeshops.
This implies that the marginal benefit of being located closer to the border is
increasing; being located very closely to the border means attracting a lot of
foreign visitors, but being located further away quickly decreases this benefit,
as other coffeeshops will attract the foreign visitors. Apparently there is some
gray area, where the distance to the border has increased, such that it is less
attractive to locate a coffeeshop there. The larger cities of the Netherlands
are located quite far away from the border, so perhaps there is an incentive to
locate coffeeshops in these cities for touristic reasons as well. The right-hand
side of the parabola could also be explained by the fact that because a lot of
shops locate close to the border, there is a ‘gap’ in the market for customers
located in the north and west of the Netherlands, increasing the benefits for a
coffeeshop to locate there.
As mentioned earlier, there are a lot of observations in the dataset, but
they are far from independent. For example, one observation may be the
number of female dropouts aged 13-17 of school i in 2006, following a medical
type of education in year 2. The next observation may then be the number
of female dropouts aged 13-17 of that same school, also following a medical
type of education, but in year 3. To account for this dependency, the standard
errors will be clustered at school × year level in the next section.
18

4 Main estimation results
4.1 General results
In this section, the results of the analysis using the data described in the pre-
vious section will be reported. Table 4 shows the result of the estimation of
equations 2, 3 and 4. For comparison, the OLS estimation has also been
reported. Under OLS estimation, the proportion of dropouts would increase
with 0.43 percentage points, if the number of coffeeshops per 10.000 citizens
increases with 1. Under 2SLS estimation, this effect is somewhat smaller: an
increase of 0.33 percentage point. When the extra instrument, the dummy
indicating whether airports are near, is added, the effect is somewhat similar:
an increase of 0.37 percentage point. When Amsterdam is excluded, the cal-
culated effect is even negative. None of the estimations show a signifiant effect
for the relation between coffeeshops and dropout rates.
When the effect is estimated separately for 18+ and 18- students, we can see
that for 18+ students, the effect is larger than for 18- students, which is to
be expected: those able to enter coffeeshops would experience more negative
effects from them than those who cannot. However, neither effect differs sig-
nificantly from zero.
When we look at the estimations where the effect is estimated separately for
males and females (estimations 10 through 18 in table 5), we can see that the
effect is somewhat larger for males than for females, as the predicted values are
somewhat higher. However, the effect is still not significantly different from
zero.
19

Table 4: OLS and 2SLS estimations of equations 1, 2, 3 and 4
(1) (2) (3†) (4) (5†) (6) (7†) (8) (9†)OLS 2SLS 2SLS 2SLS 2SLS 2SLS 2SLS 2SLS 2SLS
Excluding Excluding 18-22 yrs 18-22 yrs 13-17 yrs 13-17 yrsAmsterdam Amsterdam
First stage, dependent variable: Coffeeshops per 10.000 citizensDistance 0.00000902∗∗∗ 0.00000354 0.00000528∗∗ 0.00000286 0.00000895∗∗∗ 0.00000360 0.00000907∗∗∗ 0.00000344
(3.85) (1.70) (2.72) (1.51) (3.86) (1.73) (3.78) (1.62)
Distance2 -3.52e-11∗ 9.77e-12 -3.18e-11∗ -8.66e-12 -3.48e-11∗ 9.37e-12 -3.55e-11∗ 1.05e-11(-2.19) (0.59) (-2.50) (-0.69) (-2.18) (0.56) (-2.16) (0.62)
Airport 0.672∗∗∗ 0.351∗∗∗ 0.658∗∗∗ 0.690∗∗∗
(6.90) (8.21) (6.96) (6.76)F-value 9.81 18.15 3.76 33.30 10.14 18.61 9.41 17.47
Dependent variable: Proportion of dropoutsShops per 0.00430 0.00326 0.00367 -0.0156 -0.00463 0.00603 -0.00368 0.00125 0.011910.000 citizens (1.25) (0.28) (0.61) (-0.49) (-0.37) (0.41) (-0.47) (0.08) (1.48)
Constant 0.413∗∗∗ 0.414∗∗∗ 0.413∗∗∗ 0.425∗∗∗ 0.419∗∗∗ 0.512∗∗∗ 0.519∗∗∗ 0.363∗∗∗ 0.355∗∗∗
(39.75) (31.07) (36.29) (19.21) (31.28) (30.85) (36.84) (19.61) (24.17)N 7393 7393 7393 7165 7165 4306 4306 3087 3087
t statistics in parentheses∗ p < 0.05, ∗∗ p < 0.01, ∗∗∗ p < 0.001† These estimations include the extra instrument airport.
Standard errros have been clustered at school × year level.
20

Table 5: OLS and 2SLS estimations of equations 1, 8 and 10
(10) (11) (12†) (13) (14†) (15) (16†) (17) (18†)OLS 2SLS 2SLS 2SLS 2SLS 2SLS 2SLS 2SLS 2SLS
Excluding Excluding 18-22 yrs 18-22 yrs 13-17 yrs 13-17 yrsAmsterdam Amsterdam
First stage, dependent variable: Coffeeshops per 10.000 citizensDistance 0.00000897∗∗∗ 0.00000363 0.00000524∗∗ 0.00000289 0.00000861∗∗∗ 0.00000363 0.00000943∗∗∗ 0.00000362
(3.86) (1.77) (2.72) (1.54) (3.70) (1.78) (4.01) (1.71)
Distance2 -3.51e-11∗ 8.89e-12 -3.09e-11∗ -8.37e-12 -3.25e-11∗ 9.02e-12 -3.85e-11∗ 8.88e-12(-2.23) (0.55) (-2.47) (-0.68) (-2.04) (0.56) (-2.42) (0.53)
Airport 0.672∗∗∗ 0.351∗∗∗ 0.658∗∗∗ 0.690∗∗∗
(6.89) (8.20) (6.96) (6.75)F-value 6.36 10.01 3.79 16.67 7.73 13.77 4.60 8.21
Shops per 0.00661 0.00390 0.00663 -0.0112 -0.00191 0.00906 -0.000207 0.00428 0.015110.000 cit. (1.64) (0.32) (1.03) (-0.35) (-0.15) (0.60) (-0.03) (0.26) (1.71)
Shops × -0.00480 -0.00395 -0.00552 -0.00284 -0.00412 -0.00476 -0.00666 -0.00615 -0.00664female (-1.50) (-0.93) (-1.38) (-0.58) (-0.85) (-0.90) (-1.33) (-0.95) (-1.06)
Constant 0.412∗∗∗ 0.452∗∗∗ 0.451∗∗∗ 0.461∗∗∗ 0.456∗∗∗ 0.511∗∗∗ 0.518∗∗∗ 0.362∗∗∗ 0.355∗∗∗
(39.73) (34.53) (39.89) (21.17) (34.15) (30.81) (36.82) (19.61) (24.17)N 7393 7393 7393 7165 7165 4306 4306 3087 3087
t statistics in parentheses∗ p < 0.05, ∗∗ p < 0.01, ∗∗∗ p < 0.001† These estimations include the extra instrument airport.
Standard errros have been clustered at school × year level.
21

4.2 Estimation results using the absolute number of cof-
feeshops
As mentioned in the previous section, it is not a priori clear which variable
should be chosen as the outcome variable; either the number of coffeeshops
per 10.000 citizens, or the absolute number of coffeeshops. In this section, the
latter will be used for the estimations.
22

Table 6: OLS and 2SLS estimations of equations 1, 5, 6 and 7
(1) (2) (3†) (4) (5†) (6) (7†) (8) (9†)OLS 2SLS 2SLS 2SLS 2SLS 2SLS 2SLS 2SLS 2SLS
Excluding Excluding 18-22 yrs 18-22 yrs 13-17 yrs 13-17 yrsAmsterdam Amsterdam
First stage, dependent variable: number of coffeeshops.Distance 0.000847∗∗∗ 0.000450∗∗∗ 0.000526∗∗∗ 0.000389∗∗∗ 0.000814∗∗∗ 0.000433∗∗∗ 0.000890∗∗∗ 0.000475∗∗∗
(5.86) (3.82) (6.62) (6.51) (5.86) (3.82) (5.79) (3.76)
Distance2 -4.21e-09∗∗∗ -9.50e-10 -3.91e-09∗∗∗ -2.61e-09∗∗∗ -4.03e-09∗∗∗ -8.80e-10 -4.44e-09∗∗∗ -1.04e-09(-4.43) (-0.88) (-6.73) (-6.33) (-4.42) (-0.84) (-4.35) (-0.92)
Airport 48.57∗∗∗ 19.77∗∗∗ 46.85∗∗∗ 50.92∗∗∗
(5.86) (8.51) (5.80) (5.89)F-value 17.51 15.54 23.29 31.21 17.27 15.53 17.63 15.43
Dependent variable: Proportion of dropoutsShops 0.000147∗∗∗ 0.00000868 0.0000480 -0.000193 -0.0000864 0.0000991 -0.0000475 -0.0000265 0.000155
(3.40) (0.05) (0.57) (-0.46) (-0.41) (0.48) (-0.44) (-0.11) (1.37)
Constant 0.414∗∗∗ 0.415∗∗∗ 0.415∗∗∗ 0.418∗∗∗ 0.417∗∗∗ 0.514∗∗∗ 0.517∗∗∗ 0.364∗∗∗ 0.361∗∗∗
(42.34) (39.05) (39.82) (37.94) (38.82) (38.37) (39.89) (25.63) (26.95)N 7975 7393 7393 7165 7165 4306 4306 3087 3087
t statistics in parentheses∗ p < 0.05, ∗∗ p < 0.01, ∗∗∗ p < 0.001† These estimations include the extra instrument airport.
Standard errros have been clustered at school × year level.
23

Table 7: OLS and 2SLS estimations of equations 1, 5, 6 and 7 with gender effect
(10) (11) (12†) (13) (14†) (15) (16†) (17) (18†)OLS 2SLS 2SLS 2SLS 2SLS 2SLS 2SLS 2SLS 2SLS
Excluding Excluding 18-22 yrs 18-22 yrs 13-17 yrs 13-17 yrsAmsterdam Amsterdam
Distance 0.000841∗∗∗ 0.000455∗∗∗ 0.000520∗∗∗ 0.000388∗∗∗ 0.000815∗∗∗ 0.000460∗∗∗ 0.000874∗∗∗ 0.000445∗∗∗
(5.88) (3.92) (6.70) (6.65) (5.83) (4.05) (5.83) (3.64)
Distance2 -4.22e-09∗∗∗ -1.04e-09 -3.85e-09∗∗∗ -2.59e-09∗∗∗ -4.04e-09∗∗∗ -1.09e-09 -4.44e-09∗∗∗ -9.40e-10(-4.51) (-0.99) (-6.82) (-6.48) (-4.41) (-1.06) (-4.52) (-0.85)
Airport 48.56∗∗∗ 19.77∗∗∗ 46.86∗∗∗ 50.89∗∗∗
(5.86) (8.51) (5.80) (5.88)F-value 8.99 9.60 10.49 16.28 8.75 8.70 8.00 8.59
Shops 0.000186∗∗∗ 0.0000414 0.0000886 -0.000130 -0.0000364 0.000135 -0.000000863 0.0000113 0.000197(3.78) (0.24) (0.99) (-0.31) (-0.17) (0.66) (-0.01) (0.05) (1.60)
Shops × female -0.00691∗ -0.00382 -0.00538 -0.00302 -0.00413 -0.00466 -0.00670 -0.00582 -0.00630(-2.23) (-0.90) (-1.34) (-0.62) (-0.85) (-0.89) (-1.34) (-0.90) (-1.00)
Constant 0.414∗∗∗ 0.454∗∗∗ 0.454∗∗∗ 0.456∗∗∗ 0.455∗∗∗ 0.515∗∗∗ 0.518∗∗∗ 0.365∗∗∗ 0.362∗∗∗
(40.39) (43.29) (43.96) (41.91) (42.71) (38.64) (40.28) (25.58) (26.86)N 7975 7393 7393 7165 7165 4306 4306 3087 3087
t statistics in parentheses∗ p < 0.05, ∗∗ p < 0.01, ∗∗∗ p < 0.001† These estimations include the extra instrument airport.
Standard errros have been clustered at school × year level.
24

Note that OLS estimation shows a significant effect: if an extra coffeeshop
is located in a city, the proportion of dropouts would increase with 0.015
percentage point. This is an incredibly small number; in a class of 30 students,
this would lead to 0.00441 students extra dropping out. In a city with 10,000
students, 1.47 students would drop out extra. When we look at the 2SLS
estimations, however, the effects are even smaller and insignificant. When
using airport as an extra instrument, the predicted increase of the proportion
of dropouts is even smaller.
When looking at table 7, OLS estimation would again give a significant result,
with the predicted effect for males being larger than that for females. 2SLS
estimation again shows an insignificant effect for all estimations.
4.3 Comparison: High school students
This thesis has mainly focussed on MBO students, since data on this type of
students is available, and roughly half of them is allowed to enter a coffeeshop,
and thus use soft drugs legally. We have observed however, that there seems
to be a significant relationship between coffeeshops and dropout rates of those
younger than 18 as well. Therefore, it might be interesting to look at the data
of high school students. Since the Dutch system knows 3 types of education,
and normally only the last year of one of these types holds students that
might be 18 or older, we can assume that the vast majority of high school
students is aged below 18, and can therefore not use soft drugs through legal
means. Through a similar estimation as in the previous sections, the effect of
coffeeshops on high school dropout rates will be identified. The dataset used is
provided by Dutch ministry of education, but is less rich than the dataset on
MBO students. It contains data on all Dutch high schools, with the number
of dropouts per type and grade. Table 8 shows a summary of the data.
The model that is calculated is as follows:
25

Table 8: Dataset on High School students, proportion of dropouts
Education type Mean Standard Number ofand grade proportion deviation observationsbrug 1-2 .0099091 .0330232 3788brug 3 .011805 .0568428 450havo 3-5 .0150753 .0453159 17743lwoo 1-2 .0205714 .0366588 2298lwoo 3-4 .0445992 .0428017 2286vmbo 2 .0308765 .0481243 192vmbo 3-4 .0349506 .0514148 3225vwo 3-6 .0074849 .0300562 20158Total .0145409 .0402178 50140
First stage:
ci = γ0 + γ1ki + γ2k2i
(+ γ3airport
)+ γ4type+ γ5profile
4 + εi (11)
Second stage:
di = β0 + β1ci + β2type+ β3profile+ ηi (12)
Here, ki is again the distance to the border in kilometers, ci is the number of
coffeeshops per 10.000 citizens, airport is a dummy with value 1 if an airport
is located near the city, type indicates the type and grade of the students,
as displayed in table 8. di indicates the proportion of dropouts. As in the
previous section, the estimations are repeated with the absolute number of
coffeeshops as the outcome variable, such that we estimate:
Ci = γ0 + γ1ki + γ2k2i
(+ γ3airport
)+ γ4type+ γ5profile+ εi (13)
Second stage:
di = β0 + β1Ci + β2type+ β3profile+ ηi (14)
4Students in grade 4 and 5 of havo and 4, 5 and 6 of vwo choose a profile; a combinationof courses geared towards the same subject; there are two profiles geared towards socialsciences (CM and EM) and two profiles geared towards natural sciences (NT and NG)
26

Now, Ci again denotes the absolute number of coffeeshops. We should ex-
pect to see results somewhat similar to the result of MBO students aged 13
to 17, as these students are not allowed to enter coffeeshops, as are almost all
high school students. Table 9 shows the estimation results for the above four
equations. Surprisingly, both the OLS and 2SLS estimations show a signifi-
cant effect of an increase in the number of coffeeshops on the proportion of
dropouts. While OLS predicts an increase of 0.5 percentage points if the num-
ber of shops per 10.000 citizens increases with one, 2SLS predicts an increase
of 0.1 percentage point. Adding airport as an instrument decreases the esti-
mation somewhat, while excluding Amsterdam does not change the estimation
much. When looking at the other explanatory variable, the absolute number
of shops, a similar image exists. OLS estimation predicts an increase in the
proportion of dropouts of 0.007 percentage point, while 2SLS predicts a 0.002
percentage point increase. Adding Airport as an extra instrument decreases
the estimation somewhat, while excluding Amsterdam does not change the
predictions much. It is interesting to note that using the high school dataset
produces significant predictions for the effect of coffeeshops on dropout rates,
while the MBO dataset does not. Both predictions are small, however, so the
fact that the second datasets predictions are significant could be due to the
fact that this dataset contains more observations.
27

Table 9: Estimation results for High school data
(1) (2) (3†) (4) (5†)OLS 2SLS 2SLS 2SLS 2SLS
Excluding ExcludingAmsterdam Amsterdam
First stage; dependent variable: Coffeeshops per 10.000 citizensDistance 0.00000702∗∗∗ 0.000000427 0.00000380∗∗∗ 0.00000212∗
(4.46) (0.31) (3.65) (2.18)
Distance2 1.24e-11 4.55e-11∗∗∗ -3.51e-11∗∗∗ -1.77e-11∗
(0.85) (3.82) (-4.64) (-2.46)
Airport 1.593∗∗∗ 0.518∗∗∗
(25.45) (26.30)
F-value 84.00 250.71 16.68 321.76
Second stage; dependent variable: Proportion of dropoutsShops per 0.00508∗∗∗ 0.0104∗∗∗ 0.00605∗∗∗ 0.00917∗ 0.00715∗∗∗
10.000 cit. (6.27) (7.60) (6.59) (2.34) (5.81)
Constant 0.00414∗∗ 0.000170 0.00341∗ 0.00189 0.00334∗
(2.87) (0.10) (2.30) (0.60) (2.07)N 20721 20721 20721 19470 19470
(6) (7) (8†) (9) (10†)OLS 2SLS 2SLS 2SLS 2SLS
First stage; dependent variable: Number of coffeeshopsDistance 0.000814∗∗∗ 0.000312∗∗ 0.000555∗∗∗ 0.000454∗∗∗
(7.85) (3.26) (13.97) (13.54)
Distance2 -4.43e-10 2.08e-09∗ -4.27e-09∗∗∗ -3.22e-09∗∗∗
(-0.42) (2.42) (-14.32) (-13.28)
Airport 121.5∗∗∗ 31.34∗∗∗
(23.13) (22.37)F-value 155.40 265.38 104.07 251.93
Second stage; dependent variable: Proportion of dropoutsShops 0.0000693∗∗∗ 0.000119∗∗∗ 0.0000790∗∗∗ 0.000212∗∗∗ 0.000136∗∗∗
(5.59) (7.87) (6.70) (5.61) (7.18)
Constant -4.531∗∗∗ -4.547∗∗∗ -4.539∗∗∗ -4.582∗∗∗ -4.569∗∗∗
(-93.74) (-92.94) (-93.58) (-89.05) (-91.98)N 21177 20721 20721 19470 19470
t statistics in parentheses∗ p < 0.05, ∗∗ p < 0.01, ∗∗∗ p < 0.001† These estimations include the extra instrument airport.
Standard errros have been clustered at school × year level.
28

5 Conclusion
This thesis has started out by investigating the existence of coffeeshops in the
Netherlands. The literature concerning the effect of soft drugs on school per-
formance was surveyed, as well as the literature on coffeeshops and criminal
activity. These two subjects were also identified as the mechanisms through
which coffeeshops could have an effect on the number of dropouts; on the
one hand, an increase in the number of coffeeshops increases soft drugs usage,
which in turn decreases school performance, and as such would lead to an
increased number of dropouts. The second effect is that of increased crimi-
nal activity in a neighbourhood harbouring coffeeshops. Through an increase
of criminal activity, students can engage in criminal activity themselves, and
therefore have a higher probability of dropping out.
To formally investigate the hypothesised effect of coffeeshops on dropouts,
a dataset containing dropout rates of all MBO schools of the Netherlands was
retrieved from the ministry of education. Furthermore, a dataset made by
the Netherlands Bureau for Economic Policy Analysis containing data on the
distance to the border of each city was retrieved. This dataset also contained
other demographic variables per city, such as the number of citizens. These
datasets were merged to investigate the relationship between the number of
coffeeshops per 10.000 citizens, and the number of dropouts. To properly
identify the effect, the distance of the city to the border was used as an in-
strument, as the variation in distance to the border is thought to be exogenous.
While using the dataset on MBO students, very small increases or decreases
in the proportion of dropouts were found; none of them being significant. Us-
ing the absolute number of coffeeshops did not change this fact. Using an extra
instrument (airport) did not change the predictions either. Based on the anal-
ysis of this dataset, one would conclude that there is no significant relationship
29

between the number of coffeeshops and the proportion of dropouts. However,
while running the same analysis with a dataset containing data on high school
students, significant increases in the number of dropouts were found. In fact,
increasing the number of coffeeshops per 10.000 citizens with one led to a
predicted increase of the proportion of dropouts with 0.1 percentage point.
Increasing the absolute number of coffeeshop should increase the proportion
of dropouts with 0.0015 percentage point.
These results should be interpreted with caution, however. As shown in
all predictions, OLS estimation led to larger and significant results than 2SLS
estimations did. OLS is however not suited to calculate the effect, as argued
in section 3. The 2SLS approach used the distance to the border as an in-
strument to provide exogenous variation in the number of coffeeshops. This
instrument is somewhat weak, though. Given the circumstances this was one
of the few options to provide exogenous variation, yet it may have biased the
results. Furthermore, data on the number of coffeeshops in 2009 was not avail-
able. Even though the number of coffeeshops per municipality had changed
very little between 2008 and 2010, this may have caused a bias as well.
In conclusion, it appears that coffeeshops may have a negative effect on
school performance. The analysis suggest that high school students may expe-
rience negative effects from the presence of coffeeshops. It is difficult to assess
whether the identified effect is due to high school students indeed experiencing
more negative effects, or due to their dataset being larger. Furthermore, this
thesis has not been able to identify the exact channel through which adults
and minors are affected, because the data that was available did not include
any information on the reason of dropping out of school. Further research,
with a micro level design, would be needed to be conclusive about the effects
of coffeeshops.
30

References
Bieleman, B. and Goeree, P. (2005). Coffeeshops in Nederland 2004; aantallen
coffeeshops en gemeentelijk beleid 1999-2004. Groningen-Rotterdam/Den
Haag: St. Intraval/WODC.
Bieleman, B., Nijkamp, R., Reimer, J., and Haaijer, M. (2013). Coffeeshops
in nederland 2012. Intraval Onderzoek en Advies.
Bieleman, B. and Snippe, J. (1999). Gedogen gewogen; evaluatie van het Am-
sterdamse coffeeshopbeleid. Groningen-Rotterdam: St. Intraval.
Bray, J., Zarkin, G., Ringwalt, C., and Qi, J. (2000). The relationship between
marijuna initation and dropping out of high school. Health Economics, 9:9–
18.
Bun, M. and Harrison, T. (2014). Ols and iv estimation of regression mod-
els including endogenous interaction terms. UVA Econometrics Discussion
Paper, 2014/02.
Fergusson, D. and Horwood, L. (1997). Early onset cannabis useand psychoso-
cial adjustment in young adults. Addiction, 92:279–296.
Galien, M.-J. v. d. (2014). Criminaliteit en overlast rondom drugsgerelateerde
plaatsen. http://purl.utwente.nl/essays/65908.
Government, D. (2015). Gedoogbeleid softdrugs en coffeeshops.
Hall, W., Solowij, N., and Lemon, J. (1998). The Health and Psychological
Consequences of Cannabis Use. Canberra: Commonwealth Department of
Human Services and Health.
Harrison, L., Erickson, P., Korf, D., Brochu, S., and Benschop, A. (2007).
How much for a dime bag? an exploration of youth drug markets. Drug and
Alcohol Dependence, 90(Supplement 1):S27–S39.
31

Huisman, W., Huikeshoven, M., van de Bunt, H., and van Wijk, J. (2003).
De zwakste schakel; criminaliteitsanalyse. Amsterdam: Politie Amsterdam-
Amstelland.
Jansen, F. (2012). Georganiseerde hennepteelt; criminaliteitsbeeldanalyse
2012. KLPD - Dienst Nationale Recherche.
Lynskey, M. and Hall, W. (2000). The effects of adolescent cannabis use on
education attainment: a review. Addiction, 95(11):11621–1630.
Mackleod, J., Oakes, R., Copello, A., I. Crome, M. E., Hickman, M., Op-
penkowski, T., Stokes-Lampard, H., and Smith, G. (2004). Psychological
and social sequelae of cannabis and other illicit drug use by young people:
a systematic review of longitudinal, general population studies. The Lancet,
363:1579–1588.
Middelburg, B. (2001). De Godmother. Amsterdam: Uitgeverij LJ Veen.
Peeperkorn, M. (2003). Kamer voor legaliseren softdrugs. Volkskrant, January
31st.
Solowij, N. (1998). Long-term effects of cannabis on the central nervous system.
Toronto, Addiction Research Foundation.
Spapens, T. (2008). Georganiseerde misdaad en strafrechtelijke samenwerking
in Nederlandse grensgebieden. Antwerp/Oxford: Intersentia.
Spapens, T., Muller, T., and van de Bunt, H. (2015). The dutch drug policy
from a regulatory perspective. European Journal on Criminal Policy and
Research Impact, 21:191–205.
Townsend, L., Flisher, A. J., and King, G. (2007). A systematic review of the
relationship between high school dropout and substance use. Clinical Child
and Family Psychology, 10(4):295–317.
32

Trapman, L. and Verheul, E. (2014). Gevangen bij de achterdeur? Ars Aequi,
63(12):887.
van der Torre, E., Holvast, R., Keijzer, D., Beke, B., and Bik, J. (2013). Het
Nieuwe Coffeeshopbeleid. Apeldoorn: Politieacademie.
33