master thesis enterprise risk management: the effect on
TRANSCRIPT
Master Thesis
Enterprise Risk Management: the effect on internal control quality.
Name: Rick Strengnaerts
Student number: 454104RS
Program: Accounting, Auditing & Control
Track: Accounting and Control
Date: 18-6-2017
Table of Contents
Abstract ........................................................................................................................................................ 1
Acknowledgement ....................................................................................................................................... 2
1. Introduction and Contribution .......................................................................................................... 3
2. Prior literature and hypothesis development ................................................................................... 6
2.1 Literature on determinants of ERM adoption ............................................................................... 7
2.2 Literature on implications of ERM ............................................................................................... 7
2.3 Hypothesis development ............................................................................................................. 10
3. Methodology ...................................................................................................................................... 13
3.1 Variable motivation and research design .................................................................................... 13
3.2 Sample selection ......................................................................................................................... 20
4. Results ................................................................................................................................................ 23
4.1 Descriptive statistics ................................................................................................................... 23
4.2 Pearson and Spearman correlation .............................................................................................. 27
4.3 Regression analyses .................................................................................................................... 29
4.4 Robustness check ........................................................................................................................ 34
5. Discussion and Conclusion ............................................................................................................... 40
5.1 Conclusion .................................................................................................................................. 40
5.2 Limitations .................................................................................................................................. 41
5.3 Future research ............................................................................................................................ 42
6. References .......................................................................................................................................... 44
Appendix A: Libby box .............................................................................................................................. 48
Appendix B: Descriptive statistics on search string .................................................................................... 49
1
Abstract
Enterprise risk management (ERM) is a holistic risk management approach. Prior
literature has largely focused on the value enhancing effect of ERM (Kraus and Lehner, 2012).
In this study I will make an attempt to prove the positive relation between ERM and internal
control quality. I use the existence of both a Chief Risk Officer (CRO) and a risk committee as a
proxy for ERM. Using a sample of 13,682 firm year observations of firms located in the United
States, I observe 511 firms with a hypothesized ERM framework. The majority of the firms with
a hypothesized ERM framework operate in the financial services industry. For this reason I
perform additional analyses, both on the sample consisting of only financial firms and the sample
of only non-financial firms. I investigate the relation of ERM on both the amount of material
weaknesses and the amount audit fees by performing an OLS regression. The results of the
regression analysis show there is no relation between ERM and material weaknesses. Next, the
results of the regression analysis on the relation between ERM and audit fees are inconsistent
among the different samples and not robust. For these reasons I conclude there is no relation
between ERM and internal control quality.

2
Acknowledgement
I would like to thank several people for their support and guidance. Without them
completing this Master Thesis would not have been possible. A special thanks to my coach Dr.
Sander Renes for providing me with professional feedback and guidance in such a timely
manner. Also, I would like to thank my family and friends for their help and constant support.
3
1. Introduction and Contribution
In recent years, Enterprise Risk Management (ERM1) has become an increasingly
popular issue amongst firms and media outlets; however, limited academic literature currently
exists (Liebenberg and Hoyt, 2003; Pagach and War, 2010). In 2004 the Committee of
Sponsoring Organizations of the Treadway Commission (COSO), introduced the Enterprise Risk
Management-Integrated Framework stating the various implications of ERM for organizations.
ERM provides a more integrated approach for risk management where it assesses which risks
should be mitigated and which should be accepted according to the firm’s risk appetite and
strategy. In this paper I will answer the following research question:
Does the existence of an ERM framework improve internal control?
To examine the relation between ERM and internal control quality I am studying cross-
sectional differences in the amount of material weaknesses and the amount of audit fees for firms
in the United States. Firstly, I hypothesize a positive relation between ERM and internal control
quality. Internal control quality is measured by the amount of material weaknesses, hence I
expect a negative relation between ERM and the amount of material weaknesses. Secondly, I
hypothesize a negative relation between ERM and audit fees. I extract data from the Compustat,
Audit Analytics and Capital IQ database to construct the sample I use in this study.
To identify ERM framework I use both the presence of a Chief Risk Officer (CRO) and a
risk committee, as a proxy for ERM (e.g. Beasley, Clune and Hermanson, 2005). By means of
search strings, I identify hypothesized ERM activity. The final sample comprises of 13,662 firm
year observations, of which 510 firm year observations have an identified ERM framework. The
observations of firms with an ERM framework are largely clustered in the financial sector and,
for this reason, I perform additional separate analyses on the financial and non-financial samples.
First, the results of the OLS regression used to identify the relation between ERM and the
amount of reported material weaknesses presents no significant coefficient for the ERM variable.
This means for the sample I used there is no significant relation between ERM and the amount of
material weaknesses. In the separate analyses where I study a sample of financial firms I again
1 ERM is an acronym for integrated risk management, holistic risk management, enterprise-wide risk management,
and strategic risk management. Throughout this paper I will use ERM for consistency (Hoyt and Liebenberg, 2011).
4
find no significant coefficient for the ERM variable. For the regression using a sample of non-
financial firms I find a significant negative coefficient for the ERM variable, meaning for the
sample of non-financial firms there is a significant negative relation. The relation is in
accordance to my hypothesis stating that ERM positively affect internal control quality.
However, due to the limited number of non-financial firms reporting material weaknesses, this
result should be interpreted with caution.
Secondly, I study the relation between ERM and audit fees. I find a negative significant
relation between ERM and audit fees. This is in accordance to my second hypothesis, where I
state a negative relation between ERM and audit fees. Again, I perform a separate analysis where
I study a sample using only financial firms and a separate analysis using a sample of non-
financial firms. For the sample of financial firms I find no significant relation between ERM and
audit fees. For the sample of non-financial firms I find a weak significant positive relation
between ERM and audit fees. This means, for the sample of non-financial firms, ERM is
expected to increase the amount of audit fees. This result is against the hypothesized relation
where ERM decreases the amount of audit fees. Due to the inconsistency in my results regarding
the relation between ERM and audit fees the negative relation between ERM and audit fees has
to be interpreted with caution.
Additionally, I perform a series of robustness checks where I determine if my regression
results are robust. I, for instance, check if the manipulations I made to the data do not
significantly harm the results. The regression results specifying the relation between ERM and
internal control quality are robust to changes. The regression results specifying the relation
between ERM and audit fees are not robust to changes.
In prior empirical literature various determinants and implications of ERM have been
studied and documented. Baxter, Bedard, Hoitash and Yezegel (2013), for instance, find that
firms with high-quality ERM programs perform better and have a greater market valuation.
However, there is a lack of empirical literature studying the relation between ERM and internal
control quality. Since ERM is hypothesized to increase the audit committee’s effort in
monitoring the internal control I expect a positive relation between ERM and internal control
quality (Krishnan, 2005).
This paper contributes to the existing literature by adding more evidence to the study of
the implications of ERM. The ERM literature in still in an early stage of development where

5
additional research in required. Secondly, I study the relation between ERM and internal control
quality, an implication of ERM that until now has not been investigated. Thirdly, prior ERM
literature has mostly focused on the financial industry, since ERM is more common in this
industry; however, I study the effects of ERM on the whole industry including non-financial
firms. This is valuable information for studies that investigate loosely the financial industry due
to data availability and try to make a general statement about these results.
Although further research is required to make a definite statement about the relation
between ERM and internal control quality, this is a first indication that ERM has no potentially
beneficial effect on the internal control quality. With the increasing media attention and the
amount of firms embracing ERM, empirical results on establishing what the potential benefits
are is important. In the next section I will present the prior literature and hypothesis
development.
6
2. Prior literature and hypothesis development
The adoption of Section 404 of the SOX act of 2002 (Sarbanes Oxley Act, 2002),
mandated the identification of material weaknesses in financial statements and sparked the
interest of firms towards ERM developed (McShane, Nair and Rustambekov, 2011). In 2004, the
COSO released the Enterprise Risk Management-Integrated Framework, which elaborates on an
ERM approach. COSO (2004, p.12) defines ERM as follows:
“Enterprise risk management is a process, effected by an entity’s board of
directors, management and other personnel, applied in strategy setting and
across the enterprise, designed to identify potential events that may affect
the entity, and manage risk to be within its risk appetite, to provide
reasonable assurance regarding the achievement of the entity objectives.”
It further provides a guideline for management when implementing an ERM framework.
It guides management to effectively deal with the uncertainties, aids in determining the level of
uncertainties a firm faces, recognizes that uncertainty presents both risks and opportunities, and
provides guidance in the challenge firms face in determining how much uncertainty they should
accept. The main purpose of COSO Enterprise Risk Management-Integrated Framework (2004)
is to help management achieve companies’ strategic, operational, reporting, and compliance
objectives. Although, COSO (2004) does not make ERM mandatory, it did create public pressure
for a more systematic risk management system (Liebenberg and Hoyt, 2003).
COSO (2004) further explains that ERM incorporates and deals with enterprise-wide
risks by combining both current and aggregated information from internal and external sources
of risk. This information is then included in a risk portfolio containing risks across all
departments that is used for the recognition of interrelated impacts of risks, which facilitates a
more effective response to risks. Aside from this, ERM is involved in the alignment of a firm’s
risk appetite in the context of its business strategy (COSO, 2004). For example, if a car
manufacturer’s strategy involves supplying the market with high-end quality cars, then the risk a
firm faces regarding its labor recruitment of mechanics should be aligned with the appropriate
quality of mechanics.
7
2.1 Literature on determinants of ERM adoption
The empirical literature on ERM is two-fold with one field of research reflecting the
factors associated with ERM adoption and the other focusing on the implications of ERM
adoption (Baxter et al., 2013).
Liebenberg and Hoyt (2003) are among the first academics to investigate the different
determinants of ERM using the appointment of a CRO as a proxy for ERM. They state the main
responsibility of a CRO is the implementation and coordination of ERM, although an additional
important task involves the communication of risk management objectives and strategy to
outside stakeholders. In their study, Liebenberg and Hoyt (2003) test if different firm
characteristics have a relation to ERM adoption, including earning volatility, stock price
volatility, leverage and market-to-book ratio. The only significant relation of those variables to
ERM adoption is the positive relation between leverage and ERM, meaning more leveraged
firms, ceteris paribus, are more likely to adopt an ERM framework.
Beasley et al. (2005) also investigate the implementation of ERM by analyzing survey
data from a group of 123 firms. By surveying chief audit executives, they constructed a five-
point scale of ERM implementation, ranging from 1 if no ERM plans exist for implementation to
5 if an ERM implementation was complete. Beasley et al. (2005), test the effect of different
corporate governance and other firm characteristics on ERM implementation. They conclude that
having a Big Four auditor firm, more independent board members and an appointed CRO has a
positive influence on the implementation stage of ERM. The positive significant effect of an
appointed CRO on the stage of ERM implementation is especially valuable evidence to justify
using the presence of a CRO as a proxy for ERM.
2.2 Literature on implications of ERM
Besides the determinant of ERM adoption, the majority and more recent empirical
literature focuses on the implications of ERM, and especially the effects on shareholder value.
Kraus and Lehner’s (2012) literature review of 25 articles compares the results of different
studies on the relation of ERM on shareholder value, showing that this relation differs greatly
between articles. Kraus and Lehner (2012) conclude that there is a lack of knowledge regarding

8
the value enhancing effect of ERM on making a possible general statement. They additionally
state that ERM literature regarding value creation is in a pre-paradigm state2 (Kuhn, 1963).
Pagach and War (2010), studied the effect of ERM on firm performance, by performing a
time series analysis. They note that the benefits of ERM are dependent on a firm’s exposure to
lower tail risks. Pagach and War (2010) compare firms before and after the appointment of a
CRO regarding various key firm variables such as leverage, size, research & development
(R&D) expenditure, market-to-book ratio, ROE, and others. Surprisingly, when comparing the
averages over two years prior and two years after CRO appointment, Pagach and War (2010)
find a small and significant increase in leverage to be the only significant result. Stulz (1996,
2003) hypothesizes that ERM is only beneficial for firms that face lower tail risk; therefore,
Pagach and War (2010) reduce the sample to firms who are hypothesized to benefit from ERM
adoption, measured by a positive cumulative abnormal returns around the announcement of the
CRO appointment. Using this sample, Pagach and War (2010) find a significant reduction in
earnings volatility as being the only beneficial change for firms when compared pre- and post-
CRO appointment data. They considered that the result could be explained by the fact that ERM
takes an extended period of time before its benefits are observable or too much noise exists in the
data. Additionally, Pagach and War’s (2010) hypothesis that the limited evidence found
regarding increased firm performance could be explained by the fact that ERM has no significant
effect on firm performance, at least as measures by financial statement items. They therefore
stress the importance of not only providing guidance for ERM implementation, but also
examining proper metrics to test the benefits of ERM adoption and especially the effect of ERM
adoption in the longer term (Pagach and War, 2010).
Since 2007, Standard & Poor’s (S&P) included an ERM rating as a component of its risk
management rating of insurance companies by assessing the risk management culture, systems,
processes, and practice. This rating has become another common measure of ERM (e.g.
McShane et al., 2011; Seik, Yu and Li, 2011; Baxter et al., 2013). The S&P ERM rating
2 The pre-paradigm state, as explained by Kuhn (1963) entails a state with lack on census, as he refers to it as an
‘immature science’. For the ERM literature, to Kraus and Lehner (2012, p.2), this entails “the mentioned
quantitative approaches are too early and may miss some important mediator and moderator variables (Edmondson
and Mcmanus, 2007)”.
9
distinguishes between different qualities of ERM, which makes it possible to study the effects of
an increase in ERM quality, rather than comparing firm’s implementation, or lack of, ERM.3
Baxter et al. (2013) investigate both the determinants as the implications of ERM quality
by using this S&P ERM rating. First, they test if different company characteristics are associated
with variations in ERM quality. The researchers concluded that size and complexity are positive
determinants of ERM quality. Moreover, they found that leverage is negatively related to ERM,
providing evidence supporting the argument that less distressed firms have more available
resources to invest in high-quality ERM. This stands in contrast to the theory that argues firms
with more financial distress are in demand of a higher ERM quality in order to decrease the risk
associated with this distress (e.g. Liebenberg and Hoyt, 2003). Secondly, Baxter et al. (2013),
test different implications associated with ERM quality, including firm value and performance.
Here, they find a positive significant result for both firm value and performance, and they test if
a higher ERM quality results in a greater market reaction to earnings surprises. Measured by the
earnings response coefficient, they argue that firms with a high-quality ERM framework should
have more persistent earnings, and thus greater earnings credibility (Baxter et al., 2013). They
find a positive significant relation, concluding that investors perceive earnings to be more
credible for firms with a higher ERM quality.
McShane et al. (2011), studied the relation of ERM on firm value using a sample of firms
with an identified S&P ERM rating. They found that an increase in the ERM quality is expected
to be associated with a positive significant increase in firm value. However, McShane et al.
(2011) hypothesize the first three of five S&P rating categories of ERM to measure Traditional
Risk Management (TRM)4 and the top two S&P rating categories of ERM to measure ERM.
They separates the S&P ERM ratings in TRM and ERM and study the effect on firm value,
finding no significant relation for the top two ratings measuring ERM quality, concluding the
significant increase in firm value initially found is expected to be the result of an increase in
TRM.
3 Although it would be interesting to study ERM using the S&P ERM rating, this data is currently unavailable to
students of the Erasmus School of Economics.
4 TRM’s view on risk management largely entails minimizing risk exposure by means of hedging and decreasing the
expected costs related to tax payments, financial distress, underinvestment, asymmetric information, and
undiversifiable stakeholders (McShane et al., 2011).

10
Additionally, Ellul and Yerramilli (2013) studied the implications of ERM adoption by
performing a cross-sectional analysis exploring what contributed to the large cross-sectional
differences in the risk-taking behavior among banks during the Financial Crisis. Ellul and
Yerramilli (2013) hypothesize that these differences are due to the specific characteristics of risk
management. By constructing their own risk management index, they study the effects of risk
management in the year prior to the crisis, 2006, on the risk exposure during the crisis, 2007 and
2008. Their risk management index is composed of three indicator variables to measure the
importance of a CRO within a firm and two indicator variables measuring the quality of risk
oversight of the risk committees. For example, they use variable CRO-Top5, indicating if the
CRO is amongst the top five highest paid executives. Using this risk management index, Ellul
and Yerramilli (2013) identify the effects of risk management on different risk measures,
concluding that firms with stronger risk management in the prior crisis years had a lower level of
risk exposure during crisis years.
There are multiple empirical studies investigating the effects of ERM on value creation,
albeit with mixed results (Pagach and War, 2010; Hoyt and Liebenberg, 2011; McShane et al.,
2011; Baxter et al., 2013). Few empirical studies focus on internal control. In this study, I will
investigate the effect of ERM on internal control and audit fees. In the next section, I will explain
the theory behind the relation of ERM to internal control and audit fees.
2.3 Hypothesis development
In previous ERM literature, little attention has been devoted to the effects of ERM on
internal control quality. ERM and internal control are inherently connected, as ERM is
commonly built upon and strengthens the internal control framework (COSO, 1992, 2004). Risk
management, in general, involves identifying a firm’s threats and opportunities and internal
control help in countering these threats and seizing these opportunities.
In this regard, a common approach to ERM is to create a risk committee. This stand-
alone committee is fully in charge of risk oversight and the communication of risk appetite to
stakeholders. A risk committee differs from an audit committee whose responsibility regarding
risk management mainly involves compliance with law and regulation and informal strategic
decision making (McKinsey & Company, 2012). As a firm’s risk management evolves to an

11
ERM approach where risk aggregation5 becomes part of risk management, firms upgrade the
mindset and capabilities of the audit committee by growing its mandate to a full-risk committee
or establishing a separate risk committee. The internal control quality benefits from ERM,
because a risk committee takes over the responsibility of risk management. By relieving the audit
committee from the responsibility of risk management the effectiveness of the audit committee
in monitoring the internal control quality of a company increases. Krishnan (2005) studied the
relation between audit committee quality and internal control quality and concluded that audit
committee quality significantly benefits internal control quality.
Additionally, McShane et al. (2011) indicate the differences between ERM and TRM6 by
stating that the fundamental concept of ERM is the aggregation of risks into a risk portfolio. The
approach used by TRM where each risk is individually hedged is commonly referred to as a silo-
based approach to risk management, whereas the approach used by ERM is referred to as a
holistic approach. The holistic approach of ERM is described in COSO (2004) as follows: First
the different risks each different business unit or department faces are considered by their
respective manager. These different risks are put together in a risk portfolio which gives an
overview of all the different risks a firm faces. With the risk portfolio of all the risks for each
business unit, senior management then determines the firm’s risk residual7. The risk residual of
the risk portfolio is then hedged, according to the firm’s risk appetite, instead of hedging every
individual risk at its own. I argue that ERM deals more effectively with controlling risks, since
the risk portfolio will simplify the process of monitoring internal control risks. I therefore
hypothesize that firms which implemented an ERM framework have a higher internal control
quality, hence hypothesis 1:
H1: ERM is positively related to the quality of internal control.
5 Risk aggregation or risk data aggregation means gathering and processing risk data. This data is then used to
accurately measure a firm’s performance against its risk appetite (Bank for International Settlements, 2013).
Aggregating data on risk and defining a firm’s risk appetite are common practices in ERM.
6 For further explanation on TRM, I refer to Footnote 2.
7 The risk residual is defined as the risk remaining after internal controls have been implemented and the
management’s responses have been developed (COSO, 2004).

12
Besides the relation between ERM and internal control quality, audit fees and internal
control quality are naturally linked and empirical studies have proven that an increase in the
quality of internal control is expected to decrease audit fees (Hoitash, Hoitash and Bedard,
2008). Audit fees are defined as the fees a firm pays to its external auditor for performing an
audit service. Hay, Knechel and Wong (2006) stress the importance of the demand effect of audit
fees, which states independent directors demand more extensive auditing to protect their
reputation and have less responsibility in the case of due diligence. More specifically, Hay et al.
(2006) state that the amount of audit fees is increasing in accordance to the set of risks faced and
decreasing for the set of control mechanisms available for mitigating those risks. Since ERM is
hypothesized to decrease internal control risk, I expect ERM to decrease the amount of audit
fees. Additionally, ERM implementation is costly, although a decrease in audit fees could be a
direct benefit resulting from ERM implementation. I am interested in the relation between ERM
and audit fees. I hypothesize that the existence of ERM decreases the amount of audit fees, hence
hypothesis 2:
H2: ERM is negatively related to the amount of audit fees.
To provide more clarity surrounding my hypothesis development and research design I
have included Figure A in Appendix A depicting a Libby Box, which illustrates the relation
between independent and dependent variables as well as that between the different constructs
and proxies used in this thesis. In the next section, I will elaborate on the motivation behind the
variables used in this study and the different models used to test the two hypotheses.
13
3. Methodology
The primary objective of this study is to determine the relation between ERM and
internal control, along with the relation between ERM and the amount of audit fees. Below, I
will explain the motivation behind the measures for ERM and my dependent variables.
Additionally, I will present the model I will use to test my hypotheses. Finally, I will discuss the
steps I have taken in my sample selection.
3.1 Variable motivation and research design
ERM
A CRO is a managerial position whose main responsibility is the implementation and
coordination of ERM. A well-developed ERM framework, according to Beasley et al. (2005), is
argued to be accompanied by the presence of a CRO. Although an ERM framework might be put
in place together in the absence of an appointed CRO, one cannot directly observe the existence
of an ERM framework since it is not mandatory for firms to state the use of ERM (Liebenberg
and Hoyt, 2003). Several other papers also used the appointment of a CRO as a proxy for ERM
(e.g.; Liebenberg and Hoyt, 2003; Beasley, Pagach and Warr, 2007; Gordon, Loeb and Tseng,
2009; Grace, Leverty, Phillips and Shimpi, 2015).
Although the relation between the appointment of a CRO and implementation of ERM
has been documented, using CRO as proxy for the implementation of ERM can be problematic.
Firstly, type I and type II errors could occur where a type I error exists when an ERM framework
is implemented in a company where a CRO is absent, for instance when an ERM framework is
implemented before the assignment of a CRO. Additionally, a type II error might exist when a
CRO is present, but an ERM framework is absent. This might occur when an ERM framework is
still in the process of being implemented and a CRO is appointed to supervise this
implementation. For the type I error, the effect of an appointed CRO has little effect on the
benefits received from ERM. For the type II error, the benefits received from ERM are only
observed in the time after the first year of appointing the CRO.
Besides the appointment of a CRO, the presence of a risk committee is also believed to
be a valid indicator for ERM. This standalone risk committee is fully in charge of risk oversight.
Since the presence of a risk committee means the risk oversight is assigned to one committee,
and therefore indicates a holistic approach to risk management, this can be seen as a valid
indicator of ERM. In a survey conducted by Kleffner, Lee and McGannon (2003) amongst
14
Canadian firms, the respondents agreed that ERM should be overseen by a risk committee.
Similarly, Hoyt and Liebenberg (2011) used the term Risk Committee, together with Chief Risk
Officer, in a detailed search of financial reports and other media services in their attempt to
identify ERM. Similar to using CRO as a measure of ERM, the identification of a risk committee
is vulnerable to type I and type II errors.
Lastly, since 2007 S&P has provided an ERM rating for the insurance industry ranking
insurance companies in one of five quality measures.8 This measure allows for the distinction
between different qualities of ERM and has been used to study the effects of higher ERM quality
on shareholder value (McShane et al., 2011; Lin, Wen and Yu, 2012; Baxter et al., 2013). This
measure has, however, obvious limitations, since only the insurance industry is observed.
Moreover, an ERM quality index in likely to include some measure of internal control. Also, as
mentioned in the prior literature section, McShane et al. (2011) note that only the top two ERM
measures accounts for an increase in ERM quality and the remaining three measures account for
an increase in Traditional Risk Management (TRM).
In this study I will use the presence of a CRO and risk committee as a proxy for ERM. By
performing different search strings on a list of the executive’s function titles for each firm, I
identify if a firm has a hypothesized ERM framework. Examples of such search strings,
following Hoyt and Liebenberg (2011), include “Enterprise Risk Management”, “Chief Risk
Officer”, “Risk Committee" and “Strategic Risk Management”. The dummy variable ERM
equals one for firms who have an executive where the function title matches a search string or
parts of it, and zero otherwise. Table B of Appendix B presents an overview of all the different
search strings used with the respective amount of matched executives in panel A. Some firm year
observations have more than one identified executive matched with the search string, with a
maximum of three. I included an overview of how many firms have one, two or three identified
executives matched with the search string in panel B of Table B.
Throughout the text, I will refer to firms for which dummy variable ERM equals one as
ERM firms, and those firms for which dummy variable ERM equals zero as non-ERM firms.
Consequently, I refer to ERM observation as those observations where dummy variable ERM
equals one and non-ERM observations as those observations where dummy variable ERM equals
zero.
8 S&P recently changed their scale to six point scale, although for older samples a five point scale was used.

15
Internal Control Quality
Hypothesis 1 predicts a positive relation between ERM and internal control quality. The
quality of internal control can be explained by the efficiency of internal controls. Material
weaknesses in internal controls are a common measure for internal control quality (Doyle, Ge
and McVay, 2007). Material weaknesses in internal control are defined as “a significant
deficiency, or combination of significant deficiencies, that results in more than a remote
likelihood that a material misstatement of the annual or interim financial statements will not be
prevented or detected’’ (PCAOB, 2004 p.10). Since the SOX act in 2002, firms are required to
publicly disclose any material weaknesses of internal control in their annual report, which has
sparked an interest among researchers in studying the relation between material weaknesses and
internal control quality (e.g. Bedard, 2006; Doyle et al., 2007). In conjunction with Doyle et al.
(2007), I will use the variable MAT WEAK, equal to the amount of material weaknesses, as a
proxy for internal control quality. In the attempts to justify hypothesis 1, I will test against null
hypothesis H10:
H10 : ERM and the amount of material weaknesses have no relation
Model 1 was used to test H10 and controls for variables found to explain differences in
internal control quality. Following Doyle et al. (2007), I control for a number of firm
characteristics. First, I control for firm SIZE measured by the firm’s total assets. Large firms tend
to have relatively less internal control weaknesses, because they enjoy economies of scale and
have greater resources to spend on internal audit and consultancy fees. However, empirical
evidence is mixed, as opponents claim larger firms intuitively have more financial reporting
processes. Since I will not control for firm complexity, as explained later in this section, I expect
a positive relation between SIZE and MAT WEAK. In the regression model, presented in section
4, I will use the natural logarithm of SIZE following prior literature (Gordon et al., 2009;
McShane et al., 2011). Doyle et al. (2007) also argue that AGE is negatively related to internal
control, because over time, firms have ‘ironed out the kinks’. I also control for firm
LEVERAGE, measured by the leverage ratio, equal to the total liabilities divided by total assets.
I do not follow Doyle et al. (2007), in this approach as they use debt-to-equity ratio; however, a
considerable portion of firms report an extremely low level of shareholder equity. This resulted
16
in high leverage ratios, which could potentially harm the regression results. More leverage
implies a firm is exposed to more risk and has a higher demand for internal control, hence I
expect a positive relation between leverage and internal controls. Furthermore, I control for
auditor type using dummy variable BIG 4 equal to one if the auditor of the current fiscal year is a
Big Four auditor and zero otherwise. Firms audited by a Big Four audit firm generally have a
higher internal control quality and therefore I expect a negative relation between BIG 4 and the
amount of material weaknesses. I also control for corporate governance measured by integer
variable GOVERNANCE equal to the amount of independent board members. Increased
corporate governance effectiveness results in more effective monitoring of internal control
quality. Krinsnan (2005) found a negative relation between the effectiveness of the audit
committee and material weaknesses. I argue the amount of independent board members
positively relates to the objectivity of the audit committee, controlling for industry effects.
Additionally, Bates and Leclerc (2009) stress the involvement of the board of executives in the
audit and risk committee. Next, I control for growth by constructing indicator variable
GROWTH equal to one if the sales growth over the past two years is in the highest quintile of
sales growth for their industry (Doyle et al, 2007). I expect rapid sales growth to have a negative
impact on internal control quality, since the internal controls growth might not cope with the
rapid sales growth. Finally, I control for the firm’s financial health by constructing dummy
variable LOSS equal to one if the firm’s sum of income before extraordinary items in year t and
t-1 is negative. Firms with good internal controls require adequate financial resources and time
management, which might be lacking in loss-making firms. Moreover, Krishnan (2005) found
that firms who reported losses are positively associated with internal control problems and a
change of audit firm.
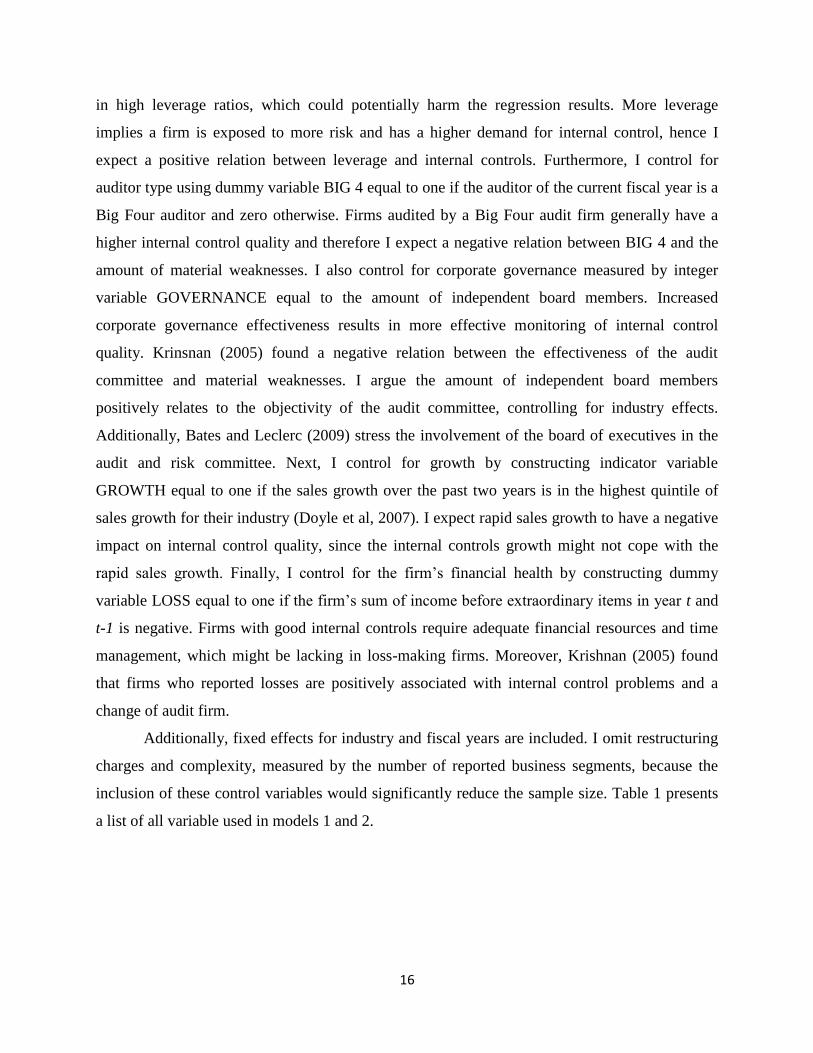
Additionally, fixed effects for industry and fiscal years are included. I omit restructuring
charges and complexity, measured by the number of reported business segments, because the
inclusion of these control variables would significantly reduce the sample size. Table 1 presents
a list of all variable used in models 1 and 2.
17
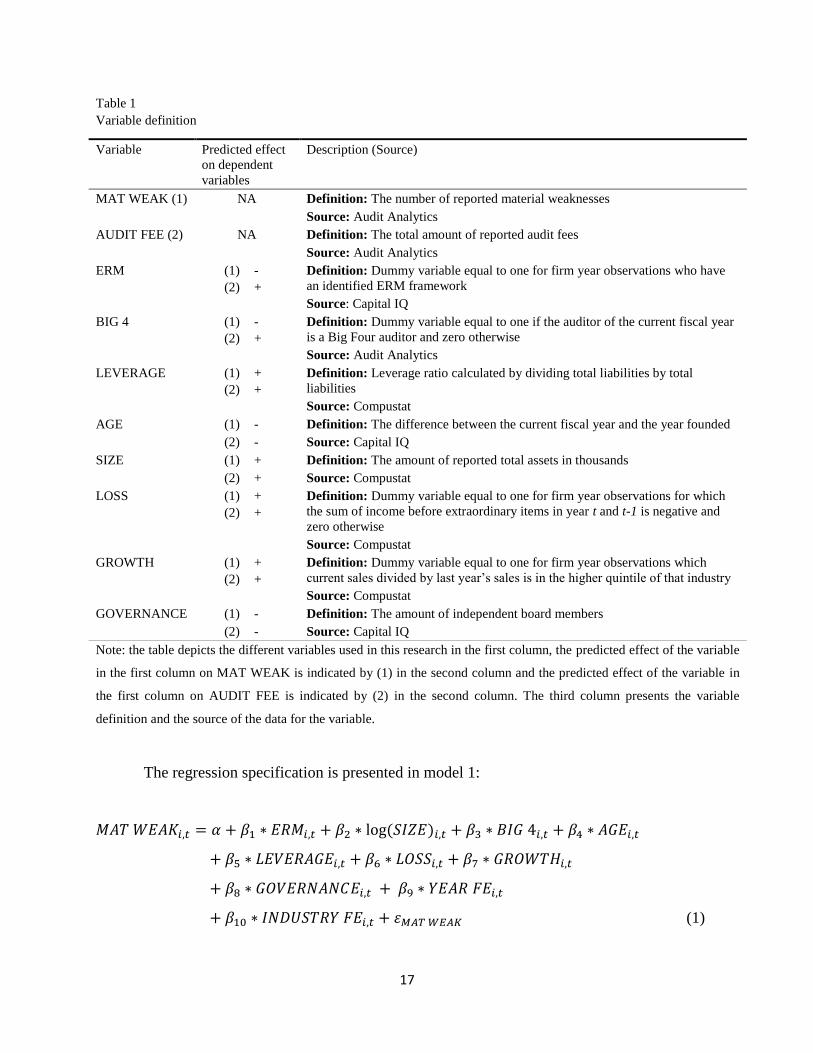
Table 1
The regression specification is presented in model 1:
𝑀𝐴𝑇 𝑊𝐸𝐴𝐾𝑖,𝑡 = 𝛼 + 𝛽1 ∗ 𝐸𝑅𝑀𝑖,𝑡 + 𝛽2 ∗ log (𝑆𝐼𝑍𝐸)𝑖,𝑡 + 𝛽3 ∗ 𝐵𝐼𝐺 4𝑖,𝑡 + 𝛽4 ∗ 𝐴𝐺𝐸𝑖,𝑡
+ 𝛽5 ∗ 𝐿𝐸𝑉𝐸𝑅𝐴𝐺𝐸𝑖,𝑡 + 𝛽6 ∗ 𝐿𝑂𝑆𝑆𝑖,𝑡 + 𝛽7 ∗ 𝐺𝑅𝑂𝑊𝑇𝐻𝑖,𝑡
+ 𝛽8 ∗ 𝐺𝑂𝑉𝐸𝑅𝑁𝐴𝑁𝐶𝐸𝑖,𝑡 + 𝛽9 ∗ 𝑌𝐸𝐴𝑅 𝐹𝐸𝑖,𝑡
+ 𝛽10 ∗ 𝐼𝑁𝐷𝑈𝑆𝑇𝑅𝑌 𝐹𝐸𝑖,𝑡 + 𝜀𝑀𝐴𝑇 𝑊𝐸𝐴𝐾 (1)
Variable definition
Variable Predicted effect
on dependent
variables
Description (Source)
MAT WEAK (1) NA Definition: The number of reported material weaknesses
Source: Audit Analytics
AUDIT FEE (2) NA Definition: The total amount of reported audit fees
Source: Audit Analytics
ERM (1)
(2)
-
+
Definition: Dummy variable equal to one for firm year observations who have
an identified ERM framework
Source: Capital IQ
BIG 4 (1)
(2)
-
+
Definition: Dummy variable equal to one if the auditor of the current fiscal year
is a Big Four auditor and zero otherwise
Source: Audit Analytics
LEVERAGE
(1)
(2)
+
+
Definition: Leverage ratio calculated by dividing total liabilities by total
liabilities
Source: Compustat
AGE (1) - Definition: The difference between the current fiscal year and the year founded
(2) - Source: Capital IQ
SIZE (1) + Definition: The amount of reported total assets in thousands
(2) + Source: Compustat
LOSS (1)
(2)
+
+
Definition: Dummy variable equal to one for firm year observations for which
the sum of income before extraordinary items in year t and t-1 is negative and
zero otherwise
Source: Compustat
GROWTH (1)
(2)
+
+
Definition: Dummy variable equal to one for firm year observations which
current sales divided by last year’s sales is in the higher quintile of that industry
Source: Compustat
GOVERNANCE (1) - Definition: The amount of independent board members
(2) - Source: Capital IQ
Note: the table depicts the different variables used in this research in the first column, the predicted effect of the variable
in the first column on MAT WEAK is indicated by (1) in the second column and the predicted effect of the variable in
the first column on AUDIT FEE is indicated by (2) in the second column. The third column presents the variable
definition and the source of the data for the variable.

18
where,
𝑖 : indicates the firm 𝑖;
𝑡 : indicates year 𝑡;
𝛼 : equals the constant term;
𝜀𝑀𝐴𝑇 𝑊𝐸𝐴𝐾: equals the error term.
The variable of interest is beta coefficient 𝛽1 which measures the relation between ERM
and MAT WEAK.
This model is subject to possible endogeneity concern, since the selection for the sample
of firms who implemented ERM is unlikely to be random. To illustrate, firms do not randomly
choose to implement ERM, as has been proven in previous empirical literature (e.g. Liebenberg
and Hoyt, 2003). Firms have a, possibly unobservable, motivation to implement ERM, which
might also have an effect on the internal control quality. This possible endogeneity concern is
referred to as endogeneity, where an unobservable variable is related to both the ERM variable
and internal control quality. This unobservable variable is partly responsible for the relation
measured by the ERM coefficient; hence the ERM coefficient is biased. ERM and the amount of
reported material weaknesses have a negative hypothesized relation, therefore, the omitted
variable bias in likely to negatively bias the ERM coefficient. The result of the omitted variable
bias is that I cannot conclude the changes in internal control quality measure by the ERM
coefficient of the OLS regression is the result of the implementation of an ERM framework
Furthermore, a firm’s internal control quality could be the reason for firms to implement
ERM. In this case the hypothesized relation between ERM and internal control quality holds
both ways. This is referred to as a simultaneity bias, where the independent variable causes the
dependent variable, but simultaneously the dependent variable also causes the independent
variable. This is not to be mistaken with reverse causality, where the dependent variable causes
the independent variable, but there is no causal relation in the opposite direction. Since ERM is
hypothesized to increase internal control quality, it is most likely that also the relation partially
holds the other way around. Internal control quality has not been documented as a determinant of
ERM in prior empirical literature, although one could easily argue that firms with weak internal
controls might be more inclined to implement ERM to improve their internal control quality. The
result of a possible simultaneity bias is that I cannot conclude on the direction of the relation.
19
The simultaneity bias results in a biased ERM coefficient; since part of the relation explained by
the ERM coefficient is the results of the hypothesized effect internal control quality has on ERM
implementation.
Audit fees
Hypothesis 2 predicts a negative relation between ERM and audit fees. I construct the
variable AUDIT FEE equal to the amount of audit fees as reported by Compustat in fiscal year t.
In the effort to justify hypothesis 2 I will use model 2, as presented below:
log (𝐴𝑈𝐷𝐼𝑇 𝐹𝐸𝐸)𝑖,𝑡 = 𝛼 + 𝛽1 ∗ 𝐸𝑅𝑀𝑖,𝑡 + 𝛽2 ∗ log (𝑆𝐼𝑍𝐸)𝑖,𝑡 + 𝛽3 ∗ 𝐵𝐼𝐺 4𝑖,𝑡 + 𝛽4 ∗ 𝐴𝐺𝐸𝑖,𝑡
+ 𝛽5 ∗ 𝐿𝐸𝑉𝐸𝑅𝐴𝐺𝐸𝑖,𝑡 + 𝛽6 ∗ 𝐿𝑂𝑆𝑆𝑖,𝑡 + 𝛽7 ∗ 𝐺𝑅𝑂𝑊𝑇𝐻𝑖,𝑡
+ 𝛽8 ∗ 𝐺𝑂𝑉𝐸𝑅𝑁𝐴𝑁𝐶𝐸𝑖,𝑡 + 𝛽9 ∗ 𝑌𝐸𝐴𝑅 𝐹𝐸𝑖,𝑡
+ 𝛽10 ∗ 𝐼𝑁𝐷𝑈𝑆𝑇𝑅𝑌 𝐹𝐸𝑖,𝑡 + 𝜀𝐴𝑈𝐷𝐼𝑇 𝐹𝐸𝐸 (2)
To test to reject null hypothesis H20:
H20 : ERM and the amount of audit fees are not related.
Where, all subscripts are specified as in model 1.
Hay et al. (2006) summarized a large body of empirical literature on audit fees and
evaluated different independent variables used as determinants of audit fees. Model 2, as
presented above, controls for variables as concluded, following the literature review by Hay et al.
(2006), to be most likely the main explanatory variables for the variation in a firm’s amount of
audit fees.9 The majority of the arguments for using control variables are based on the positive
relation to audit risk. Since people are generally risk averse, audit firms want to be compensated
for the risk to which they are exposed and therefore the amount of audit fees is positively related
to audit risk.
9 Hay et al. (2006) additionally provide auditor and engagement variables influencing audit fees. I will not use the
methodology provide on these two types of variables, since they are too specified and therefore out of the scope for
this research. Examples of these variables are; auditor locations and a dummy measure controlling for the ‘busy
season’ in which time the majority of companies have their fiscal year-end.

20
First, I control for SIZE, measured by total assets, as this is the most common
determinant of external audit fees (Hay et al., 2006). One can easily argue that larger firms are
more time consuming for an audit firm to audit. Secondly, I control for a firm’s financial health
by including an LOSS dummy variable equal to one if a firm’s sum of income before
extraordinary items for years t and t-1 is negative. Reporting losses increases the risk the auditor
faces, since loss-making firms are more likely to have internal control problems that an auditor
needs to identify. The higher the risk the auditor faces, the higher the amount of audit fees, hence
a negative relation between financial health and audit fees. In addition, I control for LEVERAGE
measured by dividing total debt by total assets. More levered firms are more likely to fail and
therefore not able to pay the outstanding amount of audit fee. For this reason, LEVERAGE is
positively related to audit risk, hence the amount of audit fees. The quality of the auditor is
naturally linked to the amount of audit fees. Big Four audit firms are generally classified as high-
quality audit firms; therefore, I control for audit quality by including a BIG 4 dummy variable
equal to one if the firm is audited by a Big Four audit firm and zero otherwise. Moreover,
corporate governance is likely to affect audit fees, since improved corporate governance implies
more effective internal control monitoring reducing internal control risk or audit risk (Hay et al.,
2006). However, empirical evidence is mixed. In his review of empirical literature on audit fees,
Hay et al. (2006) found only one variable with sufficient studies that used them, namely the
amount of independent directors. For this reason I expect a negative relation between
GOVERNANCE, measuring the number of independent board members, and audit fees.
I additionally add industry and year fixed effects similar to model 1 to control for
differences in results caused by the variable’s behavior over different industries and years.
Similar to model 1 this model is likely to be subject to an omitted variable bias, where the
omitted variable has a hypothesized effect on both the ERM implementation and the amount of
audit fees. Furthermore, model 2 is subject to a possible simultaneity bias where the
hypothesized relation between ERM and internal control quality goes both ways, as explain
previously in this section.
3.2 Sample selection
The sample consists of firms located in the United States with observations for the years
2010 to 2014. The beginning of the time frame was deliberately chosen after the Financial Crisis
of 2007 and 2008 to avoid biased results caused by the Financial Crisis. Although the effects of
21
the crisis continued beyond 2008 I initially included 2009 to 2016 in my sample selection.
Ultimately, the final time period of 2010 to 2014 resulted naturally through data availability.10
For the entire sample selection I use databases available through Wharton Research Data Service
(WRDS).
From Audit Analytics I obtained data on AUDIT FEE, MAT WEAK and BIG 4. By
performing a search for the names of all Big Four audit firms in the variable current auditor
name I generated dummy variable BIG 4. The initial sample extracted from Audit Analytics
contained 62,629 firm year observations. A total amount of 21,102 duplicate observations were
deleted. I also deleted an additional 22,011 observations because of missing or zero data on the
AUDIT FEE variable. From the Fundamental Annual section of the Compustat database I
extracted data on SIZE, LOSS, GROWTH and LEVERAGE for the North America region. I
winsorized GROWTH at the bottom and top 1% level to deal with extreme outliers.
LEVERAGE is measured by the leverage ratio, hence total liabilities are divided by total assets.
688 observations were deleted because of unmatched data and an additional 511 observations
were deleted because of missing or negative balance sheet items. From the People Intelligence
section of the Capital IQ database I obtained data on executives’ function name and the number
of independent directors. I used the data on executive’s function name to identify ERM activity.
GOVERNANCE is measured by the sum of independent board members. Additionally, the
People Intelligence section of the Capital IQ database provided data on the year the company
was founded. By subtracting this year from the current fiscal year I obtained the value for the
firm’s AGE variable. I winsorized AGE at the top 1% level to deal with extreme outliers. Table 2
depicts the sample selection, including the amount of firm year observations for each procedure.
The amount of firm year observation of the final sample equals 13,682. The sample has 3,352
unique firms and the amount of ERM observations is equal to 511 which accounts for 3.7% of
the total amount of firm year observations.
In the next section I will present the results, including the descriptive statistics of the
variables of interest over different industries.
10
The remainder of the sample selection is written as if initially only data for fiscal years 2010 to 2014 has been
extracted from WRDS, in order that the reader can easily understand the sample selection process.

22
Table 2
Sample selection
Description
Nr. Firm year
observations
Firm year observation in Audit Analytics database 62,629
Less duplicate observations (21,102)
Less observations with missing or zero data on AUDIT FEE in Audit Analytics (22,011)
Matched with Compustat - Fundamental Annual data
Less unmatched observations with Compustat - Fundamental Annual data (688)
Less observations with missing data on SIZE (221)
Less observations with missing or negative data on LEVERAGE (209)
Less observations with missing data on GROWTH (61)
Less observations with missing data on LOSS (20)
Matched with Capital IQ – People Intelligence data
Less unmatched observations with Capital IQ – People Intelligence data (4,116)
Less observations with missing data on AGE (519)
Final sample 13,682
Number of unique firms 3,352
ERM observations 511
Note: Column one presents a description for the number of firm year observations presented in the second column.
Column two indicates the number of firm year observations. Additionally, the sample size of the final sample, the
number of unique firms and the number of observations for which ERM equals one are denoted in the bottom rows.
23
4. Results
In this section I will present the analysis. Firstly, I present the descriptive statistics
comparing the ERM and non-ERM samples. Additionally, I provide a Pearson and Spearman
correlation matrix to investigate notable correlations that could harm my results. Lastly, I present
the results of the regression analysis.
4.1 Descriptive statistics
Material weaknesses and audit fees
The descriptive statistics are presented in Table 3. The mean, standard deviation,
minimum and maximum of all variables are reported separately for ERM firms in column (1)
and non-ERM firms in column (2). The asterisks indicated next to the mean values indicate at
which significance level the mean value differs for the ERM sample and non-ERM sample,
calculated by performing a two-sided t-test.
Around 7% of all firms in the entire sample report material weaknesses. In accordance to
hypothesis 1, the average number of reported material weaknesses is lower for ERM firms.
However, the difference in mean values between the ERM and non-ERM sample is not
significant. The average amount of AUDIT FEES is significantly higher for the ERM firms, in
contrast to that predicted by hypothesis 2. However, the mean of SIZE is also significantly
higher for ERM firms, primarily due to the fact that ERM is costly to implement and most small
firms do not have the necessary funds available. SIZE typically accounts for more than half of
the variation for the reported amount of audit fees, as seen in prior empirical literature (Hay et
al., 2006), and could therefore be the reason why AUDIT FEES are higher for ERM firms.
Moreover, as explained later in this section, both ERM and SIZE differ greatly for different
industries. In addition, the mean of LEVERAGE is higher for ERM firms. This could imply there
is a self-selection bias of leveraged firms who implement ERM to decrease large risk exposure.
However, this is likely caused by the fact that the ERM firm observations are principally
clustered in the financial sector, as explained later in this section, and financial firms are
generally more levered. Lastly, 24% of the non-ERM firms have a Big Four auditor, for ERM
this is only 14%. This is, again, a result of the fact that the ERM observations are clustered in the
financial services industry, where, in general, firms have less Big Four auditors.
Table 4 presents descriptive statistics of the ERM variables, both dependent variables and
SIZE for different industries. The second and third columns show that the majority of the ERM

24
firms are operating in the financial services industry. Almost half of the ERM observations
within the financial industry are classified as commercial banks.11
This is largely due to the fact
that risk committees are more common in more regulated industries such as financial services,
insurance, healthcare, pharmaceuticals, gambling and utilities (Bates and Leclerc, 2009).
Furthermore, the average number of material weaknesses in the financial industry is lower for
ERM firms when compared to non-ERM firms, which is evidence supporting hypothesis 1.
Lastly, the sample of non-financial firms with a hypothesized ERM framework has only 106 firm
year observations in total of which only one firm year observation has reported material
weaknesses greater than zero. Since there is only one firm reporting material weaknesses in the
non-financial ERM sample, the relation of ERM on internal control quality will not have
considerable explanatory power or external validity. Nevertheless, I will report the regression
statistics in the regression analyses presented later in section 4.
Next to this, the mean of AUDIT FEE is higher for ERM firms, which suggests a positive
relation between ERM and AUDIT FEE. However, since SIZE is also substantially higher for
ERM and the most common determinant of external audit fees I cannot base any suggestion on
the fact that AUDIT FEE is higher for ERM firms (Hay et al., 2006). The majority of the ERM
observations are located in the financial services industry, however the majority of the entire
sample of firm year observations is located outside of the financial services industry. To account
for the possible effect this has on the regression results using the entire sample, I will perform
separate analyses on a sample with only financial firms and a sample with only non-financial
firms.
11
Although not presented in Table 4, half of the ERM observations are indicated with Standard Industry
Classification (SIC) code 6020, which represents a commercial bank.

25
Table 3
Descriptive statistics comparing ERM and non-ERM observations
(1)
ERM = 0
(2)
ERM = 1
N Mean Std. Dev. Minimum Maximum N Mean Std. Dev. Minimum Maximum
MAT WEAK 13171 0.068
0.46 0 11 511 0.047 0.254 0 3
AUDIT FEE 13171 3,101,625 ***
6,460,137 18,000 145,000,000 511 5,346,755 ***
11,400,000 99,200 75,100,000
BIG 4 13171 0.233 ***
0.423 0 1 511 0.137 ***
0.344 0 1
LEVERAGE 13171 0.545 ***
0.239 0.048 0.999 511 0.789 ***
0.176 0.181 0.999
AGE 13171 50.4 ***
42.1 3 180 511 74.7 ***
56.0 3 180
SIZE 13171 19, 338 ***
129,312 10 3,221,972 511 134,936 ***
457,680 121 3,270,108
LOSS 13171 0.228 ***
0.419 0 1 511 0.157 ***
0.364 0 1
GROWTH 13171 0.093 *
0.290 0 1 511 0.067 *
0.249 0 1
GOVERNANCE 13171 4.8 ***
2.4 0 17 511 5.9 ***
2.6 0 15
Variable definition:
MAT WEAK
AUDIT FEE
ERM
BIG 4
LEVERAGE
AGE
SIZE
LOSS
GROWTH
GOVERNANCE
= The amount of reported material weaknesses
= The total amount of reported audit fees
= Dummy variable equal to one for firm year observations who have an identified ERM framework
= Dummy variable equal to one if the auditor of the current fiscal year is a Big Four auditor and zero otherwise
= Leverage ratio calculated by dividing total liabilities by total assets
= The difference between the current fiscal year and the year founded
= The amount of reported total assets in thousands
= Dummy variable equal to one for firm year observations for which the sum of income before extraordinary items in year t and t-1 is
negative and zero otherwise
= Dummy variable equal to one for firm year observations in which current sales divided by last year’s sales is in the higher quintile of that
industry
= The amount of independent board members
Note: The first column presents the different variables used in this study. The descriptive statistics are reported separately for the sample only with firm year
observation where ERM has been identified, labeled ERM=0, and without firm year observation where ERM has been identified, labeled ERM=1,where, N
denotes the number of firm year observations and Std. Dev. the standard deviation. The asterisks indicate the p-value of the difference in mean values between
the ERM and non-ERM sample. The p-value is calculated using a two-sided t-test, where ***. **. * stand for p-value<0.1%, p-value<1% and p-value<5%,
respectively. Below the descriptive statistics is a list of variable definitions.

26
Table 4
Descriptive statistics for each industry of the dependent and independent variables
Nr. of observations
AUDIT FEE SIZE
MAT WEAK
Industry ERM = 0 ERM = 1
ERM = 0 ERM = 1 ERM = 0 ERM = 1
ERM = 0 ERM = 1
Agriculture, forestry, fishing 41 2 2,571,770 319,800 3,575 950 0.049 0.000
Mining & construction 1,089 19 2,099,942 1,179,388 8,357 3,714 0.091 0.000
Manufacturing 4,809 33 3,500,958 6,973,651 8,949 32,978 0.075 0.060
Transportation & public utilities 1,236 17 3,307,231 2,846,051 17,497 3,147 0.049 0.000
Wholesale & retail trade 1,148 9 2,005,379 1,270,776 6,348 1,376 0.091 0.000
Finance, insurance & real estate 2,918 405 3,284,005 5,808,831 54,565 167,030 0.070 0.052
Services 1,889 26 2,405,088 2,562,197 4,076 3,019 0.080 0.000
Public administration 41 0 26,173,861 0 165,306 0 0.000 0
Total 13,171 511 3,101,625 5,346,755 19,338 134,936 0.068 0.047
Note: Industries are classified using the Standard Industrial Classification (SIC) Code’s first digit. A SIC Code is a four-digit numerical code assigned by the
United States government to firms to identify the industry area. Exceptions to the classifying industries on the basis of its first SIC Code digit are first digit SIC
Codes 2 and 3 which together form the manufacturing industry classification and first digit SIC Codes 7 and 8 which together form the service industry
classification. Nr. of observations reports the number of firm year observations. The numbers below columns AUDIT FEE, SIZE and MAT WEAK (columns 4-
9) are mean values. For the number of observations, AUDIT FEE, SIZE and MAT WEAK, the reported numbers are presented separately for the sample
consisting only of firm year observations where firms do not have an hypothesized ERM framework, labeled ERM=0, and the sample consisting only of firm
year observations where firms do have an hypothesized ERM framework, labeled ERM=1.

27
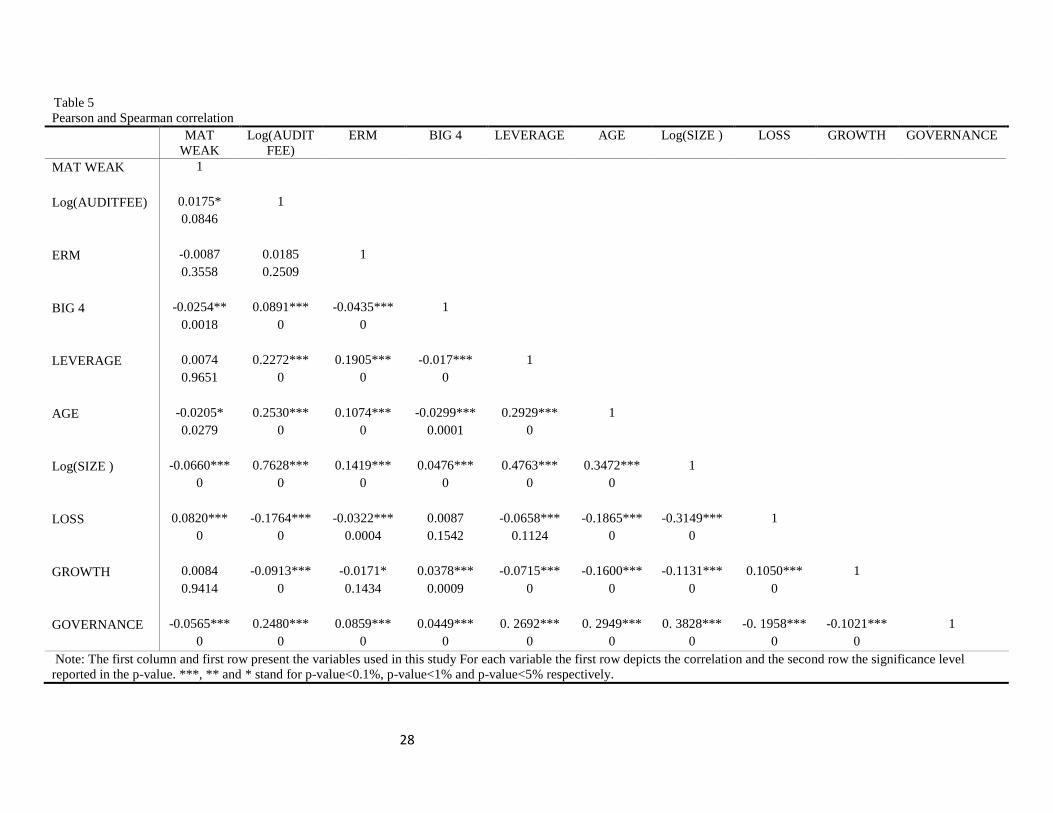
4.2 Pearson and Spearman correlation
Table 5 presents the results of the correlations between all variables in the form of a
Pearson and Spearman correlation matrix. Note that log(AUDIT FEE) and log(SIZE) are used,
since these will be used in the analyses. The Pearson and Spearman correlation matrix allows for
the identification of correlations potentially harming the contribution of the independent variable
to the analysis. However, no variable presented in Table 5 shows a correlation large enough to
harm the results of the analyses.
The correlation of ERM and MAT WEAK is not significant; however, the sign is
according with the expectations of hypothesis 1. The correlation of ERM and AUDIT FEE is
also not significant, however the sign is contradicting hypothesis 2. Oddly, AUDIT FEE is only
weakly significantly correlated to MAT WEAK.
Most control variables are significantly correlated to both dependent variables. The
correlation of log(AUDIT) and log(SIZE) is highly significant equal to 0.7645, meaning the
majority of the variation in log(AUDIT) sample is the result of changes in log(SIZE). According
to the theory, GOVERNANCE is negatively correlated to MAT WEAK, but not to AUDIT FEE,
meaning an independent board is beneficial for the internal control quality, but not the amount of
audit fees. Additionally, the majority control variables are significant correlated to ERM. Most of
the signs can be explained by the fact that most ERM observations are financial firms, which are
generally more levered and larger.
28
Table 5
Pearson and Spearman correlation
MAT
WEAK
Log(AUDIT
FEE)
ERM BIG 4 LEVERAGE AGE Log(SIZE ) LOSS GROWTH GOVERNANCE
MAT WEAK 1
Log(AUDITFEE) 0.0175* 1
0.0846
ERM -0.0087 0.0185 1
0.3558 0.2509
BIG 4 -0.0254** 0.0891*** -0.0435*** 1
0.0018 0 0
LEVERAGE 0.0074 0.2272*** 0.1905*** -0.017*** 1
0.9651 0 0 0
AGE -0.0205* 0.2530*** 0.1074*** -0.0299*** 0.2929*** 1
0.0279 0 0 0.0001 0
Log(SIZE ) -0.0660*** 0.7628*** 0.1419*** 0.0476*** 0.4763*** 0.3472*** 1
0 0 0 0 0 0
LOSS 0.0820*** -0.1764*** -0.0322*** 0.0087 -0.0658*** -0.1865*** -0.3149*** 1
0 0 0.0004 0.1542 0.1124 0 0
GROWTH 0.0084 -0.0913*** -0.0171* 0.0378*** -0.0715*** -0.1600*** -0.1131*** 0.1050*** 1
0.9414 0 0.1434 0.0009 0 0 0 0
GOVERNANCE -0.0565*** 0.2480*** 0.0859*** 0.0449*** 0. 2692*** 0. 2949*** 0. 3828*** -0. 1958*** -0.1021*** 1
0 0 0 0 0 0 0 0 0
Note: The first column and first row present the variables used in this study For each variable the first row depicts the correlation and the second row the significance level
reported in the p-value. ***, ** and * stand for p-value<0.1%, p-value<1% and p-value<5% respectively.
29
4.3 Regression analyses
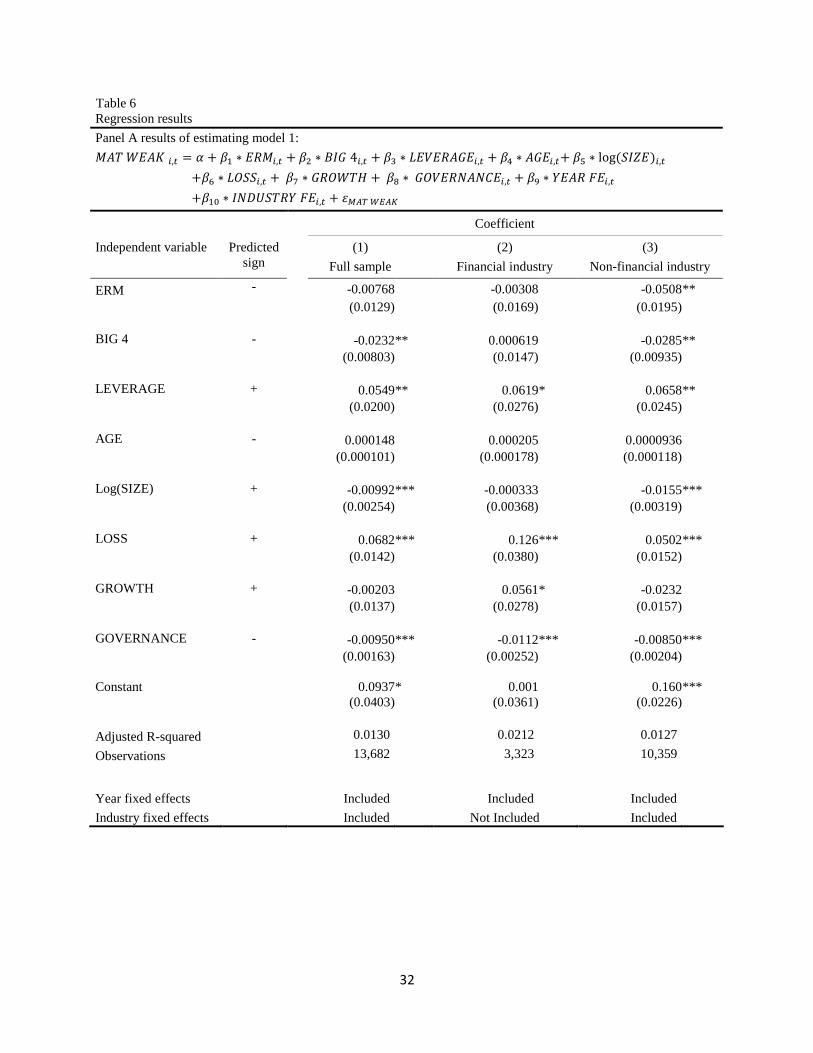
This section presents the results of the regression analysis that was conducted for each
hypothesis. Table 6 presents the results of the regressions using model 1 in panel A and the
results of the regression using model 2 in panel B.
Column (1) of panel A shows the results using the entire sample. As predicted by H1, the
coefficient for ERM is negative and insignificant. The negative sign implies ERM is positively
related to the number of material weaknesses, thus negatively to internal control quality.
However, due to the possible simultaneity bias, as mention earlier in section 3, the relation could
also run in the opposite direction. The result then implies that firms with a higher internal control
quality are more inclined to implement ERM.
The significant relation of the different control variables are largely as expected. The
coefficient for LOSS is positive and significant. This supports the hypothesis stating loss-making
firms have a lower expected internal control quality due a lack of adequate financial resources
and time management. However, this result should be interpreted with caution, as I cannot
predict a causal relation between LOSS and MAT WEAK. For this reason the result might also
support the hypothesized consequence of low internal control quality negatively affecting
earnings, resulting in losses. The negative coefficient for GOVERNANCE supports the claim
that a more independent board positively affects the internal control quality. SIZE is, contrary to
my expectations, negatively related to MAT WEAK, providing evidence for the theory that
larger firms are expected to report less material weaknesses. Supporting the theory where larger
firms enjoy economies of scale improving the internal control quality, opposed to the
contradicting theory where larger firms have more accounting processes and are generally more
complex.
Since the observations of ERM firms are largely clustered in the financial services
industry, I perform an additional analysis separately for a sample of financial- and a sample of
non-financial firms. The results are presented in, respectively, column (2) and (3) of panel A. For
the sample of financial firms, again the coefficient for ERM is negative and insignificant. The
ERM coefficient using the sample of non-financial firms is negative and significant, indicates
ERM is expected to have a positive relation with internal control quality for non-financial firms.
However, this result should be interpreted with caution, since only one non-financial firm
reported material weaknesses.

30
To conclude that for the non-financial sector ERM is expected to have a positive relation
with internal control quality a large sample size is required. Additionally, the ERM coefficient
for the financial industry is insignificant. The financial industry is where the majority of my firm
year observations are clustered and an ERM framework is hypothesized to be most developed.
Furthermore, the ERM coefficient for the regression results using the entire sample is also
insignificant. Due to the insignificant results in both samples where the majority of ERM
observations are, I cannot reject null hypothesis H10.
Although the insignificant results for the ERM coefficient provide evidence that there is
no relation between ERM and internal control quality, this can be due to the fact that there is
insufficient variation in the MAT WEAK variable across ERM observation to find a significant
relation of ERM to MAT WEAK. I construct dummy variable MAT WEAKdummy equal to one
for firm year observations for which the amount of reported material weaknesses is greater than
zero, and zero otherwise. The mean of MAT WEAKdummy is higher for ERM observations,
meaning the sample of ERM firms has relatively more observations where material weaknesses
are observed. I rerun the regressions of panel A of Table 6 by replacing dependent variable MAT
WEAK by dummy variable MAT WEAKdummy; however these results present no noticeable
differences.
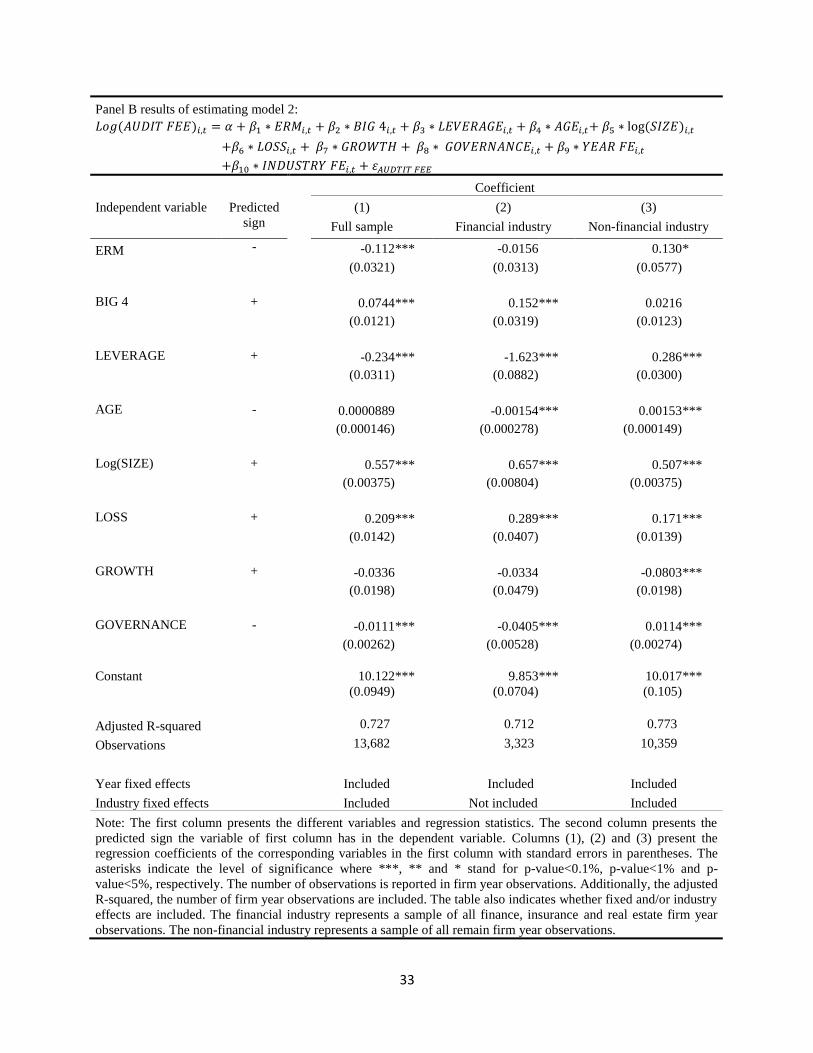
Panel b of Table 6 presents the results of the regressions using model 2. Column (1) of
panel B presents the regression results using the entire sample. The ERM coefficient is highly
significant and negative, in accordance to the expectations of hypothesis 2. This supports the
hypothesis implying that ERM is expected to decrease the amount of AUDIT FEE. Since I
measure AUDIT FEE by its natural logarithm, the ERM coefficient explains that, ceteris paribus,
firms with an ERM framework are expected to have 11,2% less audit fees comparted to firms
with an ERM framework. The majority of the control variables have a sign in accordance with
the expectations. Surprisingly, the coefficient of LEVERAGE is negative, which implies that
more levered firms are expected to have a lower amount of audit fees.
Similar to model 1, I again perform a separate analysis on the financial services and non-
financial services industry presented in columns (2) and (3) of Table 6 panel B. Again, the ERM
coefficient for the financial services industry is insignificant. For the non-financial industry the
ERM coefficient is a significantly positive, hence a positive relation between ERM and the

31
amount of audit fees. This result is contradicting the result earlier found for the relation between
ERM and audit fees using entire sample.
The only significant change between the results in column (1) and column (3), besides
the ERM coefficient, is that for the non-financial industry the sign of control variables
LEVERAGE and GOVERNANCE is positive. Another explanation could be that ERM in the
non-financial industry is not as developed as in the financial industry. As presented by the
descriptive statistics, and also prior literature, ERM is much more common in the financial
industry which could have a positive effect on the potential benefits of ERM in the financial
industry.
It seems the negative ERM coefficient for the entire sample can be largely attributed to
the large relative amount of financial ERM firms in my sample. However, the regression results
for ERM using only financial firms are not significant. Moreover, the change in the magnitude of
the ERM coefficients when comparing the sample for the full sample and the financial industry
is hard to explain. One would expect that the ERM coefficient for the financial industry would
drop below -0.112 since the non-financial observations are eliminated for which the ERM
coefficient is positively significant.
As a result of the highly significant ERM coefficient for the entire sample I reject null
hypothesis H20 stating ERM has no relation to the reported amount of audit fees. However, the
ERM coefficient for the financial industry is insignificant, considering the majority of the ERM
observations in my sample are financial firms. Additionally, the ERM coefficient for the non-
financial sample has an opposing sign. For this reason the significant negative ERM coefficient,
predicting a negative relation between ERM and the reported amount of audit fees, has to be
interpret with caution. In the next section I will perform various robustness checks to test if the
results presented in Table 6 are robust.
32
Table 6
Regression results
Panel A results of estimating model 1:
𝑀𝐴𝑇 𝑊𝐸𝐴𝐾 𝑖,𝑡 = 𝛼 + 𝛽1 ∗ 𝐸𝑅𝑀𝑖,𝑡 + 𝛽2 ∗ 𝐵𝐼𝐺 4𝑖,𝑡 + 𝛽3 ∗ 𝐿𝐸𝑉𝐸𝑅𝐴𝐺𝐸𝑖,𝑡 + 𝛽4 ∗ 𝐴𝐺𝐸𝑖,𝑡+ 𝛽5 ∗ log (𝑆𝐼𝑍𝐸)𝑖,𝑡
+𝛽6 ∗ 𝐿𝑂𝑆𝑆𝑖,𝑡 + 𝛽7 ∗ 𝐺𝑅𝑂𝑊𝑇𝐻 + 𝛽8 ∗ 𝐺𝑂𝑉𝐸𝑅𝑁𝐴𝑁𝐶𝐸𝑖,𝑡 + 𝛽9 ∗ 𝑌𝐸𝐴𝑅 𝐹𝐸𝑖,𝑡
+𝛽10 ∗ 𝐼𝑁𝐷𝑈𝑆𝑇𝑅𝑌 𝐹𝐸𝑖,𝑡 + 𝜀𝑀𝐴𝑇 𝑊𝐸𝐴𝐾
Coefficient
Independent variable Predicted
sign
(1)
Full sample
(2)
Financial industry
(3)
Non-financial industry
ERM - -0.00768 -0.00308 -0.0508 **
(0.0129) (0.0169) (0.0195)
BIG 4 - -0.0232 ** 0.000619 -0.0285 **
(0.00803) (0.0147) (0.00935)
LEVERAGE + 0.0549 ** 0.0619 * 0.0658 **
(0.0200) (0.0276) (0.0245)
AGE - 0.000148 0.000205 0.0000936
(0.000101) (0.000178) (0.000118)
Log(SIZE) + -0.00992 *** -0.000333 -0.0155 ***
(0.00254) (0.00368) (0.00319)
LOSS + 0.0682 *** 0.126 *** 0.0502 ***
(0.0142) (0.0380) (0.0152)
GROWTH + -0.00203 0.0561 * -0.0232
(0.0137) (0.0278) (0.0157)
GOVERNANCE - -0.00950 *** -0.0112 *** -0.00850 ***
(0.00163) (0.00252) (0.00204)
Constant 0.0937 * 0.001 0.160 ***
(0.0403) (0.0361) (0.0226)
Adjusted R-squared 0.0130 0.0212 0.0127
Observations 13,682 3,323 10,359
Year fixed effects Included Included Included
Industry fixed effects Included Not Included Included
33
Panel B results of estimating model 2:
𝐿𝑜𝑔(𝐴𝑈𝐷𝐼𝑇 𝐹𝐸𝐸)𝑖,𝑡 = 𝛼 + 𝛽1 ∗ 𝐸𝑅𝑀𝑖,𝑡 + 𝛽2 ∗ 𝐵𝐼𝐺 4𝑖,𝑡 + 𝛽3 ∗ 𝐿𝐸𝑉𝐸𝑅𝐴𝐺𝐸𝑖,𝑡 + 𝛽4 ∗ 𝐴𝐺𝐸𝑖,𝑡+ 𝛽5 ∗ log (𝑆𝐼𝑍𝐸)𝑖,𝑡
+𝛽6 ∗ 𝐿𝑂𝑆𝑆𝑖,𝑡 + 𝛽7 ∗ 𝐺𝑅𝑂𝑊𝑇𝐻 + 𝛽8 ∗ 𝐺𝑂𝑉𝐸𝑅𝑁𝐴𝑁𝐶𝐸𝑖,𝑡 + 𝛽9 ∗ 𝑌𝐸𝐴𝑅 𝐹𝐸𝑖,𝑡
+𝛽10 ∗ 𝐼𝑁𝐷𝑈𝑆𝑇𝑅𝑌 𝐹𝐸𝑖,𝑡 + 𝜀𝐴𝑈𝐷𝑇𝐼𝑇 𝐹𝐸𝐸
Coefficient
Independent variable Predicted
sign
(1)
Full sample
(2)
Financial industry
(3)
Non-financial industry
ERM - -0.112 *** -0.0156 0.130 *
(0.0321) (0.0313) (0.0577)
BIG 4 + 0.0744 *** 0.152 *** 0.0216
(0.0121) (0.0319) (0.0123)
LEVERAGE + -0.234 *** -1.623 *** 0.286 ***
(0.0311) (0.0882) (0.0300)
AGE - 0.0000889 -0.00154 *** 0.00153 ***
(0.000146) (0.000278) (0.000149)
Log(SIZE) + 0.557 *** 0.657 *** 0.507 ***
(0.00375) (0.00804) (0.00375)
LOSS + 0.209 *** 0.289 *** 0.171 ***
(0.0142) (0.0407) (0.0139)
GROWTH + -0.0336 -0.0334 -0.0803 ***
(0.0198) (0.0479) (0.0198)
GOVERNANCE - -0.0111 *** -0.0405 *** 0.0114 ***
(0.00262) (0.00528) (0.00274)
Constant 10.122 *** 9.853 *** 10.017 ***
(0.0949) (0.0704) (0.105)
Adjusted R-squared 0.727 0.712 0.773
Observations 13,682 3,323 10,359
Year fixed effects Included Included Included
Industry fixed effects Included Not included Included
Note: The first column presents the different variables and regression statistics. The second column presents the
predicted sign the variable of first column has in the dependent variable. Columns (1), (2) and (3) present the
regression coefficients of the corresponding variables in the first column with standard errors in parentheses. The
asterisks indicate the level of significance where ***, ** and * stand for p-value<0.1%, p-value<1% and p-
value<5%, respectively. The number of observations is reported in firm year observations. Additionally, the adjusted
R-squared, the number of firm year observations are included. The table also indicates whether fixed and/or industry
effects are included. The financial industry represents a sample of all finance, insurance and real estate firm year
observations. The non-financial industry represents a sample of all remain firm year observations.

34
4.4 Robustness check
In this section, I perform various robustness checks and study the impacts of these checks
on my results. Table 7 presents the regression results of the various robustness checks, where
panel A presents the results for model 1 and panel B presents the results for model 2. Again, I
perform the regression of models 1 and 2 for; the entire sample, the sample including only
financial firms and the sample including only non-financial firms. I compare the results of Table
7 to the results reported in Table 6.
First, I rerun model 1 without taking the natural logarithm of SIZE; these results are
presented in panel A.12
The sign and p-value of the ERM coefficient for all three samples are
comparable to the results presented in Table 6. The same procedure is undertaking using model 2
where, additionally, log(AUDIT FEE) is replaced by AUDIT FEE. These results are presented in
panel B of table 7. The ERM coefficient for both the full sample as the non-financial industry of
model 2 has a lower significance level. This means ERM and audit fees most likely do not have a
linear relation. The ERM coefficient using model 2 one can be interpreted as the percentage
change in the amount of audit fees when a firm is hypothesized to have an ERM framework.
Whereas the ERM coefficient when using audit fees, without using its natural logarithm, is
interpreted as an absolute increase in the amount of audit fees. Common sense of course dictates
that the relation of ERM on audit fees is more likely to be relative as opposed to absolute, similar
for SIZE.
Secondly, I check if winsorizing both variables AGE and GROWTH harms the
regression results. The ERM coefficients for model 1 and 2 using the unwinsorized observations
are presented in respectively panel A and panel B of Table 7. For both models I do not find any
noticeable changes in the ERM coefficient. Thirdly, I exclude the public administration industry,
since this industry had substantially large audit fees and no ERM observations. This presents no
notable changes for both models 1 and 2. Note that the ERM coefficient for model 1 and 2 of the
financial industry is the same as reported in Table 7, since no the exclusion of the public
administration industry has no effect on the observations in the financial industry.
Lastly, I merge the full sample used throughout the thesis with the segment data extracted
from Compustat used to construct the COMPLEXITY measure, where COMPLEXITY equals
the sum of business and geographical segments for each firm. The merging process resulted in
12
Although not presented in Table 7, replacing log(SIZE) by SIZE made no noticeable changes to the SIZE
coefficient for models 1 or 2 in any sample.

35
1,445 unmatched firm year observations which accounted for approximately 12% of the initial
observations. Remarkably, 20% of the 1,445 firm year observations are observations with an
identified ERM framework, accounting for half of the initial amount of ERM observations. This
average amount of relative ERM observations is five times higher than the average amount of the
entire sample, which is equal to only 4%. Almost all of the unmatched observations are financial
firms, which explains the high relative amount of ERM observations in the unmatched sample.
The sample created after merger with the dataset used to measure COMPLEXITY is referred to
as the Complexity sample and the sample unmatched observations is referred to as the
Unmatched sample. Panel A presents the ERM coefficient by preforming the regression of model
1, additionally controlling for complexity using the Complexity sample. The sign for the
coefficient of ERM changes, however, the sign is still insignificant.
More notable are the changes to the results of model 2 with complexity as an additional
control variable. The coefficient for ERM using the entire sample has changed from an
insignificant negative coefficient to a significant positive coefficient. To elaborate on this I
included Table 8 comparing the full sample with the complexity sample and the unmatched
sample. The mean SIZE and LEVERAGE of the unmatched sample is substantially higher
compared to the sample used in the regression analysis; however mean AUDIT FEE shows no
noticeable differences.
As previously mentioned, the unmatched sample is primarily composed of financial firms
with a relatively large number of ERM observations. Additionally, Table 8 shows the mean SIZE
and LEVERAGE of the unmatched firms is substantially higher compared to the sample used in
the regression analysis. This largely explains the difference in signs for the ERM coefficient,
since relatively larger firms with comparable audit fees are eliminated and size is the main cause
for variation in audit fees. Meaning, where previously the higher AUDIT FEE for ERM was
partially explained by a likewise higher SIZE, this is now partially explained by ERM, hence the
positive since.
I am interested if the change in the results of model 2 is due to the inclusion of control
variable COMPLEXITY. Therefore, I use rerun model 2 without COMPLEXITY as a control
variable using the Complexity sample. These results are similar to the result where
COMPLEXITY was included. The coefficient for ERM in the non-financial sample has a higher
p-value. This means COMPLEXITY accounts for some of the variation in AUDIT FEE, since

36
the inclusion of COMPLEXITY in model 2 decreases the significance level of the relation of
ERM on AUDIT FEE.
In conclusion, the results for model 1, which explain the relation between ERM and
internal control quality, are robust to changes. With the exception of using unwinsorized
observations, the magnitude or sign of the ERM coefficients are similar across panel A. The
ERM coefficients for model 2 are not robust, since the sign and significance for both the full
sample and the sample of financial firms change in sign and significance in various robustness
checks.
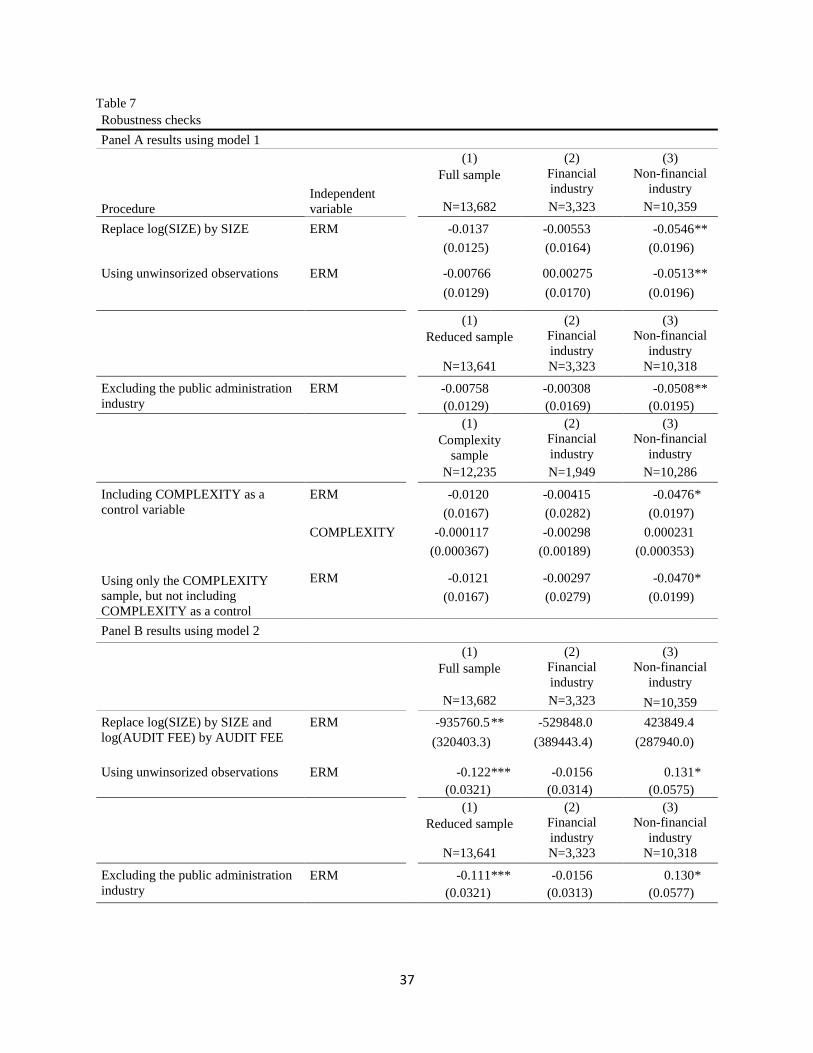
37
Table 7
Robustness checks
Panel A results using model 1
Procedure
Independent
variable
(1)
Full sample
(2)
Financial
industry
(3)
Non-financial
industry
N=13,682 N=3,323 N=10,359
Replace log(SIZE) by SIZE ERM -0.0137 -0.00553 -0.0546 **
(0.0125) (0.0164) (0.0196)
Using unwinsorized observations ERM -0.00766 00.00275 -0.0513 **
(0.0129) (0.0170) (0.0196)
(1)
Reduced sample
(2)
Financial
industry
(3)
Non-financial
industry
N=13,641 N=3,323 N=10,318
Excluding the public administration
industry
ERM
-0.00758 -0.00308 -0.0508 **
(0.0129) (0.0169) (0.0195)
(1)
Complexity
sample
(2)
Financial
industry
(3)
Non-financial
industry
N=12,235 N=1,949 N=10,286
Including COMPLEXITY as a
control variable
ERM -0.0120 -0.00415 -0.0476 *
(0.0167) (0.0282) (0.0197)
COMPLEXITY -0.000117 -0.00298 0.000231
(0.000367) (0.00189) (0.000353)
Using only the COMPLEXITY
sample, but not including
COMPLEXITY as a control
ERM -0.0121 -0.00297 -0.0470 *
(0.0167) (0.0279) (0.0199)
Panel B results using model 2
(1)
Full sample
(2)
Financial
industry
(3)
Non-financial
industry
N=13,682 N=3,323 N=10,359
Replace log(SIZE) by SIZE and
log(AUDIT FEE) by AUDIT FEE
ERM
-935760.5 ** -529848.0 423849.4
(320403.3) (389443.4) (287940.0)
Using unwinsorized observations ERM
-0.122 *** -0.0156 0.131 *
(0.0321) (0.0314) (0.0575)
(1)
Reduced sample
(2)
Financial
industry
(3)
Non-financial
industry
N=13,641 N=3,323 N=10,318
Excluding the public administration
industry
ERM
-0.111 *** -0.0156 0.130 *
(0.0321) (0.0313) (0.0577)

38
(1)
Complexity
sample
(2)
Financial
industry
(3)
Non-financial
industry
N=12,235 N=1,949 N=10,286
Including COMPLEXITY as a
control variable
ERM 0.136 *** 0.188 *** 0.127 *
(0.0373) (0.0526) (0.0538)
COMPLEXITY 0.0147 *** 0.0253 *** 0.0135 ***
(0.000555) (0.00218) (0.000556)
Using only the COMPLEXITY
sample, but not including
COMPLEXITY as a control
ERM 0.145 *** 0.178 ** 0.165 **
(0.0396) (0.0589) (0.0558)
Note: This table presents the regression statistics of model 1 and model 2. Columns (1), (2) and (3) present the
regression coefficients with standard errors in parentheses for the sample of all industries, the sample of only
financial firm and the sample of only non-financial firms respectively. N denotes the number of firm year
observations. The asterisks indicate the level of significance where ***, ** and * stand for p-value<0.1%, p-
value<1% and p-value<5%, respectively. The financial industry represents a sample of all finance, insurance and
real estate firm year observations. The non-financial industry represents a sample of all firm year observations not
in the financial industry sample.
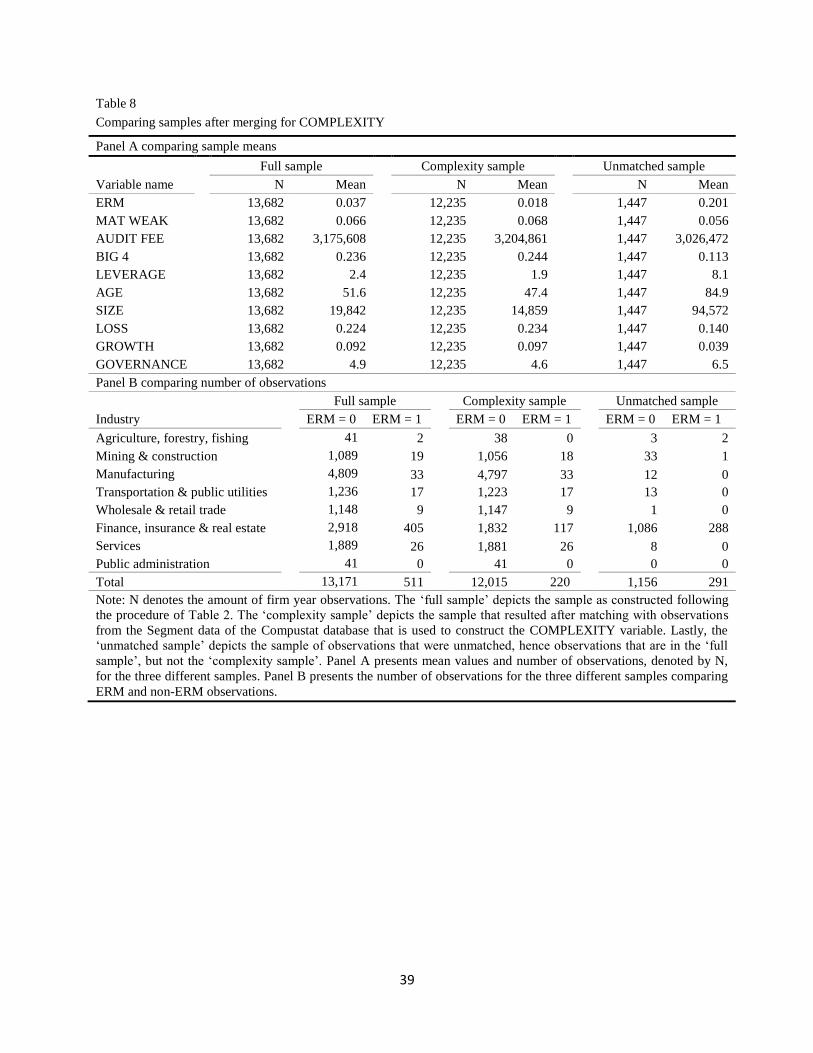
39
Table 8
Comparing samples after merging for COMPLEXITY
Panel A comparing sample means
Full sample Complexity sample Unmatched sample
Variable name
N Mean N Mean N Mean
ERM 13,682 0.037 12,235 0.018 1,447 0.201
MAT WEAK 13,682 0.066 12,235 0.068 1,447 0.056
AUDIT FEE 13,682 3,175,608 12,235 3,204,861 1,447 3,026,472
BIG 4 13,682 0.236 12,235 0.244 1,447 0.113
LEVERAGE 13,682 2.4 12,235 1.9 1,447 8.1
AGE 13,682 51.6 12,235 47.4 1,447 84.9
SIZE 13,682 19,842 12,235 14,859 1,447 94,572
LOSS 13,682 0.224 12,235 0.234 1,447 0.140
GROWTH 13,682 0.092 12,235 0.097 1,447 0.039
GOVERNANCE 13,682 4.9 12,235 4.6 1,447 6.5
Panel B comparing number of observations
Full sample Complexity sample Unmatched sample
Industry ERM = 0 ERM = 1 ERM = 0 ERM = 1 ERM = 0 ERM = 1
Agriculture, forestry, fishing 41 2 38 0 3 2
Mining & construction 1,089 19 1,056 18 33 1
Manufacturing 4,809 33 4,797 33 12 0
Transportation & public utilities 1,236 17 1,223 17 13 0
Wholesale & retail trade 1,148 9 1,147 9 1 0
Finance, insurance & real estate 2,918 405 1,832 117 1,086 288
Services 1,889 26 1,881 26 8 0
Public administration 41 0 41 0 0 0
Total 13,171 511 12,015 220 1,156 291
Note: N denotes the amount of firm year observations. The ‘full sample’ depicts the sample as constructed following
the procedure of Table 2. The ‘complexity sample’ depicts the sample that resulted after matching with observations
from the Segment data of the Compustat database that is used to construct the COMPLEXITY variable. Lastly, the
‘unmatched sample’ depicts the sample of observations that were unmatched, hence observations that are in the ‘full
sample’, but not the ‘complexity sample’. Panel A presents mean values and number of observations, denoted by N,
for the three different samples. Panel B presents the number of observations for the three different samples comparing
ERM and non-ERM observations.
40
5. Discussion and Conclusion
5.1 Conclusion
This paper investigates if there is a positive relation between ERM and internal control
quality, using both the appointment of a CRO and the existence of a risk committee as a proxy
for the existence of an ERM framework. Through the use of data available through the WRDS
database I composed a sample of firms located in the United States with a total of 13,682 firm
year observations. The descriptive statistics show that the majority of the ERM observations are
clustered in the financial industry, which largely explains why the ERM firms in my sample are
larger and more levered.
I study the relation of ERM and internal control quality by using both the amount of
reported material weaknesses and the amount of reported audit fees as a proxy. By means of an
OLS regression I study both relations. The relation between ERM and the amount of reported
material weaknesses is insignificant and negative. Only when all financial firms are eliminated
do I find a negative significant relation. Given that, the sample of non-financial firms has too few
ERM observations to make a general statement, I cannot reject null hypothesis H10, which states
ERM has no relation with the amount of reported material weaknesses.
Next, I study the relation between ERM and the amount of reported audit fees. I find a
significant negative coefficient for ERM. I am able to reject the null hypothesis stating ERM has
no relation to the reported amount of audit fees. However, this result has to be interpreted with
caution since the sign of the ERM coefficient when all financial firms are eliminated is
significantly positive. Additionally, The ERM coefficient when using only financial firms,
considering the large majority of ERM observations are financial firms, is negative and
insignificant. Additionally, the results are not robust to the various robustness checks I
performed.
Furthermore, this study is subject to a possible omitted variable bias, where this omitted
variable is related to both ERM and internal control quality; hence responsible for some of the
explained relation between ERM and internal control quality measured by the OLS regression.
The result of the omitted variable bias is that I cannot conclude the changes in internal control
quality measured by the ERM coefficient of the OLS regression is solely the result of the
implementation of an ERM framework.

41
Additionally, I am unable to reject the possibility of a simultaneity bias, where the
relation of ERM on internal control quality goes both ways. The opposing relation is explained
by the internal control quality of a firm that has a significant effect on the implementation of
ERM. For this reason I am unable to predict the direct of the relation.
To conclude, I find no significant relation for ERM using both proxies of internal control
for the financial industry. The separation between these two industries is important due to the
often complex structure of financial firms, making them hard to comparable. Again, the majority
of ERM observations are financial firms. For this reason I conclude I fail to find that the
existence of an ERM framework improves internal control.
This is a concerning though as more and more public pressure and also the interest of
firms aim towards a more holistic approach to risk management. For this reason I argue
disclosure, or assessment by and external auditor, of risk management practices is greatly
recommended.
Additionally, I find a negative sign for the ERM coefficient of the financial industry and
a positive sign non-financial industry. An alternative explanation for this result is that the quality
of ERM differs between the financial industry and non-financial industry. As reported by the
majority of the prior literature, ERM is must more common and developed in the financial
industry.
5.2 Limitations
There are a number of concerns regarding the limitations of this study. Firstly, the
identification of ERM within a firm is difficult, since disclosure of ERM activities is not
mandatory. A lack of solid ERM measures means that ERM literature struggles to identify the
implications of ERM. This study used the identification of a CRO or risk committee as a
measure for ERM, which is an indirect measure of ERM. The strength of my results relies on the
ability of my proxy for ERM to identify firms with a hypothesized ERM framework.
Additionally, for the hypothesized effect of ERM on internal control it is assumed that the ERM
framework is well developed. Since the quality of ERM framework is unclear, I might observe
firm year observations with an ERM framework of insufficient quality, or low level of
implementation, which does not have the desired effect on the internal control quality. This
might be the cause for the insignificant ERM coefficients I found.

42
Secondly, the various robustness checks showed that the results used to test the relation
of ERM on audit fees are not robust. This is particularly true of merging with the sample used to
compute the COMPLEXITY variable, which significantly changed the coefficients of the
variables of interest. For the results regarding the regression used to test the relation of ERM on
internal control quality, nothing notable changed.
Moreover, the limited number of ERM observations in the non-financial industry affected
the results, especially those concerning the relation of ERM on internal control quality. For the
non-financial firms, only one firm year observation has reported material weaknesses greater
than zero. For this reason the non-financial sample is not noticeably interesting to investigate
regarding internal control quality. By using the amount of reported material weaknesses as a
proxy for internal control quality, I am not able to distinguish between different qualities of
internal control if a firm has zero reported material weaknesses. The number of non-financial
observations in the ERM sample is equal to 105. The average expected number of firms
reporting material weaknesses according to the sample average is between 4 and 5.13
The number
of non-financial observations in the ERM sample needs to increase by a multiple of at least 10 to
be able to detect any difference between firms who have implemented ERM and those who have
not.
Lastly, McKinsey&Company (2012) state that an audit committee discusses risks those
primarily involve compliance with law and informal strategic decision making. When a firm
evolves in its risk management practices and risk-return trade-offs are involved, the board
decides to upgrade the mind-set and capabilities of the audit committee. However, the board does
not necessarily change the name from audit committee to risk committee or establish a separate
risk committee. This means that, while some firms do have an ERM framework, this cannot be
observed in this study since it is this operating under the name of audit committee.
5.3 Future research
As ERM has become more and more popular since the late 20th
century (Liebenberg and
Hoyt, 2003) and the growing number of firms who implemented ERM will solve some of the
limitations encountered in this study. Future research further exploring the effects of ERM will
13
There are 105 non-financial observations in the ERM sample and the average amount of firms reporting material
weaknesses greater than zero is 4.5%, see table 3. 106*0.045 = 4.725.
43
stimulate this process. As mentioned before, ERM literature is still in its pre-paradigm state,
meaning future research on proper improved constructs for ERM is greatly encouraged. In future
studies I recommend studying specific risk benefits of ERM, since the relation between ERM
and internal control is based on the consequences of ERM on the audit committee. An interesting
topic for future research is the relation between ERM and audit committee quality. Additionally,
as empirical literature struggles to identify the true benefits of ERM, I recommend conducting a
survey on the different firm motivations for ERM implementations.

44
6. References
Bank for International Settlements (2013). Principles for effective risk data aggregation and risk
reporting PDF file. Retrieved from http://www.bis.org/publ/bcbs239.pdf
Bates, E. W., & Leclerc, R. J. (2009). Boards of directors and risk committees. The Corporate
Governance Advisor, 17(6), 16-18.
Baxter, R., Bedard, J. C., Hoitash, R., & Yezegel, A. (2013). Enterprise risk management
program quality: Determinants, value relevance, and the financial crisis. Contemporary
Accounting Research, 30(4), 1264-1295.
Beasley, M. S., Clune, R., & Hermanson, D. R. (2005). Enterprise risk management: An
empirical analysis of factors associated with the extent of implementation. Journal of
Accounting and Public Policy, 24(6), 521-531.
Beasley, M., Pagach, D., & Warr, R. (2007). Information conveyed in hiring announcements of
senior executives overseeing enterprise-wide risk management processes. Journal of
Accounting, Auditing & Finance, 23(3), 311-332.
Bedard, J. 2006. Sarbanes Oxley internal control requirements and earnings quality. Working
paper, University of Laval.
Committee of Sponsoring Organizations of the Treadway Commission. COSO, (1992). Internal
Control - Integrated Framework: Committee of Sponsoring Organizations of the Treadway
Commission.
Committee of Sponsoring Organizations of the Treadway Commission. COSO, (2004).
Enterprise Risk Management - Integrated Framework: Committee of Sponsoring
Organizations of the Treadway Commission.

45
Doyle, J., Ge, W., & McVay, S. (2007). Determinants of weaknesses in internal control over
financial reporting. Journal of Accounting and Economics, 44(1), 193-223.
Edmondson, A. C., & McManus, S. E. (2007). Methodological fit in management field research.
Academy of Management Review, 32(4), 1246-1264.
Ellul, A., & Yerramilli, V. (2013). Stronger risk controls, lower risk: Evidence from US bank
holding companies. The Journal of Finance, 68(5), 1757-1803.
Gordon, L. A., Loeb, M. P., & Tseng, C. Y. (2009). Enterprise risk management and firm
performance: A contingency perspective. Journal of Accounting and Public Policy, 28(4),
301-327.
Grace, M. F., Leverty, J. T., Phillips, R. D., & Shimpi, P. (2015). The value of investing in
enterprise risk management. Journal of Risk and Insurance, 82(2), 289-316.
Hay, D. C., Knechel, W. R., & Wong, N. (2006). Audit Fees: A Metaanalysis of the Effect of
Supply and Demand Attributes. Contemporary Accounting Research, 23(1), 141-191.
Hoitash, R., Hoitash, U., & Bedard, J. C. (2008). Internal control quality and audit pricing under
the Sarbanes-Oxley Act. Auditing: A Journal of Practice & Theory, 27(1), 105-126.
Hoyt, R. E., & Liebenberg, A. P. (2011). The value of enterprise risk management. Journal of
Risk and Insurance, 78(4), 795-822.
Kleffner, A. E., Lee, R. B., & McGannon, B. (2003). The effect of corporate governance on the
use of enterprise risk management: Evidence from Canada. Risk Management and Insurance
Review, 6(1), 53-73.

46
Kraus, V., & Lehner, O. M. (2012). The nexus of enterprise risk management and value creation:
A systematic literature review. ACRN Journal of Finance and Risk Perspectives, 1(1), 91-
163.
Krishnan, J. (2005). Audit Committee Quality and Internal Control: An Empirical Analysis. The
Accounting Review, 80(2), 649-675.
Kuhn, T. S. (1963). The function of dogma in scientific research. Scientific Change, 347-369.
Liebenberg, A. P., & Hoyt, R. E. (2003). The determinants of enterprise risk management:
Evidence from the appointment of chief risk officers. Risk Management and Insurance
Review, 6(1), 37-52.
Lin, Y., Wen, M. M., & Yu, J. (2012). Enterprise risk management: Strategic antecedents, risk
integration, and performance. North American Actuarial Journal, 16(1), 1-28.
McKinsey & Company (2012). Enterprise Risk Management: What’s different in the corporate
world and why. McKinsey working papers on risk, number 40.
McShane, M. K., Nair, A., & Rustambekov, E. (2011). Does enterprise risk management
increase firm value?. Journal of Accounting, Auditing & Finance, 26(4), 641-658.
Pagach, D., and Warr, R. (2010). The Effects of Enterprise Risk Management on Firm
Performance, Working Paper, North Carolina State University, Raleigh.
Public Company Accounting Oversight Board (PCAOB), 2004. Auditing Standard No. 2—An
Audit of Internal Control over Financial Reporting Performed in Conjunction with an Audit
of Financial Statements.
Sarbanes Oxley Act. (2002). Public Law 107–204.

47
Seik, H. Y., Yu, J., & Li, J. (2011). Enterprise Risk Management in Financial Crisis. IUP Journal
of Risk & Insurance, 8(3), 7.
Standard & Poor's. (2013). Enterprise Risk Management. Standard & Poor's Financial Services
LLC.
Stulz, R. M. (1996). Rethinking risk management. Journal of Applied Corporate Finance, 9(3), 8-
25.
Stulz, R. M. (2003). Rethinking risk management, The Revolution in Corporate Finance, 4th
Edition, Oxford: Blackwell Publishing, 367-384.

48
Appendix A: Libby box
Figure A
Note: The Libby Box depicts the relation between the conventional variable on the top row and the construct
variable on the middle row. Moreover, the relations between the independent variable in the first column and the
dependent variable in the second column are illustrated. Additionally, the different control variables are given in the
bottom right corner.
Dependent variable Independent variable C
o
n
c
e
p
t
u
a
l
ERM Internal control quality
ERM =
{1 = for firms who have a
hypothesized ERM framework
0 = for firms who do not have a
hypothesized ERM framework }
Number of material weaknesses
Audit fees
O
p
e
r
a
t
i
o
n
a
l
Type of auditor
Leverage
Firm age
Firm size
Financial health
Growth
Governance
Year FE
Industry FE
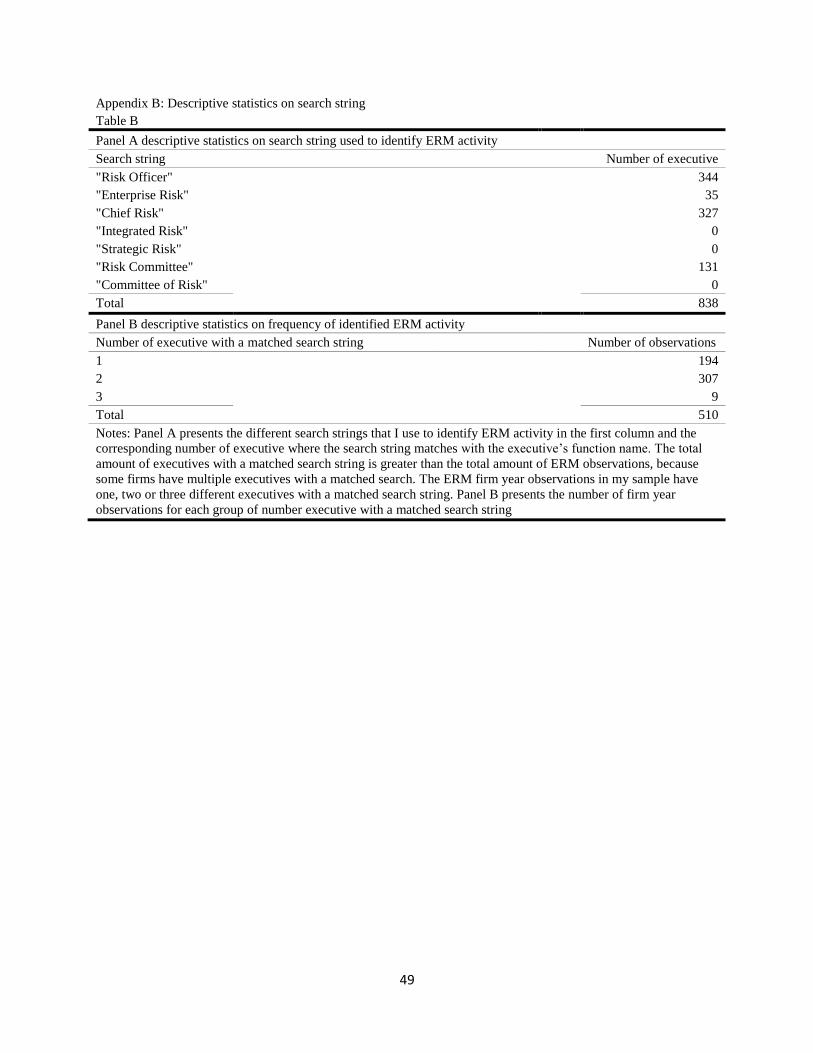
49
Appendix B: Descriptive statistics on search string
Table B
Panel A descriptive statistics on search string used to identify ERM activity
Search string Number of executive
"Risk Officer" 344
"Enterprise Risk" 35
"Chief Risk" 327
"Integrated Risk" 0
"Strategic Risk" 0
"Risk Committee" 131
"Committee of Risk" 0
Total 838
Panel B descriptive statistics on frequency of identified ERM activity
Number of executive with a matched search string Number of observations
1 194
2 307
3 9
Total 510
Notes: Panel A presents the different search strings that I use to identify ERM activity in the first column and the
corresponding number of executive where the search string matches with the executive’s function name. The total
amount of executives with a matched search string is greater than the total amount of ERM observations, because
some firms have multiple executives with a matched search. The ERM firm year observations in my sample have
one, two or three different executives with a matched search string. Panel B presents the number of firm year
observations for each group of number executive with a matched search string