master thesis: bank capital requirements and …s3.amazonaws.com/zanran_storage/ thesis examines...
TRANSCRIPT

Master Thesis:
Bank Capital Requirements and Performance
Student:
Lilia Mukhlynina
Supervisor:
Prof. Kjell G. Nyborg
Department of Banking and Finance
University of Zurich
Januar 2012

AbstractThis thesis examines possible effects of stricter capital regulations on banks. Following
the history of Basel Accords, the focus of analysis lies on capital supervision and control.
An issue for controversial discussions among bankers and academics, Basel III is to be
implemented in the coming years as a response to the last financial crisis. Core element of
the new directive is the requirement to raise the proportion of equity in the bank capital
structure. The main reasoning is that equity is the loss-absorbing source of financing and
when increased, will help to reduce the probability and severity of systemic risks. This
initiative caused an intense opposition from the bankers’ side who claim, equity is too
expensive compared to debt. They argue that more equity will negatively affect bank
profits, lowering its lending abilities and eventually leading to a credit crunch. The thesis
analyses both stand points of the debate with the conclusion that equity funding is not
expensive per se. The justification of the opposite opinion can only be true under certain
conditions, which include tax deductibility of debt and government guarantees. In this case,
the paradoxical nature of government measures becomes obvious: strengthening the rules
on capital and, at the same time giving incentives for debt financing. Until the internal
contradictions are solved and the message of the authorities is clear, the probability that
financial institutions become risk-averse and stock up their capital reserves remains low.
Keywords: cost of capital, Miller-Modigliani proposition, Basel Accord, leverage, capital structure

Contents
Page
Abstract . . . . . . . . . . . . . . . . . . . . . . . . . . . . . . . . . . . . . . . . . . i
Table of Contents . . . . . . . . . . . . . . . . . . . . . . . . . . . . . . . . . . . . . ii
1 Evolution of Bank Regulations . . . . . . . . . . . . . . . . . . . . . . . . . . . . 5
1.1 Birth of Capital Regulation . . . . . . . . . . . . . . . . . . . . . . . . . . 5
1.2 Capital Regulation Before Basel . . . . . . . . . . . . . . . . . . . . . . . 6
1.3 Basel I . . . . . . . . . . . . . . . . . . . . . . . . . . . . . . . . . . . . . . 9
Definition of Capital . . . . . . . . . . . . . . . . . . . . . . . . . . . . . . 10
Risk Weights . . . . . . . . . . . . . . . . . . . . . . . . . . . . . . . . . . 11
Amendments . . . . . . . . . . . . . . . . . . . . . . . . . . . . . . . . . . 12
Evaluation of Basel I . . . . . . . . . . . . . . . . . . . . . . . . . . . . . . 13
1.4 Basel II . . . . . . . . . . . . . . . . . . . . . . . . . . . . . . . . . . . . . 16
Consultative Papers . . . . . . . . . . . . . . . . . . . . . . . . . . . . . . . 17
Structure of the Accord . . . . . . . . . . . . . . . . . . . . . . . . . . . . . 18
Basel II: Pillar I in Detail . . . . . . . . . . . . . . . . . . . . . . . . . . . 19
Evaluation of Basel II . . . . . . . . . . . . . . . . . . . . . . . . . . . . . . 22
1.5 Basel III . . . . . . . . . . . . . . . . . . . . . . . . . . . . . . . . . . . . . 26
Features in Review . . . . . . . . . . . . . . . . . . . . . . . . . . . . . . . 26
Future of Basel III . . . . . . . . . . . . . . . . . . . . . . . . . . . . . . . 29
2 Debt vs Equity . . . . . . . . . . . . . . . . . . . . . . . . . . . . . . . . . . . . 32
2.1 The Logic of Miller and Modigliani . . . . . . . . . . . . . . . . . . . . . . 32
Does M&M Apply to Banks? . . . . . . . . . . . . . . . . . . . . . . . . . 33
2.2 Market Distortions Due to Government Interventions . . . . . . . . . . . . 35
Taxes . . . . . . . . . . . . . . . . . . . . . . . . . . . . . . . . . . . . . . . 35
Bankruptcy, Bank Runs and Deposit Insurance . . . . . . . . . . . . . . . 38
2.3 Is Debt a Carrot or a Stick? . . . . . . . . . . . . . . . . . . . . . . . . . . 42
2.4 Banker’s Argument . . . . . . . . . . . . . . . . . . . . . . . . . . . . . . . 44
3 Empirical Evidence . . . . . . . . . . . . . . . . . . . . . . . . . . . . . . . . . . 47
3.1 Previous Studies . . . . . . . . . . . . . . . . . . . . . . . . . . . . . . . . 47
3.2 The Model . . . . . . . . . . . . . . . . . . . . . . . . . . . . . . . . . . . . 49
Selection of Variables . . . . . . . . . . . . . . . . . . . . . . . . . . . . . . 49
Relationship Expectations . . . . . . . . . . . . . . . . . . . . . . . . . . . 50
Data . . . . . . . . . . . . . . . . . . . . . . . . . . . . . . . . . . . . . . . 52
ii

Data Analysis . . . . . . . . . . . . . . . . . . . . . . . . . . . . . . . . . . 53
Regression Analysis . . . . . . . . . . . . . . . . . . . . . . . . . . . . . . . 55
4 Evaluation . . . . . . . . . . . . . . . . . . . . . . . . . . . . . . . . . . . . . . . 59
4.1 Proposals to Capital Regulation . . . . . . . . . . . . . . . . . . . . . . . . 59
4.2 Is Debt Expensive? . . . . . . . . . . . . . . . . . . . . . . . . . . . . . . . 61
Appendix . . . . . . . . . . . . . . . . . . . . . . . . . . . . . . . . . . . . . . . . . 63
Introduction
Motivation
A bank exists to facilitate the interaction between two parties. Being an intermediary insti-
tution, it plays a significant role in the financial system and society, who therefore depend
on its prudence and health. More than any other business entities, banks are extremely
interconnected with each other, which can lead to a domino effect in times of trouble.
Due to its high involvement in people’s lives, any malfunction becomes crucial, revealing
a considerable scale of adverse externalities. Such structural fragility also comes from the
bank-specific balance sheet that contains low portion of cash and capital reserves relative
to debt.
Banking is a spread business, which lives from the difference between receiving and pay-
ing interest on capital. To generate an income bank attempts to keep high interest rates
on its services while securing cheap access to the capital. Hence the price of financing
determines its structure. As equity predominantly perceived to be more expensive than
debt, it is plausible, that banks maintain high ratios of debt trying to lever up its earnings.
In this context it is also understandable why bank executives build an opposition against
strengthened capital requirements, which imply substantial raise in equity. Their claims
do not seem wrong, but the question is how they define expensiveness and at which cost
comes the “cheapness” of debt.
The problem of optimal capital structure is not new. The first thorough research on the
subject started with the article of M. Miller and F. Modigliani in the American Economic
Review: “The Cost of Capital, Corporation Finance and the Theory of Investment”. The
economists illuminated the fact, that whatever financial structure the firm might have, it
is completely irrelevant to its value, which depends only on the income from its assets.
This statement sounds contradictory to the managers’ behavior, who compose their bank
balance sheet according to the price for capital resources. That is however consistent with
the theory. The Miller and Modigliani Irrelevance Theorem (M&M henceforth) holds only
under certain assumptions, such as operating in perfect financial markets, with no transac-
tion or bankruptcy costs, no taxes, symmetric information or any other arbitrage allowing
frictions. As such ideal conditions are only theoretically possible, the proposition is better
used as a scale to measure market distortions. In other words, which of the prerequisites
2

may fail in order the capital structure to matter? Having an answer to this question and
modifying the corresponding parameters, it is possible to steer the form of funding. The
most common mechanisms that authorities apply to banks are taxes and deposit guaran-
tees. Under the current regulatory framework, debt has two major advantages over equity.
First, debt possesses the advantage of tax shield and second, it provides a safety net, as
the government gives subsidies and therefore is taking over a portion of risk. That allows
banks to pay investors less and thus to generate more income. Lacking such favorable char-
acteristics, equity is perceived to be more expensive. It is true, but cannot be generalized.
One has to distinguish between social and private costs. The same conditions do not have
the same implications for banking executives and for shareholders; the correlation of their
individual interests is often negative. It is also important to mention the time perspective.
In the short term, benefits of cheap financing may overweigh the risk concerns. But in
the long term, the probability of default will rise, making leveraged structure highly fragile
and expensive. Many economists point out, that the system designed today gives the man-
agement incentives to pile up debt and to shun equity, and thereby setting the economic
system on the brink of failure.
It is therefore very interesting to follow the evolution of capital regulation from the roots
to the modern concepts. Such analysis might help to see how particular rules formed the
structure and behavior of banking institutions and maybe it will help to identify the tools
that bring financial markets closer to the optimal functioning.
Structure
The thesis is organized in three parts. The first part is dedicated to the evolution of capital
regulation. The historical overview starts with the earliest attempts to set some rudimen-
tary capital rules the banking institutions should comply with. It continues with Basel
Accords, following the development of the directives from 1988 to the latest regulatory
initiatives. The purpose is not only to list the events in their chronological order, but also
to analyze the reasoning that lied behind the introduction of certain requirements, as well
as consequences and market response.
The second part is the core element of the paper. It contains the collection of arguments
from different market participants: academics and practitioners, “leverage defenders” and
those, who support an expansion of equity. To understand the rationale for particular
positions, it might be helpful to choose a starting point, which in this case would be M&M
Proposition. The first question which appears in the context is whether the Theorem holds
3

for banks. After having this point covered, we move to the extensive analysis of debt and
equity as building blocks of bank liabilities. This thesis examines the roles both types
of financing play privately and socially, the costs and benefits they create and how they
are perceived by the different kinds of discussion participants. The analysis is based on
the review of the advances in scientific literature, media contributions to the subject and
interviews with banking executives1.
The last section covers empirical evidences to the subject. The sample of European banks
was used to evaluate the effect of leverage on a bank’s performance. Return on assets
and equity, residual returns and price-to-book ratio were chosen as a profitability measure,
whereas capital tier 1 ratio served as an indicator for leverage. The null-hypothesis is the
validity of M&M Proposition, meaning that the regression coefficients are not significantly
different from zero. Overview of the results is included in the part of data analysis and
tables.
The conclusion is dedicated to the current discussion of capital regulation and academic
proposals and summarizes the findings and thoughts of the thesis.
1Which could not be explicitely included in this thesis.
4

1
Evolution of Bank Regulations
1.1 Birth of Capital Regulation
Although there are a lot of arguments which justify control and supervision of banks,
the question whether and how far the sector has to be regulated remains controversial.
Economist Kevin Dowd (1996, [33]) compares this issue with generally desirable free trade
and asks why the laissez-faire approach could not be applicable for banks. Examining the
possibility of free financial system, he comes to the conclusion that, with no lender of last
resort or government guarantees, the market would be disciplined and punished by deposi-
tors themselves. In his theoretical model, the depositors, being aware of the risks, threaten
to close the accounts when the first signs of danger appear. That induces banks to pursue
conservative lending policy and transparency. Adequate level of capital therefore serves as
an insurance against potential losses to reassure investors. Dowd argues that additional
capitalization, being rather costly, makes a bank safer and more attractive to its depositors.
So the competition between banks would ensure the most appropriate to the customers’
demand degree of capitalization. The exact amount of capital would be determined by
market forces.
Representing the opposite point of view, Professor Sheila Dow (1996, [32]) brings two main
arguments for regulated financial system. She claims that, first, free banking is prone to
extreme cyclicality and second, central banking would automatically emerge in such a sys-
tem, so there is no point in laissez-faire (Dowd, 1996, [33]). Dow bases her position on “the
very special economic role of money and the uncertainty associated with it”. Unlike firms,
banks use their liabilities as money, so the purpose of the regulation is in this case “to
ensure that bank’s assets retain sufficient liquidity to meet any reduction in redeposit, and
to discourage such a reduction in the first place”. In her article “Why the Banking System
Should Be Regulated”, Dow reasons, that “regulation is warranted because the moneyness
of bank liabilities is a public good”. The state in turn “produces moneyness by inspiring
confidence in moneys capacity to retain value (Dow, 1996, [32]).
Following this line of argument, Santos (2000, [79]) derives the necessity to regulate banks
from the role they play in financial intermediation, providing liquidity, monitoring and in-
formation services. Such importance may increase the probability of a systemic crisis and
5

lead to substantial social costs. High interconnectedness and potential exposure to runs
make banks particularly vulnerable to any kind of actual or perceived failure. Thus, the
danger of a destructive chain reaction stimulates the idea of implementing bank insuring
mechanisms.
Another issue comes from the inability of depositors to monitor banking activities. Accord-
ing to the representation hypothesis of Dewatripont and Tirole (1994, [24]), the rationale
for banking regulation is based on agency problems and corporate governance. A bank
structure implies separation of ownership from management, what makes them susceptible
to moral hazard and adverse selection problems. Screening and monitoring, though neces-
sary, could be expensive for single depositors, especially for the small ones. That would also
lead to a free-riding effect. Therefore, the regulation could facilitate the communication
between two sides by taking over the control and supervision that depositors would exert
themselves under these certain conditions (Santos, 2000, [79]).
If the regulation of banks is really crucial for the system, one has to ask why among
other parameters the regulation of bank capital seems to be particularly important. This
can be explained by the fact, that the bank has mainly two sources of financing at its
disposal. Using borrowed money, the bank has to fulfill its contractual liabilities, which, if
not satisfied, can lead to default. Financing its operations with the own funds (equity), the
bank does not expose itself to an immediate failure in case the value of the funds decreases.
Therefore, the bigger the proportion of own capital in the bank balance sheet, the greater
the probability that the institution will comply with its obligations even in difficult times
(FDIC, 2003, [37]).
1.2 Capital Regulation Before Basel
The history of banking regulation starts long before the Basel Accords and experiences a
series of changes from the strict policy to the phases of deregulation.
The earliest attempts to control bank capital can be traced back to 1863, when the new
class of “charter national banks” was created in the US1. Civil War was a heavy weight for
the economy, forcing government to look for funds. Thus, the new national banks were al-
lowed to issue their own currency, backed by the US securities. These were the first entities
to undergo capital requirements, which were based on the population in their service area.
1Before 1863 only state-regulated banks had existed in the US.
6

1913 is the birth year of the US Federal Reserve (FED) as the lender of last resort. That
helped banks to avoid losses by discounting assets instead of selling them at low prices
in case of liquidity problems. After the difficult year of 1929 and the beginning of the
Great Depression, the American Senate took several regulatory measures. On the proposal
of senator Steagall, the Federal Deposit Insurance Corporation (FDIC) was established in
1933. The purpose was to ensure the system from bank runs, providing creditors with gov-
ernment guarantees. At the same time, Senator Glass initiated the creation of a “Chinese
Wall” between investment banking, that issued securities, and commercial banking which
accepted deposits. These rules, known as Glass-Steagall Act, were introduced to protect
investors and to eliminate potential conflict of interest concerning granting and using of
credit by the same institution. Japan soon adopted a similar course of action, whereas
Europe kept its model of universal banking.
After the “golden 1960s” of economic prosperity, Europe experienced the Herstatt bankruptcy2,
when one of the biggest commercial banks in Germany with DM 2 million assets had gone
down. The bank was involved in the foreign exchange business, which after the collapse
of Bretton Woods in 1973 had become a risky activity under the floating exchange rates.
Responding to the consequences of the downfall, the G-10 countries3 formed a standing
committee at the Bank for International Settlements (BIS) in 1975, which later became
the birthplace of the Basel Accords (Balthazar, 2006, [7]).
The lack of consensus between supervisors from different countries at this moment made it
more difficult to work out a universal approach to capital regulation. There were numerous
developments that urged the authorities to turn their focus on capital (Tarullo, 2004, [86]).
In the late 1970s, the economic situation globally deteriorated. The combination of eco-
nomic stagnation and high inflation was named “stagflation”, characterizing the decade of
macroeconomic weakness (FDIC, 2003, [37]). Volatile foreign exchange and interest rates
caused the expansion of non-bank financial institutions (NBFIs), which became direct com-
petitors of banks. Together with rapid growth of capital markets, this effect led to the shift
in the clients’ behavior, who turned their attention from savings accounts to money mar-
ket funds. Losing on their gain margins, the banks began to look for alternative ways
2The Case of Herstatt was one of the largest failures in German banking history. The debacle received
much attention due to its regulatory implications and now is known in finance under the term “Herstatt
risk”, which comes from the time delivery lag between two currencies. The bank was closed in 1974 (BIS,
2004 [11]).3The Group of Ten includes eleven industrial countries: Belgium, Canada, France, Germany, Italy,
Japan, the Netherlands, Sweden, Switzerland, the United Kingdom and the United States. These countries
cooperate on economic, monetary and financial matters.
7

to secure their income, investing in real estate lending and loans to developing countries
(Balthazar, 2006, [7]). The downward trend in capital level, particularly at large banks,
became the point of concern. Looking for new sources of revenue, banks tried to increase
lending, putting their capital under pressure. They involved themselves in leasing and data
processing activities, but also sought for new ways within the traditional credit business.
One possibility to get higher returns fast was to attract borrowers with low credit history
or restricted access to public capital markets, who were ready to pay higher risk premi-
ums. Such a tendency proved to have disastrous consequences later on (Tarullo, 2004, [86]).
This situation of high competitiveness among banks was an unintended result of the partic-
ular macroeconomic strategy in the US, called “Regulation Q”. The Federal Reserve Board,
according to the Banking Act of 1933, prohibited the payment of interest on demand de-
posits and set a ceiling to the interest rates that banks paid for funds. The government
planned to restrain price competition in banking industry and to stabilize the system by
controlling credit flows in the economy. This implied that banks would lend more in their
local area instead of trying to keep pace with the big players. Regulation Q did not af-
fect the volume of total credit, but influenced its allocation. Restricted for the financial
intermediaries, the funds were available in the unregulated markets for a cheaper price.
The policy, complemented by the other restrictions concerning commercial and investment
business, put banks in a difficult position (Gilbert, 1986, [41]; Ruebling, 1970, [77]).
The US “Savings and Loans” institutions (S&L) soon were also in trouble. The 1980
marked the beginning of the S&L crises which took a decade to resolve. Growing fast after
the Great Depression, S&L offered long-term fixed-rate mortgage loans financed through
short-term deposits. Creditworthy borrowers and limited interest rates secured a comfort-
able economic environment. But the recession of the 1970s worsened funding conditions
considerably (Balthazar, 2006, [7]).
Responding to the poor economic development and problems in financial sector, the gov-
ernment started the deregulation campaign that lasted for the next 20 years. In 1980 the
limits on interest rates were abolished and the restrictions on banking activities were in
many ways loosened (Tarullo, 2004, [86]). To compensate for the higher costs of funding,
S&L began to look for riskier opportunities. This and the overall financial instability mo-
tivated the regulators to propose an explicit capital ratio requirement at the federal level.
The first standard was set by the leverage ratio on primary capital, which included equity
and loan loss reserves. Thus, the earliest capital adequacy ratio constituted a minimum of
6% for community banks and 5% for larger regional institutions.
8

In 1982 Mexico defaulted on its USD 80 billion debt, causing substantial write-offs of bad
loans during the next ten years. By 1983, twenty-seven countries had undergone debt re-
structuring processes, involving more than USD 230 billion. The same year the Rumasa
failure4 happened in Spain and one year later, Continental Illinois5 failed on its obligations
after the downgrading and followed bank run. In the US and Europe the government was
working on the uniform capital standards, emphasizing the growing necessity for interna-
tional convergence in bank regulation. As a result, the Congress passed the International
Lending and Supervision Act of 1983 (ILSA), responding to the international debt crisis
and its negative impact on the US. The common definition of regulatory capital and uni-
form capital requirements were finalized in 1985, changing the primary capital ratio for
large banks from 5% and for the community banks from 6% to equal 5.5% of adjusted total
assets. Holding less than 3% of primary-capital-to-total assets, banks were categorized as
“unsafe and unsound” and required to comply with corresponding corrective actions. By
1986 banks were expanding their activities, developing more innovative off-balance sheet
operations and at the same time were moving away from low-yield safe liquid assets. Reg-
ulators sensed the need to review the primary capital ratio as insufficient to differentiate
among newly appeared risks and were looking for ways to systematically consider risk pro-
files of individual banks (FDIC, 2003, [37]). Soon almost all Basel Committee countries
introduced capital ratio calculations, that were progressively based on a risk-weighting of
assets. However, there were substantial differences in the approach and details of capital
regulation among these countries (Tarullo, 2004, [86]).
1.3 Basel I
In July 1988, a working group of the Basel Committee published a set of minimal require-
ments for bank capital. The new Basel Accord mostly addressed to credit risk, leaving
4Rumasa was a diversified holding company with close government links and a conglomerate strategy.
However, it was claimed that Rumasa did not have any real assets and used one company as a collateral
to buy another, building the whole empire in the pyramid fashion. At the time point of expropriation,
the group controlled over 700 companies, employing 65’000 people directly and 300’000 indirectly (Fight,
2004, ([38]).5Continental was the seventh largest bank in the US, which made its default consequential. Regulators,
worried about systemic implications, decided to rescue the bank, injecting USD 2bn. Other USD 5.3m were
granted by a consortium of the twenty-four major US banks and the FED managed its liquidity problems.
One of the first “too-big-to-fail” problems highlighted the concerns about control and possible failure of
large banks (Balthazar, 2006,[7]; FDIC, 1997, [36].
9

other kinds of risk to national regulators6. Targeting primarily on globally active banks,
the proposal outlined two major points: global reduction of competitive inequality among
banks and strengthening of the international banking system (Balthazar, 2006, [7]). To
resolve the first problem, the regulation increased current capital ratios, which seemed to
be too low in some countries. For the second purpose, it introduced a simpler approach to
credit risk, with regard to the risk-taking behavior of banks (van Roy, 2005, [76]).
The core of the initiative could be illustrated by the three steps of calculations. First,
each asset and off-balance sheet item held by the bank had to be assigned to one of the
five risk categories. Second, the capital required for each balance sheet item based on the
risk-weighting had to be determined. Third, these amounts had to be added together to
generate the total minimum capital the bank had to raise and to maintain (Tarullo, 2004,
[86]).
Definition of Capital
According to its quality, capital was divided into two major classes:
• core capital (basic equity): Tier 1
• supplementary capital: Tier 2
The first category contained stockholder equity7 and disclosed reserves8. The most impor-
tant element of capital, it defined bank competitiveness and profit margins. Common for
all banking systems it could be found in the published accounts of different countries where
market estimations of capital adequacy were made (BIS,1988, [9]).
Tier 2 contained undisclosed reserves9, asset revaluation reserves 10, general provisions11,
hybrid debt capital instruments12 and subordinated term debt.
6E.g. investment risk, interest rate risk, exchange rate risk and concentration risk.7Equity capital: common stock and non-cumulative perpetual preferred stock.8Disclosed reserves: e.g. share premiums, retained profit, general and legal reserves.9Undisclosed reserves (hidden reserves): usually unpublished, but considered in P&L account and ac-
cepted by bank supervisory authorities (BIS,1988, [9]).10Accounting standards in some countries allow to revalue assets to their current value rather than
historical costs (BIS,1988, [9]).11Also called general loan-loss reserves, usually built in anticipation of not-yet identified losses (BIS,1988,
[9]).12Capital instruments, which combain partly debt and partly equity characteristics (BIS,1988, [9]).
10

There were also certain deductions from both categories. Goodwill had to be eliminated
from Tier 1, due to its volatile and subjective character. Investments in not consolidated
subsidiaries had to be deduced against the total capital base in order to avoid several en-
tities using the same capital funds (Balthazar, 2006, [7]).
Besides, Tier 2 components had to be limited to a maximum of 100% and subordinated
debt to a maximum of 50% of the Tier 1 capital; general provisions were not allowed to be
more than 1.25 percentage points and asset revaluation reserves in form of latent gains or
unrealized securities were subject to a discount of 55% (Tarullo, 2004, [86]).
The first Basel Accord defined a minimum standard to apply for international banks. The
target ratio of capital to weighted risk assets had to be at least 8%, of which the core
capital had to be minimum 4%.
Risk Weights
After the capital was defined, the Committee worked on identifying factors to weigh the
balance sheet items, according to their risk characteristics. By doing that regulators aimed
to implement a novel approach, advantageous to the simple-ratio procedure. They wanted
to create a fairer international field and level basis for international comparison between
banks with various structures; to incorporate off-balance sheet exposure into the measure
and to stimulate banks to hold liquid or other low-risk assets. The method had to be as
simple as possible, using only five classes of weights: 0, 10, 20, 50 and 100% (Table 4.1).
The assignment of weights was based on the general characteristics of the borrower, rather
than borrower’s specific financial stand or credit history. That was the reason, for example,
to weigh all loans to non-banking entities at 100%, whether it was a blue-chip corporation
or a newly born startup.
There were several elements that deserved particular attention:
• categories of risk
It was emphasized that credit risk was the major issue for most banks, so the regu-
lation stressed the necessity to oversee the counterparty-relationships, especially the
risky ones.
• country transfer risk
11

The Committee defined a group of countries13 as a measure for different weight coef-
ficients. Any country rescheduling its external sovereign debt, precluded itself from
the group for five years.
• claims on non-central-government, public-sector entities
It did not seem adequate to set a single weight for all claims on domestic public-sector
entities, which would be below the level of central government. Thus, the Committee
granted the possibility to national authorities to apply the appropriate weighting
factors for public-sector within the country, according to certain guidelines.
• collateral and guarantees
The importance of collateral was recognized only to a limited extent, due to the
country differences in dealing with that issue. There was no initiative for a common
collateral weighting system. However, several specifications were composed in the
document.
• loans secured on residential property
Because of the rather low record of loss in the majority of countries, the regulation
assigned a 50% weight to loans fully secured by mortgages on residential property,
rented or occupied by the borrower.
• off-balance sheet engagements
Off-balance sheet exposures were divided into derivative instruments and obligations
similar to unfunded loans. The latter would be shifted to the on-balance sheet side
if a certain event occurred.
The Committee adopted a two-step approach to deal with this issue: first, a conver-
sion factor had to be used to transform the item into its on-balance sheet equivalent;
second, this equivalent had to be categorized into to the risk class, based on the
customer type, like a common asset would be. This conversion factor was basically a
discount which depended on the probability that the item became an asset, creating
credit exposure for the bank.
Treatment for the derivative exposures came later into action, in the 1995 Amend-
ment. (BIS,1988, [9]; Tarullo, 2004, [86])
Amendments
Several adjustments have been made until the full implementation of the Basel Accord in
1992. There were, for example, modifications in the handling of general provisions in the
13Members of the OECD or countries with special lending agreements with the IMF (BIS,1988, [9]).
12

aftermath of the Latin American debt crisis. The matter of loan-loss reserves gained con-
siderable attention and caused discussions about excluding country-risk provisions from the
Tier 2 category. Later some changes have been made in the characteristics of risk-weight
categories and netting possibilities for certain off-balance sheet exposures. These steps were
important to the banks with substantial activities in derivatives trading, but they were not
evolutionary important in the conceptual approach.
It was rather the 1996 Amendment, which incorporated market risk and included the
rules for calculation of capital charges for market risk, using internal Value-at-Risk models.
These additions moved the Proposal in the direction of the Basel II initiative, which had a
larger focus on banks internal risk management systems and models (Tarullo, 2004, [86]).
Evaluation of Basel I
One can evaluate the Basel I proposal in two ways. One way is to check if the arrangement
has been appropriately implemented and observed by single countries. The other way - to
assess if it was successful in achieving the stated goals.
The first Basel Accord was enacted in all G-10 countries by the end of 1990. In two years,
the countries outside the membership with developed banking systems also introduced the
arrangements for capital requirements. Such broad voluntarily implementation by non-
Basel countries was motivated by the fact that, by not complying with the new capital
rules banks would look less favorable compared with the ones that complied.
Despite many critical points, the Basel I initiative was to a large extent effective in its
implementation. By the end of the transition period in 1992, most Basel-countries had at
least 4% for Tier 1 and 8% for total capital14 (Tarullo, 2004, [86]).
Broadly speaking, the Basel Accord managed to establish an international set of rules for
more than hundred countries. The introduction of formal allowance for risk in computing
capital ratios was a major improvement in comparison with the situation until 1988, when
only some banks applied equity-to-assets or equity-to-deposits ratios. Moreover, the Pro-
posal included off-balance sheet exposures into consideration.
14The exceptions were Citicorp, which suffered from substantial losses in 1991 that reduced its Tier 1
capital to 3.64%; and some banks in Japan, which were in distressed financial situation (D.Tarullo, 2004,
[86]).
13

As already mentioned, there were a lot of deficiencies in the initiative that led to a series of
further innovations and improvements. One problem was the rather crude classification of
credit-risk weightings. Quantification of economic capital was complicated in the absence
of precise estimates of risk and inner capital needs. In contrast to the regulatory capital,
economic capital is to be estimated by the bank itself, according to its risk-taking activities.
There is no problem if the internal models and risk parameters estimate economic capital
to be higher than regulatory limits. But as soon as the relation changes to the opposite,
the bank has to build a capital buffer in excess of its estimation what is sufficient. The
banks, expecting this mismatch to negatively influence the shareholder value, started to
look for prompt solutions.
Generally, in order to obey the Basel I capital requirements, banks had to choose one of the
following scenarios: increase their capital level, decrease their risk-weighted assets or sell
off the assets. This can be represented by the decomposition of the growth rate of capital
adequacy ratio of bank i into three growth rate terms:
∆(CARi, t)
CARi, t=
∆(Ki, t)
Ki, t− ∆(RISKi, t)
RISKi, t− ∆(Ai, t)
Ai, t(1.1)
where
CAR = K/RWA = capital adequacy ratio (tier 1 or total capital)
K = capital (tier 1 or total capital)
RISK = RWA/A = credit risk ratio
A = total assets
Source: P. Van Roy, 2005, [76]
One can see, that an obligatory increase in CAR does not hinder the bank from increasing
their capital level K and their credit risk ratio RWA/A15, at the same time. Such moral
hazard behavior was one of the negative responses from banking industry after the impo-
sition of the Basel Accord (Van Roy, 2004, [76]).
Interesting fact, that already back in 1980, Koehn and Santomero analyzed this kind of
argument, coming to the conclusion that ratio constraints for bank capital regulation do
not seem to be an adequate measure for controlling the riskiness of banks and probability
of failure. The economists first showed that the implementation of higher capital require-
ments induces banks to reshuffle the composition of its asset portfolio per unit of capital.
15Provided that the total amount of assets remains constant.
14

They evaluated the effect of changing required capital-asset ratio, assuming CRRA utility
function16and came to the conclusion that the composition of an equilibrium portfolio after
the mandatory ratio increase changed towards more risky assets17. Koehn and Santomero
pointed out that the level of reshuffling depends on the risk aversion coefficient of the bank
utility function. That implies that elasticity value of high risk assets for highly risk-averse
institutions is less than elasticity for the less risk averse ones. Thus, initially riskier agents
would tend to offset the capital restrictions to a greater degree than their conservative
counterparts, leading to the greater dispersion of risk taking across the whole banking in-
dustry (Koehn, Santomero, 1980, [57]).
Banks reacted to capital restrictions with various techniques to balance out the disad-
vantages and to exploit newly appeared opportunities. Expanding their capital arbitrage
strategies, they mutated the effect of the new rules, making them less efficient.
One way of using arbitrage was, as already mentioned, to invest in riskier assets. Purchas-
ing bonds of speculative classes with high compensation and the same capital requirements
as investment-grade bonds is an example of such a strategy (Balthazar, 2006, [7]).
Another, more sophisticated practice of outplaying a system was the integration of deriva-
tives in the daily business. Using securitization banks can transfer illiquid assets to a
self-created independent companies, named Special Purpose Vehicles (SPV). These entities
issued Asset Backed Securities (ABS) to finance themselves and buy loans from the bank,
liberating its balance-sheets by risk-chanelling. The result of the securitization mania was
vividly seen during the last financial crisis.
These arbitrage tactics can be harmless as well, allowing banks to correct the weaknesses
of the regulations, but it is hard to draw a line between correction and exploiting, making
it difficult to hold up. It is also worth mentioning that not all banks are able to use these
techniques, which leads to competitive disadvantages.
The reason why banks are motivated to perform capital arbitrage lies in the commonly
perceived expensiveness of equity compared to debt. Such factors as tax, asymmetric
information, agency costs and the safety net make equity look more costly. Therefore,
16CRRA: constant relative risk aversion, meaning the marginal rate of substitution remains unaffected
by the regulative changes.17For the utility function with decreasing relative risk aversion, the effect of substituting assets with
riskier alternatives is even larger.
15

when supervisory institutions demand capital standards higher than what the banks would
choose under the market discipline alone, these requirements could be viewed at as a form
of regulatory taxation (Donahoo, Shaffer, 2004, [31]). Thus, authorities encourage banks to
elaborate on methods to serve clients minimizing the taxation. Bank executives get them-
selves involved in capital arbitrage because they believe it is possible to enhance shareholder
value by replacing equity with debt in the capital structures of their banks (Jones, 2000,
[52]).
There have been some other critical issues raised in connection with Basel 1988 performance.
Lack of risk sensitivity granted a small company with high leverage an opportunity to get a
corporate loan with the same capital conditions as the AAA-rated large corporate company
would get. The list of recognized collateral was rather limited in comparison with that
effectively used by banks. Besides, Basel I focused only on credit risk and did not cover
other risk sources. The Amendment of 1996 partially filled this gap, but still some risk
types were not included in the requirements. Independent of the bank type, sophistication
and risk level, the rules were practically the same “one-size-fits-all approach”. The 8%
ratio was chosen arbitrarily, without any solvency targets outlined. Diversification of loans
through different sectors was not taken into account, letting the credit-risk requirements
have additive nature (Balthazar, 2006, [7]).
1.4 Basel II
Discussion about Basel II emerged in the need for improvements to the first set of capital
requirements. The purpose was to address the most important shortcomings of Basel I, that
were partly caused by the necessity to find an international compromise to set the capital
rules. Surprising was the speed with which the first international agreement was replaced
with the new version. There were two major trends that encouraged the review process.
On one hand, the fast-growing securitization activity of banks, on the other hand large
banking institutions were active in developing their internal models for risk assessment.
The difference between the Basel I approach and the advanced techniques for risk manage-
ment used by banks was thus increasing. Besides, the interbank competition became more
intense, arbitrage and securitization strategies more sophisticated (Tarullo, 2004, [86]).
The first Consultative Paper (CP1), containing the set of modifications of the 1988 Basel
Accord, was released in June 1999. CP2 came out in 2001 and included some adjustments
to the previous paper. In 2003 the Committee issued CP3 and in 2004 the Proposal was
16

finalized and published. This work lasted for more than six years and involved three
Quantitative Impact Studies (QIS)18(Balthazar, 2006, [7]).
Consultative Papers
CP1 was mostly an extensive version of Basel I. It revised some issues like capital charges
to operational risk and interest risk for the banks, whose exposure there was substantial.
The Committee introduced a “three-pillar” approach, where the first pillar contained the
capital rules, the second was about the supervision process and the third was dealing with
the market discipline. This framework allowed supervisors to ask banks to hold more cap-
ital, above the stated minimum. It was also possible for authorities to demand higher
transparency to better assess bank risk positions. The methodology was still in its raw
form, but the new outline was already visible. The most controversial innovation of the
concept was the suggestion to use external ratings from the credit assessment institutions
like Moodys and Standard&Poors. Their ratings would be used as a basis to categorize the
borrowers to a particular risk bucket. One additional risk bucket of 150% would be created,
compared to Basel I, but this new credit rating approach would allow risk differentiation
among corporate, sovereign and bank borrowers. The rest of the CP1 content were mainly
minor changes which addressed other deficiencies of the first Accord.
CP2 went a lot further, defining the character of the Basel Accords anew. It proposed the
internal ratings-based approach (IRB), introducing two IRB methodologies for small and
medium-sized institutions respectively. A-IRB19 implied that the banks could use their own
techniques to estimate the probability of default of their exposures. Once the values were
calculated, they would be converted into risk-weights, according to the regulative formulas.
However some minimum requirements relating to the internal rating, credit assessment,
and disclosure practices had to be fulfilled if the bank wanted to use the IRB approach.
For A-IRB there was a special set of rules, which concerned the calculation of exposure in
the event of default, possible loss, and maturity of the exposure.
The response of the banks regarding the IRB capital regulation was positive in the be-
ginning, while many academics were skeptical whether this approach was an appropriate
18QIS were conducted to collect the data for evaluation of the new capital requirements for different
types of banks. The regulators aimed to keep the level of capital in the banking sector as close as possible
to the current one (Balthazar, 2006, [7]).19Foundational internal ratings-based (F-IRB) approach was meant for wider range of banks, whereas
A-IRB was applicable only to some big banks, which could comply with the prerequisits (Tarullo, 2004,
[86]).
17

measure. There were also complaints that the banks would have to disclose proprietary in-
formation to be eligible for the use of internal estimates. But the most important comment
from the bankers side was the expected increase of regulatory capital under CP2 proposal.
As the first two papers contained a lot of disputable and incomplete features, the committee
decided to review the requirements for the third time. Based on the results of QIS-3, the
CP3 included, beside some modifications to the Pillar 1, major changes on retail exposures,
small business lending, operational and credit risk and asset securitization. That was the
last discussion paper before the final version of the second Basel Accord was released in
2004 (Tarullo, 2004, [86]).
Structure of the Accord
In the new Basel framework capital requirements were only part of the “three-pillars con-
cept, which aimed to secure banks robustness and health. Beside the capital regulation, the
committee empathized the necessity to consider supervisory approach as well as diclosure
practices in the Basel Accords.
Pillar 1 (reviewed later in detail) was dedicated to the minimum capital requirements,
updating the solvency ratio from 1988. The committee kept RWA as a main estimate to
control capital buffer and carried over the 4% and 8% minimum ratios from Basel I. But
the way to weigh assets was adjusted, introducing different versions of the IRB approach.
The values, rather than rough estimates as before, now were bound to the internal capital
estimates. Depending on the size and complexity the banks could choose the way to com-
pute their RWA for credit risk. The more sophisticated models consumed less capital but
required stricter prerequisites, motivating banks to improve their risk management.
Pillar 1 newly considered operational risk by setting explicit capital requirements for risks
of possible errors in internal processes, frauds, IT problems, etc. Here the banks could also
choose the most suitable approach according to its individual characteristics.
Pillar 2 based supervisory review on four main principles:
• The banks were required to adopt a process for assessing their capital requirements
relative to their individual risk profile
• This process would be evaluated by supervisors, eligible to take corrective actions
• The banks were expected to hold capital beyond the scope of the Pillar 1 minimum
and the regulators would be able to enforce this in case of non-compliance
18

• Supervisors were authoritized to intervene as soon as possible to prevent drastic
reduction of capital to ensure banks risk–resilience
Pillar 3 defined core and supplementary disclosures for banks and a set of disciplinary
measures for supervisors. Banks had to release publicly at least twice a year comprehensive
reports on their internal risk management and implementation of Basel II. The requirement
roused many discussions as the list of items to be published was rather extensive. (Jackson,
2001,[48]; Balthazar, 2006, [7]).
Basel II: Pillar I in Detail
Credit Risk: Unstructured Exposures
Under the standardized approach (SA) the banks calculated their RWA based not only
on the counterparty types, but also on the estimates of the external rating agencies. The
list of the recognized External Credit Assessment Institutions (ECAI) was provided by the
regulators, who examined the rating companies on their objectivity, resources, credibility
and other relevant parameters. Later these ratings were mapped on the S&P international
rating scale and converted into risk–weights. This simple application of the Accord was
created primarily for the smaller, less sophisticated banks. (Table 4.2)
The categories of risk for the RWA-calculation included: sovereign20, Public Sector Entities
(PSE)21, Multilateral Development Banks (MDB)22, banks23, corporate24, retail25, credits
secured by residential property26, credits secured by commercial real estate27, past due
loans28, other assets29, off-balance sheet items30.
20Exposures on countries were now considered according to their rating independently if they belong to
the OECD group.21The authorities could weigh non-central government PSE as banks or as sovereigns, depending on their
tax status.22Fulfilling certain criteria, these banks coild benefit from a 0% RWA, otherwise they fall in “banks”-
category.23Two possible options: to weight one risk-unit more than is given on their country or to use the banks’
rating. The category also includes security firms (except for RWA-calculation treated as “corporate”).24The category includes insurance companies.25The claim of a person or a small business, in the form of a retail product, not concentrated in the
portfolio and not more than EUR 1m.26Fully secured claims, where only borrower could use the property.27The Committee recommended to apply a risk-weight of minimum 100% with possible exceptions to
mature and well-developed markets.28Loans past due for longer than 90 days were risk-weighted according to their provisioning.29100% risk-weight.30Similar treatment as in Basel I.
19

Another issue covered by the Standardized Approach was the so-called Credit Risk Mit-
igation (CRM). This was designed as a set of techniques the bank can apply to reduce
its credit risk. That included collaterals, guarantees or hedging with credit derivatives.
There were also several methods to integrate collaterals into RWA calculation: simple and
comprehensive approaches. Thus the bank, depending on the collateral31, had either to
cover the exposure through the security with a minimum risk-weight of 20% or to apply
haircuts to take time value into account. For this purpose, the SA provided a formula for
computing the adjusted value of collateral:
AE = max(0; [E · (1 + (He)−Hc −Hfx)]) (1.2)
where
AE = Adjusted exposure
E = Original exposure
He = Haircut of the exposure
C = Collateral value
Hc = Haircut for collateral type
Hfx = Haircut for currency mismatch
Source: Balthazar, 2006 [7]
The bank could make the estimations using supervisory or its own haircuts. In the latter
case, it was necessary to comply with certain qualitative and quantitative criteria.
IRB Approaches32allowed banks to classify their assets based on the internal models for
credit risk. The regulators prescribed some key parameters33 that had to be used in the
formulas, whereas the others could be estimated internally. Exposure had to be assigned
to one of the six categories, which included corporate, sovereign, bank, retail, equity and
31Simple approach was applicable to cash on deposits, gold, debt securities with particular minimum
rating, some unrated debt securities, equities included in a main index, Undertakings for Collective In-
vestments in Transferable Securities (UCITS) and mutual funds under specified restrictions. Equities, not
included in a main index but from a recognized exhange, UCITS and mutual funds containing these equities
were the subject for the Comprehensive computation (Balthazar, 2006 [7], for more information see BIS,
2004, [11]32Include Foundation-IRB and Advanced-IRB approaches. The difference lied in the definition of the
input variables. Both models allow to use bank’s own PD parameters, but only under the A-IRB was
possible to estimate own LGD and EAD (Nomura, 2005, [70]).33Key inputs included: probability of default (PD), loss given default (LGD), exposure at default (EAD),
maturity (M), asset correlation (p) and confidence interval (CI) (Balthazar, 2006 [7].
20

purchased receivables exposures. The treatment was accordingly more comprehensive as
by the Standardized Approach, including specific risk-weighting functions and complex
computations. Under this approach, calculation of minimum capital was based on the
LGD-distribution in a portfolio of loans or similar instruments within one year. The confi-
dence level was chosen at 99.9% and only unexpected losses could be covered. (Balthazar,
2006,[7]; Nomura, 2005, [70]).
Credit Risk: Securitization
The regulators attempted to set stricter rules to the techniques close to capital arbitrage
in the second Accord. But the task was rather difficult due to the high complexity of the
securitization structures and the increasing sophistication of banks in using these tools. In
general, Basel II addressed both traditional34 and synthetic securitization35. Banks could
again make use of standardized or IRB approaches. In the first case, risk weights are based
on rating of the position. Unrated exposures had to be deducted from the capital with
several exceptions36. Banks using internal ratings had to comply with the following rules:
• for rated exposures risk weights must be based on ratings based approach (RBA)
• for unrated exposures - internal assessment (IA) possible if specified conditions met;
otherwise supervisory formula (SF), if inputs could be determined
• if exposures are unrated and earlier mentioned methods are unavailable, banks can
apply “look through” exceptional approach with regulatory approval and on tempo-
rary basis
• in other cases the exposure must be deducted from the capital
(Balthazar, 2006,[7]; GS, 2005, [78]).
Operational Risk
This was a new subject to Basel capital requirements. Three different approaches were
considered for the calculation of a bank capital ratio for operational risk:
34In traditional securitization the cash flows from an underlying pool service at least two different
tranches. In case of default, the lower tranches would absorb losses while the others were left untouched
(Balthazar, 2006, [7]).35The underlyings of this structure are not explicitly taken out of the balance sheet and only credit risk
is backed by funded or unfunded credit derivatives (Balthazar, 2006, [7]).36In case of: most senior exposure, second-loss position or better, liquidity facilities (GS, 2005, [78]).
21

• Basic Indicator Approach (BIA)
The simplest method, assuming that the amount of operational risk is proportional
to the size of banking activities. Thus the requirement was set at 15% of the bank
average gross annual income over the last three years.
• Standardized Approach (SA)
Here, bank’s three-year-average gross income was categorized into eight different busi-
ness lines: corporate finance, trading and sales, retail banking, commercial banking,
payment and settlement, agency services, asset management and retail brokerage.
The capital charge had to be calculated for each line by multiplying the correspond-
ing gross income by a factor assigned to that line by the Basel Committee. The total
capital requirement for operational risk would be the sum of the individual capital
requirements calculated for all business lines.
• Advanced Measurement Approach (AMA)
A more sophisticated method, which implied that banks would use their own opera-
tional risk management systems. These systems had to consider actual internal and
external loss data, scenario analysis and factors of the bank environment and internal
mechanisms.
(Balthazar, 2006,[7]; Nomura, 2005, [70]).
Evaluation of Basel II
The new Accord shifted the focus of banking executives on economic versus regulatory cap-
ital management, measuring their performance against risk factors instead of market share
or expected return. A change for a system based on bank internal risk models has a poten-
tial for enhancing bank safety and proper working. That is because under this regulatory
approach banks would develop greater risk sensitivity and would be able to manage their
capital according to the requirements and credit exposures much closer to the actual risks.
The IRB model was the major innovation in the Basel II Capital Accord, which received
a lot of praise as well as many critical comments. Several assumptions taken in Basel II
have been questioned by many academics and practitioners. For example the new concept
assumed that banks were in advantageous position compared to the supervisors concern-
ing the resources and expertise for the best possible risk assessment (Tarullo, 2004,[86];
KPMG, 2003, [58]). Being to a large extent true, this proposition increases the power of
banking institutions by decentralizing risk management process, which if exaggerated can
22

have rather negative consequences like the last financial crisis demonstrated.
There were also some problems related directly to Pillar 1. One of them Gordy (2003, [?])
calls “portfolio invariance”. A specified mathematical model, based on Merton’s Theory37,
represents the core of the risk-weighting formulas of the second Capital Accord. This model
is restricted with the assumption of an invariant portfolio, meaning that the required cap-
ital depends only on the risk of the loans it backs and not on the portfolio to which it is
added (Atkinson, 2010, [6]). In other words, “it is assumed that the bank‘s credit portfolio
is infinitely fine–grained in the sense that any single obligor represents a negligible share of
the portfolio‘s total exposure, and that a single, common systematic risk factor derives all
dependence across credit losses in the portfolio” (Gordy, 2004, [43]). Being a compromise
for the sake of easier global applicability, it has an important consequence on ignoring the
diversification effect which can influence the portfolio risk substantially. Thus the required
capital ratio is a linear function of the asset type it has to back, independent of the amount
of the exposure. Technically, the IRB approach and the model it uses, are based on the
asymptotic single-risk-factor (ASRF)38. This model has an important implication for credit
VaR39 of the portfolio as it allows to make calculations using only exposure–specific pa-
rameters, such as PD, LGD and a common factor, reducing computational complexity.
According to Gordy (2003, [?]), “each exposure’s contribution to VaR is portfolio invariant
only if: (a) dependence across exposures is driven by a single systemic risk factor - a global
risk factor [...] and (b) each exposure is small”. The last financial crisis proved that ex-
posures can be very large and emerge in the national (vs. global) market (Atkinson, 2010,
[6]).
In the context of securitization, the ASRF implies “capital neutrality”, meaning that ”the
sum of the economic charges for individual tranches of a securitization equals the economic
capital for the underlying collateral pool” (Gordy, 2004, [43]).
37The model to compute the correlation of default risk in the portfolio is based on one of the theories of
the Nobel Prize winner, Robert Meron. He specified certain default-generating processes and used them to
predict the defaults, adding such variables as estimation of asset’s returns and their volatility. Assuming
normal distribution, one can calculate the estimated probability of default (Balthazar, 2006,[7]).38Under the ASRF framework “correlations in realised losses across exposures are assumed to be driven
by a single systematic risk factor meant to capture the effects of unexpected changes in economic conditions.
It can be shown that given this dependence assumption the loss rate for a well- diversified credit portfolio
depends only on the systematic factor, and not on idiosyncratic risk factors associated with individual
exposures. Furthermore, the total economic resources (both capital and provisions) that a bank must
maintain in order to satisfy a portfolio-wide Value-at-Risk (VaR) target can be determined by estimating
the sum of the conditional expected losses (CEL) associated with each exposure in the portfolio” (BIS,
2004b, [10]).39Value-at-risk defines the maximum default loss with a given probability over a given horizon.
23

The ASRF model was heavily criticized for producing specification errors. The core of the
argument lied in the assumption that a single common factor could determine the system-
atic element of credit risk. The portfolio was taken as highly grained, diversifying away
all idiosyncratic risk components. Moreover, the model restrictions made it impossible to
consider any single exposure independently. However, to calibrate the model one needs the
information about the portfolio correlation structure or the common factor itself to esti-
mate the exposure-specific dependence on the common factor. When there is not enough
information, the model could be flawy calibrated leading to more errors in measuring port-
folio credit risk40 (Tarashev, 2008,[85]).
Another point of criticism relates to the risk-weighting approach which gives incentives to
concentration of low-weighted assets (sovereign debt, mortgages and interbank lending) in
the portfolio. Emerging at the same period of time as the Basel Rules, Credit Default
Swaps (CDS) made it possible to go short in credit contracts, a practice not allowed in the
past. The banks exploited the opportunity of risk-derivatives, transforming the basic idea
of capital weights.
Some argue that both Basel Accords did not pay enough attention to off-balance sheet
exposures and securitization issues, which subsequently led to huge counterparty risks and
global contagion.
A significant number of arguments points at the pro-cyclicality of the Basel capital reg-
ulations. The basic claim is that people tend to underestimate risks in good times and
overestimate them in bad times. As an example, the amount of debt held by banks usually
fluctuates with the market values and if the latter are not fairly priced, reflecting future
cash flows, the pro-cyclicality may result. Bank counterparty and risk management are
stricter in bad times, but looser when the economic conditions are getting better. Com-
pensation schemes are designed in the way that endorse short-term orientation, but is not
particularly suitable over the whole business cycle.
According to Kane (2006, [53]), the negotiations of Basel II were very complex due to
the multiple financial institutions and regulatory committees, which caused many sim-
plifications and compromise solutions to difficult issues. Banks looking for the loopholes
in the regulations could manipulate rather subjective risk inputs41 to reduce the amount
40Basel II ignores calibrationg problems, assuming that the level of PD can fully determine firm-specific
dependence on the single common factor (Tarashev, 2008,[85]).41For example, over-the-counter exposures are difficult to price and there is usually not enough historical
data on that kind of instruments (Atkinson, 2010, [6]).
24

of required capital. For that purpose Pillar 2 and Pillar 3 were introduced as a market-
controlling mechanism, but the problem was not resolved. The idea of bank fully disclosure
and transparency under the fear of punishment has its justification in efficient market hy-
pothesis, which assumes rational behavior of market participants. If the markets are not
efficient and suffer from information deficiency, the possibility of financial bubbles and sys-
temic pro-cyclicality is not unthinkable(Atkinson, 2010, [6]).
There were also the debates regarding an increasing involvement of rating agencies. The
cornerstone is that non-rated entities could be uniformly charged at the conditions of the
old Accord and only the rated ones are the subject to improved capital allocation. Whereas
the US and European banks could use the IRB approach, banks in developing countries
would probably not. For the risky firm, rated BB– or below there was a clear incentive to
avoid the official rating procedure and to remain unrated, making use of lower risk weights
and so to reduce the cost of capital. The rating agencies even created such services as
preliminary rating without public disclosure (Danielsson et.al., 2001,[19]).
Summing up on Basel II, one can say that there are many critical opinions, the most
critical related to the sub-prime and the last systemic crisis. Most of the arguments contain
valuable inputs and suggestions, but those who ascribe all the failures of the last years to
the Capital Accords are certainly mistaken. There always has to be somebody to blame
and in this case it is Basel II, which stands out as one of the most influential regulatory
frameworks. But is it the rules, that are falsely composed or the underlying models or
the use of the models in these rules or the implementation of the rules altogether? There
is probably no answer to this question for the present system is of such an exponentially
increasing complexity, that it becomes impossible to single out some particular factor that
caused the damage. Every proposal in the regulation can be imagined as a vector that can
point either in one or in opposite direction and until we “open the box”, both destinations
are simultaneously reached. The metaphor from the quantum world can be a little bit
far-fetched but it also shows that it is not straightforward to predict the outcome of the
experiment 42. Unfortunately the costs of the “field research” here are too big to be ignored.
The quality and intensity of responsibility has to be much higher than in many other areas.
Thus the regulators should be committed to find the best staff, best instruments and best
control mechanisms to improve the system. That is probably the only thing they can do,
but this is a lot.
42Relates to the “Schrodinger’s cat” thought experiment and a concept of quantum superposition.
25
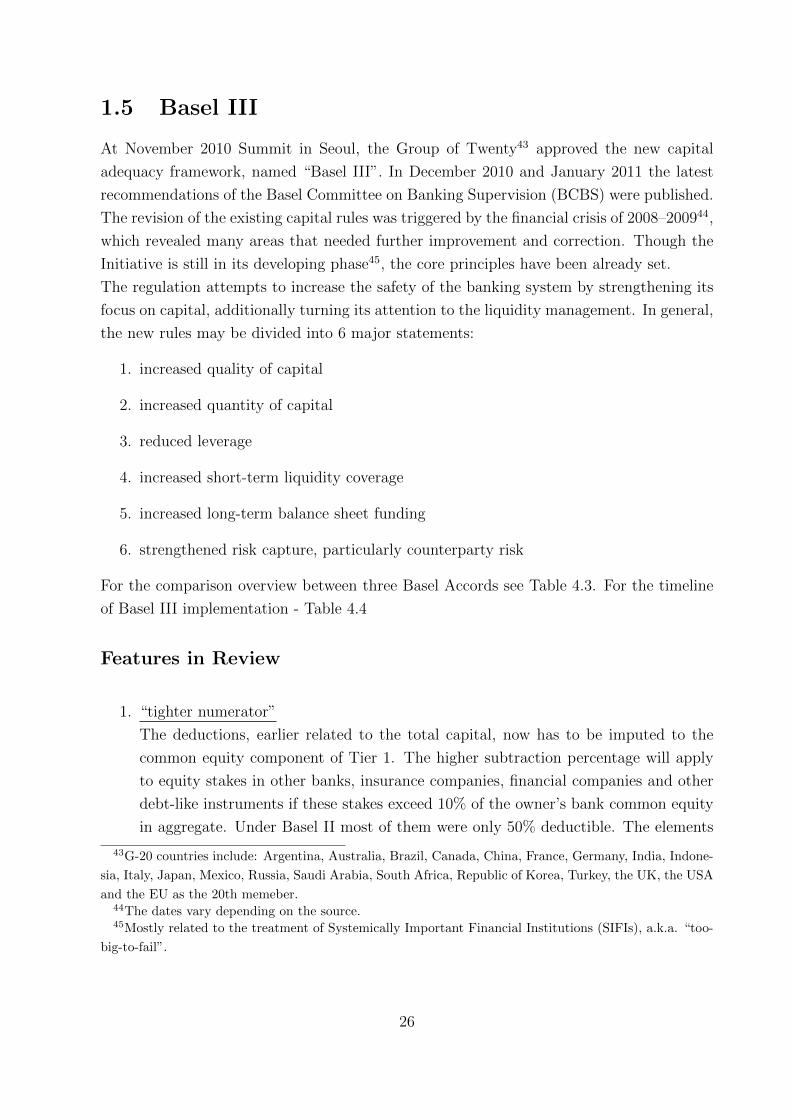
1.5 Basel III
At November 2010 Summit in Seoul, the Group of Twenty43 approved the new capital
adequacy framework, named “Basel III”. In December 2010 and January 2011 the latest
recommendations of the Basel Committee on Banking Supervision (BCBS) were published.
The revision of the existing capital rules was triggered by the financial crisis of 2008–200944,
which revealed many areas that needed further improvement and correction. Though the
Initiative is still in its developing phase45, the core principles have been already set.
The regulation attempts to increase the safety of the banking system by strengthening its
focus on capital, additionally turning its attention to the liquidity management. In general,
the new rules may be divided into 6 major statements:
1. increased quality of capital
2. increased quantity of capital
3. reduced leverage
4. increased short-term liquidity coverage
5. increased long-term balance sheet funding
6. strengthened risk capture, particularly counterparty risk
For the comparison overview between three Basel Accords see Table 4.3. For the timeline
of Basel III implementation - Table 4.4
Features in Review
1. “tighter numerator”
The deductions, earlier related to the total capital, now has to be imputed to the
common equity component of Tier 1. The higher subtraction percentage will apply
to equity stakes in other banks, insurance companies, financial companies and other
debt-like instruments if these stakes exceed 10% of the owner’s bank common equity
in aggregate. Under Basel II most of them were only 50% deductible. The elements
43G-20 countries include: Argentina, Australia, Brazil, Canada, China, France, Germany, India, Indone-
sia, Italy, Japan, Mexico, Russia, Saudi Arabia, South Africa, Republic of Korea, Turkey, the UK, the USA
and the EU as the 20th memeber.44The dates vary depending on the source.45Mostly related to the treatment of Systemically Important Financial Institutions (SIFIs), a.k.a. “too-
big-to-fail”.
26

of Tier 1 or Tier 2, not anymore eligible to belong to either category because of
their weak loss-absorbing capacity, will be eliminated by consecutive 10% tranches
annually from 2013 to 2023. Only Tier 1- “carve outs” are estimated to be around 25
- 40%. The amount of goodwill and deferred tax assets have to be carefully managed
by large banks being under the light of regulative attention. As the new requirements
are already discounted by markets, the banks would probably try to restructure their
balance sheets as soon as possible.
2. “more is better”
The last crisis exposed the fact, that the core capital was insufficient to absorb losses.
This led to the stricter definition of capital, meaning that “common equity Tier
1” (instead of “core Tier 1”) now comprises common shares and retained earnings
only. This is set to be 7% now, where 4.5% comes from minimum common equity
(2% under Basel II) and 2.5% from capital conservation buffer. The total capital
(including conservation buffer) has to be raised to 10.5% (vs. 8% under Basel II),
whereas Tier 1 has to constitute at least 6%. The capital conservation buffer should
help to prevent cyclicality by gaining additional slack through the periods of growth.
It is also possible that the banks, especially SIFIs may face total capital requirements
of 13 - 15% due to further revisions and BCBS add-ons.
3. “less greed”
The key message is that leverage can not exceed the limit of 3%, meaning that a bank
total assets (on- and off-balance sheet) should not be more than 33 times the bank
own capital. These ratios will be set in force in 2018 and starting from 2013, the
banks will be monitored on leverage data. The ratio has to be on a gross, unweighted
basis and not consider risks related to the assets. Taking into account the fact, that
the market or rating agencies can put pressure on banks to maintain a higher leverage
ratio than officially required, one can expect that the banks would look for riskier
return opportunities and to sell low margin assets (e.g. mortgages), driving the prices
down.
4. “take care of liquidity”
The Liquidity Coverage Ratio (LCR) was introduced to secure short-term resilience
to potential problems. Basically, banks have to sustain high-quality liquid assets
(HQLA) to cover 30 days’ net outflows following a short-term liquidity crisis. HQLA
have to amount to at least 100% of net outflows and are categorized into Level 1
and Level 2 assets. The first class contains cash, reserves held at the central bank
and sovereign bonds or items rated at least AA–. The second class includes sovereign
27

bonds or similar products rated between A– and A+, corporate and covered bonds
with the rating of minimum AA–. Beside that, Level 2 assets are restricted to 40%
of HQLA after a 15% haircut. As an implication for these measures, the risk of bank
run should be reduced, improving the stability in the markets. However for banks
this can mean lower profitability, as they have to hold more liquid, low-yield assets.
5. “healthy balance sheet, healthy spirit’
By adopting the Net Stable Funding Ratio (NSFR), the Basel Committee intended to
decrease bank dependency on short-term funding and protect them from the conse-
quences of a longer-term liquidity crisis. Basel III demands that weighted assets with
maturity longer than one year, as well as some off-balance sheet exposures, are 100%
covered by long-term stable funding. Generally, the weighting factors for assets vary
from 0% and 5% for cash and government bonds respectively, to 65% for mortgages,
85% for retail loans, and 100% for other assets. The liabilities for stable funding are
determined through weighting factors from 100% for Tier 1 capital to 90% for core
retail deposits and 50% for unsecured wholesale funding and ECB funding at 0%.
As a result, banks would probably rely less on their short-term funding and increasing
the stability of the funding mix. But they would need to pile up more of wholesale
and corporate deposits with maturities longer than one year and the demand for
term debt is rather limited right now. That can lead to higher funding costs. The
competition could be weakened because stronger banks with higher NSFR could try
to influence market prices for assets, the option weaker banks would not be able to use.
6. “beware of Lehman”
The Counterparty Credit Risk (CCR) management should be particularly taken care
of. The focus lies on the risk on derivative exposures and in order to deal with
this issue, the Committee introduced the concept of Credit Valuation Adjustments
(CVA) capital charge and a central counterparty for the treatment of market-to-
market counterparty risk. For the calibration of CCR-modeling some banks will be
permitted to use Internal Model Methods (IMM). These banks will need to integrate
the changes in the counterparty credit spreads in their calculations, which will result
in an additional capital charge.
According to the Standard&Poor’s research, this approach has several calibration
issues. Their calculations show that the banks can expect additional capital charge
of about 15%-20% of total regulatory Exposure-at-Default (EAD). Combined with
28

other requirements this would mean the total capital charge for counterparty risk at a
level between 20% and 25% of EAD (2.5% - 4% under Basel II), which is a big increase.
The researchers mention also other potential problems like incentives for banks to use
qualified clearing houses for OTC derivative transactions more frequently, as they are
not expected to make capital charges. This increased concentration at central clearing
houses under the risk-free assumption (zero capital charge) can expose the system to
further potential risks. There is also a possibility that banks would try to push OTC
derivative transactions through unregulated channels (such as hedge funds) when the
transactions through regulated institutions became too capital expensive.
Sources: BIS, 2011,[12]; BNP Paribas, 2011,[72] ; KPMG, 2011,[59]; S&P, 2010,[83]; McK-
insey&Company, 2010,[61].
Future of Basel III
Basel III is a big challenge for banks as well as for supervisors and regulators. Not all
requirements are definitely set yet and the implementation is still in its earliest phase. But
the transition period is rather long, so that the banks can start monitoring their ratios
well before the deadline in 2019. Many banks intend to comply with the requirements
even sooner to reassure the markets and rating agencies in their credibility. The impact on
banks however is not expected to be equal for different lines of business.
Retail banking would be probably least affected by the new rules. But if so, they would
not be very flexible in their response possibilities, being rather sensible to repricing, cost
cutting and other changes in business activity. Most influential will be those changes, that
affect the entire bank, such as higher capital and liquidity requirements. Especially new
capital ratios can be significant, as most retail banks in recent years could profit from lower
capital ratios than wholesale banks. Increase in target ratios for high-risk segments can
cause an increase in costs of up to 70 basis points. Given that for some consumer finance
segments repricing may be difficult, the option of banks to pass the higher costs on to
customers may not be easy to realise.
Corporate banking would also have limited consequences, like retail banking, mostly due
to increased capital target ratios. Many standard corporate banking products, like long-
term corporate loans and long-term asset-based finance businesses my be affected, facing
higher funding costs. Higher liquidity requirements will cause a cost increase in uncom-
mitted credit and liquidity lines to both financial institutions and corporates. This, given
the difficulties in passing on the cost increases, can lead to a reduction in profitability and
29

a reduction of capital being allocated to these businesses. There could also be a change
in client relationships, as the active portfolio management will be more difficult because of
new constraints on hedging and capital markets transactions.
But most affected will be investment banks with their broad capital market activities.
The regulative interventions, including new capital treatment, new leverage ratio, limited
netting and new funding requirements for trading portfolios, are expected to have a big
impact on trading business. Particularly three areas of activity have to be mentioned here.
• OTC derivatives
There are two major effects for this type of business. On one side, banks will have to
hold more capital for market risk46. On the other side, newly adopted CVAs demand
that banks hold more capital for counterparty credit risk. The credit valuation ad-
justments are estimated by McKinsey (2010,[61]) to increase RWA by a factor of 3,
in addition to other changes in market–risk charges. Together with liquidity require-
ments this may result in a raise of costs by significant 85 basis points on the market
value of unnetted, uncollateralized positions on average. Lower-rated counterparties,
as well as the ones with limited netting ability, will be most sensitive to changes.
Banks would have to look for ways to compensate for higher costs, demanding better
collateral and netting agreements and moving some businesses to central counterparty
clearing platforms.
• Cash trading
Here profitability will be negatively affected by higher inventory costs, particularly
the funding requirements on lower-rated assets. This can lead to a widening of bid-
ask spreads from 1 to 10 basis points, which will already be affected by higher hedge
costs from OTC derivatives, shifting some trading activity toward exchanges.
• Securitizations
Overall changes in this business could drive up capital ratios by a factor up to ten.
First, the investors, buying a piece of a new securitization, will have to make sure
in the future, that the originator holds at least 5% of all securitizations it created.
Second, there could be a threefold increase in capital requirements in regard to re-
securitzation as well. And third, in contrast to Basel II, which required to deduct
securitizations with a low rating (below BB–) from capital (50% as Tier 1 and 50% as
46The stressed VaR, the incremental risk charge (IRC), and the comprehensive risk measure (CRM) for
correlation trading under the EU’s Capital Requirement Directive III (CRD III) are to be mentioned here
(McKinsey, 2010,[61]).
30

Tier 2 were allowed), Basel III weighs 1.250% on such securitizations47. Along with
the increased capital ratio, this amounts to a substantially higher capital ratios (40 -
100% higher for capital deduction items). In some cases the required Tier 1 capital
would exceed the nominal value of the securitization48.
Sources: BIS, 2011,[12]; KPMG, 2011,[59]; McKinsey&Company, 2010,[61].
The new Basel rules seem to become a monumental task for banks, who will have to
reorganize a large part of its process flows. It is not surprising that many executives find the
new requirements absurdly high and impossible to comply with. In fact they are high, but
if appropriate and doable, that is another question. Where should one find a line between
prudential restriction and exaggerated precaution, eventually leading to evolutionary halt?
Perhaps, that is the purpose of the experiment, making incremental steps and observing
how the environment reacts. This grand experiment with far-reaching consequences might
be assigned to a high risk–weighted category itself. But the most important task is to make
the experiment survivable, exactly mentioned by Harford (2011,[45]): “The financial crisis
was so traumatic that it is tempting simply to conclude that all banking risks should be
legislated out of existence, with fancy financial instruments outlawed, and banks compelled
to hold gigantic capital cushions. But that would take for granted - and threaten - the
benefits we now enjoy from banking. The end of error in finance would also be the end of
new ideas, and indeed of most banking as we know it. [...] As in any other sector, some
innovations in finance will inevitably fail. And as in any other sector, those inevitable
failures are a price well worth paying for innovations that succeed - but only if the failures
are survivable.”
47Basel II allowed banks to choose between two options for low– or unrated securitizations: to place a
risk weighting of 1.250% (which would require a minimum regulatory capital of the nominal value, but an
actual capital of 1.250% multiplied with the bank internal target ratio, which is usually above 8%, results
in actual capital requirement above the nominal value) or to deduct capital (50% from Tier 1 and 50%
from Tier 2) Most banks however chose the second option for it affected capital ratios less (McKinsey,
2010,[61]).481.250% multiplied with the new minimum of 8.5% yields capital requirement of 106% of the nominal
value. Assuming, the required minimum will be increased, the required ratio can rise beyond 140%. Such
high percentages could cause controversial discussions and suggestions to revise the rule.
31

2
Debt vs Equity
“As I’ve got into the paper and finally figured out the essential idea, I said that
it was the simplest thing in the world, but one of those simple things that has
consequences that go on forever, both in scope and in time.”
- Stewart Myers about M&M
2.1 The Logic of Miller and Modigliani
To draw a straight line we are better off by using a ruler, so that minimizing the distor-
tions, we can at some point accept the line as “perfectly” straight. If we are to make it
by hand, the bias will be a function of many factors: shaking hand, smoothness of the
surface and continuity of ink. If one of these parameters performed at its worst for what-
ever reason or if somebody constantly pushed our hand in order to support it the best
sake, we would probably have big chances of ending up with some zigzag approximation
of the desired result. It is however not a problem if we take the ruler, measure the errors
and after neutralizing the obstacles try to correct the line. There is also another way of
handling the problem. We can look at it and say that it was meant to be a zigzag after
all. That the world is designed in such a way that it is much more advantageous to have
a zigzag in the end, that it perfectly fits the circumstances and a straight line though nice
and correct just too hard to get. May be it is an acceptable solution but not in case if
this line is a part of the architect’s draft for the building. It is even worse if it is a skyscraper.
If to assume that there exists a perfect world with frictionless markets, full information, no
transaction or bankruptcy costs and an absence of taxes, then firm’s decision how to finance
itself, with debt or equity, should not matter for the firm’s value. This was a quantum step
of Miller and Modigliani (1958, [66]) in the development of finance and can serve many as
a ruler to build a straight line of argument for further emerging problems. As mentioned
in the beginning of the thesis, the utility of the proposition is at its highest if we take it
reverse. Which of the idealistic assumptions have to fail in order to produce a zigzag or
when does the financial structure matter? This question has to be answered in order to
understand why many perceive equity as so much more expensive than debt and how we
32

should correctly estimate the cost of capital.
Does M&M Apply to Banks?
Repeatedly mentioned in the context of optimal capital structure, this sentence is still used
in the question form. The answer has not yet been agreed upon. To examine why and if it
is possible at all, it would make sense to look at the nature of the question and to define a
departure point. Basically it seems important to distinguish between “to apply” and “to
hold”. The Proposition may apply but not hold for banks1. The “apply” question would
sound like: is it possible that under the perfect market conditions, a value of a bank is
independent from its structure? The “hold” question goes further: if we omitted the as-
sumptions of the frictionless world one after another, is the form of financing still irrelevant
for the cost of capital? To see if we have to answer the second question, it is important to
examine the first.
What would it mean if M&M were applicable to banks? This would in some respect equal
banks with firms, making it possible to consider them as all–equity financed entities and
to prove the Proposition in the same way as for the firms2. The problem here is that banks
are not firms, sometimes even exactly the opposite in their functions. While the corporate
institution usually represents a borrower, banks provide lending opportunities. The very
existence of banking is justified by fulfilling among other functions, the maturity transfor-
mation, converting short-term liabilities into long-term assets3. Being all-equity-financed,
the banks would not be able to perform this activity anymore. Miller (1995,[65]) argues in
his article “Do the M&M Propositions Apply to Banks?” that it is well imaginable, that
the bank is financed exclusively with equity. He claims, that if an equity financed bank is
not profitable, the additional debt would not make it better, due to the added risk, which
will offset the increased return. This may be true, but it still does not mean the bank can
1One can imagine these questions as two sets, where “hold” is a subset of “apply”. More exact, “apply”
would be necessary condition for “hold” whereas “hold” - sufficient for “apply”.2The original proof for M&M Irrelevance Proposition is based on arbitrage, meaning that “if levered
firms were undervalued relative to unlevered ones, the arbitrager were able to “undo the leverage” by
buying an appropriate portion of both the levered firm’s debt and its shares. On a consolidated basis, the
interest paid by the firm cancels against the interest received and the arbitrager thus owned a pure equity
stream. Unlevered corporate equity streams could in turn be relevered by borrowing on individual account
if unlevered streams ever sold at a discount relative to levered corporate equity.” (M. Miller, 1988,[65]
That possibility of “homemade leverage” by individual investors could be used in the case of banks.3More about functions of financial intermediaries for example by Gorton and Winton, 2002[44] or various
articles of D. Diamond about bank capital, liquidity and monitoring.
33

exist as a financial intermediary according to its definition4. However it is not a reason to
dismiss the idea of M&M for banks, it may be useful to adjust it for banks. This could
be for example an assumption of some minimum amount of leverage for a bank to fulfill
its functions in full spectrum. Another point concerns the perfect market, where there is
no theoretical justification for financial intermediaries5. In this case one has to consider to
make certain assumptions as well6. But in spite of that, the question of how much leverage
is appropriate for banks fits very good in the M&M framework.
Assuming the specifics of banks are considered and adjustments are made accordingly, the
banks and the firms have a common denominator now and we can apply the Proposition to
banks. Starting from this platform we can deal with the question “to hold”, which is the
same as for the firms. Due to the peculiarities of banks however, the extent to which it holds
can be different. Some factors may play a bigger role and offset the Irrelevance Proposition
in a much larger extent. In their recent article Miles et. al. (2011,[63]) formulate this notion
as following: “There are several reasons why the theorem is not likely to hold exactly for
banks, though to jump to the conclusion that the basic mechanism underlying the theorem
- that equity is more risky the higher is leverage - is irrelevant would certainly be a mistake.
The key question is to what extent there is an offset to the impact upon a bank overall cost
of funds of using more equity because the risk of that equity is reduced and so the return it
needs to offer is lowered.” Supporting this point of view, Pfleiderer (2010,[74]) claims that
“the insights of Modigliani and Miller are extremely relevant to discussions about banking
and bank capital regulation. [...] the pure-form irrelevancy proposition does not apply to
any firm. But that does not mean that one can dismiss Modigliani and Miller. The M&M
Irrelevancy Proposition gives rise to an immediate corollary, which is extremely important”
and can be applied specifically to banks:“If changes in leverage or capital requirements af-
fect the value created by banks, then it must be because one or more market frictions exist
that are affected by leverage and capital requirements.”
4Financial intermediary exists to connect surplus and deficit agents by transforming bank deposits into
bank loans. Functions of a bank as a financial intermediary include delegated monitoring, information pro-
duction, consumption smoothing providing of liquidity and commitment mechanisms (Gorton, 2002,[44]).5Financial intermediaries exist because the markets are not frictionless and their role is to facilitate the
communication between lenders and borrowers, who due to the imperfections cannot interact seamlessly.
One important reason is the notion of “asymmetric information”. According to Diamond (1984,[25]) an
intermediary (such as a bank) is delegated the task of costly monitoring of loan contracts written with firms
who borrow from it. It has a gross cost advantage in collecting this information because the alternative is
either duplication of effort if each lender monitors directly, or a free-rider problem, in which case no lender
monitors.” If there is a perfect market, there is no need to monitor, because neither party posseses an
informational advantage.6E.g. one has to assume the presence of incomplete information
34

2.2 Market Distortions Due to Government Interven-
tions
There are generally two ways how government participates in financial decisions of banks:
through taxes and deposit guarantees. At this point it is important to mention two different
positions to look at it. One has to distinguish between private and social perspective, when
speaking about costs and benefits. The distinction is crucial because sometimes the interests
are mirror-inverted, and ignoring that can lead to confusion and wrong conclusions.
Taxes
A large amount of scientific literature provides evidence for taxes having a significant in-
fluence on the financial structure of corporations. According to Weichenrieder and Klautke
(2008,[90]), “an increase of 10 percentage points in the corporate tax rate increases the
debt-asset ratio by 1.4 to 4.6 percentage points”. This shift happens because of the tax-
deductibility of debt, the quality equity financing was not granted with.
Back to the roots, Miller (1988,[65]) reviews in his paper “The Modigliani-Miller Proposi-
tions After Thirty Years” some notions made in the first article7 considered a progressive
tax system8, which imposed double taxation of corporate net income. That means, first
a separate income tax is levied directly in the firm and then a second tax is levied at the
personal level on any income cash flows (e.g. dividends). But in the case of debt interest
payments are taken as a cost of doing business and therefore are allowed to be deducted
from corporate income. Thus double taxation does not take place, creating an advantage to
debt-financing in the form of a tax-shield effect. As this form of tax policy is currently dom-
inating, such an asymmetric treatment of debt and equity leads to an opposition of stricter
capital requirements, which will reduce bank ability to exploit advantages of the tax-shield.
The concerns may be legitimate in this case, especially if to estimate solely private costs
and benefits. Because on the macro-scale this “lost” portion of taxes has not vanished,
it goes back to the government, offsetting any extra costs to banks9. “So it is not clear
7Meant Modigliani and Miller (1958,[66]) “The Cost of Capital, Corporation Finance and the Theory
of Investment”.8in this thesis it is generally assumed that tax rate is progressive as it is in most countries9Assuming the collected taxes are not wasted by the government, but reinvested, contributing to the
35

that in estimating the wider economic cost of having banks using more equity, and less
debt, we should include the cost to banks of paying higher taxes” (Miles et.al. (2011),[63]).
The same view supports Admati et. al.(2010,[3]), pointing out that “from a public-policy
perspective, this effect [meant debt-advantage of tax-shield ] is irrelevant as it concerns only
the distribution of public money”. They explain that the tax savings obtained by a bank,
reduce the government tax revenue, forcing a contraction in public spending or an increase
in taxes elsewhere. So that in the end, while the bank gains, the public loses as in the
typical zero-sum game10. One can link this argument back to Miller (1977,[64]), who chal-
lenged the statement made in Miller & Modigliani (1988,[65]) that taxes are too large to
be ignored in the irrelevance proposition, saying that “even in a world in which interest
payments are fully deductible in computing corporate income taxes, the value of the firm,
in equilibrium will still be independent of its capital structure.” He incorporates personal
taxes into the model and, taking debt and equity as equally risky, illustrates his insight on
the market for corporate bonds.
Source: Miller, 1977 [64]
Figure 2.1: Equilibrium in the Market for Bonds
social wellfare.10Zero-sum game is a particular case in game theory where the gain or loss of one individual is exactly
balanced by the loss or gain of the other participating individual. If to sum up their total gains and losses,
the result will be zero. The outcome of the zero-sum situation is usually Pareto optimal, meaning that there
is no possible change, which would make one participant better off without leaving any other individual in
disadvantage.
36

Assuming for simplicity that there are only personal taxes on debt (personal taxes on in-
come from shares are zero), Miller shows that the supply for bonds in this case is a flat line
and the demand is continuously increasing. The reason the supply curve rd is flat at re(1−Tc)
is because the firms are ready to offer debt as long as the after tax cost of it is less than or
equal to the after tax cost of equity: rd(1− Tc) ≤ re. But the investors are willing to buy
these bonds only if their taxes on interest income are compensated by the rate of return.
So the rate of return on these bonds have to be high enough to be attractive for investors.
And this, in its turn, depends on the tax brackets investors are in. The demand curve is
thus upward sloping, implying continuous involvement of investors in higher and higher
tax brackets. The point of equilibrium is where fully tax-exempt bonds (usually sovereign)
are demanded by fully tax-exempt individuals, because only they can be satisfied with the
corresponding low rate of return. In Miller’s model this continuum of investors along the
supply curve is under the tax range of Tpd’s from 0 to larger than Tc, where the last in-
vestor to buy a debt security is the one with the corporate tax brackets (Tpd = Tc). Miller
concludes that if a firm offered an amount of bonds larger than the equilibrium amount,
the interest rate would have to be higher than re(1−Tc)
, which would make it unprofitable for
some levered firms. If the corporations were to issue less securities as what optimum sug-
gests, the ability to pay low interest would drive up the demand for bonds, inducing firms
to lever up and thus the economy would end up in the equilibrium point again. In Miller’s
world, there is no optimum for individual firms, but for the sector as a whole, because
all-equity or low-levered firms would attract investors in high tax brackets, whereas firms
loaded with debt will find their clients in low tax brackets. But this are just different kinds
of investors with no advantage of one over another. So “in this important sense it would
still be true that the value of any firm, in equilibrium, would be independent of its capital
structure, despite the deductibility of interest payments in computing corporate income
taxes” (Miller, 1977,[64]). This also means that “a firm’s debt/equity decision cannot be
considered in isolation. The debt of different firms are substitutes for each other. Equity
and debt with the same level of riskiness are also substitutes” (Nyborg, 2011,[71]).
But Miller’s model is not the only one broadly accepted, it has to compete with others in
its attempt to explain how taxes may affect the cost of capital. Beside Miller & Modigliani,
there is another important theory, which found its place somewhere in between. DeAngelo
and Masulis (1980,[21]) offer a Compromise Theory, where they claim, that a firm can
increase its value by adding up debt, but the tax gain per unit of interest will be less than
the corporate tax rate. In this case the corporate tax shield will be a decreasing function
of borrowing, meaning that there is some tax advantage to debt. The economists came
to this conclusion by questioning the flatness of the supply curve, illustrated by Miller
37

(1978). They claim that in equilibrium firms are willing to issue debt as long as the after
tax cost of it is less than the after tax cost of equity: rd(1− Tc) = re. This happens, they
argue, because firms do not possess an unlimited capacity to use tax shield, but they are
also in different tax brackets with corresponding (limited) capacity to benefit from tax-
deductibility of debt (Nyborg, 2011,[71]).
It is therefore not a straightforward task to estimate the effect of taxes on the capital struc-
ture of a firm or a bank, which is a more relevant case in the context of this thesis, assuming
M&M applies to banks. It does not seem possible yet to calculate the sensitivity of the
tax advantage of debt exactly. The theories differ as does the empirical evidence, ranging
from “large” size of tax advantage (Fama and French, 1998,[34]) to “small” (Kemsley and
Nissim, 2002,[56]). But in any case, one has to come back to the point of perspective and
ask which side is winning while the other will have to suffer. It would be miraculous if
adding leverage would make all parties better off and maybe there would be no further
discussions if everyone were satisfied. Many articles represent a quest for an optimal capi-
tal structure, the question is: optimal for whom. Usually it is the banks and corporations
which are the departure point. But after or in the middle of the economical calamities like
the latest financial crisis, there is a search of “another” optimum, which includes the social
perspective as well. Because in the end, the tax-payers pay for the rescue of “too-big-to-
fail” redistributing wealth and closing an economic cycle. So in the end it comes to the
question who should pay first.
Bankruptcy, Bank Runs and Deposit Insurance
That is another important argument in the discussion about bank financial decisions. The
M&M framework works under the assumption of no-default, regarding both, a bank and an
investor. This means, all debt is riskless and individual borrowing is a perfect substitute to
a bank borrowing. That is a good starting point but without further analysis it is incom-
plete as an approach. Miller (1988,[65]) in his later article “Modigliani-Miller Propositions
After Thirty Years” addressed to this problem: “The troublesome tactical simplification
in the original proof was our taking bonds or other debt instruments to be securities not
merely of lower risk than common stocks, but of no risk whatever.[...] Drawing so sharp a
line between risky stocks and risk-less bonds served, we thought, to bring out the risks of
corporate leveraging as such, and , to that extent, also to explain how the seeming gains
from using cheap debt can be offset by the higher risks and hence costs of leveraged eq-
uity (our MM Proposition II) keeping the weighted average risks and costs the same (our
Proposition I). But making bonds risk-less also made all debts effectively indistinguishable,
38

thereby, leaving corporate finance, in the strict sense, with nothing to do. [...] Thus, iron-
ically, the risk-less debt assumption we introduced originally to sharpen the line between
corporate stocks and bonds seemed to have blurred the line between the corporation and
other forms of business organization.”
There is a plenty of scientific literature examining how financial distress may distort the
Irrelevance Proposition, contributing to the calculation of capital. Generally, two types of
bankruptcy costs could be distinguished direct and indirect. The first category includes
legal and other administrative fees connected with bankruptcy. The second - comprises op-
portunity costs, such as lost sales, decreased productivity and profitability, restrictions of
firms borrowing and higher compensation and costs from the suboptimal use of resources,
asymmetric information, and conflict of interest problems (Fisher and Martel, 2001,[39],
Jensen and Smith, 1984,[51]). Analyzing the impact of direct costs on a number of rail-
road firms, Warner (1977,[89]) finds that expected present value of bankruptcy expenses
is rather small compared to the market value of the firm. Baxter (1967,[13]) in his turn
shifts the focus to the direct costs, pointing out its significance. In the article “Leverage,
Risk of Run and the Cost of Capital” he discusses how excessive leverage in the context
of the Modigliani and Miller model, can be expected to raise the cost of a firm’s capital.
In addition, Kraus and Litzenberger (1973,[60]) argue that tax shield is going to be offset
by the expected increase of bankruptcy costs in case of growing leverage. They define the
point at which additional leverage causes an increase in expected bankruptcy costs that just
balance out the tax advantage to the incremental debt as the point where capital structure
is optimal. According to academical evidence, the costs of financial distress do seem to
make a difference for the debt/equity decision of the firm. In this respect it is worthwhile
to mention a paper of Hellwig (1977,[46]), who supports the argument that the probability
of a firm’s bankruptcy depends on its debt/equity ratio and that if it is large enough, this
probability will always be positive. He also finds that even in case of such probability,“the
M&M Theorem can be valid, if and only if all portfolios that are used as collateral for in-
dividual borrowing contain a firm’s bonds and equity in the same proportions in which the
firm has issued them.” This contradicts (or complements) the results of Stiglitz (1972,[84]),
who suggested that M&M was no longer valid in situation of bankruptcy. According to
Hellwig, it is only the case if an individual were to borrow on margin to invest only in the
firm’s equity.
Even if scientific literature is inconclusive regarding this issue, there is still an indication,
that financial distress does matter and when it does not, there are rather restrictive condi-
tions that are fulfilled. “Too restrictive to be of much practical importance”, how Hellwig
39

(1977,[46]) concludes himself.
It does not seem clear yet how bankruptcy is connected with government intervention and
its role in defining optimal mix of capital. It becomes obvious, when one thinks about bank
runs.
Arriving at this point of the analysis it would make sense to choose Diamond and Dybvig
(1983,[28]) as the departure point for the next destination. The economists introduced
an extensive model of banking, justification its existence as a financial intermediary and
providing an analysis of bank runs and financial crises. At the core of the theory lie the
specifics of banking business. Bank balance sheet is structured in such a way, that there
is a substantial liquidity mismatch between the side of assets and the side of liabilities. A
bank creates loans, adding them to its assets, which have longer maturity and cannot be
quickly sold at a high price, and issues demand deposits on the liability side, which could
be withdrawn at any time. This existential function of banks to provide liquidity, smoothes
consumption patterns and alleviates the maturity problems for consumers, who are rather
uncertain about the timing of consumption and moreover are heterogeneous in their inter-
temporal preferences. By liquidating their assets in different time buckets the consumers
ensure the functioning of this mechanism. Banks can make long-term loans, while main-
taining relatively small amounts of cash, to service depositors’ withdrawals. That requires a
suggestion of “ordinary circumstances”, where the probability of all consumers demanding
their deposits is rather low, assuming their needs do not correlate. According to Diamond
and Dybvig (1983,[28]), the disadvantage of this concept is in its inherent instability.
Banks do not possess information according to when exactly do their depositors need the
money and at the same time they are not able to call in the loans with long maturity in case
many depositors want to withdraw. If all consumers were to decide to go for their money
simultaneously, the bank would run out of cash, subsequently forced to declare bankruptcy.
This means that even a healthy profitable bank with sound strategy and good management
is sensitive to panics and can go bankrupt. The Diamond and Dybvig model (1983,[28])
explains bank runs as some form of self-fulfilling prophecy, where depositors behavior is a
function of expectation of what other depositors would do. If there is a considerable amount
of individuals expecting the others would withdraw and knowing that the bank will only be
able to serve the first to come, they will also call in for their funds. In mathematical terms,
the situation is represented by a game with multiple Nash-equilibria. In a rational world, if
depositors are to expect others to withdraw only when they really need their money, they
will also go for liquidity only when it is necessary. If the expectation is not associated with
40

the real need but with the urgency to withdraw as long as the bank does not run out of
cash, the depositors will rush to their accounts. If the world were not only rational but
also Pareto-efficient, the second equilibria would not exist. In reality the world is hardly
both and bank runs are not just a theoretical implication of a model. Only to mention the
Northern Rock episode, where one of the most innovative and rapidly growing banks in
the UK dried out of liquidity and, unable to serve all its depositors, was taken into state
ownership11.
Diamond (2007,[27]) shows, that deposit insurance backed by the government or the central
bank can serve as an instrument to prevent bank runs, arguing that suspension to converta-
bility12may work as long as it is just a threat. But when the situation is extended when it
has to be actually carried out, the depositors would demand another way of handling with
runs. That is where government “safety net” comes into light.
Diamond and Dybvig (1983,[28]) suggest a model, where “deposit insurance provided by the
government allows bank contracts that can dominate the best that can be offered without
insurance and never do worse.[...]Deposit insurance guarantees that the promised return
will be paid to all who withdraw”. They show that in this case, the “bad equilibrium”
disappears, because for the late consumers it does not make sense anymore to queue up in
the first period with early consumers because they would get less as if they waited until the
time when they usually would consume. A bank with such a safety net can credibly promise
its investors not to have runs and government can ensure the security through its taxation
authority. The theory would work fine if it were not prone to moral hazard. Having its
deposits insured, the bank has a temptation to take excessive risks. As the government
guarantees the liquidity anyway, the investors do not have an incentive to monitor bank
behavior and will tend to choose the most profitable bank. Here starts the deadly spiral,
which somewhere becomes a “too-big-to-fail” problem, meaning that the state cannot allow
a bank to default, because it will contagiously pull other banks, that invested in that bank,
down to collapse. Diamond and Dybvig (1983,[28]) anticipated this problem, pointing out
that “if the lender of last resort were always required to bail out banks with liquidity
problems, there would be perverse incentives for banks to take on risk, even if bailouts
occurred only when many banks fail together.[...] If the lender of last resort is not required
to bail out banks unconditionally, a bank run can occur in response to changes in depositor
11More about Fall of Nothern Rock by H.S. Shin (2009, “Reflections on Nothern Rock: the Bank Run
that Heralded the Global Financial Crisis”, Journal of Economic Perspectives, 23 (1)), pp. 101 - 119.12Diamond (2007,[27]) illustrates a simple model where a bank can suspend convertability of deposits to
cash in attempt to stop a bank run.
41

expectations about the bank‘s creditworthiness”. Therefore, deposit insurance can cause a
big amount of problems, requiring proper regulation and supervision. But here comes the
question: what is “appropriate regulation”? One of the major issues, underlined by Admati
et.al.(2010,[3]) is that government guarantees account for another distortion (beside taxes
and other issues, articulated further in the thesis) that favors debt over equity financing.
The economists address it as the “privatization of profits and socialization of costs” and
indicate that the banks unfairly profit from cheaper borrowing, as they otherwise would.
The government takes over a portion of the risk, so that the depositors do not demand
banks to pay high compensation for the risk. Admati at. al. suggest, that charging
banks for this safety net would remove the subsidy and biased perception of costly equity
financing. But, acknowledging that this approach would be extremely hard to carry out
and that incentives to take excessive risk would not be possible to eliminate with any
insurance plan, they advocate a policy of leverage reduction. This would lower social costs
and minimize the probability of bank failure and a subsequent bailout. Similar opinion
in this respect expresses another group of prominent economists - Miles et.al.(2011,[63]) -
claiming that an underpriced state insurance produces a market friction, contributing to
the misinterpretation of M&M results. The scientists stress that the existence of insurance
does not nullify the logic of Modigliani and Miller (1958), but that the Proposition holds
even if debt is completely safe (insured). This distortion, among with other frictions, is
however responsible that the Irrelevance Theorem does not hold to the full extent.
2.3 Is Debt a Carrot or a Stick?
Another frequently mentioned advantage of the debt is its disciplinary function. This dis-
cussion finds its roots in the early articles of M. Jensen (since 1976, [50]), where he examines
the problem of principal-agency relationships. The difficulty lies in the separation of own-
ership and management, where those who provide capital (principals) are not well informed
(asymmetric information) about the actions of the hired management (agents), who effec-
tively decide what to do with the means. Thus the principals do not know if or to what
extent the contracts have been satisfied and need to find incentives, which would motivate
the agents to act in the desirable way. In the case of banks, there could be conflicting
interests between outside investors and the bank management. Generally, the latter could
profit from extensive risk-taking, as they would benefit if the project is a success and would
not lose if it is a failure, as the investors are the ones who have to bear the losses. Diamond
(1994,[26]) suggests that “if the firm is financed exclusively with equity, outsiders never
have control and the firm will always invest (meant, also in risky projects). If the firm
cannot fully repay its debt obligation, then the firm cannot avoid a default and the owners
42

of the debt can take control of the firm”. It seems, that the solution to the principal-agency
problem partially lies in the choice of leverage. According to Jensen (1986,[49]), debt can
induce managers to behave efficiently. In contrast to dividends, which may be subsequently
reduced, interest on debt has to be repaid, independently from the performance. He claims,
that “greater leverage also overcomes institutional resistance to entrenchment, which the
free cash flow hypothesis assumes13”.
One problem with this argument is that by adding up leverage, bank exposes itself to in-
creased probability of bankruptcy and related costs, which counterbalances and eventually
offsets the advantages of debt disciplinary effects.
Another input comes from Admati et.al.(2010,[3]), who emphasize that the above refer-
enced arguments, though theoretically correct, are inadequately applied to the discussion
of capital regulation. They claim that here, on the contrary, the use of debt can generate
and aggravate agency problems and the mechanisms through which debt can perform its
disciplinary function do not properly work for large institutions. Besides, it was observed,
that debt did not prove its effectiveness in ameliorating the situation during the years 2007
- 2008.
The major difference in the case of banks is its already mentioned maturity mismatch: part
of its loans are illiquid and could be hardly assessed from the outside, whereas other assets
are very tradable, allowing management to promptly reorganize bank positions, sometimes
to the personal advantage. Moreover, banks and firms are dissimilar in their focus on
agency problems. Firms are mostly concerned about empire building, whereas banks have
to predominantly deal with risk management and theft, which can be easily hidden due to
the high liquidity of some assets. Exacerbating this problem of in-transparency with exces-
sive leverage can lead to unfavorable consequences. Non-financial institutions are less prone
to this kind of problems, having lower level of leverage and thus less incentives to engage
in risky activities. Apart from high leverage and more dispersed investors, the state insur-
ance eliminates an incentive for depositors to spend resources on monitoring bank behavior.
Admati et. al. (2010,[3]) legitimately ask why debt is considered to be “uniquely capable
of providing managerial oversight for financial institutions”. They accentuate the use of
13The free cash flow hypothesis was described by Jensen (1986,[49]) and stated that the management
in possession of free cash flow will invest it in negative NPV-projects, striving to increase size and scope
of organization (so-called empire building), rather than paying the liquidity excess to shareholders. He
difines free cash flow as cash flow left after the firm invested in all positive NPV-opportunities. Besides,
realizing specific investments, managers entrench themselves, making it costly for shareholders to replace
them. (More about management entrenchment by A. Shleifer and R. Vishny (1989,[81]).
43

compensational instruments in provision of management incentives, indicating that capital
structure in this context is not an appropriate tool, laden with additional problems and
socially costly indirect consequences.
Calomiris and Kahn (1991,[16]) claim that the function of debt discipline is enhanced due
to the repeated renegotiating of contracts. According to this logic, the creditors make
efforts to control the bank activities and if they are not satisfied the contracts will not
be renewed. Diamond and Rajan (2001,[29]) point out that, in fear of the run, the bank
management will in its turn better monitor its borrowers. Admati et.al.(2010,[3]) respond
to this argument, illustrating the failing of the short-term debt to perform its disciplinary
function during the financial crisis of 2007 - 2008, where renewable debt instruments, mostly
in the form of roll-over repo contracts were largely expanded. They claim that the most
effective discipline for management must come from the shareholders. In this case, this can
be linked to information when the debt or equity is repriced. The latter is repriced on a
daily basis, compare to debt, which has a much longer period before the next renegotia-
tion happens. Plus, debt holders, believing to be protected by government guarantees or
marketable collaterals, may refuse to spend resources on monitoring altogether. Analyzing
the latest crisis and its consequences, Kashyap et.al.(2008,[54]) come to conclusion that
excessive short-term leverage was the core of the problem. As the housing market deterio-
rated, increasing the perceived risk of mortgage-backed securities, it became challenging to
refinance the short-term loans against these securities. Banks were trying to get rid of the
troubled assets, pulling down their price, sometimes below their fundamental values. Due
to the valuation losses, the bank capital was compromised, making it even harder to get a
roll-over funding. The downward spiral continued due to borrowers, who started to panic
as the banks cut back on their loans, preserving liquidity.
2.4 Banker’s Argument
After the Basel III capital regulations were announced, there was a wave of discontent on
the side of bankers and top executives. They claimed that with increased capital ratios the
banks:
• first, will not be able to function efficiently and will have to restrict lending, which
will hurt borrowers and eventually cause a credit crunch
• and second, will lower bank‘s return on equity (ROE), deteriorating its performance
and thus hurting the shareholders
44

The arguments are certainly to some extent true, but as with any statement, it depends
how the message is formulated and from which perspective it is looked at. Putting this
differently, one could say that the new capital requirements might hurt bankers, as the ROE,
to which management compensation is bound to, will decline. The mechanics are rather
straightforward, but still deserve some close attention. Here is the basic ROE equation:
ROE =ROA · A − r ·D
E= ROA+
D
E· (ROA − rd) (2.1)
where
ROA = return on assets
A =total assets
E = bank equity
D = bank debt
rd = after-tax interest on debt
Source: Admati et.al.(2010 [3])
One can see, that when there is more equity in the denominator, there will be less return
on equity as a result. By taking only ROE as a measure for profitability, one can claim,
that the industry will become inefficient. An important point, that many bankers omit in
their arguments, is that ROE on its own cannot be taken as a profitability measure without
appropriate risk-adjustment. Every additional unit of return, is mirrored somehow in the
risk characteristics of the investment, keeping in mind that free-lunch is not available yet.
As Admati et.al.(2010 [3]) emphasize in their article ”Fallacies, Irrelevant Facts, and Myths
in the Discussion of Capital Regulation: Why Bank Equity is Not Expensive”, that more
equity would reduce ROE in good times, but raise it in bad times, which is the interest of
shareholders. Admati (2011,[2]) stresses that “unless leverage and risk are held constant,
ROE comparisons across managers or banks are meaningless”, because “leverage increases
realized ROE when realized returns on assets are above the borrowing rate, by magnifying
the impact that rises in asset values have on earnings. However, high leverage also magni-
fies losses when returns on assets are low - a small negative return on asset relative to the
borrowing rate can wipe out much, or even all, of the equity”.
What about the reduced lending possibilities? Here it also comes down to how the problem
is stated. In fact, to raise the proportion of equity and reduce leverage, it is not necessary
to shrink the balance sheet and sell off the assets. Nor do the banks need to set equity
aside, which they claim would drive up the cost of funding. Admati et.al.(2010, [3]) show
different possibilities to comply with the new requirements and just one of them is to cut
45

back the assets. Other options are recapitalization, when some parts of the liabilities areis
replaced with additional equity, or even expansion of assets if the bank wants to keep the
size of its assets and liabilities unchanged.
It is however possible to expect that many banks will charge higher interest for lending,
subsequently causing a slowdown of investment activity and a lower level of the GDP. The
recent study of Miles et.al.(2011,[63]) showed that “even proportionally large increases in
bank capital are likely to result in a small long-run impact on the borrowing costs faced by
bank customers”. They conclude, that even by doubling the portion of equity, the average
funding cost will increase by only around 10 - 40 basis points, simultaneously creating large
benefits by reducing the probability of systemic failures due to loss-absorbing qualities of
capital. Investigating the historical development of equity funding and costs in the UK
and the US since 1880, the authors find no evidence that higher capital ratios required
considerable increase in cost of borrowing for firms, although the amount of leverage was
almost half the current level. They observe an upward trend in leverage for 100 years, but
no significant trend for the average growth of the economy. Kashyap, Stein and Hansen
(2010,[55]) analyze data on US banks and find that “substantially higher capital require-
ments for significant financial institutions are likely to have only a modest impact on the
cost of loans for households and corporations.”
46

3
Empirical Evidence
3.1 Previous Studies
There is a large spectrum of scientific evidence regarding a bank’s capital structure and
performance. Many studies from different regions were undertaken to reveal what deter-
mines a bank’s optimal performance, how costly capital requirements are, how large the
benefits coming from debt-financing are. There are different approaches as there are dif-
ferent datasets, time periods and examined environments, the results are heterogenous as
well.
Most studies distinguish two sets of factors influencing profitability: bank specific and
external determinants. The first category contains such variables as bank capital ratio,
overhead costs, yearly growth of deposits, bank size, ownership, age, nationality, interest
income share, funding costs and risk. Macroeconomic and industry-specific characteristics
include tax rate, regional population, GDP growth, term structure of interest rate and
stock market capitalization.
Pasiouras and Kosmidou (2007,[73]) investigate the influence of a bank’s internal and ex-
ternal parameters on profitability of commercial domestic and foreign banks operating in
the 15 EU countries over the period 1995 - 2001. Their findings show that most variables1,
bank specific characteristics, financial market structures and macroeconomic conditions
are significant 2. In this regard, they indicate, that size and bank profitability are posi-
tively related, whereas Micco et.al.(2007,[62])3 find that this relationship is not significant.
Akhavein et.al.(1997,[4]) as well as Smirlock (1985,[82]) confirm a positive and significant
relationship between size and bank profitability.
Abreu and Mendes (2002,[1]) study a number of european banks during the period of 1986
- 1999. Using the loans-to-asset ratio as a proxy for risk, they find an evidence for positive
1With the exception of concentration in the case of domestic banks profits, for more details see F.
Pasiouras and K. Kosmidou (2007,[73])2However their impact and relation with profits is not always the same for domestic and foreign banks,
for more details see Pasiouras and Kosmidou (2007,[73])3Their dataset includes more than 70’000 observations and primarily focused on the relationship between
bank ownership and performance.
47

impact on the profitability of the bank. Bourke (1989,[14])4, Molyneux and Thornton
(1992,[67])5 perform empirical studies, where they show that the relationship between risk
and profitability is negative.
Athanasoglou et.al.(2008,[5])6 indicate that high overhead costs in relation to the assets
contribute to the lower profitability of a bank.
Micco et. al. (2007,[62]) reveal that state-owned banks located in developing countries
are less profitable than the private ones and that the difference between their performance
increases during election years. At the same time, studies of Nocera and Sironi (2007,[47])7
as well as Barth et. al. (2004,[8])8 provide evidence for government-owned banks being less
profitable than their private counterparties. Bourke (1989, [14]), Molyneux and Thornton
(1992,[67]) claim that the relationship is not significant.9
It is interesting to examine the empirical evidence of financial structure to bank prof-
itability. Here, Bourke (1989,[14]), Demirguc-Kunt and Huizinga (1999,[22]), Abreu and
Mendes (2002,[1]), Goddard et.al.(2004,[42]), Naceur and Goaied (2005,[69]), Molyneux and
Thornton (1992,[67]) and Pasiouras and Kosmidou (2007,[73]) observe positive relationship
between the level of equity and a bank’s performance. It is worth to mention the study
of van Binsbergen et. al. (2008,[88]) here, which estimates firm-specific cost of corporate
debt functions for many companies from 1980 to 2006. The finding reveals that the net
benefit of debt is about 3% of asset value, whereas the cost of debt equals about 7% 10.
4The study is performed on 12 countries from European, North American and Australian areas5The study includes eighteen European countries for the time period between 1986 and 19896The study uses a panel of Greek banks, covering the period 1985 - 20017The study includes a sample of 181 large banks from 15 European countries over the 1999 - 2004
period and evaluate the impact of alternative ownership models and the degree of ownership concentration
on profitability, cost efficiency and risk.8The paper examines 107 countries and assesses the link between specific regulatory and supervisory
practices, banking-sector development, efficiency, and fragility.9see Dietrich and Wanzenried (2010,[30]) and for more analysis of empirical evidence.
10Possible benefits of debt include, for example: tax savings (see Kraus and Litzenberger (1973,[60])),
management efficiency (see Jensen (1986,[49])), lenders monitoring (see Jensen and Meckling (1976,[50])).
Possible costs: financial distress (see Scott, (1976,[80])), personal taxes (see Miller (1977,[64])), debt over-
hang (see Myers, (1977,[68])) and agency conflicts (J. van Binsbergen (2008,[88])).
48

3.2 The Model
Selection of Variables
Profitability Parameters
• Return on Assets (ROA)
ROA is a widely used criterion to measure performance. It is defined as the ratio of
bank annual earnings to its total assets and shows the efficiency of the management
in generating income from invested capital.
• Return on Equity (ROE)
ROE denotes the rate of return on shareholders equity and it indicates the man-
agement’s ability to generate profit with the money shareholders have invested. It
is often but sometimes inappropriately (or insufficiently) used performance measure,
since it does not adjust for the scale of risk (see, for example, Admati (2010,[3])).
• Price to Book Ratio (P/B)
It is the ratio of the market value of the stock to book value per share, expected
to yield if the liquidation would take place. In other words, it is the measure of
shareholder’s equity in a bank balance sheet. In connection with ROE it contributes
to the misperception of performance, since the high ROE ratios are often linked with
the overvaluation of equity.
• Excess Return (Alpha)
Shows how much on average the stock price moved while the market index was un-
changed. Alpha is defined as a measure of performance on a risk-adjusted basis. It
is also called the abnormal rate of return on a security in excess of what would be
predicted by equilibrium model like CAPM.
Predictors
• Total Capital Ratio Tier I (Capital Ratio)
This ratio is taken as a proxy for the bank leverage and is defined by Basel Committee
as the ratio of a bank’s core equity (shareholder equity and disclosed reserves) to its
total risk-weighted assets (RWA). This is a key predictor parameter in the model,
whose effect on Return we are most interested in. Currently this ratio is the target
measure for regulators, assessing a bank’s financial strength and capacity to act in
distressed circumstances. Loosely speaking, rising the ratio among other initiatives
49
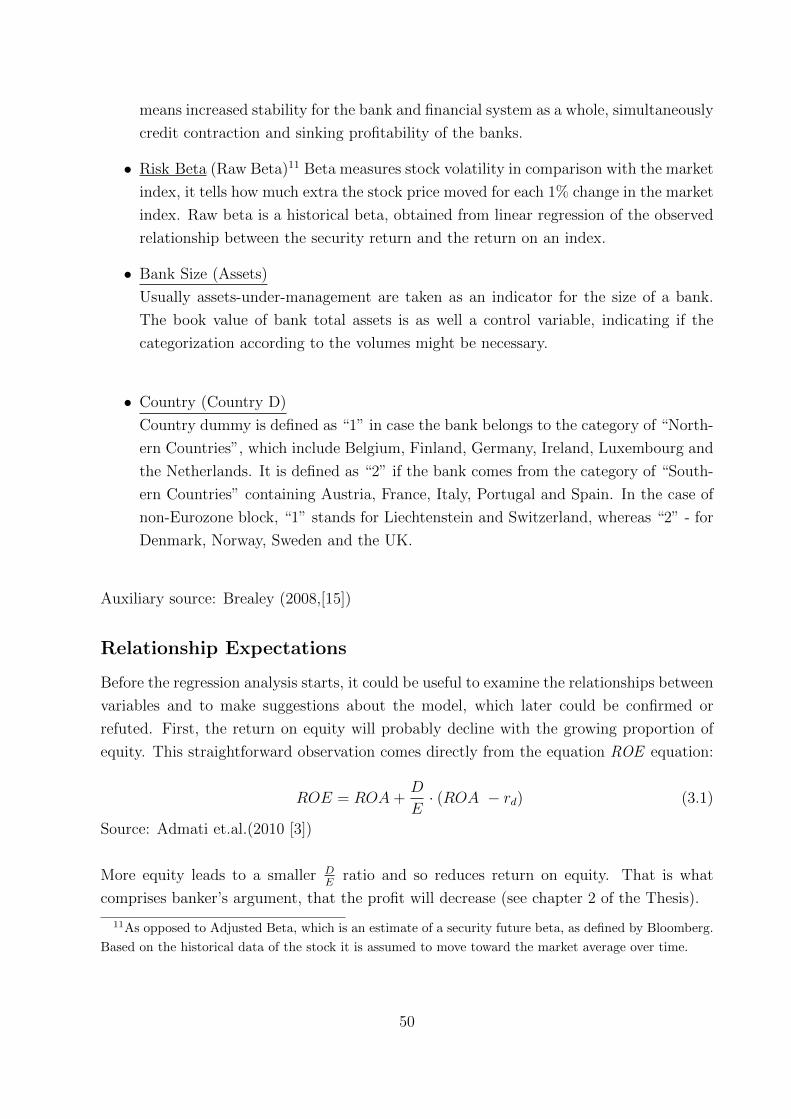
means increased stability for the bank and financial system as a whole, simultaneously
credit contraction and sinking profitability of the banks.
• Risk Beta (Raw Beta)11 Beta measures stock volatility in comparison with the market
index, it tells how much extra the stock price moved for each 1% change in the market
index. Raw beta is a historical beta, obtained from linear regression of the observed
relationship between the security return and the return on an index.
• Bank Size (Assets)
Usually assets-under-management are taken as an indicator for the size of a bank.
The book value of bank total assets is as well a control variable, indicating if the
categorization according to the volumes might be necessary.
• Country (Country D)
Country dummy is defined as “1” in case the bank belongs to the category of “North-
ern Countries”, which include Belgium, Finland, Germany, Ireland, Luxembourg and
the Netherlands. It is defined as “2” if the bank comes from the category of “South-
ern Countries” containing Austria, France, Italy, Portugal and Spain. In the case of
non-Eurozone block, “1” stands for Liechtenstein and Switzerland, whereas “2” - for
Denmark, Norway, Sweden and the UK.
Auxiliary source: Brealey (2008,[15])
Relationship Expectations
Before the regression analysis starts, it could be useful to examine the relationships between
variables and to make suggestions about the model, which later could be confirmed or
refuted. First, the return on equity will probably decline with the growing proportion of
equity. This straightforward observation comes directly from the equation ROE equation:
ROE = ROA+D
E· (ROA − rd) (3.1)
Source: Admati et.al.(2010 [3])
More equity leads to a smaller DE
ratio and so reduces return on equity. That is what
comprises banker’s argument, that the profit will decrease (see chapter 2 of the Thesis).
11As opposed to Adjusted Beta, which is an estimate of a security future beta, as defined by Bloomberg.
Based on the historical data of the stock it is assumed to move toward the market average over time.
50

There seems to be a similar consideration about the ROA:
ROA = ROE · EA
+ r · DA
(3.2)
But now one can see the problem. On one hand, the ROA should go up with the increased
equity, on the other hand go down because ROE declines. It is not a straightforward con-
clusion about which effect will overweigh. It is also not clear then whether ROE would
just decline if equity grows. This ambiguous effect comes from the interconnection between
these two profitability measures. One can imagine this as a linear dependence, which be-
comes more elastic the bigger the share of equity in the balance sheet is. This points at
the cushion-property of equity, meaning that above some point, ROE will be lower with
additional equity and below that point - ROE will be higher with higher equity. The point
is where the bank’s ROE is equal to the after-tax rate of interest on debt. As the banks
usually operate “above the point”, earning more than return on their debt, the effect on
ROE is typically negative. In times of trouble the relation would change, also affecting
ROE and making equity cushion a vital possession. That is why it could be interesting to
look at the empirical evidence, before, during and after the crisis. Here is the graphical
representation of the effect:
Source: Admati et.al.,2010 [3]
Figure 3.1: The Effect of Increased Equity on ROE
51

According to CAPM estimation Beta equity is connected with the ROE in the following
way:
ROE12 = rf + βe · (rm − rf ) (3.3)
Thus, one can expect positive correlation between these parameters. It is however not
obvious to which extent beta will affect the return on equity and if the intensity changes
during the crisis. The same concerns ROA, whereas the relationship is less clear.
The size seems to be an important factor, whose influence could be interpreted in both
ways. Intuitively one could assume growing profitability with increasing size of a bank, due
to the economies of scale and further advantages of size. But bigger institutions also tend
to involve themselves in riskier operations, which leads to a big variance in profitability
and may have other consequences. The relation would supposedly be positive before the
crisis and could turn negative during it.
Measuring if there is a proper return for the given level of risk, we get the Jensen‘s Alpha
equation, which indicates the connection between risk and excess returns.
α = ROE − (rf + βe · (rm − rf )) (3.4)
According to this interdependence, Alpha should rise with ROE and sink with beta. It
would be interesting to observe how the quality of this relationship changed over the last
years. P/B ratio has clearly a positive correlation with ROE and besides can not be taken
as a standalone variable to assess performance. It could be expected, that during the crisis
there is a bigger mismatch between price-to-book and return-on-equity ratios, indicating
under- or overvaluation of particular stocks.
Data
The analysis is based on data extracted from the Bloomberg database. The sample is
taken from the banks of European countries and divided into two sets: Eurozone and
non-Eurozone countries. The first data set consists of Austria, Belgium, Finland, France,
Germany, Ireland, Italy, Luxembourg, the Netherlands, Portugal and Spain. The second
set considers Denmark, Liechtenstein, Switzerland, Norway, Sweden and the UK. The sets
contain 42 and 52 banks respectively. Within each set there is a categorization according to
the size and Tier 1- capital ratio. Both classifications yield three subsets of small, middle
and big banks. The data provided by the Bloomberg database comes from the end-of-year
12Here ROE is an expected return, whereas in the alpha equation it is realised return. For the purpose
of simplicity it is written equally
52

balance sheets of publicly traded banks from 2002 to 2010.
The data was cleaned in the following way. First the banks have been filtered according to
the completeness of the available data. The banks with insufficient information about the
parameters of interest for this Thesis were excluded from the sample. Then, the remaining
data was checked for outliers (no data points were left out based on this criteria) and
organized in a way that allowed sorting and categorization. Now this panel data showed
the evolution of the banks’ performances through time. Each year from 2002 to 2010 the
panel sample contains the same banks, chosen in accordance with the bank unique ticker
symbol. Once yearly clean data was prepared, the numbers have been sorted by size and
capital (as stated earlier). The final set thus contains four ordered data files for Euro-
and non-Eurozone countries respectively. In the next step the clean data in each subset
has been divided into three groups dependent on the size or capital sorting. The group
of the smallest and the biggest banks contains 30% each of the total sample and 40% has
been set for the middle-sized/capitalized banks. Hence a 30% - 40% - 30% proportion was
chosen for every subset of bank data, resulting in overall twelve data files, six for each group
of countries. The data was checked for asymptotical normality of error-terms, checked for
heteroscedasticity and adjusted for autocorrelation with Cochrane-Orcutt estimator. Hence
it was ready for the analysis.
Data Analysis
Table 4.1 provides descriptive statistics for banks from the Eurozone, ordered by size and
by capital. Table 4.2 summarizes bank characteristics for non-eurozone countries.
Comparing these two tables one can make following observations. Eurozone- and non-
Eurozone banks are hardly comparable according to their size. Particularly “smallest”
and “middle” categories differ substantially. The numbers (in euros) indicate much larger
banking institutions in the Euro-area. For example, the mean values for the smallest and
middle-sized Euro-banks are 10.7 billion and 78.3 billion, whereas for non-Euro only 280
million and 6 billion respectively.
Analyzing the tables combining both size- and capital-sort one can see, that the biggest
banks in the Eurozone are also the ones with the highest capital ratio (by size: 710.8 bil-
lion with 27.23% and 10.7 billion with 8.64%, by capital: 286.1 billion with 10.4% and 172
billion with 7.03%). Non-Euro members, on the contrary, capitalize themselves with the
highest proportion of own capital, possessing the lowest amount of assets on average (by
53

size: 553.6 billion with 10.18% and 276 million with 13.59%, by capital: 53.23 billion with
16.91% and 305.7 billion with 8.65%). This inverse order of size-capital relation among
banks, depending on the geographical and economical area is worth mentioning, particu-
larly with respect of the later regression analysis.
Raw Beta as a measure of risk or relative volatility reveals that the biggest Eurozone banks
are the riskiest ones, having returns that change on average 1.31 times the magnitude of
the overall market’s returns, compared to beta of 0.44 for the smallest banks (by size-sort,
less distinctive but not contradictory by capital-sort). In the non-Eurozone area the same
pattern can be observed: the biggest banks have an average beta of 1.19 and the smallest
ones have 0.47 (by size sort, confirmed by capital-sort).
It’s interesting to look at the profitability measures across various groups of banks. In par-
ticular worth examining are the ROA and ROE parameters. A clear pattern can be seen
in the group of non-Eurozone banks. The smallest banks by assets have the highest ROA
(1.31%) and lowest ROE (9.5%) on average, while the biggest banks have the opposite -
lowest ROA (0.56%) and highest ROE (12.02%). Ordered by capital, the best capitalized
banks (they are the smallest) are the most profitable measured by ROA, with 1.26% on
average. The least capitalized banks, which are the biggest, have the lowest profitability of
0.64% ROA but the highest ROE of 11.36%. The middle and the best capitalized banks
have slightly lower ROE of 10.22% and 10.62%. The observation of ROE across banks
reveals that, although the biggest ratio of return on equity is to be found by the least
capitalized banks, the distinction according to this criteria (capital ratio, which is a proxy
for leverage) is not significant and the pattern is not straightforward. At the same time,
the tendency of the ROE ratio to decline with decreasing size of the bank is much stronger.
ROA shows a clear pattern of falling with the size and rising with the proportion of eq-
uity. This statistics are not in line with the banker’s argument, who argue that with the
increased capitalization their profit will drastically decrease. ROE is frequently mentioned
as an important measure of profitability. If to base the claim on the other yardstick (e.g.
ROA), the conclusion might be quite different.
In the case of Eurozone-group of banks, the behavior of ROA parameter is the same as with
non-Eurozone-group, but the numbers are lower (0.6% the highest average ROA, compared
to 1.31% of non-Euro banks). Sorting by capital is also consistent with these observations,
showing that ROA ratio rise with an increased amount of equity. The dynamic of ROE is
again less clear, which gives no ground to establish dependent relationship between ROE
and leverage.
54

Another remarkable observation concerns Price-to-Book ratio which, taken on average from
the different groups, does not reveal a particular correlation between bank size, capitaliza-
tion and leverage. It does not fluctuate extremely across differently categorized banks and
apparently is affected by different parameters, not examined here. It is as well not possible
to base “banker’s argument” on this profitability measure.
The last here considered profitability variable is alpha. Interpreted as an excess return it
tends to decline with an increased amount of assets under management and rise with higher
capitalization. The pattern is similar to the one of ROA and reveals itself for all groups in
Euro- and non-Euro areas.
So far, the main conclusions from bank descriptive characteristics are the absence of clear
correlation between ROE and Price-to-Book ratios to leverage (as reverse to capitalization),
an apparently positive correlation between amount of capital (equity) and ROA (the same
for alpha) and the opposite structure of size-capital relationship for Euro- and non-Euro
groups.
Regression Analysis
After the data is cleaned and preliminary analyzed, the next step is to empirically check the
arguments described above in the thesis. Such a test can be made stating the null hypothesis
as a M&M Proposition of capital structure irrelevance and the alternative hypothesis that
it does not hold.
H0 : β1 = 0; HA : β1 6= 0; (3.5)
Although the collected data might be insufficient to make strong empirical conclusions13,
for the sake of scientific curiosity two approaches were used for the regression analysis. The
first is the traditional panel regression, based on OLS estimators. Another makes use of
Fama-MacBeth estimators (FM henceforth). Both methods, though grounded on the same
idea, show important differences in the ways they operate. In particular, the FM procedure
gives standard errors corrected for cross-sectional and serial correlation of the residuals14.
Referring to Cochrane (2005 [18]), if to assume that the regressors are time-invariant, the
13The study is based on the data, provided by Bloomberg database, which contains consistent information
about publicly listed banks from Euro- and non-Eurozone only since 2002. After eliminating datasets with
missing values, only 42 and 51 banks forn Euro- and non-Euro area respectively were left for the analysis.14For more details about the Fama-Macbeth approach see Fama and MacBeth (1973,[35]), Cochrane
(2005,[18]) and Campbell (1996, [17])
55

results from two approaches should be equivalent. This rather impractical assumption leads
to the unprejudiced state of mind before the results have been obtained.
The formal model for the regression analysis is the following:
yj = β0 + βi
n∑i=1
xi + ei (3.6)
where yj can be interpreted as a vector of profitability parameters with j= {ROA, ROE,
price-to-book, alpha}; βi is a parameter vector of regression coefficients, xi is a vector of
regressors and ei is an error term with i = {capital ratio, ln(assets), raw beta, country
dummy15} and n is a number of regressors.
The results for the plain panel regression are represented in the Tables 4.3 - 4.4 for the Eu-
rozone banks and in the Tables 4.5-4.6 for the Non-Euro banks, sorted by size and capital
accordingly. Average values, used for the regressions are given further in the Appendix.
FM regression was carried out in two steps. First the cross-sectional regressions for each
point of time produced the time-series of βi estimators. Then the resulting yearly coeffi-
cients were averaged:
βi =1
T
T∑t=1
βi (3.7)
The significance of the obtained estimates are based on the time-series standard deviations
of the yearly coefficients:
tβi =βiσβi
(3.8)
where
σ2βi
=1
T (T − 1)
T∑t=1
(βi − βi)2 (3.9)
are standard errors of estimates.
Tables 4.7- 4.10 summarize the results, ordered by region, size and capital.
Remarkably, the outcomes of both methods do not confirm each other. Statistically though,
they do not contradict either. But the discrepancy deserves some attention. Starting from
the point of null-hypothesis, which states that the capital structure is independent of prof-
itability, one looks for the indication of βi coefficients significantly different than zero.
According to FM regression results, we can not reject the null-hypothesis in the majority
15only in case of FM regression
56

of cases. Assuming empirical validity of tests, it would not be correct to exclude the possi-
bility that leverage has no effect on bank profitability, which is consistent with the M&M
Proposition.
The panel regression reveals another picture, where the coefficients on capital ratio are
negative and significant, but only for the Euro-group, particularly for middle- and small-
sized banks. For these banks, better capitalization is associated with worse performance in
terms of ROA, ROE and price-to-book ratios. These are the banks with a low proportion of
equity. That may lead to the conclusion, that better capitalized banks are more robust to
changes in capital, in particular reduction of leverage. The banks with the highest stakes of
equity seem to be insensible to the variation in capital structure. The fact, that the capital-
profitability relationship is inverse with the non-Euro banks may affect the (in)significance
of estimators in this case.
Worth mentioning are the relations between other parameters. For example, panel regres-
sion suggests negative and significant dependency between risk parameter beta and various
profitability measures, predominantly for middle and big banks, also in the non-Euro area.
Knowing that in one case it is about the most capitalized banks (Eurozone) and in the
other case the least (non-Eurozone), one cannot directly connect this with leverage. It
allows though to conclude, that mostly for the banks with the largest amount of assets,
beta factor, measuring risk is not irrelevant for profitability, but rather negatively related
to it.
Another observation from panel regression analysis shows that Euro-banks with the lowest
amount of equity and assets as well as non-Euro-banks with the highest amount of equity
have significant coefficients for alpha, excess return. In the first case it is possible to link
higher capitalization and risk with reduced excess returns, in the other case - higher cap-
italized banks are more profitable in terms of alpha. The result is not inconsistent if to
recall, that small Euro-banks are the least capitalized and more sensitive to the changes in
capital structure. On the contrary, best capitalized non-Euro banks may even profit from
an additional amount of equity. This is in line with the theoretical argument, that the less
equity the bank possesses, the more expensive it is to raise it.
Both samples from Euro- and non-Euro areas show that there is a positive and significant
relationship amount of bank assets and profitability, mostly for the big banks, for which it
is apparently easier to improve the rate of returns through expansion.
57

Coming back to the major point of the Thesis and the discussion concerning the capital
structure, cost of capital and profitability one can conclude the following. The regressions
of parameters of interest (leverage proxy and profitability) by both methods revealed the
possibility of M&M irrelevance proposition to be right, i.e. to hold for banks. In cases where
the null-hypothesis was rejected we can suppose a negative association between amount of
equity and profitability variables. Cases, where it was not rejected allow us to assume
both, that the connection may or may not take place. In some cases we can observe, that
comparably better capitalized banks find it easier to get additional returns as the ones with
the lowest stock of equity.
Due to the relatively small sample size in both, time and quantity dimensions, one cannot
make any definite statements concerning the causal relationships between amount of capital
and profitability of banks. However the absence of strong proof against the null-hypothesis
should not be underestimated. Improved statistical instruments can be used in quest for
further empirical evidence related to this issue, which would bring new pieces of informa-
tion and maybe allow to draw new conclusions.
58

4
Evaluation
4.1 Proposals to Capital Regulation
At this place, thinking about the future of bank regulation, the lecture of Ch. Goodhart
at the LSE in summer 2010, comes to mind: “So, what are we going to do? Well, let me
start by saying that anybody, any fool, anyone of you in five minutes, if you really wanted
to and if you were a dictator, could make banks much much safer. All you gonna do is put
much more capital, a lot less leverage, more liquidity, tighter margin controls and maximum
loan-to-value ratio of 50%. We can all do it. Why dont we, why dont we just make banks
safer?”1
This is a good question, which is now being asked by a large group of individuals, coming
from financial as well as non-financial areas. In this case it is not a rhetorical question.
Following the line of argument of this leading economist one can learn some facts, which
make it easier to at least partly answer the question.
The economical situation in the last years was such, where a trend of bank credit has grown
faster than the retail deposits. Banks adjusted their activity to this trend by substituting
relatively safe public-sector debt with private-sector assets that are much riskier. In addi-
tion they looked for wholesale funding with a very short-maturity and involved themselves
in securitization on a large scale to increase proportion of new lending. Such behavior
causes a regulative response to reverse such practices, which bears substantial costs for
banks. This is what the argument is about - the cost of additional equity, that takes banks
“into a less profitable, less preferred position in their activities as intermediaries”, how
Goddhart (2010) puts it. The argument goes on by concluding that, independently of the
circumstances that make the previous position comfortable, the removal of these benefits
by government will turn bank intermediation into a less profitable business. That would
mean, that the banks will charge more for their services, driving up bid-ask spreads and
less deals will take place. Credit expansion will be curbed and probably even reversed.
This is what bankers threaten with when they talk about credit crunch. This is the point,
where Miles (2010) says, that one has to carefully weigh the costs of such a crunch opposed
1This citation in a slightly different form appears in the article by Ch. Goodhart “How Should We
Regulate the Financial Sector in the LSE Report “The Future of Finance (2010, [87])
59

to the potential profits of avoiding systemic crises, where the probability of such disasters
is not easy to calculate precisely.
As Goodhart (2010) states it, “there is a trade-off between the extent and degree of reg-
ulation on banks, to make them safer, and their capacity to intermediate between lenders
and borrowers, particularly their ability to generate credit flows on acceptable terms to
potential borrowers.” It is by far not clear yet how the problem is going to be solved.
Another problem is that pushing banks into the framework of tighter regulation makes the
alternative of operating in the unregulated field more attractive. Different countries have
different regulative practices as well as legal bases. The quest for opportunities in order to
outplay the system may lead to new distortions and imbalances in the globalized world.
There are not just problems stated, but also a range of solution proposals. Leading schools
of economics joined their forces in order to stabilize the financial system and banking indus-
try as a part of it. The result of this collaborative thought often is an insightful guidance
for financial regulators and politicians. As an example, The Squam Lake Group, consisting
of 15 academics, issued a distilled report, which attempted to provide “a revelatory, unified,
and coherent voice for fixing our troubled and damaged financial markets. As an alterna-
tive to the patchwork solutions and ideologically charged proposals that have dominated
other discussions, the Squam Lake Group sets forth a clear nonpartisan plan of action to
transform the regulation of financial markets - not just for the current climate, but for
generations to come.”[40]
Regarding the reform for capital requirements they propose the following steps, summarized
below:
• to make capital ratios higher for larger banks
• to connect capital requirements with the liquidity of the assets held by the bank
• to make the proportion of equity held by financial institution an increasing function
of its short-term debt
The economists rightfully doubt that these measures would be endorsed by banks, because
in case of implementation, they would bear the major costs, receiving only a small part of
societal benefits.
Dewatripont, Rochet and Tirole (2010[23]) provide a comprehensive overview of what hap-
pened in the last financial crisis and which lessons have to be learned. Among other valuable
suggestions they advocate for a “powerful and independent banking supervisor” and “abso-
lute prohibition against the injection of public funds into banking sector during “normal”
60

periods, allowing market discipline to dominate. They point out that “the critical issue is
the definition of a rule for the sharing of the costs of intervention among the central bank,
the deposit insurance fund, and the Treasury”.
Coming back to Ch. Goodhart and following his line of argument, one can think of capital
requirements as a “desired” levels of equity, which were transformed by markets and rating
agencies into minimum capital ratios and if they are minimal, they cannot act as a buffer.
This oxymoron is another way to think about bank capital and its regulation.
In his article Goodhart (2010, [87]) stresses the need of a “fundamental change in the way
we, but supervisors in particular, used to think about the way financial regulation oper-
ates.” Hence the “paradigm shift” is necessary as a part of the solution. The now prevalent
idea of the purpose of regulation is that it has to curb bankers’ excessive risk taking and
to encourage them to comply with “best practices”, requiring them more capital to hold.
He argues, that the regulation should not intend to limit the risks as long as they are
properly internalized. Goodhart reverts the attention to externalities, the grade by which
the malfunctioning in one institution may spread and affect the other and consequently the
whole system might be damaged.
Analyzing the causes and the lessons from the last financial crisis, H. Davies ([20]) from
the London School of Economics concludes the discussion “Few would contest that stronger
capitalization of banks is a lesson from the crisis. The financial markets themselves are
likely to penalize weakly capitalized institutions, even if regulators do not do so. But the
sums of new equity required to recapitalize the system will be huge. The impact on credit
availability and the cost of capital is uncertain.”
4.2 Is Debt Expensive?
Getting an idea about the history of capital regulation, the complexity of equity-debt re-
lationship and the strong intentions of the Basel Committee to reform the current system,
one can think about what is to come. Where does this analysis of financial structure leave
us? For the bank, is it better to drastically de-lever and pile up equity, taking advantage
of its loss-absorbing qualities to reduce the probability of default? Or is the risk worth it
and banks should invest resources in figuring out how to outplay the new requirements in
order to profit from the positive effects of debt-financing? For regulators, should they push
the requirements higher and demand banks to fully comply with the strict rules on capital
to protect the tax-payers? Or should the government be rather moderate and cautious of
61

a credit-crunch, lowering GDP and undesirable behavior of bankers? I think, the answer is
“it depends”. It depends on the perspective: private or social. It depends on the present
period in economics: one tends to have different ideas and incentives at the peak and at
the bottom of the cycle waves. It depends on the incumbent regulators, who contingent
on how they set the play-field, get different responses. It would be incorrect and rather
narrow-minded to say that one source of financing is definitely better than the other. Under
the multiplicity of circumstances it may well be that for one group of market participants
the cost of debt will be lower, whereas at the same time it will be higher for another group.
The same applies to equity. One tends to seek for clarity and definiteness and to make
statements, but these statements also serve as justifications and often come from incentives
of particular interest group. It may be better to be aware of the limitations of assertive
statements and to turn the focus on the motives that lie behind. Analyzing what drives
a certain line of argument may help in figuring out the most appropriate response in a
particular situation.
The way I look at the Miller & Modigiliani Propositions is not the one that allows to take a
side in the argument. It serves as the holding point one should refer to in order to make a
sound, logical reasoning under any set of circumstances and economical environment. That
was the genius of M&M, who made their Proposition so long-lasting and resistant to the
legion of critics. It is its inherent fundamentality, which allows to go in any direction once
one established the current location.
The analytical part of the thesis showed that equity is not more expensive than debt per
definition, but can be so under a particular set of circumstances. This additional cost
might however be offset by the comparable benefits of equity, which differ for the various
participants. There has not been a question whether the regulation should take place at
all and require higher ratios of own capital. It better should, otherwise it will not keep up
the pace with the evolution in banking industry. The question is rather how to handle it
correctly and to find an appropriate reaction, justified and not exaggerated.
Empirical analysis gave an indication that the Irrelevance Proposition should not be dis-
missed. In fact, it is possible that M&M holds and the factors that may prevent its
fulfillment in other times are now offset by the series of counter-balancing factors. This
particular setup might give rise the M&M in its purest form. Assuming the empirical tests
are valid, this is not an unthinkable outcome.
As it seems, the world is full of imperfections and M&M may give a guidance how to deal
with it, because as Miller pointed out “showing what doesn’t matter can also show, by
implication, what does” (1988, [65]).
62

Appendix
Table 4.1: Risk-weight of assets (Basel I)
% Item
0 Cash
Claims on OECD central governments
Claims on other central governments if they are denominated and
funded in the national currency
20 Claims on OECD banks and multilateral development banks
Claims on banks outside OECD with residual maturity less than
1 year
Claims on public sector entities (PSE) or OECD countries
50 Mortgage loans
100 All other claims: claims on corporate, claims on banks outside
OECD with a maturity longer than 1 year, fixed assets, all other
assets, etc.
Source: Balthazar, 2006,[7]
Table 4.2: RWA in the Standardized Approach (Basel II)
AAA to
AA– (%)
A+ to A–
(%)
BBB+ to
BBB– (%)
BB+ to B–
(%)
B+ to B–
(%)
Below B–
(%)
Unrated
(%)
Sovereign 0 20 50 100 150 100
Bank option 1 20 50 100 150 100
Banks option 2 20 50 100 150 50
(Short-term claims) (20) (20) (50) (150) (20)
Corporate 20 50 100 150 100
Retail 75
Residential Property 35
Commercial Real Estate 100
Source: Balthazar, 2006,[7]

Table 4.3: Comparing Basel I, II and III
Basel I Basel II Basel II.5 Basel III
New capital definition
Capital Ratios New capital buffers
and Targets New leverage ratio
Higher minimum ratios
Systemic add-on
Pillar-3 Disclosure
RWA Pillar-2 ICAAP Counterparty risk
Requirements Pillar-1 Operational Risk Incremental risk
Pillar-1 Market risk Trading book revisions
Pillar-1 Credit risk New Pillar-1 Credit risk Securitization revision
Coverage ratio
Liquidity Net stable funding ratio
Standards
Tier 1 & 2 definition
Source: PWC, 2010,[75], BIS, 2011[12]
Table 4.4: Basel III Introduction TimelineAs of
2011 2012 2013 2014 2015 2016 2017 2018 1 January
2019
Supervisory Parallel run Migration
Leverage Ratio monitoring 1 Jan 2013 - 1 Jan 2017 to
Disclosure starts 1 Jan 2015 Pillar 1
Minimum Common Equity Capital Ratio 3.5% 4.0% 4.5% 4.5% 4.5% 4.5% 4.5%
Capital Conservation Buffer 0.625% 1.25% 1.875% 2.5%
Minimum common equity
plus capital 3.5% 4.0% 4.5% 5.125% 5.75% 6.375% 7.0%
conservation buffer
Phase-in of deductions from CET1
(including amounts exceeding the 20% 40% 60% 80% 100% 100%
limit for DTAs, MSRs and financials)
Minimum Tier 1 Capital 4.5% 5.5% 6.0% 6.0% 6.0% 6.0% 6.0%
Minimum Total Capital 8.0% 8.0% 8.0% 8.0% 8.0% 8.0% 8.0%
Minimum Total Capital
plus conservation buffer 8.0% 8.0% 8.0% 8.625% 9.25% 9.875% 10.5%
Capital instruments that no longer
qualify as non-core Tier 1 capital Phased out over 10 year horizon beginning 2013
or Tier 2 capital
Source: PWC, 2010,[75], BIS, 2011[12]

Table 4.5: Bank characteristics: EurozoneSize-Sort
Mean Median Std.Dev. Std.Error Minimum Maximum Sample
Smallest
Total Assets (e, bn) 10.70 10.40 2.60 0.90 7.10 14.30 42
Capital Ratio Tier 1(%) 8.64 8.14 0.91 0.30 7.10 14.30 42
Raw Beta 0.44 0.50 0.15 0.05 0.28 0.64 42
Return on Assets (%) 0.60 0.51 0.20 0.07 0.35 0.95 42
Return on Equity (%) 9.28 8.78 3.05 1.02 4.81 13.84 42
Price–to–Book Ratio 1.45 1.61 0.34 0.11 0.87 1.82 42
Alpha (%) 0.59 0.47 0.35 0.12 0.24 1.05 42
Middle
Total Assets (e, bn) 78.30 82.20 19.20 6.40 52.10 99.10 42
Capital Ratio Tier 1(%) 8.48 8.25 0.69 0.23 7.85 9.87 42
Raw Beta 0.89 0.91 0.19 0.06 0.67 1.11 42
Return on Assets (%) 0.57 0.63 0.33 0.11 -0.06 0.89 42
Return on Equity (%) 10.41 11.91 7.43 2.48 -2.96 17.50 42
Price–to–Book Ratio 1.95 2.20 0.67 0.22 0.95 2.77 42
Alpha (%) 0.23 -0.03 0.43 0.14 -0.25 0.75 42
Biggest
Total Assets (e, bn) 710.80 780.30 242.90 81.00 377.20 983.10 42
Capital Ratio Tier 1(%) 27.23 27.38 0.38 0.13 26.66 27.61 42
Raw Beta 1.31 1.32 0.23 0.08 1.07 1.60 42
Return on Assets (%) 0.40 0.35 0.21 0.07 0.09 0.65 42
Return on Equity (%) 9.05 8.51 6.39 2.13 -1.12 16.85 42
Price–to–Book Ratio 1.23 1.40 0.40 0.13 0.65 1.70 42
Alpha (%) 0.03 -0.19 0.57 0.19 -0.73 0.67 42
Capital-Sort
Smallest
Total Assets (e, bn) 172.00 146.70 106.90 35.60 71.80 337.50 42
Capital Ratio Tier 1(%) 7.03 6.82 0.60 0.20 6.52 8.10 42
Raw Beta 0.81 0.82 0.19 0.06 0.55 1.11 42
Return on Assets (%) 0.41 0.42 0.27 0.09 -0.21 0.68 42
Return on Equity (%) 8.03 8.75 6.36 2.12 -7.09 13.75 42
Price–to–Book Ratio 1.47 1.63 0.39 0.13 0.81 1.91 42
Alpha (%) 0.28 0.20 0.51 0.17 -0.27 1.23 42
Middle
Total Assets (e, bn) 289.20 331.80 98.70 32.90 138.10 403.20 42
Capital Ratio Tier 1(%) 8.29 7.73 0.96 0.32 7.68 10.17 42
Raw Beta 0.91 0.90 0.16 0.05 0.73 1.20 42
Return on Assets (%) 0.55 0.54 0.22 0.07 0.23 0.84 42
Return on Equity (%) 10.84 9.88 6.06 2.02 0.79 19.26 42
Price–to–Book Ratio 1.69 1.77 0.67 0.22 0.84 2.73 42
Alpha (%) 0.21 0.15 0.47 0.16 -0.39 0.87 42
Biggest
Total Assets (e, bn) 286.10 295.00 104.60 34.90 149.60 496.20 42
Capital Ratio Tier 1(%) 10.40 9.92 0.95 0.32 9.68 12.33 42
Raw Beta 0.94 0.93 0.27 0.09 0.66 1.41 42
Return on Assets (%) 0.60 0.57 0.27 0.09 0.16 0.92 42
Return on Equity (%) 9.64 10.35 5.36 1.79 0.56 15.12 42
Price–to–Book Ratio 1.55 1.66 0.51 0.17 0.86 2.13 42
Alpha (%) 0.35 0.14 0.41 -0.10 0.90 42

Table 4.6: Bank characteristics: non–EurozoneSize-Sort
Mean Median Std.Dev. Std.Error Minimum Maximum Sample
Smallest
Total Assets (e, bn) 0.276 0.281 0.08 0.03 0.17 0.379 51
Capital Ratio Tier 1(%) 13.59 12.93 1.37 0.46 11.50 15.46 51
Raw Beta 0.47 0.68 0.28 0.09 0.16 0.72 51
Return on Assets (%) 1.31 1.52 0.77 0.26 0.31 2.27 51
Return on Equity (%) 9.50 11.40 5.88 1.96 1.58 17.36 51
Price–to–Book Ratio 1.32 1.26 0.47 0.16 0.81 2.17 51
Alpha (%) 1.04 -0.16 1,52 0.51 -0.30 2.73 51
Middle
Total Assets (e, bn) 6.02 5.69 1.63 0.54 4.21 8.78 51
Capital Ratio Tier 1(%) 12.71 12.77 0.97 0.32 11.10 14.21 51
Raw Beta 0.49 0.65 0.26 0.09 0.22 0.76 51
Return on Assets (%) 0.96 1.13 0.43 0.14 0.34 1.49 51
Return on Equity (%) 10.54 12.58 4.82 1.61 3.66 15.76 51
Price–to–Book Ratio (%) 1.17 1.08 0.42 0.14 0.66 1.99 51
Alpha (%) 0.59 -0.12 0.88 0.29 -0.20 1.53 51
Biggest
Total Assets (e, bn) 553.59 573.93 163.30 54.40 328.90 743.57 51
Capital Ratio Tier 1(%) 10.18 9.26 2.12 0.71 7.85 14.20 51
Raw Beta 1.19 1.22 0.24 0.08 0.97 1.48 51
Return on Assets (%) 0.56 0.66 0.29 0.10 0.19 0.87 51
Return on Equity (%) 12.02 14.86 7.59 2.53 0.69 20.59 51
Price–to–Book Ratio 1.59 1.78 0.47 0.16 0.75 2.15 51
Alpha (%) 0.02 -0.34 0.61 0.20 -0.68 0.65 51
Capital-Sort
Smallest
Total Assets (e, bn) 305.67 278.10 95.30 31.77 177.40 484.59 51
Capital Ratio Tier 1(%) 8.65 8.05 1.40 0.47 7.42 11.23 51
Raw Beta 0.83 0.87 0,16 0.05 0.63 1.08 51
Return on Assets (%) 0.64 0.69 0.35 0.12 0.12 1.10 51
Return on Equity (%) 11.36 13.37 7.08 2.36 1.44 20.19 51
Price–to–Book Ratio 1.38 1.42 0.48 0.16 0.51 1.97 51
Alpha (%) 0.21 -0.17 0.74 0.25 -0.69 1.08 51
Middle
Total Assets (e, bn) 145.28 140.89 68.09 22.70 43.39 230.35 51
Capital Ratio Tier 1(%) 11.43 11.05 1.54 0.51 9.73 14.17 51
Raw Beta 0.68 0.74 0.36 0.12 0.24 1.12 51
Return on Assets (%) 0.93 1.07 0.53 0.18 0.26 1.57 51
Return on Equity (%) 10.22 13.62 5.79 1.93 0.28 15.70 51
Price–to–Book Ratio 1.30 1.24 0.48 0.16 0.78 2.04 51
Alpha (%) 0.57 -0.32 1.19 0.40 -0.51 2.20 51
Biggest
Total Assets (e, bn) 53.23 56.91 54.13 18.04 2.29 145.68 51
Capital Ratio Tier 1(%) 16.91 16.98 1.33 0.44 14.53 18.49 51
Raw Beta 0.58 0.71 0.24 0.08 0.28 0.83 51
Return on Assets (%) 1.26 1.40 0.58 0.19 0.52 2.07 51
Return on Equity (%) 10.62 11.02 4.66 1.55 3.65 15.37 51
Price–to–Book Ratio 1.35 1.31 0.34 0.11 0.99 1.89 51
Alpha (%) 0.88 0.16 1.00 0.33 -0.09 2.12 51

Table 4.7: Panel regressions of performance variables on bank characteristics: Eurozone
Size-Sort
ROA (%) ROE (% ) P/B Alpha (% )
Smallest
Constant -12.960 161.697 10.708 -25.840b
(-0.99) (-0.83) (1.45) (-3.76)
Capital ratio tier 1(% ) -0.318c -4.881c -0.342a -0.532a
(-2.31) (-2.38) (-4.41) (-7.38)
Ln (assets) [ln(bn)] 0.696 9.124 -0.288 1.381 a
(-1.12) (0.99) (0.82) (4.24)
Raw beta 0.577 6.264 0.764c -1.857a
(-1.07) (0.78) (2.51) (-6.58)
Adjusted R2 0.562 0.572 0.950 0.959
Observations 42 42 42 42
Middle
Constant -0.020b -164.201c -14.434 10.457
(-2.67) (-2.13) (-0.73) (0.63)
Capital ratio tier 1(% ) -0.411 a -8.821a -0.580 b -0.293
(-13.20) (-12.38) (-3.18) (1.90)
Ln (assets) [ln(bn)] 0.556 a 10.704b 0.945 0.437
(4.00) (3.37) (1.17) (-0.64)
Raw beta -0.943a -21.073a -2.676c -1.991
(-1.07) (-4.16) (-2.07) (-1.82)
Adjusted R2 0.981 0.980 0.837 0.712
Observations 42 42 42 42
Biggest
Constant -22.422b -711.751b -23.642 37.741
(-3.08) (-3.12) (-1.80) (1.80)
Capital ratio tier 1(% ) 0.059 2.620 -0.001 0.159
(0.83) (1.18) (-0.01) (0.77)
Ln (assets) [ln(bn)] 0.914b 28.755b 1.051c -1.429
(3.25) (3.25) (2.07 (-1.76)
Raw beta 1.977b -64.684b -2.839 b - 0.131
(-3.29) (-3.42) (-2.61) (-0.08)
Adjusted R2 0.635 0.624 0.695 ).592
Observations 42 42 42 42
Each column presents separate regression, t-statistics are in brackets, letters (a,b,c) stand for two-tailed
statistical significance at the 1%, 5% and 10% respectively. Sample period covers years 2002 - 2010 (end-
year balance sheet data).

Table 4.8: Panel regressions of performance variables on bank characteristics: Eurozone
Capital-Sort
ROA (%) ROE (% ) P/B Alpha (% )
Smallest
Constant -8.805b -192.13c -2.351 -2.546
(-2.62) (-2.18) (-0.37) (-0.22)
Capital ratio tier 1(% ) -0.190 -4.663 -0.434c 0.127
(-1.90) (-1.78) (-2.28) (0.37)
Ln (assets) [ln(bn)] 0.440b 9.745b 0.293 0.158
(3.52) (2.97) (1.23) (0.37)
Raw beta -0.950c -21.719 -0.809 -2.620
(-2.12) (-1.85) (-0.95) (-1.71)
Adjusted R2 0.808 0.761 0.664 0.372
Observations 42 42 42 42
Middle
Constant -5.805 -168.402 -24.065 21.200
(-1.20) (-1.16) (-1.40) (1.31)
Capital ratio tier 1(% ) -0.248 a -6.834b -0.659b 0.057
(-4.32) (-3.95) (-3.2) (0.30)
Ln (assets) [ln(bn)] 0.325 9.117 1.257 -0.81
(1.61) (1.50) (1.75) (-1.19)
Raw beta -0.157 -3.368 -2.061 -0297
(0.74) (0.82) (-1.27) (-0.19)
Adjusted R2 0.674 0.621 0.65 0.218
Observations 42 42 42 42
Biggest
Constant -8.007 -173.584 19.922 13.935
(-0.84) (-0.74) (1.54) (0.89)
Capital ratio tier 1 (% ) -0.259c -3.838 -0.235 0.187
(-2.16) (-1.31) (-1.458) (0.95)
Ln (assets) [ln(bn)] 0.443 8.854 -0.598 -0.555
(1.17) (+0.96) -1.16 (-0.89)
Raw beta -0.376 -10.571 -0.214 -0.985
(-0.63) (-0.72) (-0.26) (-1.00)
Adjusted R2 0.510 0.256 0.745 0.432
Observations 42 42 42 42
Each column presents separate regression, t-statistics are in brackets, letters (a,b,c) stand for two-tailed
statistical significance at the 1%, 5% and 10% respectively. Sample period covers years 2002 - 2010 (end-
year balance sheet data).

Table 4.9: Panel regressions of performance variables on bank characteristics: non-Eurozone
Size-Sort
ROA (%) ROE (% ) P/B Alpha (% )
Smallest
Constant 51.516 426.271 19.071 13.721b
(1.23) (1.39) (0.61) (2.68)
Capital ratio tier 1(% ) -0.064 -0.436 -0.134 -0.043
(-0.32) (-0.30) (-0.90) (-1.75)
Ln (assets) [ln(bn)] -2.569 - 21.41 -0.843 -0.503
(-1.14) (-1.29) (-0.50) (1.82)
Raw beta 1.049 9.342 0.874 -5.001a
(0.41) (0.50) (0.45) (-15.87)
Adjusted R2 0.170 0.248 -0.205 0.997
Observations 51 51 51 51
Middle
Constant 5.340 29.086 8.773 -11.327
(0.13) (0.06) (0.21) (-1.04)
Capital ratio tier 1(% ) -0.168 -2.030 -0.068 0.081
(-0.78) (-0.85) (-0.32) (1.46)
Ln (assets) [ln(bn)] -0.090 0.467 -0.290 0.569
(-0.05) (0.02) (-0.15) (1.10)
Raw beta -0.453 -6.593 -0.468 -3.875a
(-0.22) (0.02) (-0.23) (-7.34)
Adjusted R2 -0.211 -0.191 -0.212 0.981
Observations 51 51 51 51
Biggest
Constant -27.685c -722.853c -21.312 26.628
(-2.35) (-2.23) (-1.17) (1.31)
Capital ratio tier 1(% ) 0.053 1.681 0.034 0.113
(0.93) (1.08) (0.38) (1.16)
Ln (assets) [ln(bn)] 1.128c 29.296c 0.963 -0.952
(2.40) (2.32) (1.35) (-1.20)
Raw beta -2.293b -61.126b -2.866c -1.714
(-2.90) (-2.80) (2.33) (-1.26)
Adjusted R2 0.468 0.422 0.513 0.648
Observations 51 51 51 51
Each column presents separate regression, t-statistics are in brackets, letters (a,b,c) stand for two-tailed
statistical significance at the 1%, 5% and 10% respectively. Sample period covers years 2002 - 2010 (end-
year balance sheet data).

Table 4.10: Panel regressions of performance variables on bank characteristics: non-Eurozone
Capital-Sort
ROA (%) ROE (% ) P/B Alpha (% )
Smallest
Constant -10.894 -240.718 0.900 -13.292
(-0.73) (-0.87) (0.04) (1.21)
Capital ratio tier 1(% ) -0.0.37 -1.629 -0.154 -0.068
(-0.31) (-0.75) (-0.96) (-0.79)
Ln (assets) [ln(bn)] 0.447 10.104 0.071 -0.354
(0.78) (0.95) (0.09) (-0.84)
Raw beta 0.058 -0.737 -0.067 -3.818a
(0.05) (-0.03) (-0.04) -4.29
Adjusted R2 -0.271 -0.062 -0.255 0.848
Observations 51 51 51 51
Middle
Constant 19.917 135.923 9.580 4.284
(1.33) (0.69) (0.47) (0.25)
Capital ratio tier 1(% ) -0.074 -0.516 -0.046 0.155
(0.82) (-0.44) (-0.38) (1.47)
Ln (assets) [ln(bn)] -0.709 -4.564 -0.296 -0.129
(-1.17) (-0.58) (-0.36) (-0.18)
Raw beta 0.002 -4.517 -0.248 -3.241b
(0.00) (-0.36) (-0.19) (-2.92)
Adjusted R2 0.540 0.434 -0.040 0.877
Observations 51 51 51 51
Biggest
Constant 6.862 42.761 5.263c 3.540a
(1.57) (1.09) (2.19) (6.31)
Capital ratio tier 1 (% ) -0.166 -1.357 0.179 0.081b
(-0.84) (-0.77) (-1.57) (3.20)
Ln (assets) [ln(bn)] -0.096 -0.220 -0.030 -0.087b
(-0.57) (-0.15) (-0.33) (-4.07)
Raw beta -0.913 -6.901 -0.300 -3.409a
(-0.65) (-0.55) (-0.39) (-18.87)
Adjusted R2 -0.078 -0.337 0.049 0.994
Observations 51 51 51 51
Each column presents separate regression, t-statistics are in brackets, letters (a,b,c) stand for two-tailed
statistical significance at the 1%, 5% and 10% respectively. Sample period covers years 2002 - 2010 (end-
year balance sheet data).

Table 4.11: Fama-Macbeth regressions of performance variables on bank characteristics: Eurozone
Size-Sort
ROA (%) ROE (% ) P/B Alpha (% )
Smallest
Constant -1.100 -10.507 2.737 -2.148
(-0.37) (-0.22) (0.78) (-0.49)
Capital ratio tier 1(%) 0.084c 0.497 0.023 0.093
(1.91) (0.84) (0.45) (1.00)
Ln (assets) [ln(bn)] 0.042 0.619 -0.070 0.071
(0.34) (0.31) (-0.42) (0.36)
Raw beta -0.143 3.611 -0.221 1.339
(0.44) (0.68) (-0.45) (1.11)
Country dummy -0.020 1.785 0.944a -0.388
(-0.10) (0.54) (3.30) (-0.81)
Observations 42 42 42 42
Middle
Constant 1.040 8.324 -1.740 4.173
(0.52) (0.20) (-0.35) (1.07)
Capital ratio tier 1(% ) 0.120 0.661 -0.017 0.046
(0.90) (0.18) (-0.12) (0.70)
Ln (assets) [ln(bn)] -0.065 -0.369 0.215 -0.162
(-0.59) (-0.14) (0.80) (-1.12)
Raw beta 0.201 5.821 -1.758a -0.630
(0.64) (0.96) (-2.77) (-0.73)
Country dummy -0.271 -3.553 0.047 0.473
(-0.38) (-0.23) (0.07) (0.96)
Observations (42) (42) (42 ) (42)
Biggest
Constant 4.018 37.716 3.721 1.202
(0.91) (0.35) (0.81) (0.17)
Capital ratio tier 1(% ) 0.081 3.836 0.000 -0.276c
(0.59) (0.79) (0.00) (-1.86)
Ln (assets) [ln(bn)] -0.150 -1.976 -0.103 0.054
(-0.82) (-0.41) (-0.56) (0.19)
Raw beta (%) -0.088 -4.902 -0.015 -0.550
(-0.28) (-0.64) (-0.03) (-1.32)
Country Dummy -0.364 -9.491 -0.126 0.176
(-1.53) (-0.84) (-0.33) (0.44)
Observations (42) (42) (42) (42)
Each column presents separate regression, t-statistics are in brackets, letters (a,b,c) stand for two-tailed
statistical significance at the 1%, 5% and 10% respectively. Sample period covers years 2002 - 2010 (end-
year balance sheet data).

Table 4.12: Fama-Macbeth regressions of performance variables on bank characteristics: Eurozone
Capital-Sort
ROA (%) ROE (% ) P/B Alpha (% )
Smallest
Constant -1.485 -38.585 0.616 0.374
(-0.55) (-0.64) (0.17) (0.05)
Capital ratio tier 1(% ) 0.276 6.898 0.156 0.161
(0.88) (1.09) (0.33) (0.59)
Ln (assets) [ln(bn)] 0.007 0.023 0.005 -0.044
(0.12) (0.02) (0.03) (-0.17)
Raw beta -0.253 -2.981 -0.374 -0.172
(-0.32) (-0.17) (-0.28) (-0.25)
Country Dummy -0.108 -2.884 0.623 -0.185
(-0.39) (-0.51) (0.60) (-0.34)
Observations (42) (42) (42) (42)
Middle
Constant 1.605 30.771 3.021 0.846
(0.68) (0.59) (0.37) (0.12)
Capital ratio tier 1(% ) -0.015 -2.687 -0.200 0.120
(-0.05) (-0.41) (-0.19) (0.17)
Ln (assets) [ln(bn)] -0.036 0.023 0.037 -0.057
(-0.62) (0.03) (0.22) (-0.49)
Raw beta 0.122 3.601 -0.967 -0.316
(0.43) (0.68) (-0.97) (-0.56)
Country Dummy -0.162 -0.818 0.333 0.378
(-0.74) (-0.15) (0.50) (0.41)
Observations (42) (42) (42) (42)
Biggest
Constant 2.228 29.615 -0.816 3.580
(1.07) (0.72) (-0.23) (0.82)
Capital ratio tier 1(% ) 0.052 -0.264 0.071 0.066
(0.59) (-0.17) (0.79) (0.46)
Ln (assets) [ln(bn)] -0.083 -0.745 0.099 -0.149
(-1.08) (-0.55) (0.47) (-0.64)
Raw beta 0.004 1.350 -1.096 -0.262
(0.01) (0.24) (-0.95) (-0.24)
Country Dummy -0.126 0.244 0.017 -0.233
(-0.47) (0.06) (0.08) (-0.07)
Observations (42) (42) (42) (42)
Each column presents separate regression, t-statistics are in brackets, letters (a,b,c) stand for two-tailed
statistical significance at the 1%, 5% and 10% respectively. Sample period covers years 2002 - 2010 (end-
year balance sheet data).

Table 4.13:Fama-Macbeth regressions of performance variables on bank characteristics: non-Eurozone
Size-Sort
ROA (%) ROE (% ) P/B (%) Alpha
Smallest
Constant -2.616 -23.456 8.399 9.907
(-0.73) (-0.64) (1.40) (1.49)
Capital ratio tier 1 0.080 0.146 0.030 0.013
(1.39) (0.23) (0.92) (0.22)
Ln (assets) [ln(bn)] 0.144 1.541 -0.431 -0.282
(0.73) (0.67) (-1.22) (-0.59)
Raw beta 0.225 4.114 1.867b 1.795
(0.25) (0.76) (1.97) (0.74)
Country D 0.000 0.000 0.000 0.000
(0.00) (0.00) (0.00) (0.00)
Observations (51) (51) (51) (51)
Middle
Constant 4.682 -17.235 -3.290 0.592
(0.67) (-0.28) (-0.27) (0.11)
Capital ratio tier 1 0.023 0.0273 0.037 -0.014
(0.45) (0.46) (0.76) (-0.20)
Ln (assets) [ln(bn)] -0.189 1.118 0.169 0.005
(-0.63) (0.44) (0.29) (0.03)
Raw beta -0.031 -1.877 0.776 0.075
(-0.02) (-0.12) (0.70) (0.24)
Country D -0.127 -3.605 -0.165 -0.041
(-0.29) (-0.63) (-0.10) (-0.05)
Observations (51) (51) (51) (51)
Biggest
Constant 1.144 -19.446 0.360 7.003b
(0.27) (-0.19) (0.99) (1.96)
Capital ratio tier 1 0.090 2.000 0.025 0.040
(0.61) (0.48) (0.31) (0.45)
Ln (assets) [ln(bn)] -0.70 0.945 0.037 -0.224
(-0.34) (0.34) (0.26) (-1.59)
Raw beta -0.151 -5.001 0.127 -1.168a
(-0.60) (-0.68) (-0.31) (-2.97)
Observations (51) (51) (51) (51)
Each column presents separate regression, t-statistics are in brackets, letters (a,b,c) stand for two-tailed
statistical significance at the 1%, 5% and 10% respectively. Sample period covers years 2002 - 2010 (end-
year balance sheet data).

Table 4.14: Fama-Macbeth regressions of performance variables on bank characteristics:non-Eurozone
Capital-Sort
ROA (%) ROE (% ) P/B (%) Alpha
Smallest
Constant 0.466 -14.077 0.260 1.120
(0.13) (-0.37) (0.10) (0.24)
Capital ratio tier 1 0.079 0.551 0.093 0.121
(0.79) (0.46) (0.46) (0.40)
Ln (assets) [ln(bn)] -0.021 0.868 -0.015 -0.050
(-0.15) (0.75) (-0.20) (-0.49)
Raw beta 0.051 0.511 0.861c -0.706
(0.16) (0.16) (1.75) (-1.42)
CountryD 0.000 0.000 0.000 0.000
(0.00) (0.00) (0.00) (0.00)
Observations (51) (51) (51) (51)
Middle
Constant 1.521 -4.752 0.688 2.087
(0.44) (0.20) (0.26) (0.53)
Capital ratio tier 1 0.071 -0.009 -0.062 0.027
(0.48) (-0.01) (-0.16) (0.13)
Ln (assets) [ln(bn)] -0.071 0.750 0.033 -0.087
(-0.64) (1.28) (0.14) (-0.79)
Raw beta 0.571 2.114 1.260 0.050
(0.57) (0.29) (1.03) (0.04)
CountryD -1.212 -14.302 -1.333 -0.751
(-0.66) (-0.65) (-0.61) (-0.31)
Observations (51) (51) (51) (51)
Biggest
Constant 2.121 -6.735 -0.665 3.527
(0.50) (-0.12) (-0.35) (0.73)
Capital ratio tier 1 0.066 0.216 0.048 -0.002
(0.71) (0.24) (0.81) (-0.03)
Ln (assets) [ln(bn)] -0.082 0.757 0.049 -0.114
(-0.59) (0.32) (0.64) (-0.68)
Raw beta -0.342 -5.255 0.245 -0.245
(-0.19) (-0.31) (0.33) (-0.39)
CountryD -0.496 -2.383 0.065 -0.062
(-0.77) (-0.26) (0.14) (-0.05)
Observations (51) (51) (51) (51)
Each column presents separate regression, t-statistics are in brackets, letters (a,b,c) stand for two-tailed
statistical significance at the 1%, 5% and 10% respectively. Sample period covers years 2002 - 2010 (end-
year balance sheet data).

Table 4.15: Clean Data. Eurozone. Size-sort.
Number Year Short Name Tot Assets:2002C ROA:2002C ROE:2002C Country Country Dummy Tier 1 Capital Ratio:2002C P/B:2002C Alpha:20020101:20050101 Raw Beta:20020101:200701011 2002 DEUTSCHE BANK-RG 758355001344 0.05 1.13 GE 1 9.60 0.91 0.31 0.902 BNP PARIBAS 710304989184 0.43 12.91 FR 0 8.10 1.27 0.94 1.123 CREDIT AGRICOLE 505718013952 0.21 6.99 FR 0 8.80 0.90 1.27 0.934 SOC GENERALE 501265006592 0.25 8.04 FR 0 8.14 1.45 1.28 1.185 COMMERZBANK 422133989376 -0.06 -2.90 GE 1 7.30 0.46 1.53 1.566 DEXIA SA 350692016128 0.37 15.11 BE 1 9.30 1.55 0.19 1.547 BANCO SANTANDER 324208099328 0.66 9.79 SP 0 8.01 1.30 -0.18 1.488 INTESA SANPAOLO 279752015872 0.07 1.49 IT 0 6.76 1.00 1.30 1.599 BBVA 279444520960 0.49 8.05 SP 0 8.40 1.63 -0.32 1.40
10 KBC GROEP 221730504704 0.46 12.96 BE 1 8.83 1.07 1.08 0.8511 UNICREDIT SPA 213349302272 0.85 16.68 IT 0 7.21 1.98 -0.03 0.7412 LANDESBANK BERLI 173669089280 -0.38 -16.99 GE 1 5.60 0.53 0.10 0.3413 CIC 162785001472 0.24 10.17 FR 0 6.29 1.09 1.23 0.2214 NATIXIS 133327003648 0.09 2.96 FR 0 7.20 1.00 0.41 0.7515 BANCA MONTE DEI 128872603648 0.47 11.14 IT 0 6.05 1.14 0.17 1.2016 ERSTE GROUP BANK 121222299648 0.25 11.64 AS 0 6.30 1.43 0.50 0.8717 BANK IRELAND 87297998848 1.08 22.45 IR 1 7.60 3.00 0.36 0.8818 ALLIED IRISH BK 85820997632 1.18 22.83 IR 1 6.90 2.76 0.33 0.8019 BANCO COM PORT-R 61851574272 0.44 12.49 PO 0 6.60 2.42 -1.69 1.5120 BANCO POPULAR 42005123072 1.60 22.96 SP 0 8.88 2.90 0.73 0.4221 BANCO ESPIRITO-R 41233821696 0.56 13.07 PO 0 7.01 1.87 0.44 0.4622 MEDIOBANCA 30503999488 0.87 5.84 IT 0 16.54 1.60 0.06 1.0123 BANCO SABADELL 27211225088 0.82 9.14 SP 0 8.16 1.24 0.68 0.3524 BANCO BPI SA-REG 25666099200 0.56 13.52 PO 0 7.40 1.42 0.99 0.7325 BANKINTER 22638188544 0.50 12.61 SP 0 8.04 1.95 0.39 1.0226 CREDITO EMILIANO 19087259648 0.61 13.43 IT 0 7.23 1.69 1.00 1.0627 OEST VOLKSBANKEN 18886699008 0.24 5.99 AS 0 9.47 9.13 0.91 0.0928 BANCA CARIGE 15363319808 0.45 4.95 IT 0 7.13 1.53 1.37 0.0229 POHJOLA BANK-A 12709000192 0.49 9.98 FI 1 7.00 1.07 1.00 0.7430 BANCO SARDEG-RSP 11536480256 0.52 7.55 IT 0 12.79 0.42 1.69 0.6731 VAN LANSCHOT-CVA 11288860672 0.85 16.51 NE 1 8.40 2.00 0.80 0.2532 CREDITO BERGAMAS 10444983296 0.85 11.74 IT 0 9.67 1.16 0.94 0.2933 BANCA POP SONDRI 10187244544 0.52 6.43 IT 0 9.65 1.86 0.73 0.0934 OBERBANK AG 9689099264 0.38 7.74 AS 0 6.83 1.20 -0.02 0.0635 CREDITO VALTELLI 9430503424 0.16 3.89 IT 0 6.15 1.20 0.38 0.1336 BANCO PASTOR 8869684224 0.89 13.31 SP 0 8.20 1.50 1.43 0.5137 OLDENBURG LANDES 8220900352 0.41 8.76 GE 1 7.00 3.90 -0.46 0.0438 BANIF-REG 6066775040 0.35 7.26 PO 0 7.05 0.62 0.39 0.5739 CREDITO ARTIGIAN 4340764160 0.36 5.81 IT 0 7.81 1.52 -0.32 -0.0840 BANCO DESIO 3715785984 0.40 7.26 IT 0 9.89 1.58 2.48 0.5941 ALANDSBANKEN-A 1812635008 0.55 11.09 FI 1 8.34 1.97 0.55 0.5242 BANCA POP SPOLET 1593699968 0.44 6.95 IT 0 8.07 1.00 0.57 0.40
Year Short Name Tot Assets:2003C ROA:2003C ROE:2003C Country Country Dummy Tier 1 Capital Ratio:2003C P/B:2003C Alpha:20020101:20070101 Raw Beta:20020101:200701011 2003 DEUTSCHE BANK-RG 803614031872 0.17 4.69 GE 1 10.00 1.36 0.39 0.902 CREDIT AGRICOLE 785731026944 0.16 5.30 FR 0 7.90 1.18 0.84 0.933 BNP PARIBAS 782996013056 0.50 13.76 FR 0 9.40 1.51 0.62 1.124 SOC GENERALE 539224014848 0.46 14.62 FR 0 8.66 1.72 0.97 1.185 COMMERZBANK 381584998400 -0.58 -25.92 GE 1 7.30 1.02 1.03 1.566 BANCO SANTANDER 351780405248 0.77 10.66 SP 0 8.26 1.79 -0.46 1.487 DEXIA SA 349462986752 0.41 15.71 BE 1 9.90 1.67 -0.57 1.548 BBVA 287083757568 0.79 12.45 SP 0 8.50 1.95 -0.64 1.409 INTESA SANPAOLO 260214996992 0.45 8.74 IT 0 7.84 1.35 0.87 1.59
10 UNICREDIT SPA 238255587328 0.87 15.68 IT 0 6.96 2.10 0.40 0.7411 KBC GROEP 225586790400 0.50 12.73 BE 1 9.54 1.23 0.93 0.8512 CIC 155838005248 0.29 11.40 FR 0 6.80 1.13 1.46 0.2213 LANDESBANK BERLI 152047403008 -0.26 -11.73 GE 1 6.10 0.57 2.41 0.3414 NATIXIS 135782998016 0.20 7.09 FR 0 8.10 1.09 1.18 0.7515 ERSTE GROUP BANK 128575299584 0.28 13.40 AS 0 6.30 1.98 0.39 0.8716 BANCA MONTE DEI 122973200384 0.35 7.88 IT 0 6.50 1.25 0.59 1.2017 BANK IRELAND 89302999040 0.94 20.16 IR 1 8.00 2.40 0.21 0.8818 ALLIED IRISH BK 80959995904 0.81 14.84 IR 1 7.10 2.18 0.30 0.8019 BANCO COM PORT-R 67687985152 0.68 17.38 PO 0 7.10 2.02 -1.32 1.5120 BANCO POPULAR 52611149824 1.51 21.38 SP 0 8.36 2.86 0.71 0.4221 BANCO ESPIRITO-R 43283349504 0.59 12.21 PO 0 7.76 1.86 0.42 0.4622 MEDIOBANCA 32887898112 0.17 1.18 IT 0 16.72 1.51 0.27 1.0123 BANCO SABADELL 30506350592 0.81 10.05 SP 0 7.57 1.44 1.32 0.3524 BANCO BPI SA-REG 26165600256 0.63 13.86 PO 0 6.80 1.83 1.33 0.7325 BANKINTER 23917830144 0.57 13.95 SP 0 8.01 2.42 0.21 1.0226 OEST VOLKSBANKEN 21561600000 0.28 6.93 AS 0 8.91 8.78 0.95 0.0927 CREDITO EMILIANO 20382799872 0.49 11.05 IT 0 6.60 1.77 0.76 1.0628 BANCA CARIGE 15918249984 0.54 5.78 IT 0 8.14 1.95 1.43 0.0229 POHJOLA BANK-A 14753999872 0.92 18.49 FI 1 7.00 1.19 0.79 0.7430 BANCO SARDEG-RSP 12486980608 0.29 4.25 IT 0 9.83 0.81 1.17 0.6731 VAN LANSCHOT-CVA 11578370048 0.90 16.26 NE 1 8.70 1.75 1.14 0.2532 CREDITO BERGAMAS 11056892928 0.89 12.75 IT 0 8.44 1.41 1.22 0.2933 BANCA POP SONDRI 10937561088 0.60 7.95 IT 0 8.82 2.04 1.12 0.0934 OBERBANK AG 10493100032 0.38 7.87 AS 0 7.08 1.21 0.50 0.0635 BANCO PASTOR 10411809792 0.64 9.49 SP 0 6.54 2.02 2.00 0.5136 CREDITO VALTELLI 10239960064 0.16 4.07 IT 0 5.79 1.29 0.70 0.1337 OLDENBURG LANDES 8343799808 0.44 9.10 GE 1 7.20 3.78 -0.67 0.0438 BANIF-REG 5711558144 0.43 7.81 PO 0 6.82 0.73 2.67 0.5739 CREDITO ARTIGIAN 4941704192 0.33 5.39 IT 0 7.64 1.30 0.16 -0.0840 BANCO DESIO 4283709952 0.50 9.85 IT 0 7.99 2.11 2.02 0.5941 ALANDSBANKEN-A 1851476992 0.58 11.25 FI 1 9.27 2.02 0.44 0.5242 BANCA POP SPOLET 1714104960 0.25 3.61 IT 0 6.96 1.05 1.21 0.40
Year Short Name Tot Assets:2004C ROA:2004C ROE:2004C Country Country Dummy Tier 1 Capital Ratio:2004C P/B:2004C Alpha:20020101:20070101 Raw Beta:20020101:200701011 2004 BNP PARIBAS 1002503012352 0.55 16.31 FR 0 7.50 1.37 0.62 1.132 DEUTSCHE BANK-RG 840067973120 0.30 9.14 GE 1 8.60 1.30 0.39 0.903 CREDIT AGRICOLE 817402019840 0.34 11.00 FR 0 8.00 1.22 0.84 0.934 BANCO SANTANDER 664486281216 0.71 12.13 SP 0 7.16 1.66 -0.46 1.485 SOC GENERALE 601354993664 0.55 17.86 FR 0 7.69 1.64 0.97 1.186 COMMERZBANK 424876998656 0.09 3.84 GE 1 7.50 0.92 1.04 1.567 DEXIA SA 388787011584 0.49 16.52 BE 1 10.00 1.47 -0.57 1.548 BBVA 329441148928 0.95 18.87 SP 0 7.90 3.38 -0.64 1.409 KBC GROEP 285162995712 0.63 15.04 BE 1 10.07 1.64 0.93 0.85
10 INTESA SANPAOLO 276134985728 0.69 12.13 IT 0 6.70 1.55 0.87 1.5911 UNICREDIT SPA 265406218240 0.82 15.46 IT 0 7.94 1.92 0.40 0.7412 CIC 172653002752 0.34 11.37 FR 0 7.20 1.15 1.46 0.2213 BANCA MONTE DEI 142757527552 0.45 9.00 IT 0 6.24 0.89 0.59 1.2014 NATIXIS 140033998848 0.35 11.65 FR 0 8.30 1.02 1.18 0.7515 ERSTE GROUP BANK 139811913728 0.39 16.76 AS 0 6.70 2.60 0.39 0.8716 LANDESBANK BERLI 130302001152 0.07 3.42 GE 1 7.50 1.02 2.41 0.3417 BANK IRELAND 106430996480 0.96 22.53 IR 1 7.20 2.24 0.21 0.8818 ALLIED IRISH BK 101108998144 1.24 21.05 IR 1 8.20 2.32 0.30 0.8019 BANCO COM PORT-R 71320363008 0.85 21.23 PO 0 8.10 2.27 -1.32 1.5120 BANCO POPULAR 63576084480 1.12 17.31 SP 0 7.94 2.92 0.71 0.4221 BANCO SABADELL 45709234176 0.98 13.39 SP 0 8.72 1.66 1.32 0.3522 BANCO ESPIRITO-R 43051798528 0.35 7.57 PO 0 6.41 2.03 0.42 0.4623 MEDIOBANCA 37779521536 1.52 11.07 IT 0 16.97 1.50 0.27 1.0124 BANKINTER 31270199296 0.63 14.91 SP 0 8.63 2.26 0.21 1.0225 BANCO BPI SA-REG 25755760640 0.61 14.54 PO 0 6.50 2.28 1.33 0.7326 OEST VOLKSBANKEN 23771035648 0.39 10.08 AS 0 10.57 8.37 0.95 0.0927 BANCA CARIGE 20786315264 0.61 6.48 IT 0 7.38 1.78 1.43 0.0228 CREDITO EMILIANO 19582595072 0.72 14.56 IT 0 7.60 1.85 0.77 1.0629 POHJOLA BANK-A 16879900672 0.68 14.20 FI 1 7.60 1.32 0.79 0.7430 VAN LANSCHOT-CVA 16577778688 0.72 11.87 NE 1 9.20 1.52 1.14 0.2531 BANCO PASTOR 15844462592 0.45 7.34 SP 0 6.92 1.68 2.00 0.5132 BANCA POP SONDRI 12610888704 0.70 8.45 IT 0 10.92 1.84 1.12 0.0933 BANCO SARDEG-RSP 11817326592 0.31 4.48 IT 0 9.77 0.84 1.17 0.6734 CREDITO VALTELLI 11595014144 0.46 9.57 IT 0 6.17 0.95 0.70 0.1335 OBERBANK AG 11293391872 0.38 7.70 AS 0 6.82 1.15 0.50 0.0636 CREDITO BERGAMAS 10586728448 1.06 13.76 IT 0 9.06 1.32 1.22 0.2937 OLDENBURG LANDES 8352700416 0.36 7.19 GE 1 7.00 3.59 -0.67 0.0438 BANIF-REG 7272748032 0.41 8.33 PO 0 7.92 0.88 2.67 0.5739 CREDITO ARTIGIAN 5301101056 0.36 5.81 IT 0 7.87 1.26 0.16 -0.0840 BANCO DESIO 4657143296 0.70 14.52 IT 0 8.04 3.22 2.02 0.5941 ALANDSBANKEN-A 1995326080 0.55 10.10 FI 1 7.79 2.01 0.44 0.5242 BANCA POP SPOLET 1855004032 0.45 6.59 IT 0 6.79 1.00 1.21 0.40
Year Short Name Tot Assets:2005C ROA:2005C ROE:2005C Country Country Dummy Tier 1 Capital Ratio:2005C P/B:2005C Alpha:20020101:20070101 Raw Beta:20020101:200701011 2005 BNP PARIBAS 1258078994432 0.52 16.58 FR 0 7.60 1.48 0.62 1.132 CREDIT AGRICOLE 1061443010560 0.41 14.45 FR 0 8.20 1.42 0.84 0.933 DEUTSCHE BANK-RG 992160972800 0.39 12.64 GE 1 8.70 1.38 0.39 0.90

Table 4.15: Clean Data. Eurozone. Size-sort.
4 SOC GENERALE 835134029824 0.61 21.23 FR 0 7.57 1.84 0.97 1.185 BANCO SANTANDER 818236555264 0.84 16.77 SP 0 7.88 1.75 -0.46 1.486 UNICREDIT SPA 787000197120 0.47 10.06 IT 0 6.89 1.72 0.40 0.747 DEXIA SA 508761014272 0.45 14.98 BE 1 10.30 1.46 -0.57 1.548 COMMERZBANK 444860989440 0.27 10.38 GE 1 8.10 1.34 1.04 1.569 BBVA 392389492736 1.06 25.90 SP 0 7.50 3.12 -0.64 1.40
10 KBC GROEP 351616008192 0.71 16.02 BE 1 9.40 1.79 0.93 0.8511 INTESA SANPAOLO 273534992384 1.10 18.71 IT 0 7.10 1.85 0.87 1.5912 CIC 195835002880 0.31 10.04 FR 0 6.90 0.90 1.46 0.2213 NATIXIS 168118992896 0.45 13.97 FR 0 8.30 1.24 1.18 0.7514 BANCA MONTE DEI 153749094400 0.53 10.89 IT 0 6.51 1.32 0.59 1.2015 ERSTE GROUP BANK 152680759296 0.49 19.14 AS 0 6.80 2.82 0.39 0.8716 LANDESBANK BERLI 144403005440 0.20 14.39 GE 1 8.10 1.56 2.41 0.3417 ALLIED IRISH BK 133214003200 1.15 21.63 IR 1 7.20 2.37 0.30 0.8018 BANK IRELAND 127780003840 0.90 24.70 IR 1 7.90 2.68 0.21 0.8819 BANCO POPULAR 77697744896 1.24 20.01 SP 0 8.09 2.50 0.71 0.4220 BANCO COM PORT-R 76849602560 0.97 24.19 PO 0 7.40 2.58 -1.32 1.5121 OEST VOLKSBANKEN 54799515648 0.41 14.16 AS 0 7.33 7.49 0.95 0.0922 BANCO SABADELL 52320395264 0.93 13.62 SP 0 7.96 1.94 1.32 0.3523 BANCO ESPIRITO-R 50221842432 0.53 11.67 PO 0 7.71 1.71 0.42 0.4624 BANKINTER 40786010112 0.52 13.58 SP 0 7.32 2.49 0.21 1.0225 MEDIOBANCA 38225199104 1.88 13.02 IT 0 15.69 2.14 0.27 1.0126 BANCO BPI SA-REG 30158706688 0.90 23.06 PO 0 7.30 2.45 1.33 0.7327 BANCA CARIGE 23066390528 0.60 6.39 IT 0 7.02 1.62 1.43 0.0228 POHJOLA BANK-A 22871900160 1.34 21.05 FI 1 9.60 1.35 0.79 0.7429 CREDITO EMILIANO 21129084928 1.23 21.18 IT 0 7.70 2.07 0.77 1.0630 BANCO PASTOR 19523018752 0.71 12.58 SP 0 7.74 2.56 2.00 0.5131 VAN LANSCHOT-CVA 17971611648 0.88 13.31 NE 1 9.40 1.61 1.14 0.2532 BANCA POP SONDRI 14261526528 0.71 7.98 IT 0 10.23 2.15 1.12 0.0933 BANCO SARDEG-RSP 13334559744 0.43 6.02 IT 0 9.28 0.88 1.17 0.6734 CREDITO VALTELLI 12981639168 0.45 7.91 IT 0 5.95 1.17 0.70 0.1335 OBERBANK AG 12251617280 0.59 10.87 AS 0 6.81 1.03 0.50 0.0636 CREDITO BERGAMAS 11968686080 1.12 13.35 IT 0 8.60 1.60 1.22 0.2937 OLDENBURG LANDES 8440799744 0.87 16.16 GE 1 7.30 2.46 -0.67 0.0438 BANIF-REG 8355603456 0.74 16.95 PO 0 6.89 1.75 2.67 0.5739 BANCO DESIO 6358876160 1.88 30.39 IT 0 9.50 1.78 2.02 0.5940 CREDITO ARTIGIAN 5828297216 0.50 7.38 IT 0 7.12 1.11 0.16 -0.0841 ALANDSBANKEN-A 2170388992 0.65 12.36 FI 1 7.02 2.35 0.44 0.5242 BANCA POP SPOLET 2033816832 0.71 9.61 IT 0 9.36 1.47 1.21 0.40
Year Short Name Tot Assets:2006C ROA:2006C ROE:2006C Country Country Dummy Tier 1 Capital Ratio:2006C P/B:2006C Alpha:20040101:20090101 Raw Beta:20040101:200901011 2006 DEUTSCHE BANK-RG 1584492969984 0.47 19.36 GE 1 8.50 1.55 -1.25 1.432 BNP PARIBAS 1440342999040 0.54 17.53 FR 0 7.40 1.61 -0.45 1.013 CREDIT AGRICOLE 1261296025600 0.42 16.44 FR 0 8.20 1.47 -0.88 1.224 SOC GENERALE 956841000960 0.58 20.04 FR 0 7.82 1.94 -0.47 1.595 BANCO SANTANDER 875584815104 0.90 17.95 SP 0 7.42 1.97 -0.69 1.236 UNICREDIT SPA 823284203520 0.68 14.79 IT 0 6.96 1.79 -0.58 1.407 COMMERZBANK 608278020096 0.31 11.91 GE 1 6.70 1.33 -1.06 1.668 INTESA SANPAOLO 576783974400 0.95 11.16 IT 0 8.80 1.34 0.40 1.119 DEXIA SA 566743007232 0.51 17.61 BE 1 9.80 1.44 -1.62 1.59
10 NATIXIS 458632986624 0.30 8.26 FR 0 10.50 1.49 -1.75 1.8511 BBVA 411915943936 1.18 25.00 SP 0 7.80 3.00 -0.66 1.1212 KBC GROEP 365343014912 0.96 20.24 BE 1 8.70 1.78 -0.29 1.3213 CIC 214312992768 0.62 18.82 FR 0 8.90 1.34 -0.22 0.5714 ERSTE GROUP BANK 181702737920 0.56 15.48 AS 0 6.60 2.30 -0.73 1.0315 BANK IRELAND 162212003840 0.85 26.02 IR 1 7.50 2.81 -1.89 1.4616 BANCA MONTE DEI 158555668480 0.58 12.10 IT 0 6.53 1.91 0.08 0.8617 ALLIED IRISH BK 158525997056 1.50 29.57 IR 1 8.20 2.55 -1.19 1.4218 LANDESBANK BERLI 141624999936 0.46 30.15 GE 1 7.20 3.14 0.94 0.7219 BANCO POPULAR 91650433024 1.21 19.44 SP 0 8.02 3.01 -0.83 0.7220 BANCO COM PORT-R 79258746880 0.94 20.62 PO 0 7.30 2.63 -0.76 1.3221 BANCO SABADELL 72779833344 1.45 23.69 SP 0 7.33 2.48 0.33 0.6422 OEST VOLKSBANKEN 67429318656 0.25 10.82 AS 0 7.71 8.41 -0.35 0.3423 BANCO ESPIRITO-R 59138805760 0.71 11.99 PO 0 7.00 1.63 -0.50 0.8724 MEDIOBANCA 46116552704 2.04 13.72 IT 0 14.14 1.85 0.29 0.9225 BANKINTER 46075768832 0.48 13.75 SP 0 6.86 2.96 0.09 0.8026 BANCO BPI SA-REG 35565486080 0.94 23.46 PO 0 7.40 3.05 -0.40 1.2527 BANCA CARIGE 25287094272 0.57 5.56 IT 0 8.43 1.84 0.04 0.7328 CREDITO EMILIANO 24250912768 1.02 17.54 IT 0 7.85 2.19 0.01 1.0729 POHJOLA BANK-A 24195999744 0.77 10.08 FI 1 8.20 1.41 0.71 0.7930 BANCO PASTOR 23782246400 0.72 13.44 SP 0 7.26 2.98 -0.14 0.4531 VAN LANSCHOT-CVA 18739275776 0.95 15.04 NE 1 10.00 2.23 0.60 0.4132 BANCA POP SONDRI 16042418176 0.81 9.21 IT 0 9.46 2.28 0.25 0.4333 CREDITO VALTELLI 14901452800 0.49 8.38 IT 0 6.27 1.26 0.30 0.4734 CREDITO BERGAMAS 13595166720 1.89 22.50 IT 0 9.65 1.60 0.98 0.6435 OBERBANK AG 13221821440 0.65 10.93 AS 0 7.08 1.13 0.98 0.1136 BANCO SARDEG-RSP 11905436672 0.48 5.98 IT 0 8.64 0.90 -0.13 1.1237 BANIF-REG 9151013888 0.89 18.21 PO 0 6.90 2.73 0.99 1.1738 OLDENBURG LANDES 9051200512 0.86 14.99 GE 1 7.00 2.29 -0.50 0.2739 BANCO DESIO 7473956864 1.00 14.25 IT 0 9.40 2.14 1.35 1.1140 CREDITO ARTIGIAN 6656538624 0.55 7.78 IT 0 6.82 1.19 -0.04 0.6441 BANCA POP SPOLET 2277279744 0.57 7.49 IT 0 9.37 1.60 0.09 0.7842 ALANDSBANKEN-A 2188615936 0.67 12.64 FI 1 7.10 2.48 0.74 0.52
Year Short Name Tot Assets:2007C ROA:2007C ROE:2007C Country Country Dummy Tier 1 Capital Ratio:2007C P/B:2007C Alpha:20040101:20090101 Raw Beta:20040101:200901011 2007 DEUTSCHE BANK-RG 2020349050880 0.36 18.55 GE 1 8.60 1.21 -1.25 1.432 BNP PARIBAS 1694453989376 0.50 16.98 FR 0 7.30 1.41 -0.45 1.013 CREDIT AGRICOLE 1414222970880 0.30 11.52 FR 0 8.10 1.01 -0.88 1.224 SOC GENERALE 1071761981440 0.09 3.36 FR 0 6.62 1.56 -0.47 1.595 UNICREDIT SPA 1021835476992 0.64 12.27 IT 0 6.55 1.31 -0.58 1.406 BANCO SANTANDER 976073850880 0.98 18.11 SP 0 7.71 1.68 -0.69 1.237 COMMERZBANK 616474017792 0.31 13.05 GE 1 7.00 1.14 -1.06 1.668 DEXIA SA 604564029440 0.43 16.15 BE 1 9.10 1.38 -1.62 1.599 INTESA SANPAOLO 572959031296 1.26 13.49 IT 0 6.50 1.30 0.40 1.11
10 NATIXIS 520006008832 0.23 6.41 FR 0 10.30 0.95 -1.75 1.8511 BBVA 501725986816 1.34 25.20 SP 0 7.30 2.31 -0.66 1.1212 KBC GROEP 355596992512 0.91 18.49 BE 1 8.70 1.88 -0.29 1.3213 CIC 250908999680 0.49 14.29 FR 0 8.20 1.05 -0.22 0.5714 ERSTE GROUP BANK 200518844416 0.62 14.30 AS 0 7.00 1.69 -0.73 1.0315 BANK IRELAND 188813000704 0.94 27.73 IR 1 8.20 2.30 -1.89 1.4616 ALLIED IRISH BK 177862000640 1.16 22.35 IR 1 7.50 1.54 -1.19 1.4217 BANCA MONTE DEI 162076393472 0.90 17.51 IT 0 8.88 1.28 0.08 0.8618 LANDESBANK BERLI 142163001344 0.15 8.51 GE 1 11.80 2.62 0.94 0.7219 BANCO POPULAR 107169349632 1.27 21.45 SP 0 7.92 2.28 -0.83 0.7220 BANCO COM PORT-R 88166162432 0.62 13.79 PO 0 5.50 2.92 -0.76 1.3221 OEST VOLKSBANKEN 78640832512 0.30 14.10 AS 0 7.20 8.79 -0.35 0.3422 BANCO SABADELL 76776005632 1.05 17.86 SP 0 7.22 1.97 0.33 0.6423 BANCO ESPIRITO-R 68354711552 0.90 13.02 PO 0 7.50 1.59 -0.50 0.8724 MEDIOBANCA 57839702016 1.83 13.12 IT 0 12.28 1.77 0.29 0.9225 BANKINTER 49648680960 0.76 21.73 SP 0 6.32 2.82 0.09 0.8026 BANCO BPI SA-REG 40545947648 0.93 23.02 PO 0 6.20 2.47 -0.40 1.2527 BANCA CARIGE 27463675904 0.78 7.42 IT 0 7.82 1.72 0.04 0.7328 CREDITO EMILIANO 26232528896 0.99 17.07 IT 0 8.05 1.73 0.01 1.0729 POHJOLA BANK-A 25922000896 0.84 11.36 FI 1 7.50 1.42 0.71 0.7930 BANCO PASTOR 25326456832 0.82 14.53 SP 0 7.18 1.86 -0.14 0.4531 VAN LANSCHOT-CVA 21718833152 1.01 16.97 NE 1 9.00 1.88 0.60 0.4132 BANCA POP SONDRI 18941786112 0.84 9.64 IT 0 10.41 1.88 0.25 0.4333 CREDITO VALTELLI 17228261376 0.53 6.98 IT 0 10.28 0.92 0.30 0.4734 CREDITO BERGAMAS 14755080192 1.50 17.05 IT 0 9.89 1.37 0.98 0.6435 OBERBANK AG 14330769408 0.74 11.92 AS 0 7.15 1.51 0.98 0.1136 BANCO SARDEG-RSP 12639723520 0.73 8.22 IT 0 8.41 0.75 -0.13 1.1237 BANIF-REG 10760960000 1.02 18.37 PO 0 7.70 1.63 0.99 1.1738 OLDENBURG LANDES 9783300096 0.80 14.29 GE 1 6.30 2.09 -0.50 0.2739 BANCO DESIO 8079121920 2.36 31.17 IT 0 9.94 1.40 1.35 1.1140 CREDITO ARTIGIAN 7152700416 0.61 9.21 IT 0 5.86 1.12 -0.04 0.6441 ALANDSBANKEN-A 2592037120 0.85 15.97 FI 1 8.60 3.21 0.74 0.5242 BANCA POP SPOLET 2540034304 0.44 6.33 IT 0 8.38 1.20 0.09 0.78
Year Short Name Tot Assets:2008C ROA:2008C ROE:2008C Country Country Dummy Tier 1 Capital Ratio:2008C P/B:2008C Alpha:20050101:20100101 Raw Beta:20050101:201001011 2008 DEUTSCHE BANK-RG 2202423001088 -0.18 -11.32 GE 1 10.10 0.52 -0.42 1.552 BNP PARIBAS 2075550941184 0.16 6.73 FR 0 7.80 0.64 0.36 1.223 CREDIT AGRICOLE 1653220048896 0.07 2.66 FR 0 8.60 0.46 -0.54 1.344 SOC GENERALE 1130003038208 0.18 7.03 FR 0 8.80 0.67 -0.19 1.815 BANCO SANTANDER 1056336117760 0.87 15.74 SP 0 9.10 0.96 -0.07 1.496 UNICREDIT SPA 1045611544576 0.39 7.12 IT 0 6.66 0.42 0.44 1.827 DEXIA SA 651005984768 -0.53 -35.85 BE 1 10.60 1.44 -0.90 1.868 INTESA SANPAOLO 636132982784 0.42 5.08 IT 0 7.10 0.66 0.50 1.11

Table 4.15: Clean Data. Eurozone. Size-sort.
9 COMMERZBANK 625196007424 0.00 0.02 GE 1 10.10 0.49 -1.17 2.0510 NATIXIS 555760025600 -0.52 -17.26 FR 0 8.20 0.23 -0.18 2.1711 BBVA 542650007552 0.96 19.04 SP 0 7.90 1.24 -0.53 1.4812 KBC GROEP 355316989952 -0.70 -15.74 BE 1 8.90 0.51 0.46 1.9713 CIC 251666006016 0.07 2.21 FR 0 9.00 0.53 -0.35 0.8714 BANCA MONTE DEI 213795979264 0.49 7.86 IT 0 9.32 0.69 -0.29 0.9215 ERSTE GROUP BANK 201441148928 0.43 10.40 AS 0 7.20 0.58 -0.24 1.3916 BANK IRELAND 197433999360 0.88 25.73 IR 1 8.10 1.43 2.84 2.4817 ALLIED IRISH BK 182174007296 0.43 8.67 IR 1 7.40 0.19 0.30 2.1518 LANDESBANK BERLI 145387995136 0.02 1.48 GE 1 11.00 1.50 0.98 0.9119 BANCO POPULAR 110376050688 0.97 16.18 SP 0 8.12 1.10 -1.24 1.0820 BANCO COM PORT-R 94423719936 0.17 3.55 PO 0 7.10 0.77 -1.15 1.4021 BANCO SABADELL 80378068992 0.86 14.95 SP 0 7.28 1.31 -0.39 0.8322 BANCO ESPIRITO-R 75186724864 0.51 8.61 PO 0 6.60 0.85 -0.57 0.9823 MEDIOBANCA 64468086784 1.66 13.97 IT 0 10.29 1.29 0.16 0.9924 OEST VOLKSBANKEN 55814909952 -0.23 -10.74 AS 0 7.56 5.82 -0.70 0.2925 BANKINTER 53469630464 0.49 13.60 SP 0 7.39 1.29 0.09 0.6626 BANCO BPI SA-REG 43025100800 0.36 9.59 PO 0 8.80 1.04 -0.49 1.3327 POHJOLA BANK-A 32448000000 0.30 5.02 FI 1 12.00 1.21 0.31 1.0728 BANCA CARIGE 31986444288 0.69 6.45 IT 0 7.92 0.86 -0.04 0.4429 CREDITO EMILIANO 30136094720 0.55 9.45 IT 0 9.62 0.70 0.41 1.2130 BANCO PASTOR 27121301504 0.63 11.04 SP 0 7.46 0.87 -0.44 0.8031 CREDITO VALTELLI 23579412480 0.49 6.11 IT 0 9.98 0.77 -0.24 0.3732 BANCA POP SONDRI 21819463680 0.21 2.68 IT 0 8.93 1.25 0.20 0.4933 VAN LANSCHOT-CVA 20691896320 0.09 1.49 NE 1 10.00 1.38 -0.16 0.3634 OBERBANK AG 15313988608 0.71 11.79 AS 0 8.27 1.34 0.83 0.0835 CREDITO BERGAMAS 14041613312 0.83 9.09 IT 0 16.54 1.12 0.77 0.4836 BANCO SARDEG-RSP 12967676928 0.51 5.65 IT 0 8.22 0.35 0.15 0.8037 BANIF-REG 12876616704 0.50 9.89 PO 0 7.85 0.65 0.95 1.2138 OLDENBURG LANDES 9987800064 0.22 4.12 GE 1 9.90 2.22 -0.48 0.2039 CREDITO ARTIGIAN 8548529152 0.62 7.81 IT 0 10.69 0.72 -0.33 0.3540 BANCO DESIO 7521231872 0.81 9.27 IT 0 9.81 0.86 0.29 0.6641 ALANDSBANKEN-A 2769731072 0.52 10.39 FI 1 8.60 2.24 1.00 0.3942 BANCA POP SPOLET 2742088960 0.40 6.34 IT 0 7.35 0.66 -0.14 0.64
Year Short Name Tot Assets:2009C ROA:2009C ROE:2009C Country Country Dummy Tier 1 Capital Ratio:2009C P/B:2009C Alpha:20050101:20100101 Raw Beta:20050101:201001011 2009 BNP PARIBAS 2057698017280 0.27 10.57 FR 0 10.10 1.08 0.36 1.222 CREDIT AGRICOLE 1557342060544 0.07 2.75 FR 0 9.50 0.67 -0.54 1.343 DEUTSCHE BANK-RG 1500664037376 0.27 14.77 GE 1 12.60 0.84 -0.42 1.554 BANCO SANTANDER 1117573349376 0.82 14.17 SP 0 10.10 1.38 -0.07 1.495 SOC GENERALE 1023701024768 0.06 2.06 FR 0 10.70 0.99 -0.19 1.816 UNICREDIT SPA 928759676928 0.17 2.97 IT 0 8.63 0.66 0.44 1.827 COMMERZBANK 844103024640 -0.62 -48.64 GE 1 10.50 0.79 -1.17 2.058 INTESA SANPAOLO 624844013568 0.45 5.52 IT 0 8.40 0.76 0.50 1.119 DEXIA SA 577629978624 0.16 14.33 BE 1 12.30 0.77 -0.90 1.86
10 BBVA 535065001984 0.78 15.32 SP 0 9.40 1.62 -0.53 1.4811 NATIXIS 449217986560 -0.34 -9.36 FR 0 9.70 0.49 -0.18 2.1712 KBC GROEP 324231004160 -0.73 -20.66 BE 1 10.80 1.07 0.46 1.9713 CIC 235597004800 0.33 10.31 FR 0 10.20 0.52 -0.35 0.8714 BANCA MONTE DEI 224814972928 0.10 1.38 IT 0 7.52 0.48 -0.29 0.9215 ERSTE GROUP BANK 201710174208 0.45 8.69 AS 0 10.80 0.73 -0.24 1.3916 BANK IRELAND 194115993600 0.04 1.04 IR 1 12.00 0.08 2.84 2.4817 ALLIED IRISH BK 174313996288 -1.35 -25.68 IR 1 7.20 0.11 0.30 2.1518 LANDESBANK BERLI 143835004928 0.18 11.54 GE 1 8.50 1.31 0.98 0.9119 BANCO POPULAR 129290149888 0.64 10.99 SP 0 9.13 0.94 -1.24 1.0820 BANCO COM PORT-R 95550406656 0.24 4.16 PO 0 9.30 0.68 -1.15 1.4021 BANCO SABADELL 82822889472 0.64 10.77 SP 0 9.10 0.86 -0.39 0.8322 BANCO ESPIRITO-R 82297200640 0.62 9.82 PO 0 8.30 0.88 -0.57 0.9823 MEDIOBANCA 73890480128 0.00 0.04 IT 0 10.30 1.22 0.16 0.9924 BANKINTER 54467465216 0.43 10.08 SP 0 7.37 1.31 0.09 0.6625 OEST VOLKSBANKEN 49145593856 -2.07 -90.03 AS 0 10.00 4.63 -0.70 0.2926 BANCO BPI SA-REG 47449178112 0.39 10.47 PO 0 8.60 1.03 -0.49 1.3327 BANCA CARIGE 36299374592 0.60 5.59 IT 0 7.87 0.88 -0.04 0.4428 POHJOLA BANK-A 35510001664 0.57 9.93 FI 1 11.80 1.06 0.31 1.0729 BANCO PASTOR 32325234688 0.34 6.92 SP 0 10.55 0.88 -0.44 0.8030 CREDITO EMILIANO 26439041024 0.31 4.93 IT 0 11.09 0.97 0.41 1.2131 CREDITO VALTELLI 24895770624 0.31 4.19 IT 0 9.27 0.61 -0.24 0.3732 BANCA POP SONDRI 23454554112 0.89 11.85 IT 0 9.60 1.21 0.20 0.4933 VAN LANSCHOT-CVA 21264838656 -0.12 -2.12 NE 1 9.50 1.05 -0.16 0.3634 OBERBANK AG 16031440896 0.49 8.02 AS 0 9.58 1.19 0.83 0.0835 CREDITO BERGAMAS 14534722560 0.60 6.48 IT 0 15.89 1.09 0.77 0.4836 BANIF-REG 14442205184 0.40 7.09 PO 0 8.93 0.65 0.95 1.2137 BANCO SARDEG-RSP 13579846656 0.41 4.58 IT 0 10.25 0.45 0.15 0.8038 OLDENBURG LANDES 12248900608 0.30 6.21 GE 1 8.00 1.92 -0.48 0.2039 CREDITO ARTIGIAN 9140595712 0.27 3.11 IT 0 9.06 0.69 -0.33 0.3540 BANCO DESIO 8308780032 0.68 7.36 IT 0 10.40 0.72 0.29 0.6641 ALANDSBANKEN-A 3379308032 0.85 17.55 FI 1 7.90 2.43 1.00 0.3942 BANCA POP SPOLET 2851597824 0.29 4.22 IT 0 9.79 0.68 -0.14 0.64
Year Short Name Tot Assets:2010C ROA:2010C ROE:2010C Country Country Dummy Tier 1 Capital Ratio:2010C P/B:2010C Alpha:20050101:20100101 Raw Beta:20050101:201001011 2010 BNP PARIBAS 1998158036992 0.37 11.76 FR 0 11.40 0.86 0.36 1.222 DEUTSCHE BANK-RG 1905629986816 0.14 5.40 GE 1 12.30 0.74 -0.42 1.553 CREDIT AGRICOLE 1593528942592 0.08 2.95 FR 0 10.60 0.53 -0.54 1.344 BANCO SANTANDER 1217500676096 0.70 11.39 SP 0 10.00 0.88 -0.07 1.495 SOC GENERALE 1132072009728 0.36 10.37 FR 0 10.60 0.73 -0.19 1.816 UNICREDIT SPA 929487585280 0.14 2.14 IT 0 9.46 0.47 0.44 1.827 COMMERZBANK 754298978304 0.18 14.65 GE 1 11.90 0.61 -1.17 2.058 INTESA SANPAOLO 658756993024 0.42 5.09 IT 0 9.40 0.49 0.50 1.119 DEXIA SA 566735011840 0.13 7.56 BE 1 13.10 0.54 -0.90 1.86
10 BBVA 552738029568 0.85 14.13 SP 0 10.50 0.93 -0.53 1.4811 NATIXIS 458008985600 0.30 7.27 FR 0 11.40 0.63 -0.18 2.1712 KBC GROEP 320823001088 0.39 12.16 BE 1 12.60 0.78 0.46 1.9713 BANCA MONTE DEI 244278935552 0.42 5.74 IT 0 8.37 0.33 -0.29 0.9214 CIC 242035998720 0.47 12.27 FR 0 10.83 0.53 -0.35 0.8715 ERSTE GROUP BANK 205938016256 0.50 7.72 AS 0 11.80 0.94 -0.24 1.3916 BANK IRELAND 167473004544 -0.34 -8.65 IR 1 9.70 0.27 2.84 2.4817 ALLIED IRISH BK 145221992448 -6.40 -148.94 IR 1 4.30 0.16 0.30 2.1518 LANDESBANK BERLI 131476996096 0.19 10.11 GE 1 15.24 1.62 0.98 0.9119 BANCO POPULAR 130139848704 0.46 7.67 SP 0 9.63 0.63 -1.24 1.0820 BANCO COM PORT-R 100009738240 0.21 3.46 PO 0 9.20 0.48 -1.15 1.4021 BANCO SABADELL 97099210752 0.42 6.96 SP 0 9.36 0.66 -0.39 0.8322 BANCO ESPIRITO-R 83655426048 0.58 7.70 PO 0 8.80 0.53 -0.57 0.9823 MEDIOBANCA 76501180416 0.53 6.44 IT 0 11.09 0.77 0.16 0.9924 BANKINTER 54151979008 0.28 5.84 SP 0 7.31 0.76 0.09 0.6625 OEST VOLKSBANKEN 46464843776 0.12 4.68 AS 0 10.30 4.50 -0.70 0.2926 BANCO BPI SA-REG 45659811840 0.40 11.22 PO 0 9.10 0.86 -0.49 1.3327 BANCA CARIGE 40009957376 0.47 4.72 IT 0 6.70 0.76 -0.04 0.4428 POHJOLA BANK-A 36183998464 0.64 9.86 FI 1 12.50 1.21 0.31 1.0729 BANCO PASTOR 31134697472 0.20 4.32 SP 0 10.63 0.69 -0.44 0.8030 CREDITO EMILIANO 29998233600 0.28 4.27 IT 0 11.28 0.85 0.41 1.2131 CREDITO VALTELLI 26760794112 0.27 3.53 IT 0 9.52 0.39 -0.24 0.3732 BANCA POP SONDRI 26282383360 0.54 7.41 IT 0 8.07 1.02 0.20 0.4933 VAN LANSCHOT-CVA 20325117952 0.27 4.19 NE 1 11.90 0.84 -0.16 0.3634 OBERBANK AG 16768363520 0.60 8.97 AS 0 10.50 1.12 0.83 0.0835 BANIF-REG 15710692352 0.22 3.38 PO 0 10.76 0.48 0.95 1.2136 CREDITO BERGAMAS 15488814080 0.65 7.29 IT 0 13.75 0.93 0.77 0.4837 BANCO SARDEG-RSP 13929971712 0.09 1.03 IT 0 9.99 0.42 0.15 0.8038 OLDENBURG LANDES 13351000064 0.41 9.04 GE 1 7.80 1.48 -0.48 0.2039 CREDITO ARTIGIAN 8829604864 0.27 3.24 IT 0 8.66 0.48 -0.33 0.3540 BANCO DESIO 8163010048 0.64 6.83 IT 0 11.10 0.68 0.29 0.6641 ALANDSBANKEN-A 3475429888 -0.07 -1.44 FI 1 7.30 2.20 1.00 0.3942 BANCA POP SPOLET 3029300224 0.31 4.28 IT 0 9.44 0.47 -0.14 0.64

Table 4.16: Clean Data. Eurozone. Capital-sort.
Number Year Short Name Tot Assets:2002C ROA:2002C ROE:2002C Country Tier 1 Capital Ratio:2002C P/B:2002C Alpha:20020101:20050101 Raw Beta:20020101:200701011 2002 MEDIOBANCA 30'503'999'488 0.866 5.843 IT 16.540 1.596 0.063 1.0062 BANCO SARDEG-RSP 11'536'480'256 0.522 7.551 IT 12.790 0.421 1.686 0.6733 BANCO DESIO 3'715'785'984 0.399 7.257 IT 9.890 1.580 2.478 0.5894 CREDITO BERGAMAS 10'444'983'296 0.850 11.738 IT 9.670 1.156 0.941 0.2935 BANCA POP SONDRI 10'187'244'544 0.521 6.426 IT 9.650 1.861 0.727 0.0926 DEUTSCHE BANK-RG 758'355'001'344 0.047 1.131 GE 9.600 0.910 0.306 0.9017 OEST VOLKSBANKEN 18'886'699'008 0.244 5.986 AS 9.470 9.127 0.913 0.0948 DEXIA SA 350'692'016'128 0.370 15.109 BE 9.300 1.551 0.188 1.5399 BANCO POPULAR 42'005'123'072 1.596 22.964 SP 8.880 2.897 0.727 0.421
10 KBC GROEP 221'730'504'704 0.460 12.957 BE 8.830 1.070 1.081 0.85211 CREDIT AGRICOLE 505'718'013'952 0.213 6.994 FR 8.800 0.901 1.273 0.93312 BBVA 279'444'520'960 0.490 8.051 SP 8.400 1.626 -0.317 1.39913 VAN LANSCHOT-CVA 11'288'860'672 0.855 16.513 NE 8.400 1.998 0.800 0.24814 ALANDSBANKEN-A 1'812'635'008 0.555 11.094 FI 8.340 1.968 0.548 0.52315 BANCO PASTOR 8'869'684'224 0.888 13.310 SP 8.200 1.498 1.431 0.51416 BANCO SABADELL 27'211'225'088 0.820 9.145 SP 8.160 1.236 0.681 0.35017 SOC GENERALE 501'265'006'592 0.250 8.042 FR 8.140 1.445 1.284 1.18118 BNP PARIBAS 710'304'989'184 0.429 12.913 FR 8.100 1.274 0.938 1.12519 BANCA POP SPOLET 1'593'699'968 0.442 6.948 IT 8.070 1.002 0.570 0.40220 BANKINTER 22'638'188'544 0.501 12.614 SP 8.040 1.955 0.387 1.02321 BANCO SANTANDER 324'208'099'328 0.659 9.786 SP 8.010 1.303 -0.184 1.48222 CREDITO ARTIGIAN 4'340'764'160 0.357 5.814 IT 7.810 1.518 -0.321 -0.08023 BANK IRELAND 87'297'998'848 1.077 22.445 IR 7.600 3.001 0.356 0.87724 BANCO BPI SA-REG 25'666'099'200 0.555 13.517 PO 7.400 1.418 0.994 0.73425 COMMERZBANK 422'133'989'376 -0.065 -2.898 GE 7.300 0.459 1.532 1.56426 CREDITO EMILIANO 19'087'259'648 0.614 13.431 IT 7.230 1.692 0.996 1.05927 UNICREDIT SPA 213'349'302'272 0.854 16.684 IT 7.210 1.979 -0.028 0.74028 NATIXIS 133'327'003'648 0.089 2.956 FR 7.200 1.003 0.415 0.74629 BANCA CARIGE 15'363'319'808 0.452 4.953 IT 7.130 1.531 1.370 0.01830 BANIF-REG 6'066'775'040 0.354 7.260 PO 7.050 0.619 0.390 0.56731 BANCO ESPIRITO-R 41'233'821'696 0.558 13.068 PO 7.010 1.874 0.439 0.46232 POHJOLA BANK-A 12'709'000'192 0.491 9.976 FI 7.000 1.070 0.995 0.73933 OLDENBURG LANDES 8'220'900'352 0.410 8.757 GE 7.000 3.902 -0.457 0.03934 ALLIED IRISH BK 85'820'997'632 1.181 22.833 IR 6.900 2.761 0.325 0.79935 OBERBANK AG 9'689'099'264 0.375 7.742 AS 6.830 1.197 -0.020 0.05736 INTESA SANPAOLO 279'752'015'872 0.067 1.488 IT 6.760 0.998 1.301 1.59337 BANCO COM PORT-R 61'851'574'272 0.437 12.491 PO 6.600 2.424 -1.687 1.51338 ERSTE GROUP BANK 121'222'299'648 0.246 11.640 AS 6.300 1.433 0.497 0.87339 CIC 162'785'001'472 0.244 10.174 FR 6.290 1.085 1.233 0.22040 CREDITO VALTELLI 9'430'503'424 0.161 3.890 IT 6.150 1.204 0.384 0.13441 BANCA MONTE DEI 128'872'603'648 0.473 11.140 IT 6.050 1.136 0.166 1.20242 LANDESBANK BERLI 173'669'089'280 -0.383 -16.990 GE 5.600 0.531 0.096 0.344
Year Short Name Tot Assets:2003C ROA:2003C ROE:2003C Country Tier 1 Capital Ratio:2003C P/B:2003C Alpha:20020101:20070101 Raw Beta:20020101:200701011 2003 MEDIOBANCA 32'887'898'112 0.169 1.185 IT 16.720 1.506 0.274 1.0062 DEUTSCHE BANK-RG 803'614'031'872 0.175 4.691 GE 10.000 1.356 0.387 0.9013 DEXIA SA 349'462'986'752 0.409 15.705 BE 9.900 1.667 -0.566 1.5394 BANCO SARDEG-RSP 12'486'980'608 0.289 4.248 IT 9.830 0.805 1.173 0.6735 KBC GROEP 225'586'790'400 0.500 12.733 BE 9.540 1.234 0.928 0.8526 BNP PARIBAS 782'996'013'056 0.504 13.758 FR 9.400 1.514 0.620 1.1257 ALANDSBANKEN-A 1'851'476'992 0.579 11.250 FI 9.270 2.022 0.444 0.5238 OEST VOLKSBANKEN 21'561'600'000 0.279 6.927 AS 8.910 8.780 0.946 0.0949 BANCA POP SONDRI 10'937'561'088 0.605 7.948 IT 8.820 2.036 1.123 0.092
10 VAN LANSCHOT-CVA 11'578'370'048 0.903 16.260 NE 8.700 1.747 1.139 0.24811 SOC GENERALE 539'224'014'848 0.456 14.620 FR 8.660 1.724 0.968 1.18112 BBVA 287'083'757'568 0.786 12.448 SP 8.500 1.949 -0.640 1.39913 CREDITO BERGAMAS 11'056'892'928 0.888 12.747 IT 8.440 1.405 1.218 0.29314 BANCO POPULAR 52'611'149'824 1.510 21.382 SP 8.360 2.861 0.710 0.42115 BANCO SANTANDER 351'780'405'248 0.772 10.658 SP 8.260 1.786 -0.458 1.48216 BANCA CARIGE 15'918'249'984 0.542 5.784 IT 8.140 1.955 1.425 0.01817 NATIXIS 135'782'998'016 0.197 7.091 FR 8.100 1.090 1.178 0.74618 BANKINTER 23'917'830'144 0.572 13.946 SP 8.010 2.416 0.212 1.02319 BANK IRELAND 89'302'999'040 0.935 20.164 IR 8.000 2.403 0.214 0.87720 BANCO DESIO 4'283'709'952 0.503 9.854 IT 7.990 2.110 2.019 0.58921 CREDIT AGRICOLE 785'731'026'944 0.159 5.296 FR 7.900 1.184 0.836 0.93322 INTESA SANPAOLO 260'214'996'992 0.450 8.736 IT 7.840 1.352 0.870 1.59323 BANCO ESPIRITO-R 43'283'349'504 0.592 12.212 PO 7.760 1.861 0.420 0.46224 CREDITO ARTIGIAN 4'941'704'192 0.333 5.386 IT 7.640 1.301 0.163 -0.08025 BANCO SABADELL 30'506'350'592 0.814 10.049 SP 7.570 1.435 1.323 0.35026 COMMERZBANK 381'584'998'400 -0.577 -25.923 GE 7.300 1.023 1.035 1.56427 OLDENBURG LANDES 8'343'799'808 0.444 9.098 GE 7.200 3.776 -0.671 0.03928 ALLIED IRISH BK 80'959'995'904 0.812 14.843 IR 7.100 2.176 0.298 0.79929 BANCO COM PORT-R 67'687'985'152 0.676 17.378 PO 7.100 2.023 -1.319 1.51330 OBERBANK AG 10'493'100'032 0.380 7.867 AS 7.080 1.208 0.496 0.05731 POHJOLA BANK-A 14'753'999'872 0.918 18.489 FI 7.000 1.190 0.790 0.73932 UNICREDIT SPA 238'255'587'328 0.868 15.683 IT 6.960 2.099 0.396 0.74033 BANCA POP SPOLET 1'714'104'960 0.245 3.610 IT 6.960 1.054 1.214 0.40234 BANIF-REG 5'711'558'144 0.431 7.806 PO 6.820 0.731 2.673 0.56735 CIC 155'838'005'248 0.290 11.402 FR 6.800 1.131 1.460 0.22036 BANCO BPI SA-REG 26'165'600'256 0.632 13.861 PO 6.800 1.828 1.328 0.73437 CREDITO EMILIANO 20'382'799'872 0.486 11.051 IT 6.600 1.768 0.765 1.05938 BANCO PASTOR 10'411'809'792 0.640 9.495 SP 6.540 2.015 2.000 0.51439 BANCA MONTE DEI 122'973'200'384 0.351 7.883 IT 6.500 1.245 0.593 1.20240 ERSTE GROUP BANK 128'575'299'584 0.283 13.403 AS 6.300 1.976 0.394 0.87341 LANDESBANK BERLI 152'047'403'008 -0.260 -11.730 GE 6.100 0.568 2.414 0.34442 CREDITO VALTELLI 10'239'960'064 0.161 4.070 IT 5.790 1.290 0.704 0.134
Year Short Name Tot Assets:2004C ROA:2004C ROE:2004C Country Tier 1 Capital Ratio:2004C P/B:2004C Alpha:20020101:20070101 Raw Beta:20020101:200701011 2004 MEDIOBANCA 37'779'521'536 1.518 11.074 IT 16.97 1.498 0.274 1.0062 BANCA POP SONDRI 12'610'888'704 0.703 8.451 IT 10.92 1.844 1.123 0.0923 OEST VOLKSBANKEN 23'771'035'648 0.389 10.081 AS 10.57 8.365 0.946 0.0944 KBC GROEP 285'162'995'712 0.632 15.04 BE 10.07 1.635 0.928 0.8525 DEXIA SA 388'787'011'584 0.494 16.515 BE 10 1.473 -0.566 1.5396 BANCO SARDEG-RSP 11'817'326'592 0.306 4.48 IT 9.77 0.844 1.173 0.6737 VAN LANSCHOT-CVA 16'577'778'688 0.716 11.871 NE 9.2 1.524 1.139 0.2488 CREDITO BERGAMAS 10'586'728'448 1.056 13.764 IT 9.06 1.32 1.218 0.2939 BANCO SABADELL 45'709'234'176 0.979 13.388 SP 8.72 1.664 1.323 0.35
10 BANKINTER 31'270'199'296 0.628 14.91 SP 8.63 2.258 0.212 1.02311 DEUTSCHE BANK-RG 840'067'973'120 0.301 9.138 GE 8.6 1.304 0.387 0.90112 NATIXIS 140'033'998'848 0.354 11.651 FR 8.3 1.024 1.178 0.74613 ALLIED IRISH BK 101'108'998'144 1.236 21.054 IR 8.2 2.323 0.298 0.79914 BANCO COM PORT-R 71'320'363'008 0.85 21.23 PO 8.1 2.267 -1.319 1.51315 BANCO DESIO 4'657'143'296 0.704 14.521 IT 8.04 3.219 2.019 0.58916 CREDIT AGRICOLE 817'402'019'840 0.34 10.997 FR 8 1.223 0.836 0.93317 UNICREDIT SPA 265'406'218'240 0.822 15.456 IT 7.94 1.923 0.396 0.7418 BANCO POPULAR 63'576'084'480 1.121 17.309 SP 7.94 2.922 0.71 0.42119 BANIF-REG 7'272'748'032 0.414 8.325 PO 7.92 0.879 2.673 0.56720 BBVA 329'441'148'928 0.948 18.866 SP 7.9 3.383 -0.64 1.39921 CREDITO ARTIGIAN 5'301'101'056 0.357 5.808 IT 7.87 1.257 0.163 -0.0822 ALANDSBANKEN-A 1'995'326'080 0.546 10.095 FI 7.79 2.009 0.444 0.52323 SOC GENERALE 601'354'993'664 0.55 17.855 FR 7.69 1.64 0.968 1.18124 CREDITO EMILIANO 19'582'595'072 0.721 14.556 IT 7.6 1.846 0.765 1.05925 POHJOLA BANK-A 16'879'900'672 0.677 14.2 FI 7.6 1.318 0.79 0.73926 BNP PARIBAS 1'002'503'012'352 0.553 16.313 FR 7.5 1.374 0.62 1.12527 COMMERZBANK 424'876'998'656 0.09 3.842 GE 7.5 0.924 1.035 1.56428 LANDESBANK BERLI 130'302'001'152 0.065 3.419 GE 7.5 1.017 2.414 0.34429 BANCA CARIGE 20'786'315'264 0.606 6.476 IT 7.38 1.784 1.425 0.01830 CIC 172'653'002'752 0.335 11.374 FR 7.2 1.148 1.46 0.2231 BANK IRELAND 106'430'996'480 0.955 22.527 IR 7.2 2.24 0.214 0.87732 BANCO SANTANDER 664'486'281'216 0.71 12.128 SP 7.16 1.655 -0.458 1.48233 OLDENBURG LANDES 8'352'700'416 0.356 7.193 GE 7 3.592 -0.671 0.03934 BANCO PASTOR 15'844'462'592 0.449 7.343 SP 6.92 1.679 2 0.51435 OBERBANK AG 11'293'391'872 0.383 7.704 AS 6.82 1.147 0.496 0.05736 BANCA POP SPOLET 1'855'004'032 0.446 6.591 IT 6.79 1.001 1.214 0.40237 INTESA SANPAOLO 276'134'985'728 0.692 12.13 IT 6.7 1.55 0.87 1.59338 ERSTE GROUP BANK 139'811'913'728 0.388 16.763 AS 6.7 2.595 0.394 0.87339 BANCO BPI SA-REG 25'755'760'640 0.614 14.539 PO 6.5 2.279 1.328 0.73440 BANCO ESPIRITO-R 43'051'798'528 0.351 7.57 PO 6.41 2.033 0.42 0.46241 BANCA MONTE DEI 142'757'527'552 0.451 9 IT 6.24 0.89 0.593 1.20242 CREDITO VALTELLI 11'595'014'144 0.458 9.568 IT 6.17 0.946 0.704 0.134
Year Short Name Tot Assets:2005C ROA:2005C ROE:2005C Country Tier 1 Capital Ratio:2005C P/B:2005C Alpha:20020101:20070101 Raw Beta:20020101:200701011 2005 MEDIOBANCA 38'225'199'104 1.879 13.022 IT 15.69 2.14 0.274 1.006

Table 4.16: Clean Data. Eurozone. Capital-sort.
2 DEXIA SA 508'761'014'272 0.454 14.976 BE 10.3 1.459 -0.566 1.5393 BANCA POP SONDRI 14'261'526'528 0.711 7.981 IT 10.23 2.149 1.123 0.0924 POHJOLA BANK-A 22'871'900'160 1.343 21.049 FI 9.6 1.354 0.79 0.7395 BANCO DESIO 6'358'876'160 1.883 30.39 IT 9.5 1.775 2.019 0.5896 KBC GROEP 351'616'008'192 0.706 16.019 BE 9.4 1.785 0.928 0.8527 VAN LANSCHOT-CVA 17'971'611'648 0.882 13.312 NE 9.4 1.61 1.139 0.2488 BANCA POP SPOLET 2'033'816'832 0.709 9.606 IT 9.36 1.465 1.214 0.4029 BANCO SARDEG-RSP 13'334'559'744 0.432 6.019 IT 9.28 0.877 1.173 0.673
10 DEUTSCHE BANK-RG 992'160'972'800 0.385 12.64 GE 8.7 1.383 0.387 0.90111 CREDITO BERGAMAS 11'968'686'080 1.118 13.347 IT 8.6 1.601 1.218 0.29312 NATIXIS 168'118'992'896 0.451 13.974 FR 8.3 1.243 1.178 0.74613 CREDIT AGRICOLE 1'061'443'010'560 0.414 14.447 FR 8.2 1.416 0.836 0.93314 COMMERZBANK 444'860'989'440 0.268 10.375 GE 8.1 1.343 1.035 1.56415 LANDESBANK BERLI 144'403'005'440 0.199 14.387 GE 8.1 1.558 2.414 0.34416 BANCO POPULAR 77'697'744'896 1.243 20.014 SP 8.09 2.502 0.71 0.42117 BANCO SABADELL 52'320'395'264 0.925 13.621 SP 7.96 1.943 1.323 0.3518 BANK IRELAND 127'780'003'840 0.901 24.696 IR 7.9 2.683 0.214 0.87719 BANCO SANTANDER 818'236'555'264 0.839 16.767 SP 7.88 1.752 -0.458 1.48220 BANCO PASTOR 19'523'018'752 0.705 12.578 SP 7.74 2.557 2 0.51421 BANCO ESPIRITO-R 50'221'842'432 0.53 11.667 PO 7.71 1.711 0.42 0.46222 CREDITO EMILIANO 21'129'084'928 1.226 21.178 IT 7.7 2.074 0.765 1.05923 BNP PARIBAS 1'258'078'994'432 0.518 16.577 FR 7.6 1.48 0.62 1.12524 SOC GENERALE 835'134'029'824 0.613 21.231 FR 7.57 1.837 0.968 1.18125 BBVA 392'389'492'736 1.055 25.896 SP 7.5 3.124 -0.64 1.39926 BANCO COM PORT-R 76'849'602'560 0.973 24.187 PO 7.4 2.575 -1.319 1.51327 OEST VOLKSBANKEN 54'799'515'648 0.408 14.161 AS 7.33 7.492 0.946 0.09428 BANKINTER 40'786'010'112 0.521 13.582 SP 7.32 2.493 0.212 1.02329 BANCO BPI SA-REG 30'158'706'688 0.897 23.063 PO 7.3 2.446 1.328 0.73430 OLDENBURG LANDES 8'440'799'744 0.866 16.159 GE 7.3 2.456 -0.671 0.03931 ALLIED IRISH BK 133'214'003'200 1.146 21.632 IR 7.2 2.367 0.298 0.79932 CREDITO ARTIGIAN 5'828'297'216 0.503 7.375 IT 7.12 1.108 0.163 -0.0833 INTESA SANPAOLO 273'534'992'384 1.101 18.708 IT 7.1 1.853 0.87 1.59334 BANCA CARIGE 23'066'390'528 0.599 6.39 IT 7.02 1.618 1.425 0.01835 ALANDSBANKEN-A 2'170'388'992 0.652 12.361 FI 7.02 2.345 0.444 0.52336 CIC 195'835'002'880 0.314 10.037 FR 6.9 0.904 1.46 0.2237 UNICREDIT SPA 787'000'197'120 0.469 10.063 IT 6.89 1.717 0.396 0.7438 BANIF-REG 8'355'603'456 0.742 16.947 PO 6.89 1.752 2.673 0.56739 OBERBANK AG 12'251'617'280 0.588 10.873 AS 6.81 1.026 0.496 0.05740 ERSTE GROUP BANK 152'680'759'296 0.49 19.142 AS 6.8 2.815 0.394 0.87341 BANCA MONTE DEI 153'749'094'400 0.533 10.885 IT 6.51 1.321 0.593 1.20242 CREDITO VALTELLI 12'981'639'168 0.452 7.905 IT 5.95 1.165 0.704 0.134
Year Short Name Tot Assets:2006C ROA:2006C ROE:2006C Country Tier 1 Capital Ratio:2006C P/B:2006C Alpha:20040101:20090101 Raw Beta:20040101:200901011 2006 MEDIOBANCA 46'116'552'704 2.036 13.722 IT 14.14 1.851 0.294 0.9212 NATIXIS 458'632'986'624 0.301 8.26 FR 10.5 1.485 -1.749 1.8473 VAN LANSCHOT-CVA 18'739'275'776 0.952 15.038 NE 10 2.234 0.603 0.4134 DEXIA SA 566'743'007'232 0.511 17.605 BE 9.8 1.443 -1.624 1.5935 CREDITO BERGAMAS 13'595'166'720 1.891 22.502 IT 9.65 1.603 0.98 0.6446 BANCA POP SONDRI 16'042'418'176 0.807 9.213 IT 9.46 2.283 0.254 0.4317 BANCO DESIO 7'473'956'864 1.003 14.254 IT 9.4 2.144 1.347 1.118 BANCA POP SPOLET 2'277'279'744 0.573 7.486 IT 9.37 1.601 0.094 0.7819 CIC 214'312'992'768 0.621 18.817 FR 8.9 1.344 -0.223 0.569
10 INTESA SANPAOLO 576'783'974'400 0.954 11.162 IT 8.8 1.336 0.402 1.10611 KBC GROEP 365'343'014'912 0.957 20.237 BE 8.7 1.778 -0.286 1.32312 BANCO SARDEG-RSP 11'905'436'672 0.475 5.982 IT 8.64 0.898 -0.132 1.12113 DEUTSCHE BANK-RG 1'584'492'969'984 0.471 19.364 GE 8.5 1.548 -1.245 1.43214 BANCA CARIGE 25'287'094'272 0.57 5.56 IT 8.43 1.839 0.038 0.73215 CREDIT AGRICOLE 1'261'296'025'600 0.424 16.437 FR 8.2 1.466 -0.875 1.22316 ALLIED IRISH BK 158'525'997'056 1.498 29.567 IR 8.2 2.548 -1.186 1.4217 POHJOLA BANK-A 24'195'999'744 0.769 10.084 FI 8.2 1.413 0.705 0.79118 BANCO POPULAR 91'650'433'024 1.212 19.436 SP 8.02 3.005 -0.827 0.72319 CREDITO EMILIANO 24'250'912'768 1.023 17.539 IT 7.85 2.19 0.008 1.07120 SOC GENERALE 956'841'000'960 0.583 20.043 FR 7.82 1.941 -0.469 1.59221 BBVA 411'915'943'936 1.178 25.004 SP 7.8 2.999 -0.656 1.12322 OEST VOLKSBANKEN 67'429'318'656 0.254 10.824 AS 7.71 8.413 -0.352 0.33923 BANK IRELAND 162'212'003'840 0.848 26.015 IR 7.5 2.806 -1.886 1.46124 BANCO SANTANDER 875'584'815'104 0.897 17.951 SP 7.42 1.969 -0.69 1.23225 BNP PARIBAS 1'440'342'999'040 0.542 17.534 FR 7.4 1.612 -0.447 1.0126 BANCO BPI SA-REG 35'565'486'080 0.94 23.462 PO 7.4 3.046 -0.396 1.25327 BANCO SABADELL 72'779'833'344 1.452 23.691 SP 7.33 2.483 0.327 0.63828 BANCO COM PORT-R 79'258'746'880 0.937 20.622 PO 7.3 2.632 -0.764 1.32129 BANCO PASTOR 23'782'246'400 0.721 13.439 SP 7.26 2.984 -0.143 0.45430 LANDESBANK BERLI 141'624'999'936 0.463 30.146 GE 7.2 3.144 0.937 0.7231 ALANDSBANKEN-A 2'188'615'936 0.674 12.638 FI 7.1 2.477 0.735 0.52232 OBERBANK AG 13'221'821'440 0.653 10.925 AS 7.08 1.133 0.983 0.10933 BANCO ESPIRITO-R 59'138'805'760 0.708 11.989 PO 7 1.628 -0.497 0.86734 OLDENBURG LANDES 9'051'200'512 0.856 14.992 GE 7 2.286 -0.503 0.27435 UNICREDIT SPA 823'284'203'520 0.677 14.789 IT 6.96 1.787 -0.576 1.39836 BANIF-REG 9'151'013'888 0.892 18.208 PO 6.9 2.728 0.993 1.17237 BANKINTER 46'075'768'832 0.48 13.751 SP 6.86 2.955 0.09 0.79938 CREDITO ARTIGIAN 6'656'538'624 0.547 7.784 IT 6.82 1.188 -0.038 0.6439 COMMERZBANK 608'278'020'096 0.305 11.909 GE 6.7 1.327 -1.063 1.65540 ERSTE GROUP BANK 181'702'737'920 0.558 15.481 AS 6.6 2.296 -0.731 1.03141 BANCA MONTE DEI 158'555'668'480 0.583 12.1 IT 6.53 1.906 0.078 0.85742 CREDITO VALTELLI 14'901'452'800 0.492 8.378 IT 6.27 1.261 0.299 0.466
Year Short Name Tot Assets:2007C ROA:2007C ROE:2007C Country Tier 1 Capital Ratio:2007C P/B:2007C Alpha:20040101:20090101 Raw Beta:20040101:200901011 2007 MEDIOBANCA 57'839'702'016 1.834 13.123 IT 12.28 1.771 0.294 0.9212 LANDESBANK BERLI 142'163'001'344 0.149 8.508 GE 11.8 2.616 0.937 0.723 BANCA POP SONDRI 18'941'786'112 0.842 9.635 IT 10.41 1.882 0.254 0.4314 NATIXIS 520'006'008'832 0.225 6.408 FR 10.3 0.945 -1.749 1.8475 CREDITO VALTELLI 17'228'261'376 0.534 6.978 IT 10.28 0.916 0.299 0.4666 BANCO DESIO 8'079'121'920 2.361 31.17 IT 9.94 1.395 1.347 1.117 CREDITO BERGAMAS 14'755'080'192 1.498 17.052 IT 9.89 1.366 0.98 0.6448 DEXIA SA 604'564'029'440 0.433 16.152 BE 9.1 1.377 -1.624 1.5939 VAN LANSCHOT-CVA 21'718'833'152 1.012 16.969 NE 9 1.878 0.603 0.413
10 BANCA MONTE DEI 162'076'393'472 0.897 17.505 IT 8.88 1.283 0.078 0.85711 KBC GROEP 355'596'992'512 0.91 18.487 BE 8.7 1.884 -0.286 1.32312 DEUTSCHE BANK-RG 2'020'349'050'880 0.359 18.55 GE 8.6 1.21 -1.245 1.43213 ALANDSBANKEN-A 2'592'037'120 0.846 15.971 FI 8.6 3.206 0.735 0.52214 BANCO SARDEG-RSP 12'639'723'520 0.73 8.219 IT 8.41 0.753 -0.132 1.12115 BANCA POP SPOLET 2'540'034'304 0.439 6.326 IT 8.38 1.197 0.094 0.78116 CIC 250'908'999'680 0.49 14.294 FR 8.2 1.051 -0.223 0.56917 BANK IRELAND 188'813'000'704 0.941 27.725 IR 8.2 2.295 -1.886 1.46118 CREDIT AGRICOLE 1'414'222'970'880 0.302 11.518 FR 8.1 1.006 -0.875 1.22319 CREDITO EMILIANO 26'232'528'896 0.988 17.066 IT 8.05 1.728 0.008 1.07120 BANCO POPULAR 107'169'349'632 1.273 21.448 SP 7.92 2.277 -0.827 0.72321 BANCA CARIGE 27'463'675'904 0.777 7.421 IT 7.82 1.719 0.038 0.73222 BANCO SANTANDER 976'073'850'880 0.979 18.111 SP 7.71 1.676 -0.69 1.23223 BANIF-REG 10'760'960'000 1.015 18.367 PO 7.7 1.626 0.993 1.17224 ALLIED IRISH BK 177'862'000'640 1.159 22.354 IR 7.5 1.542 -1.186 1.4225 BANCO ESPIRITO-R 68'354'711'552 0.9 13.024 PO 7.5 1.594 -0.497 0.86726 POHJOLA BANK-A 25'922'000'896 0.838 11.361 FI 7.5 1.42 0.705 0.79127 BNP PARIBAS 1'694'453'989'376 0.499 16.982 FR 7.3 1.414 -0.447 1.0128 BBVA 501'725'986'816 1.341 25.203 SP 7.3 2.311 -0.656 1.12329 BANCO SABADELL 76'776'005'632 1.046 17.859 SP 7.22 1.973 0.327 0.63830 OEST VOLKSBANKEN 78'640'832'512 0.301 14.095 AS 7.2 8.793 -0.352 0.33931 BANCO PASTOR 25'326'456'832 0.823 14.534 SP 7.18 1.859 -0.143 0.45432 OBERBANK AG 14'330'769'408 0.744 11.923 AS 7.15 1.508 0.983 0.10933 COMMERZBANK 616'474'017'792 0.313 13.054 GE 7 1.141 -1.063 1.65534 ERSTE GROUP BANK 200'518'844'416 0.615 14.299 AS 7 1.691 -0.731 1.03135 SOC GENERALE 1'071'761'981'440 0.093 3.364 FR 6.62 1.557 -0.469 1.59236 UNICREDIT SPA 1'021'835'476'992 0.64 12.274 IT 6.55 1.307 -0.576 1.39837 INTESA SANPAOLO 572'959'031'296 1.261 13.485 IT 6.5 1.299 0.402 1.10638 BANKINTER 49'648'680'960 0.756 21.733 SP 6.32 2.824 0.09 0.79939 OLDENBURG LANDES 9'783'300'096 0.8 14.29 GE 6.3 2.093 -0.503 0.27440 BANCO BPI SA-REG 40'545'947'648 0.933 23.017 PO 6.2 2.468 -0.396 1.25341 CREDITO ARTIGIAN 7'152'700'416 0.607 9.213 IT 5.86 1.118 -0.038 0.6442 BANCO COM PORT-R 88'166'162'432 0.615 13.791 PO 5.5 2.915 -0.764 1.321
Year Short Name Tot Assets:2008C ROA:2008C ROE:2008C Country Tier 1 Capital Ratio:2008C P/B:2008C Alpha:20050101:20100101 Raw Beta:20050101:201001011 2008 CREDITO BERGAMAS 14'041'613'312 0.83 9.09 IT 16.54 1.117 0.771 0.4782 POHJOLA BANK-A 32'448'000'000 0.302 5.016 FI 12 1.207 0.309 1.0673 LANDESBANK BERLI 145'387'995'136 0.022 1.483 GE 11 1.503 0.982 0.907
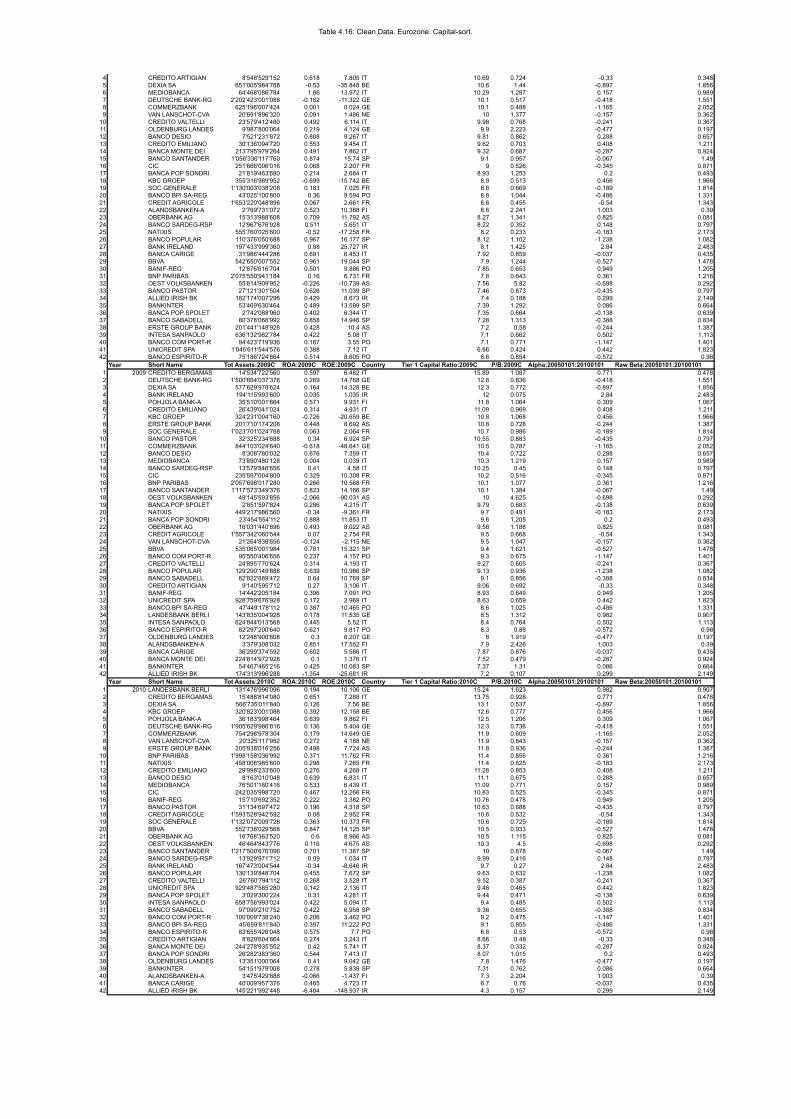
Table 4.16: Clean Data. Eurozone. Capital-sort.
4 CREDITO ARTIGIAN 8'548'529'152 0.618 7.805 IT 10.69 0.724 -0.33 0.3485 DEXIA SA 651'005'984'768 -0.53 -35.848 BE 10.6 1.44 -0.897 1.8566 MEDIOBANCA 64'468'086'784 1.66 13.972 IT 10.29 1.287 0.157 0.9897 DEUTSCHE BANK-RG 2'202'423'001'088 -0.182 -11.322 GE 10.1 0.517 -0.418 1.5518 COMMERZBANK 625'196'007'424 0.001 0.024 GE 10.1 0.488 -1.165 2.0529 VAN LANSCHOT-CVA 20'691'896'320 0.091 1.486 NE 10 1.377 -0.157 0.362
10 CREDITO VALTELLI 23'579'412'480 0.492 6.114 IT 9.98 0.768 -0.241 0.36711 OLDENBURG LANDES 9'987'800'064 0.219 4.124 GE 9.9 2.223 -0.477 0.19712 BANCO DESIO 7'521'231'872 0.808 9.267 IT 9.81 0.862 0.288 0.65713 CREDITO EMILIANO 30'136'094'720 0.553 9.454 IT 9.62 0.703 0.408 1.21114 BANCA MONTE DEI 213'795'979'264 0.491 7.862 IT 9.32 0.687 -0.287 0.92415 BANCO SANTANDER 1'056'336'117'760 0.874 15.74 SP 9.1 0.957 -0.067 1.4916 CIC 251'666'006'016 0.068 2.207 FR 9 0.526 -0.345 0.87117 BANCA POP SONDRI 21'819'463'680 0.214 2.684 IT 8.93 1.253 0.2 0.49318 KBC GROEP 355'316'989'952 -0.699 -15.742 BE 8.9 0.513 0.456 1.96619 SOC GENERALE 1'130'003'038'208 0.183 7.025 FR 8.8 0.669 -0.189 1.81420 BANCO BPI SA-REG 43'025'100'800 0.36 9.594 PO 8.8 1.044 -0.486 1.33121 CREDIT AGRICOLE 1'653'220'048'896 0.067 2.661 FR 8.6 0.455 -0.54 1.34322 ALANDSBANKEN-A 2'769'731'072 0.523 10.388 FI 8.6 2.241 1.003 0.3923 OBERBANK AG 15'313'988'608 0.709 11.792 AS 8.27 1.341 0.825 0.08124 BANCO SARDEG-RSP 12'967'676'928 0.511 5.651 IT 8.22 0.352 0.148 0.79725 NATIXIS 555'760'025'600 -0.52 -17.258 FR 8.2 0.233 -0.183 2.17326 BANCO POPULAR 110'376'050'688 0.967 16.177 SP 8.12 1.102 -1.238 1.08227 BANK IRELAND 197'433'999'360 0.88 25.727 IR 8.1 1.425 2.84 2.48328 BANCA CARIGE 31'986'444'288 0.691 6.453 IT 7.92 0.859 -0.037 0.43529 BBVA 542'650'007'552 0.961 19.044 SP 7.9 1.244 -0.527 1.47830 BANIF-REG 12'876'616'704 0.501 9.886 PO 7.85 0.653 0.949 1.20531 BNP PARIBAS 2'075'550'941'184 0.16 6.731 FR 7.8 0.643 0.361 1.21632 OEST VOLKSBANKEN 55'814'909'952 -0.226 -10.739 AS 7.56 5.82 -0.698 0.29233 BANCO PASTOR 27'121'301'504 0.626 11.039 SP 7.46 0.873 -0.435 0.79734 ALLIED IRISH BK 182'174'007'296 0.429 8.673 IR 7.4 0.188 0.299 2.14935 BANKINTER 53'469'630'464 0.489 13.599 SP 7.39 1.292 0.086 0.66436 BANCA POP SPOLET 2'742'088'960 0.402 6.344 IT 7.35 0.664 -0.138 0.63937 BANCO SABADELL 80'378'068'992 0.858 14.946 SP 7.28 1.313 -0.388 0.83438 ERSTE GROUP BANK 201'441'148'928 0.428 10.4 AS 7.2 0.58 -0.244 1.38739 INTESA SANPAOLO 636'132'982'784 0.422 5.08 IT 7.1 0.662 0.502 1.11340 BANCO COM PORT-R 94'423'719'936 0.167 3.55 PO 7.1 0.771 -1.147 1.40141 UNICREDIT SPA 1'045'611'544'576 0.388 7.12 IT 6.66 0.424 0.442 1.82342 BANCO ESPIRITO-R 75'186'724'864 0.514 8.605 PO 6.6 0.854 -0.572 0.98
Year Short Name Tot Assets:2009C ROA:2009C ROE:2009C Country Tier 1 Capital Ratio:2009C P/B:2009C Alpha:20050101:20100101 Raw Beta:20050101:201001011 2009 CREDITO BERGAMAS 14'534'722'560 0.597 6.482 IT 15.89 1.087 0.771 0.4782 DEUTSCHE BANK-RG 1'500'664'037'376 0.269 14.768 GE 12.6 0.836 -0.418 1.5513 DEXIA SA 577'629'978'624 0.164 14.328 BE 12.3 0.772 -0.897 1.8564 BANK IRELAND 194'115'993'600 0.035 1.035 IR 12 0.075 2.84 2.4835 POHJOLA BANK-A 35'510'001'664 0.571 9.931 FI 11.8 1.064 0.309 1.0676 CREDITO EMILIANO 26'439'041'024 0.314 4.931 IT 11.09 0.969 0.408 1.2117 KBC GROEP 324'231'004'160 -0.726 -20.659 BE 10.8 1.068 0.456 1.9668 ERSTE GROUP BANK 201'710'174'208 0.448 8.692 AS 10.8 0.728 -0.244 1.3879 SOC GENERALE 1'023'701'024'768 0.063 2.064 FR 10.7 0.986 -0.189 1.814
10 BANCO PASTOR 32'325'234'688 0.34 6.924 SP 10.55 0.883 -0.435 0.79711 COMMERZBANK 844'103'024'640 -0.618 -48.641 GE 10.5 0.787 -1.165 2.05212 BANCO DESIO 8'308'780'032 0.676 7.359 IT 10.4 0.722 0.288 0.65713 MEDIOBANCA 73'890'480'128 0.004 0.039 IT 10.3 1.219 0.157 0.98914 BANCO SARDEG-RSP 13'579'846'656 0.41 4.58 IT 10.25 0.45 0.148 0.79715 CIC 235'597'004'800 0.329 10.308 FR 10.2 0.516 -0.345 0.87116 BNP PARIBAS 2'057'698'017'280 0.266 10.568 FR 10.1 1.077 0.361 1.21617 BANCO SANTANDER 1'117'573'349'376 0.823 14.166 SP 10.1 1.384 -0.067 1.4918 OEST VOLKSBANKEN 49'145'593'856 -2.066 -90.031 AS 10 4.625 -0.698 0.29219 BANCA POP SPOLET 2'851'597'824 0.286 4.215 IT 9.79 0.683 -0.138 0.63920 NATIXIS 449'217'986'560 -0.34 -9.361 FR 9.7 0.491 -0.183 2.17321 BANCA POP SONDRI 23'454'554'112 0.888 11.853 IT 9.6 1.205 0.2 0.49322 OBERBANK AG 16'031'440'896 0.493 8.022 AS 9.58 1.188 0.825 0.08123 CREDIT AGRICOLE 1'557'342'060'544 0.07 2.754 FR 9.5 0.668 -0.54 1.34324 VAN LANSCHOT-CVA 21'264'838'656 -0.124 -2.115 NE 9.5 1.047 -0.157 0.36225 BBVA 535'065'001'984 0.781 15.321 SP 9.4 1.621 -0.527 1.47826 BANCO COM PORT-R 95'550'406'656 0.237 4.157 PO 9.3 0.675 -1.147 1.40127 CREDITO VALTELLI 24'895'770'624 0.314 4.193 IT 9.27 0.605 -0.241 0.36728 BANCO POPULAR 129'290'149'888 0.639 10.986 SP 9.13 0.936 -1.238 1.08229 BANCO SABADELL 82'822'889'472 0.64 10.769 SP 9.1 0.856 -0.388 0.83430 CREDITO ARTIGIAN 9'140'595'712 0.27 3.106 IT 9.06 0.692 -0.33 0.34831 BANIF-REG 14'442'205'184 0.396 7.091 PO 8.93 0.649 0.949 1.20532 UNICREDIT SPA 928'759'676'928 0.172 2.969 IT 8.63 0.659 0.442 1.82333 BANCO BPI SA-REG 47'449'178'112 0.387 10.465 PO 8.6 1.025 -0.486 1.33134 LANDESBANK BERLI 143'835'004'928 0.178 11.535 GE 8.5 1.312 0.982 0.90735 INTESA SANPAOLO 624'844'013'568 0.445 5.52 IT 8.4 0.764 0.502 1.11336 BANCO ESPIRITO-R 82'297'200'640 0.621 9.817 PO 8.3 0.88 -0.572 0.9837 OLDENBURG LANDES 12'248'900'608 0.3 6.207 GE 8 1.919 -0.477 0.19738 ALANDSBANKEN-A 3'379'308'032 0.851 17.552 FI 7.9 2.426 1.003 0.3939 BANCA CARIGE 36'299'374'592 0.602 5.586 IT 7.87 0.876 -0.037 0.43540 BANCA MONTE DEI 224'814'972'928 0.1 1.376 IT 7.52 0.479 -0.287 0.92441 BANKINTER 54'467'465'216 0.425 10.083 SP 7.37 1.31 0.086 0.66442 ALLIED IRISH BK 174'313'996'288 -1.354 -25.681 IR 7.2 0.107 0.299 2.149
Year Short Name Tot Assets:2010C ROA:2010C ROE:2010C Country Tier 1 Capital Ratio:2010C P/B:2010C Alpha:20050101:20100101 Raw Beta:20050101:201001011 2010 LANDESBANK BERLI 131'476'996'096 0.194 10.106 GE 15.24 1.623 0.982 0.9072 CREDITO BERGAMAS 15'488'814'080 0.651 7.288 IT 13.75 0.928 0.771 0.4783 DEXIA SA 566'735'011'840 0.126 7.56 BE 13.1 0.537 -0.897 1.8564 KBC GROEP 320'823'001'088 0.392 12.158 BE 12.6 0.777 0.456 1.9665 POHJOLA BANK-A 36'183'998'464 0.639 9.862 FI 12.5 1.206 0.309 1.0676 DEUTSCHE BANK-RG 1'905'629'986'816 0.136 5.404 GE 12.3 0.736 -0.418 1.5517 COMMERZBANK 754'298'978'304 0.179 14.649 GE 11.9 0.609 -1.165 2.0528 VAN LANSCHOT-CVA 20'325'117'952 0.272 4.188 NE 11.9 0.843 -0.157 0.3629 ERSTE GROUP BANK 205'938'016'256 0.498 7.724 AS 11.8 0.936 -0.244 1.387
10 BNP PARIBAS 1'998'158'036'992 0.371 11.762 FR 11.4 0.856 0.361 1.21611 NATIXIS 458'008'985'600 0.298 7.265 FR 11.4 0.625 -0.183 2.17312 CREDITO EMILIANO 29'998'233'600 0.276 4.268 IT 11.28 0.853 0.408 1.21113 BANCO DESIO 8'163'010'048 0.639 6.831 IT 11.1 0.675 0.288 0.65714 MEDIOBANCA 76'501'180'416 0.533 6.439 IT 11.09 0.771 0.157 0.98915 CIC 242'035'998'720 0.467 12.266 FR 10.83 0.525 -0.345 0.87116 BANIF-REG 15'710'692'352 0.222 3.382 PO 10.76 0.478 0.949 1.20517 BANCO PASTOR 31'134'697'472 0.196 4.318 SP 10.63 0.688 -0.435 0.79718 CREDIT AGRICOLE 1'593'528'942'592 0.08 2.952 FR 10.6 0.532 -0.54 1.34319 SOC GENERALE 1'132'072'009'728 0.363 10.373 FR 10.6 0.725 -0.189 1.81420 BBVA 552'738'029'568 0.847 14.125 SP 10.5 0.933 -0.527 1.47821 OBERBANK AG 16'768'363'520 0.6 8.966 AS 10.5 1.115 0.825 0.08122 OEST VOLKSBANKEN 46'464'843'776 0.116 4.675 AS 10.3 4.5 -0.698 0.29223 BANCO SANTANDER 1'217'500'676'096 0.701 11.387 SP 10 0.878 -0.067 1.4924 BANCO SARDEG-RSP 13'929'971'712 0.09 1.034 IT 9.99 0.416 0.148 0.79725 BANK IRELAND 167'473'004'544 -0.34 -8.646 IR 9.7 0.27 2.84 2.48326 BANCO POPULAR 130'139'848'704 0.455 7.672 SP 9.63 0.632 -1.238 1.08227 CREDITO VALTELLI 26'760'794'112 0.268 3.528 IT 9.52 0.387 -0.241 0.36728 UNICREDIT SPA 929'487'585'280 0.142 2.136 IT 9.46 0.465 0.442 1.82329 BANCA POP SPOLET 3'029'300'224 0.31 4.281 IT 9.44 0.471 -0.138 0.63930 INTESA SANPAOLO 658'756'993'024 0.422 5.094 IT 9.4 0.485 0.502 1.11331 BANCO SABADELL 97'099'210'752 0.422 6.958 SP 9.36 0.655 -0.388 0.83432 BANCO COM PORT-R 100'009'738'240 0.206 3.462 PO 9.2 0.475 -1.147 1.40133 BANCO BPI SA-REG 45'659'811'840 0.397 11.222 PO 9.1 0.855 -0.486 1.33134 BANCO ESPIRITO-R 83'655'426'048 0.575 7.7 PO 8.8 0.53 -0.572 0.9835 CREDITO ARTIGIAN 8'829'604'864 0.274 3.243 IT 8.66 0.48 -0.33 0.34836 BANCA MONTE DEI 244'278'935'552 0.42 5.741 IT 8.37 0.332 -0.287 0.92437 BANCA POP SONDRI 26'282'383'360 0.544 7.413 IT 8.07 1.015 0.2 0.49338 OLDENBURG LANDES 13'351'000'064 0.41 9.042 GE 7.8 1.476 -0.477 0.19739 BANKINTER 54'151'979'008 0.278 5.839 SP 7.31 0.762 0.086 0.66440 ALANDSBANKEN-A 3'475'429'888 -0.066 -1.437 FI 7.3 2.204 1.003 0.3941 BANCA CARIGE 40'009'957'376 0.465 4.723 IT 6.7 0.76 -0.037 0.43542 ALLIED IRISH BK 145'221'992'448 -6.404 -148.937 IR 4.3 0.157 0.299 2.149

Table 4.17: Average Values. Eurozone. Size-sort.
Year Tot Assets ln(assets) ROA ROE Tier 1 Capital Ratio P/B Alpha Raw Beta2002 7'138'411'328 22.69 0.51 8.90 8.09 1.63 0.62 0.282003 7'630'337'333 22.76 0.51 8.78 7.60 1.72 1.04 0.282004 8'598'486'272 22.87 0.51 8.65 7.92 1.64 1.05 0.322005 9'663'118'571 22.99 0.79 12.69 8.12 1.61 0.97 0.292006 10'433'681'429 23.07 0.82 12.28 8.14 1.82 0.47 0.642007 11'710'217'301 23.18 0.95 13.84 8.49 1.58 0.47 0.642008 12'738'337'429 23.27 0.49 7.05 9.68 1.13 0.24 0.502009 13'677'713'408 23.34 0.45 6.55 9.85 1.06 0.24 0.502010 14'342'873'515 23.39 0.35 4.81 9.90 0.87 0.24 0.50
Average 10'659'241'843 23.06 0.60 9.28 8.64 1.45 0.59 0.44Median 10'433'681'429 23.07 0.51 8.78 8.14 1.61 0.47 0.50SD 2'621'255'982 0.25 0.20 3.05 0.91 0.34 0.35 0.15SE 873'751'994 0.08 0.07 1.02 0.30 0.11 0.12 0.05min 7'138'411'328 22.69 0.35 4.81 7.60 0.87 0.24 0.28max 14'342'873'515 23.39 0.95 13.84 9.90 1.82 1.05 0.64
Year Tot Assets ln(assets) ROA ROE Tier 1 Capital Ratio P/B Alpha Raw Beta2002 52'072'570'217 24.68 0.63 11.91 8.25 2.15 0.55 0.742003 54'103'428'638 24.71 0.59 11.76 8.16 2.20 0.63 0.742004 60'808'735'021 24.83 0.72 13.68 8.44 2.29 0.74 0.672005 71'733'898'662 25.00 0.85 16.78 8.08 2.45 0.75 0.712006 82'244'270'923 25.13 0.89 17.50 7.85 2.77 -‐0.25 0.912007 90'795'252'676 25.23 0.87 16.40 7.89 2.40 -‐0.25 0.912008 96'415'721'352 25.29 0.54 9.17 8.42 1.27 -‐0.03 1.112009 99'075'126'935 25.32 0.12 -‐0.55 9.38 1.06 -‐0.03 1.112010 97'832'643'162 25.31 -‐0.06 -‐2.96 9.87 0.95 -‐0.03 1.11
Average 78'342'405'287 25.06 0.57 10.41 8.48 1.95 0.23 0.89Median 82'244'270'923 25.13 0.63 11.91 8.25 2.20 -‐0.03 0.91SD 19'155'260'416 0.26 0.33 7.43 0.69 0.67 0.43 0.19SE 6'385'086'805 0.09 0.11 2.48 0.23 0.22 0.14 0.06min 52'072'570'217 24.68 -‐0.06 -‐2.96 7.85 0.95 -‐0.25 0.67max 99'075'126'935 25.32 0.89 17.50 9.87 2.77 0.75 1.11
Year Tot Assets ln(assets) ROA ROE Tier 1 Capital Ratio P/B Alpha Raw Beta2002 377'185'196'190 26.66 0.28 6.42 7.87 1.16 0.67 1.072003 408'724'616'743 26.74 0.35 6.78 8.24 1.43 0.63 1.072004 477'771'859'180 26.89 0.53 12.97 7.88 1.55 0.49 1.132005 622'090'019'446 27.16 0.58 15.52 8.03 1.64 0.54 1.102006 780'296'304'167 27.38 0.65 16.85 8.27 1.70 -‐0.73 1.322007 893'917'875'909 27.52 0.60 14.45 7.84 1.40 -‐0.73 1.322008 983'144'053'524 27.61 0.09 -‐1.12 8.68 0.67 -‐0.20 1.602009 905'878'936'970 27.53 0.13 1.09 10.23 0.89 -‐0.20 1.602010 948'616'705'575 27.58 0.34 8.51 10.89 0.65 -‐0.19 1.60
Average 710'847'285'301 27.23 0.40 9.05 8.66 1.23 0.03 1.31Median 780'296'304'167 27.38 0.35 8.51 8.24 1.40 -‐0.19 1.32SD 242'864'592'621 0.38 0.21 6.39 1.12 0.40 0.57 0.23SE 80'954'864'207 0.13 0.07 2.13 0.37 0.13 0.19 0.08min 377'185'196'190 26.66 0.09 -‐1.12 7.84 0.65 -‐0.73 1.07max 983'144'053'524 27.61 0.65 16.85 10.89 1.70 0.67 1.60
The Smallest
Middle
The Biggest

Table 4.18: Average Values. Eurozone. Capital-‐sort.
Year Tot Assets ln(assets) ROA ROE Tier 1 Capital Ratio P/B Alpha Raw Beta2002 91'271'408'896 25.24 0.36 8.02 6.54 1.63 0.27 0.662003 73'922'444'043 25.03 0.42 8.75 6.60 1.41 1.23 0.632004 120'614'153'077 25.52 0.52 11.09 6.72 1.80 0.59 0.702005 146'722'332'160 25.71 0.63 12.69 6.85 1.67 0.83 0.552006 161'017'153'984 25.80 0.62 12.75 6.82 1.91 -‐0.02 0.822007 309'875'280'811 26.46 0.68 13.75 6.52 1.82 -‐0.27 0.972008 377'503'922'453 26.66 0.39 7.11 7.24 1.17 -‐0.16 1.112009 195'595'941'419 26.00 0.26 5.21 8.10 1.03 0.20 1.012010 71'835'455'787 25.00 -‐0.21 -‐7.09 7.91 0.81 -‐0.18 0.85
Average 172'039'788'070 25.71 0.41 8.03 7.03 1.47 0.28 0.81Median 146'722'332'160 25.71 0.42 8.75 6.82 1.63 0.20 0.82SD 106'868'813'499 0.59 0.27 6.36 0.60 0.39 0.51 0.19SE 35'622'937'833 0.20 0.09 2.12 0.20 0.13 0.17 0.06min 71'835'455'787 25.00 -‐0.21 -‐7.09 6.52 0.81 -‐0.27 0.55max 377'503'922'453 26.66 0.68 13.75 8.10 1.91 1.23 1.11
Year Tot Assets ln(assets) ROA ROE Tier 1 Capital Ratio P/B Alpha Raw Beta2002 148'502'119'996 25.72 0.52 9.88 7.71 1.46 0.67 0.752003 138'079'097'043 25.65 0.54 9.05 7.73 1.88 0.51 0.732004 232'665'351'326 26.17 0.57 12.39 7.73 1.77 0.87 0.762005 261'929'987'765 26.29 0.75 17.66 7.68 2.47 0.58 0.832006 344'267'285'685 26.56 0.84 19.26 7.71 2.73 -‐0.39 1.012007 331'797'683'637 26.53 0.82 15.96 7.77 2.02 -‐0.33 0.962008 365'136'310'904 26.62 0.40 7.05 8.51 0.91 0.15 1.202009 377'677'712'053 26.66 0.23 0.79 9.62 1.10 -‐0.26 0.902010 403'178'407'755 26.72 0.32 5.53 10.17 0.84 0.09 1.10
Average 289'248'217'352 26.33 0.55 10.84 8.29 1.69 0.21 0.91Median 331'797'683'637 26.53 0.54 9.88 7.73 1.77 0.15 0.90SD 98'745'819'389 0.40 0.22 6.06 0.96 0.67 0.47 0.16SE 32'915'273'130 0.13 0.07 2.02 0.32 0.22 0.16 0.05min 138'079'097'043 25.65 0.23 0.79 7.68 0.84 -‐0.39 0.73max 403'178'407'755 26.72 0.84 19.26 10.17 2.73 0.87 1.20
Year Tot Assets ln(assets) ROA ROE Tier 1 Capital Ratio P/B Alpha Raw Beta2002 173'423'787'185 25.88 0.57 9.89 10.02 2.05 0.84 0.702003 237'717'567'252 26.19 0.50 10.35 9.75 2.13 0.62 0.762004 149'637'206'961 25.73 0.72 12.42 9.92 2.08 0.74 0.662005 246'855'859'614 26.23 0.87 14.37 9.74 1.56 0.90 0.692006 298'650'694'814 26.42 0.89 14.13 9.68 1.66 -‐0.10 1.022007 303'531'561'413 26.44 0.92 15.12 9.83 1.67 0.05 0.942008 295'033'511'778 26.41 0.38 1.59 10.82 1.09 -‐0.06 0.932009 373'627'961'344 26.65 0.16 0.56 11.52 0.86 0.14 1.412010 496'248'322'087 26.93 0.36 8.39 12.33 0.86 0.04 1.30
Average 286'080'719'161 26.32 0.60 9.64 10.40 1.55 0.35 0.94Median 295'033'511'778 26.41 0.57 10.35 9.92 1.66 0.14 0.93SD 104'620'522'619 0.37 0.27 5.36 0.95 0.51 0.41 0.27SE 34'873'507'540 0.12 0.09 1.79 0.32 0.17 0.14 0.09min 149'637'206'961 25.73 0.16 0.56 9.68 0.86 -‐0.10 0.66max 496'248'322'087 26.93 0.92 15.12 12.33 2.13 0.90 1.41
The Smallest
Middle
The Biggest

Table 4.19: Clean Data. Non-Eurozone. Size-sort.
Number Year Short Name Tot Assets:2002C ROA:2002C ROE:2002C Country Tier 1 Capital Ratio:2002C P/B:2002C Alpha:20020101:20050101 Raw Beta:20020101:200701011 2002 UBS AG-REG 813'813'316'267 0.29 8.56 SZ 11.30 2.00 0.43 1.212 HSBC HLDGS PLC 722'205'833'020 0.86 12.71 GB 9.00 2.02 -0.01 1.003 CREDIT SUISS-REG 655'781'874'277 -0.34 -12.60 SZ 9.00 1.46 -0.31 2.024 ROYAL BK SCOTLAN 631'688'862'440 0.50 8.60 GB 7.30 1.83 0.09 1.345 BARCLAYS PLC 617'984'899'353 0.59 15.02 GB 8.20 1.67 0.21 1.386 LLOYDS BANKING 387'232'942'124 0.73 19.56 GB 7.70 3.13 -0.60 1.507 NORDEA BANK AB 249'619'005'440 0.36 7.48 SW 7.10 1.03 0.70 0.908 DANSKE BANK A/S 235'666'971'406 0.50 14.23 DE 7.60 1.40 0.70 0.479 SVENSKA HAN-A 140'158'293'627 0.59 14.52 SW 6.40 1.54 0.26 0.57
10 SEB AB-A 136'164'569'615 0.44 11.82 SW 7.88 1.12 1.07 0.7211 STANDARD CHARTER 107'533'318'569 0.68 11.60 GB 8.30 2.00 0.80 1.2212 SWEDBANK AB-A 105'049'328'861 0.43 10.91 SW 7.10 1.41 0.76 0.7313 DNB NOR ASA 87'756'588'559 0.47 7.12 NO 7.10 1.08 1.83 0.4714 BANQUE CANTO-REG 22'406'294'348 -3.60 -104.36 SZ 5.50 0.77 1.42 0.6815 JYSKE BANK-REG 20'614'932'467 0.36 8.05 DE 8.20 1.04 2.39 0.3316 BERNER KANTO-REG 12'875'017'782 0.38 7.22 SZ 13.50 1.25 0.69 -0.0217 ST GALLER KA-REG 12'446'585'853 0.56 9.14 SZ 9.10 0.92 1.59 0.3618 SYDBANK 8'982'508'136 0.62 12.15 DE 8.30 1.03 3.02 0.2319 LIECHTENSTEIN-BR 7'673'954'805 0.97 12.74 LC 25.30 2.30 0.38 0.3520 SPAREBANK 1 SR B 6'810'116'750 -0.07 -1.30 NO 7.24 0.53 1.54 0.0021 VERWALTUNGS-U-BR 6'028'691'418 0.13 1.49 LC 20.20 1.26 0.30 0.7222 BANK SARASIN-B 5'606'551'637 -5.47 -50.15 SZ 23.70 1.33 0.01 1.1823 SPAREBANK 1 NORD 5'207'324'191 0.17 2.81 NO 7.87 0.38 1.40 0.0624 SPAREBANK 1 SMN 4'947'775'669 0.02 0.33 NO 8.12 0.42 1.97 0.1225 SPAREBANKEN VEST 4'873'265'651 0.20 3.06 NO 8.63 0.12 1.08 0.0026 SPAR NORD BANK 4'287'786'004 0.38 6.80 DE 8.00 0.91 2.46 0.2227 SPAREBANKEN MORE 2'992'090'695 0.80 10.19 NO 10.25 0.58 0.76 0.1628 SPAREBANKEN OST 2'141'093'005 0.30 4.79 NO 9.48 0.44 0.84 0.1029 SANDNES SPAREBAN 1'664'788'797 0.67 9.01 NO 8.70 0.55 1.15 0.1730 LAN & SPAR BANK 999'257'577 0.46 6.02 DE 9.50 1.07 1.18 0.1131 RINGKJOEBING LND 807'858'274 2.73 16.79 DE 14.60 1.02 3.43 0.0632 SPAREBANK1 BUSKE 759'126'623 0.88 13.84 NO 9.60 0.21 0.71 0.0433 NORRESUNDBY 655'605'740 1.10 9.03 DE 13.60 0.95 2.24 0.0734 NORDJYSKE BANK A 579'533'814 1.56 11.63 DE 15.50 0.88 2.19 0.3435 GRONLANDSBANKEN 482'686'555 2.12 14.07 DE 28.80 1.04 1.31 0.1636 SPAREKASSEN FAAB 481'938'702 1.96 12.21 DE 12.00 0.99 2.33 0.3737 DJURSLANDS BANK 386'352'315 1.15 10.82 DE 10.50 0.75 2.91 0.0038 SKJERN BANK 248'748'850 1.22 10.48 DE 10.70 0.89 3.27 0.1939 OSTJYDSK BANK 228'686'154 1.29 12.12 DE 8.80 0.82 2.27 0.1140 SVENDBORG SPAREK 224'251'908 2.21 12.60 DE 15.30 0.89 2.13 0.1041 SALLING BANK 191'972'193 0.47 5.87 DE 8.90 0.80 1.99 0.1842 TONDER BANK 173'333'342 1.37 11.60 DE 11.30 0.76 2.73 0.1443 TOTALBANKEN 168'346'157 1.15 9.58 DE 12.30 0.88 2.47 0.2044 VESTFYNS BANK 163'329'061 0.69 6.95 DE 10.30 0.81 2.21 0.1545 KREDITBANKEN 148'248'727 1.88 11.63 DE 20.90 0.89 2.73 0.2546 LOLLANDS BANK 130'210'901 1.01 6.98 DE 15.00 0.68 2.61 0.3347 NORDFYNS BANK 125'939'256 1.21 13.72 DE 10.60 0.91 1.75 0.2948 DK COMPANY A/S 114'278'269 1.10 9.35 DE 19.00 0.81 6.31 0.3349 MONS BANK 101'723'109 1.47 8.19 DE 14.10 0.67 2.53 0.1350 VORDINGBORG BANK 86'235'336 1.18 9.33 DE 12.70 0.81 2.45 0.1251 HVIDBJERG BANK 56'562'764 1.13 9.76 DE 12.20 0.74 2.52 -0.07
Short Name Tot Assets:2003C ROA:2003C ROE:2003C Country Tier 1 Capital Ratio:2003C P/B:2003C Alpha:20020101:20070101 Raw Beta:20020101:200701011 2003 UBS AG-REG 888'098'751'139 0.49 16.76 SZ 11.80 2.56 0.43 1.212 HSBC HLDGS PLC 823'158'217'767 0.98 13.90 GB 8.90 2.30 -0.01 1.003 ROYAL BK SCOTLAN 645'020'835'225 0.52 9.65 GB 7.40 2.10 0.09 1.344 CREDIT SUISS-REG 643'524'292'729 0.08 2.64 SZ 11.70 1.50 -0.31 2.025 BARCLAYS PLC 629'312'197'564 0.65 17.33 GB 7.90 1.99 0.21 1.386 LLOYDS BANKING 357'709'016'130 1.29 37.05 GB 9.50 2.60 -0.60 1.507 NORDEA BANK AB 262'190'006'272 0.58 12.38 SW 7.30 1.43 0.70 0.908 DANSKE BANK A/S 244'781'562'384 0.52 15.60 DE 7.70 1.57 0.70 0.479 SEB AB-A 141'140'532'108 0.45 12.12 SW 7.97 1.51 1.07 0.72
10 SVENSKA HAN-A 139'051'214'268 0.64 14.89 SW 7.10 1.79 0.26 0.5711 SWEDBANK AB-A 110'575'837'753 0.65 15.75 SW 7.20 1.78 0.76 0.7312 STANDARD CHARTER 95'543'181'171 0.86 14.21 GB 8.60 2.57 0.80 1.2213 DNB NOR ASA 84'022'596'531 0.80 13.15 NO 6.80 1.38 1.83 0.4714 BANQUE CANTO-REG 20'567'495'452 0.48 9.72 SZ 13.40 1.35 1.42 0.6815 JYSKE BANK-REG 15'613'383'878 0.95 17.74 DE 10.20 1.39 2.39 0.3316 BERNER KANTO-REG 12'481'438'980 0.37 7.11 SZ 14.70 1.27 0.69 -0.0217 ST GALLER KA-REG 11'978'183'153 0.57 9.12 SZ 9.80 0.99 1.59 0.3618 SYDBANK 9'824'400'436 0.96 17.58 DE 8.90 1.41 3.02 0.2319 LIECHTENSTEIN-BR 7'802'582'039 1.13 15.27 LC 25.90 2.19 0.38 0.3520 SPAREBANK 1 SR B 6'267'906'993 0.80 15.21 NO 9.11 0.86 1.54 0.0021 VERWALTUNGS-U-BR 5'235'512'246 1.12 11.06 LC 14.30 1.59 0.30 0.7222 SPAREBANK 1 NORD 4'868'873'469 0.53 9.15 NO 9.03 0.52 1.40 0.0623 BANK SARASIN-B 4'855'003'895 0.89 9.57 SZ 23.40 1.51 0.01 1.1824 SPAREBANKEN VEST 4'804'458'446 0.73 11.95 NO 8.38 0.17 1.08 0.0025 SPAREBANK 1 SMN 4'390'702'146 0.61 10.32 NO 10.12 0.67 1.97 0.1226 SPAR NORD BANK 4'345'063'830 0.74 12.17 DE 9.00 1.27 2.46 0.2227 SPAREBANKEN MORE 2'755'916'857 0.80 10.24 NO 10.22 0.76 0.76 0.1628 SPAREBANKEN OST 1'846'981'043 0.84 13.47 NO 11.26 0.62 0.84 0.1029 SANDNES SPAREBAN 1'814'873'510 0.74 10.66 NO 8.60 0.76 1.15 0.1730 RINGKJOEBING LND 1'010'224'301 3.40 21.96 DE 15.10 1.69 3.43 0.0631 LAN & SPAR BANK 995'496'998 0.40 5.15 DE 11.10 1.05 1.18 0.1132 SPAREBANK1 BUSKE 750'656'550 0.77 11.37 NO 11.42 0.43 0.71 0.0433 NORRESUNDBY 746'268'820 2.18 17.64 DE 14.20 1.30 2.24 0.0734 NORDJYSKE BANK A 608'306'612 2.24 16.62 DE 18.20 1.32 2.19 0.3435 SPAREKASSEN FAAB 554'798'883 2.42 15.73 DE 13.00 1.20 2.33 0.3736 DJURSLANDS BANK 419'467'255 2.12 18.29 DE 12.40 1.18 2.91 0.0037 GRONLANDSBANKEN 392'711'382 1.98 12.14 DE 30.20 1.47 1.31 0.1638 OSTJYDSK BANK 291'263'509 2.24 20.74 DE 10.40 1.28 2.27 0.1139 SKJERN BANK 287'012'156 2.83 23.49 DE 12.30 1.58 3.27 0.1940 SVENDBORG SPAREK 255'605'800 2.73 15.85 DE 17.40 1.29 2.13 0.1041 SALLING BANK 188'629'596 1.50 16.76 DE 10.90 1.12 1.99 0.1842 TONDER BANK 185'323'776 1.69 13.39 DE 12.43 1.24 2.73 0.1443 TOTALBANKEN 178'942'806 1.91 15.45 DE 13.80 1.07 2.47 0.2044 VESTFYNS BANK 171'733'279 1.79 17.80 DE 12.50 1.12 2.21 0.1545 KREDITBANKEN 164'528'953 2.97 17.83 DE 20.70 1.36 2.73 0.2546 NORDFYNS BANK 147'852'029 2.70 25.84 DE 12.40 1.53 1.75 0.2947 LOLLANDS BANK 138'884'367 2.63 17.53 DE 16.50 1.07 2.61 0.3348 DK COMPANY A/S 123'630'824 1.77 14.59 DE 17.70 1.65 6.31 0.3349 MONS BANK 116'752'677 3.27 18.34 DE 15.50 1.06 2.53 0.1350 VORDINGBORG BANK 97'099'724 1.57 11.13 DE 13.50 1.02 2.45 0.1251 HVIDBJERG BANK 63'127'603 2.44 19.54 DE 15.70 1.04 2.52 -0.07
Short Name Tot Assets:2003C ROA:2003C ROE:2003C Country Tier 1 Capital Ratio:2003C P/B:2003C Alpha:20020101:20070101 Raw Beta:20020101:200701011 2004 UBS AG-REG 1'123'568'237'558 0.51 23.11 SZ 11.90 2.82 0.43 1.212 HSBC HLDGS PLC 944'246'983'355 1.12 16.15 GB 8.90 2.20 -0.01 1.003 ROYAL BK SCOTLAN 831'171'643'887 0.93 17.01 GB 7.00 1.64 0.09 1.344 BARCLAYS PLC 760'591'801'394 0.66 20.12 GB 7.60 2.38 0.21 1.385 CREDIT SUISS-REG 704'679'081'165 0.54 16.02 SZ 12.30 1.46 -0.31 2.026 LLOYDS BANKING 401'963'368'063 0.89 23.14 GB 8.20 2.40 -0.60 1.507 NORDEA BANK AB 280'073'994'240 0.77 16.71 SW 7.30 1.60 0.70 0.908 DANSKE BANK A/S 275'975'024'255 0.48 14.72 DE 7.70 1.58 0.70 0.479 SEB AB-A 178'164'081'580 0.51 14.71 SW 7.76 1.66 1.07 0.72
10 SVENSKA HAN-A 146'029'920'938 0.77 16.68 SW 7.60 1.89 0.26 0.5711 SWEDBANK AB-A 113'369'423'052 0.90 21.27 SW 8.20 1.92 0.76 0.7312 DNB NOR ASA 111'839'995'773 0.96 17.28 NO 7.60 1.63 1.83 0.4713 STANDARD CHARTER 108'534'535'015 1.15 18.97 GB 8.60 2.51 0.80 1.2214 BANQUE CANTO-REG 19'751'465'610 1.07 13.77 SZ 16.50 0.67 1.42 0.6815 JYSKE BANK-REG 16'830'486'123 1.16 17.96 DE 20.50 1.67 2.39 0.3316 BERNER KANTO-REG 12'712'080'951 0.38 6.98 SZ 15.80 1.35 0.69 -0.02

Table 4.19: Clean Data. Non-Eurozone. Size-sort.
17 ST GALLER KA-REG 11'868'200'182 0.62 9.35 SZ 11.30 1.14 1.59 0.3618 SYDBANK 10'565'134'904 0.99 17.53 DE 9.30 16.98 3.02 0.2319 LIECHTENSTEIN-BR 7'398'499'699 1.18 11.51 LC 27.20 1.32 0.38 0.3520 SPAREBANK 1 SR B 7'181'334'854 1.10 11.66 NO 9.08 2.10 1.54 0.0021 SPAREBANK 1 SMN 6'222'042'574 1.03 19.32 NO 10.90 0.84 1.97 0.1222 SPAREBANKEN VEST 5'641'245'566 0.71 11.97 NO 9.56 0.17 1.08 0.0023 SPAREBANK 1 NORD 5'131'606'480 0.96 16.49 NO 9.24 0.73 1.40 0.0624 VERWALTUNGS-U-BR 5'102'494'491 1.12 11.70 LC 15.40 1.38 0.30 0.7225 SPAR NORD BANK 4'931'479'664 0.94 14.63 DE 8.50 1.60 2.46 0.2226 BANK SARASIN-B 4'896'895'079 1.09 10.03 SZ 23.00 1.30 0.01 1.1827 SPAREBANKEN MORE 3'000'277'551 0.92 11.67 NO 10.75 0.79 0.76 0.1628 SPAREBANKEN OST 2'233'038'349 1.10 16.96 NO 7.97 1.60 0.84 0.1029 SANDNES SPAREBAN 2'113'186'188 0.68 10.09 NO 12.30 0.74 1.15 0.1730 RINGKJOEBING LND 1'272'092'515 2.52 17.28 DE 12.20 2.09 3.43 0.0631 LAN & SPAR BANK 1'023'523'373 0.29 3.49 DE 13.10 1.27 1.18 0.1132 SPAREBANK1 BUSKE 916'694'055 0.87 12.35 NO 11.78 0.91 0.71 0.0433 NORRESUNDBY 784'338'876 1.66 13.06 DE 13.30 1.37 2.24 0.0734 NORDJYSKE BANK A 651'517'591 1.18 8.36 DE 18.10 1.37 2.19 0.3435 SPAREKASSEN FAAB 606'135'606 3.14 19.34 DE 12.80 1.49 2.33 0.3736 DJURSLANDS BANK 462'569'800 1.27 10.46 DE 12.00 1.36 2.91 0.0037 GRONLANDSBANKEN 423'815'775 1.34 7.09 DE 28.00 1.16 1.31 0.1638 OSTJYDSK BANK 335'447'620 1.60 15.20 DE 9.40 1.34 2.27 0.1139 SKJERN BANK 327'813'805 1.73 13.98 DE 12.00 1.61 3.27 0.1940 SVENDBORG SPAREK 263'184'353 2.16 12.10 DE 17.20 1.39 2.13 0.1041 TONDER BANK 200'679'888 1.68 13.00 DE 11.80 1.29 2.73 0.1442 SALLING BANK 193'074'815 1.21 12.22 DE 11.50 1.19 1.99 0.1843 KREDITBANKEN 189'593'445 2.22 13.12 DE 21.00 1.45 2.73 0.2544 TOTALBANKEN 180'468'749 1.96 14.37 DE 12.80 1.29 2.47 0.2045 VESTFYNS BANK 174'101'649 1.18 10.74 DE 11.80 1.21 2.21 0.1546 NORDFYNS BANK 156'429'911 1.59 14.46 DE 12.10 1.48 1.75 0.2947 LOLLANDS BANK 151'288'651 1.89 12.17 DE 16.90 1.25 2.61 0.3348 DK COMPANY A/S 132'398'440 1.19 9.62 DE 14.30 1.84 6.31 0.3349 MONS BANK 122'267'071 2.62 14.29 DE 15.00 1.24 2.53 0.1350 VORDINGBORG BANK 108'790'400 1.34 8.85 DE 14.20 1.16 2.45 0.1251 HVIDBJERG BANK 66'991'043 1.03 7.77 DE 14.20 1.12 2.52 -0.07
Short Name Tot Assets:2003C ROA:2003C ROE:2003C Country Tier 1 Capital Ratio:2003C P/B:2003C Alpha:20020101:20070101 Raw Beta:20020101:200701011 2005 BARCLAYS PLC 1'342'594'654'523 0.47 20.71 GB 7.00 2.28 0.21 1.382 UBS AG-REG 1'322'661'178'538 0.74 35.99 SZ 12.80 2.80 0.43 1.213 HSBC HLDGS PLC 1'269'306'174'281 1.08 16.93 GB 9.00 1.97 -0.01 1.004 ROYAL BK SCOTLAN 1'128'312'745'141 0.77 15.24 GB 7.60 1.58 0.09 1.345 CREDIT SUISS-REG 860'453'185'061 0.48 14.93 SZ 11.30 1.79 -0.31 2.026 LLOYDS BANKING 449'906'349'443 0.84 23.47 GB 7.90 2.68 -0.60 1.507 DANSKE BANK A/S 325'944'288'954 0.57 18.16 DE 7.30 1.87 0.70 0.478 NORDEA BANK AB 325'548'998'656 0.75 17.69 SW 6.80 1.76 0.70 0.909 SEB AB-A 200'890'198'380 0.48 15.51 SW 7.53 1.98 1.07 0.72
10 STANDARD CHARTER 181'776'383'325 1.06 18.60 GB 7.70 2.47 0.80 1.2211 SVENSKA HAN-A 168'041'161'516 0.78 17.89 SW 7.60 1.97 0.26 0.5712 DNB NOR ASA 138'280'116'723 1.00 19.12 NO 7.40 1.68 1.83 0.4713 SWEDBANK AB-A 127'351'634'496 1.07 24.12 SW 6.50 2.05 0.76 0.7314 BANQUE CANTO-REG 22'410'305'654 1.39 16.99 SZ 17.80 1.16 1.42 0.6815 JYSKE BANK-REG 18'941'104'945 1.27 20.00 DE 10.60 2.10 2.39 0.3316 SYDBANK 13'256'386'852 1.05 19.88 DE 8.10 2.07 3.02 0.2317 BERNER KANTO-REG 12'913'513'700 0.43 7.89 SZ 14.70 1.60 0.69 -0.0218 ST GALLER KA-REG 12'284'487'734 0.90 12.13 SZ 13.50 1.44 1.59 0.3619 SPAREBANK 1 SMN 8'837'107'830 1.18 23.22 NO 8.80 1.08 1.97 0.1220 LIECHTENSTEIN-BR 8'454'954'169 1.73 13.31 LC 20.30 1.56 0.38 0.3521 SPAREBANK 1 SR B 8'419'137'553 1.35 13.10 NO 8.98 1.36 1.54 0.0022 SPAREBANKEN VEST 6'846'802'120 0.94 15.87 NO 9.95 0.30 1.08 0.0023 SPAR NORD BANK 6'159'822'736 1.16 17.75 DE 9.90 1.74 2.46 0.2224 SPAREBANK 1 NORD 6'089'246'669 1.22 20.33 NO 9.99 0.84 1.40 0.0625 BANK SARASIN-B 5'456'332'637 1.39 12.04 SZ 23.90 1.68 0.01 1.1826 VERWALTUNGS-U-BR 5'293'446'906 1.48 14.05 LC 15.30 1.43 0.30 0.7227 SPAREBANKEN MORE 3'361'168'986 1.03 13.05 NO 11.43 0.86 0.76 0.1628 SANDNES SPAREBAN 2'550'048'177 0.97 15.13 NO 10.80 0.96 1.15 0.1729 SPAREBANKEN OST 2'387'098'745 1.68 24.89 NO 15.22 0.74 0.84 0.1030 RINGKJOEBING LND 1'790'597'138 2.32 18.33 DE 11.60 2.61 3.43 0.0631 LAN & SPAR BANK 1'064'672'152 0.55 6.44 DE 12.80 1.37 1.18 0.1132 SPAREBANK1 BUSKE 1'053'650'363 0.97 14.08 NO 11.82 0.92 0.71 0.0433 NORRESUNDBY 930'282'793 1.65 12.91 DE 12.20 1.54 2.24 0.0734 NORDJYSKE BANK A 711'138'779 1.57 11.06 DE 16.80 1.53 2.19 0.3435 SPAREKASSEN FAAB 702'212'187 3.71 21.36 DE 12.00 1.91 2.33 0.3736 DJURSLANDS BANK 590'880'662 1.53 13.39 DE 9.80 1.61 2.91 0.0037 GRONLANDSBANKEN 463'629'352 1.70 8.97 DE 22.00 1.49 1.31 0.1638 OSTJYDSK BANK 415'425'895 1.70 15.54 DE 8.50 1.48 2.27 0.1139 SKJERN BANK 368'243'791 2.33 17.60 DE 11.30 1.58 3.27 0.1940 SVENDBORG SPAREK 286'301'399 2.36 12.41 DE 17.30 1.86 2.13 0.1041 TOTALBANKEN 232'422'791 2.81 20.06 DE 9.40 1.49 2.47 0.2042 KREDITBANKEN 208'736'925 2.47 14.43 DE 15.40 1.76 2.73 0.2543 SALLING BANK 204'781'990 1.10 10.63 DE 10.60 1.51 1.99 0.1844 TONDER BANK 201'742'513 2.16 15.83 DE 11.60 1.93 2.73 0.1445 VESTFYNS BANK 182'645'652 1.52 12.86 DE 11.10 1.43 2.21 0.1546 LOLLANDS BANK 178'296'538 2.28 14.60 DE 16.10 1.38 2.61 0.3347 NORDFYNS BANK 174'829'841 1.79 15.47 DE 10.30 1.46 1.75 0.2948 MONS BANK 152'452'532 2.37 13.27 DE 14.10 1.54 2.53 0.1349 DK COMPANY A/S 149'797'988 1.87 14.41 DE 11.60 3.87 6.31 0.3350 VORDINGBORG BANK 132'367'264 1.11 8.07 DE 12.40 1.31 2.45 0.1251 HVIDBJERG BANK 71'141'526 1.07 7.64 DE 12.30 1.25 2.52 -0.07
Year Short Name Tot Assets:2008C ROA:2008C ROE:2008C Country Tier 1 Capital Ratio:2008C P/B:2008C Alpha:20050101:20100101 Raw Beta:20050101:201001011 2006 UBS AG-REG 1'489'448'628'129 0.55 26.16 SZ 11.90 2.89 -1.32 2.022 BARCLAYS PLC 1'463'362'549'540 0.48 24.56 GB 7.70 2.41 -1.29 1.413 HSBC HLDGS PLC 1'410'840'902'095 0.93 15.64 GB 9.40 1.95 -0.44 0.874 ROYAL BK SCOTLAN 1'279'331'402'544 0.73 15.89 GB 7.50 1.56 -2.46 1.935 CREDIT SUISS-REG 780'585'594'807 0.87 26.43 SZ 13.90 2.08 -0.67 1.586 LLOYDS BANKING 504'429'171'295 0.86 26.26 GB 8.20 2.89 -1.61 1.457 DANSKE BANK A/S 367'390'289'435 0.52 15.99 DE 8.63 1.81 -1.49 1.068 NORDEA BANK AB 346'890'010'624 0.94 22.31 SW 7.10 1.98 0.08 1.119 SEB AB-A 214'315'065'707 0.66 20.36 SW 8.19 2.20 -0.76 1.26
10 STANDARD CHARTER 201'718'859'794 0.94 15.68 GB 8.40 2.40 0.44 1.2511 SVENSKA HAN-A 198'313'447'902 0.78 19.91 SW 6.80 1.98 -0.33 0.7512 DNB NOR ASA 160'294'874'787 0.96 19.18 NO 6.70 1.84 -0.35 0.7313 SWEDBANK AB-A 149'896'492'968 0.85 19.04 SW 6.50 2.14 -1.68 1.2514 JYSKE BANK-REG 21'546'481'802 1.40 22.50 DE 9.70 2.38 -0.20 1.0415 BANQUE CANTO-REG 20'528'753'126 1.56 18.89 SZ 18.30 1.77 1.85 0.5216 SYDBANK 15'390'806'371 1.42 26.71 DE 9.00 2.93 -0.05 1.2017 BERNER KANTO-REG 12'711'075'947 0.45 8.46 SZ 17.20 1.69 0.89 0.1318 ST GALLER KA-REG 12'305'829'605 1.17 14.47 SZ 13.50 1.71 0.93 0.9119 SPAREBANK 1 SR B 10'324'375'967 1.20 11.94 NO 7.39 1.00 -0.11 0.4020 LIECHTENSTEIN-BR 9'303'801'270 1.75 15.84 LC 15.10 2.09 -0.16 0.9421 SPAR NORD BANK 7'854'502'533 1.59 24.78 DE 9.70 2.09 -0.05 0.6922 SPAREBANK 1 SMN 7'670'646'312 1.34 22.87 NO 8.64 0.99 0.02 0.4623 SPAREBANKEN VEST 7'310'413'306 1.05 18.65 NO 9.51 0.17 -0.98 0.2624 SPAREBANK 1 NORD 6'673'115'209 1.47 7.67 NO 9.77 0.67 -0.50 0.5625 BANK SARASIN-B 6'172'750'843 1.04 9.64 SZ 18.80 2.28 1.02 1.4426 VERWALTUNGS-U-BR 5'934'008'742 1.49 13.81 LC 15.50 1.91 -0.39 0.7427 SPAREBANKEN MORE 3'855'720'769 0.93 12.67 NO 10.28 0.70 -0.64 0.3128 SANDNES SPAREBAN 3'160'703'535 0.83 14.54 NO 10.40 0.82 -1.69 0.6429 SPAREBANKEN OST 2'590'368'053 0.47 6.86 NO 13.61 0.46 -1.47 0.4830 RINGKJOEBING LND 2'316'085'613 2.82 26.81 DE 10.40 3.26 -0.06 1.0131 SPAREBANK1 BUSKE 1'184'944'242 0.75 11.01 NO 10.88 0.39 -1.00 0.3332 NORRESUNDBY 1'139'122'632 2.43 19.45 DE 13.10 1.53 -0.43 0.6233 LAN & SPAR BANK 1'121'799'310 0.38 4.55 DE 11.20 1.68 0.55 0.3134 NORDJYSKE BANK A 901'580'181 2.61 18.82 DE 17.00 1.87 -0.24 0.7535 SPAREKASSEN FAAB 865'844'477 4.31 25.24 DE 12.10 1.92 0.20 0.99

Table 4.19: Clean Data. Non-Eurozone. Size-sort.
36 DJURSLANDS BANK 727'267'581 1.69 16.10 DE 10.40 1.69 0.03 0.5137 OSTJYDSK BANK 571'281'494 1.83 16.49 DE 9.00 1.58 -0.46 0.8638 SKJERN BANK 556'421'156 1.95 16.78 DE 11.10 1.90 -1.54 0.9639 GRONLANDSBANKEN 489'016'279 1.89 10.46 DE 19.90 1.97 -0.22 0.6540 TOTALBANKEN 364'402'209 3.05 25.72 DE 9.30 1.80 -0.30 1.0341 SVENDBORG SPAREK 320'351'853 2.77 14.30 DE 17.40 1.83 0.16 0.4342 TONDER BANK 253'802'379 1.76 13.22 DE 11.00 1.93 0.56 0.5943 KREDITBANKEN 250'556'384 2.67 15.68 DE 14.80 2.23 0.56 0.4544 SALLING BANK 210'699'336 1.17 11.15 DE 10.10 1.63 -0.03 0.4345 NORDFYNS BANK 208'502'385 1.87 16.31 DE 9.60 1.58 -0.84 0.7446 DK COMPANY A/S 203'499'219 1.35 9.62 DE 12.10 7.13 -0.45 2.0647 VESTFYNS BANK 202'649'327 1.93 15.65 DE 10.70 1.69 0.11 0.5848 LOLLANDS BANK 198'913'273 2.98 18.70 DE 16.90 1.83 0.16 0.7749 MONS BANK 169'584'668 2.92 16.95 DE 14.10 1.60 -0.38 0.5750 VORDINGBORG BANK 137'617'205 1.32 10.04 DE 10.90 2.12 0.40 0.3751 HVIDBJERG BANK 73'600'344 1.47 10.68 DE 11.70 1.73 -0.08 0.31
Year Short Name Tot Assets:2010C ROA:2010C ROE:2010C Country Tier 1 Capital Ratio:2010C P/B:2010C Alpha:20050101:20100101 Raw Beta:20050101:201001011 2007 ROYAL BK SCOTLAN 2'502'768'023'405 0.54 15.66 GB 7.30 0.84 -2.46 1.932 BARCLAYS PLC 1'668'704'535'156 0.40 20.50 GB 7.80 1.43 -1.29 1.413 HSBC HLDGS PLC 1'614'379'679'430 0.90 16.27 GB 8.70 1.57 -0.44 0.874 UBS AG-REG 1'373'195'511'829 -0.22 -12.12 SZ 9.10 2.72 -1.32 2.025 CREDIT SUISS-REG 821'349'177'898 0.59 17.88 SZ 10.00 1.61 -0.67 1.586 LLOYDS BANKING 480'404'773'243 0.94 28.24 GB 9.50 2.20 -1.61 1.457 DANSKE BANK A/S 449'263'031'518 0.49 14.86 DE 6.42 1.31 -1.49 1.068 NORDEA BANK AB 389'054'005'248 0.85 19.29 SW 8.30 1.74 0.08 1.119 SEB AB-A 248'399'942'295 0.64 18.96 SW 9.90 1.49 -0.76 1.26
10 STANDARD CHARTER 226'200'880'794 0.94 14.92 GB 8.80 3.32 0.44 1.2511 SVENSKA HAN-A 197'004'845'745 0.85 22.04 SW 10.60 1.73 -0.33 0.7512 DNB NOR ASA 185'746'705'017 1.06 21.49 NO 7.60 1.51 -0.35 0.7313 SWEDBANK AB-A 170'368'772'061 0.81 18.75 SW 8.50 1.39 -1.68 1.2514 JYSKE BANK-REG 28'740'601'122 0.92 17.84 DE 8.10 2.19 -0.20 1.0415 BANQUE CANTO-REG 21'330'461'981 1.38 17.71 SZ 16.30 1.72 1.85 0.5216 SYDBANK 17'748'111'510 1.38 26.21 DE 8.90 2.10 -0.05 1.2017 LIECHTENSTEIN-BR 13'065'501'450 1.31 15.92 LC 9.70 1.80 -0.16 0.9418 SPAREBANK 1 SR B 12'995'422'435 1.06 10.95 NO 7.51 0.82 -0.11 0.4019 BERNER KANTO-REG 12'893'880'840 1.13 20.32 SZ 18.40 1.58 0.89 0.1320 ST GALLER KA-REG 12'111'222'865 1.14 13.45 SZ 13.90 1.61 0.93 0.9121 SPAREBANKEN VEST 9'457'723'563 0.96 17.28 NO 8.33 0.11 -0.98 0.2622 SPAREBANK 1 SMN 9'010'974'690 1.25 18.71 NO 8.30 0.80 0.02 0.4623 SPAR NORD BANK 8'502'809'425 1.12 17.47 DE 9.40 1.55 -0.05 0.6924 SPAREBANK 1 NORD 7'664'551'891 1.21 6.31 NO 8.92 0.52 -0.50 0.5625 BANK SARASIN-B 7'053'647'246 2.72 26.05 SZ 17.00 2.61 1.02 1.4426 VERWALTUNGS-U-BR 6'336'298'439 1.57 15.30 LC 16.00 1.56 -0.39 0.7427 SPAREBANKEN MORE 4'488'284'883 0.99 14.49 NO 9.34 0.58 -0.64 0.3128 SANDNES SPAREBAN 4'364'216'651 0.75 14.58 NO 10.50 0.66 -1.69 0.6429 SPAREBANKEN OST 2'776'712'895 0.95 13.92 NO 13.13 0.35 -1.47 0.4830 RINGKJOEBING LND 2'633'416'594 1.89 19.96 DE 11.20 2.43 -0.06 1.0131 SPAREBANK1 BUSKE 1'364'881'662 0.69 10.60 NO 9.66 0.28 -1.00 0.3332 NORRESUNDBY 1'289'337'527 1.60 12.97 DE 12.40 1.43 -0.43 0.6233 LAN & SPAR BANK 1'128'871'660 0.33 3.98 DE 8.60 1.51 0.55 0.3134 NORDJYSKE BANK A 1'014'735'770 1.95 14.29 DE 10.10 1.39 -0.24 0.7535 SPAREKASSEN FAAB 986'680'741 3.18 19.50 DE 11.80 2.18 0.20 0.9936 DJURSLANDS BANK 847'337'489 1.36 13.29 DE 10.10 1.64 0.03 0.5137 OSTJYDSK BANK 798'468'393 1.54 14.94 DE 8.00 1.20 -0.46 0.8638 SKJERN BANK 718'671'877 0.91 9.01 DE 11.10 1.19 -1.54 0.9639 GRONLANDSBANKEN 563'361'405 2.00 12.03 DE 16.80 2.56 -0.22 0.6540 TOTALBANKEN 396'778'102 2.37 20.92 DE 9.20 1.81 -0.30 1.0341 SVENDBORG SPAREK 350'187'718 2.25 11.69 DE 17.30 1.59 0.16 0.4342 TONDER BANK 324'477'532 1.77 15.06 DE 9.10 1.55 0.56 0.5943 KREDITBANKEN 300'349'919 2.42 15.07 DE 15.60 1.67 0.56 0.4544 SALLING BANK 249'641'413 1.01 10.33 DE 8.10 1.57 -0.03 0.4345 DK COMPANY A/S 248'985'259 1.03 7.80 DE 11.60 4.38 -0.45 2.0646 NORDFYNS BANK 236'055'261 1.28 11.42 DE 10.00 1.70 -0.84 0.7447 VESTFYNS BANK 227'361'124 1.43 11.59 DE 9.80 1.45 0.11 0.5848 LOLLANDS BANK 212'010'004 1.93 11.74 DE 13.80 1.46 0.16 0.7749 MONS BANK 171'220'729 1.71 9.44 DE 12.70 1.19 -0.38 0.5750 VORDINGBORG BANK 142'094'065 0.51 4.04 DE 9.90 1.93 0.40 0.3751 HVIDBJERG BANK 104'559'381 0.68 5.88 DE 9.50 1.61 -0.08 0.31
Year Short Name Tot Assets:2010C ROA:2010C ROE:2010C Country Tier 1 Capital Ratio:2010C P/B:2010C Alpha:20050101:20100101 Raw Beta:20050101:201001011 2008 ROYAL BK SCOTLAN 2'508'803'121'307 -1.15 -43.44 GB 10.00 0.33 -3.02 2.092 BARCLAYS PLC 2'144'574'935'871 0.27 14.63 GB 8.60 0.35 -0.06 2.013 HSBC HLDGS PLC 1'811'478'081'349 0.23 5.06 GB 8.30 1.25 -0.18 1.184 UBS AG-REG 1'351'097'504'449 -0.99 -61.35 SZ 11.00 1.31 -1.70 2.305 CREDIT SUISS-REG 784'814'951'651 -0.65 -21.77 SZ 13.30 1.03 0.06 1.276 DANSKE BANK A/S 476'110'894'394 0.03 1.00 DE 9.20 0.37 -0.44 1.487 NORDEA BANK AB 474'073'989'120 0.62 15.35 SW 9.30 0.73 0.28 1.448 LLOYDS BANKING 455'486'880'517 0.20 7.17 GB 8.00 0.80 -1.66 1.899 STANDARD CHARTER 311'820'796'949 0.82 14.57 GB 9.90 1.09 1.15 1.55
10 SEB AB-A 229'070'547'331 0.41 12.55 SW 10.10 0.50 -0.67 1.4511 SVENSKA HAN-A 196'962'379'422 0.60 16.23 SW 10.50 1.05 0.10 0.9812 DNB NOR ASA 188'581'553'609 0.56 12.25 NO 6.70 0.47 0.18 0.9013 SWEDBANK AB-A 165'294'339'550 0.64 14.12 SW 10.60 0.27 -0.93 1.8614 JYSKE BANK-REG 31'819'016'374 0.43 9.57 DE 11.00 0.61 0.21 1.1015 BANQUE CANTO-REG 23'630'281'540 1.01 14.35 SZ 16.40 1.11 1.60 0.6916 SYDBANK 20'955'693'149 0.42 8.79 DE 10.80 0.57 0.40 1.4017 LIECHTENSTEIN-BR 15'559'148'870 0.65 9.19 LC 13.50 0.92 0.17 1.1718 BERNER KANTO-REG 15'242'334'715 0.51 9.55 SZ 17.10 1.74 0.72 0.0819 ST GALLER KA-REG 15'139'943'180 0.80 9.91 SZ 13.70 1.22 0.66 0.8920 SPAREBANK 1 SR B 12'959'597'190 0.41 4.56 NO 6.44 0.41 0.30 0.5421 SPAREBANKEN VEST 9'769'656'226 0.24 4.74 NO 7.73 0.05 -0.88 0.3222 SPAR NORD BANK 9'305'678'839 0.14 2.33 DE 9.70 0.58 -0.43 0.8723 SPAREBANK 1 SMN 8'718'079'647 0.79 11.93 NO 8.10 0.32 0.45 0.5924 BANK SARASIN-B 8'521'001'162 0.78 7.96 SZ 14.50 1.68 1.05 1.2425 VERWALTUNGS-U-BR 7'651'885'780 -0.76 -8.83 LC 13.60 0.97 -0.97 1.4326 SPAREBANK 1 NORD 6'744'237'010 0.55 2.79 NO 9.10 0.18 0.02 0.7627 SPAREBANKEN MORE 4'200'129'657 0.88 13.45 NO 9.12 0.36 -0.34 0.4328 SANDNES SPAREBAN 3'264'138'906 -0.26 -5.10 NO 10.80 0.18 -0.71 0.8929 SPAREBANKEN OST 2'592'485'783 -1.63 -29.01 NO 8.39 0.19 -1.47 0.6730 RINGKJOEBING LND 2'418'423'563 1.28 13.47 DE 13.00 0.88 0.09 1.2631 SPAREBANK1 BUSKE 2'202'699'995 0.33 5.44 NO 10.58 0.13 -0.92 0.4132 NORRESUNDBY 1'319'717'849 0.25 2.05 DE 14.10 0.52 -0.24 0.5333 LAN & SPAR BANK 1'173'388'789 -0.01 -0.13 DE 19.00 1.16 -0.10 0.1434 NORDJYSKE BANK A 1'081'441'063 0.72 5.40 DE 14.30 0.57 0.07 0.7435 SPAREKASSEN FAAB 987'907'797 0.86 5.55 DE 13.10 0.65 -0.01 0.7236 DJURSLANDS BANK 875'751'257 0.28 2.91 DE 9.50 0.65 -0.53 0.5537 OSTJYDSK BANK 792'958'066 0.65 6.43 DE 9.50 0.45 -0.49 0.8238 SKJERN BANK 754'826'337 -1.06 -11.63 DE 10.20 0.32 -1.44 1.0439 GRONLANDSBANKEN 552'198'762 1.17 7.62 DE 17.30 0.93 -0.04 0.7540 TOTALBANKEN 413'140'586 -0.64 -5.81 DE 9.00 0.34 -0.42 1.2941 SVENDBORG SPAREK 369'767'550 1.32 7.37 DE 19.30 0.86 -0.03 0.2642 KREDITBANKEN 325'186'666 1.18 7.68 DE 17.40 1.01 0.02 0.4143 TONDER BANK 311'280'189 -0.59 -5.46 DE 9.30 1.07 0.02 0.4044 SALLING BANK 279'250'222 -0.08 -1.00 DE 8.60 0.82 -0.17 0.2245 NORDFYNS BANK 268'251'227 -0.42 -4.23 DE 9.40 0.53 -1.03 0.5446 DK COMPANY A/S 248'985'259 1.03 7.80 DE 11.60 4.38 0.25 2.4747 VESTFYNS BANK 240'296'439 0.64 5.38 DE 11.30 0.70 -0.35 0.6448 LOLLANDS BANK 211'454'165 0.20 1.22 DE 16.20 0.59 -0.19 0.5649 MONS BANK 175'027'936 0.58 3.15 DE 17.50 0.50 -0.47 0.5050 VORDINGBORG BANK 142'746'323 0.51 4.24 DE 11.70 0.99 -0.13 0.2251 HVIDBJERG BANK 110'644'607 0.23 2.33 DE 12.00 0.57 -0.06 0.37
Year Short Name Tot Assets:2010C ROA:2010C ROE:2010C Country Tier 1 Capital Ratio:2010C P/B:2010C Alpha:20050101:20100101 Raw Beta:20050101:201001011 2009 ROYAL BK SCOTLAN 1'911'553'404'269 -0.18 -5.28 GB 14.10 0.40 -3.02 2.092 HSBC HLDGS PLC 1'649'863'337'450 0.23 5.08 GB 10.80 1.59 -0.18 1.18

Table 4.19: Clean Data. Non-Eurozone. Size-sort.
3 BARCLAYS PLC 1'553'738'924'626 0.57 23.12 GB 13.00 0.67 -0.06 2.014 LLOYDS BANKING 1'157'482'436'656 0.39 10.73 GB 9.60 0.75 -1.66 1.895 UBS AG-REG 904'015'377'378 -0.16 -7.44 SZ 15.40 1.38 -1.70 2.306 CREDIT SUISS-REG 695'560'956'248 0.61 18.70 SZ 16.30 1.51 0.06 1.277 NORDEA BANK AB 507'544'010'752 0.47 11.55 SW 11.40 1.28 0.28 1.448 DANSKE BANK A/S 416'435'533'984 0.05 1.74 DE 14.10 0.80 -0.44 1.489 STANDARD CHARTER 304'686'980'346 0.75 13.25 GB 11.50 1.88 1.15 1.55
10 SEB AB-A 225'063'124'969 0.05 1.22 SW 13.90 0.98 -0.67 1.4511 DNB NOR ASA 219'757'637'763 0.47 9.77 NO 9.30 1.04 0.18 0.9012 SVENSKA HAN-A 206'987'310'289 0.48 12.96 SW 14.20 1.53 0.10 0.9813 SWEDBANK AB-A 174'990'531'476 -0.58 -11.95 SW 13.50 0.92 -0.93 1.8614 JYSKE BANK-REG 30'174'157'604 0.20 4.01 DE 13.50 1.05 0.21 1.1015 BANQUE CANTO-REG 24'097'177'818 0.85 12.11 SZ 17.80 1.41 1.60 0.6916 SYDBANK 21'211'152'534 0.50 9.64 DE 13.10 1.09 0.40 1.4017 BERNER KANTO-REG 16'280'248'618 0.51 9.83 SZ 17.20 1.63 0.72 0.0818 ST GALLER KA-REG 15'850'468'122 0.73 9.51 SZ 13.00 1.43 0.66 0.8919 LIECHTENSTEIN-BR 15'449'476'756 0.76 10.76 LC 13.70 1.18 0.17 1.1720 SPAREBANK 1 SR B 15'053'696'511 0.88 9.95 NO 9.60 0.75 0.30 0.5421 SPAREBANKEN VEST 11'769'840'832 0.38 7.82 NO 10.54 0.08 -0.88 0.3222 BANK SARASIN-B 10'318'375'960 0.27 3.17 SZ 16.30 1.95 1.05 1.2423 SPAREBANK 1 SMN 10'188'653'284 1.10 8.77 NO 10.45 0.61 0.45 0.5924 SPAR NORD BANK 8'672'728'858 0.18 2.88 DE 13.20 0.76 -0.43 0.8725 VERWALTUNGS-U-BR 7'841'149'635 0.50 6.59 LC 17.10 0.64 -0.97 1.4326 SPAREBANK 1 NORD 7'741'911'415 1.32 6.17 NO 11.90 0.38 0.02 0.7627 SPAREBANKEN MORE 4'988'332'007 0.82 12.04 NO 11.55 0.51 -0.34 0.4328 SANDNES SPAREBAN 3'404'531'381 0.27 5.01 NO 15.00 0.33 -0.71 0.8929 SPAREBANKEN OST 2'647'427'796 1.25 21.82 NO 14.15 0.43 -1.47 0.6730 SPAREBANK1 BUSKE 2'557'490'246 0.73 11.24 NO 12.89 0.16 -0.92 0.4131 RINGKJOEBING LND 2'409'518'601 1.29 12.09 DE 16.60 1.49 0.09 1.2632 NORRESUNDBY 1'350'896'569 0.31 2.55 DE 14.60 0.68 -0.24 0.5333 LAN & SPAR BANK 1'299'498'198 0.35 4.60 DE 15.10 1.13 -0.10 0.1434 NORDJYSKE BANK A 1'204'454'872 0.78 6.19 DE 16.40 0.83 0.07 0.7435 SPAREKASSEN FAAB 1'069'613'712 0.18 1.31 DE 15.00 0.94 -0.01 0.7236 DJURSLANDS BANK 846'034'203 0.62 6.53 DE 11.70 0.65 -0.53 0.5537 OSTJYDSK BANK 824'353'618 0.31 2.93 DE 12.00 0.48 -0.49 0.8238 SKJERN BANK 670'427'975 -1.71 -21.71 DE 10.40 0.50 -1.44 1.0439 GRONLANDSBANKEN 557'017'747 1.66 10.38 DE 18.90 0.99 -0.04 0.7540 TOTALBANKEN 422'808'495 0.25 2.37 DE 14.20 0.45 -0.42 1.2941 SVENDBORG SPAREK 414'356'765 0.72 4.44 DE 18.10 0.87 -0.03 0.2642 TONDER BANK 366'048'400 0.64 6.33 DE 11.70 0.92 0.02 0.4043 KREDITBANKEN 311'436'572 0.14 0.91 DE 17.60 0.95 0.02 0.4144 SALLING BANK 299'191'879 0.11 1.40 DE 11.70 0.80 -0.17 0.2245 NORDFYNS BANK 269'557'218 0.25 2.82 DE 13.50 0.54 -1.03 0.5446 VESTFYNS BANK 255'937'386 0.07 0.65 DE 14.40 0.69 -0.35 0.6447 DK COMPANY A/S 248'985'259 1.03 7.80 DE 11.60 4.38 0.25 2.4748 LOLLANDS BANK 235'650'640 0.74 4.70 DE 18.00 0.65 -0.19 0.5649 MONS BANK 189'741'709 0.97 5.38 DE 18.90 0.60 -0.47 0.5050 VORDINGBORG BANK 161'023'498 -0.69 -6.19 DE 14.00 1.03 -0.13 0.2251 HVIDBJERG BANK 121'661'369 0.15 1.55 DE 12.00 0.15 -0.06 0.37
Year Short Name Tot Assets:2010C ROA:2010C ROE:2010C Country Tier 1 Capital Ratio:2010C P/B:2010C Alpha:20050101:20100101 Raw Beta:20050101:201001011 2010 HSBC HLDGS PLC 1'836'462'011'108 0.54 9.53 GB 12.10 1.24 -0.18 1.182 BARCLAYS PLC 1'737'541'864'892 0.25 7.26 GB 13.50 0.63 -0.06 2.013 ROYAL BK SCOTLAN 1'695'470'595'538 -0.07 -1.47 GB 12.90 0.57 -3.02 2.094 LLOYDS BANKING 1'156'585'264'642 -0.03 -0.72 GB 11.60 0.97 -1.66 1.895 UBS AG-REG 1'055'242'739'013 0.57 17.16 SZ 17.80 1.24 -1.70 2.306 CREDIT SUISS-REG 826'736'228'200 0.49 13.59 SZ 17.20 1.25 0.06 1.277 NORDEA BANK AB 580'839'014'400 0.49 11.36 SW 11.40 1.34 0.28 1.448 DANSKE BANK A/S 431'175'697'917 0.12 3.57 DE 14.80 0.94 -0.44 1.489 STANDARD CHARTER 386'448'064'072 0.89 12.91 GB 14.00 1.65 1.15 1.55
10 SEB AB-A 242'501'275'901 0.30 6.79 SW 14.20 1.24 -0.67 1.4511 SVENSKA HAN-A 239'576'454'037 0.52 12.86 SW 16.50 1.52 0.10 0.9812 DNB NOR ASA 238'778'783'208 0.80 14.12 NO 10.10 1.20 0.18 0.9013 SWEDBANK AB-A 190'866'513'521 0.42 8.07 SW 15.20 1.15 -0.93 1.8614 JYSKE BANK-REG 32'750'422'216 0.32 5.87 DE 14.10 1.26 0.21 1.1015 BANQUE CANTO-REG 28'506'800'130 0.88 12.39 SZ 17.60 1.65 1.60 0.6916 SYDBANK 20'237'132'244 0.27 4.40 DE 14.30 1.18 0.40 1.4017 BERNER KANTO-REG 19'536'266'517 0.52 9.48 SZ 18.20 1.61 0.72 0.0818 ST GALLER KA-REG 19'532'666'938 0.61 8.07 SZ 12.80 1.42 0.66 0.8919 LIECHTENSTEIN-BR 17'757'099'853 0.46 6.16 LC 13.90 1.24 0.17 1.1720 SPAREBANK 1 SR B 17'287'163'160 1.01 9.35 NO 10.20 0.77 0.30 0.5421 BANK SARASIN-B 14'023'581'536 0.66 8.73 SZ 15.30 2.18 1.05 1.2422 SPAREBANKEN VEST 13'502'990'354 0.60 2.05 NO 10.80 0.17 -0.88 0.3223 SPAREBANK 1 SMN 12'568'843'877 1.11 14.64 NO 10.90 0.66 0.45 0.5924 SPAR NORD BANK 9'047'189'425 0.16 2.47 DE 13.20 0.79 -0.43 0.8725 SPAREBANK 1 NORD 8'821'996'456 1.23 15.08 NO 10.89 0.38 0.02 0.7626 VERWALTUNGS-U-BR 8'484'857'847 0.14 1.67 LC 19.00 0.74 -0.97 1.4327 SPAREBANKEN MORE 5'700'179'796 1.07 6.80 NO 12.03 0.50 -0.34 0.4328 SANDNES SPAREBAN 3'454'593'431 -0.06 -0.54 NO 12.60 0.39 -0.71 0.8929 SPAREBANKEN OST 3'185'025'412 1.30 8.68 NO 15.39 0.44 -1.47 0.6730 SPAREBANK1 BUSKE 2'713'542'224 1.01 2.92 NO 14.69 0.19 -0.92 0.4131 RINGKJOEBING LND 2'448'049'302 1.42 11.76 DE 18.60 1.58 0.09 1.2632 NORRESUNDBY 1'328'611'970 0.59 4.80 DE 15.82 0.66 -0.24 0.5333 NORDJYSKE BANK A 1'294'166'799 1.00 8.03 DE 17.40 0.78 0.07 0.7434 LAN & SPAR BANK 1'290'074'521 0.45 6.17 DE 15.60 0.94 -0.10 0.1435 SPAREKASSEN FAAB 1'129'421'911 -0.93 -7.58 DE 14.30 0.94 -0.01 0.7236 OSTJYDSK BANK 936'293'542 0.14 1.39 DE 12.50 0.42 -0.49 0.8237 DJURSLANDS BANK 878'757'322 0.57 5.59 DE 14.90 0.66 -0.53 0.5538 SKJERN BANK 737'149'987 0.15 2.03 DE 11.40 0.45 -1.44 1.0439 GRONLANDSBANKEN 608'273'389 1.54 9.19 DE 19.10 1.12 -0.04 0.7540 TOTALBANKEN 428'960'030 0.31 2.96 DE 15.20 0.39 -0.42 1.2941 SVENDBORG SPAREK 426'042'318 0.95 5.64 DE 19.90 0.83 -0.03 0.2642 TONDER BANK 376'011'034 0.28 2.91 DE 11.50 0.88 0.02 0.4043 SALLING BANK 333'795'646 0.27 3.78 DE 11.60 0.63 -0.17 0.2244 NORDFYNS BANK 304'420'968 0.14 1.63 DE 12.30 0.49 -1.03 0.5445 KREDITBANKEN 297'708'681 0.61 3.63 DE 21.40 0.87 0.02 0.4146 VESTFYNS BANK 272'895'606 0.25 2.28 DE 16.20 0.66 -0.35 0.6447 DK COMPANY A/S 248'985'259 1.03 7.80 DE 11.60 4.38 0.25 2.4748 LOLLANDS BANK 232'045'415 1.12 7.04 DE 18.10 0.61 -0.19 0.5649 VORDINGBORG BANK 207'740'423 0.42 4.58 DE 14.20 0.60 -0.13 0.2250 MONS BANK 188'729'235 0.34 1.87 DE 18.40 0.59 -0.47 0.5051 HVIDBJERG BANK 136'819'158 -0.82 -10.15 DE 10.00 0.73 -0.06 0.37

Table 4.20: Clean Data. Non-Eurozone. Capital-sort.
Number Year Short Name Tot Assets:2002C ROA:2002C ROE:2002C Country Tier 1 Capital Ratio:2002C P/B:2002C Alpha:20020101:20050101 Raw Beta:20020101:200701011 2002 GRONLANDSBANKEN 482'686'555 2.12 14.07 DE 28.80 1.04 1.31 0.162 LIECHTENSTEIN-BR 7'673'954'805 0.97 12.74 LC 25.30 2.30 0.38 0.353 BANK SARASIN-B 5'606'551'637 -5.47 -50.15 SZ 23.70 1.33 0.01 1.184 KREDITBANKEN 148'248'727 1.88 11.63 DE 20.90 0.89 2.73 0.255 VERWALTUNGS-U-BR 6'028'691'418 0.13 1.49 LC 20.20 1.26 0.30 0.726 DK COMPANY A/S 114'278'269 1.10 9.35 DE 19.00 0.81 6.31 0.337 NORDJYSKE BANK A 579'533'814 1.56 11.63 DE 15.50 0.88 2.19 0.348 SVENDBORG SPAREK 224'251'908 2.21 12.60 DE 15.30 0.89 2.13 0.109 LOLLANDS BANK 130'210'901 1.01 6.98 DE 15.00 0.68 2.61 0.33
10 RINGKJOEBING LND 807'858'274 2.73 16.79 DE 14.60 1.02 3.43 0.0611 MONS BANK 101'723'109 1.47 8.19 DE 14.10 0.67 2.53 0.1312 NORRESUNDBY 655'605'740 1.10 9.03 DE 13.60 0.95 2.24 0.0713 BERNER KANTO-REG 12'875'017'782 0.38 7.22 SZ 13.50 1.25 0.69 -0.0214 VORDINGBORG BANK 86'235'336 1.18 9.33 DE 12.70 0.81 2.45 0.1215 TOTALBANKEN 168'346'157 1.15 9.58 DE 12.30 0.88 2.47 0.2016 HVIDBJERG BANK 56'562'764 1.13 9.76 DE 12.20 0.74 2.52 -0.0717 SPAREKASSEN FAAB 481'938'702 1.96 12.21 DE 12.00 0.99 2.33 0.3718 UBS AG-REG 813'813'316'267 0.29 8.56 SZ 11.30 2.00 0.43 1.2119 TONDER BANK 173'333'342 1.37 11.60 DE 11.30 0.76 2.73 0.1420 SKJERN BANK 248'748'850 1.22 10.48 DE 10.70 0.89 3.27 0.1921 NORDFYNS BANK 125'939'256 1.21 13.72 DE 10.60 0.91 1.75 0.2922 DJURSLANDS BANK 386'352'315 1.15 10.82 DE 10.50 0.75 2.91 0.0023 VESTFYNS BANK 163'329'061 0.69 6.95 DE 10.30 0.81 2.21 0.1524 SPAREBANKEN MORE 2'992'090'695 0.80 10.19 NO 10.25 0.58 0.76 0.1625 SPAREBANK1 BUSKE 759'126'623 0.88 13.84 NO 9.60 0.21 0.71 0.0426 LAN & SPAR BANK 999'257'577 0.46 6.02 DE 9.50 1.07 1.18 0.1127 SPAREBANKEN OST 2'141'093'005 0.30 4.79 NO 9.48 0.44 0.84 0.1028 ST GALLER KA-REG 12'446'585'853 0.56 9.14 SZ 9.10 0.92 1.59 0.3629 HSBC HLDGS PLC 722'205'833'020 0.86 12.71 GB 9.00 2.02 -0.01 1.0030 CREDIT SUISS-REG 655'781'874'277 -0.34 -12.60 SZ 9.00 1.46 -0.31 2.0231 SALLING BANK 191'972'193 0.47 5.87 DE 8.90 0.80 1.99 0.1832 OSTJYDSK BANK 228'686'154 1.29 12.12 DE 8.80 0.82 2.27 0.1133 SANDNES SPAREBAN 1'664'788'797 0.67 9.01 NO 8.70 0.55 1.15 0.1734 SPAREBANKEN VEST 4'873'265'651 0.20 3.06 NO 8.63 0.12 1.08 0.0035 STANDARD CHARTER 107'533'318'569 0.68 11.60 GB 8.30 2.00 0.80 1.2236 SYDBANK 8'982'508'136 0.62 12.15 DE 8.30 1.03 3.02 0.2337 BARCLAYS PLC 617'984'899'353 0.59 15.02 GB 8.20 1.67 0.21 1.3838 JYSKE BANK-REG 20'614'932'467 0.36 8.05 DE 8.20 1.04 2.39 0.3339 SPAREBANK 1 SMN 4'947'775'669 0.02 0.33 NO 8.12 0.42 1.97 0.1240 SPAR NORD BANK 4'287'786'004 0.38 6.80 DE 8.00 0.91 2.46 0.2241 SEB AB-A 136'164'569'615 0.44 11.82 SW 7.88 1.12 1.07 0.7242 SPAREBANK 1 NORD 5'207'324'191 0.17 2.81 NO 7.87 0.38 1.40 0.0643 LLOYDS BANKING 387'232'942'124 0.73 19.56 GB 7.70 3.13 -0.60 1.5044 DANSKE BANK A/S 235'666'971'406 0.50 14.23 DE 7.60 1.40 0.70 0.4745 ROYAL BK SCOTLAN 631'688'862'440 0.50 8.60 GB 7.30 1.83 0.09 1.3446 SPAREBANK 1 SR B 6'810'116'750 -0.07 -1.30 NO 7.24 0.53 1.54 0.0047 NORDEA BANK AB 249'619'005'440 0.36 7.48 SW 7.10 1.03 0.70 0.9048 SWEDBANK AB-A 105'049'328'861 0.43 10.91 SW 7.10 1.41 0.76 0.7349 DNB NOR ASA 87'756'588'559 0.47 7.12 NO 7.10 1.08 1.83 0.4750 SVENSKA HAN-A 140'158'293'627 0.59 14.52 SW 6.40 1.54 0.26 0.5751 BANQUE CANTO-REG 22'406'294'348 -3.60 -104.36 SZ 5.50 0.77 1.42 0.68
Number Short Name Tot Assets:2003C ROA:2003C ROE:2003C Country Tier 1 Capital Ratio:2003C P/B:2003C Alpha:20020101:20070101 Raw Beta:20020101:200701011 2003 GRONLANDSBANKEN 392'711'382 1.98 12.14 DE 30.20 1.47 1.31 0.162 LIECHTENSTEIN-BR 7'802'582'039 1.13 15.27 LC 25.90 2.19 0.38 0.353 BANK SARASIN-B 4'855'003'895 0.89 9.57 SZ 23.40 1.51 0.01 1.184 KREDITBANKEN 164'528'953 2.97 17.83 DE 20.70 1.36 2.73 0.255 NORDJYSKE BANK A 608'306'612 2.24 16.62 DE 18.20 1.32 2.19 0.346 DK COMPANY A/S 123'630'824 1.77 14.59 DE 17.70 1.65 6.31 0.337 SVENDBORG SPAREK 255'605'800 2.73 15.85 DE 17.40 1.29 2.13 0.108 LOLLANDS BANK 138'884'367 2.63 17.53 DE 16.50 1.07 2.61 0.339 HVIDBJERG BANK 63'127'603 2.44 19.54 DE 15.70 1.04 2.52 -0.07
10 MONS BANK 116'752'677 3.27 18.34 DE 15.50 1.06 2.53 0.1311 RINGKJOEBING LND 1'010'224'301 3.40 21.96 DE 15.10 1.69 3.43 0.0612 BERNER KANTO-REG 12'481'438'980 0.37 7.11 SZ 14.70 1.27 0.69 -0.0213 VERWALTUNGS-U-BR 5'235'512'246 1.12 11.06 LC 14.30 1.59 0.30 0.7214 NORRESUNDBY 746'268'820 2.18 17.64 DE 14.20 1.30 2.24 0.0715 TOTALBANKEN 178'942'806 1.91 15.45 DE 13.80 1.07 2.47 0.2016 VORDINGBORG BANK 97'099'724 1.57 11.13 DE 13.50 1.02 2.45 0.1217 BANQUE CANTO-REG 20'567'495'452 0.48 9.72 SZ 13.40 1.35 1.42 0.6818 SPAREKASSEN FAAB 554'798'883 2.42 15.73 DE 13.00 1.20 2.33 0.3719 VESTFYNS BANK 171'733'279 1.79 17.80 DE 12.50 1.12 2.21 0.1520 TONDER BANK 185'323'776 1.69 13.39 DE 12.43 1.24 2.73 0.1421 DJURSLANDS BANK 419'467'255 2.12 18.29 DE 12.40 1.18 2.91 0.0022 NORDFYNS BANK 147'852'029 2.70 25.84 DE 12.40 1.53 1.75 0.2923 SKJERN BANK 287'012'156 2.83 23.49 DE 12.30 1.58 3.27 0.1924 UBS AG-REG 888'098'751'139 0.49 16.76 SZ 11.80 2.56 0.43 1.2125 CREDIT SUISS-REG 643'524'292'729 0.08 2.64 SZ 11.70 1.50 -0.31 2.0226 SPAREBANK1 BUSKE 750'656'550 0.77 11.37 NO 11.42 0.43 0.71 0.0427 SPAREBANKEN OST 1'846'981'043 0.84 13.47 NO 11.26 0.62 0.84 0.1028 LAN & SPAR BANK 995'496'998 0.40 5.15 DE 11.10 1.05 1.18 0.1129 SALLING BANK 188'629'596 1.50 16.76 DE 10.90 1.12 1.99 0.1830 OSTJYDSK BANK 291'263'509 2.24 20.74 DE 10.40 1.28 2.27 0.1131 SPAREBANKEN MORE 2'755'916'857 0.80 10.24 NO 10.22 0.76 0.76 0.1632 JYSKE BANK-REG 15'613'383'878 0.95 17.74 DE 10.20 1.39 2.39 0.3333 SPAREBANK 1 SMN 4'390'702'146 0.61 10.32 NO 10.12 0.67 1.97 0.1234 ST GALLER KA-REG 11'978'183'153 0.57 9.12 SZ 9.80 0.99 1.59 0.3635 LLOYDS BANKING 357'709'016'130 1.29 37.05 GB 9.50 2.60 -0.60 1.5036 SPAREBANK 1 SR B 6'267'906'993 0.80 15.21 NO 9.11 0.86 1.54 0.0037 SPAREBANK 1 NORD 4'868'873'469 0.53 9.15 NO 9.03 0.52 1.40 0.0638 SPAR NORD BANK 4'345'063'830 0.74 12.17 DE 9.00 1.27 2.46 0.2239 HSBC HLDGS PLC 823'158'217'767 0.98 13.90 GB 8.90 2.30 -0.01 1.0040 SYDBANK 9'824'400'436 0.96 17.58 DE 8.90 1.41 3.02 0.2341 STANDARD CHARTER 95'543'181'171 0.86 14.21 GB 8.60 2.57 0.80 1.2242 SANDNES SPAREBAN 1'814'873'510 0.74 10.66 NO 8.60 0.76 1.15 0.1743 SPAREBANKEN VEST 4'804'458'446 0.73 11.95 NO 8.38 0.17 1.08 0.0044 SEB AB-A 141'140'532'108 0.45 12.12 SW 7.97 1.51 1.07 0.7245 BARCLAYS PLC 629'312'197'564 0.65 17.33 GB 7.90 1.99 0.21 1.3846 DANSKE BANK A/S 244'781'562'384 0.52 15.60 DE 7.70 1.57 0.70 0.4747 ROYAL BK SCOTLAN 645'020'835'225 0.52 9.65 GB 7.40 2.10 0.09 1.3448 NORDEA BANK AB 262'190'006'272 0.58 12.38 SW 7.30 1.43 0.70 0.9049 SWEDBANK AB-A 110'575'837'753 0.65 15.75 SW 7.20 1.78 0.76 0.7350 SVENSKA HAN-A 139'051'214'268 0.64 14.89 SW 7.10 1.79 0.26 0.5751 DNB NOR ASA 84'022'596'531 0.80 13.15 NO 6.80 1.38 1.83 0.47
Short Name Tot Assets:2003C ROA:2003C ROE:2003C Country Tier 1 Capital Ratio:2003C P/B:2003C Alpha:20020101:20070101 Raw Beta:20020101:200701011 2004 GRONLANDSBANKEN 423'815'775 1.34 7.09 DE 28.00 1.16 1.31 0.162 LIECHTENSTEIN-BR 7'398'499'699 1.18 11.51 LC 27.20 1.32 0.38 0.353 BANK SARASIN-B 4'896'895'079 1.09 10.03 SZ 23.00 1.30 0.01 1.184 KREDITBANKEN 189'593'445 2.22 13.12 DE 21.00 1.45 2.73 0.255 JYSKE BANK-REG 16'830'486'123 1.16 17.96 DE 20.50 1.67 2.39 0.336 NORDJYSKE BANK A 651'517'591 1.18 8.36 DE 18.10 1.37 2.19 0.347 SVENDBORG SPAREK 263'184'353 2.16 12.10 DE 17.20 1.39 2.13 0.108 LOLLANDS BANK 151'288'651 1.89 12.17 DE 16.90 1.25 2.61 0.339 BANQUE CANTO-REG 19'751'465'610 1.07 13.77 SZ 16.50 0.67 1.42 0.68
10 BERNER KANTO-REG 12'712'080'951 0.38 6.98 SZ 15.80 1.35 0.69 -0.0211 VERWALTUNGS-U-BR 5'102'494'491 1.12 11.70 LC 15.40 1.38 0.30 0.7212 MONS BANK 122'267'071 2.62 14.29 DE 15.00 1.24 2.53 0.1313 DK COMPANY A/S 132'398'440 1.19 9.62 DE 14.30 1.84 6.31 0.3314 VORDINGBORG BANK 108'790'400 1.34 8.85 DE 14.20 1.16 2.45 0.1215 HVIDBJERG BANK 66'991'043 1.03 7.77 DE 14.20 1.12 2.52 -0.0716 NORRESUNDBY 784'338'876 1.66 13.06 DE 13.30 1.37 2.24 0.0717 LAN & SPAR BANK 1'023'523'373 0.29 3.49 DE 13.10 1.27 1.18 0.1118 SPAREKASSEN FAAB 606'135'606 3.14 19.34 DE 12.80 1.49 2.33 0.3719 TOTALBANKEN 180'468'749 1.96 14.37 DE 12.80 1.29 2.47 0.2020 CREDIT SUISS-REG 704'679'081'165 0.54 16.02 SZ 12.30 1.46 -0.31 2.0221 SANDNES SPAREBAN 2'113'186'188 0.68 10.09 NO 12.30 0.74 1.15 0.1722 RINGKJOEBING LND 1'272'092'515 2.52 17.28 DE 12.20 2.09 3.43 0.0623 NORDFYNS BANK 156'429'911 1.59 14.46 DE 12.10 1.48 1.75 0.2924 DJURSLANDS BANK 462'569'800 1.27 10.46 DE 12.00 1.36 2.91 0.0025 SKJERN BANK 327'813'805 1.73 13.98 DE 12.00 1.61 3.27 0.1926 UBS AG-REG 1'123'568'237'558 0.51 23.11 SZ 11.90 2.82 0.43 1.21

Table 4.20: Clean Data. Non-Eurozone. Capital-sort.
27 TONDER BANK 200'679'888 1.68 13.00 DE 11.80 1.29 2.73 0.1428 VESTFYNS BANK 174'101'649 1.18 10.74 DE 11.80 1.21 2.21 0.1529 SPAREBANK1 BUSKE 916'694'055 0.87 12.35 NO 11.78 0.91 0.71 0.0430 SALLING BANK 193'074'815 1.21 12.22 DE 11.50 1.19 1.99 0.1831 ST GALLER KA-REG 11'868'200'182 0.62 9.35 SZ 11.30 1.14 1.59 0.3632 SPAREBANK 1 SMN 6'222'042'574 1.03 19.32 NO 10.90 0.84 1.97 0.1233 SPAREBANKEN MORE 3'000'277'551 0.92 11.67 NO 10.75 0.79 0.76 0.1634 SPAREBANKEN VEST 5'641'245'566 0.71 11.97 NO 9.56 0.17 1.08 0.0035 OSTJYDSK BANK 335'447'620 1.60 15.20 DE 9.40 1.34 2.27 0.1136 SYDBANK 10'565'134'904 0.99 17.53 DE 9.30 16.98 3.02 0.2337 SPAREBANK 1 NORD 5'131'606'480 0.96 16.49 NO 9.24 0.73 1.40 0.0638 SPAREBANK 1 SR B 7'181'334'854 1.10 11.66 NO 9.08 2.10 1.54 0.0039 HSBC HLDGS PLC 944'246'983'355 1.12 16.15 GB 8.90 2.20 -0.01 1.0040 STANDARD CHARTER 108'534'535'015 1.15 18.97 GB 8.60 2.51 0.80 1.2241 SPAR NORD BANK 4'931'479'664 0.94 14.63 DE 8.50 1.60 2.46 0.2242 LLOYDS BANKING 401'963'368'063 0.89 23.14 GB 8.20 2.40 -0.60 1.5043 SWEDBANK AB-A 113'369'423'052 0.90 21.27 SW 8.20 1.92 0.76 0.7344 SPAREBANKEN OST 2'233'038'349 1.10 16.96 NO 7.97 1.60 0.84 0.1045 SEB AB-A 178'164'081'580 0.51 14.71 SW 7.76 1.66 1.07 0.7246 DANSKE BANK A/S 275'975'024'255 0.48 14.72 DE 7.70 1.58 0.70 0.4747 BARCLAYS PLC 760'591'801'394 0.66 20.12 GB 7.60 2.38 0.21 1.3848 SVENSKA HAN-A 146'029'920'938 0.77 16.68 SW 7.60 1.89 0.26 0.5749 DNB NOR ASA 111'839'995'773 0.96 17.28 NO 7.60 1.63 1.83 0.4750 NORDEA BANK AB 280'073'994'240 0.77 16.71 SW 7.30 1.60 0.70 0.9051 ROYAL BK SCOTLAN 831'171'643'887 0.93 17.01 GB 7.00 1.64 0.09 1.34
Short Name Tot Assets:2003C ROA:2003C ROE:2003C Country Tier 1 Capital Ratio:2003C P/B:2003C Alpha:20020101:20070101 Raw Beta:20020101:200701011 2005 BANK SARASIN-B 5'456'332'637 1.39 12.04 SZ 23.90 1.68 0.01 1.182 GRONLANDSBANKEN 463'629'352 1.70 8.97 DE 22.00 1.49 1.31 0.163 LIECHTENSTEIN-BR 8'454'954'169 1.73 13.31 LC 20.30 1.56 0.38 0.354 BANQUE CANTO-REG 22'410'305'654 1.39 16.99 SZ 17.80 1.16 1.42 0.685 SVENDBORG SPAREK 286'301'399 2.36 12.41 DE 17.30 1.86 2.13 0.106 NORDJYSKE BANK A 711'138'779 1.57 11.06 DE 16.80 1.53 2.19 0.347 LOLLANDS BANK 178'296'538 2.28 14.60 DE 16.10 1.38 2.61 0.338 KREDITBANKEN 208'736'925 2.47 14.43 DE 15.40 1.76 2.73 0.259 VERWALTUNGS-U-BR 5'293'446'906 1.48 14.05 LC 15.30 1.43 0.30 0.72
10 SPAREBANKEN OST 2'387'098'745 1.68 24.89 NO 15.22 0.74 0.84 0.1011 BERNER KANTO-REG 12'913'513'700 0.43 7.89 SZ 14.70 1.60 0.69 -0.0212 MONS BANK 152'452'532 2.37 13.27 DE 14.10 1.54 2.53 0.1313 ST GALLER KA-REG 12'284'487'734 0.90 12.13 SZ 13.50 1.44 1.59 0.3614 UBS AG-REG 1'322'661'178'538 0.74 35.99 SZ 12.80 2.80 0.43 1.2115 LAN & SPAR BANK 1'064'672'152 0.55 6.44 DE 12.80 1.37 1.18 0.1116 VORDINGBORG BANK 132'367'264 1.11 8.07 DE 12.40 1.31 2.45 0.1217 HVIDBJERG BANK 71'141'526 1.07 7.64 DE 12.30 1.25 2.52 -0.0718 NORRESUNDBY 930'282'793 1.65 12.91 DE 12.20 1.54 2.24 0.0719 SPAREKASSEN FAAB 702'212'187 3.71 21.36 DE 12.00 1.91 2.33 0.3720 SPAREBANK1 BUSKE 1'053'650'363 0.97 14.08 NO 11.82 0.92 0.71 0.0421 RINGKJOEBING LND 1'790'597'138 2.32 18.33 DE 11.60 2.61 3.43 0.0622 TONDER BANK 201'742'513 2.16 15.83 DE 11.60 1.93 2.73 0.1423 DK COMPANY A/S 149'797'988 1.87 14.41 DE 11.60 3.87 6.31 0.3324 SPAREBANKEN MORE 3'361'168'986 1.03 13.05 NO 11.43 0.86 0.76 0.1625 CREDIT SUISS-REG 860'453'185'061 0.48 14.93 SZ 11.30 1.79 -0.31 2.0226 SKJERN BANK 368'243'791 2.33 17.60 DE 11.30 1.58 3.27 0.1927 VESTFYNS BANK 182'645'652 1.52 12.86 DE 11.10 1.43 2.21 0.1528 SANDNES SPAREBAN 2'550'048'177 0.97 15.13 NO 10.80 0.96 1.15 0.1729 JYSKE BANK-REG 18'941'104'945 1.27 20.00 DE 10.60 2.10 2.39 0.3330 SALLING BANK 204'781'990 1.10 10.63 DE 10.60 1.51 1.99 0.1831 NORDFYNS BANK 174'829'841 1.79 15.47 DE 10.30 1.46 1.75 0.2932 SPAREBANK 1 NORD 6'089'246'669 1.22 20.33 NO 9.99 0.84 1.40 0.0633 SPAREBANKEN VEST 6'846'802'120 0.94 15.87 NO 9.95 0.30 1.08 0.0034 SPAR NORD BANK 6'159'822'736 1.16 17.75 DE 9.90 1.74 2.46 0.2235 DJURSLANDS BANK 590'880'662 1.53 13.39 DE 9.80 1.61 2.91 0.0036 TOTALBANKEN 232'422'791 2.81 20.06 DE 9.40 1.49 2.47 0.2037 HSBC HLDGS PLC 1'269'306'174'281 1.08 16.93 GB 9.00 1.97 -0.01 1.0038 SPAREBANK 1 SR B 8'419'137'553 1.35 13.10 NO 8.98 1.36 1.54 0.0039 SPAREBANK 1 SMN 8'837'107'830 1.18 23.22 NO 8.80 1.08 1.97 0.1240 OSTJYDSK BANK 415'425'895 1.70 15.54 DE 8.50 1.48 2.27 0.1141 SYDBANK 13'256'386'852 1.05 19.88 DE 8.10 2.07 3.02 0.2342 LLOYDS BANKING 449'906'349'443 0.84 23.47 GB 7.90 2.68 -0.60 1.5043 STANDARD CHARTER 181'776'383'325 1.06 18.60 GB 7.70 2.47 0.80 1.2244 ROYAL BK SCOTLAN 1'128'312'745'141 0.77 15.24 GB 7.60 1.58 0.09 1.3445 SVENSKA HAN-A 168'041'161'516 0.78 17.89 SW 7.60 1.97 0.26 0.5746 SEB AB-A 200'890'198'380 0.48 15.51 SW 7.53 1.98 1.07 0.7247 DNB NOR ASA 138'280'116'723 1.00 19.12 NO 7.40 1.68 1.83 0.4748 DANSKE BANK A/S 325'944'288'954 0.57 18.16 DE 7.30 1.87 0.70 0.4749 BARCLAYS PLC 1'342'594'654'523 0.47 20.71 GB 7.00 2.28 0.21 1.3850 NORDEA BANK AB 325'548'998'656 0.75 17.69 SW 6.80 1.76 0.70 0.9051 SWEDBANK AB-A 127'351'634'496 1.07 24.12 SW 6.50 2.05 0.76 0.73
Year Short Name Tot Assets:2008C ROA:2008C ROE:2008C Country Tier 1 Capital Ratio:2008C P/B:2008C Alpha:20050101:20100101 Raw Beta:20050101:201001011 2006 GRONLANDSBANKEN 489'016'279 1.89 10.46 DE 19.90 1.97 -0.22 0.652 BANK SARASIN-B 6'172'750'843 1.04 9.64 SZ 18.80 2.28 1.02 1.443 BANQUE CANTO-REG 20'528'753'126 1.56 18.89 SZ 18.30 1.77 1.85 0.524 SVENDBORG SPAREK 320'351'853 2.77 14.30 DE 17.40 1.83 0.16 0.435 BERNER KANTO-REG 12'711'075'947 0.45 8.46 SZ 17.20 1.69 0.89 0.136 NORDJYSKE BANK A 901'580'181 2.61 18.82 DE 17.00 1.87 -0.24 0.757 LOLLANDS BANK 198'913'273 2.98 18.70 DE 16.90 1.83 0.16 0.778 VERWALTUNGS-U-BR 5'934'008'742 1.49 13.81 LC 15.50 1.91 -0.39 0.749 LIECHTENSTEIN-BR 9'303'801'270 1.75 15.84 LC 15.10 2.09 -0.16 0.94
10 KREDITBANKEN 250'556'384 2.67 15.68 DE 14.80 2.23 0.56 0.4511 MONS BANK 169'584'668 2.92 16.95 DE 14.10 1.60 -0.38 0.5712 CREDIT SUISS-REG 780'585'594'807 0.87 26.43 SZ 13.90 2.08 -0.67 1.5813 SPAREBANKEN OST 2'590'368'053 0.47 6.86 NO 13.61 0.46 -1.47 0.4814 ST GALLER KA-REG 12'305'829'605 1.17 14.47 SZ 13.50 1.71 0.93 0.9115 NORRESUNDBY 1'139'122'632 2.43 19.45 DE 13.10 1.53 -0.43 0.6216 SPAREKASSEN FAAB 865'844'477 4.31 25.24 DE 12.10 1.92 0.20 0.9917 DK COMPANY A/S 203'499'219 1.35 9.62 DE 12.10 7.13 -0.45 2.0618 UBS AG-REG 1'489'448'628'129 0.55 26.16 SZ 11.90 2.89 -1.32 2.0219 HVIDBJERG BANK 73'600'344 1.47 10.68 DE 11.70 1.73 -0.08 0.3120 LAN & SPAR BANK 1'121'799'310 0.38 4.55 DE 11.20 1.68 0.55 0.3121 SKJERN BANK 556'421'156 1.95 16.78 DE 11.10 1.90 -1.54 0.9622 TONDER BANK 253'802'379 1.76 13.22 DE 11.00 1.93 0.56 0.5923 VORDINGBORG BANK 137'617'205 1.32 10.04 DE 10.90 2.12 0.40 0.3724 SPAREBANK1 BUSKE 1'184'944'242 0.75 11.01 NO 10.88 0.39 -1.00 0.3325 VESTFYNS BANK 202'649'327 1.93 15.65 DE 10.70 1.69 0.11 0.5826 SANDNES SPAREBAN 3'160'703'535 0.83 14.54 NO 10.40 0.82 -1.69 0.6427 RINGKJOEBING LND 2'316'085'613 2.82 26.81 DE 10.40 3.26 -0.06 1.0128 DJURSLANDS BANK 727'267'581 1.69 16.10 DE 10.40 1.69 0.03 0.5129 SPAREBANKEN MORE 3'855'720'769 0.93 12.67 NO 10.28 0.70 -0.64 0.3130 SALLING BANK 210'699'336 1.17 11.15 DE 10.10 1.63 -0.03 0.4331 SPAREBANK 1 NORD 6'673'115'209 1.47 7.67 NO 9.77 0.67 -0.50 0.5632 JYSKE BANK-REG 21'546'481'802 1.40 22.50 DE 9.70 2.38 -0.20 1.0433 SPAR NORD BANK 7'854'502'533 1.59 24.78 DE 9.70 2.09 -0.05 0.6934 NORDFYNS BANK 208'502'385 1.87 16.31 DE 9.60 1.58 -0.84 0.7435 SPAREBANKEN VEST 7'310'413'306 1.05 18.65 NO 9.51 0.17 -0.98 0.2636 HSBC HLDGS PLC 1'410'840'902'095 0.93 15.64 GB 9.40 1.95 -0.44 0.8737 TOTALBANKEN 364'402'209 3.05 25.72 DE 9.30 1.80 -0.30 1.0338 SYDBANK 15'390'806'371 1.42 26.71 DE 9.00 2.93 -0.05 1.2039 OSTJYDSK BANK 571'281'494 1.83 16.49 DE 9.00 1.58 -0.46 0.8640 SPAREBANK 1 SMN 7'670'646'312 1.34 22.87 NO 8.64 0.99 0.02 0.4641 DANSKE BANK A/S 367'390'289'435 0.52 15.99 DE 8.63 1.81 -1.49 1.0642 STANDARD CHARTER 201'718'859'794 0.94 15.68 GB 8.40 2.40 0.44 1.2543 LLOYDS BANKING 504'429'171'295 0.86 26.26 GB 8.20 2.89 -1.61 1.4544 SEB AB-A 214'315'065'707 0.66 20.36 SW 8.19 2.20 -0.76 1.2645 BARCLAYS PLC 1'463'362'549'540 0.48 24.56 GB 7.70 2.41 -1.29 1.4146 ROYAL BK SCOTLAN 1'279'331'402'544 0.73 15.89 GB 7.50 1.56 -2.46 1.9347 SPAREBANK 1 SR B 10'324'375'967 1.20 11.94 NO 7.39 1.00 -0.11 0.4048 NORDEA BANK AB 346'890'010'624 0.94 22.31 SW 7.10 1.98 0.08 1.1149 SVENSKA HAN-A 198'313'447'902 0.78 19.91 SW 6.80 1.98 -0.33 0.7550 DNB NOR ASA 160'294'874'787 0.96 19.18 NO 6.70 1.84 -0.35 0.7351 SWEDBANK AB-A 149'896'492'968 0.85 19.04 SW 6.50 2.14 -1.68 1.25
Year Short Name Tot Assets:2010C ROA:2010C ROE:2010C Country Tier 1 Capital Ratio:2010C P/B:2010C Alpha:20050101:20100101 Raw Beta:20050101:201001011 2007 BERNER KANTO-REG 12'893'880'840 1.13 20.32 SZ 18.40 1.58 0.89 0.13

Table 4.20: Clean Data. Non-Eurozone. Capital-sort.
2 SVENDBORG SPAREK 350'187'718 2.25 11.69 DE 17.30 1.59 0.16 0.433 BANK SARASIN-B 7'053'647'246 2.72 26.05 SZ 17.00 2.61 1.02 1.444 GRONLANDSBANKEN 563'361'405 2.00 12.03 DE 16.80 2.56 -0.22 0.655 BANQUE CANTO-REG 21'330'461'981 1.38 17.71 SZ 16.30 1.72 1.85 0.526 VERWALTUNGS-U-BR 6'336'298'439 1.57 15.30 LC 16.00 1.56 -0.39 0.747 KREDITBANKEN 300'349'919 2.42 15.07 DE 15.60 1.67 0.56 0.458 ST GALLER KA-REG 12'111'222'865 1.14 13.45 SZ 13.90 1.61 0.93 0.919 LOLLANDS BANK 212'010'004 1.93 11.74 DE 13.80 1.46 0.16 0.77
10 SPAREBANKEN OST 2'776'712'895 0.95 13.92 NO 13.13 0.35 -1.47 0.4811 MONS BANK 171'220'729 1.71 9.44 DE 12.70 1.19 -0.38 0.5712 NORRESUNDBY 1'289'337'527 1.60 12.97 DE 12.40 1.43 -0.43 0.6213 SPAREKASSEN FAAB 986'680'741 3.18 19.50 DE 11.80 2.18 0.20 0.9914 DK COMPANY A/S 248'985'259 1.03 7.80 DE 11.60 4.38 -0.45 2.0615 RINGKJOEBING LND 2'633'416'594 1.89 19.96 DE 11.20 2.43 -0.06 1.0116 SKJERN BANK 718'671'877 0.91 9.01 DE 11.10 1.19 -1.54 0.9617 SVENSKA HAN-A 197'004'845'745 0.85 22.04 SW 10.60 1.73 -0.33 0.7518 SANDNES SPAREBAN 4'364'216'651 0.75 14.58 NO 10.50 0.66 -1.69 0.6419 NORDJYSKE BANK A 1'014'735'770 1.95 14.29 DE 10.10 1.39 -0.24 0.7520 DJURSLANDS BANK 847'337'489 1.36 13.29 DE 10.10 1.64 0.03 0.5121 CREDIT SUISS-REG 821'349'177'898 0.59 17.88 SZ 10.00 1.61 -0.67 1.5822 NORDFYNS BANK 236'055'261 1.28 11.42 DE 10.00 1.70 -0.84 0.7423 SEB AB-A 248'399'942'295 0.64 18.96 SW 9.90 1.49 -0.76 1.2624 VORDINGBORG BANK 142'094'065 0.51 4.04 DE 9.90 1.93 0.40 0.3725 VESTFYNS BANK 227'361'124 1.43 11.59 DE 9.80 1.45 0.11 0.5826 LIECHTENSTEIN-BR 13'065'501'450 1.31 15.92 LC 9.70 1.80 -0.16 0.9427 SPAREBANK1 BUSKE 1'364'881'662 0.69 10.60 NO 9.66 0.28 -1.00 0.3328 LLOYDS BANKING 480'404'773'243 0.94 28.24 GB 9.50 2.20 -1.61 1.4529 HVIDBJERG BANK 104'559'381 0.68 5.88 DE 9.50 1.61 -0.08 0.3130 SPAR NORD BANK 8'502'809'425 1.12 17.47 DE 9.40 1.55 -0.05 0.6931 SPAREBANKEN MORE 4'488'284'883 0.99 14.49 NO 9.34 0.58 -0.64 0.3132 TOTALBANKEN 396'778'102 2.37 20.92 DE 9.20 1.81 -0.30 1.0333 UBS AG-REG 1'373'195'511'829 -0.22 -12.12 SZ 9.10 2.72 -1.32 2.0234 TONDER BANK 324'477'532 1.77 15.06 DE 9.10 1.55 0.56 0.5935 SPAREBANK 1 NORD 7'664'551'891 1.21 6.31 NO 8.92 0.52 -0.50 0.5636 SYDBANK 17'748'111'510 1.38 26.21 DE 8.90 2.10 -0.05 1.2037 STANDARD CHARTER 226'200'880'794 0.94 14.92 GB 8.80 3.32 0.44 1.2538 HSBC HLDGS PLC 1'614'379'679'430 0.90 16.27 GB 8.70 1.57 -0.44 0.8739 LAN & SPAR BANK 1'128'871'660 0.33 3.98 DE 8.60 1.51 0.55 0.3140 SWEDBANK AB-A 170'368'772'061 0.81 18.75 SW 8.50 1.39 -1.68 1.2541 SPAREBANKEN VEST 9'457'723'563 0.96 17.28 NO 8.33 0.11 -0.98 0.2642 NORDEA BANK AB 389'054'005'248 0.85 19.29 SW 8.30 1.74 0.08 1.1143 SPAREBANK 1 SMN 9'010'974'690 1.25 18.71 NO 8.30 0.80 0.02 0.4644 JYSKE BANK-REG 28'740'601'122 0.92 17.84 DE 8.10 2.19 -0.20 1.0445 SALLING BANK 249'641'413 1.01 10.33 DE 8.10 1.57 -0.03 0.4346 OSTJYDSK BANK 798'468'393 1.54 14.94 DE 8.00 1.20 -0.46 0.8647 BARCLAYS PLC 1'668'704'535'156 0.40 20.50 GB 7.80 1.43 -1.29 1.4148 DNB NOR ASA 185'746'705'017 1.06 21.49 NO 7.60 1.51 -0.35 0.7349 SPAREBANK 1 SR B 12'995'422'435 1.06 10.95 NO 7.51 0.82 -0.11 0.4050 ROYAL BK SCOTLAN 2'502'768'023'405 0.54 15.66 GB 7.30 0.84 -2.46 1.9351 DANSKE BANK A/S 449'263'031'518 0.49 14.86 DE 6.42 1.31 -1.49 1.06
Year Short Name Tot Assets:2010C ROA:2010C ROE:2010C Country Tier 1 Capital Ratio:2010C P/B:2010C Alpha:20050101:20100101 Raw Beta:20050101:201001011 2008 SVENDBORG SPAREK 369'767'550 1.32 7.37 DE 19.30 0.86 -0.03 0.262 LAN & SPAR BANK 1'173'388'789 -0.01 -0.13 DE 19.00 1.16 -0.10 0.143 MONS BANK 175'027'936 0.58 3.15 DE 17.50 0.50 -0.47 0.504 KREDITBANKEN 325'186'666 1.18 7.68 DE 17.40 1.01 0.02 0.415 GRONLANDSBANKEN 552'198'762 1.17 7.62 DE 17.30 0.93 -0.04 0.756 BERNER KANTO-REG 15'242'334'715 0.51 9.55 SZ 17.10 1.74 0.72 0.087 BANQUE CANTO-REG 23'630'281'540 1.01 14.35 SZ 16.40 1.11 1.60 0.698 LOLLANDS BANK 211'454'165 0.20 1.22 DE 16.20 0.59 -0.19 0.569 BANK SARASIN-B 8'521'001'162 0.78 7.96 SZ 14.50 1.68 1.05 1.24
10 NORDJYSKE BANK A 1'081'441'063 0.72 5.40 DE 14.30 0.57 0.07 0.7411 NORRESUNDBY 1'319'717'849 0.25 2.05 DE 14.10 0.52 -0.24 0.5312 ST GALLER KA-REG 15'139'943'180 0.80 9.91 SZ 13.70 1.22 0.66 0.8913 VERWALTUNGS-U-BR 7'651'885'780 -0.76 -8.83 LC 13.60 0.97 -0.97 1.4314 LIECHTENSTEIN-BR 15'559'148'870 0.65 9.19 LC 13.50 0.92 0.17 1.1715 CREDIT SUISS-REG 784'814'951'651 -0.65 -21.77 SZ 13.30 1.03 0.06 1.2716 SPAREKASSEN FAAB 987'907'797 0.86 5.55 DE 13.10 0.65 -0.01 0.7217 RINGKJOEBING LND 2'418'423'563 1.28 13.47 DE 13.00 0.88 0.09 1.2618 HVIDBJERG BANK 110'644'607 0.23 2.33 DE 12.00 0.57 -0.06 0.3719 VORDINGBORG BANK 142'746'323 0.51 4.24 DE 11.70 0.99 -0.13 0.2220 DK COMPANY A/S 248'985'259 1.03 7.80 DE 11.60 4.38 0.25 2.4721 VESTFYNS BANK 240'296'439 0.64 5.38 DE 11.30 0.70 -0.35 0.6422 UBS AG-REG 1'351'097'504'449 -0.99 -61.35 SZ 11.00 1.31 -1.70 2.3023 JYSKE BANK-REG 31'819'016'374 0.43 9.57 DE 11.00 0.61 0.21 1.1024 SYDBANK 20'955'693'149 0.42 8.79 DE 10.80 0.57 0.40 1.4025 SANDNES SPAREBAN 3'264'138'906 -0.26 -5.10 NO 10.80 0.18 -0.71 0.8926 SWEDBANK AB-A 165'294'339'550 0.64 14.12 SW 10.60 0.27 -0.93 1.8627 SPAREBANK1 BUSKE 2'202'699'995 0.33 5.44 NO 10.58 0.13 -0.92 0.4128 SVENSKA HAN-A 196'962'379'422 0.60 16.23 SW 10.50 1.05 0.10 0.9829 SKJERN BANK 754'826'337 -1.06 -11.63 DE 10.20 0.32 -1.44 1.0430 SEB AB-A 229'070'547'331 0.41 12.55 SW 10.10 0.50 -0.67 1.4531 ROYAL BK SCOTLAN 2'508'803'121'307 -1.15 -43.44 GB 10.00 0.33 -3.02 2.0932 STANDARD CHARTER 311'820'796'949 0.82 14.57 GB 9.90 1.09 1.15 1.5533 SPAR NORD BANK 9'305'678'839 0.14 2.33 DE 9.70 0.58 -0.43 0.8734 DJURSLANDS BANK 875'751'257 0.28 2.91 DE 9.50 0.65 -0.53 0.5535 OSTJYDSK BANK 792'958'066 0.65 6.43 DE 9.50 0.45 -0.49 0.8236 NORDFYNS BANK 268'251'227 -0.42 -4.23 DE 9.40 0.53 -1.03 0.5437 NORDEA BANK AB 474'073'989'120 0.62 15.35 SW 9.30 0.73 0.28 1.4438 TONDER BANK 311'280'189 -0.59 -5.46 DE 9.30 1.07 0.02 0.4039 DANSKE BANK A/S 476'110'894'394 0.03 1.00 DE 9.20 0.37 -0.44 1.4840 SPAREBANKEN MORE 4'200'129'657 0.88 13.45 NO 9.12 0.36 -0.34 0.4341 SPAREBANK 1 NORD 6'744'237'010 0.55 2.79 NO 9.10 0.18 0.02 0.7642 TOTALBANKEN 413'140'586 -0.64 -5.81 DE 9.00 0.34 -0.42 1.2943 BARCLAYS PLC 2'144'574'935'871 0.27 14.63 GB 8.60 0.35 -0.06 2.0144 SALLING BANK 279'250'222 -0.08 -1.00 DE 8.60 0.82 -0.17 0.2245 SPAREBANKEN OST 2'592'485'783 -1.63 -29.01 NO 8.39 0.19 -1.47 0.6746 HSBC HLDGS PLC 1'811'478'081'349 0.23 5.06 GB 8.30 1.25 -0.18 1.1847 SPAREBANK 1 SMN 8'718'079'647 0.79 11.93 NO 8.10 0.32 0.45 0.5948 LLOYDS BANKING 455'486'880'517 0.20 7.17 GB 8.00 0.80 -1.66 1.8949 SPAREBANKEN VEST 9'769'656'226 0.24 4.74 NO 7.73 0.05 -0.88 0.3250 DNB NOR ASA 188'581'553'609 0.56 12.25 NO 6.70 0.47 0.18 0.9051 SPAREBANK 1 SR B 12'959'597'190 0.41 4.56 NO 6.44 0.41 0.30 0.54
Year Short Name Tot Assets:2010C ROA:2010C ROE:2010C Country Tier 1 Capital Ratio:2010C P/B:2010C Alpha:20050101:20100101 Raw Beta:20050101:201001011 2009 GRONLANDSBANKEN 557'017'747 1.66 10.38 DE 18.90 0.99 -0.04 0.752 MONS BANK 189'741'709 0.97 5.38 DE 18.90 0.60 -0.47 0.503 SVENDBORG SPAREK 414'356'765 0.72 4.44 DE 18.10 0.87 -0.03 0.264 LOLLANDS BANK 235'650'640 0.74 4.70 DE 18.00 0.65 -0.19 0.565 BANQUE CANTO-REG 24'097'177'818 0.85 12.11 SZ 17.80 1.41 1.60 0.696 KREDITBANKEN 311'436'572 0.14 0.91 DE 17.60 0.95 0.02 0.417 BERNER KANTO-REG 16'280'248'618 0.51 9.83 SZ 17.20 1.63 0.72 0.088 VERWALTUNGS-U-BR 7'841'149'635 0.50 6.59 LC 17.10 0.64 -0.97 1.439 RINGKJOEBING LND 2'409'518'601 1.29 12.09 DE 16.60 1.49 0.09 1.26
10 NORDJYSKE BANK A 1'204'454'872 0.78 6.19 DE 16.40 0.83 0.07 0.7411 CREDIT SUISS-REG 695'560'956'248 0.61 18.70 SZ 16.30 1.51 0.06 1.2712 BANK SARASIN-B 10'318'375'960 0.27 3.17 SZ 16.30 1.95 1.05 1.2413 UBS AG-REG 904'015'377'378 -0.16 -7.44 SZ 15.40 1.38 -1.70 2.3014 LAN & SPAR BANK 1'299'498'198 0.35 4.60 DE 15.10 1.13 -0.10 0.1415 SANDNES SPAREBAN 3'404'531'381 0.27 5.01 NO 15.00 0.33 -0.71 0.8916 SPAREKASSEN FAAB 1'069'613'712 0.18 1.31 DE 15.00 0.94 -0.01 0.7217 NORRESUNDBY 1'350'896'569 0.31 2.55 DE 14.60 0.68 -0.24 0.5318 VESTFYNS BANK 255'937'386 0.07 0.65 DE 14.40 0.69 -0.35 0.6419 SVENSKA HAN-A 206'987'310'289 0.48 12.96 SW 14.20 1.53 0.10 0.9820 TOTALBANKEN 422'808'495 0.25 2.37 DE 14.20 0.45 -0.42 1.2921 SPAREBANKEN OST 2'647'427'796 1.25 21.82 NO 14.15 0.43 -1.47 0.6722 ROYAL BK SCOTLAN 1'911'553'404'269 -0.18 -5.28 GB 14.10 0.40 -3.02 2.0923 DANSKE BANK A/S 416'435'533'984 0.05 1.74 DE 14.10 0.80 -0.44 1.4824 VORDINGBORG BANK 161'023'498 -0.69 -6.19 DE 14.00 1.03 -0.13 0.2225 SEB AB-A 225'063'124'969 0.05 1.22 SW 13.90 0.98 -0.67 1.4526 LIECHTENSTEIN-BR 15'449'476'756 0.76 10.76 LC 13.70 1.18 0.17 1.1727 SWEDBANK AB-A 174'990'531'476 -0.58 -11.95 SW 13.50 0.92 -0.93 1.8628 JYSKE BANK-REG 30'174'157'604 0.20 4.01 DE 13.50 1.05 0.21 1.10

Table 4.20: Clean Data. Non-Eurozone. Capital-sort.
29 NORDFYNS BANK 269'557'218 0.25 2.82 DE 13.50 0.54 -1.03 0.5430 SPAR NORD BANK 8'672'728'858 0.18 2.88 DE 13.20 0.76 -0.43 0.8731 SYDBANK 21'211'152'534 0.50 9.64 DE 13.10 1.09 0.40 1.4032 BARCLAYS PLC 1'553'738'924'626 0.57 23.12 GB 13.00 0.67 -0.06 2.0133 ST GALLER KA-REG 15'850'468'122 0.73 9.51 SZ 13.00 1.43 0.66 0.8934 SPAREBANK1 BUSKE 2'557'490'246 0.73 11.24 NO 12.89 0.16 -0.92 0.4135 OSTJYDSK BANK 824'353'618 0.31 2.93 DE 12.00 0.48 -0.49 0.8236 HVIDBJERG BANK 121'661'369 0.15 1.55 DE 12.00 0.15 -0.06 0.3737 SPAREBANK 1 NORD 7'741'911'415 1.32 6.17 NO 11.90 0.38 0.02 0.7638 DJURSLANDS BANK 846'034'203 0.62 6.53 DE 11.70 0.65 -0.53 0.5539 TONDER BANK 366'048'400 0.64 6.33 DE 11.70 0.92 0.02 0.4040 SALLING BANK 299'191'879 0.11 1.40 DE 11.70 0.80 -0.17 0.2241 DK COMPANY A/S 248'985'259 1.03 7.80 DE 11.60 4.38 0.25 2.4742 SPAREBANKEN MORE 4'988'332'007 0.82 12.04 NO 11.55 0.51 -0.34 0.4343 STANDARD CHARTER 304'686'980'346 0.75 13.25 GB 11.50 1.88 1.15 1.5544 NORDEA BANK AB 507'544'010'752 0.47 11.55 SW 11.40 1.28 0.28 1.4445 HSBC HLDGS PLC 1'649'863'337'450 0.23 5.08 GB 10.80 1.59 -0.18 1.1846 SPAREBANKEN VEST 11'769'840'832 0.38 7.82 NO 10.54 0.08 -0.88 0.3247 SPAREBANK 1 SMN 10'188'653'284 1.10 8.77 NO 10.45 0.61 0.45 0.5948 SKJERN BANK 670'427'975 -1.71 -21.71 DE 10.40 0.50 -1.44 1.0449 LLOYDS BANKING 1'157'482'436'656 0.39 10.73 GB 9.60 0.75 -1.66 1.8950 SPAREBANK 1 SR B 15'053'696'511 0.88 9.95 NO 9.60 0.75 0.30 0.5451 DNB NOR ASA 219'757'637'763 0.47 9.77 NO 9.30 1.04 0.18 0.90
Year Short Name Tot Assets:2010C ROA:2010C ROE:2010C Country Tier 1 Capital Ratio:2010C P/B:2010C Alpha:20050101:20100101 Raw Beta:20050101:201001011 2010 KREDITBANKEN 297'708'681 0.61 3.63 DE 21.40 0.87 0.02 0.412 SVENDBORG SPAREK 426'042'318 0.95 5.64 DE 19.90 0.83 -0.03 0.263 GRONLANDSBANKEN 608'273'389 1.54 9.19 DE 19.10 1.12 -0.04 0.754 VERWALTUNGS-U-BR 8'484'857'847 0.14 1.67 LC 19.00 0.74 -0.97 1.435 RINGKJOEBING LND 2'448'049'302 1.42 11.76 DE 18.60 1.58 0.09 1.266 MONS BANK 188'729'235 0.34 1.87 DE 18.40 0.59 -0.47 0.507 BERNER KANTO-REG 19'536'266'517 0.52 9.48 SZ 18.20 1.61 0.72 0.088 LOLLANDS BANK 232'045'415 1.12 7.04 DE 18.10 0.61 -0.19 0.569 UBS AG-REG 1'055'242'739'013 0.57 17.16 SZ 17.80 1.24 -1.70 2.30
10 BANQUE CANTO-REG 28'506'800'130 0.88 12.39 SZ 17.60 1.65 1.60 0.6911 NORDJYSKE BANK A 1'294'166'799 1.00 8.03 DE 17.40 0.78 0.07 0.7412 CREDIT SUISS-REG 826'736'228'200 0.49 13.59 SZ 17.20 1.25 0.06 1.2713 SVENSKA HAN-A 239'576'454'037 0.52 12.86 SW 16.50 1.52 0.10 0.9814 VESTFYNS BANK 272'895'606 0.25 2.28 DE 16.20 0.66 -0.35 0.6415 NORRESUNDBY 1'328'611'970 0.59 4.80 DE 15.82 0.66 -0.24 0.5316 LAN & SPAR BANK 1'290'074'521 0.45 6.17 DE 15.60 0.94 -0.10 0.1417 SPAREBANKEN OST 3'185'025'412 1.30 8.68 NO 15.39 0.44 -1.47 0.6718 BANK SARASIN-B 14'023'581'536 0.66 8.73 SZ 15.30 2.18 1.05 1.2419 SWEDBANK AB-A 190'866'513'521 0.42 8.07 SW 15.20 1.15 -0.93 1.8620 TOTALBANKEN 428'960'030 0.31 2.96 DE 15.20 0.39 -0.42 1.2921 DJURSLANDS BANK 878'757'322 0.57 5.59 DE 14.90 0.66 -0.53 0.5522 DANSKE BANK A/S 431'175'697'917 0.12 3.57 DE 14.80 0.94 -0.44 1.4823 SPAREBANK1 BUSKE 2'713'542'224 1.01 2.92 NO 14.69 0.19 -0.92 0.4124 SYDBANK 20'237'132'244 0.27 4.40 DE 14.30 1.18 0.40 1.4025 SPAREKASSEN FAAB 1'129'421'911 -0.93 -7.58 DE 14.30 0.94 -0.01 0.7226 SEB AB-A 242'501'275'901 0.30 6.79 SW 14.20 1.24 -0.67 1.4527 VORDINGBORG BANK 207'740'423 0.42 4.58 DE 14.20 0.60 -0.13 0.2228 JYSKE BANK-REG 32'750'422'216 0.32 5.87 DE 14.10 1.26 0.21 1.1029 STANDARD CHARTER 386'448'064'072 0.89 12.91 GB 14.00 1.65 1.15 1.5530 LIECHTENSTEIN-BR 17'757'099'853 0.46 6.16 LC 13.90 1.24 0.17 1.1731 BARCLAYS PLC 1'737'541'864'892 0.25 7.26 GB 13.50 0.63 -0.06 2.0132 SPAR NORD BANK 9'047'189'425 0.16 2.47 DE 13.20 0.79 -0.43 0.8733 ROYAL BK SCOTLAN 1'695'470'595'538 -0.07 -1.47 GB 12.90 0.57 -3.02 2.0934 ST GALLER KA-REG 19'532'666'938 0.61 8.07 SZ 12.80 1.42 0.66 0.8935 SANDNES SPAREBAN 3'454'593'431 -0.06 -0.54 NO 12.60 0.39 -0.71 0.8936 OSTJYDSK BANK 936'293'542 0.14 1.39 DE 12.50 0.42 -0.49 0.8237 NORDFYNS BANK 304'420'968 0.14 1.63 DE 12.30 0.49 -1.03 0.5438 HSBC HLDGS PLC 1'836'462'011'108 0.54 9.53 GB 12.10 1.24 -0.18 1.1839 SPAREBANKEN MORE 5'700'179'796 1.07 6.80 NO 12.03 0.50 -0.34 0.4340 LLOYDS BANKING 1'156'585'264'642 -0.03 -0.72 GB 11.60 0.97 -1.66 1.8941 SALLING BANK 333'795'646 0.27 3.78 DE 11.60 0.63 -0.17 0.2242 DK COMPANY A/S 248'985'259 1.03 7.80 DE 11.60 4.38 0.25 2.4743 TONDER BANK 376'011'034 0.28 2.91 DE 11.50 0.88 0.02 0.4044 NORDEA BANK AB 580'839'014'400 0.49 11.36 SW 11.40 1.34 0.28 1.4445 SKJERN BANK 737'149'987 0.15 2.03 DE 11.40 0.45 -1.44 1.0446 SPAREBANK 1 SMN 12'568'843'877 1.11 14.64 NO 10.90 0.66 0.45 0.5947 SPAREBANK 1 NORD 8'821'996'456 1.23 15.08 NO 10.89 0.38 0.02 0.7648 SPAREBANKEN VEST 13'502'990'354 0.60 2.05 NO 10.80 0.17 -0.88 0.3249 SPAREBANK 1 SR B 17'287'163'160 1.01 9.35 NO 10.20 0.77 0.30 0.5450 DNB NOR ASA 238'778'783'208 0.80 14.12 NO 10.10 1.20 0.18 0.9051 HVIDBJERG BANK 136'819'158 -0.82 -10.15 DE 10.00 0.73 -0.06 0.37

Table 4.21: Average Values. Non-‐Eurozone. Size-‐sort.
Year Tot Assets ln(assets) ROA ROE Tier 1 Capital Ratio P/B Alpha Raw Beta2002 169'881'223 18.95 1.23 9.93 12.84 0.81 2.73 0.162003 186'873'232 19.05 2.27 17.36 15.46 1.26 2.62 0.182004 201'756'374 19.12 1.65 11.93 14.81 1.33 2.62 0.182005 228'187'733 19.25 1.91 13.45 12.93 1.69 2.62 0.182006 280'726'501 19.45 2.06 14.78 12.57 2.17 -‐0.16 0.722007 336'281'479 19.63 1.52 11.40 11.50 1.79 -‐0.16 0.722008 346'400'956 19.66 0.32 1.67 12.69 0.94 -‐0.30 0.702009 356'546'569 19.69 0.31 1.58 14.47 0.93 -‐0.30 0.702010 378'555'631 19.75 0.48 3.39 15.05 0.93 -‐0.30 0.68
Average 276'134'411 19.44 1.31 9.50 13.59 1.32 1.04 0.47Median 280'726'501 19.45 1.52 11.40 12.93 1.26 -‐0.16 0.68SD 81'102'281 0.31 0.77 5.88 1.37 0.47 1.52 0.28SE 27'034'094 0.10 0.26 1.96 0.46 0.16 0.51 0.09min 169'881'223 18.95 0.31 1.58 11.50 0.81 -‐0.30 0.16max 378'555'631 19.75 2.27 17.36 15.46 2.17 2.73 0.72
Year Tot Assets ln(assets) ROA ROE Tier 1 Capital Ratio P/B Alpha Raw Beta2002 4'347'788'461 22.19 0.50 5.33 12.95 0.86 1.46 0.232003 4'207'481'736 22.16 1.16 12.84 12.77 1.08 1.53 0.222004 4'510'208'969 22.23 1.13 12.58 13.03 1.99 1.53 0.222005 5'197'761'376 22.37 1.37 15.25 12.76 1.39 1.53 0.222006 5'691'179'166 22.46 1.49 15.76 12.07 1.52 -‐0.20 0.652007 6'558'791'439 22.60 1.36 15.50 11.10 1.31 -‐0.20 0.652008 7'175'397'163 22.69 0.34 3.66 11.72 0.66 -‐0.13 0.742009 7'721'690'481 22.77 0.65 8.02 13.77 0.84 -‐0.13 0.742010 8'775'226'053 22.90 0.61 5.93 14.21 0.86 -‐0.12 0.76
Average 6'020'613'872 22.52 0.96 10.54 12.71 1.17 0.59 0.49Median 5'691'179'166 22.46 1.13 12.58 12.77 1.08 -‐0.12 0.65SD 1'630'085'844 0.27 0.43 4.82 0.97 0.42 0.88 0.26SE 543'361'948 0.09 0.14 1.61 0.32 0.14 0.29 0.09min 4'207'481'736 22.16 0.34 3.66 11.10 0.66 -‐0.20 0.22max 8'775'226'053 22.90 1.49 15.76 14.21 1.99 1.53 0.76
Year Tot Assets ln(assets) ROA ROE Tier 1 Capital Ratio P/B Alpha Raw Beta2002 328'911'802'025 26.52 0.19 2.22 7.85 1.57 0.65 0.972003 340'020'608'025 26.55 0.66 14.86 8.90 1.86 0.65 0.972004 401'119'336'134 26.72 0.83 17.84 9.84 1.87 0.65 0.972005 525'494'565'309 26.99 0.85 19.69 8.99 2.01 0.65 0.972006 573'926'168'304 27.08 0.87 20.59 9.26 2.15 -‐0.68 1.222007 691'794'063'116 27.26 0.74 16.82 9.13 1.78 -‐0.68 1.222008 743'574'618'229 27.33 0.20 0.69 10.19 0.75 -‐0.34 1.482009 665'463'393'442 27.22 0.28 6.64 13.23 1.15 -‐0.34 1.482010 711'965'448'586 27.29 0.43 8.88 14.20 1.19 -‐0.34 1.48
Average 553'585'555'908 27.04 0.56 12.02 10.18 1.59 0.02 1.19Median 573'926'168'304 27.08 0.66 14.86 9.26 1.78 -‐0.34 1.22SD 163'300'088'521 0.32 0.29 7.59 2.12 0.47 0.61 0.24SE 54'433'362'840 0.11 0.10 2.53 0.71 0.16 0.20 0.08min 328'911'802'025 26.52 0.19 0.69 7.85 0.75 -‐0.68 0.97max 743'574'618'229 27.33 0.87 20.59 14.20 2.15 0.65 1.48
The Smallest
Middle
The Biggest
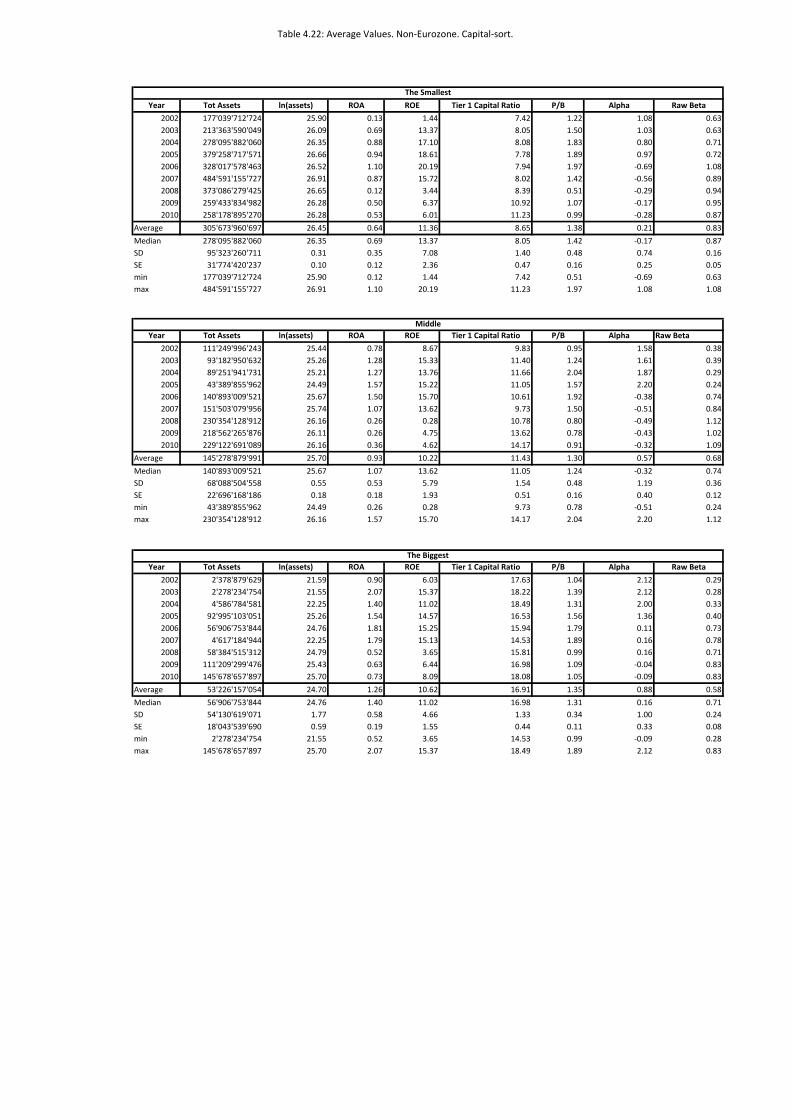
Table 4.22: Average Values. Non-‐Eurozone. Capital-‐sort.
Year Tot Assets ln(assets) ROA ROE Tier 1 Capital Ratio P/B Alpha Raw Beta2002 177'039'712'724 25.90 0.13 1.44 7.42 1.22 1.08 0.632003 213'363'590'049 26.09 0.69 13.37 8.05 1.50 1.03 0.632004 278'095'882'060 26.35 0.88 17.10 8.08 1.83 0.80 0.712005 379'258'717'571 26.66 0.94 18.61 7.78 1.89 0.97 0.722006 328'017'578'463 26.52 1.10 20.19 7.94 1.97 -‐0.69 1.082007 484'591'155'727 26.91 0.87 15.72 8.02 1.42 -‐0.56 0.892008 373'086'279'425 26.65 0.12 3.44 8.39 0.51 -‐0.29 0.942009 259'433'834'982 26.28 0.50 6.37 10.92 1.07 -‐0.17 0.952010 258'178'895'270 26.28 0.53 6.01 11.23 0.99 -‐0.28 0.87
Average 305'673'960'697 26.45 0.64 11.36 8.65 1.38 0.21 0.83Median 278'095'882'060 26.35 0.69 13.37 8.05 1.42 -‐0.17 0.87SD 95'323'260'711 0.31 0.35 7.08 1.40 0.48 0.74 0.16SE 31'774'420'237 0.10 0.12 2.36 0.47 0.16 0.25 0.05min 177'039'712'724 25.90 0.12 1.44 7.42 0.51 -‐0.69 0.63max 484'591'155'727 26.91 1.10 20.19 11.23 1.97 1.08 1.08
Year Tot Assets ln(assets) ROA ROE Tier 1 Capital Ratio P/B Alpha Raw Beta2002 111'249'996'243 25.44 0.78 8.67 9.83 0.95 1.58 0.382003 93'182'950'632 25.26 1.28 15.33 11.40 1.24 1.61 0.392004 89'251'941'731 25.21 1.27 13.76 11.66 2.04 1.87 0.292005 43'389'855'962 24.49 1.57 15.22 11.05 1.57 2.20 0.242006 140'893'009'521 25.67 1.50 15.70 10.61 1.92 -‐0.38 0.742007 151'503'079'956 25.74 1.07 13.62 9.73 1.50 -‐0.51 0.842008 230'354'128'912 26.16 0.26 0.28 10.78 0.80 -‐0.49 1.122009 218'562'265'876 26.11 0.26 4.75 13.62 0.78 -‐0.43 1.022010 229'122'691'089 26.16 0.36 4.62 14.17 0.91 -‐0.32 1.09
Average 145'278'879'991 25.70 0.93 10.22 11.43 1.30 0.57 0.68Median 140'893'009'521 25.67 1.07 13.62 11.05 1.24 -‐0.32 0.74SD 68'088'504'558 0.55 0.53 5.79 1.54 0.48 1.19 0.36SE 22'696'168'186 0.18 0.18 1.93 0.51 0.16 0.40 0.12min 43'389'855'962 24.49 0.26 0.28 9.73 0.78 -‐0.51 0.24max 230'354'128'912 26.16 1.57 15.70 14.17 2.04 2.20 1.12
Year Tot Assets ln(assets) ROA ROE Tier 1 Capital Ratio P/B Alpha Raw Beta2002 2'378'879'629 21.59 0.90 6.03 17.63 1.04 2.12 0.292003 2'278'234'754 21.55 2.07 15.37 18.22 1.39 2.12 0.282004 4'586'784'581 22.25 1.40 11.02 18.49 1.31 2.00 0.332005 92'995'103'051 25.26 1.54 14.57 16.53 1.56 1.36 0.402006 56'906'753'844 24.76 1.81 15.25 15.94 1.79 0.11 0.732007 4'617'184'944 22.25 1.79 15.13 14.53 1.89 0.16 0.782008 58'384'515'312 24.79 0.52 3.65 15.81 0.99 0.16 0.712009 111'209'299'476 25.43 0.63 6.44 16.98 1.09 -‐0.04 0.832010 145'678'657'897 25.70 0.73 8.09 18.08 1.05 -‐0.09 0.83
Average 53'226'157'054 24.70 1.26 10.62 16.91 1.35 0.88 0.58Median 56'906'753'844 24.76 1.40 11.02 16.98 1.31 0.16 0.71SD 54'130'619'071 1.77 0.58 4.66 1.33 0.34 1.00 0.24SE 18'043'539'690 0.59 0.19 1.55 0.44 0.11 0.33 0.08min 2'278'234'754 21.55 0.52 3.65 14.53 0.99 -‐0.09 0.28max 145'678'657'897 25.70 2.07 15.37 18.49 1.89 2.12 0.83
The Smallest
Middle
The Biggest

Table 4.23: Fama-‐MacBeth Regression. Eurozone. Size-‐sort.
Constant CapRatio Ln(assets) RawBeta CountryD Constant CapRatio Ln(assets) RawBeta CountryD2002 9.039 0.226 -‐0.394 0.056 -‐0.402 2002 12.449 0.27 -‐0.5 0.061 -‐0.5322003 9.782 0.296 -‐0.434 0.063 -‐0.698 2003 5.407 0.191 -‐0.21 0.235 -‐0.5362004 1.996 0.196 -‐0.117 0.26 -‐0.564 2004 1.993 -‐0.406 0.041 -‐1.082 0.7292005 2.993 0.003 -‐0.104 0.413 -‐0.255 2005 1.809 -‐0.033 -‐0.021 0.671 -‐0.2682006 5.731 -‐0.059 -‐0.157 -‐0.24 -‐0.048 2006 8.375 -‐0.159 -‐0.205 0.225 -‐0.2742007 7.6 -‐0.103 -‐0.21 -‐0.331 0.004 2007 5.81 -‐0.111 -‐0.128 -‐0.046 0.0892008 -‐1.984 -‐0.013 0.103 -‐0.299 -‐0.494 2008 1.025 0.116 -‐0.04 -‐0.146 -‐0.0642009 -‐2.62 0.127 0.092 -‐0.558 -‐0.539 2009 -‐1.582 0.018 0.086 -‐0.021 -‐0.0562010 3.625 0.056 -‐0.13 -‐0.154 -‐0.282 2010 -‐1.799 0.114 0.049 -‐0.03 -‐0.224
Average 4.02 0.08 -‐0.15 -‐0.09 -‐0.36 Average 3.72 0.00 -‐0.10 -‐0.01 -‐0.13
Constant CapRatio Ln(assets) RawBeta CountryD Constant CapRatio Ln(assets) RawBeta CountryD2002 192.987 7.078 -‐8.973 -‐0.175 -‐10.317 2002 -‐14.764 -‐0.238 0.654 -‐0.058 0.052003 234.474 10.779 -‐11.269 -‐8.789 -‐19.873 2003 -‐5.042 -‐0.413 0.369 -‐0.879 0.5522004 -‐7.638 4.744 -‐0.623 2.826 -‐10.827 2004 3.603 -‐0.406 0.041 -‐1.082 0.7292005 9.896 1.58 -‐0.438 6.108 -‐6.397 2005 9.998 -‐0.313 -‐0.231 -‐0.788 0.4962006 19.308 -‐0.668 0.409 -‐6.724 2.564 2006 3.147 -‐0.168 -‐0.154 -‐0.931 -‐0.1822007 1.739 0.21 0.875 -‐11.17 5.931 2007 8.692 -‐0.308 -‐0.218 -‐0.78 -‐0.0482008 -‐45.958 -‐2.036 2.903 -‐7.989 -‐14.092 2008 2.771 -‐0.463 0.045 -‐0.206 0.472009 -‐91.815 11.146 0.632 -‐18.176 -‐30.449 2009 1.337 -‐0.187 0.021 -‐0.121 -‐0.0392010 26.452 1.691 -‐1.304 -‐0.032 -‐1.955 2010 1.073 0.01 -‐0.039 -‐0.106 -‐0.441
Average 37.72 3.84 -‐1.98 -‐4.90 -‐9.49 Average 1.20 -‐0.28 0.05 -‐0.55 0.18
Constant CapRatio Ln(assets) RawBeta CountryD Constant CapRatio Ln(assets) RawBeta CountryD2002 -‐1.798 0.048 0.085 -‐0.144 0.402 2002 -‐2.724 0.049 0.243 -‐2.043 0.3262003 1.255 -‐0.036 -‐0.013 -‐0.149 0.342 2003 0.724 0.016 0.118 -‐2.044 -‐0.1742004 0.788 0.08 -‐0.039 0.286 0.113 2004 5.27 0.078 -‐0.102 -‐1.3 -‐0.9032005 3.538 0.122 -‐0.159 0.343 0.136 2005 -‐5.132 -‐0.014 0.351 -‐1.118 -‐0.8242006 -‐2.199 0.19 0.048 0.468 -‐0.111 2006 -‐8.175 -‐0.051 0.541 -‐2.312 -‐0.12007 2.984 0.103 -‐0.138 0.658 -‐0.345 2007 -‐9.598 -‐0.283 0.676 -‐2.981 0.1672008 -‐0.117 0.103 -‐0.022 0.44 -‐0.636 2008 1.521 -‐0.185 0.111 -‐1.551 1.0882009 1.567 0.038 -‐0.073 0.131 -‐0.429 2009 -‐1.542 0.172 0.1 -‐1.419 0.2892010 3.344 0.433 -‐0.278 -‐0.223 -‐1.922 2010 3.997 0.061 -‐0.104 -‐1.057 0.558
Average 1.04 0.12 -‐0.07 0.20 -‐0.27 Average -‐1.74 -‐0.02 0.21 -‐1.76 0.05
Constant CapRatio Ln(assets) RawBeta CountryD Constant CapRatio Ln(assets) RawBeta CountryD2002 -‐17.881 -‐0.308 1.235 1.341 7.099 2002 8.419 0.003 -‐0.295 -‐0.999 0.172003 9.365 -‐1.127 0.373 1.923 6.052 2003 4.433 -‐0.024 -‐0.113 -‐1.101 -‐0.152004 2.222 -‐0.35 0.328 8.776 1.792 2004 0.254 -‐0.012 0.062 -‐1.473 0.1812005 31.386 -‐0.481 -‐0.693 7.298 5.419 2005 6.671 -‐0.017 -‐0.197 -‐1.38 0.3162006 -‐66.173 -‐0.222 3.134 6.868 5.027 2006 6.947 0.05 -‐0.262 -‐1.258 0.3242007 -‐27.883 -‐0.933 1.828 6.599 -‐0.114 2007 9.226 0.157 -‐0.397 -‐0.913 0.1162008 12.077 0.499 -‐0.72 11.277 -‐6.969 2008 0.506 0.067 -‐0.077 0.529 1.0462009 79.458 -‐1.432 -‐3.22 14.471 -‐8.042 2009 -‐1.61 0.126 -‐0.009 0.326 1.1772010 52.349 10.305 -‐5.586 -‐6.16 -‐42.244 2010 2.709 0.06 -‐0.169 0.602 1.076
Average 8.32 0.66 -‐0.37 5.82 -‐3.55 Average 4.17 0.05 -‐0.16 -‐0.63 0.47
Constant CapRatio Ln(assets) RawBeta CountryD Constant CapRatio Ln(assets) RawBeta CountryD2002 -‐3.952 0.1 0.157 0.303 0.166 2002 -‐0.748 0.106 0.068 -‐1.245 1.3442003 -‐5.893 0.15 0.226 0.456 0.066 2003 -‐2.769 -‐0.037 0.202 -‐0.233 1.1272004 0.72 0.065 -‐0.031 -‐0.026 -‐0.054 2004 -‐1.956 0.039 0.135 -‐0.056 1.4992005 0.11 0.101 -‐0.01 0.311 0.045 2005 4.798 0.075 -‐0.172 -‐0.134 0.6842006 -‐3.05 0.123 0.124 0.025 0.07 2006 1.041 0.03 -‐0.003 0.591 0.8772007 -‐3.286 0.109 0.122 0.709 0.243 2007 7.898 0.088 -‐0.309 -‐0.333 0.9682008 3.452 0.044 -‐0.141 -‐0.075 -‐0.341 2008 3.19 0.016 -‐0.092 -‐0.651 0.9022009 2.776 0.012 -‐0.103 -‐0.048 -‐0.154 2009 5.291 0.014 -‐0.186 -‐0.525 0.8422010 -‐0.777 0.049 0.038 -‐0.368 -‐0.218 2010 4.401 -‐0.041 -‐0.132 -‐0.428 0.652
Average -‐1.10 0.08 0.04 0.14 -‐0.02 Average 2.74 0.02 -‐0.07 -‐0.22 0.94
Constant CapRatio Ln(assets) RawBeta CountryD Constant CapRatio Ln(assets) RawBeta CountryD2002 -‐55.347 0.843 2.416 6.446 4.865 2002 -‐8.112 0.316 0.251 2.151 -‐0.3012003 -‐84.255 1.806 3.379 7.589 3.385 2003 -‐10.223 0.085 0.438 3.4 -‐0.9472004 15.08 0.115 -‐0.345 1.65 -‐0.099 2004 -‐0.618 -‐0.01 0.053 2.369 -‐1.2612005 7.587 0.218 0.001 9.539 2.04 2005 -‐5.202 0.051 0.231 2.305 -‐0.7572006 -‐40.591 0.409 2.023 3.395 4.252 2006 -‐0.894 0.065 0.032 0.214 -‐0.1642007 -‐33.885 0.762 1.43 10.447 6.735 2007 -‐0.488 0.14 -‐0.014 0.19 -‐0.0952008 57.639 0.191 -‐2.222 -‐0.73 -‐3.141 2008 2.268 0.035 -‐0.114 0.532 -‐0.0522009 63.557 -‐0.238 -‐2.342 -‐0.721 -‐0.283 2009 1.648 0.075 -‐0.105 0.502 0.0822010 -‐24.352 0.368 1.229 -‐5.12 -‐1.686 2010 2.285 0.079 -‐0.13 0.39 0.002
Average -‐10.51 0.50 0.62 3.61 1.79 Average -‐2.15 0.09 0.07 1.34 -‐0.39
Eurozone: Size-‐Sort
ROECoefficients
AlphaCoefficients
ROECoefficients
AlphaCoefficients
Smallest
ROACoefficients
P/BCoefficients
AlphaCoefficients
Biggest
Middle
ROACoefficients
P/BCoefficients
ROACoefficients
ROECoefficients
P/BCoefficients

Table 4.24: Fama-‐MacBeth Regression. Eurozone. Capital-‐sort.
Constant CapRatio Ln(assets) RawBeta CountryD Constant CapRatio Ln(assets) RawBeta CountryD2002 2.167 0.005 -‐0.065 -‐0.035 -‐0.073 2002 -‐3.201 -‐0.052 0.321 -‐2.699 -‐0.8492003 2.669 -‐0.074 -‐0.063 0.157 -‐0.021 2003 -‐2.765 -‐0.015 0.293 -‐2.57 -‐0.7012004 2.345 0.081 -‐0.103 0.07 0.195 2004 -‐7.869 0.135 0.425 -‐2.57 -‐0.4762005 2.426 0.146 -‐0.124 0.069 0.064 2005 -‐1.536 0.157 0.083 -‐0.702 0.0392006 -‐1.043 0.217 0.014 -‐0.488 -‐0.015 2006 2.246 0.087 -‐0.049 -‐0.312 0.3642007 6.879 0.014 -‐0.261 0.58 -‐0.308 2007 4.546 0.181 -‐0.206 -‐0.001 1.0692008 1.867 0.009 -‐0.048 -‐0.013 -‐0.73 2008 3.185 0.021 -‐0.098 -‐0.266 0.6742009 0.935 0.07 -‐0.044 -‐0.291 -‐0.112 2009 -‐0.92 -‐0.028 0.112 -‐0.562 0.0682010 1.808 0 -‐0.053 -‐0.01 -‐0.132 2010 -‐1.033 0.152 0.011 -‐0.183 -‐0.033
Average 2.23 0.05 -‐0.08 0.00 -‐0.13 Average -‐0.82 0.07 0.10 -‐1.10 0.02
Constant CapRatio Ln(assets) RawBeta CountryD Constant CapRatio Ln(assets) RawBeta CountryD2002 56.488 -‐1.105 -‐1.564 3.207 2.435 2002 7.615 -‐0.073 -‐0.247 0.71 -‐0.0522003 31.672 -‐1.611 -‐0.402 4.773 1.874 2003 -‐0.88 0.003 0.101 -‐1.282 -‐0.1542004 24.948 -‐0.402 -‐0.487 3.517 3.016 2004 0.643 -‐0.035 0.051 -‐1.073 -‐0.2682005 47.119 -‐0.661 -‐1.311 7.51 2.032 2005 4.456 -‐0.111 -‐0.077 -‐0.633 -‐0.3362006 -‐12.639 0.156 1.165 -‐5.126 4.641 2006 5.051 -‐0.014 -‐0.158 -‐0.993 -‐0.232007 81.503 -‐2.207 -‐2.08 7.304 0.609 2007 6.046 0.158 -‐0.278 -‐0.735 0.1772008 83.265 -‐0.159 -‐2.995 -‐2.05 -‐7.475 2008 -‐0.69 0.127 -‐0.016 -‐0.258 -‐0.2082009 -‐36.009 3.039 0.633 -‐8.629 -‐5.335 2009 11.416 0.263 -‐0.671 2.197 -‐0.4862010 -‐9.815 0.577 0.339 1.647 0.401 2010 -‐1.434 0.274 -‐0.048 -‐0.295 -‐0.536
Average 29.61 -‐0.26 -‐0.74 1.35 0.24 Average 3.58 0.07 -‐0.15 -‐0.26 -‐0.23
Constant CapRatio Ln(assets) RawBeta CountryD Constant CapRatio Ln(assets) RawBeta CountryD2002 -‐0.798 0.158 0.009 -‐0.158 0.04 2002 -‐1.875 0.251 0.068 -‐0.457 0.5282003 -‐0.943 0.384 -‐0.059 -‐0.041 0.02 2003 3.759 0.641 -‐0.293 0.206 0.9792004 -‐0.483 0.254 -‐0.039 0.152 -‐0.281 2004 -‐3.365 0.963 -‐0.099 0.369 -‐0.512005 2.082 0.251 -‐0.135 0.26 -‐0.275 2005 15.259 -‐2.169 0.201 -‐1.389 -‐0.322006 3.1 -‐0.031 -‐0.095 0.418 -‐0.015 2006 9.26 -‐0.582 -‐0.002 -‐1.977 -‐0.0462007 4.604 -‐0.373 -‐0.057 0.583 -‐0.014 2007 14.991 -‐1.453 0.03 -‐2.634 0.472008 3.379 -‐0.408 0.033 -‐0.294 -‐0.013 2008 2.437 -‐0.12 -‐0.008 -‐0.372 0.7672009 4.652 -‐0.427 -‐0.02 0.237 -‐0.322 2009 -‐7.682 0.447 0.217 -‐1.081 -‐0.2942010 -‐1.151 0.056 0.039 -‐0.063 -‐0.597 2010 -‐5.598 0.22 0.22 -‐1.366 1.425
Average 1.60 -‐0.02 -‐0.04 0.12 -‐0.16 Average 3.02 -‐0.20 0.04 -‐0.97 0.33
Constant CapRatio Ln(assets) RawBeta CountryD Constant CapRatio Ln(assets) RawBeta CountryD2002 -‐10.421 2.357 0.089 -‐0.102 0.301 2002 0.58 -‐0.04 0.011 0.135 0.1392003 9.435 5.891 -‐1.849 0.383 -‐2.652 2003 -‐5.791 0.693 0.052 -‐0.434 -‐0.0632004 -‐9.278 3.164 -‐0.231 5.696 -‐5.743 2004 7.563 -‐0.823 0.01 -‐0.865 0.2932005 52.491 -‐4.437 -‐0.157 3.844 -‐0.002 2005 -‐11.782 1.51 0.065 -‐0.988 -‐0.2822006 57.973 -‐7.997 0.56 7.091 6.204 2006 2.957 -‐0.119 -‐0.057 -‐1.012 0.1572007 18.287 -‐4.291 0.931 7.289 2.927 2007 11.258 -‐0.604 -‐0.263 -‐0.16 -‐0.5212008 54.188 -‐6.522 0.484 -‐3.615 2.095 2008 6.426 -‐0.189 -‐0.213 0.46 1.1682009 145.38 -‐14.547 -‐0.662 13.334 1.648 2009 -‐5.673 0.587 0.002 -‐0.325 0.0032010 -‐41.114 2.201 1.045 -‐1.509 -‐12.142 2010 2.078 0.064 -‐0.124 0.343 2.505
Average 30.77 -‐2.69 0.02 3.60 -‐0.82 Average 0.85 0.12 -‐0.06 -‐0.32 0.38
Constant CapRatio Ln(assets) RawBeta CountryD Constant CapRatio Ln(assets) RawBeta CountryD2002 -‐3.408 0.521 0.012 0.065 0.062 2002 -‐3.175 1.004 -‐0.079 0.042 0.4892003 -‐2.799 0.511 -‐0.013 0.259 -‐0.047 2003 -‐0.631 0.05 0.063 0.469 -‐0.6162004 0.129 0.091 -‐0.018 0.279 0.197 2004 -‐5.291 0.308 0.218 -‐0.67 1.0772005 -‐0.465 0.242 -‐0.031 0.302 0.173 2005 0.164 0.227 -‐0.019 0.541 0.672006 -‐0.808 0.324 -‐0.032 0.021 -‐0.079 2006 1.709 0.481 -‐0.147 0.641 -‐0.0182007 0.334 -‐0.196 0.086 -‐0.535 -‐0.108 2007 7.782 -‐0.418 -‐0.137 0.255 -‐0.1992008 2.658 -‐0.157 -‐0.051 0.16 -‐0.084 2008 -‐1.043 -‐0.587 0.405 -‐3.706 3.0482009 -‐1.772 0.423 -‐0.021 -‐0.728 -‐0.403 2009 1.488 0.235 -‐0.074 -‐0.675 0.4962010 -‐7.234 0.727 0.132 -‐2.098 -‐0.684 2010 4.543 0.105 -‐0.184 -‐0.267 0.656
Average -‐1.49 0.28 0.01 -‐0.25 -‐0.11 Average 0.62 0.16 0.01 -‐0.37 0.62
Constant CapRatio Ln(assets) RawBeta CountryD Constant CapRatio Ln(assets) RawBeta CountryD2002 -‐91.925 13.96 0.368 1.342 -‐4.008 2002 -‐14.199 0.615 0.447 -‐0.802 -‐0.1092003 -‐72.437 10.478 0.38 6.069 -‐5.417 2003 2.676 0.185 -‐0.089 -‐0.949 0.4072004 -‐21.293 0.063 1.234 1.397 5.302 2004 10.958 -‐0.106 -‐0.418 0.972 -‐0.7992005 -‐8.594 2.748 -‐0.066 6.353 3.418 2005 1.73 0.358 -‐0.136 0.22 -‐0.8412006 -‐18.601 4.657 -‐0.122 3.207 -‐0.218 2006 5.514 0.249 -‐0.296 0.15 -‐0.5772007 53.316 1.22 -‐2.071 5.028 -‐0.677 2007 -‐2.524 -‐0.05 0.151 -‐1.173 -‐0.5832008 22.004 1.408 -‐1.34 8.775 -‐7.871 2008 -‐4.718 0.098 0.151 -‐0.034 0.4512009 -‐56.276 9.9 -‐0.149 -‐13.733 -‐3.401 2009 -‐2.744 0.374 -‐0.018 0.183 0.4952010 -‐153.456 17.644 1.972 -‐45.263 -‐13.082 2010 6.671 -‐0.272 -‐0.187 -‐0.115 -‐0.11
Average -‐38.58 6.90 0.02 -‐2.98 -‐2.88 Average 0.37 0.16 -‐0.04 -‐0.17 -‐0.19
Eurozone: Capital-‐Sort
P/BCoefficients
ROECoefficients
AlphaCoefficients
ROACoefficients
Middle
ROACoefficients
P/BCoefficients
ROECoefficients
AlphaCoefficients
Smallest
ROECoefficients
AlphaCoefficients
Biggest
ROACoefficients
P/BCoefficients

Table 4.25: Fama-‐MacBeth Regressions. Non-‐Eurozone. Size-‐sort.
Constant CapRatio Ln(assets) RawBeta CountryD Constant CapRatio Ln(assets) RawBeta CountryD2002 -‐7.716 0.443 0.186 0.031 -‐2.222 2002 -‐0.885 0.103 0.042 0.694 -‐0.592003 -‐1.621 0.178 0.037 -‐0.047 -‐1.135 2003 -‐5.546 0.197 0.219 0.172 -‐1.0162004 3.098 0.022 -‐0.1 0.203 -‐0.324 2004 -‐5.417 0.039 0.264 0.122 -‐0.5422005 2.053 0.101 -‐0.078 0.059 -‐0.624 2005 0.891 -‐0.03 0.046 0.191 -‐0.012006 3.75 0.061 -‐0.127 -‐0.034 -‐0.258 2006 3.49 -‐0.028 -‐0.064 0.462 0.2142007 1.874 0.074 -‐0.05 -‐0.336 -‐0.389 2007 6.809 -‐0.011 -‐0.212 0.551 0.1682008 7.494 -‐0.007 -‐0.546 -‐0.375 -‐0.587 2008 -‐0.428 -‐0.022 0.065 -‐0.306 0.5882009 -‐0.216 -‐0.046 0.071 -‐0.579 0.37 2009 1.902 -‐0.054 0.017 -‐0.409 0.5562010 1.581 -‐0.014 -‐0.022 -‐0.284 0.296 2010 2.42 0.028 -‐0.043 -‐0.333 0.078
Average 1.14 0.09 -‐0.07 -‐0.15 -‐0.54 Average 0.36 0.02 0.04 0.13 -‐0.06
Constant CapRatio Ln(assets) RawBeta CountryD Constant CapRatio Ln(assets) RawBeta CountryD2002 -‐224.467 12.43 5.459 -‐0.826 -‐60.253 2002 12.983 0.211 -‐0.513 -‐0.646 -‐0.0112003 -‐63.079 4.073 1.827 -‐1.117 -‐23.636 2003 11.081 -‐0.048 -‐0.361 -‐0.713 0.42004 1.56 0.17 0.497 2.076 -‐1.99 2004 5.959 0.051 -‐0.19 -‐0.867 -‐0.0192005 -‐10.968 -‐0.483 1.444 -‐4.944 8.655 2005 9.137 -‐0.026 -‐0.285 -‐0.853 0.3672006 35.254 -‐0.758 -‐0.468 2.453 8.688 2006 3.615 0.092 -‐0.131 -‐1.462 0.4462007 -‐3.314 1.874 0.422 -‐4.011 -‐16.613 2007 3.458 0.101 -‐0.134 -‐1.346 0.6912008 154.796 0.893 -‐4.771 -‐19.528 -‐36.137 2008 4.336 0.025 -‐0.099 -‐1.572 0.1532009 -‐57.805 -‐0.469 3.42 -‐14.353 3.975 2009 8.635 -‐0.085 -‐0.221 -‐1.401 0.5412010 -‐6.995 0.271 0.671 -‐4.756 5.663 2010 3.819 0.04 -‐0.086 -‐1.649 0.081
Average -‐19.45 2.00 0.94 -‐5.00 -‐12.41 Average 7.00 0.04 -‐0.22 -‐1.17 0.29
Constant CapRatio Ln(assets) RawBeta CountryD Constant CapRatio Ln(assets) RawBeta CountryD2002 15.088 0.026 -‐0.651 -‐4.509 0.955 2002 0.372 0.039 -‐0.005 -‐0.121 0.4942003 9.181 0.069 -‐0.406 -‐0.153 -‐0.244 2003 -‐0.151 0.068 0.015 0.008 0.0982004 6.868 0 -‐0.267 0.577 -‐0.21 2004 -‐35.542 0.044 1.717 3.13 -‐4.6792005 8.032 -‐0.024 -‐0.298 0.95 -‐0.11 2005 5.574 -‐0.054 -‐0.171 0.585 0.5132006 10.097 -‐0.043 -‐0.412 1.588 -‐0.098 2006 2.826 -‐0.027 -‐0.099 1.701 0.3962007 2.47 0.083 -‐0.127 1.341 -‐0.324 2007 3.489 0.024 -‐0.158 1.479 0.3782008 -‐4.202 0.064 0.173 0.051 -‐0.393 2008 -‐1.6 0.087 0.052 -‐0.027 0.4732009 0.894 -‐0.039 0.01 0.14 -‐0.097 2009 -‐2.003 0.088 0.068 0.036 0.4012010 -‐6.291 0.07 0.279 -‐0.264 -‐0.62 2010 -‐2.572 0.068 0.099 0.189 0.437
Average 4.68 0.02 -‐0.19 -‐0.03 -‐0.13 Average -‐3.29 0.04 0.17 0.78 -‐0.17
Constant CapRatio Ln(assets) RawBeta CountryD Constant CapRatio Ln(assets) RawBeta CountryD2002 110.114 0.03 -‐4.518 -‐42.2 10.522 2002 3.118 -‐0.021 -‐0.054 -‐0.018 -‐0.8942003 9.192 0.533 -‐0.063 -‐2.05 -‐5.675 2003 3.283 0.005 -‐0.069 -‐0.369 -‐1.0222004 -‐11.845 -‐0.136 1.219 4.84 -‐5.989 2004 5.084 -‐0.03 -‐0.134 -‐0.247 -‐0.7412005 -‐25.011 -‐0.056 1.903 5.718 -‐8.543 2005 8.983 -‐0.162 -‐0.25 0.574 -‐0.1452006 6.724 -‐0.576 0.422 11.976 -‐4.663 2006 1.655 -‐0.04 -‐0.086 0.421 1.0612007 -‐62.499 1.151 2.755 8.941 -‐7.383 2007 1.045 -‐0.014 -‐0.07 0.39 0.9132008 -‐104.201 1.111 4.376 -‐1.326 -‐6.573 2008 -‐9.426 0.112 0.36 0.032 -‐0.2672009 -‐12.837 -‐0.102 1.029 -‐0.652 -‐0.91 2009 -‐5.177 0.031 0.207 -‐0.087 0.2982010 -‐64.751 0.498 2.943 -‐2.142 -‐3.232 2010 -‐3.235 -‐0.01 0.141 -‐0.019 0.431
Average -‐17.23 0.27 1.12 -‐1.88 -‐3.61 Average 0.59 -‐0.01 0.00 0.08 -‐0.04
Constant CapRatio Ln(assets) RawBeta CountryD Constant CapRatio Ln(assets) RawBeta CountryD2002 -‐4.924 0.095 0.275 -‐1.531 0 2002 -‐0.153 0.001 0.049 0.155 02003 3.425 0.017 -‐0.077 0.209 0 2003 -‐1.989 0.007 0.158 0.824 02004 -‐0.388 0.011 0.092 0.661 0 2004 0.395 -‐0.009 0.047 1.12 02005 -‐4.541 0.011 0.313 1.878 0 2005 5.154 -‐0.003 -‐0.206 2.957 02006 -‐3.597 0.072 0.251 -‐0.13 0 2006 16.591 0.082 -‐0.916 3.124 02007 -‐6.774 0.102 0.372 -‐0.157 0 2007 9.045 0.071 -‐0.473 1.586 02008 0.653 0.145 -‐0.12 0.25 0 2008 10.829 0.038 -‐0.583 1.443 02009 -‐0.464 0.166 -‐0.099 0.459 0 2009 8.841 0.022 -‐0.472 1.433 02010 -‐6.936 0.101 0.287 0.382 0 2010 7.941 0.01 -‐0.414 1.409 0
Average -‐2.62 0.08 0.14 0.22 0.00 Average 8.40 0.03 -‐0.43 1.87 0.00
Constant CapRatio Ln(assets) RawBeta CountryD Constant CapRatio Ln(assets) RawBeta CountryD2002 -‐16.876 0.159 1.348 -‐3.91 0 2002 -‐2.001 0.147 0.14 1.271 02003 6.158 -‐0.366 0.849 4.43 0 2003 17.955 -‐0.003 0.852 4.89 02004 -‐22.592 -‐0.351 2.023 7.181 0 2004 15.879 -‐0.037 -‐0.714 4.952 02005 -‐38.734 -‐0.53 2.95 14.806 0 2005 16.227 -‐0.056 -‐0.718 4.919 02006 -‐40.171 -‐0.31 3.073 -‐0.696 0 2006 6.269 0.041 -‐0.344 -‐0.403 02007 -‐68.842 -‐0.084 4.199 -‐0.829 0 2007 6.437 0.034 -‐0.343 -‐0.421 02008 24.798 0.974 -‐1.891 2.031 0 2008 5.272 0.04 -‐0.317 0.155 02009 25.97 1.223 -‐2.265 3.202 0 2009 4.79 0.043 -‐0.297 0.145 02010 -‐74.233 0.613 3.388 2.786 0 2010 6.425 0.039 -‐0.377 0.126 0
Average -‐23.46 0.15 1.54 4.11 0.00 Average 9.91 0.01 -‐0.28 1.80 0.00
Non-‐Eurozone: Size-‐Sort
ROECoefficients
AlphaCoefficients
ROECoefficients
AlphaCoefficients
Smallest
ROACoefficients
P/BCoefficients
AlphaCoefficients
Biggest
Middle
ROACoefficients
P/BCoefficients
ROACoefficients
ROECoefficients
P/BCoefficients

Table 4.26: Fama-‐MacBeth Regression. Non-‐Eurozone. Capital-‐sort.
Constant CapRatio Ln(assets) RawBeta CountryD Constant CapRatio Ln(assets) RawBeta CountryD2002 0.872 0.078 0.02 -‐4.996 -‐1.146 2002 -‐0.52 0.031 0.049 -‐0.404 0.5172003 2.329 -‐0.012 0.018 0.139 -‐1.718 2003 -‐1.486 0.026 0.12 0.029 -‐0.1262004 3.75 0.015 -‐0.128 0.391 -‐0.386 2004 0.605 -‐0.001 0.039 0.091 -‐0.3252005 6.194 0.013 -‐0.234 0.656 -‐0.136 2005 0.289 -‐0.018 0.068 0.552 -‐0.2872006 8.917 -‐0.027 -‐0.326 0.637 -‐0.153 2006 2.761 0.061 -‐0.121 0.602 0.5122007 0.785 0.107 -‐0.029 0.301 -‐0.494 2007 -‐3.465 0.178 0.069 1.971 -‐0.6772008 3.196 0.059 -‐0.169 -‐0.259 0.572 2008 -‐0.55 0.082 0.001 -‐0.171 0.742009 -‐5.837 0.28 0.088 0.007 -‐0.583 2009 -‐0.554 0.005 0.071 -‐0.181 0.3472010 -‐1.119 0.08 0.023 0.044 -‐0.422 2010 -‐3.064 0.064 0.145 -‐0.286 -‐0.116
Average 2.12 0.07 -‐0.08 -‐0.34 -‐0.50 Average -‐0.66 0.05 0.05 0.24 0.07
Constant CapRatio Ln(assets) RawBeta CountryD Constant CapRatio Ln(assets) RawBeta CountryD2002 22.812 0.617 -‐0.681 -‐47.686 -‐0.669 2002 10.741 -‐0.019 -‐0.397 -‐0.142 -‐0.9052003 17.399 -‐0.106 0.084 -‐0.536 -‐6.173 2003 8.516 -‐0.06 -‐0.245 0.215 -‐1.5732004 -‐12.017 -‐0.132 1.274 3.477 -‐5.759 2004 5.144 -‐0.113 -‐0.027 0.562 -‐2.0962005 -‐41.078 -‐0.333 2.921 8.514 -‐11.92 2005 8.977 -‐0.108 -‐0.269 0.386 -‐0.3282006 0.888 -‐0.452 0.924 4.948 -‐4.576 2006 1.341 0.133 -‐0.173 -‐0.397 1.4522007 -‐57.567 0.749 2.904 2.658 -‐5.174 2007 -‐0.098 0.068 -‐0.052 0.047 1.0262008 116.941 -‐0.881 -‐4.565 -‐12.957 20.436 2008 -‐0.768 0.026 0.027 -‐0.678 0.8762009 -‐72.049 2.116 2.219 -‐5.772 -‐4.105 2009 -‐0.292 0.054 -‐0.01 -‐0.926 0.8652010 -‐35.942 0.368 1.735 0.062 -‐3.508 2010 -‐1.816 0 0.123 -‐1.268 0.122
Average -‐6.73 0.22 0.76 -‐5.25 -‐2.38 Average 3.53 0.00 -‐0.11 -‐0.24 -‐0.06
Constant CapRatio Ln(assets) RawBeta CountryD Constant CapRatio Ln(assets) RawBeta CountryD2002 -‐0.577 0.211 -‐0.03 0.064 -‐0.617 2002 -‐1.799 0.105 0.07 0.673 -‐0.3972003 6.027 0.062 -‐0.263 0.873 -‐0.604 2003 -‐0.838 0.076 0.047 0.673 -‐0.3662004 3.858 0.075 -‐0.167 0.542 -‐0.487 2004 2.496 -‐1.072 0.582 0.881 -‐4.2422005 3.57 0.017 -‐0.126 2.901 -‐5.691 2005 1.419 0.144 -‐0.095 3.273 -‐5.2622006 -‐0.091 0.192 -‐0.037 0.584 -‐1.783 2006 1.149 0.126 -‐0.125 2.977 -‐2.2772007 5.119 -‐0.184 -‐0.113 0.405 -‐0.433 2007 3.376 -‐0.1 -‐0.087 1.249 0.0272008 -‐2.745 0.284 -‐0.004 0.079 -‐1.454 2008 3.748 0.041 -‐0.218 1.373 0.0522009 0.185 -‐0.06 0.054 -‐0.378 0.48 2009 -‐2.711 0.143 0.077 -‐0.281 0.5762010 -‐3.757 0.181 0.085 -‐0.441 0.277 2010 -‐3.133 0.147 0.082 -‐0.062 0.829
Average 1.52 0.07 -‐0.07 0.57 -‐1.21 Average 0.69 -‐0.06 0.03 1.26 -‐1.33
Constant CapRatio Ln(assets) RawBeta CountryD Constant CapRatio Ln(assets) RawBeta CountryD2002 -‐27.428 1.585 1.123 -‐7.227 -‐6.912 2002 5.676 0.075 -‐0.221 -‐0.198 0.1392003 22.056 -‐0.374 -‐0.138 7.588 -‐12.709 2003 2.921 0.162 -‐0.133 -‐0.885 0.2862004 8.084 -‐0.635 0.586 4.58 -‐5.177 2004 6.761 -‐0.056 -‐0.193 -‐0.5 0.1062005 4.063 -‐1.085 1.028 14.032 -‐33.474 2005 6.917 0.076 -‐0.29 3.343 -‐6.8732006 24.117 -‐1.809 0.326 4.837 4.66 2006 -‐1.982 0.203 -‐0.015 -‐0.257 -‐0.8132007 -‐18.605 0.546 1.288 0.028 -‐13.222 2007 5.443 -‐0.421 -‐0.066 -‐0.535 0.4132008 -‐29.686 2.978 0.189 -‐3.037 -‐62.715 2008 -‐2.773 0.256 -‐0.015 -‐0.08 -‐1.1542009 -‐4.573 -‐1.531 1.676 -‐8.424 4.475 2009 1.25 -‐0.11 0.008 -‐0.446 0.9042010 -‐43.473 1.836 1.046 -‐2.692 3.747 2010 -‐1.841 0.107 0.005 -‐0.244 1.127
Average -‐4.75 -‐0.01 0.75 2.11 -‐14.30 Average 2.09 0.03 -‐0.09 0.05 -‐0.75
Constant CapRatio Ln(assets) RawBeta CountryD Constant CapRatio Ln(assets) RawBeta CountryD2002 -‐1.307 0.005 0.063 0.132 0 2002 3.088 -‐0.162 -‐0.06 1.393 02003 -‐0.09 0.093 0.001 0.025 0 2003 -‐2.875 0.137 0.11 0.869 02004 1.377 0.14 -‐0.072 0.26 0 2004 -‐0.043 0.197 -‐0.009 0.698 02005 3.098 0.132 -‐0.131 0.199 0 2005 2.964 -‐0.087 -‐0.035 0.668 02006 8.109 -‐0.063 -‐0.284 0.553 0 2006 -‐1.437 0.149 0.064 0.586 02007 1.437 0.066 -‐0.044 -‐0.019 0 2007 -‐2.545 0.489 -‐0.026 0.757 02008 -‐3.802 0.036 0.178 -‐0.667 0 2008 -‐0.854 0.081 0.032 -‐0.073 02009 -‐4.051 0.285 0.064 -‐0.055 0 2009 0.163 0.168 -‐0.096 1.39 02010 -‐0.581 0.017 0.039 0.031 0 2010 3.875 -‐0.137 -‐0.115 1.457 0
Average 0.47 0.08 -‐0.02 0.05 0.00 Average 0.26 0.09 -‐0.02 0.86 0.00
Constant CapRatio Ln(assets) RawBeta CountryD Constant CapRatio Ln(assets) RawBeta CountryD2002 -‐56.788 1.291 2.212 1.528 0 2002 -‐0.379 0.479 -‐0.055 -‐1.295 02003 -‐6.71 0.313 0.741 -‐1.371 0 2003 5.696 0.054 -‐0.193 -‐0.454 02004 33.789 -‐0.096 -‐0.815 6.56 0 2004 4.811 -‐0.081 -‐0.109 -‐0.835 02005 37.267 -‐1.367 -‐0.37 1.951 0 2005 8.207 -‐0.175 -‐0.204 -‐0.971 02006 7.954 1.315 -‐0.028 2.317 0 2006 -‐0.799 0.2 0.001 -‐1.397 02007 -‐9.934 0.385 0.918 -‐0.111 0 2007 -‐3.53 0.544 -‐0.027 -‐0.826 02008 -‐57.862 0.414 2.642 -‐5.485 0 2008 -‐2.216 0.067 0.079 -‐0.549 02009 -‐60.999 2.878 1.581 -‐0.956 0 2009 -‐5.438 0.345 0.066 -‐0.033 02010 -‐13.407 -‐0.175 0.931 0.165 0 2010 3.724 -‐0.347 -‐0.005 0.01 0
Average -‐14.08 0.55 0.87 0.51 0.00 Average 1.12 0.12 -‐0.05 -‐0.71 0.00
P/BCoefficients
ROECoefficients
AlphaCoefficients
ROACoefficients
Middle
ROACoefficients
P/BCoefficients
ROECoefficients
AlphaCoefficients
Smallest
Non-‐Eurozone: Capital-‐Sort
ROECoefficients
AlphaCoefficients
Biggest
ROACoefficients
P/BCoefficients

References
[1] M. Abreu and V. Mendes. “Commercial bank interest margins and profitability: evi-
dence for some EU countries”. Porto Working Paper Series, CISEP, Portugal, 2002.
[2] A.R. Admati. “Rethinking how banks create value”. Newspaper article in FS Focus,
published by ICAEW, 2011.
[3] A.R. Admati, P.M. DeMarzo, M.F. Hellwig, and P. Pfleiderer. “Fallacies, irrelevant
facts, and myths in the discussion of capital regulation: why bank equity is not ex-
pensive”. Working paper No. 86, Stanford Graduate School of Business, 2010.
[4] J.D. Akhavein, A.N. Berger, and D.B. Humphrey. “The effects of megamergers on
efficiency and prices: evidence from a bank profit function”. Review of Industrial
Organization, 12(1):95–139, 1997.
[5] P.P. Athanasoglou, S.N. Brissimis, and M.D. Dells. “Bank-specific, industry-specific
and macroeconomic determinants of bank profitability”. Journal of International Fi-
nancial Markets, Institutions and Money, 18(2):121–136, 2008.
[6] P. Atkinson and A. Blundell-Wignall. “Thinking beyond Basel III: nessecary solutions
for capital and liquidity”. OECD Journal: Financial Market Trends, 2010(2):9–33,
2010.
[7] L. Balthazar. “From Basel 1 to Basel 3”. Palgrave McMillan, 2006.
[8] J.R. Barth, Jr. G.Capiro, and R. Levine. 2004. “Bank regulation and supervision:
what works best?”. Journal of Financial Intermediation, 13(2):205–248.
[9] Basel Committee on Banking Supervision. “International convergence of capital mea-
surement and capital standards”. BIS, 1988.
[10] Basel Committee on Banking Supervision. “Background note on LGD quantification”.
BIS, 2004.
[11] Basel Committee on Banking Supervision. “Bank failures in mature economies”. BIS,
2004.
[12] Basel Committee on Banking Supervision. “Basel III: long-term impact on economic
performance and fluctuations”. BIS, 2011.
[13] N.D. Baxter. “Leverage, risk of run and the cost of capital”. The Journal of Finance,
22(3):394–403, 1967.
[14] Ph. Bourke. “Concentration and other determinants of bank profitability in Europe,
North America and Australia”. Journal of Banking and Finance, 13(1):65–79, 1989.
[15] R.A. Brealey, S.C. Myers, and F. Allen. “Principles of Corporate Finance”. Mc Graw
Hill, 2008.
[16] Ch.W. Calomiris and Ch.M. Kahn. “The role of demandable debt in structuring op-
timal banking arrangements”. The American Economic Review, 81(3):497–513, 1991.
[17] J.Y. Campbell, A.W. Lo, and A.C. MacKinlay. “The Econometrics of Financial Mar-
kets”. Princeton University Press, 1996.
[18] J.H. Cochrane. “Asset Pricing”. Princeton University Press, 2005.
[19] J. Danielsson, P. Embrechts, Ch. Goodhart, C. Keating, F. Muennich, O. Renault, and
H.S. Shin. “An academic response to Basel II”. Special paper No.130, LSE, Financial
Markets Group, 2001.
[20] H. Davies. “The Financial Crisis. Who is to Blame?”. Polity Press, 2010.
[21] H. DeAngelo and R.W. Masulis. “Optimal capital structure under corporate and
personal taxation”. Journal of Financial Economics, 8(1):3–29, 1980.
[22] A. Demirguc-Kunt and H. Huizinga. “Determinants of commercial bank interest mar-
gins and profitability: Some international evidence”. World Bank Economic Review,
13(2):379–408, 1999.
[23] M. Dewatripont, J.-Ch. Rochet, and J. Tirole. “Balancing the Banks”. Princeton
University Press, 2010.
[24] M. Dewatripont and J. Tirole. “A theory of debt and equity: diversity of securities and
manager-shareholder congruence”. The Quarterly Journal of Economics, 109(4):1027–
1054, 1994.
[25] D.W. Diamond. “Financial intermediation and delegated monitoring”. The Review of
Economic Studies, 51(3):393–414, 1984.
[26] D.W. Diamond. “Corporate capital structure: the control roles of bank and public
debt with taxes and costly bankruptcy”. Economic Quarterly, 80(Spr):11–37, 1994.

[27] D.W. Diamond. “Banks and liquidity creation: a simple exposition of the Diamond–
Dybvig model”. Economic Quarterly, 93(2):189–200, 2007.
[28] D.W. Diamond and Ph.H. Dybvig. “Bank runs, deposit insurance, and liquidity”.
Journal of Political Economy, 91(3):401–419, 1983.
[29] D.W. Diamond and R.G. Rajan. “Liquidity risk, liquidity creation and financial
fragility”. Journal of Political Economy, 109(2):287–327, 2001.
[30] A. Dietrich and G. Wanzenried. “Determinants of bank profitability before and during
the crisis: evidence from Switzerland”. Journal of International Financial Markets,
Institutions and Money, 21(3):307–327, 2010.
[31] K.K. Donahoo and Sh. Shaffer. “The impact of capital requirements on the securiti-
zation decision”. ”Federal Reserve Bank of New York”, 1988.
[32] Sh.C. Dow. “Why the banking system should be regulated”. The Economic Journal,
106(436):698–707, 1996.
[33] K. Dowd. “The case for financial laissez-faire”. The Economic Journal, 106(436):679–
687, 1996.
[34] E.F. Fama and K.R. French. “Taxes, financing decisions, and firm value”. The Journal
of Finance, 53(3):819–843, 1998.
[35] E.F. Fama and J.D. MacBeth. “Risk, return, and equilibrium: empirical tests”. The
Journal of Political Economy, 81(3):607–636, 1973.
[36] FDIC. “History of the Eighties”. Federal Deposit Insurance Corporation paper, 1997.
[37] FDIC. “Basel and the evolution of capital regulation: moving forward, looking back”.
Federal Deposit Insurance Corporation paper, 2003.
[38] A. Fight. “Understanding International Bank Risk”. John Wiley & Sons, Ltd, 2004.
[39] T.C.G. Fisher and J. Martel. “On direct bankruptcy costs and the firm’s bankruptcy
decision”. Unpublished working paper, Universite de Cergy-Pontoise, France, 2001.
[40] K.R. French, M.N. Baily, J.Y. Campbell, J.H. Cochrane, D.W. Diamond, D. Duffie,
A.K. Kashyap, F.S. Mishkin, R.G. Rajan, D.S. Scharfstein, R.J. Schiller, H.S. Shin,
M.J. Slaughter, J.C. Stein, and R.M. Stulz. “The Squam Lake Report. Fixing the
Financial System.”. Princeton University Press, 2010.

[41] R.A. Gilbert. “Requiem for Regulation Q: what it did and why it passed away”.
Review, (Feb):22–37, 1986.
[42] J. Goddard, Ph. Molyneux, and J.O.S. Wilson. “The profitability of european banks: a
cross-sectional and dynamic panel analysis”. Manchester School, 72(3):363–381, 2004.
[43] M.B. Gordy. “Model foundations for the supervisory formula approach”. Board of
Governors of the Federal Reserve System working paper, 2004.
[44] G. Gorton and A. Winton. “Financial intermediation”. NBER working paper, 2002.
[45] T. Harford. “Adapt. Why Success Always Starts With Failure”. Little, Brown, 2011.
[46] M. Hellwig. “A model of borrowing and lending with bankruptcy”. Econometrica,
45(8):1879–1906, 1977.
[47] G. Iannotta, G. Nocera, and A. Sironi. “Ownership structure, risk and performance in
the european banking industry”. Journal of Banking and Finance, 31(7):2127–2149,
2007.
[48] P. Jackson. “Bank capital standards: the new Basel Accord”. Bank of England
Quarterly Bulletin, 2001.
[49] M.J. Jensen. “Agency costs of free cash flow, corporate finance, and takeovers”. The
American Economic Review, 76(2):323–329, 1986.
[50] M.J. Jensen and W.H. Meckling. “Theory of the firm: managerial behavior, agency
costs and ownership structure”. Journal of Financial Economics, 3(4):305–360, 1976.
[51] M.J. Jensen and C.W. Smith. “The Modern Theory of Corporate Finance”, chapter
”The theory of corporate finance: a historical overview”, pages 2–20. McGraw Hill,
1984.
[52] D. Jones. “Emerging problems with the Basel Capital Accord: regulatory capital
arbitrage and related issues”. Journal of Banking and Finance, 24(1-2):35–58, 2000.
[53] E.J. Kane. “Basel II: a contracting perspective”. Journal of Financial Services Re-
search, 32(1-2):39–53, 2007.
[54] A.K. Kashyap, R. Rajan, and J.C. Stein. “Rethinking capital regulation”. Working
paper, Federal Reserve Bank of Kansas City, 2008.

[55] A.K. Kashyap, J.C. Stein, and S. Hanson. “An analysis of the impact of ”substantially
heightened” capital requirements on large financial institutions”. Unpublished working
paper, University of Chicago, Harvard University, 2010.
[56] D. Kemsley and D. Nissim. “Valuation of the debt tax shield”. The Journal of Finance,
57(5):2045–2073, 2002.
[57] M. Koehn and A.M. Santomero. “Regulation of bank capital and portfolio risk”. The
Journal of Finance, 35(5):1235–1244, 1980.
[58] KPMG. “Basel II: a worldwide challenge for the banking business”. Research Paper,
2003.
[59] KPMG. “Basel III: Issues and implications”. Research Paper, 2011.
[60] A. Kraus and R.H. Litzenberger. “A state preference model of optimal financial lever-
age”. Journal of Finance, 28(4):911–922, 1973.
[61] McKinsey&Company. “Basel III and european banking: its impact, how banks might
respond, and the challenges of implementation”. Research Paper, 2010.
[62] A. Micco, U. Panizza, and M. Yanez. “Bank ownership and performance does politics
matter?”. Journal of Banking and Finance, 31(1):219–241, 2007.
[63] D. Miles, J. Yang, and G. Marcheggiano. “Optimal bank capital”. Discussion Paper
No. 31, Bank of England, 2011.
[64] M.H. Miller. “Debt and taxes”. The Journal of Finance, 32(2):261–275, 1977.
[65] M.H. Miller. “The Modigliani-Miller propositions after thirty years”. The Journal of
Economic Perspectives, 2(4):99–120, 1988.
[66] F. Modigliani and M.H. Miller. “The cost of capital, corporation finance and the
theory of investment”. The American Economic Review, 48(3):655–669, 1958.
[67] Ph. Molyneux and J. Thornton. “Determinants of european bank profitability: a
note”. Journal of Banking and Finance, 16(6):1173–1178, 1992.
[68] S.C. Myers. “Determinants of corporate borrowing”. Journal of Financial Economics,
5(2):147–175, 1977.
[69] S.B. Naceur and M. Goaied. “The determinants of commercial bank interest mar-
gin and profitability: evidence from Tunisia”. Frontiers in Finance and Economics,
5(1):106–130, 2005.

[70] Nomura. “Basel II and banks”. Research Paper, 2005.
[71] K.G. Nyborg. Advanced valuation course. University of Zurich, Spring 2011.
[72] BNP Paribas. “Basel III: no Achilles’ spear”. Research Paper, 2011.
[73] F. Pasiouras and K. Kosmidou. “Factors influencing the profitability of domestic and
foreign commercial banks in the European Union”. Research in International Business
and Finance, 21(2):222–237, 2007.
[74] P. Pfleiderer. “On the relevancy of Modigliani and Miller to banking: a parable and
some observations”. Working paper No. 93, Stanford University, 2010.
[75] PriceWaterhouseCoopers. “The new Basel III framework: navigating changes in bank
capital management. Research Paper, 2010.
[76] P. Van Roy. “The impact of the 1988 Basel Accord on banks’ capital ratios and credit
risk-taking: an international study”. Unpublished working paper, National Bank of
Belgium, 2005.
[77] Ch.E. Ruebling. “The administration of Regulation Q”. Review, (Feb):29–40, 1970.
[78] Goldman Sachs. “The Basel II Capital Accord”. Research Paper, 2005.
[79] J.A.C. Santos. “Bank capital regulation in contemporary banking theory: a review of
the literature”. BIS working paper, 2000.
[80] Jr. J.H. Scott. “A theory of optimal capital structure”. The Bell Jounal of Economics,
7(1):33–54, 1976.
[81] A. Shleifer and R.W. Vishny. “Management entrenchment: the case of manager -
specific investment”. Journal of Financial Economics, 25(1):123–139, 1989.
[82] M. Smirlock. “Evidence on the (non)relationship bewteen concentration and prof-
itability in banking”. Journal of Money, Credit and Banking, 17(1):69–83, 1985.
[83] Standard&Poor’s. “Basel III Proposal to increase capital requirements for counterparty
credit risk may significantly affect derivatives trading”. Research Paper, 2010.
[84] J.E. Stiglitz. “Some aspects of the pure theory of corporate finance: bankruptcies and
take-overs”. The Bell Jounal of Economics and Management, 3(2):458–482, 1972.

[85] N. Tarashev and Zhu Haibin. “Specification and calibration errors in measures of
portfolio credit risk: the case of the ASRF model”. International Journal of Central
Banking, 4(2):192–173, 2008.
[86] D. Tarullo. “Banking on Basel: The Future of International Financial Regulation”.
Peterson Institute, 2004.
[87] A. Turner, A. Haldane, P. Woolley, S. Wadhwani, Ch. Goodhart, A. Smithers,
A. Large, J. Kay, M. Wolf, P. Boone, S. Johnson, and R. Layard. “The Future of
Finance”. LSE, 2010.
[88] J.H. van Binsbergen, J.R. Graham, and J. Yang. ”The Cost of Debt”. Working paper,
Duke University, 2008.
[89] J.B. Warner. “Bankruptcy costs: some evidence”. The Journal of Finance, 32(2):337–
347, 1977.
[90] A.J. Weichenrieder and T. Klautke. “Taxes and the efficiency costs of capital distor-
tions”. Unpublished working paper, CESifo Group Munich, 2008.