master s thesis - aalborg...
TRANSCRIPT
RENEWABLE ENERGY TRANSITION FOR A
SUSTAINABLE FUTURE IN NAMIBIA
YOANN LE FOL
Aalborg
June 2012
Aalborg University
Department of Development and Planning
Division of Sustainable Energy Planning and Management
MASTER’S THESIS


ACKNOWLEDGMENT
First and foremost, I would like to thank the team of the Renewable Energy and Energy
Efficiency Institute (REEEI); namely Kudakwashe Ndhlukula, Helvi Ileka, Lydia Sheimi, Virginia
Roman, Eben Kamatato, Ndakema Hamunghete and Zenas Iileka; as well as Nico Sneider from
the Namibian Ministry of Mines and Energy, for their strong support and the fantastic time in
their company.
Furthermore, I would sincerely like to thank my supervisor Prof. Frede Hvelplund for providing
excellent advice and comments throughout the project.
Last but not least, I would like to thank all friends and people that contributed to my amazing
experience in Namibia and Southern Africa.
ABSTRACT The Namibian electricity sector has mainly relied on electricity imports from the Southern
African Power Pool (SAPP) over the last decade. However, a growth in electricity demand and
scarce import options could cause electricity shortages as of 2013. The national utility is mainly
studying the feasibility of fossil fuel power plants in order to cope with the increasing generation
while Namibia offers first class renewable energy sources. Moreover, technical, economic and
politic barriers to renewable energy development remain in Namibia despite various programs
that were implemented to remove them. The thesis analyses the Namibian energy system at
both the institutional and technological levels in order to understand which policy framework
could sustain a renewable energy transition. The Multi-level Perspective is used to examine
thoroughly the Namibian energy regime and recommend energy policy. In addition, different
degree of renewable integration and institutional changes are tested with a long term energy
scenario analysis simulated with LEAP. The thesis shows that high renewable energy
deployment powers a sustainable future in Namibia.

1
TABLE OF CONTENTS
Chapter 1 - Introduction
1.1 Background ............................................................................................................................................................ 2
1.2 Problem formulation .......................................................................................................................................... 4
1.3 Methodological framework ............................................................................................................................. 5
1.4 Scope and delimitations .................................................................................................................................... 6
1.5 Outline of the study............................................................................................................................................. 6
Chapter 2 – Renewable Energy Policy
2.1 Drivers of renewable energy policy ............................................................................................................. 8
2.2 Renewable energy procurement mechanisms: biding or feed-in? ................................................. 9
2.2.1 REFIT scheme .............................................................................................................................................. 9
2.2.2 Bidding system ............................................................................................................................................ 9
2.2.3 The South African dilemma ................................................................................................................ 10
2.3 Renewable energy support and promotion ........................................................................................... 11
2.3.1 Fiscal incentives ...................................................................................................................................... 11
2.3.2 Public financing ....................................................................................................................................... 11
2.3.3 Ownership model .................................................................................................................................... 11
Chapter 3 – Renewable Energy Sources in Namibia
3.1 The Namibian electrical system ................................................................................................................. 13
3.1.1 Generation and demand ....................................................................................................................... 13
3.1.2 Grid ............................................................................................................................................................... 13
3.1.3 Nampower’s projects ............................................................................................................................ 14
3.2 Solar Photovoltaic Electricity Generation .............................................................................................. 15
3.2.1 Installed capacity .................................................................................................................................... 15
3.2.2 Resource ..................................................................................................................................................... 15
3.2.3 Application ................................................................................................................................................. 15

2
3.2.4 Costs ............................................................................................................................................................. 15
3.2.5 Integration ................................................................................................................................................. 16
3.2.6 Projects ........................................................................................................................................................ 16
3.3 Concentrating Solar Power ........................................................................................................................... 17
3.3.1 Installed capacity in Namibia ............................................................................................................. 17
3.3.2 Resource ..................................................................................................................................................... 17
3.3.3 Application ................................................................................................................................................. 17
3.3.4 Costs ............................................................................................................................................................. 17
3.3.5 Integration ................................................................................................................................................. 18
3.3.6 Projects ........................................................................................................................................................ 18
3.4 Wind Energy ....................................................................................................................................................... 19
3.4.1 Installed capacity .................................................................................................................................... 19
3.4.2 Resource ..................................................................................................................................................... 19
3.4.3 Application ................................................................................................................................................. 19
3.4.4 Costs ............................................................................................................................................................. 19
3.4.5 Integration ................................................................................................................................................. 20
3.4.6 Projects ........................................................................................................................................................ 20
3.5 Biomass Energy ................................................................................................................................................. 21
3.5.1 Installed capacity .................................................................................................................................... 21
3.5.2 Resource ..................................................................................................................................................... 21
3.5.3 Application ................................................................................................................................................. 21
3.5.4 Costs ............................................................................................................................................................. 21
3.5.5 Integration ................................................................................................................................................. 22
3.5.6 projects ........................................................................................................................................................ 22
3.6 Hydropower ........................................................................................................................................................ 23
3.6.1 Installed capacity .................................................................................................................................... 23
3.6.2 Resource ..................................................................................................................................................... 23
3.6.3 Application ................................................................................................................................................. 23
3
3.6.4 Costs ............................................................................................................................................................. 23
3.6.5 Integration ................................................................................................................................................. 23
3.6.6 Projects ........................................................................................................................................................ 23
Chapter 4 – Theoretical Framework
4.2 Multi-level perspective (MLP) ..................................................................................................................... 27
4.2.1 Sociotechnical system and system innovation ........................................................................... 27
4.2.2 System innovation levels ..................................................................................................................... 27
Sociotechnical regime .......................................................................................................................................... 27
Niche ........................................................................................................................................................................... 28
Landscape ................................................................................................................................................................. 28
4.2.3 System Innovation: dynamics and patterns................................................................................. 28
Chapter 5 – Energy System Innovation in Namibia
5.1 Off-grid electrification: the niche for renewables ............................................................................... 31
5.1.1 Governmental initiatives ..................................................................................................................... 31
Energy shops ........................................................................................................................................................... 31
Solar electrification of public institutions ................................................................................................... 32
Solar revolving fund ............................................................................................................................................. 32
Renewable energy trainings ............................................................................................................................. 33
Challenges ................................................................................................................................................................. 33
5.1.2 Micro-grid approach .............................................................................................................................. 33
Tsumkwe hybrid energy system ..................................................................................................................... 33
Challenges ................................................................................................................................................................. 34
5.1.3 Low-cost renewable energy appliances market ........................................................................ 34
5.2 A sociotechnical regime in early transition ........................................................................................... 36
5.2.1 Actors and linkages ................................................................................................................................ 36
5.2.2 Energy policy ............................................................................................................................................ 38
5.3 A favourable landscape .................................................................................................................................. 41
5.3.1 Southern African Development Community (SADC) stimulus ..................................................... 41
4
5.3.2 International pressure ......................................................................................................................... 42
International growth in renewables: a significant driver..................................................................... 42
International regulation on climate change ............................................................................................... 42
5.4 Transition dynamics in Namibia ................................................................................................................ 44
5.4.1 Energy policy revision .......................................................................................................................... 44
5.4.2 National integrated resource plan (NIRP) .................................................................................... 45
Chapter 6 – Long Term Energy Scenario Analysis
6.1 Scenario construction: institutional and technical aspects ............................................................. 47
6.1.1 Business as usual scenario .................................................................................................................. 47
6.1.2 Progressive renewable scenario ...................................................................................................... 47
Institutional aspects ............................................................................................................................................. 48
Technological aspects .......................................................................................................................................... 48
6.1.3 High renewable scenario ..................................................................................................................... 50
Institutional aspects ............................................................................................................................................. 50
Technological aspects .......................................................................................................................................... 51
6.2 Scenario analysis: assumptions .................................................................................................................. 52
6.2.1 System delimitations ............................................................................................................................. 52
6.2.2 System balance .................................................................................................................................... 53
6.2.3 Generation ............................................................................................................................................. 53
6.2.4 Transmission ....................................................................................................................................... 55
6.2.5 Economic and financial parameters ........................................................................................... 55
6.2.6 Environmental and social aspects ............................................................................................... 56
6.3. Scenario analysis: results .............................................................................................................................. 57
6.3.1 Technical..................................................................................................................................................... 57
6.3.2 Economic results ..................................................................................................................................... 59
Net Present Value .................................................................................................................................................. 59
Fossil fuel prices and renewable energy costs .......................................................................................... 59
Electricity trading .................................................................................................................................................. 60
5
Infrastructure investment ................................................................................................................................. 61
6.3.3 Socio-environmental results ...................................................................................................................... 62
Job creation .............................................................................................................................................................. 62
Environmental impacts ....................................................................................................................................... 63
Conclusion………………………………………………………………...…………………………………………….………74
Bibliography……………………………………..……………………...…………………………………………….….……76
Annexe 1: GHI and DNI resource assessment of Namibia .............................................................................. 76
Annexe 2- Paper conference (SASEC, 2012): “Potential and future of concentrating solar power
in Namibia”. Le Fol, Y., Ndhlukula, K. 2012 ........................................................................................................... 78
6
LIST OF FIGURES
Figure 3. 1. Load profile in Namibia. Source: NIRP
Figure 3. 2. Transmission and distribution system in Namibia. Source: Nampower
Figure 3. 3. Solar technologies installed per year in Namibia (2004 – 2010). Source REEEI
Figure 3. 4. Solar power vs electricty demand in Namibia. Source: Innowind, 2011
Figure 3. 5. Suitable area for CSP establishment in Namibia. Source: Le Fol, Y. (2012)
Figure 3. 6. Daily wind speed in Walvis Bay. Source: MME (1996)
Figure 3. 7. Biomass potential in Namibia. Source: Bester (1999)
Figure 4.1: Multi levels hierarchy. Source: Geels, 2007
Figure 4. 2. Dynamics of system innovations. Source: Geels, 2005.
Figure 5. 1. Renewable energy demonstration and discourse of the Minister of Mines and Energy (Isak Hatali) at the launch of the Energy Shop in Rundu. 7 November 2011.
Figure 5. 2. Low cost solar panels and inverters for sale in Windhoek (China Town) and Katima Mulilo (Caprivi Region). April 2012. Note: 100 N$ = ± 14 US$.
Figure 5. 3. Cracked solar panel for sale in China Town, Windhoek. April 2012
Figure 5. 4. Sociotechnical regime of energy in Namibia
Figure 6. 1. Installed capacity from 2011 to 2031 in the 'business as usual' scenario
Figure 6. 2. Installed capacity from 2011 to 2031 in the 'progressive renewable' scenario
Figure 6. 3. Installed capacity from 2011 to 2031 in the 'high renewable' scenario
Figure 6. 4. System delimitation for LEAP modelling
Figure 6. 5. Load demand forecast in Namibia to 2031. Source: NIRP
Figure 6. 6. Generation output in the 'business as usual' scenario
Figure 6. 7. Generation output in the 'progressive renewablel' scenario
Figure 6. 8. Generation output in the 'high renewablel' scenario
Figure 6. 9. Electricity imports and exports compared to endogenous generation for each scenario from 2012 to 2031
Figure 6. 10. Cumulative grid investments from 2012 to 2031 (all scenarios)
Figure 6. 11. Employment in new power plants and fuel collection/conversion (all scenarios)
Figure 6. 12. Employment in the new energy sector per year (all scenarios)
Figure 6. 13. Global warming potential in TCO2 eq. (all scenarios)
7
LIST OF TABLES
Table 5. 1. ECB licences issued to IPPs. Source: ECB, 2011
Table 6. 1. Techno-economic figures for existing Namibian plants
Table 6. 2. Fossil fuel based power options for the future Namibian generation system
Table 6. 3. RET options for the future Namibian generation system
Table 6. 6. Job creation per fossil fuel based power plant
Table 6. 7. Job creation per RET option
Table 6. 8. Renewable energy share in the geneartion mix by 2020 and 2030 (all scenarios)
Table 6. 9. Net present values of the 'progressive renewable' and 'high renewable' vs. 'business as usual scenario'.
Table 6. 10. Sensitivity analysis on the impact of fuel prices and RE costs
Table 6. 11. Sensitivity analysis on the impacts of imported electricity price on scenario's NPV
Table 6. 12. Sensitivity analysis on the impacts of export price on the 'high renewable' scenario profitability
Table 6. 13. GHG saving and cost of avoided CO2 (PR, HR vs. BU)
8
LIST OF ACRONYMS
CDM: Clean Development Mechanism
GHG: Greenhouse Gases
IPP: Independent Power Producer
LEAP: Long range Energy Alternatives Planning system
MET: Ministry of Environment and Tourism
MME: Ministry of Mines and Energy
NIRP: National Integrated Resource Plan
OGEMP: Off-grid Energisation Master Plan
PPA: Power Purchase Agreement
RE: Renewable Energy
REEEI: Renewable Energy and Energy Efficiency Institute
REFIT: Renewable Feed-in Tariff
RES: Renewable Energy Sources
RET: Renewable Energy Technology
SAPP: Southern African Power Pool
UNFCCC: United Nation Framework Convention on Climate Change

1
CHAPTER 1 - INTRODUCTION
2
1.1 BACKGROUND
Electricity is an essential factor for social, economic as well as industrial development. Yet, in
Sub-Saharan Africa only 28% of the population has access to electricity [1]. This situation results
in great difficulties to meet basic people needs (e.g. health and education) and impedes national
development [2]. Moreover, the Sub-Saharan countries have the fastest growths worldwide in
population and GDP per capita [3]. Development in sectors like education, agriculture or
industry as well as infrastructure improvements are necessary to cope with such growth while
meeting poverty alleviation goals (e.g. millennium development goals). This transition implies a
dramatic raise in electricity consumption that will increase the pressure on current electrical
power system. However, inefficient and ageing power plants characterized the African electricity
supply industry and the commissioning of new electricity facilities seldom occurs as a
consequence of poor planning [4]. In many countries, the current or short-run energy demands
are greater than the installed capacity. Such deficits in electricity generation are a threat for the
development of the region. For instance, it is estimated that the GDP per capita of Southern
African countries was reduced by 0.2% between 1990 and 2005 because of poor power
infrastructures [5].
Namibia is a relevant example of this overall situation. First of all, the issue of energy access still
poses barriers to development. The electrification rate reaches 41.8% in average and only 25%
in rural areas [6,7]. Moreover, the Namibian socioeconomic status is representative of an
emerging country. Namibia has one of the highest income inequality in the world in addition to
an unemployment rate of 51.2% [8,9]. On the other hand, the national economy shows a stable
development with an annual GDP growth of 6%. It is stimulated by industrial sectors such as
mining, fishing and tourism. Consequently, the World Bank ranks Namibia as one of the 13
middle income countries existing in Africa. These positive indicators have encouraged national
decision-makers to raise ambitious development goals. For instance, the Government instigated
a long term program (Vision 2030) that aims at turning Namibia into an industrialize country by
2030 [10]. As a matter of fact, the current electricity supply system is not sufficient to meet the
demand associated with this objective.
As of 2011, the national generation capacity is equal to 415 MW shared among four conventional
power plants, i.e, Ruacane (hydo - 330 MW), Van Eck (coal -120 MW), Paratus (diesel -17 MW),
Anixas (diesel - 22 MW) [11]. It does not suffice to cover the national demand (e.g. peak demand
of 511 MW in 2011) and the Namibian electricity sector mainly relies mainly on electricity
imports from the Southern African Power Pool (SAPP) (e.g. 60% of the supply in 2010).
Moreover, a growth in electricity demand (4% per year) and scarce import options could result
in energy shortages as of 2012. In terms of impacts on the Namibian economy, it is estimated
that a 24 hours of blackout each month would reduce the GDP by 4% [12]. In this context, the
commissioning of conventional power plants is the option mostly considered. For example, the
national utility, Nampower is currently studying the feasibility of a new 150 to 300 MW coal-
fired power plant in Erongo Region [11]. However, the generation deficit could also be tackled
with renewable energy technologies (RETs) which provide supplementary benefits.
Decision-makers have identified RES as having a role to play in the Namibian energy mix. The
White Paper on Energy of 1998 recognizes their benefits with respect to sustainability and
security of supply [13]. Some of these benefits are mentioned below.
3
First of all, the latent Namibian energy crisis could be soundly addressed with RE solutions. Such
technologies as solar PV or wind turbines could contribute to close the gap between generation
and demand as soon as 2013 since they offer very short ramp-up times. Moreover, the White
Paper on Energy of 1998 underlines that security of supply has to be achieved with economically
competitive and reliable sources, but with a particular emphasis on Namibian resources. The use of
locally available solar, wind and biomass resources could particularly fulfil this objective.
Namibia is one of the most vulnerable countries to the adverse and negative effects of climate
change although its contribution to global emissions is negligible, i.e., 0.01% [17]. Nevertheless,
the Namibian position on climate change mitigation is in accordance with the UNFCCC’s
principle of common but differentiated responsibilities with respective capabilities [18]. There is
therefore a national commitment to contribute to the global efforts to mitigate climate change if
financial and technical resources are provided by developed countries. Previous research shows
that most Namibian CO2 equivalent emissions are related to the energy sector and land use
change. The emissions from the energy sector have increased by 15.5% between 1994 and 2000.
The situation could intensely worsen if the required escalation in capacity is met only with
fossil-fuel based power plants. In this regard, renewable energy technologies (RETs) are
indicated as a nationally appropriate measure in the second Namibian communication to the
UNFCCC [19].
Last but not least, the use of renewable energy sources (RES) could strengthen the Namibian
industrial base through innovation, development and job creation. RETs are known to create
more employment than conventional technologies such as coal power [14]. Moreover, these jobs
are likely to be decentralized and closer to the communities since the RES (e.g. wind, sun and
biomass) are spread over the country. Such a social benefit is highly valuable for a country like
Namibia where unemployment is a major concern and a priority for the Government. In 2011 a
vast program (Targeted Intervention Program for Employment and Economic Growth - TIPEEG)
was launched with a budget estimated at US$ 1.13 billion (N$9.1 billion) to create job
opportunities [15]. Furthermore, in line with Vision 2030, the deployment of a substantial RE
sector could strengthen the Namibian industry. The implementation of adequate technology
transfer programs is an opportunity to build national skills and create development poles.
Additionally, the dissemination of suitable renewable technologies (e.g. solar home systems,
micro grid) and appliances (e.g. solar torches, solar stoves) in off-grid areas is an instrument
already recognized by the Government to reduce gender imbalance and alleviate energy poverty
[16].
In a nutshell, renewables would be an excellent instrument to foster a sustainable development
in Namibia.
4
1.2 PROBLEM FORMULATION
Over the last few years, constant Governmental efforts have intended to promote RE particularly
for small scale and off-grid applications. Different initiatives such as the Namibian Renewable
Energy Program (NAMREP) were implemented to remove technical, financial and public
awareness barriers to RE [20]. Moreover, the Renewable Energy and Energy Efficiency Institute
(REEEI) was created in 2007 to pilot RE projects and disseminate information.
Despite these initiatives and the likely socioeconomic benefits of RES, their share in the
Namibian energy mix does not exceed 1% (excluding hydropower). Therefore, multiple key
barriers are still hindering the uptake of renewables in Namibia as illustrated below.
· There are capacity constraints both in terms of human resource and equipment within
the key implementing institutions;
· There are technical limitations in terms of grid integration and resource assessment;
· The energy planning is poorly addressed;
· The policy and regulatory frameworks in place are out-dated and inappropriate (e.g.
White Paper on Energy Policy of 1998);
· The upfront investment costs of most RE options are still more expensive than those of
conventional energy;
· There is no financing mechanisms in place to support RE investment;
· The tariffs of imported electricity are comparatively low, i.e. 0.11 US$/kWh (0.80
N$/kWh);
· The independent power producer (IPP) framework in place is not conducive to
successful negotiations between IPP and Nampower.
These barriers have to be overcome in order to harvest the manifold benefits of renewable
energy. The study argues that sound policy frameworks could tackle directly or indirectly the
abovementioned barriers and accelerate the RE development in Namibia.
Renewable energy policy recommendations are likely to be relevant only if grounded on a
thorough understanding of the local context. For instance, it is necessary to assess which
renewable energy sources are available and adequate with regard to the existing electrical
system. Similarly, the current energy policy and the influential actors have to be identified and
described. Therefore, preliminary questions are posed to investigate the Namibian energy sector
both in terms of technical and institutional aspects.
· What is the technical potential of the RES available in Namibia?
· How these RES are used in Namibia so far? Which are the associated benefits and
challenges?
· What is the national socio-political context with regard to energy and renewables in
particular?
Insofar as the previous questions are thoroughly tackled further investigations are possible. The
main research question is articulated as follows.
· Which policy framework could adequately support a renewable energy transition for a
sustainable future in Namibia?
5
A methodological framework has been specifically developed to answer the preliminary
questions as well as the research question.
1.3 METHODOLOGICAL FRAMEWORK
First of all, the study is based on a substantial experience within the Namibian electricity supply
industry (ESI). The author as a research intern with the Renewable Energy and Energy Efficiency
Institute (REEEI) of Namibia was involved in many of the ESI activities between August 2011
and June 2012. He was member of the steering committee of the National Integrated Resource
Plan (NIRP) as well as Namibian delegate in charge of the negotiations on carbon capture and
storage (CCS) at the COP 17/CMP 7. He also worked on a concentrating solar power (CSP)
project funded by the Ministry of Mines and Energy (MME) of Namibia.
Secondly, the study evaluates the role of policy and regulation for the integration of RES into the
Namibian energy system. In order to fulfil this objective, the methodology applied here
comprises a theoretical approach combined with a long term energy scenario analysis.
In the last decade, the innovation studies have broadened their analysis in order to examine the
co-evolution of society and technology. It mainly stemmed from the current environmental
issues and the necessity to prompt a transition toward a sustainable future. Recent research in
this field has particularly emphasised the role of institutions and policy choices in technical
change [21]. The multi-level theory included in the study is in line with this stream [22]. It
stresses the influence of the social groups and their linkages on the transition from a
sociotechnical system to another, i.e., system innovation. The theory also suggests general
patterns and dynamics for system innovation based on historical case studies (e.g. transition
from horse and cart to care). It describes three levels of change (niche, sociotechnical regime
and landscape) in order to describe a technological transition from the nascent stage to the
broad acceptance within the society (see chapter 4). The multi-level theory is used in the study
as a relevant analytical framework to examine the renewable energy transition in Namibia and
to suggest policy recommendations.
Finally, the study includes a long term energy scenario analysis in order to understand the co-
evolutions of institutions and technologies that would take place if a RE transition occurs in
Namibia. Three scenarios are created, namely, ‘business as usual’, ‘progressive renewable’ and
‘high renewable’. They reflect different levels of policy initiatives in support to RE development.
The ‘business as usual’ scenario represents a situation where very little support to RE is
provided over the next decades. The ‘progressive scenario’ simulates a moderate growth in RE
development that stems from the implementation of favourable policy frameworks. The ‘high
renewable’ scenario results in a radical transition driven by strong Governmental incentives.
Moreover, the three scenarios are evaluated through LEAP (Long range Energy Alternatives
Planning system) which is a modelling tool for energy policy analysis and climate change
mitigation assessment developed at the Stockholm Environment Institute (SEI). A cost-benefit
analysis is completed and social as well environmental impacts are examined (e.g. GHG
emissions, job creation). Moreover, the model is built upon relevant technical options for the
future Namibian energy system. The techno-economic data included are either find in the recent
literature or based on the National Integrated Resource Plan (NIRP).
6
1.4 SCOPE AND DELIMITATIONS
The study will only consider the Namibian energy sector with a focus on the electricity supply
industry. The rural electrification is only addressed in a qualitative manner since data on the
topic are very limited. Similarly, the implementation of policies and regulations is not examined
to the extent of calculating related electricity tariffs. Finally, the study will be limited to the next
20 years in order to fit into existing development policies such as Vision 2030.
1.5 OUTLINE OF THE STUDY
This study is structured as follows. In Chapter 2, the main drivers of RE policy are described as
well as the measure and instruments usually employed to support RE and promote. The cases of
Denmark and South Africa are used to provide relevant examples. Chapter 3 offers a detailed
description of the RES available in Namibia. The multi-level approach is explained in Chapter 4
and applied in Chapter 5 to analyse the current Namibian energy system. In Chapter 6, the
assumptions, methodology and results of the scenario analysis are exposed. Finally, the Chapter
7 concludes the study and provides RE policy recommendations for Namibia.
7
CHAPTER 2 – RENEWABLE ENERGY POLICY
Between 2005 and 2010, the number of countries having a RE target/policy has increased from
55 to 100 particularly due to implementations in developing countries [1]. What are the drivers
of such an uptake? What is behind the term RE policy? In this Chapter, the major approaches of
political economy that shape RE policy are described as well as the instrument and measures
usually implemented. The cases of South Africa and Denmark are highlighted to provide relevant
illustrations. The rationale behind this choice is historical and qualitative. Namibia became
independent after the withdrawal of South Africa in 1989. The countries still have many
common points in the energy sector with the exception of South Africa being more advanced in
RE policy formulation. Denmark has a history of renewables that started more than 20 years
ago. Different approaches, i.e., neoclassical and institutional, have been successively
implemented in this country for the design and implementation of the national RE policy. The
examination of their relative impacts provides some interesting perspectives.
8
2.1 DRIVERS OF RENEWABLE ENERGY POLICY
RET have the potential to offer many benefits to the society with regard to environmental,
economic and social aspects. Firstly, RE deployment is a major and durable option to mitigate
climate change. It also enables to limit resource scarcity and enhance energy security [1].
Moreover, the potential high degree of localization offered by renewables is a strong advantage
particularly in the African context. If appropriately implemented RETs contribute to local
employment and development. In rural Africa, for instance, RETs improve modern energy access
while limiting natural resource depletion and fuel dependency. Yet, the penetration of RET in
most countries is mainly limited by market and institutional barriers rather than technical
aspects.
On the other hand, fossil fuel based technologies have negative impacts on the environment and
the society. They strongly contribute to climate change and have adverse effects on human
health. Moreover, the increasing price volatility of fossil fuel weakens national economies
particularly in Africa. The Namibian Minister of Mines and Energy recently said:
“The over-reliance on foreign sources for our energy requirements is a huge security risk for the
country. This risk is compounded by political unrest and uncertainty in the Middle East, which is the
major source of crude oil.” Isak Kataly, Development Dialogue Forum, July 2011.
Nevertheless, all these disadvantages are not naturally reflected in the market price of fossil fuel
based electricity. Moreover, the fossil fuel energy sector benefits from decades of domination
and institutional support. Hence, the playing field has to be levelled if the share of renewables
versus fossil fuels has to increase. The implementation of adequate RE policy is essential to do
so.
The variety of existing RE policy is large and corresponds to the manifold views and opinions on
political economy. However, two main streams, i.e, neoclassical and institutional economy, have
particularly influences the design and formulation of RE policy so far. The neoclassical approach
posits that a minimum intervention on the free market would suffice to reach an optimum
situation for RE penetration. This is translated by the internalization of carbon externalities in
fossil fuel electricity prices with instruments such as carbon taxes, carbon trade, clean
development mechanisms… On the other hand, the institutional approach claims that the market
is actually constructed by institutions and social groups [2]. Hence, the free market will not
reach an optimum since many conservative interests are embedded in the incumbent regime. A
large deployment of RE needs some reforms at the institutional level in order to transform the
free market into an institutional market. Consequently, conservative interests and barriers to RE
integration are dismissed.
These approaches are converted into instruments and measures that should trigger and sustain
the development of RE.
9
2.2 RENEWABLE ENERGY PROCUREMENT MECHANISMS: BIDING
OR FEED-IN?
A panel of economic instruments that aim at facilitating the penetration of RE in the market
exist. In Europe, the Quota system and the renewable energy feed-in tariff (REFIT) have been the
main RE incentives implemented in the last years. In Africa, it appears that the Quota system
does not appeal to decision-makers. Though, the tendering or bidding mechanism for RE
procurement is currently challenging the REFIT approach.
2.2.1 REFIT SCHEME
A renewable energy feed-in tariff or REFIT is the implementation of a guaranteed price over a
defined time (e.g. 20 years) for electricity produced from RES. The guaranteed price covers the
generation cost and enables the RE producer to earn a reasonable return on investment.
Moreover, the grid operator is compelled to purchase all the RE power fed into the grid. It is
therefore a mean of ordering the free market for the benefit of RE. A long term RE target often
complements the REFIT scheme.
The REFIT scheme has proven to be the most efficient instrument for RE deployment [3]. It
favours a stable RE industry including research and development and facilitate the involvement
of smaller independent power producers (IPPs). However, it makes a good reading of the market
uneasy. If the guaranteed price does not decrease according to the RET’s learning rate, RE
market prices are not cost reflective. It results in unnecessary financial burden for the electricity
sector that eventually affects the consumers.
In Denmark, the REFIT scheme has strongly contributed to the large deployment of wind and
biomass power (e.g. 3 927 MW of wind capacity installed in 2011) [2]. The first implementation
occurred in 1992 with a premium model that ensured RE producer an extra profit on top of the
electricity market price. The role of REFIT was fully acknowledged when in 2001 the Danish
government initiated a shift to Quota system. In the next years, the land-based wind installed
capacity dropped substantially.
In Africa, four countries have implemented a REFIT scheme; namely, Kenya, Uganda, Ghana and
Tanzania. Meyer-Renschhausen shows that the success of these implementations is mainly
related to the level of commitment from governments [3]. Well defined rules (explicit approach)
have to be applied in order to ensure a workable mechanism (e.g. Uganda). Technology and
program caps, minimum project size, specific tariffs per technology are relevant measures. On
the other hand, if government authorities tend to limit the REFIT overall cost by setting up an
unclear regulatory framework (implicit approach), private investors barely show interests and
the RE market does not take off (e.g. Kenya). Furthermore, the premium model used in Denmark
is a risky choice for Africa since electricity prices are pretty volatile.
2.2.2 BIDDING SYSTEM
First, the government set a long term renewable energy target. Then tenders are issued for
various eligible RETs and IPPs are invited to bid. The least cost bidder that also fulfils the
technical requirements is awarded and signs a power purchase agreement (PPA) with the power

10
utility. The PPA guarantees a fix price over a certain period of time (e.g. 20 years). Tenders are
supposedly issued until the target is reached.
The selected target acts as a cap for RE deployment. Moreover, the bidding system strongly
relies on competitive IPPs. Low RE prices are expected as a result of the price competition.
Therefore, the intervention on the free market is almost none. The institutional framework is
likely to remain stable since the bidding does not directly support RET vis-à-vis fossil fuel power
plants. Furthermore, the stop-and-go aspect of the bidding system does not favour the
emergence of an industrial RE base. However, the implementation of a target is meant to foster
RE development.
2.2.3 THE SOUTH AFRICAN DILEMMA
In 2003, the South African Government published a White Paper on renewable energy. This
documents set a target at 10 000 GWh of RE contribution to final energy consumption by 2013
[4]. In 2009, the Government identified available financing as one of the most barriers for RE and
announced the implementation of a REFIT scheme. The National Energy Regulator of South
Africa (NERSA) published the REFIT tariffs per technology in the same year. However, the REFIT
scheme has never been fully implemented due to regulatory mismatches and minimum political
support. For instance, one year after the REFIT announcement, the Department of Energy (DoE)
released a document anticipating the implementation of a bidding system. In 2011, the
government pulled out and declared the REFIT system unconstitutional [5].
In line with the White paper, an integrated resource plan (IRP) was undertaken in 2010 to
determine the future South African energy demands as well as potential generation options.
Government has indicated it wishes to procure 1000 MW of renewable per year up to the IRP
allocations. The first version of the IRP allocated 17 800 MW of RE electricity generation by
2030.
In 2011, the Government shifted from the REFIT scheme to the so-called renewable energy bids
(REBID) mechanism in order to kick-start RE deployment and to achieve the aforementioned
goal. In August 2011 the “REBID” was announced with 5 bidding windows (e.g. November 2011,
March and August 2012, March and August 2013. The initial total RE allocation was increased
from 1250 MW in the first round to 3725 MW in the second. In 2012, the total awarded PPAs
accounts for 1 415 MW of RE capacity [6].
The expected RE price reduction through the bidding system is actually taking place. For
instance, the average solar PV price dropped from 3.6 US¢/kWh to 2.3 US¢/kWh (2.7 to 1.7
US¢/kWh) between the first and second round of the IRP announcements [6]. However, the
sustainability of the bidding system is quite questionable. For instance, the prices proposed by
bidders for solar PV are so low that PPAs may not reach a financial closure. Moreover, it does not
concretely challenge the current energy regime which is tremendously reliant on coal, i.e. 93%
of the electricity generation is coal based. The short-term deployment of RE is based on a virtual
and not institutional market transformation. What about the long term horizon?
11
2.3 RENEWABLE ENERGY SUPPORT AND PROMOTION
In addition to procurements a panel of additional and complementary instruments enables to
promote and foster RE development. A non-exhaustive list of these instruments accompanied
with brief descriptions is provided below.
2.3.1 FISCAL INCENTIVES
Fiscal incentives are measures that aim at improving the competitiveness of RET. They are
either applied to support directly RE or to penalize carbon emitting technologies. In the first
case, tax rabbat or tax exemptions are employed to lower the price of RET. For instance, in South
Africa a fiscal incentive was implemented to support clean development mechanism (CDM)
activities [7]. The revenues generated by selling carbon credits are exempted of tax. On the other
hand, taxes on fossil are used to internalize the cost of environmental and social impacts
associated with the emissions of GHG. The cost of generating electricity is therefore likely to
increase which may not be adequate in countries where electricity affordability is a priority (e.g.
Namibia)
2.3.2 PUBLIC FINANCING
More than 45 countries have adopted public financing in their portfolio of incentives [8]. With
this instrument, RE projects are promoted via direct public investments. The early success of RE
in Denmark is partly related to the use of public investment. From 1979, private citizens that
procured and installed a wind turbine were reimbursed 30% of the wind turbine price by the
Danish government. However, this measure was interrupted when wind power became more
competitive [9].
2.3.3 OWNERSHIP MODEL
The Danish case illustrates that a successful RE transition must involve citizens. A top-down
approach only may result in strong oppositions of local communities to the deployment of RE. It
has been acknowledged many times in countries such as France or United Kingdom. The Danish
success story shows that a very efficient way to engage the population is to implement an
ownership model. It is defined as the financial participation of consumers in their energy supply
system. In Denmark, 150 000 owners of shares in wind turbines were registered in 2001 [9]. In
South Africa, the development wind community project is promising and seen as a relevant tool
to enhance local benefits of RE deployment [10].
The South African and Danish cases have provided good lessons for renewable energy policy
formulation. They both show that a strong governmental commitment as well as long term
planning strategies are essential to the success of RE. Moreover, a renewable energy transition
is quite unlikely without the support of local communities. The Danish model has addressed this
with the ownership model and generally a democratic approach energy planning. The lessons
learnt from these two examples will support the formulation of RE policy in the last Chapters.
12
CHAPTER 3 – RENEWABLE ENERGY SOURCES IN NAMIBIA
This Chapter provides a description of the existing electrical system in Namibia. It enables to be
familiar with the Namibian context and to understand what are the challenges concerning the
integration of renewable energy. Thereafter, the Chapter describes RES available in Namibia as
well as their techno-economic potential for a future implementation. Only RETs likely to be
commercially and technically mature by 2030 are included.
13
3.1 THE NAMIBIAN ELECTRICAL SYSTEM
3.1.1 GENERATION AND DEMAND
In 2012, the Namibian generation capacity has 415MW shared among four conventional power
plants [1]. The Ruacana Hydropower station is the main core of the Namibian power supply
system [2]. A fourth unit has been recently commissioned increasing its capacity from 240 MW
to 330 MW. However, Ruacana is a run-of-river plant and the variations in Southern Angola’s
rainfall limit its performances. It is therefore operated as a base load plant during the rainy
season (February to May) and as a peaker for the rest of the year. Van Eck 120MW coal-fired
plant was built in 1973 in the outskirt of Windhoek. The overall inefficiency and the
maintenance complications make impossible to run the ageing plant at full capacity. Moreover,
the coal necessary to run Van Eck is imported via the port of Walvis Bay and transported by
train to Windhoek. In addition to the low efficiency, coal imports make the generation cost very
high. Paratus (17 MW) and Anixas (22.5 MW) are two peaking diesel power stations respectively
commissioned in 1976 and November 2011.
The power capacity installed in Namibia is insufficient to cover the peak demand (e.g 511 MW in
July). Therefore, the power utility strongly relies on import from the Southern African Power
Pool (SAPP) (e.g. 60% in 2011). Moreover, the demand is constantly growing (4%) and the
bilateral import agreement with ZESA (Zimbabwean utility) will expire in 2013 [3]. Therefore, a
power supply deficit of 80 MW by the end of 2012 increasing to 300 MW by 2015 was
forecasted.
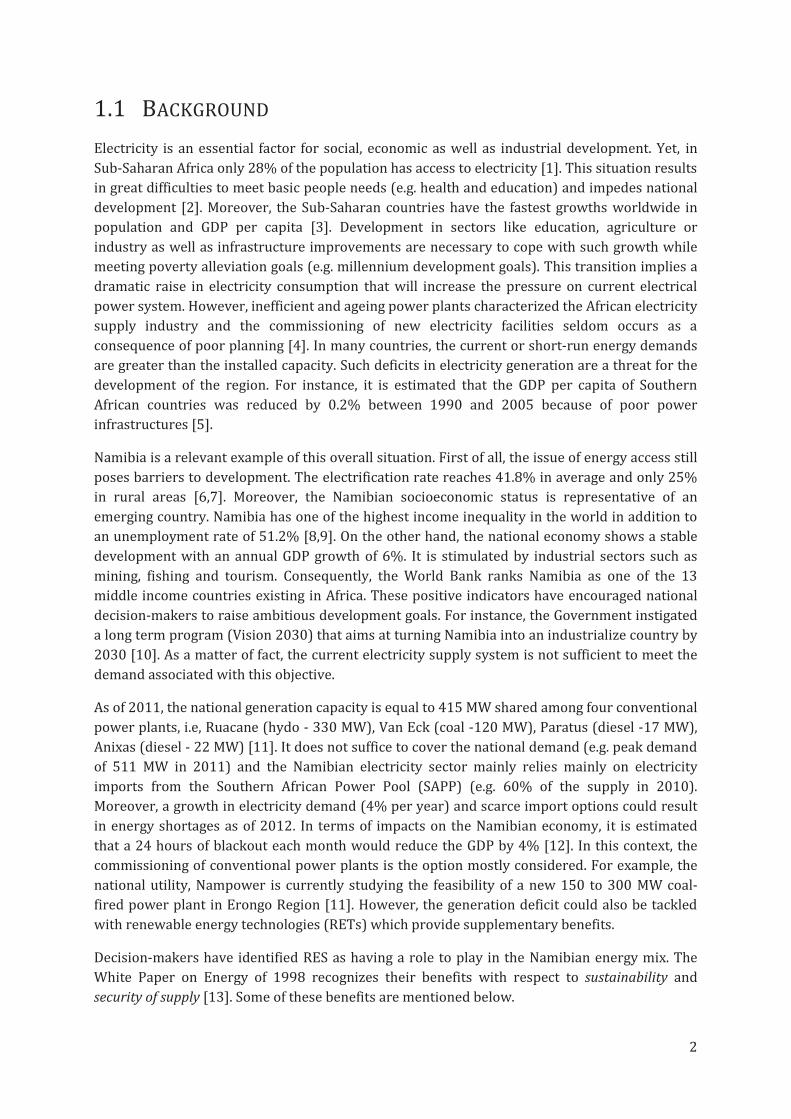
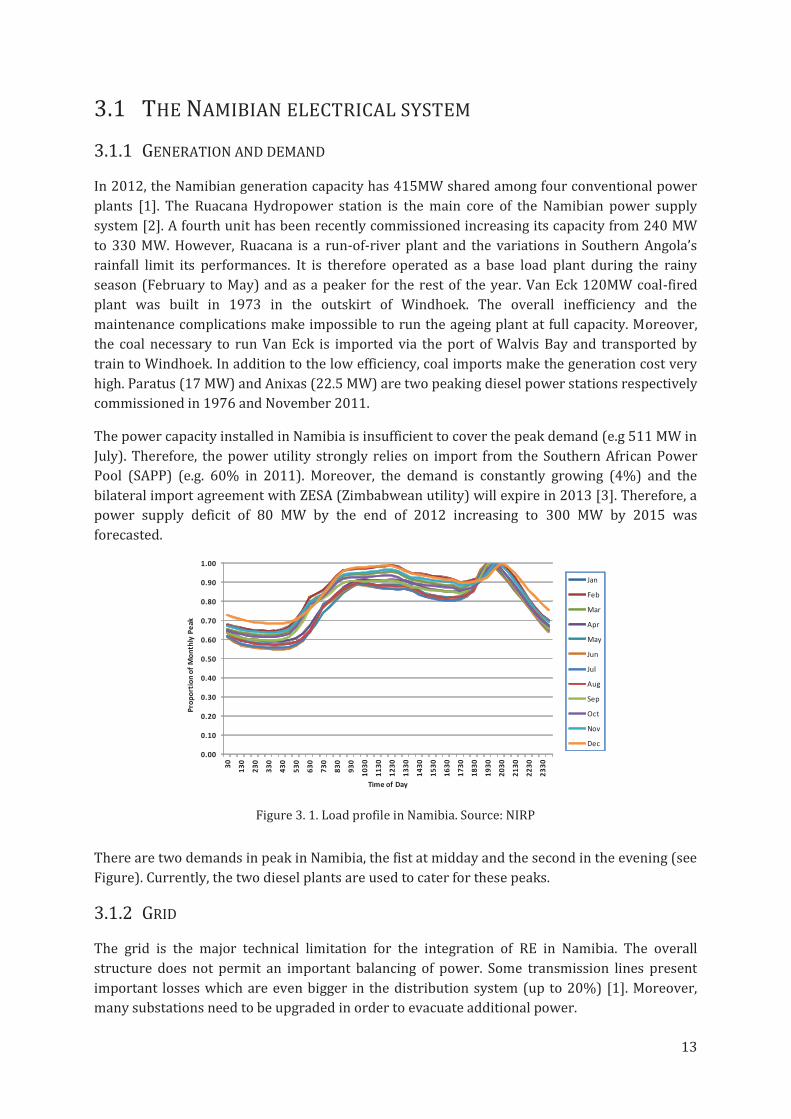
Figure 3. 1. Load profile in Namibia. Source: NIRP
There are two demands in peak in Namibia, the fist at midday and the second in the evening (see
Figure). Currently, the two diesel plants are used to cater for these peaks.
3.1.2 GRID
The grid is the major technical limitation for the integration of RE in Namibia. The overall
structure does not permit an important balancing of power. Some transmission lines present
important losses which are even bigger in the distribution system (up to 20%) [1]. Moreover,
many substations need to be upgraded in order to evacuate additional power.
0.00
0.10
0.20
0.30
0.40
0.50
0.60
0.70
0.80
0.90
1.00
30
13
0
23
0
33
0
43
0
53
0
63
0
73
0
83
0
93
0
10
30
11
30
12
30
13
30
14
30
15
30
16
30
17
30
18
30
19
30
20
30
21
30
22
30
23
30
Pro
po
rtio
n o
f M
on
thly
Pe
ak
Time of Day
Jan
Feb
Mar
Apr
May
Jun
Jul
Aug
Sep
Oct
Nov
Dec
14
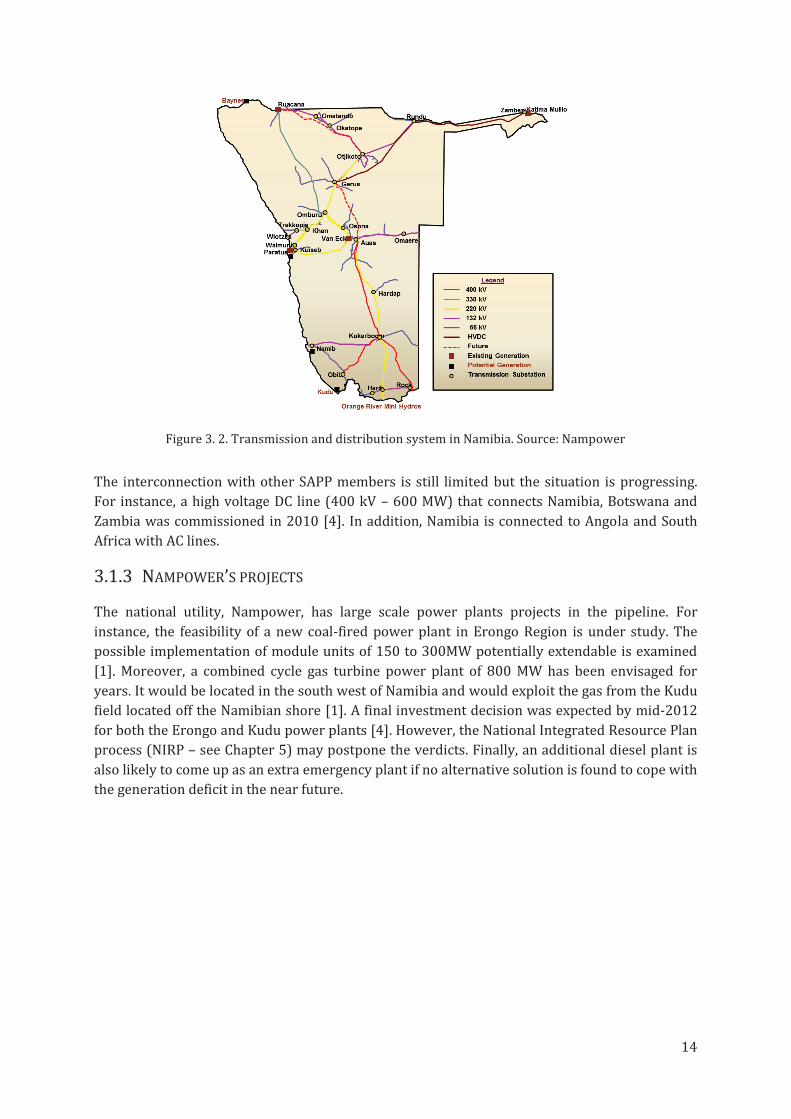
Figure 3. 2. Transmission and distribution system in Namibia. Source: Nampower
The interconnection with other SAPP members is still limited but the situation is progressing.
For instance, a high voltage DC line (400 kV – 600 MW) that connects Namibia, Botswana and
Zambia was commissioned in 2010 [4]. In addition, Namibia is connected to Angola and South
Africa with AC lines.
3.1.3 NAMPOWER’S PROJECTS
The national utility, Nampower, has large scale power plants projects in the pipeline. For
instance, the feasibility of a new coal-fired power plant in Erongo Region is under study. The
possible implementation of module units of 150 to 300MW potentially extendable is examined
[1]. Moreover, a combined cycle gas turbine power plant of 800 MW has been envisaged for
years. It would be located in the south west of Namibia and would exploit the gas from the Kudu
field located off the Namibian shore [1]. A final investment decision was expected by mid-2012
for both the Erongo and Kudu power plants [4]. However, the National Integrated Resource Plan
process (NIRP – see Chapter 5) may postpone the verdicts. Finally, an additional diesel plant is
also likely to come up as an extra emergency plant if no alternative solution is found to cope with
the generation deficit in the near future.

15
3.2 SOLAR PHOTOVOLTAIC ELECTRICITY GENERATION
3.2.1 INSTALLED CAPACITY
One of the major solar PV applications in Namibia is the solar water pumping (PVP) in the cattle
farms. Solar PV is also use for rural access to modern energy. It consists in small system
equipped with an inverter and a storage system (batteries) that provide enough electricity for
lighting, radio, TV or fans. Larger solar home systems are also utilized by households having a
substantial consumption. They can feed the grid without license if the system is smaller than 500
kV. However, there is no compensation from the power utility. There is no large commercial
solar PV plant in Namibia to date.
Figure 3. 3. Solar technologies installed per year in Namibia (2004 – 2010). Source REEEI
3.2.2 RESOURCE
Namibia has one of the best solar regimes in the world with an average high direct insolation of
2,200kWh/m2/a and minimum cloud cover. The principal climatic indicator determining the
technical potential for solar PV is the global horizontal irradiance (GHI). The areas with the
highest GHI are mostly located in the western part of Namibia, from north to south (see Annexe
1).
3.2.3 APPLICATION
Rural electrification and potential for grid connected power plants.
3.2.4 COSTS
Solar PV costs have been declining steadily over the last two decades, with an average learning
rate of 80%, i.e., a cost reduction of 20% every doubling of production [5]. The average module
selling price is around 1 USD/Wp [6]. However, the prices are likely to increase slightly in the
next few years due to the pressure on the silicon market.
16
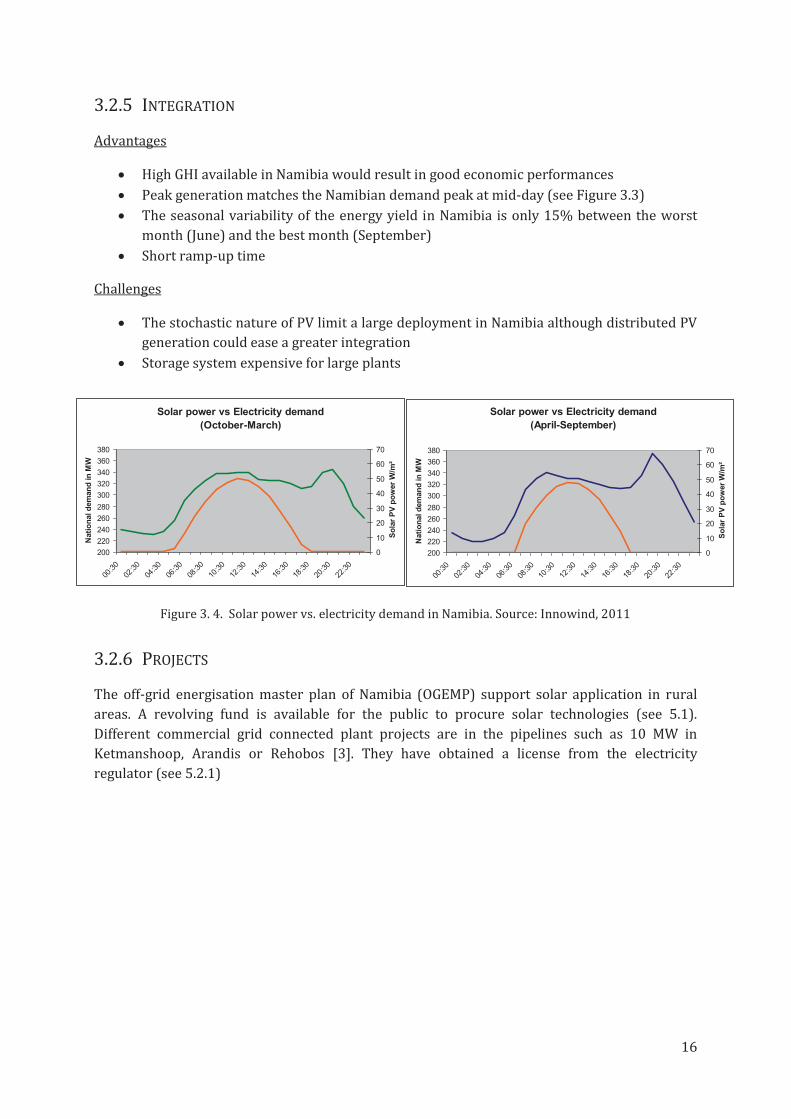
3.2.5 INTEGRATION
Advantages
· High GHI available in Namibia would result in good economic performances
· Peak generation matches the Namibian demand peak at mid-day (see Figure 3.3)
· The seasonal variability of the energy yield in Namibia is only 15% between the worst
month (June) and the best month (September)
· Short ramp-up time
Challenges
· The stochastic nature of PV limit a large deployment in Namibia although distributed PV
generation could ease a greater integration
· Storage system expensive for large plants
Figure 3. 4. Solar power vs. electricity demand in Namibia. Source: Innowind, 2011
3.2.6 PROJECTS
The off-grid energisation master plan of Namibia (OGEMP) support solar application in rural
areas. A revolving fund is available for the public to procure solar technologies (see 5.1).
Different commercial grid connected plant projects are in the pipelines such as 10 MW in
Ketmanshoop, Arandis or Rehobos [3]. They have obtained a license from the electricity
regulator (see 5.2.1)
Solar power vs Electricity demand
(October-March)
200
220
240
260
280
300
320
340
360
380
00:3
0
02:3
0
04:3
0
06:3
0
08:3
0
10:3
0
12:3
0
14:3
0
16:3
0
18:3
0
20:3
0
22:3
0
Nati
on
al d
em
an
d in
MW
0
10
20
30
40
50
60
70
So
lar
PV
po
wer
W/m
²
Solar power vs Electricity demand
(April-September)
200
220
240
260
280
300
320
340
360
380
00:3
0
02:3
0
04:3
0
06:3
0
08:3
0
10:3
0
12:3
0
14:3
0
16:3
0
18:3
0
20:3
0
22:3
0
Nati
on
al d
em
an
d in
MW
0
10
20
30
40
50
60
70
So
lar
PV
po
wer
W/m
²
17
3.3 CONCENTRATING SOLAR POWER
3.3.1 INSTALLED CAPACITY IN NAMIBIA
There is no concentrating solar power plant in Namibia to date.
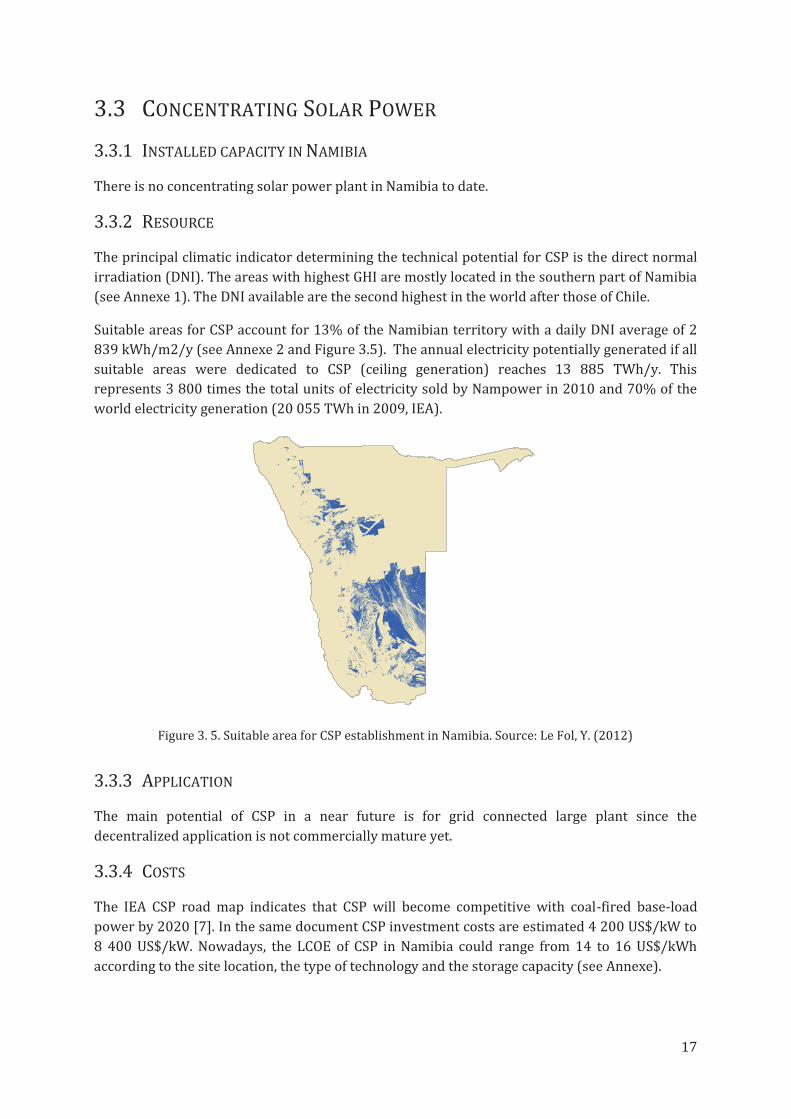
3.3.2 RESOURCE
The principal climatic indicator determining the technical potential for CSP is the direct normal
irradiation (DNI). The areas with highest GHI are mostly located in the southern part of Namibia
(see Annexe 1). The DNI available are the second highest in the world after those of Chile.
Suitable areas for CSP account for 13% of the Namibian territory with a daily DNI average of 2
839 kWh/m2/y (see Annexe 2 and Figure 3.5). The annual electricity potentially generated if all
suitable areas were dedicated to CSP (ceiling generation) reaches 13 885 TWh/y. This
represents 3 800 times the total units of electricity sold by Nampower in 2010 and 70% of the
world electricity generation (20 055 TWh in 2009, IEA).
Figure 3. 5. Suitable area for CSP establishment in Namibia. Source: Le Fol, Y. (2012)
3.3.3 APPLICATION
The main potential of CSP in a near future is for grid connected large plant since the
decentralized application is not commercially mature yet.
3.3.4 COSTS
The IEA CSP road map indicates that CSP will become competitive with coal-fired base-load
power by 2020 [7]. In the same document CSP investment costs are estimated 4 200 US$/kW to
8 400 US$/kW. Nowadays, the LCOE of CSP in Namibia could range from 14 to 16 US$/kWh
according to the site location, the type of technology and the storage capacity (see Annexe).
18
3.3.5 INTEGRATION
Advantages
· Peak generation matches the Namibian demand at mid-day
· CSP is highly dispatchable. If equipped with 6 hours of storage a CSP plant could cater for
the evening peak which is currently fulfilled by diesel plants
· CSP could generate electricity around the clock by 2020
Challenges
· No bankable data available (DNI ground measurements)
· Operation of the solar field requires skills not available in Namibia yet
3.3.6 PROJECTS
In 2012, REEEI have initiated a project focused on identifying the most viable CSP technology for
use in Namibia as well as identifying options for stimulating technology transfer.
19
3.4 WIND ENERGY
3.4.1 INSTALLED CAPACITY
There is currently one wind turbine (220 kW) installed in Namibia. It feed the distribution grid
in Erongo Region.
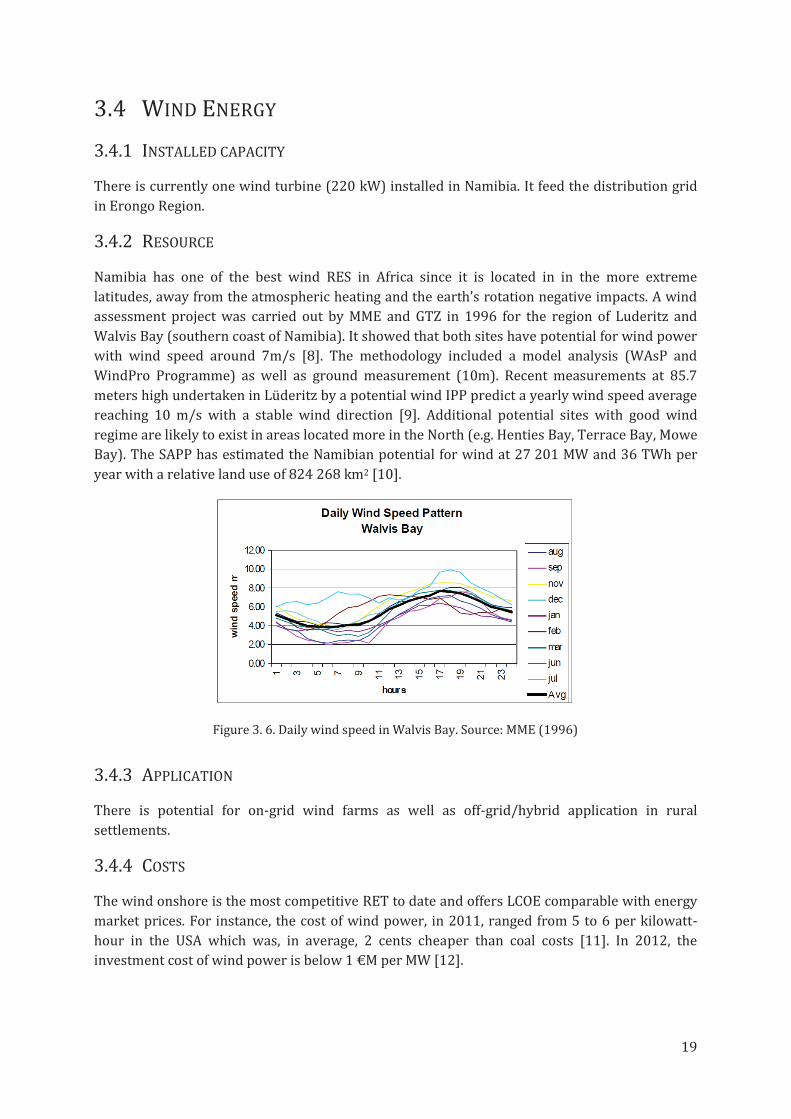
3.4.2 RESOURCE
Namibia has one of the best wind RES in Africa since it is located in in the more extreme
latitudes, away from the atmospheric heating and the earth’s rotation negative impacts. A wind
assessment project was carried out by MME and GTZ in 1996 for the region of Luderitz and
Walvis Bay (southern coast of Namibia). It showed that both sites have potential for wind power
with wind speed around 7m/s [8]. The methodology included a model analysis (WAsP and
WindPro Programme) as well as ground measurement (10m). Recent measurements at 85.7
meters high undertaken in Lüderitz by a potential wind IPP predict a yearly wind speed average
reaching 10 m/s with a stable wind direction [9]. Additional potential sites with good wind
regime are likely to exist in areas located more in the North (e.g. Henties Bay, Terrace Bay, Mowe
Bay). The SAPP has estimated the Namibian potential for wind at 27 201 MW and 36 TWh per
year with a relative land use of 824 268 km2 [10].
Figure 3. 6. Daily wind speed in Walvis Bay. Source: MME (1996)
3.4.3 APPLICATION
There is potential for on-grid wind farms as well as off-grid/hybrid application in rural
settlements.
3.4.4 COSTS
The wind onshore is the most competitive RET to date and offers LCOE comparable with energy
market prices. For instance, the cost of wind power, in 2011, ranged from 5 to 6 per kilowatt-
hour in the USA which was, in average, 2 cents cheaper than coal costs [11]. In 2012, the
investment cost of wind power is below 1 €M per MW [12].
20
3.4.5 INTEGRATION
Advantages
· According to recent estimations, 100 MW of wind energy could be integrated into the
system without major grid reinforcement [13]. However, these estimations do not take
into consideration the possible integration of other RETs.
· The wind available at the sea shore blows more in the late afternoon when the second
load peak demand occurs.
· Short ramp-up time.
Challenges
· The stochastic nature of wind power limits a large deployment in Namibia
· The wind resource is localized in one area which limits the dispatchability potential
· Storage system expensive for large plants
3.4.6 PROJECTS
So far, the electricity regulator has issued three licenses for wind power production and
Nampower is discussing PPA with two IPPs, i.e. Diaz and Innowind, which accessed sites
respectively in Lüderitz and Walvis Bay [3].
21
3.5 BIOMASS ENERGY
3.5.1 INSTALLED CAPACITY
From 2007 to 2010, the project Combating Bush Encroachment for Namibia’s Development
(CBEND) funded by the European Union (N$ 14 million) established the first bush to electricity
demonstration plant (250 kW) in Namibia. It was also the first PPA signed by Nampower with an
IPP [14]. However, the power plant does not feed electricity yet due to the low power factor of
the connecting line.
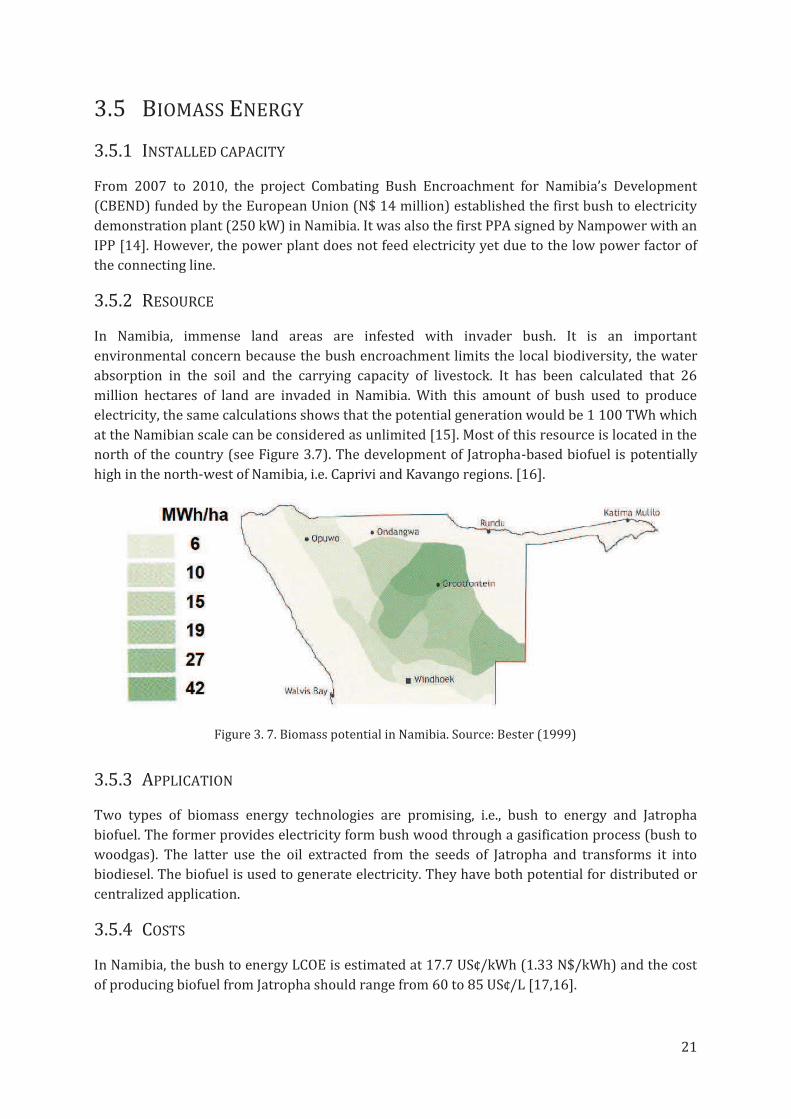
3.5.2 RESOURCE
In Namibia, immense land areas are infested with invader bush. It is an important
environmental concern because the bush encroachment limits the local biodiversity, the water
absorption in the soil and the carrying capacity of livestock. It has been calculated that 26
million hectares of land are invaded in Namibia. With this amount of bush used to produce
electricity, the same calculations shows that the potential generation would be 1 100 TWh which
at the Namibian scale can be considered as unlimited [15]. Most of this resource is located in the
north of the country (see Figure 3.7). The development of Jatropha-based biofuel is potentially
high in the north-west of Namibia, i.e. Caprivi and Kavango regions. [16].
Figure 3. 7. Biomass potential in Namibia. Source: Bester (1999)
3.5.3 APPLICATION
Two types of biomass energy technologies are promising, i.e., bush to energy and Jatropha
biofuel. The former provides electricity form bush wood through a gasification process (bush to
woodgas). The latter use the oil extracted from the seeds of Jatropha and transforms it into
biodiesel. The biofuel is used to generate electricity. They have both potential for distributed or
centralized application.
3.5.4 COSTS
In Namibia, the bush to energy LCOE is estimated at 17.7 US¢/kWh (1.33 N$/kWh) and the cost
of producing biofuel from Jatropha should range from 60 to 85 US¢/L [17,16].
22
3.5.5 INTEGRATION
Advantages
· Potentially very interesting value chain (e.g. rural development, jobs creation, electricity
generation) [18].
· Easy to integrate into the system since the electricity output is stable
· High capacity factor
· Enable to limit bush encroachment
Challenges
· Sustainable management of the resource
· Socioeconomic impact assessments showed that Jatropha presents a risk for food
security if implemented widely. The Government suspended Jatropha projects in
Namibia.
· The potential to adapt climate change (e.g. water scarcity) and financial viability of
Jatropha to energy projects may be limited. [19]
3.5.6 PROJECTS
Since CBEND was commissioned there is no biomass project in the pipelines.
23
3.6 HYDROPOWER
3.6.1 INSTALLED CAPACITY
In 2010, 64% of the electricity was generated with Ruacana hydropower plant [1]. Ruacana
hydropower has now a capacity of 332 MW.
3.6.2 RESOURCE
Namibia’s only perennial rivers are the Kunene, Kavango (forming borders with Angola and
Zambia in the north) and the Orange River bordering South Africa in the south.
3.6.3 APPLICATION
Hydropower can be used for large scale power plants of hundreds megawatts and for small
decentralized application such as micro and pico hydropower [20]. The main applications of
hydropower in Namibia are large and small grid connected plant. This is mainly due to the
resource available.
3.6.4 COSTS
Hydropower is known to provide a base-load generation at the least expensive cost. However,
both large and small scales hydropower projects involve economic challenges. Large
hydropower plants are highly centralized and often involve considerable size while there is not
any business model for small hydro in Africa proven yet [21] (for local costs see below:
Projects).
3.6.5 INTEGRATION
Advantages
· Base load characteristic
· Renewable technology already known in Namibia
Challenges
· Any new hydro project in Namibia is likely to be lengthy due to bilateral negotiations
[28]. Impact of climate variation on the river flow
· Potential construction site far away from transmission lines
3.6.6 PROJECTS
Nampower is examining the possibility of installing a second hydropower plant on Kunene
River, downstream to Ruacana. The project (Baynes Hydro) has been in the pipelines for many
decades. However, political tensions with Angola as well as socio-environmental concerns have
restricted the project to a feasibility study [22]. Nowadays, the perspective to supply Southern
Africa from a large hydropower plant has raised interests for both parties. A 600 MW mid-
merit/peaking plant is expected to be commissioned in 2018 [3]. The estimated project
implementation cost is about US$ 1.3 billion (US$ 10 billion).

24
The deployment of small hydropower plants (6 to 12 MW) along the Orange River for a total
capacity of 70 MW is examined by Nampower. The estimated cost is around US$ 5 million to U$
35 million and it is planned to develop the project as a clean development mechanism activity
[23].

25
CHAPTER 4 - THEORETICAL FRAMEWORK
This chapter describes the theoretical framework developed to address the problem formulation
and the research questions mentioned in the introduction. First, a short description of the social
construction of technology (SCOT) is provided in order to facilitate the introduction of the multi-
level approach applied in this study.

26
4.1 SOCIAL CONSTRUCTION OF TECHNOLOGY (SCOT)
In the article “The Social Construction of Facts and Artefacts: Or How the Sociology of Science
and the Sociology of Technology Might Benefit Each Other” (1987) Pinch and Bijker expound the
SCOT [1]. The conceptual approach poised by the authors stand in opposition with an
essentialist or linear comprehension of technology evolution. It is rather perceived that the
interplay of multiple and heterogeneous groups forming the society shapes the design of
technologies. This process is named interpretative flexibility. The social circumstances determine
the success and the suitability of a certain technology. The meaning of a technology is therefore
constructed and its characteristics are subjected to interpretations. Moreover, negotiations
between relevant social groups are seminal with regard to the design of technologies. Each group
sees differently whether or not the innovation could fulfil its needs or interests. A deliberation
process involving views on the technology results in the definitive role played by the technology
within the society. When the social groups enter in agreement and see the problem as being
solved, a phenomenon of stabilization and closure occurs. The society is cohesive toward the
technology.
SCOT set the basis for analysing innovation and technology from a social point of view. It
explains the potential for societies to influence upon technological artefacts. However, certain
dynamics such as the wider diffusion or the replacement of technologies are not fully covered.
Similarly, the possible coevolution of the technology and the society is overshadowed. A certain
technology may influence change in such aspects as user practices, regulation or the industry
and vice-versa [2].

27
4.2 MULTI-LEVEL PERSPECTIVE (MLP)
The Namibian energy sector is currently moving toward more renewable energy. In order to
examine this transition qualitatively the MLP has been selected as the most relevant theoretical
approach. The following paragraphs provide a comprehensive description of the MLP.
4.2.1 SOCIOTECHNICAL SYSTEM AND SYSTEM INNOVATION
The energy supply, as well as transportation or housing, are functions inherent to the society.
They are fulfilled not only by producers and consumers but imply a number of additional agents
(e.g. regulation and policies, knowledge, culture meanings, technologies and infrastructure). A
sociotechnical system is defined as the network of agents that structures and enables the
societal function [3]. Nevertheless, social groups create and maintain the sociotechnical system.
Their characteristics, linkages as well as their interactions are essential to understand the
dynamics of the sociotechnical system. Moreover, sociotechnical systems are prone to
innovations that stem from co-evolution of both the technology and the social groups. In this
regard, a system innovation is defined as a change from a sociotechnical system to another [4].
The MLP tend to capture the dynamic of the system innovation both in terms of society and
technology. It offers general patterns from the first step to the wide diffusion of a technology
within a society. Thus, it is possible to examine a society through the MLP and determine
whether transition through innovation are taking place and at which level.
In the last decade, system innovation and sociotechnical system have been further studied,
particularly in relation with sustainable development. Researchers as well as decision makers
wish to better understand their mechanisms in order to trigger change toward greener societies.
In the Netherlands, for example, the multi-level approach has been put into practice [5]. In 2001,
the Fourth Dutch National Environmental Policy Plan (NMP4) called for a transition toward a
more sustainability based on system innovation. Dutch researchers made policy prescription as
well as a transition management (TM) model in order to prescribe a long-term transition agenda
[6]. Although it has been difficult to preserve the original approach from the influence of regime
incumbents and to evaluate actual outcomes, the TM has created a long-term thinking and
objectives for a sustainable energy system in the Netherlands [7].
4.2.2 SYSTEM INNOVATION LEVELS
Geels and others elaborated three analytical levels to describe the patterns of system innovation
(see figure 4.1) [3,8]. A description of these levels is given below while the dynamic of a system
innovation is provided in the next paragraph (see 4.2.3.).
SOCIOTECHNICAL REGIME
The sociotechnical regime or meso-level includes the social groups and their linkages that
produce the sociotechnical system. This level is expected to be locked-in with regard to radical
innovation breakthrough since the sociotechnical system in place is stable. However, the relative
autonomy of social groups let room for incremental technology development.

28
Figure 4.1: Multi levels hierarchy. Source: Geels, 2007
The sociotechnical level is embedded in between two other levels which are the niche and the
landscape (see figure 4.1).
NICHE
The niche or micro-level is perceived as the locus for radical innovation. It is a protected space
where innovation blooms without being impacted or undermined by the established market.
The learning process is therefore facilitated and new user practices, regulation and industry
initiate their development. The innovation also begins to acquire its cultural meaning in the
niche. Moreover, the problems met in the existing regime are potentially drivers for the search of
innovation at the niche level.
LANDSCAPE
The landscape or macro-level represent the external environment whereby the sociotechnical
regime in place has no influence. On the other hand, the landscape affects the sociotechnical
regime. For instance, the international relations on climate change (e.g. Kyoto protocol) may
trigger transition in the energy supply system of a signatory.
4.2.3 SYSTEM INNOVATION: DYNAMICS AND PATTERNS
Four steps have been identified in the system innovation dynamic. First of all, the innovation
emerges in the niche while the sociotechnical regime remains intact. However, there is not a
predominant design standing yet and experimentations as well as improvisations tend to find
out which one match user practices and requirements. This first step results in the development
of a niche market and production. A community of engineers and specialists appears and
catalyses the development of the novelty. Consequently, the learning process contributes to the
stabilization of the innovation within the niche. The third step is the breakthrough and the
diffusion of the new technology at the level of the sociotechnical regime. Internal drivers may
favour the establishment of the novelty to the detriment of the system in place. For instance,
prices, actor interests or unsolved problems associated with the old technology. Changes at the
landscape level have also an important influence on the success of the breakthrough. They may
add new requirements on the existing regime that cannot be met with the old technology. On the
other hand, regime incumbents having conservative interests intend to impede the development
of the innovation. This results in a competition between both technologies. Finally, in the case of
a successful transition, the innovation blossoms out and gradually replaces the old regime.
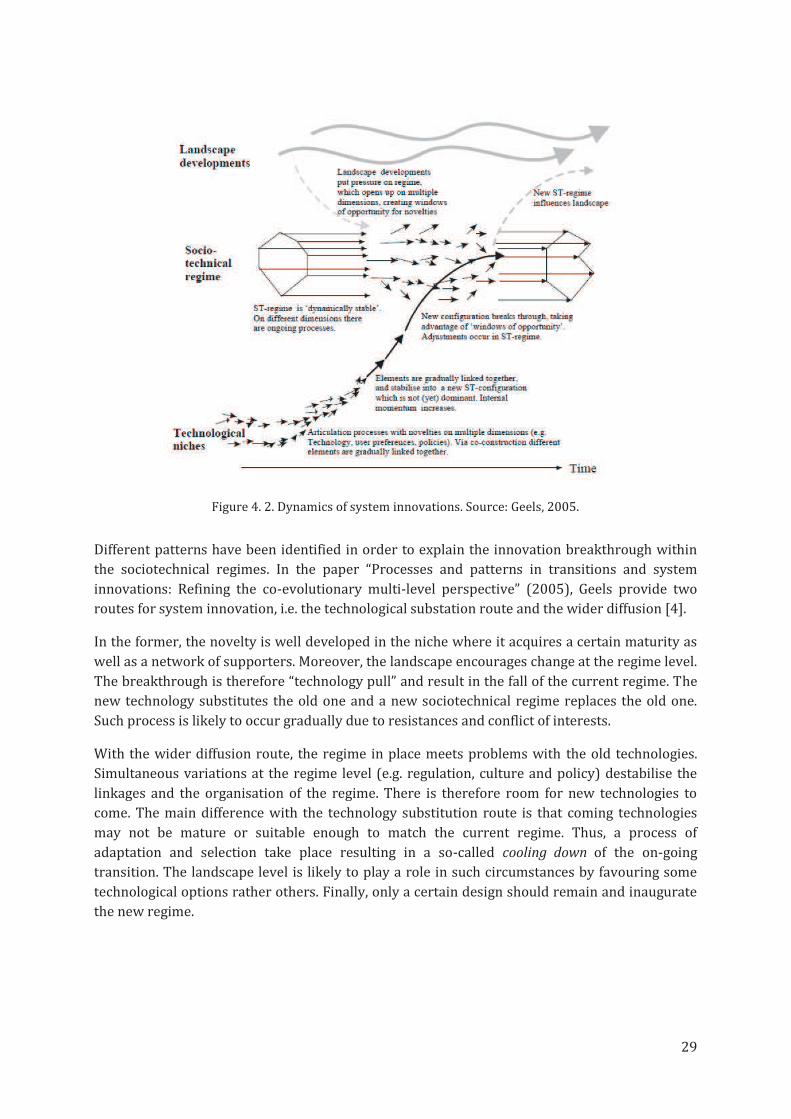
29
Figure 4. 2. Dynamics of system innovations. Source: Geels, 2005.
Different patterns have been identified in order to explain the innovation breakthrough within
the sociotechnical regimes. In the paper “Processes and patterns in transitions and system
innovations: Refining the co-evolutionary multi-level perspective” (2005), Geels provide two
routes for system innovation, i.e. the technological substation route and the wider diffusion [4].
In the former, the novelty is well developed in the niche where it acquires a certain maturity as
well as a network of supporters. Moreover, the landscape encourages change at the regime level.
The breakthrough is therefore “technology pull” and result in the fall of the current regime. The
new technology substitutes the old one and a new sociotechnical regime replaces the old one.
Such process is likely to occur gradually due to resistances and conflict of interests.
With the wider diffusion route, the regime in place meets problems with the old technologies.
Simultaneous variations at the regime level (e.g. regulation, culture and policy) destabilise the
linkages and the organisation of the regime. There is therefore room for new technologies to
come. The main difference with the technology substitution route is that coming technologies
may not be mature or suitable enough to match the current regime. Thus, a process of
adaptation and selection take place resulting in a so-called cooling down of the on-going
transition. The landscape level is likely to play a role in such circumstances by favouring some
technological options rather others. Finally, only a certain design should remain and inaugurate
the new regime.

30
CHAPTER 5 – ENERGY SYSTEM INNOVATION IN NAMIBIA
The Chapters 5 studies the Namibian energy sector with the Multi-Level Perspective (MLP)
described in the previous chapter. The three levels are analysed specifically and the overall
transition is evaluated accordingly.
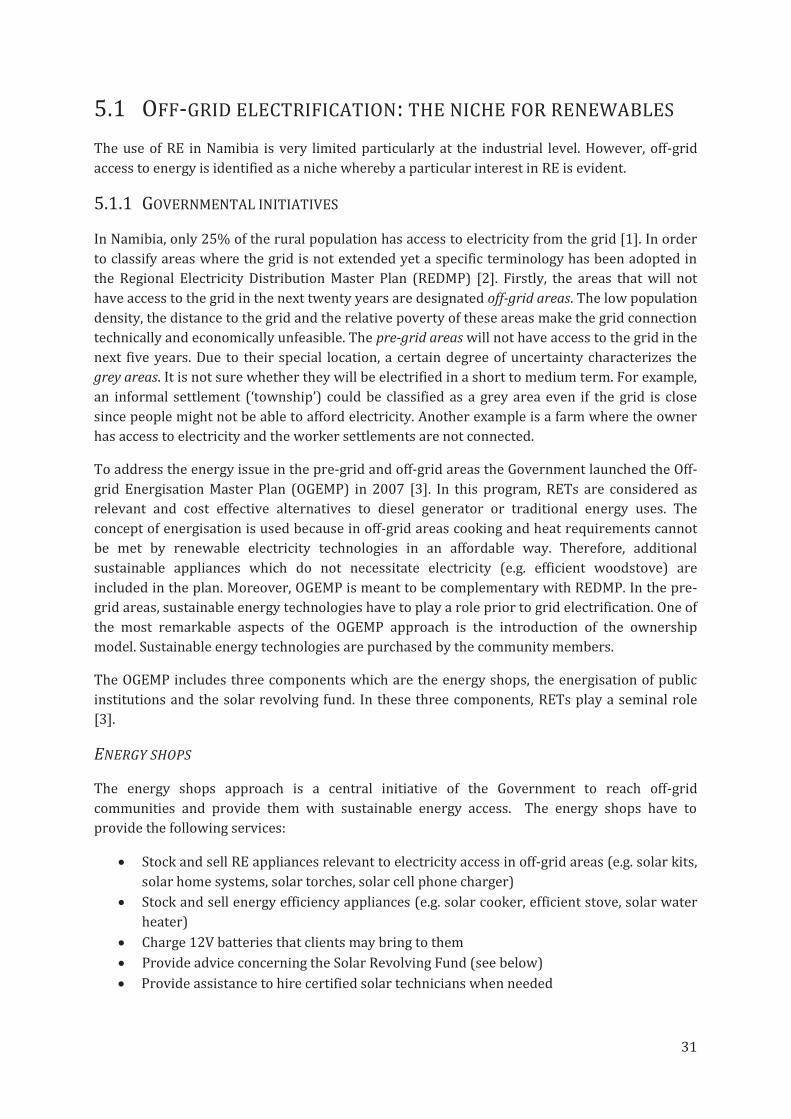
31
5.1 OFF-GRID ELECTRIFICATION: THE NICHE FOR RENEWABLES
The use of RE in Namibia is very limited particularly at the industrial level. However, off-grid
access to energy is identified as a niche whereby a particular interest in RE is evident.
5.1.1 GOVERNMENTAL INITIATIVES
In Namibia, only 25% of the rural population has access to electricity from the grid [1]. In order
to classify areas where the grid is not extended yet a specific terminology has been adopted in
the Regional Electricity Distribution Master Plan (REDMP) [2]. Firstly, the areas that will not
have access to the grid in the next twenty years are designated off-grid areas. The low population
density, the distance to the grid and the relative poverty of these areas make the grid connection
technically and economically unfeasible. The pre-grid areas will not have access to the grid in the
next five years. Due to their special location, a certain degree of uncertainty characterizes the
grey areas. It is not sure whether they will be electrified in a short to medium term. For example,
an informal settlement (‘township’) could be classified as a grey area even if the grid is close
since people might not be able to afford electricity. Another example is a farm where the owner
has access to electricity and the worker settlements are not connected.
To address the energy issue in the pre-grid and off-grid areas the Government launched the Off-
grid Energisation Master Plan (OGEMP) in 2007 [3]. In this program, RETs are considered as
relevant and cost effective alternatives to diesel generator or traditional energy uses. The
concept of energisation is used because in off-grid areas cooking and heat requirements cannot
be met by renewable electricity technologies in an affordable way. Therefore, additional
sustainable appliances which do not necessitate electricity (e.g. efficient woodstove) are
included in the plan. Moreover, OGEMP is meant to be complementary with REDMP. In the pre-
grid areas, sustainable energy technologies have to play a role prior to grid electrification. One of
the most remarkable aspects of the OGEMP approach is the introduction of the ownership
model. Sustainable energy technologies are purchased by the community members.
The OGEMP includes three components which are the energy shops, the energisation of public
institutions and the solar revolving fund. In these three components, RETs play a seminal role
[3].
ENERGY SHOPS
The energy shops approach is a central initiative of the Government to reach off-grid
communities and provide them with sustainable energy access. The energy shops have to
provide the following services:
· Stock and sell RE appliances relevant to electricity access in off-grid areas (e.g. solar kits,
solar home systems, solar torches, solar cell phone charger)
· Stock and sell energy efficiency appliances (e.g. solar cooker, efficient stove, solar water
heater)
· Charge 12V batteries that clients may bring to them
· Provide advice concerning the Solar Revolving Fund (see below)
· Provide assistance to hire certified solar technicians when needed
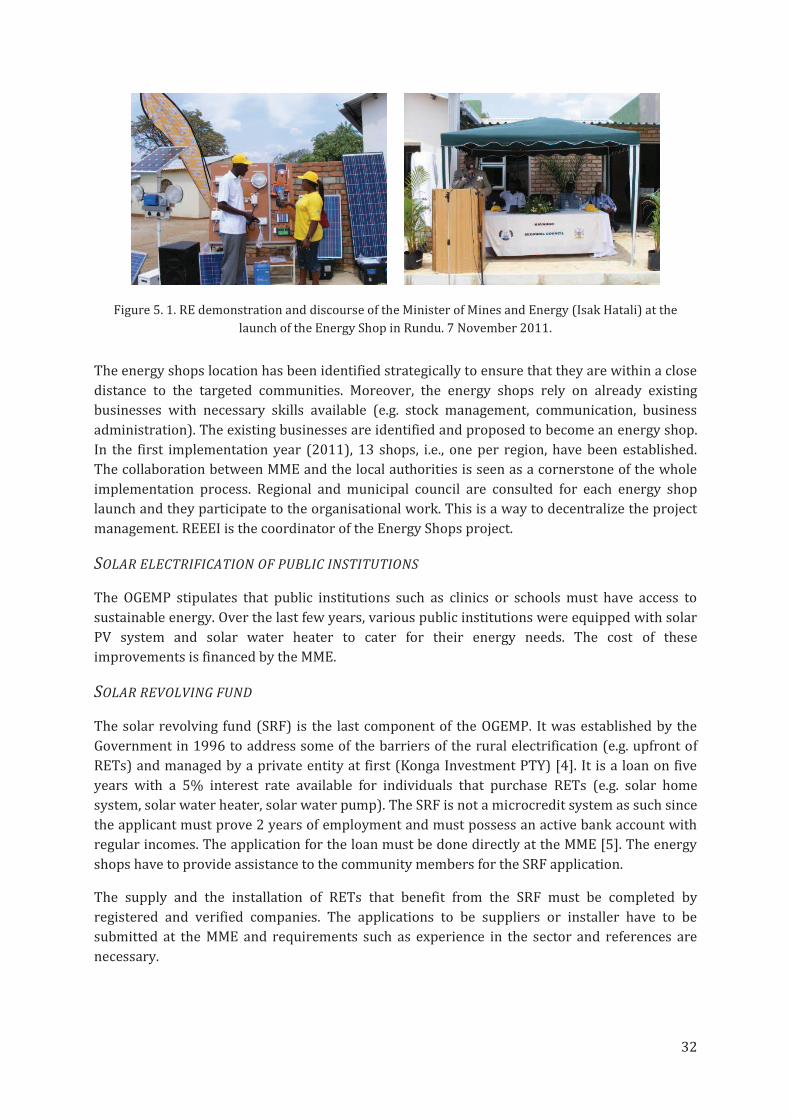
32
Figure 5. 1. RE demonstration and discourse of the Minister of Mines and Energy (Isak Hatali) at the
launch of the Energy Shop in Rundu. 7 November 2011.
The energy shops location has been identified strategically to ensure that they are within a close
distance to the targeted communities. Moreover, the energy shops rely on already existing
businesses with necessary skills available (e.g. stock management, communication, business
administration). The existing businesses are identified and proposed to become an energy shop.
In the first implementation year (2011), 13 shops, i.e., one per region, have been established.
The collaboration between MME and the local authorities is seen as a cornerstone of the whole
implementation process. Regional and municipal council are consulted for each energy shop
launch and they participate to the organisational work. This is a way to decentralize the project
management. REEEI is the coordinator of the Energy Shops project.
SOLAR ELECTRIFICATION OF PUBLIC INSTITUTIONS
The OGEMP stipulates that public institutions such as clinics or schools must have access to
sustainable energy. Over the last few years, various public institutions were equipped with solar
PV system and solar water heater to cater for their energy needs. The cost of these
improvements is financed by the MME.
SOLAR REVOLVING FUND
The solar revolving fund (SRF) is the last component of the OGEMP. It was established by the
Government in 1996 to address some of the barriers of the rural electrification (e.g. upfront of
RETs) and managed by a private entity at first (Konga Investment PTY) [4]. It is a loan on five
years with a 5% interest rate available for individuals that purchase RETs (e.g. solar home
system, solar water heater, solar water pump). The SRF is not a microcredit system as such since
the applicant must prove 2 years of employment and must possess an active bank account with
regular incomes. The application for the loan must be done directly at the MME [5]. The energy
shops have to provide assistance to the community members for the SRF application.
The supply and the installation of RETs that benefit from the SRF must be completed by
registered and verified companies. The applications to be suppliers or installer have to be
submitted at the MME and requirements such as experience in the sector and references are
necessary.

33
RENEWABLE ENERGY TRAININGS
In order to complement the OGEMP, multiple training sessions for RE technicians have been
organised. It aims at ensuring that necessary skills for the installation and maintenance of RETs
are spread over the countries. Manifold program have been undertaken over the last few years
mainly under the management of REEEI (e.g. Soltrain, SIDA – Life Academy) [6].
CHALLENGES
First of all, the implementation of reliable supply chain for quality RE appliances is problematic.
Some of the energy shops meet difficulties to access and stock up the goods [7]. It weakens the
projects since the availability and accessibility of RE to the community are limited
Although trainings are provided, the insufficiency of adequately qualified electrical contracting
companies and PV installers presents a major problem. Consequently, SRF applications suffer
from a large backlog (e.g. 600 applications in October 2011) which risks to destabilise the
overall approach [8]. The confidence of the public is necessary for the success and the credibility
of the program indeed.
The OGEMP is mainly finance by the Government which allocates a budget for rural
electrification activities. Funding from the Nampower Performance Agreement (NP) are also
available. It implies that shares from Nampower’s benefits are allocated to rural electrification
programs. However, the budget to complete an entire energisation of the country either through
grid extension or sustainable energy access has been estimated at approximately US$ 210
million (N$ 1.5 billion). There is consequently a limited budget to carry out all projects, not to
say insufficient [1].
Finally, the SRF is of no avail for the very low income population. There is no adequate scheme in
the OGEMP that targets this part of the society.
5.1.2 MICRO-GRID APPROACH
TSUMKWE HYBRID ENERGY SYSTEM
A successful RE project that has been recognized at the national level is the construction of a
hybrid system (diesel and solar PV) for the benefit of the San community of Tsumkwe
(Otjozondjupa Region). A decentralized system in Tsumkwe has been designated as the best
option since the community is located 200 kilometres away from the grid making an extension
economically or technically unfeasible even in a long term.
The project was coordinated by the Desert Research Foundation of Namibia (DRFN) and funded
by the European Union (75%), Nampower (14%) and Otjozondjupa Council (11%) for a total
amount of US$ 3.5 million (N$ 26 million). The hybrid installation is made of a peaking/back up
diesel plant together with a solar PV system (200 kWp) equipped with 1 MW of battery storage.
It produces electricity around the clock and, a micro-grid with 11kV lines supplies electricity to
the public institutions (e.g. school, clinic and police station) and households [9,10].
The project was inaugurated in January 2012 and the monitoring of social as well as economic
impacts is yet to be done.
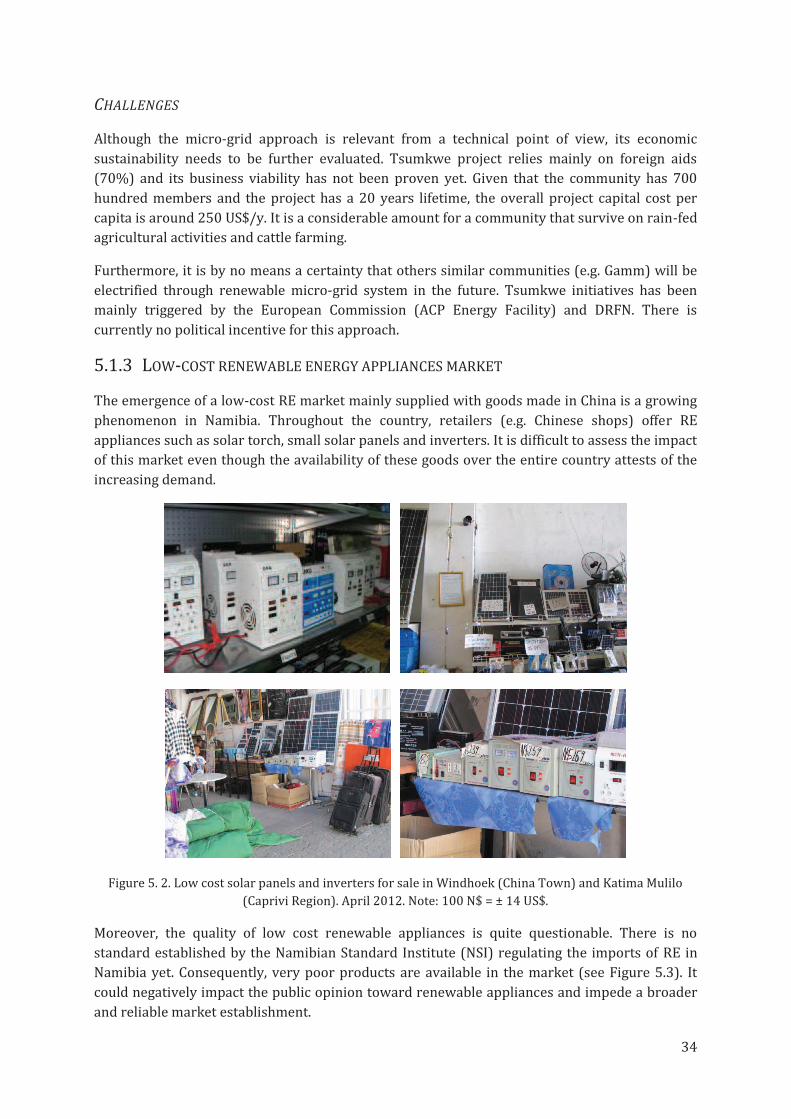
34
CHALLENGES
Although the micro-grid approach is relevant from a technical point of view, its economic
sustainability needs to be further evaluated. Tsumkwe project relies mainly on foreign aids
(70%) and its business viability has not been proven yet. Given that the community has 700
hundred members and the project has a 20 years lifetime, the overall project capital cost per
capita is around 250 US$/y. It is a considerable amount for a community that survive on rain-fed
agricultural activities and cattle farming.
Furthermore, it is by no means a certainty that others similar communities (e.g. Gamm) will be
electrified through renewable micro-grid system in the future. Tsumkwe initiatives has been
mainly triggered by the European Commission (ACP Energy Facility) and DRFN. There is
currently no political incentive for this approach.
5.1.3 LOW-COST RENEWABLE ENERGY APPLIANCES MARKET
The emergence of a low-cost RE market mainly supplied with goods made in China is a growing
phenomenon in Namibia. Throughout the country, retailers (e.g. Chinese shops) offer RE
appliances such as solar torch, small solar panels and inverters. It is difficult to assess the impact
of this market even though the availability of these goods over the entire country attests of the
increasing demand.
Figure 5. 2. Low cost solar panels and inverters for sale in Windhoek (China Town) and Katima Mulilo
(Caprivi Region). April 2012. Note: 100 N$ = ± 14 US$.
Moreover, the quality of low cost renewable appliances is quite questionable. There is no
standard established by the Namibian Standard Institute (NSI) regulating the imports of RE in
Namibia yet. Consequently, very poor products are available in the market (see Figure 5.3). It
could negatively impact the public opinion toward renewable appliances and impede a broader
and reliable market establishment.
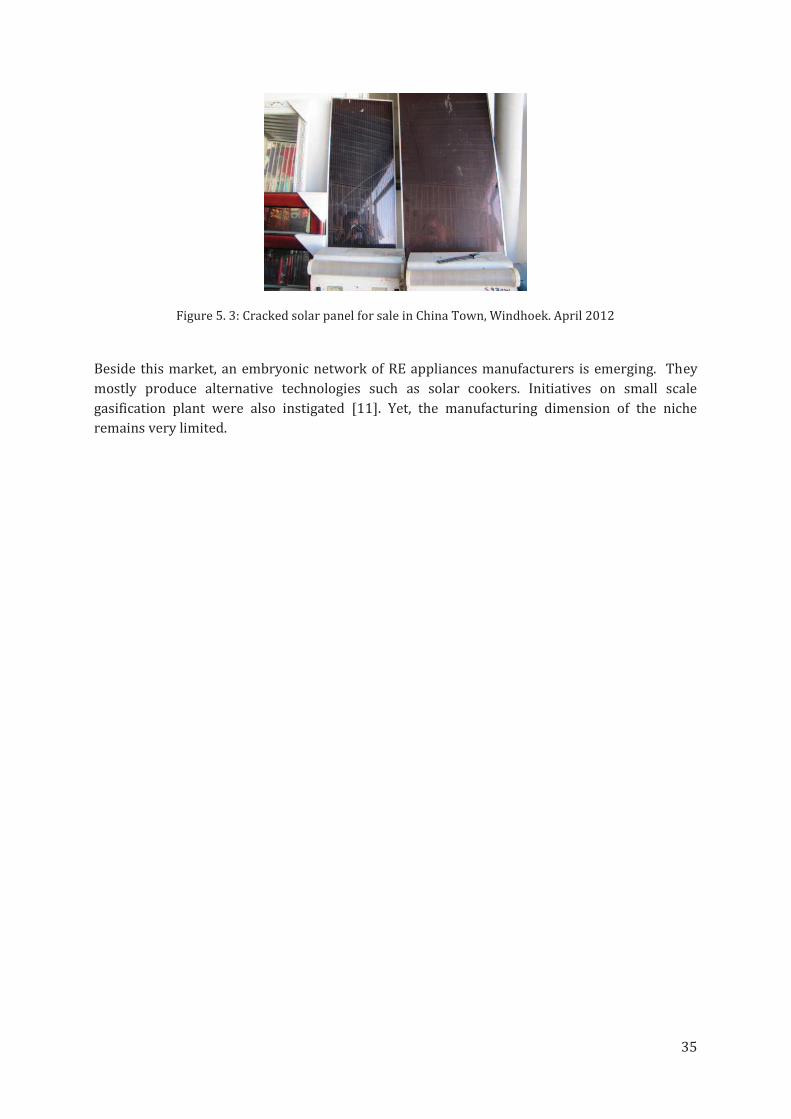
35
Figure 5. 3: Cracked solar panel for sale in China Town, Windhoek. April 2012
Beside this market, an embryonic network of RE appliances manufacturers is emerging. They
mostly produce alternative technologies such as solar cookers. Initiatives on small scale
gasification plant were also instigated [11]. Yet, the manufacturing dimension of the niche
remains very limited.
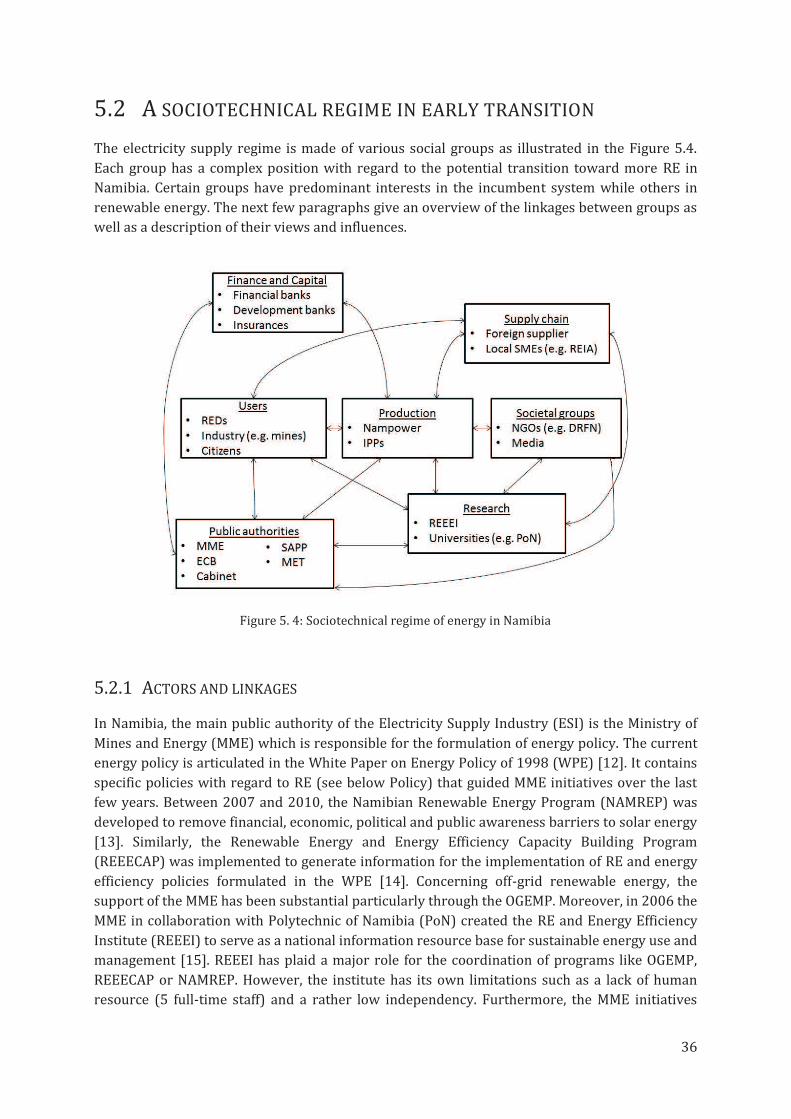
36
5.2 A SOCIOTECHNICAL REGIME IN EARLY TRANSITION
The electricity supply regime is made of various social groups as illustrated in the Figure 5.4.
Each group has a complex position with regard to the potential transition toward more RE in
Namibia. Certain groups have predominant interests in the incumbent system while others in
renewable energy. The next few paragraphs give an overview of the linkages between groups as
well as a description of their views and influences.
Figure 5. 4: Sociotechnical regime of energy in Namibia
5.2.1 ACTORS AND LINKAGES
In Namibia, the main public authority of the Electricity Supply Industry (ESI) is the Ministry of
Mines and Energy (MME) which is responsible for the formulation of energy policy. The current
energy policy is articulated in the White Paper on Energy Policy of 1998 (WPE) [12]. It contains
specific policies with regard to RE (see below Policy) that guided MME initiatives over the last
few years. Between 2007 and 2010, the Namibian Renewable Energy Program (NAMREP) was
developed to remove financial, economic, political and public awareness barriers to solar energy
[13]. Similarly, the Renewable Energy and Energy Efficiency Capacity Building Program
(REEECAP) was implemented to generate information for the implementation of RE and energy
efficiency policies formulated in the WPE [14]. Concerning off-grid renewable energy, the
support of the MME has been substantial particularly through the OGEMP. Moreover, in 2006 the
MME in collaboration with Polytechnic of Namibia (PoN) created the RE and Energy Efficiency
Institute (REEEI) to serve as a national information resource base for sustainable energy use and
management [15]. REEEI has plaid a major role for the coordination of programs like OGEMP,
REEECAP or NAMREP. However, the institute has its own limitations such as a lack of human
resource (5 full-time staff) and a rather low independency. Furthermore, the MME initiatives
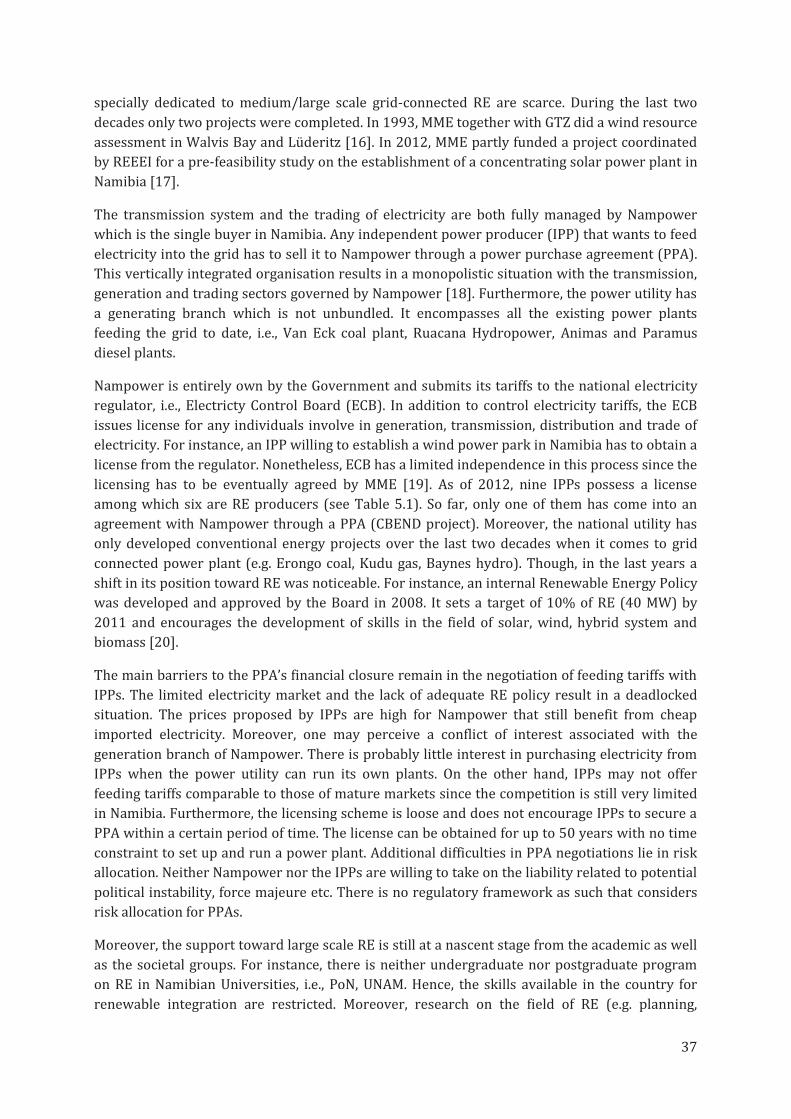
37
specially dedicated to medium/large scale grid-connected RE are scarce. During the last two
decades only two projects were completed. In 1993, MME together with GTZ did a wind resource
assessment in Walvis Bay and Lüderitz [16]. In 2012, MME partly funded a project coordinated
by REEEI for a pre-feasibility study on the establishment of a concentrating solar power plant in
Namibia [17].
The transmission system and the trading of electricity are both fully managed by Nampower
which is the single buyer in Namibia. Any independent power producer (IPP) that wants to feed
electricity into the grid has to sell it to Nampower through a power purchase agreement (PPA).
This vertically integrated organisation results in a monopolistic situation with the transmission,
generation and trading sectors governed by Nampower [18]. Furthermore, the power utility has
a generating branch which is not unbundled. It encompasses all the existing power plants
feeding the grid to date, i.e., Van Eck coal plant, Ruacana Hydropower, Animas and Paramus
diesel plants.
Nampower is entirely own by the Government and submits its tariffs to the national electricity
regulator, i.e., Electricty Control Board (ECB). In addition to control electricity tariffs, the ECB
issues license for any individuals involve in generation, transmission, distribution and trade of
electricity. For instance, an IPP willing to establish a wind power park in Namibia has to obtain a
license from the regulator. Nonetheless, ECB has a limited independence in this process since the
licensing has to be eventually agreed by MME [19]. As of 2012, nine IPPs possess a license
among which six are RE producers (see Table 5.1). So far, only one of them has come into an
agreement with Nampower through a PPA (CBEND project). Moreover, the national utility has
only developed conventional energy projects over the last two decades when it comes to grid
connected power plant (e.g. Erongo coal, Kudu gas, Baynes hydro). Though, in the last years a
shift in its position toward RE was noticeable. For instance, an internal Renewable Energy Policy
was developed and approved by the Board in 2008. It sets a target of 10% of RE (40 MW) by
2011 and encourages the development of skills in the field of solar, wind, hybrid system and
biomass [20].
The main barriers to the PPA’s financial closure remain in the negotiation of feeding tariffs with
IPPs. The limited electricity market and the lack of adequate RE policy result in a deadlocked
situation. The prices proposed by IPPs are high for Nampower that still benefit from cheap
imported electricity. Moreover, one may perceive a conflict of interest associated with the
generation branch of Nampower. There is probably little interest in purchasing electricity from
IPPs when the power utility can run its own plants. On the other hand, IPPs may not offer
feeding tariffs comparable to those of mature markets since the competition is still very limited
in Namibia. Furthermore, the licensing scheme is loose and does not encourage IPPs to secure a
PPA within a certain period of time. The license can be obtained for up to 50 years with no time
constraint to set up and run a power plant. Additional difficulties in PPA negotiations lie in risk
allocation. Neither Nampower nor the IPPs are willing to take on the liability related to potential
political instability, force majeure etc. There is no regulatory framework as such that considers
risk allocation for PPAs.
Moreover, the support toward large scale RE is still at a nascent stage from the academic as well
as the societal groups. For instance, there is neither undergraduate nor postgraduate program
on RE in Namibian Universities, i.e., PoN, UNAM. Hence, the skills available in the country for
renewable integration are restricted. Moreover, research on the field of RE (e.g. planning,
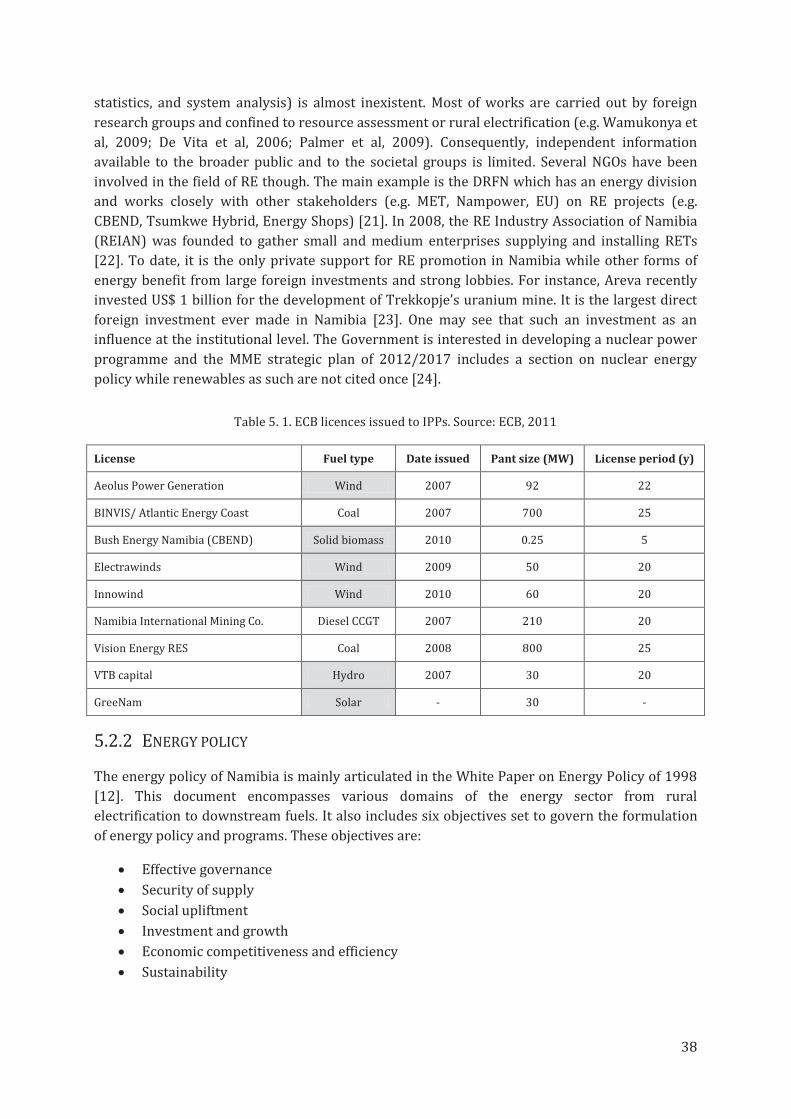
38
statistics, and system analysis) is almost inexistent. Most of works are carried out by foreign
research groups and confined to resource assessment or rural electrification (e.g. Wamukonya et
al, 2009; De Vita et al, 2006; Palmer et al, 2009). Consequently, independent information
available to the broader public and to the societal groups is limited. Several NGOs have been
involved in the field of RE though. The main example is the DRFN which has an energy division
and works closely with other stakeholders (e.g. MET, Nampower, EU) on RE projects (e.g.
CBEND, Tsumkwe Hybrid, Energy Shops) [21]. In 2008, the RE Industry Association of Namibia
(REIAN) was founded to gather small and medium enterprises supplying and installing RETs
[22]. To date, it is the only private support for RE promotion in Namibia while other forms of
energy benefit from large foreign investments and strong lobbies. For instance, Areva recently
invested US$ 1 billion for the development of Trekkopje’s uranium mine. It is the largest direct
foreign investment ever made in Namibia [23]. One may see that such an investment as an
influence at the institutional level. The Government is interested in developing a nuclear power
programme and the MME strategic plan of 2012/2017 includes a section on nuclear energy
policy while renewables as such are not cited once [24].
Table 5. 1. ECB licences issued to IPPs. Source: ECB, 2011
License Fuel type Date issued Pant size (MW) License period (y)
Aeolus Power Generation Wind 2007 92 22
BINVIS/ Atlantic Energy Coast Coal 2007 700 25
Bush Energy Namibia (CBEND) Solid biomass 2010 0.25 5
Electrawinds Wind 2009 50 20
Innowind Wind 2010 60 20
Namibia International Mining Co. Diesel CCGT 2007 210 20
Vision Energy RES Coal 2008 800 25
VTB capital Hydro 2007 30 20
GreeNam Solar - 30 -
5.2.2 ENERGY POLICY
The energy policy of Namibia is mainly articulated in the White Paper on Energy Policy of 1998
[12]. This document encompasses various domains of the energy sector from rural
electrification to downstream fuels. It also includes six objectives set to govern the formulation
of energy policy and programs. These objectives are:
· Effective governance
· Security of supply
· Social upliftment
· Investment and growth
· Economic competitiveness and efficiency
· Sustainability
39
Moreover, the WPE underlines the need to restructure the whole Namibian electricity sector in
order to gain economic efficiency. The promotion of investment is addressed through an
increasing transparency as well as a reviewing of the electricity pricing methods. It is also stated
that new legal and regulatory framework ought to be implemented. In addition, environmental
and socio-economic sustainability are viewed as a requirement for the future of the electricity
sector. In this vein, the WPE includes a chapter where the challenges met to develop RE are
listed and strategies to overcome them are provided. They are divided in six topics.
· Institutional and planning framework. It is mentioned that the playing field should be
levelled between renewables and other forms of energy when assessing financial,
economic and social costs. Environmental costs are not mentioned. Moreover, it is
advised that the ESI should consider RE and that institutional skills for research, quality
standards and the dissemination of information should be built. Low costs of imported
electricity that does not reflect long-run marginal cost are mentioned as a barrier for
renewables.
· Human resource development and public awareness. RE should be included in the
curricula of schools, universities, vocational training centres and other institutions.
Moreover, initiatives to raise awareness in the public should be implemented.
· Adequate financing schemes for renewable energy applications. It is mentioned that
the overall life-cycle cost of energy technologies should be considered and not only the
investment cost. Thus, specific financing mechanisms have to be implemented. A
revolving fund is cited as an option as well as public-private cooperation.
· Developing an inter-ministerial co-operation structure. Ministries should work
together particularly in the field of energy planning which is a multi-sector exercise.
· Improving access to energy in rural areas. The access to RE in rural area should
complement grid electrification and funds will be available for this. An emphasis is given
on photovoltaic pump as an alternative to diesel pump.
· Rational use of energy in buildings and for water heating. The energy and cost
savings achievable through the deployment of solar water heating is highlighted. Thus,
research should be completed and measures taken to advantage related technologies.
· Generating electricity for the grid with renewable energy. RERES should be part of
the Namibia’s future electricity supply such as gas, hydro and imported electricity. Coal
is not mentioned. Solar and wind seen as substantial RES should contribute to the
feasibility of wind and solar parks in Namibia. Resource assessments for solar and wind
are currently undertaken. It is recognized that grid connected RETs have benefits with
regard to energy security, self-sufficiency and sustainability. Moreover, it is stated that
environmental and socio-economic impacts will be taken into account for electricity
generating projects and evaluated to ensure the optimum energy mix. Finally, the last
paragraph mentions that specific RE tariffs structures can be discussed as well as access to
the grid for IPPs.
The WPE was implemented fourteen years ago and it has been a good footing to trigger a RE
transition coupled with the restructuration of the ESI [26]. For example, the solar revolving fund
is a direct expression of the strategy on adequate financing schemes for renewable energy
applications. The creation of REEEI responds to the need for an institutional framework
enhancing capacity building and public awareness. Similarly, REECAP, NAMREP and OGEMP are

40
fully in accordance with the policies. Moreover, the WPE has initiated manifold changes in the
regulatory framework.
In 2000, an Electricity Act was promulgated by Cabinet in order to reform the ESI [27]. The
creation of ECB was the main outcome but additional regulations were implemented. Above all,
Nampower was dispossessed of the distribution system and Regional Electricity Distributors
(REDs) were created. The distribution system has been virtually divided in five areas
corresponding to the REDs. Nonetheless, there are only three established REDs to date, namely,
the Northern RED (NORED), the Central RED (CENORED) and Erongo RED. Due to discrepancies
between the central and local authorities, REDs for the southern part of Namibia and Windhoek
have not come on board yet. In addition, the Electricity Act of 2000 made provision for the
development of an IPP framework.
In 2003, the transformation of the ESI carried on with the Petroleum Products and Energy
Amendment Act, No. 16. It enables the MME to impose a levy on petroleum products for the
benefit of other energy sources such as nuclear and renewables. Furthermore, a Cabinet
Directive of 2005 stipulates that electricity tariffs must reach cost reflectivity by 2011. Although
this has not been fully achieved yet, several tariffs increases were approved by the ECB in the
last few years (e.g. 18% for 2010/2011) [27]. It is an essential parameter to insure
competitiveness and to ease the introduction of IPPs including RE producers in the ESI. Finally,
the Electricity Act of 2007 broadened the responsibilities of the ECB which are the development
of tariffs methodology as well as the approving of electricity tariffs. Moreover, it imposed that all
public buildings must meet their water heating need with solar water heater in response to the
strategy on rational use of energy in buildings and for water heating [28].
On the other hand, the inexistence of grid-connected RE plant in Namibia ascertains the limited
efficiency and effectiveness of the WPE in that regard. The decision-makers did not strive to
develop any regulatory framework favourable to these technologies. The lack of politic
willingness paired with the non-obligatory character of the WPE hindered grid-connected RE
development. For instance, the financing schemes implemented have been entirely devoted to
RE for rural energisation. On the contrary, the specific renewable energy tariffs structures
mentioned in the strategy Generating electricity for the grid with renewable energy have been
touched upon only recently (see 5.4). Consequently, the electricity market is not fair and does
not encourage any foreign or local investment in grid-connected renewable energy. Moreover,
socio-economic and environmental impacts are not internalized in anyway. This regulatory
vacuum is consequently seen as the principal cause for the difficulties aforementioned (e.g. poor
negotiations between potential IPPs and Nampower, inexistent university curricula on
renewable energy, etc.). In a nutshell, the WPE is inadequate for large grid-connected renewable
energy.
Concerning the environmental policy, the engagements are only indicative. The National policy
on Climate Change supports sustainable energy and states that the Government will [29]:
· Promote renewable forms energy (wind, solar, bio-gas etc.) at all levels to reduce Green
House Gases (GHG)
· Promote Green technology, practices and standards
· Ensure reduction and control of harmful emissions through regulatory programs
41
5.3 A FAVOURABLE LANDSCAPE
5.3.1 SOUTHERN AFRICAN DEVELOPMENT COMMUNITY (SADC) STIMULUS
The Southern African Development Community (SADC) is an alliance of fifteen countries,
including Namibia, for the socio-economic cooperation and integration as well as the political
and security cooperation in southern Africa. The SADC as an external sphere of influence affects
the Namibian society at the sociotechnical regime level. A pertinent example is the impacts of
the Southern African Power Pool (SAPP) on the Namibian ESI.
The SAPP was created with the primary aim to provide reliable and economical electricity to
supply the consumers of each of the SAPP members within the Southern African Development
Community (SADC). It gathers power utilities from all southern Africa for the purpose of
developing a regional electricity market as well as strong collaborations. The always progressing
interconnected electrical system in the region favours the trading of electricity and open
opportunities for multinational exchanges. For instance, the Caprivi Interlink Connector (HVDC –
400 kV – 600 MW) was commissioned in 2010 to connect Namibia, Botswana and Zambia [30].
This regional integration has reinforced the mutual energy vision of SAPP members in the field
of renewables. Consequently, the transition of one country member toward a RE future is likely
to affect neighbouring countries and foster their transition as well. As of 2012, a number of SADC
countries have developed a RE policy. For example, various countries have set clear targets for
RE use in rural electrification. In Lesotho, 35% of rural electrification must come from
renewables by 2020 [31]. The Botswana Energy Master Plan also set goals for the use of RE in
rural electrification [32]. When it comes to grid-connected renewables, favourable policies have
been developed in the region as well. The RE target of the RE White Paper of South Africa is a
relevant example. Similarly, the United Republic of Tanzania has adopted a REFIT scheme in
2009 [33].
The recent introduction of the day-ahead market in the SAPP could facilitate a large penetration
of variable renewable energy. It enables power facility to cope with the stochastic character of
most RERES. However, the stock exchange on the day-ahead market is currently low (e.g. 27 397
MWh in 2010/2011) since the capacity available in the region is quite limited and the
transmission system is still a bottleneck [34].
Concerning academic institutions, several SAPP members are endowed with good
infrastructures and skills. South Africa has RE research groups (e.g. CRSES, CSIR, ERC)
disseminated in various universities (Stellenbosch, Pretoria, Cape Town, Durban). Less
developed countries also aim at implementing their own academic facility. In Mozambique, both
the Faculty of Science and the Faculty of Engineering at the Eduardo Mondlane University have
developed RE curricula [35]. A PhD programme in Energy Science and Technology is available
too. Moreover, some regional RE lobbies are emerging (e.g. SESTELA, SESSA, SAPVIA, AfriWEA).
Their main goal is to promote renewables at the industrial as well as political levels. For
instance, the Southern Africa Solar Thermal and Electricity Association (SASTELA) proposes a
regional project similar to the DESERTEC project studied in the MENA-EU countries [36]. The
concept makes use of the hydropower resource available in the north of the region (e.g. DRC,
Zambia and Angola) together with the solar resource available in the so-called Sun Belt (e.g.
42
South Africa, Botswana and Namibia). Although the impact of these supportive organisations is
difficult to assess, it illustrates the emergence of a regional RE vision.
5.3.2 INTERNATIONAL PRESSURE
INTERNATIONAL GROWTH IN RENEWABLES: A SIGNIFICANT DRIVER
RE is a global trend registering massive growth over the last few years. For example, there was a
worldwide wind power installed capacity of 283 GW in 2011 associated with a cumulative
market growth of more than 20% [37]. The saturation of some markets in the developed
countries fosters the renewable industry to investigate on the developing world. The excellent
solar, wind and biomass RES available in Namibia conjugated with the SAPP market prospects
have raised international interests. Consequently, the pressure on the incumbent regime to
establish a favourable environment for foreign investments increases.
The international interest is often translated into technology transfer and capacity building
programs. For instance, UNDP/GEF is currently undertaking a program called Concentrating
Solar Power Technology Transfer for Namibia (CSP TT NAM). The objectives of this program are
to increase the share of RE in the Namibian energy mix and to develop the technological
framework and conditions for the transfer and deployment of CSP [38].
Moreover, the implementation of RE policies and targets worldwide encourages Namibia to
follow the same way. Between 2005 and 2010, the number of countries having a RE
target/policy has increased from 55 to 100 particularly due to implementations in developing
countries [39].
INTERNATIONAL REGULATION ON CLIMATE CHANGE
Namibia ratified the United Nations Framework Convention on Climate Change (UNFCCC) in
1995. Consequently, the country is committed to mitigate its GHG in the basis of equity and in
accordance with common but differentiated responsibilities and respective capabilities [40].
On the first hand, it implies that Namibia must implement relevant mitigation strategies
periodically communicated to the UNFCCC. RE deployment seems therefore an appropriate
measure given that the total installed power capacity is likely to increase in the next decades. On
the other hand, Namibia as a Non-Annex 1 country is eligible to receive financial provision from
Annex-1 countries under different mechanisms such as the clean development mechanisms, the
Green Climate Change Fund, Adaptation Fund etc.
In this regard, the international regulation is an opportunity to facilitate the development of RE
in Namibia. For instance, the clean development mechanisms (CDM) represent an interesting
option to level the playing field between renewables and fossil fuel based energy. The UNFCCC
consolidated baseline methodology for grid-connected electricity generation from renewable
sources shows that solar, wind or biomass energy could provide carbon credits in Namibia if
compared with fossil fuel based projects (e.g. Erongo coal) [41]. Aware of this opportunity, the
Namibian Government approved in 2007 the establishment of the Designated National Authority
(DNA) at the Ministry of Environment and Tourism, i.e., the body approving participation in CDM
projects [18]. However, there is no CDM project that has been implemented yet in spite of
various attempts (e.g. geothermal project, efficient stoves). Limited capacity to carry out a CDM

43
project and an inadequate financial framework are existing barriers. Moreover, Namibia does
not attract large CDM investment since the carbon credits potentially available are few. Namibia
is a net sink of GHG large [40]. Hence, the voluntary carbon market is an alternative option
possibly more appropriate and flexible which has not been envisaged yet.
The landscape surrounding the Namibian energy regime is thus relatively favourable compared
with the 1980’s when Denmark started its transition to renewables. Nevertheless, fossil fuel
based power plants remains the most supported technologies worldwide with massive
investments and strong interests on the international scene. It also influences the Namibian
regime (see 5.4.2).
44
5.4 TRANSITION DYNAMICS IN NAMIBIA
The development of renewable in the rural energisation niche together with the regional and
international landscapes is currently putting pressure on the incumbent energy regime and
creates a window of opportunity. The on-going transformation of the energy sector in Namibia
seems particularly sensitive to these circumstances although threats remain.
5.4.1 ENERGY POLICY REVISION
The MME is currently reviewing the WPE since this document is quite ageing and needs an
update. It is expected that a new document on energy policy should be published by 2013.
However, the preparation of a new policy requires important efforts. For instance, the
formulation process of the WPE of 1998 involved an Energy Policy Committee as well as
consultants and experts during two years (1996 to 1998). Therefore, the completion of the new
energy paper should have already started in order to be on-line in 2013. Nonetheless, there is no
committee formed yet and the whole process seems postpone [8].
Yet, the transformation of the ESI is not planed out insofar as other public authorities are taking
initiatives. In 2010, the ECB called for a study on the potential establishment of procurement
mechanisms specific to renewable energy. The REEEI together with external consultants carried
out the study under the auspices of the Renewable Energy and Energy Efficiency Partnership
(REEEP). The study evaluated different procurement mechanisms (e.g. quota, REFIT, capital
subsidies, etc.) within the Namibian context. The recommendations prescribed by the study are
as follows:
· Tendering to be applied for solar (CSP) and large wind based generation systems, i.e. for
CSP and wind greater than 500kW in installed capacity
· REFIT for small hydro (less than 5MW), small wind, and biomass (both less than 500 kW)
including landfill gas
· Net-metering for photovoltaic
· Other support measures like soft loans, grants, tax breaks, etc. to support all the above
instruments and continue promoting rural and off-grid electrification.
The recommendations were provided after assessing the economic impact of each mechanism.
The most important factors that influence the selection were the limited size of the Namibian
electricity market as well as the relative poor quality of the grid system. The maximum amount
of variable energy potentially absorbed in the system is quite low indeed. The study on
procurement mechanisms has positively leaded to further discussions. The ECB, Nampower and
the MME are currently setting a steering committee for the possible implementation of the
recommendations. Moreover, the ECB has recently issued a request for proposal concerning a
study on net-metering. The study will assess the application of net metering and developing
rules for net metering and interconnection of roof top solar PV and micro- wind energy
convertors [42]. Last but not least, the ECB is examining the possibility to implement a modified
IPP framework. The IPPs could directly negotiate PPAs with large industries. This measure may
take place by the end of 2022.
45
5.4.2 NATIONAL INTEGRATED RESOURCE PLAN (NIRP)
Following the South African model, the MME requested for the development of National
Integration Resource Plan (NIRP) in Namibia. The project is partly funded by the Word Bank
and coordinated by the ECB. It includes different components such as a grid load forecast to
2031 as well as the definition and evaluation of generation options, import sources and demand
management options. The project development involved various consultants and a steering
committee made of Namibian ESI stakeholders.
While the IRPs in South Africa drive the national expansion of renewables, the NIRP process may
not offer the same outcome. The methodology applied for the study relies on World Bank
guidelines which draw their inspiration from neoclassical economics. For instance, this is
translated in the evaluation of generation options and import sources where neither escalation
cost of fossil fuels nor RE learning curves are included.
The economic analysis will be based on real costs expressed at January 2012 price levels omitting
projections for general price inflation during the planning period.( NIRP draft report) [43]
Moreover, the nuclear option is examined only with combustive fuels procured on the
international market even though the Namibian aspiration for nuclear relies mainly on the
abundant resource available locally. The costs associated with the transformation of the local
uranium are not estimated while there are essential for proper decision-making process.
This form of planning is seemingly correlated to a lack of coordination between the ESI public
authorities. The NIRP is for instance clearly in contradiction of the WPE which states that in
order to achieve the policy goal of economic efficiency, energy options should be selected on the
basis of their life-cycle costs, which include both the initial and recurrent costs. Moreover, the NIRP
which has no clear basis to be grounded on since there is no adequate RE policy in place. As
already mentioned the White Paper on Renewable Energy of South Africa was published before
the IRP. It therefore provided a good footing for fair planning. The dynamic in Namibian ESI
follows the other way looming the near future of RE in Namibia.
46
CHAPTER 6 – LONG TERM ENERGY SCENARIO ANALYSIS
The Chapter 6 offers an analysis of concrete scenarios that models different institutional and
technological co-evolutions within the Namibian energy system. The scenarios reflect various
degrees of institutional transformation and RE integration. The MLP is used again to describe
which kind of institutional change is likely to occur in the next 20 years. In the scenario ‘business
as usual’ no RE transition occurs and the incumbent regime keeps stable. The RE deployment is
larger in the scenario ‘progressive renewable’ where the stabilization of RE in the rural niche
drives a substantial RE breakthrough at the regime level. However, the transition is not
complete. An adequate RE policy framework is implemented but not at the fullest and
Nampower’s conventional projects remains central. The scenario ‘high renewable’ pictures a
tremendous change in the Namibian ESI that stems from a niche stabilization as well as an
overwhelming transition at the regime level. From the institutional viewpoint, scenarios are
built according to the RE review and the MLP analysis provided respectively in Chapter 2 and 5.
The planning and technological aspects are based on the Chapter 3 as well. The energy supply
systems reflecting each scenario are simulated through LEAP in order to examine their
technological characteristics as well as economic and socio-environmental repercussions. The
sustainability of each scenario is therefore analysed.
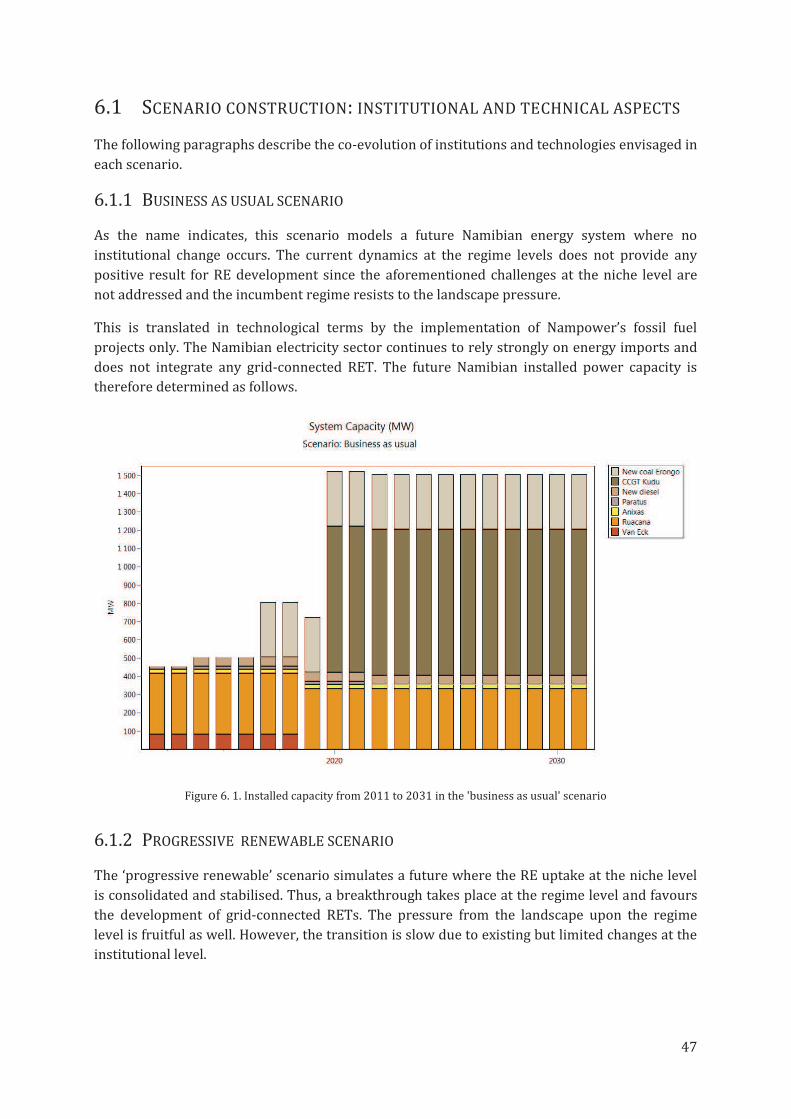
47
6.1 SCENARIO CONSTRUCTION: INSTITUTIONAL AND TECHNICAL ASPECTS
The following paragraphs describe the co-evolution of institutions and technologies envisaged in
each scenario.
6.1.1 BUSINESS AS USUAL SCENARIO
As the name indicates, this scenario models a future Namibian energy system where no
institutional change occurs. The current dynamics at the regime levels does not provide any
positive result for RE development since the aforementioned challenges at the niche level are
not addressed and the incumbent regime resists to the landscape pressure.
This is translated in technological terms by the implementation of Nampower’s fossil fuel
projects only. The Namibian electricity sector continues to rely strongly on energy imports and
does not integrate any grid-connected RET. The future Namibian installed power capacity is
therefore determined as follows.
Figure 6. 1. Installed capacity from 2011 to 2031 in the 'business as usual' scenario
6.1.2 PROGRESSIVE RENEWABLE SCENARIO
The ‘progressive renewable’ scenario simulates a future where the RE uptake at the niche level
is consolidated and stabilised. Thus, a breakthrough takes place at the regime level and favours
the development of grid-connected RETs. The pressure from the landscape upon the regime
level is fruitful as well. However, the transition is slow due to existing but limited changes at the
institutional level.
48
INSTITUTIONAL ASPECTS
The RE transition represented in this scenario is described below for the niche, regime and
landscape levels.
Niche level
· OGEMP is pursued with substantial supports both in terms of budget allocation and
human resource;
· Tsumkwe’s project is replicated in various locations. The approach relies on an
innovative and durable business model.
· Public-private partnerships are encouraged to cope with the financial burden
concomitant to rural electrification and sustainable energy access;
· RE standards are established by the NSI and strongly lessen the invasion of low quality
RE appliances in the market.
Regime level
· The revision of the WPE on energy implies the publication of a Renewable Energy White
Paper following the South African model. Adequate and feasible RE targets are included;
· The deployment of large scale RET is included in MME’s long term strategies affirming a
governmental support toward RE;
· The national energy planning is in accordance with the national energy policy and
periodically reviewed;
· The procurement mechanisms are implemented on the basis of the recommendations
already provided by REEEI;
· The modified IPP framework currently examined by the ECB is instigated;
· Awareness campaigns and capacity building programs such as NAMREP are intensified
and pursued in a long term;
· Human resource and budget allocation dedicated to RE in public authorities are
enhanced;
· Environmental policy emphasizes more specifically the role of RE in Namibia.
Landscape level
· Namibia embarks on the regional RE transition;
· The MET implements a favourable financial framework in order to facilitate
international investments in carbon offset through CDM or voluntary carbon market.
TECHNOLOGICAL ASPECTS
These political and economic measures are quite similar to those implemented in South Africa
and may offer similar repercussions. The share of RES in the energy mix should increase
progressively. The future installed capacity is therefore determined as follows.
A portfolio of RET integrates the supply electricity sector by employing most competitive
options at first. It is assumed that technologies such as wind, solar PV and CSP (with limited
storage capacity) come in line as early as 2014/2016 (e.g. solar and wind capacity of 74 MW by
2014; 120 MW by 2016). Their relative fast deployment help to cope with the electricity

49
shortfalls forecasted. Biomass (bush to energy) comes later and very gradually (e.g. biomass
installed capacity of 10 MW by 2016; 20 MW by 2020). The rationale is that bush-to-energy
technology is still at a relative early commercial stage. Without new initiatives such as the
CEBND project, biomass may not take off in Namibia.
On the other hand, it is assumed that fossil fuels remain preponderant in the energy mix since
the measures implemented are considered insufficient to tackle efficiently RE barriers (see
below). Consequently, coal and diesel projects are included in this scenario (e.g. 300 MW of new
coal power in 2012; 50 MW of new diesel installed in 2017 and 2024). Furthermore, it is
anticipated that the energy security strategy formulated in the energy policy are addressed
adequately. A maximum import is fixed at 10% by 2031. Hence, large hydro and gas power
plants complement the bouquet in order to fulfil this objective. Kudu CCGT (800 MW) becomes
the backbone of the power system after 2020. A 100 MW CSP base load plant is finally included
in 2025.
Figure 6. 2. Installed capacity from 2011 to 2031 in the 'progressive renewable' scenario
The measures elaborated and instruments instigated in the ‘progressive renewable’ scenario are
meant to trigger a RE transition in Namibia. However, it may not suffice to ensure a complete
system innovation. For instance, the tendering mechanism would probably not sustain a long
term growth in RE. Given the size of the Namibian electricity market, calls for tender are likely to
be issued sporadically. The tendering approach becomes even risky if tenders are announced
only for large scale centralized plants. The emergence of a national RE industry would be
undeniably jeopardized. Therefore, deeper institutional changes are required to consolidate and
stabilize a RE transition at both the niche and regime levels.
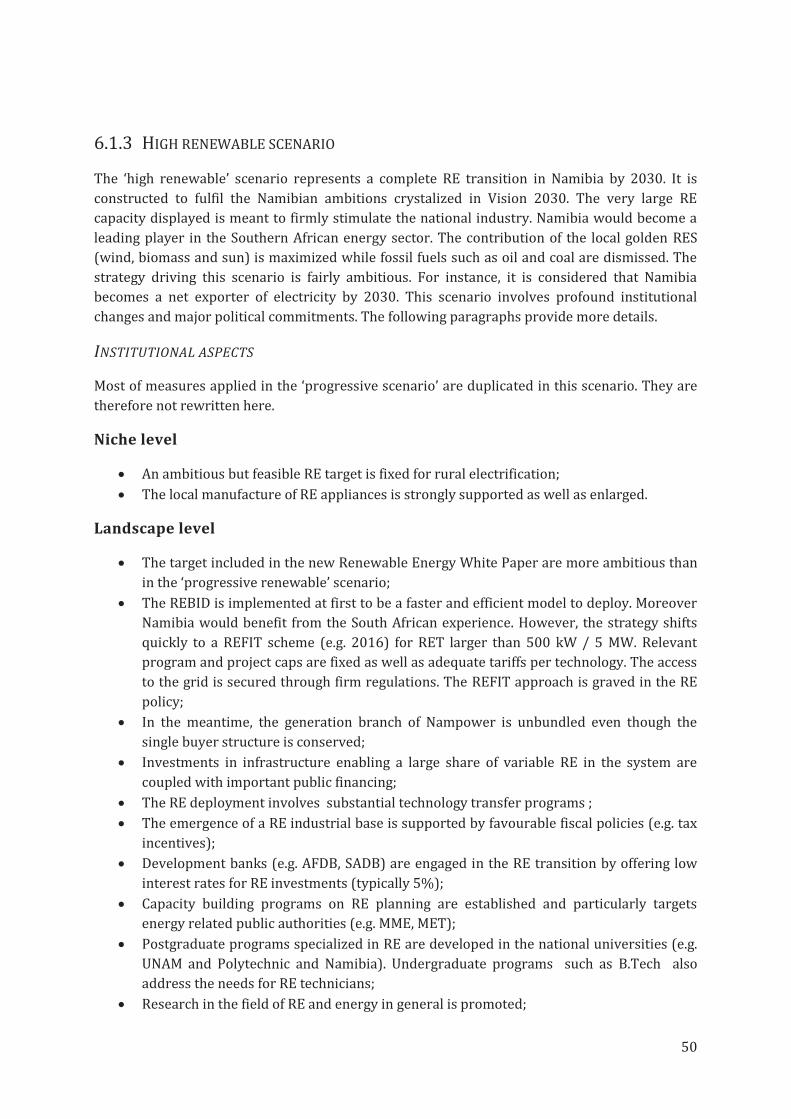
50
6.1.3 HIGH RENEWABLE SCENARIO
The ‘high renewable’ scenario represents a complete RE transition in Namibia by 2030. It is
constructed to fulfil the Namibian ambitions crystalized in Vision 2030. The very large RE
capacity displayed is meant to firmly stimulate the national industry. Namibia would become a
leading player in the Southern African energy sector. The contribution of the local golden RES
(wind, biomass and sun) is maximized while fossil fuels such as oil and coal are dismissed. The
strategy driving this scenario is fairly ambitious. For instance, it is considered that Namibia
becomes a net exporter of electricity by 2030. This scenario involves profound institutional
changes and major political commitments. The following paragraphs provide more details.
INSTITUTIONAL ASPECTS
Most of measures applied in the ‘progressive scenario’ are duplicated in this scenario. They are
therefore not rewritten here.
Niche level
· An ambitious but feasible RE target is fixed for rural electrification;
· The local manufacture of RE appliances is strongly supported as well as enlarged.
Landscape level
· The target included in the new Renewable Energy White Paper are more ambitious than
in the ‘progressive renewable’ scenario;
· The REBID is implemented at first to be a faster and efficient model to deploy. Moreover
Namibia would benefit from the South African experience. However, the strategy shifts
quickly to a REFIT scheme (e.g. 2016) for RET larger than 500 kW / 5 MW. Relevant
program and project caps are fixed as well as adequate tariffs per technology. The access
to the grid is secured through firm regulations. The REFIT approach is graved in the RE
policy;
· In the meantime, the generation branch of Nampower is unbundled even though the
single buyer structure is conserved;
· Investments in infrastructure enabling a large share of variable RE in the system are
coupled with important public financing;
· The RE deployment involves substantial technology transfer programs ;
· The emergence of a RE industrial base is supported by favourable fiscal policies (e.g. tax
incentives);
· Development banks (e.g. AFDB, SADB) are engaged in the RE transition by offering low
interest rates for RE investments (typically 5%);
· Capacity building programs on RE planning are established and particularly targets
energy related public authorities (e.g. MME, MET);
· Postgraduate programs specialized in RE are developed in the national universities (e.g.
UNAM and Polytechnic and Namibia). Undergraduate programs such as B.Tech also
address the needs for RE technicians;
· Research in the field of RE and energy in general is promoted;
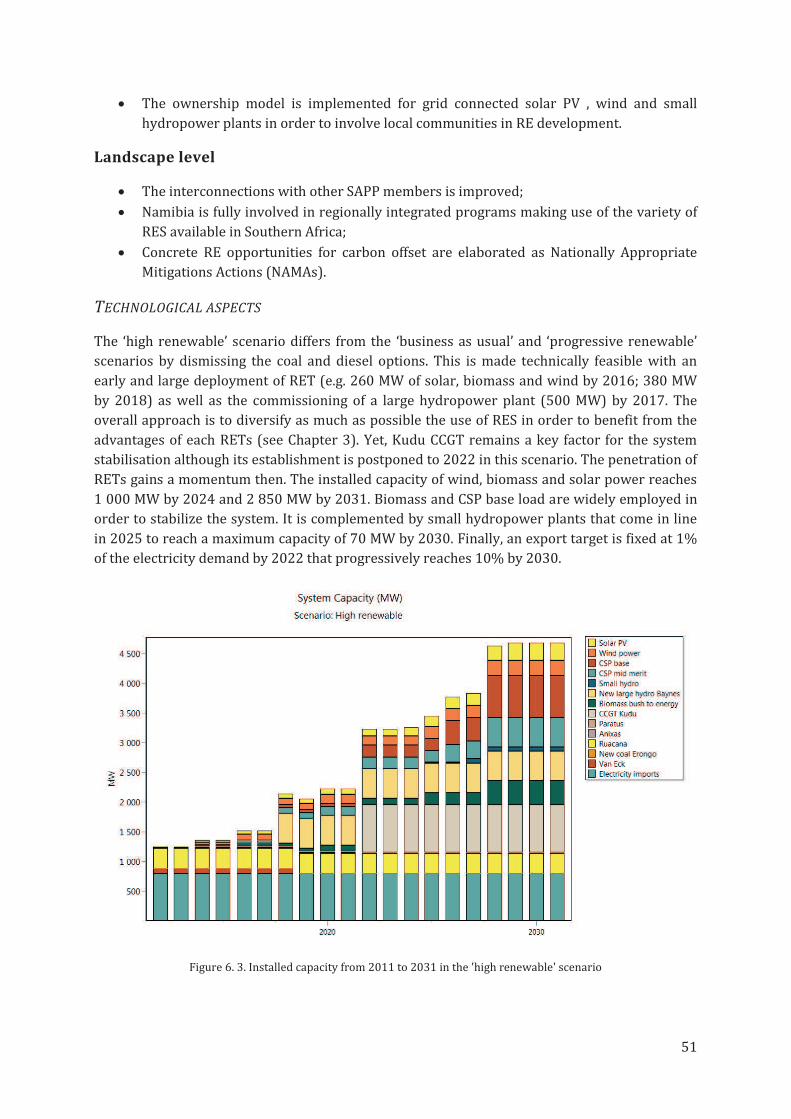
51
· The ownership model is implemented for grid connected solar PV , wind and small
hydropower plants in order to involve local communities in RE development.
Landscape level
· The interconnections with other SAPP members is improved;
· Namibia is fully involved in regionally integrated programs making use of the variety of
RES available in Southern Africa;
· Concrete RE opportunities for carbon offset are elaborated as Nationally Appropriate
Mitigations Actions (NAMAs).
TECHNOLOGICAL ASPECTS
The ‘high renewable’ scenario differs from the ‘business as usual’ and ‘progressive renewable’
scenarios by dismissing the coal and diesel options. This is made technically feasible with an
early and large deployment of RET (e.g. 260 MW of solar, biomass and wind by 2016; 380 MW
by 2018) as well as the commissioning of a large hydropower plant (500 MW) by 2017. The
overall approach is to diversify as much as possible the use of RES in order to benefit from the
advantages of each RETs (see Chapter 3). Yet, Kudu CCGT remains a key factor for the system
stabilisation although its establishment is postponed to 2022 in this scenario. The penetration of
RETs gains a momentum then. The installed capacity of wind, biomass and solar power reaches
1 000 MW by 2024 and 2 850 MW by 2031. Biomass and CSP base load are widely employed in
order to stabilize the system. It is complemented by small hydropower plants that come in line
in 2025 to reach a maximum capacity of 70 MW by 2030. Finally, an export target is fixed at 1%
of the electricity demand by 2022 that progressively reaches 10% by 2030.
Figure 6. 3. Installed capacity from 2011 to 2031 in the 'high renewable' scenario
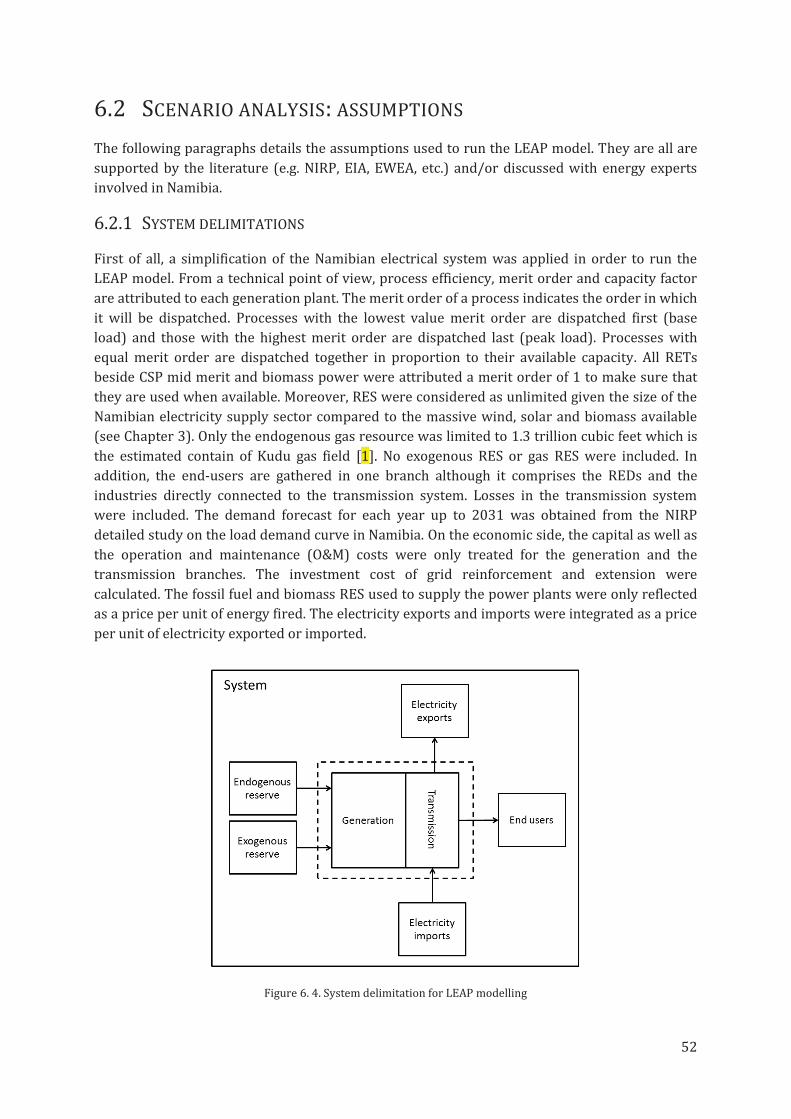
52
6.2 SCENARIO ANALYSIS: ASSUMPTIONS
The following paragraphs details the assumptions used to run the LEAP model. They are all are
supported by the literature (e.g. NIRP, EIA, EWEA, etc.) and/or discussed with energy experts
involved in Namibia.
6.2.1 SYSTEM DELIMITATIONS
First of all, a simplification of the Namibian electrical system was applied in order to run the
LEAP model. From a technical point of view, process efficiency, merit order and capacity factor
are attributed to each generation plant. The merit order of a process indicates the order in which
it will be dispatched. Processes with the lowest value merit order are dispatched first (base
load) and those with the highest merit order are dispatched last (peak load). Processes with
equal merit order are dispatched together in proportion to their available capacity. All RETs
beside CSP mid merit and biomass power were attributed a merit order of 1 to make sure that
they are used when available. Moreover, RES were considered as unlimited given the size of the
Namibian electricity supply sector compared to the massive wind, solar and biomass available
(see Chapter 3). Only the endogenous gas resource was limited to 1.3 trillion cubic feet which is
the estimated contain of Kudu gas field [1]. No exogenous RES or gas RES were included. In
addition, the end-users are gathered in one branch although it comprises the REDs and the
industries directly connected to the transmission system. Losses in the transmission system
were included. The demand forecast for each year up to 2031 was obtained from the NIRP
detailed study on the load demand curve in Namibia. On the economic side, the capital as well as
the operation and maintenance (O&M) costs were only treated for the generation and the
transmission branches. The investment cost of grid reinforcement and extension were
calculated. The fossil fuel and biomass RES used to supply the power plants were only reflected
as a price per unit of energy fired. The electricity exports and imports were integrated as a price
per unit of electricity exported or imported.
Figure 6. 4. System delimitation for LEAP modelling
53
Figure 6. 5. Load demand forecast in Namibia to 2031. Source: NIRP
6.2.2 SYSTEM BALANCE
The import of electricity is modelled according to the following methodology.
First of all, a reserve margin of 10.2% in 2011 was selected. This is the reserve margin required
by SAPP to its members since 2002. It was set at 20% before however the lack of installed
capacity in Southern Africa pushed SAPP to lower it [2]. Hence, in all scenarios the reserve
margin progressively returns to 20% by 2031.
Moreover, the model computes electricity imports from the SAPP if the electricity output from
the transmission branch (generation output minus transmission losses) was insufficient to
sustain the aforementioned reserve margins.
6.2.3 GENERATION
The technical characteristics and O&M costs of the existing Nampower’s plants were collected
from the NIRP. Similarly, the technical characteristics, capital costs and O&M costs for new
biomass, hydro and fossil fuel based power plants were collected in the same document. There is
already a commercial experience of these technologies in Namibia. However, figures from the
literature or current research were preferred for solar and wind power.
Moreover, the prices of coal and oil fuels as well as the prices of gas and biomass locally
produced were retrieved from the NIRP.
The following tables provide the economic and technical characteristics for each generation
option included in the model.
Wind Basic cost of Wind energy, EWEA [3]
CSP Pre-feasibility Study for the Establishment of a Pre-commercial Concentrating Solar Power Plant in Namibia, REEEI [4]
Solar PV Cost of renewables for power generation, IRENA [5]
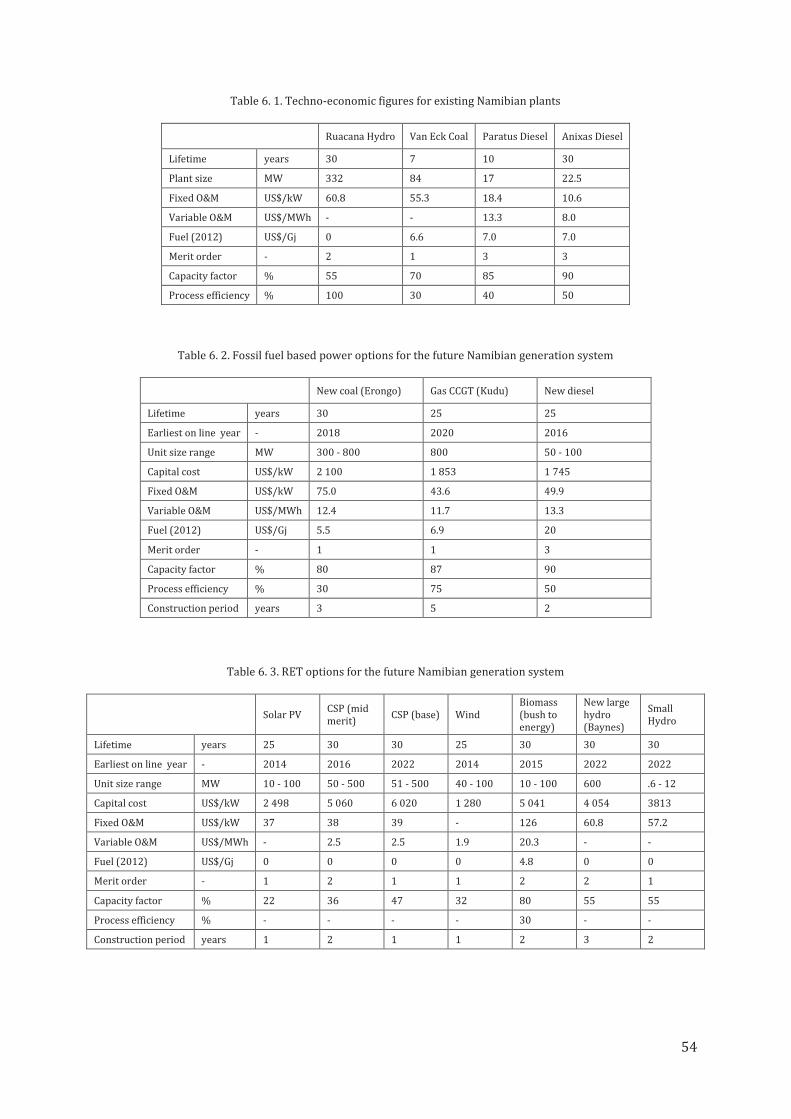
54
Table 6. 1. Techno-economic figures for existing Namibian plants
Ruacana Hydro Van Eck Coal Paratus Diesel Anixas Diesel
Lifetime years 30 7 10 30
Plant size MW 332 84 17 22.5
Fixed O&M US$/kW 60.8 55.3 18.4 10.6
Variable O&M US$/MWh - - 13.3 8.0
Fuel (2012) US$/Gj 0 6.6 7.0 7.0
Merit order - 2 1 3 3
Capacity factor % 55 70 85 90
Process efficiency % 100 30 40 50
Table 6. 2. Fossil fuel based power options for the future Namibian generation system
New coal (Erongo) Gas CCGT (Kudu) New diesel
Lifetime years 30 25 25
Earliest on line year - 2018 2020 2016
Unit size range MW 300 - 800 800 50 - 100
Capital cost US$/kW 2 100 1 853 1 745
Fixed O&M US$/kW 75.0 43.6 49.9
Variable O&M US$/MWh 12.4 11.7 13.3
Fuel (2012) US$/Gj 5.5 6.9 20
Merit order - 1 1 3
Capacity factor % 80 87 90
Process efficiency % 30 75 50
Construction period years 3 5 2
Table 6. 3. RET options for the future Namibian generation system
Solar PV CSP (mid merit)
CSP (base) Wind Biomass (bush to energy)
New large hydro (Baynes)
Small Hydro
Lifetime years 25 30 30 25 30 30 30
Earliest on line year - 2014 2016 2022 2014 2015 2022 2022
Unit size range MW 10 - 100 50 - 500 51 - 500 40 - 100 10 - 100 600 .6 - 12
Capital cost US$/kW 2 498 5 060 6 020 1 280 5 041 4 054 3813
Fixed O&M US$/kW 37 38 39 - 126 60.8 57.2
Variable O&M US$/MWh - 2.5 2.5 1.9 20.3 - -
Fuel (2012) US$/Gj 0 0 0 0 4.8 0 0
Merit order - 1 2 1 1 2 2 1
Capacity factor % 22 36 47 32 80 55 55
Process efficiency % - - - - 30 - -
Construction period years 1 2 1 1 2 3 2
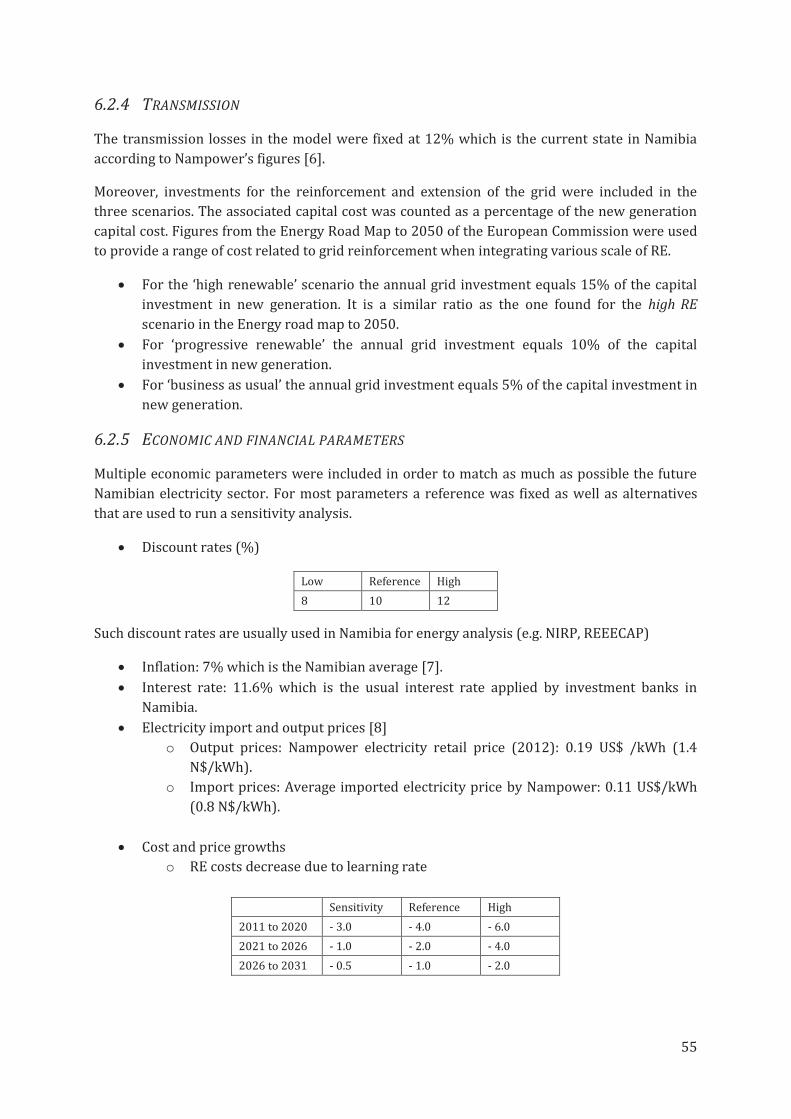
55
6.2.4 TRANSMISSION
The transmission losses in the model were fixed at 12% which is the current state in Namibia
according to Nampower’s figures [6].
Moreover, investments for the reinforcement and extension of the grid were included in the
three scenarios. The associated capital cost was counted as a percentage of the new generation
capital cost. Figures from the Energy Road Map to 2050 of the European Commission were used
to provide a range of cost related to grid reinforcement when integrating various scale of RE.
· For the ‘high renewable’ scenario the annual grid investment equals 15% of the capital
investment in new generation. It is a similar ratio as the one found for the high RE
scenario in the Energy road map to 2050.
· For ‘progressive renewable’ the annual grid investment equals 10% of the capital
investment in new generation.
· For ‘business as usual’ the annual grid investment equals 5% of the capital investment in
new generation.
6.2.5 ECONOMIC AND FINANCIAL PARAMETERS
Multiple economic parameters were included in order to match as much as possible the future
Namibian electricity sector. For most parameters a reference was fixed as well as alternatives
that are used to run a sensitivity analysis.
· Discount rates (%)
Low Reference High
8 10 12
Such discount rates are usually used in Namibia for energy analysis (e.g. NIRP, REEECAP)
· Inflation: 7% which is the Namibian average [7].
· Interest rate: 11.6% which is the usual interest rate applied by investment banks in
Namibia.
· Electricity import and output prices [8]
o Output prices: Nampower electricity retail price (2012): 0.19 US$ /kWh (1.4
N$/kWh).
o Import prices: Average imported electricity price by Nampower: 0.11 US$/kWh
(0.8 N$/kWh).
· Cost and price growths
o RE costs decrease due to learning rate
Sensitivity Reference High
2011 to 2020 - 3.0 - 4.0 - 6.0
2021 to 2026 - 1.0 - 2.0 - 4.0
2026 to 2031 - 0.5 - 1.0 - 2.0
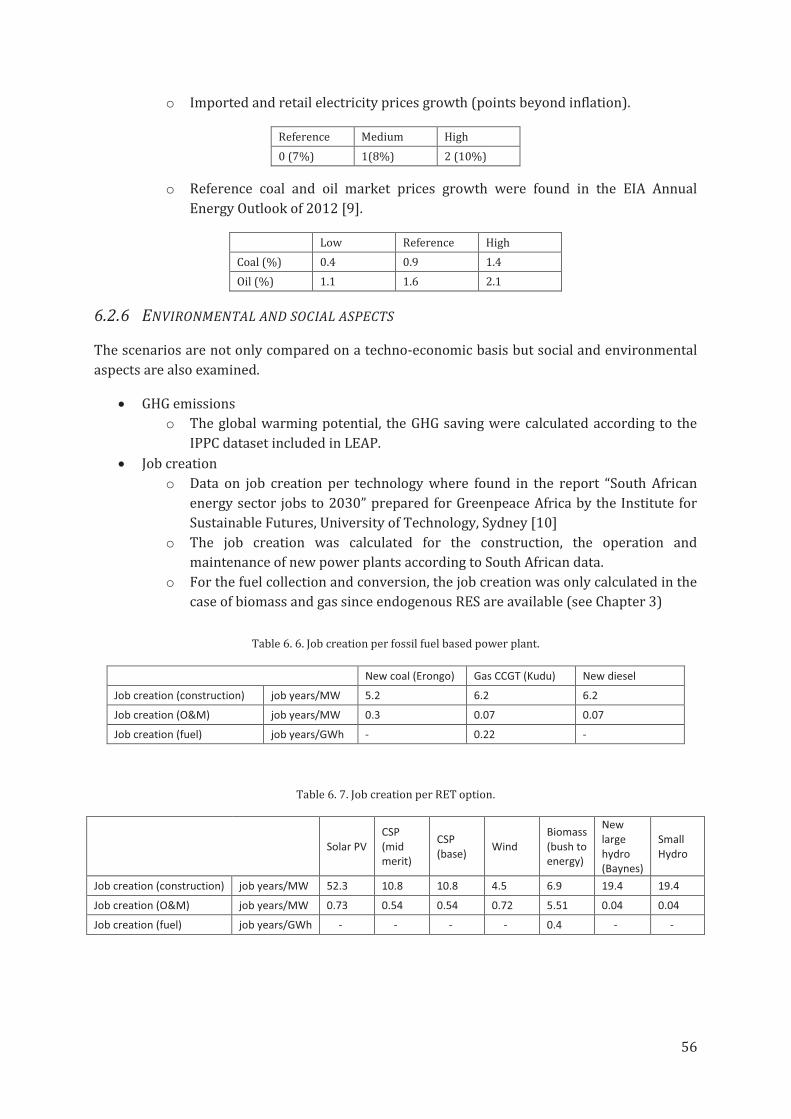
56
o Imported and retail electricity prices growth (points beyond inflation).
Reference Medium High
0 (7%) 1(8%) 2 (10%)
o Reference coal and oil market prices growth were found in the EIA Annual
Energy Outlook of 2012 [9].
Low Reference High
Coal (%) 0.4 0.9 1.4
Oil (%) 1.1 1.6 2.1
6.2.6 ENVIRONMENTAL AND SOCIAL ASPECTS
The scenarios are not only compared on a techno-economic basis but social and environmental
aspects are also examined.
· GHG emissions
o The global warming potential, the GHG saving were calculated according to the
IPPC dataset included in LEAP.
· Job creation
o Data on job creation per technology where found in the report “South African
energy sector jobs to 2030” prepared for Greenpeace Africa by the Institute for
Sustainable Futures, University of Technology, Sydney [10]
o The job creation was calculated for the construction, the operation and
maintenance of new power plants according to South African data.
o For the fuel collection and conversion, the job creation was only calculated in the
case of biomass and gas since endogenous RES are available (see Chapter 3)
Table 6. 6. Job creation per fossil fuel based power plant.
New coal (Erongo) Gas CCGT (Kudu) New diesel
Job creation (construction) job years/MW 5.2 6.2 6.2
Job creation (O&M) job years/MW 0.3 0.07 0.07
Job creation (fuel) job years/GWh - 0.22 -
Table 6. 7. Job creation per RET option.
Solar PV
CSP
(mid
merit)
CSP
(base) Wind
Biomass
(bush to
energy)
New
large
hydro
(Baynes)
Small
Hydro
Job creation (construction) job years/MW 52.3 10.8 10.8 4.5 6.9 19.4 19.4
Job creation (O&M) job years/MW 0.73 0.54 0.54 0.72 5.51 0.04 0.04
Job creation (fuel) job years/GWh - - - - 0.4 - -
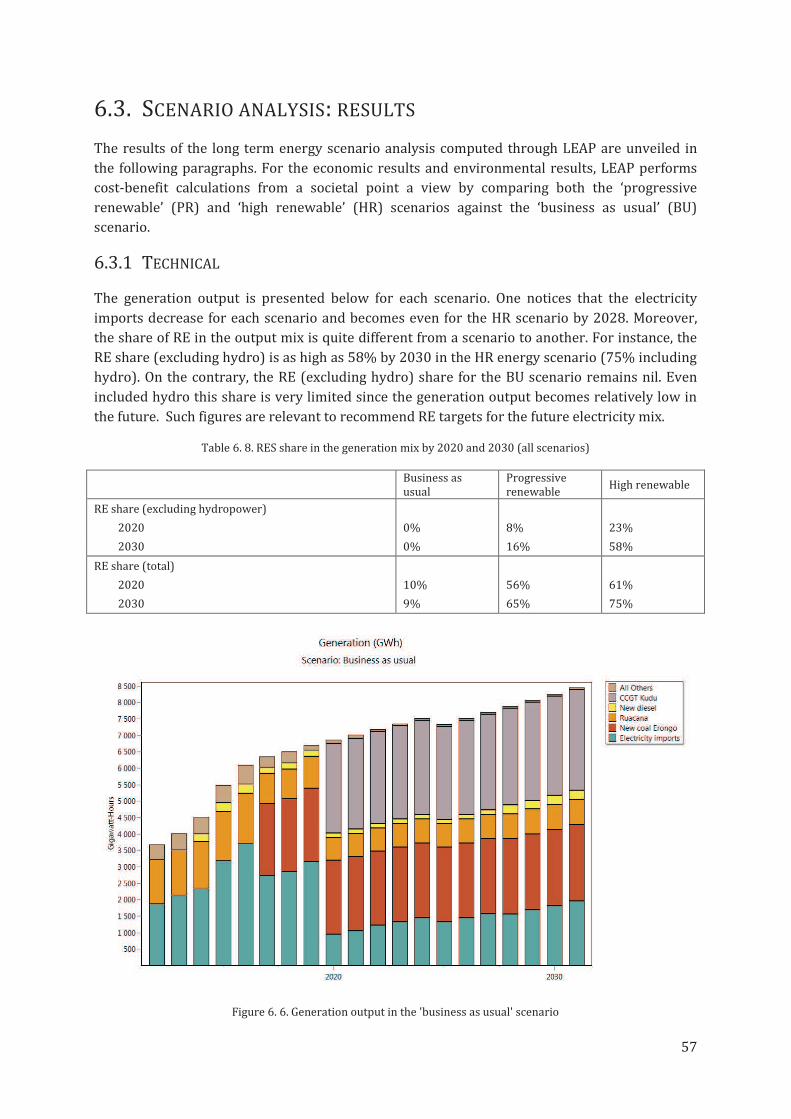
57
6.3. SCENARIO ANALYSIS: RESULTS
The results of the long term energy scenario analysis computed through LEAP are unveiled in
the following paragraphs. For the economic results and environmental results, LEAP performs
cost-benefit calculations from a societal point a view by comparing both the ‘progressive
renewable’ (PR) and ‘high renewable’ (HR) scenarios against the ‘business as usual’ (BU)
scenario.
6.3.1 TECHNICAL
The generation output is presented below for each scenario. One notices that the electricity
imports decrease for each scenario and becomes even for the HR scenario by 2028. Moreover,
the share of RE in the output mix is quite different from a scenario to another. For instance, the
RE share (excluding hydro) is as high as 58% by 2030 in the HR energy scenario (75% including
hydro). On the contrary, the RE (excluding hydro) share for the BU scenario remains nil. Even
included hydro this share is very limited since the generation output becomes relatively low in
the future. Such figures are relevant to recommend RE targets for the future electricity mix.
Table 6. 8. RES share in the generation mix by 2020 and 2030 (all scenarios)
Business as usual
Progressive renewable
High renewable
RE share (excluding hydropower)
2020 0% 8% 23%
2030 0% 16% 58%
RE share (total)
2020 10% 56% 61%
2030 9% 65% 75%
Figure 6. 6. Generation output in the 'business as usual' scenario
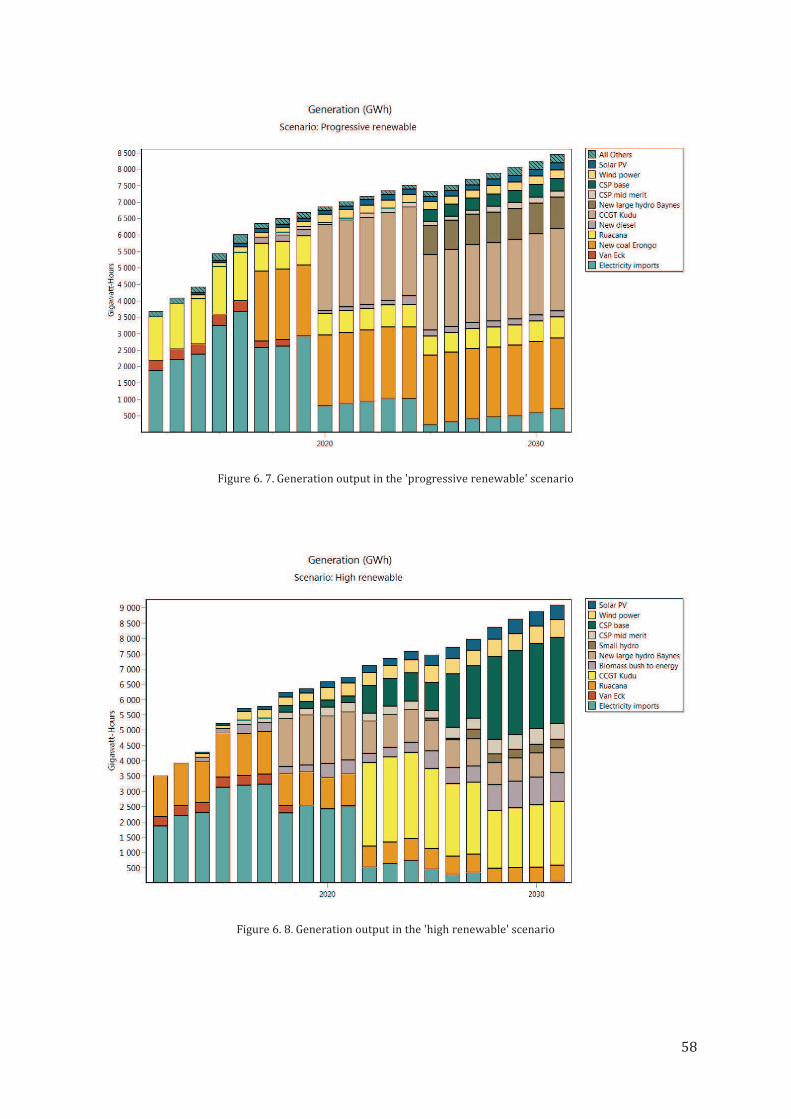
58
Figure 6. 7. Generation output in the 'progressive renewable' scenario
Figure 6. 8. Generation output in the 'high renewable' scenario

59
6.3.2 ECONOMIC RESULTS
NET PRESENT VALUE
The net present values (NPV) of the PR and HR scenarios are compared against those of the BU
scenario for different branches of the system. For instance, at 10% discount rate, the PR scenario
costs 185 MUS$ and 60 MUS$ more than the HR scenario, respectively for the transmission and
electricity generation branches (see Table 6.4). On the other hand, it costs 33 MUS$ and 78 MUS$
less than the BU scenario, respectively for the production (gas and biomass fuel) and import
branches (coal and oil). Finally, the PU scenario the NPV of the PR scenario is 134 MUS$ higher
than the BU scenario. Note that the electricity imports are included in the electricity generation
branch. The general trend is that PU and HR as always more expensive than the BU scenario
from 122 to 232 MUS$. The highest the discount rate is the most interesting are the renewables
RE intensive scenarios. However, the HR scenario remains by far the most expensive. It has an
extra cost of costs 220 MUS$ and 86 MUS$ compared respectively to the BU and HR scenarios
(10% discount rate). This is related to the massive investment in the transmission and
generation systems. The upfront cost of RE has strong impact on the generation branch.
Nevertheless, on observes that RES cost are always lower for the PU and HR scenario since oil
and coal are not imported as much as in the BU scenario. For instance, the BU cost of oil and coal
imports is 78 MUS$ greater than in the PR scenario. The same cost reaches 897 MUS$ when BU
scenario compared to the HR scenario. There is no new fossil fuel based plant installed in HR
scenario indeed. In addition, in the HR scenario the export of electricity brings large incomes up
to 627 MUS$ (8% discount rate).
Table 6. 9. Net present values of the 'progressive renewable' and 'high renewable' vs. 'business as usual scenario'.
Progressive renewable High renewable
Discount rate (%) 8 10 12 8 10 12
Transformation
Transmission 225 185 153 774 635 526
Electricity generation 54 60 61 1297 1050 859
Resources
Production -43 -33 -26 -124 -101 -83
Imports -91 -78 -67 -1088 -897 -746
Exports 0 0 0 -627 -468 -351
Net Present Value 145 134 122 232 220 204
Cumulative Costs and Benefits: 2011-2031. Compared to Scenario: Business as usual. Million 2011 U.S. Dollar. Discounted at 8%, 10% and 12% to year 2011.
FOSSIL FUEL PRICES AND RENEWABLE ENERGY COSTS
The Table 6.5 illustrates the tremendous impacts of fossil fuel market prices and RE costs
variations. Basically, if fossil fuel prices increase (e.g. +1.4%/year for coal, +2.1%/year for oil)
and RE costs decrease noticeably in the future, the PR and HR scenario becomes very
competitive. In that case, the NPV of the HR scenario is 97 MUS$ lower in comparison with the
BU scenario 12% discount rate). However, the economic burdens of PR and particularly HR
become relatively quite significant if the fossil fuel price increase is not that strong and the RE
learning rate is not this high.
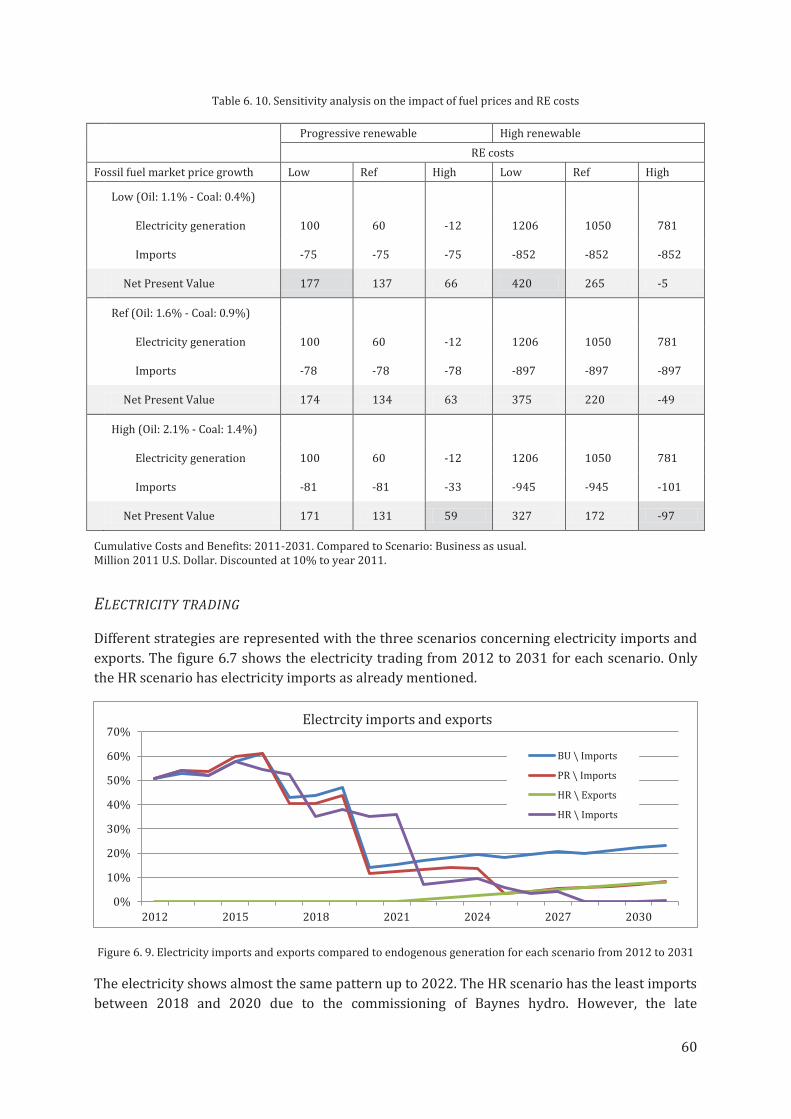
60
Table 6. 10. Sensitivity analysis on the impact of fuel prices and RE costs
Progressive renewable High renewable
RE costs
Fossil fuel market price growth Low Ref High Low Ref High
Low (Oil: 1.1% - Coal: 0.4%)
Electricity generation 100 60 -12 1206 1050 781
Imports -75 -75 -75 -852 -852 -852
Net Present Value 177 137 66 420 265 -5
Ref (Oil: 1.6% - Coal: 0.9%)
Electricity generation 100 60 -12 1206 1050 781
Imports -78 -78 -78 -897 -897 -897
Net Present Value 174 134 63 375 220 -49
High (Oil: 2.1% - Coal: 1.4%)
Electricity generation 100 60 -12 1206 1050 781
Imports -81 -81 -33 -945 -945 -101
Net Present Value 171 131 59 327 172 -97
Cumulative Costs and Benefits: 2011-2031. Compared to Scenario: Business as usual. Million 2011 U.S. Dollar. Discounted at 10% to year 2011.
ELECTRICITY TRADING
Different strategies are represented with the three scenarios concerning electricity imports and
exports. The figure 6.7 shows the electricity trading from 2012 to 2031 for each scenario. Only
the HR scenario has electricity imports as already mentioned.
Figure 6. 9. Electricity imports and exports compared to endogenous generation for each scenario from 2012 to 2031
The electricity shows almost the same pattern up to 2022. The HR scenario has the least imports
between 2018 and 2020 due to the commissioning of Baynes hydro. However, the late
0%
10%
20%
30%
40%
50%
60%
70%
2012 2015 2018 2021 2024 2027 2030
Electrcity imports and exports
BU \ Imports
PR \ Imports
HR \ Exports
HR \ Imports

61
introduction of Kudu CCGT reverses the situation from 2020 to 2022. The pattern is clear
thereafter. There is less import in the HR scenario and even no import from 2028 on. The
imports in the BU scenarios always remain between 15 and 25% whereas they get lower than
10% in the PR scenarios from 2025 on. The exports in the HR scenario start in 2022 to reach 9%
of the endogenous generation output in 2031. Such electricity trading has large economic
impacts.
For instance, the Table 6.6 shows that if the price of electricity grows substantially the BU
scenario becomes quite expensive. In the case of medium and high growth, the extra investment
of RE is economically worth since the electricity generation becomes cheaper compared to the
HR scenario (e.g. 48 MUS$ cheaper with medium price growth). Consequently, if SAPP imports
prices increase rapidly RE intensive scenario becomes very competitive. For instance, the HR
scenario 47 MUS$ cheaper the BU scenario if electricity import prices grow by 9% per year.
Table 6. 11. Sensitivity analysis on the impacts of imported electricity price on scenario's NPV
Progressive renewable High renewable
Imported electricity price growth
Ref Medium High Ref Medium High
Electricity generation 60 -48 -170 1050 927 786
Net present value 134 27 -96 220 97 -45
Cumulative Costs and Benefits: 2011-2031. Compared to Scenario: Business as usual. Million 2011 U.S. Dollar. Discounted at 10% to year 2011.
Similarly, if export prices grow rapidly compared to the electricity prices on the national market,
it makes the export option very profitable for the HR scenario with a total income of 897 MUS$ if
export price grow by 8%.
Table 6. 12. Sensitivity analysis on the impacts of export price on the 'high renewable' scenario profitability
High renewable Export price growth
Ref Medium High
Electricity generation 1050 1050 1050
Imports -468 -897 -629
Net present value 220 145 58
Cumulative Costs and Benefits: 2011-2031. Compared to Scenario: Business as usual. Million 2011 U.S. Dollar. Discounted at 10% to year 2011.
INFRASTRUCTURE INVESTMENT
The investments in grid extension and reinforcement are much higher in the PR and HR
scenarios. However, they inevitable if large RETs have to be integrated. By 2031, almost 2 000
MUS$ is invested in the electrical network. To give a rough idea, the 970 kilometres Caprivi
interconnector (HVDC) cost 371 MUS$ (302 M€), i.e., almost 1/5 of the investment allocated in
the HR scenario [11].
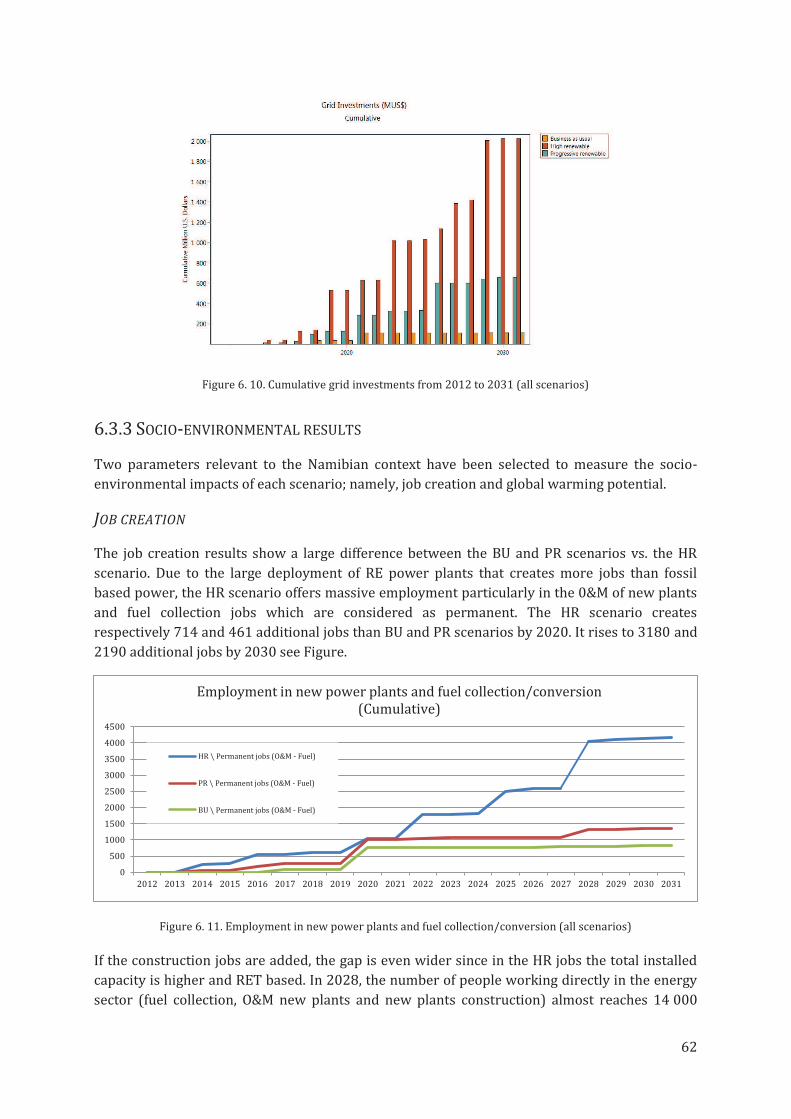
62
Figure 6. 10. Cumulative grid investments from 2012 to 2031 (all scenarios)
6.3.3 SOCIO-ENVIRONMENTAL RESULTS
Two parameters relevant to the Namibian context have been selected to measure the socio-
environmental impacts of each scenario; namely, job creation and global warming potential.
JOB CREATION
The job creation results show a large difference between the BU and PR scenarios vs. the HR
scenario. Due to the large deployment of RE power plants that creates more jobs than fossil
based power, the HR scenario offers massive employment particularly in the 0&M of new plants
and fuel collection jobs which are considered as permanent. The HR scenario creates
respectively 714 and 461 additional jobs than BU and PR scenarios by 2020. It rises to 3180 and
2190 additional jobs by 2030 see Figure.
Figure 6. 11. Employment in new power plants and fuel collection/conversion (all scenarios)
If the construction jobs are added, the gap is even wider since in the HR jobs the total installed
capacity is higher and RET based. In 2028, the number of people working directly in the energy
sector (fuel collection, O&M new plants and new plants construction) almost reaches 14 000
0
500
1000
1500
2000
2500
3000
3500
4000
4500
2012 2013 2014 2015 2016 2017 2018 2019 2020 2021 2022 2023 2024 2025 2026 2027 2028 2029 2030 2031
Employment in new power plants and fuel collection/conversion (Cumulative)
HR \ Permanent jobs (O&M - Fuel)
PR \ Permanent jobs (O&M - Fuel)
BU \ Permanent jobs (O&M - Fuel)
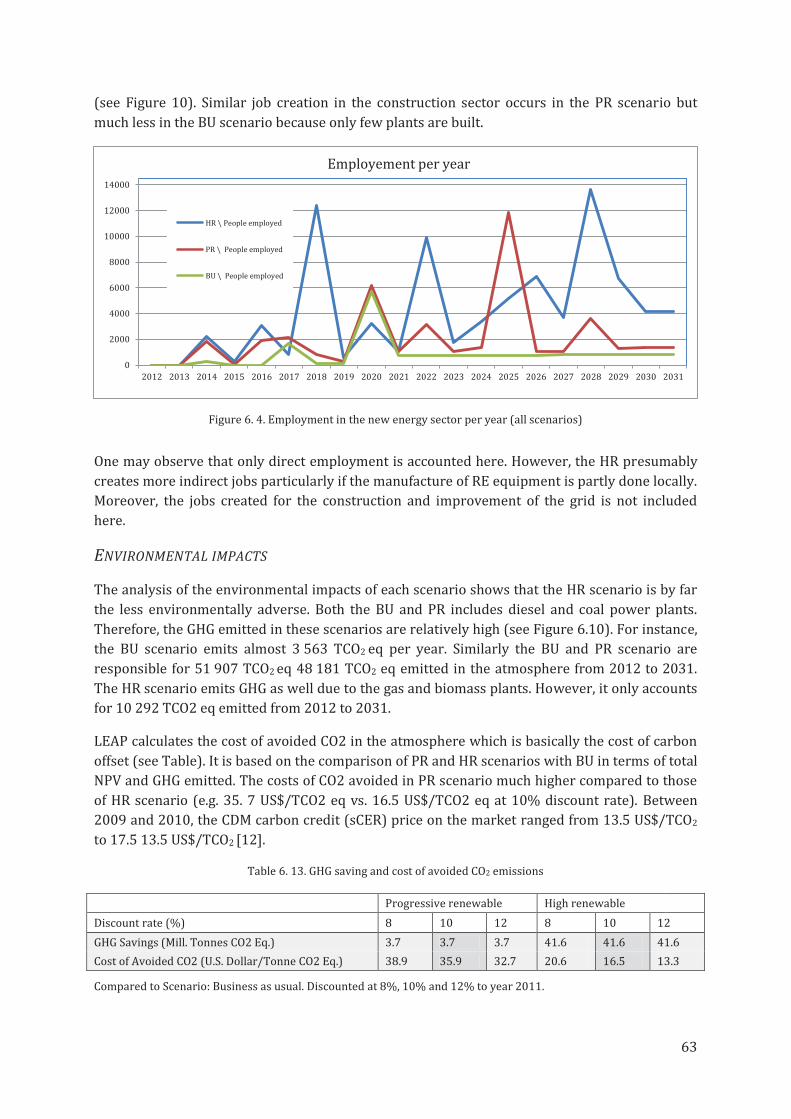
63
(see Figure 10). Similar job creation in the construction sector occurs in the PR scenario but
much less in the BU scenario because only few plants are built.
Figure 6. 4. Employment in the new energy sector per year (all scenarios)
One may observe that only direct employment is accounted here. However, the HR presumably
creates more indirect jobs particularly if the manufacture of RE equipment is partly done locally.
Moreover, the jobs created for the construction and improvement of the grid is not included
here.
ENVIRONMENTAL IMPACTS
The analysis of the environmental impacts of each scenario shows that the HR scenario is by far
the less environmentally adverse. Both the BU and PR includes diesel and coal power plants.
Therefore, the GHG emitted in these scenarios are relatively high (see Figure 6.10). For instance,
the BU scenario emits almost 3 563 TCO2 eq per year. Similarly the BU and PR scenario are
responsible for 51 907 TCO2 eq 48 181 TCO2 eq emitted in the atmosphere from 2012 to 2031.
The HR scenario emits GHG as well due to the gas and biomass plants. However, it only accounts
for 10 292 TCO2 eq emitted from 2012 to 2031.
LEAP calculates the cost of avoided CO2 in the atmosphere which is basically the cost of carbon
offset (see Table). It is based on the comparison of PR and HR scenarios with BU in terms of total
NPV and GHG emitted. The costs of CO2 avoided in PR scenario much higher compared to those
of HR scenario (e.g. 35. 7 US$/TCO2 eq vs. 16.5 US$/TCO2 eq at 10% discount rate). Between
2009 and 2010, the CDM carbon credit (sCER) price on the market ranged from 13.5 US$/TCO2
to 17.5 13.5 US$/TCO2 [12].
Table 6. 13. GHG saving and cost of avoided CO2 emissions
Progressive renewable High renewable
Discount rate (%) 8 10 12 8 10 12
GHG Savings (Mill. Tonnes CO2 Eq.) 3.7 3.7 3.7 41.6 41.6 41.6
Cost of Avoided CO2 (U.S. Dollar/Tonne CO2 Eq.) 38.9 35.9 32.7 20.6 16.5 13.3
Compared to Scenario: Business as usual. Discounted at 8%, 10% and 12% to year 2011.
0
2000
4000
6000
8000
10000
12000
14000
2012 2013 2014 2015 2016 2017 2018 2019 2020 2021 2022 2023 2024 2025 2026 2027 2028 2029 2030 2031
Employement per year
HR \ People employed
PR \ People employed
BU \ People employed
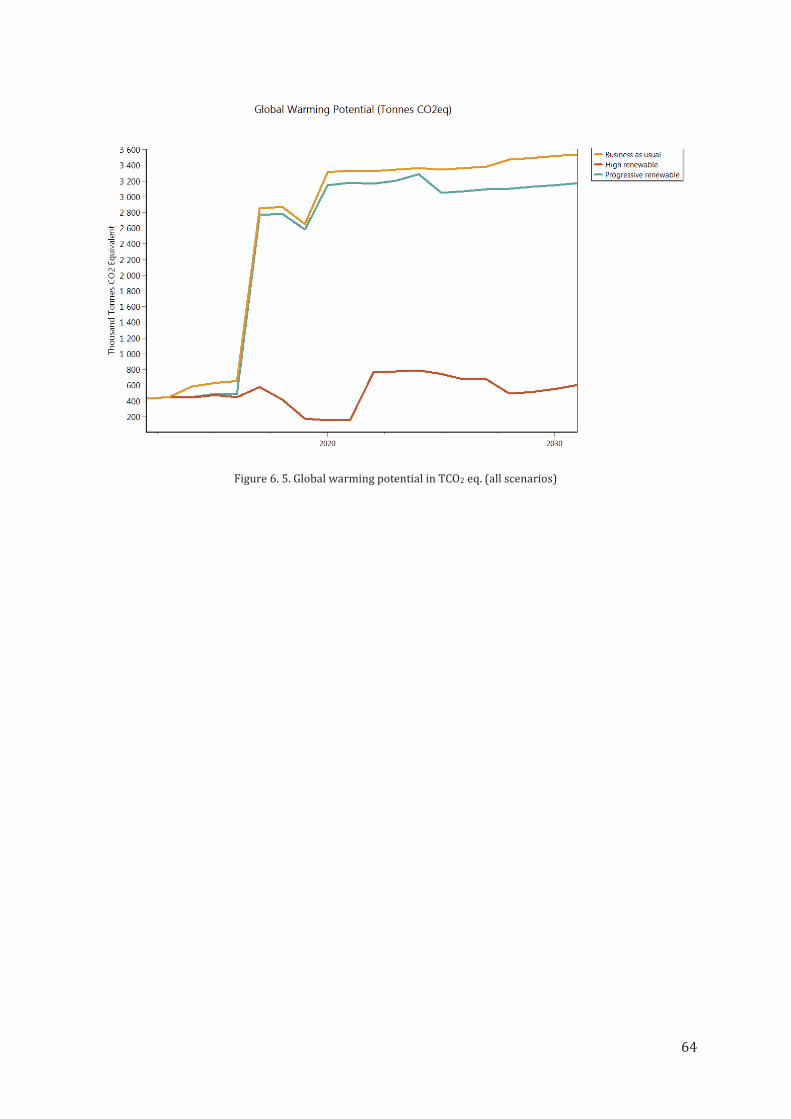
64
Figure 6. 5. Global warming potential in TCO2 eq. (all scenarios)
65
CONCLUSION Namibia will face a grave energy crisis in the next decades if decision-makers do not undertake
profound changes in the energy system both at technological and institutional levels. The study
shows that if the current trend is pursued, major economic, social and environmental impacts
will harm the Namibian society. The power projects Nampower’s projetcs in the pipelines (e.g.
Erongo coal) are insufficient to address properly the generation deficit as well as the risk of
energy shortages while it is estimated that 24 hours of blackout each month would reduce the
GDP by 4% in Namibia. The large deployment of fossil fuel based power plants will make the
energy system extremely sensitive to electricity imports and fossil fuel price volatility.
Moreover, the economic benefits of this scenario are quite limited since large centralized power
plant barely contributes to the emergence of a national energy industry but rather favour
foreign companies.
If a better future is envisaged, the study shows that two alternative paths are possible.
On the first hand, Namibia will follow the South African “Big Brother” way by employing similar
institutional measures to avoid the energy crisis and to integrate renewables. The analysis of
current dynamics at the institutional levels reveals that the copy-and-paste process has already
started. A National Integrated Resource Plan (NIRP) is currently undertaken based on the South
African IRP model. Moreover, a tendering system is likely to be the main procurement
mechanisms implemented in the near future for medium to large scale renewable energy plants.
The recent shift form REFIT to REBID in South Africa has certainly inspired Namibian decision-
makers. The study shows that this scenario offers better perspectives than a business-as-usual
path. The gradual implementation of renewable energy would stimulate the national industry by
creating job opportunities and limit electricity and fossil fuel imports. However, coal and oil
power plants remain preponderant sources of energy. Therefore, the extra costs for the society
associated with this scenario may not offer proportional benefits.
On the other hand, a massive deployment of renewable energy is likely to support sustainable
future in Namibia. In this scenario the use of the large and diverse renewable energy resources
available in Namibia is maximized and the necessary infrastructures are established. The study
shows that an important renewable energy contribution to the electricity generation (e.g. 75%
by 2030) improves drastically the energy security as well as the economic stability of the
country. The emergence of a substantial renewable industry is also in lines with the
development objectives graved in Vision 2030. It provides a massive and durable employment
as well as a high degree of localisation. Yet, this route raises great economic and technical
challenges to the current energy system. The implementation of efficient and effective
renewable energy policy is therefore required to sustain the transition. Lessons learnt from
countries having already undertaken such system innovation gives interesting information on
the way to follow in Namibia. The Danish case, for instance, demonstrates that major
institutional changes are necessary. Strong governmental support, long term energy planning,
public funding, REFIT, promotion of research & development are valuable measures that could
be employed in Namibia. Moreover, international opportunities are available to mitigate the
financial risk associated with this scenario. The study shows that a significant renewable energy
transition in Namibia could be supported substantially by the clean development mechanism
(CDM) of the Kyoto Protocol. Nevertheless, this overall bottom-up approach has to be completed

66
by the involvement of citizens. For instance, the ownership model already implemented to
procure small renewable energy technologies and appliances should be replicated for larger
renewable energy technologies (e.g. wind, solar and small hydro power plants). This statement
shows the limitation of the study that does not analyse the concrete situations of households and
firms with regard to energy and renewables in particular. Further research in that field is
therefore required to understand what are the habits and behaviour of people and how
renewable energy could adequately respond to their needs.
67
BIBLIOGRAPHY
CHAPTER 1
[1]International Energy Agency (IEA), 2010, Energy poverty - How to make access to modern energy universal?, IEA/OECD. Available at http://www.iea.org/weo/docs/weo2010/weo2010_poverty.pdf. [Accessed 5 April 2012]
[2] Bugaje, I.M. 2006, “Renewable energy for sustainable development in Africa: a review”, Renewable and Sustainable Energy Reviews, vol. 10, pp 603–612
[3] Canadell, J.G., Raupach, M.R., Houghton, R.A. 2009, “Anthropogenic CO2 emissions in Africa”, Biogeosciences Discussions, vol. 5, pp. 4395
[4]Karekezi, S. 2002, “Renewables in Africa – meeting the energy needs of the poor”, Energy Policy, vol. 30, pp. 1059-1069
[5] Foster, V., Briceno-Garmendia, C. 2010, Africa’s infrastructure: A time for transformation, AFD/WB, Washington, D.C.
[6] International Energy Agency, 2011, WEO 2011 – Energy access database. Available at http://www.iea.org/weo/electricity.asp. [Accessed 21 December 2011]
[7] Iita, J.S. (Ministry of mines and Energy, prime secretary), quoted during Development Dialogue Forum 8, 14 May 2012, Namibia, Windhoek.
[8] World Bank, 2012, Namibia Country Brief. Available at: http://web.worldbank.org. [Accessed 12 January 2012]
[9] Ministry of Labor and Social Welfare, 2008, Namibia Labor Force Survey (NLFS), Windhoek.
[10] National Planning Commission (NPC), 2004, Vision 2030: Policy Framework for Long-Term National Development, Windhoek.
[11] Nampower, 2011, Annual Report 2010. Available at http://www.nampower.com.na/Pages/annual-report.asp. [Accessed 14 October 2011]
[12] Institute for Public Policy Research (IPPR), 2009, Planning power: review of electricity policy in Namibia, Research report no. 11, Windhoek.
[13] Ministry of Mines and Energy, 1998. The White Paper on Energy Policy, Government of the Republic of Namibia, Windhoek. Available at: http://www.mme.gov.na/pdf/energy_policy_whitepaper.pdf. [Accessed 16 November 2012]
[14] Rutovitz, J. 2010. South African energy sector jobs to 2030. Prepared for Greenpeace Africa by the Institute for Sustainable Futures, University of Technology, Sydney, Australia.
[15] National Planning Commission, 2011, Targeted Intervention Program for Employment and Economic Growth (TIPEEG), Windhoek. Available at http://www.npc.gov.na/publications/TIPEEG.pdf. [Accessed 6 March 2012].
68
[16] Ministry of Mines and Energy, 2007. Off-Grid Energisation Master Plan (OGEMP), Government of the Republic of Namibia, Windhoek. Available at: http://www.mme.gov.na/pdf/undp-reports/off-grid-masterplan.pdf. [Accessed 7 November 2011]
[17] United Nations Statistics Division, 2008, Millennium Development Goals indicators: Carbon dioxide emissions (CO2), collected by CDIAC. Available at http://mdgs.un.org/unsd/mdg/SeriesDetail.aspx?srid=749&crid=. [Accessed 6 January 2012]
[18] Ministry of Environment and Tourism, 2011, Namibia’s country position paper on the COP17/CMP7 climate change conference, Government of the Republic of Namibia, Windhoek.
[19] Ministry of Environment and Tourism, 2011, Namibia’s second communication to the UNFCC, Government of the Republic of Namibia, Windhoek. Available at http://unfccc.int/national_reports/non-annex_i_natcom/items/2716.php. [Accessed 15 December 2011]
[20] Meyer-Renschhausen, M., Ndhlukula, K., Nambili. S., Snyders, N. 2010, Development of a Procurement Mechanism for Renewable Energy Resources in Namibia, Windhoek.
[21]Berkhout, F. 2002, “Technological regimes, path dependency and the environment”, Global Environemental Change, vol. 12, pp. 1-4
[22] B. Elzen, F.W. Geels, K. Green (Eds.), System Innovation and the Transition to Sustainability: Theory, Evidence and Policy, Edward Elgar, Cheltenham, 2004.
CHAPTER 2
[1] Intergovernmental Panel on Climate Change (IPCC) 2011, IPCC special Report on Renewable
Energy Resources and Climate Change Mitigation.
[2] Mendonca, M., Lacey, S., Hvelplund, H. 2009, “Stability, participation and transparency in
renewable energy policy: Lessons from Denmark and the United States”, Policy and Society,
27, 379-398
[3] Mendonca, M.,2007. “Feed-in Tariffs: Accelerating the Deployment of Renewable energy”, World
Future Council. Earthscan, London.
[4] Winkler, H 2005. “Renewable energy policy in South Africa: Policy options for renewable
electricity”. Energy Policy 33 (1): 27-38.
[5] Musango, K., Amigun, B., Brent, A.C. 2011, “Sustainable energy technologies in South Africa:
inititiatives, challenges and policy implementation”. Energy and Environment Research, Vol.
1. No. 1.
[6] Haw, C. 2012,“An update on the PV market in South Africa”,Southern African Solar Energy Conference (SASEC). 21 -23 May 2012. South Africa. Stellenbosch.
[7] Pegel, A. 2010, “Renewable energy in South Africa – Potentials, barriers and options for support”. Energy Policy. Vol. 38. pp.4945–4954
69
[8] REN-21, 2012, Renewable energy policy: fiscal incentives. Available at
http://www.ren21.net/RenewablesPolicy/PolicyInstruments/FiscalIncentives/tabid/63
27/Default.aspx [Accessed 4 May 2012]
[9] Meyer, N.I. 2004, “Renewable energy policy in Denmark”. Energy for Sustainable
Development. Vol. 8. No. 1.
[10] Tait, L. 2011. The potential for local community benefits from wind farms in South Africa.
Master’s Thesis. University of Cape Town.
CHAPTER 3
[1] Nampower, 2011, Annual Report 2010. Available at http://www.nampower.com.na/Pages/annual-report.asp. [Accessed 14 October 2011]
[2] Ministry of Mines and Energy, 2008. Renewable Energy and Energy Efficiency Capacity Building Program (REEECAP). Government of the Republic of Namibia, Windhoek. Available at: http://www.reeei.org.na/projects.php [Accessed 5 October 2012]
[3] Shilamba, P. (Nampower Manging Director), quoted during Development Dialogue Forum, 12 November 2011, Namibia, Windhoek.
[4] Infrastructure Trust Fund European Africa, 2010, Caprivi Interconnector. Available at: http://www.eu-africa-infrastructure-tf.net/activities/grants/caprivi-interconnector.htm [Accessed 21 May 2012]
[5] Aringhoff, Rainer, Georg Brakmann, Michael Geyer, and Sven Teske. 2005. Concentrated Solar Thermal Power—Now! Greenpeace International, Amsterdam, The Netherlands, September.
[6] International Energy Agency, 2010, Technology Roadmap, Solar Concentrating Solar Power, OECD
[7] Le Fol, Y., Ndhlukula, K. 2012, “The Potential and Future of Concnetrating Solar Power in Namibia”, Southern African Solar Energy Conference, South Africa, Stellenbosch, 21-23 May 2012.
[8] Ministry of Mines and Energy, Wind Energy Evaluation Programme - Walvis Bay/Lüderitz, 1996
[9] Yun-Kyu, K., Korea Midland Power Co., LTD., Namibia Wind Power PM, pers. Communication. August 2011. Windhoek.
[10] Southern African Power Pool (SAPP), 2011, SAPP Sustainability Bulletin, vol. 15. Available at http://www.sapp.co.zw/docs/SD%20Bulletin%20December,%202011.pdf [Accessed 23 April 2012]
[11] Salerno, E. (AWEA Director of Industry and Data Analysis), 2011, Cost of Wind Power – Kicks Coal’s Butt, Better than Natural Gas, quoted by Shahan, Z., Available at http://cleantechnica.com/2011/05/01/cost-of-wind-power-kicks-coals-butt-better-than-natural-gas-could-power-your-ev-for-0-70gallon/ [Accessed 10 May 2012]
70
[12] Bloomberg Energy Finance, 2011, Wind turbine prices fall to their lowest in recent years (press release. Available at http://bnef.com/PressReleases/view/139 [Accessed 10 May 2012]
[13] Soerensen, E. (Vestas grid integration expert) 2011, quoted during Development Dialogue Forum, 12 November 2011, Namibia, Windhoek.
[14] Desert Research Foundation (DRFN), 2009, CBEND bush to electricity project - Process optimization report. Available at http://cbend.forst.nu/downloads/. [Accessed 15 february 2012]
[15] Hager, C., Schultz, R., von Oertzen, D., 2007, Turning Namibian Invader Bush into Electricity: The CBEND Project, Agrisson Congress, 3- 4 July 2007, Desert Research Foundation of Namibia.
[16] Brüntrup, M., Herrmann, R., Gaebler, M. 2009, Bio-energy in Namibia: opportunities, threats and institutional challenges for rural development and food security, 13th ICABR Conference on “The Emerging Bio-Economy”, Ravello, Italy, 18-20 June 2009
[17] Desert Research Foundation (DRFN), 2010, CBEND IPP business plan. Avalilable at http://cbend.forst.nu/downloads/. [Accessed 15 february 2012]
[18] Herrmann, R., Brüntrup, M. 2009, “Bioenergy value chains in Namibia: Institutional challenges for rural development and food security,9th European IFSA Symposium, 7- 9 July 2010, Vienna, Austria.
[19] Ministry of Environment and Tourism, 2010, Strategic environmental assessment (SEA) for biofuel production in the Caprivi and Kavango regions of Namibia, Government of the Republic of Namibia, Windhoek. Available at http://www.jatropha.pro/PDF%20bestanden/Namibia_biofuel_strategic_environmental_assessment.pdf. [Accessed 15 January 2012]
[20] Brookshier, P. 2004, Hydropower technologies, Cutler J. Cleveland (Ed.), Encyclopedia of Energy, pp. 333-341. New York: Elsevier
[21] International Renewable Energy Agency (IRENA), 2011, Prospects for the African power sector. Available at http://www.irena.org/DocumentDownloads/Publications/Prospects_for_the_African_PowerSector.pdf [Accessed 20 March 2012]
[22] Institute for Public Policy Research (IPPR), 2009, Planning power: review of electricity policy in Namibia, Research report no. 11, Windhoek.
[23] Herrmann, R., Brüntrup, M. 2009, “Bioenergy value chains in Namibia: Institutional challenges for rural development and food security,9th European IFSA Symposium, 7- 9 July 2010, Vienna, Austria.
CHAPTER 4
[1] Pinch, T.J. & Bijker, W.E. 1984, "The social construction of facts and artefacts: or how the sociology of science and the sociology of technology might benefit each other", Social Studies of Science, pp. 399-441.
71
[2] Klein, H.K. & Kleinman, D.L. 2002, "The social construction of technology: Structural considerations", Science, Technology & Human Values, vol. 27, no. 1, pp. 28-52.
[3] Geels, F.W. 2004, “From Sectoral Systems of Innovation to Socio-Technical Systems: Insights about Dynamics and Change from Sociology and Institutional”, Theory, Research Policy, 33
[4 Geels, F.W., 2005, “Processes and patterns in transitions and system innovations: refining the co-evolutionary multi-level perspective”, Technological Forecasting and Social Change 72, 681–696.
[5] Berkhout, F. 2002, "Technological regimes, path dependency and the environment", Global Environmental Change, Part A: Human and Policy Dimensions, vol. 12, no. 1, pp. 1-4.
[6] Smith, A., Kern, F., 2007, “The transitions discourse in the ecological modernization of the Netherlands”, SPRU Electronic Working Paper Series No. 160, Brighton, University of Sussex, 24pp
[7] Kern, F. & Smith, A. 2008, "Restructuring energy systems for sustainability? Energy transition policy in the Netherlands", Energy Policy, vol. 36, no. 11, pp. 4093-4103.
[8] B. Elzen, F.W. Geels, K. Green (Eds.), System Innovation and the Transition to Sustainability: Theory, Evidence and Policy, Edward Elgar, Cheltenham, 2004.
CHAPTER 5
[1] Iita, J.S. (Ministry of mines and Energy, prime secretary), quoted during Development Dialogue Forum 8, 14 May 2012, Namibia, Windhoek.
[2] Ministry of Mines and Energy, 2007. Regional Electricity Distribution Master Plan (REDMP), Government of the Republic of Namibia, Windhoek. Available at: http://www.mme.gov.na/energy/pdf/Microsoft%20Word%20-%20FINAL%20REPORT_NAMREP_.pdf [Accessed 25 September 2011]
[3] Ministry of Mines and Energy, 2007. Off-Grid Energisation Master Plan (OGEMP), Government of the Republic of Namibia, Windhoek. Available at: http://www.mme.gov.na/pdf/undp-reports/off-grid-masterplan.pdf. [Accessed 7 November 2011]
[4] Etango Magazine, 2011, Solar revolving Fund gets new lease of life. Etango Magazine, 2nd quarter 2011.
[5] Solar revolving fund application form, 2011, Ministry of Mines and Energy, Available at: http://www.reeei.org.na/admin/data/uploads/SRF%20Loan%20Application%20Form.pdf [Accessed 21 September 2011]
[6] Renewable Energy and Energy Efficiency Institute (REEEI), 2012, Current Projects. Available at http://www.reeei.org.na/projects.php. [Accessed 5 May 2012]
[7] Personal communication, Helvi Hileka, Energy Shops Project Manager at REEEI, 7 April 2012
[8] Personal communication, Nico Sneiders, Research Senior at the Renewable Energy Division of the Ministry of Mines and Energy, 12 April 2012
72
[9] Etango Magazine, 2011, N$ 26 million Tsumkwe hybrid energy system comes on-line. Etango Magazine, 3rd quarter 2011
[10] Desert Research Foundation of Namibia (DRFN], 2011, Tsumkwe energy project fact sheet. Available at: http://www.drfn.info/docs/cbend/energy_factsheets/Tsumkwe%20Energy.pdf [Accessed 4 April 2012]
[11] Wienecke, M.A., 2010, “Promoting alternative technologies: experiences of the Habitat Research & Development Centre (HRDC)”, Human Settlements Review, vol. 1, Number 1
[12] Ministry of Mines and Energy, 1998. The White Paper on Energy Policy, Government of the Republic of Namibia, Windhoek. Available at: http://www.mme.gov.na/pdf/energy_policy_whitepaper.pdf. [Accessed 16 November 2012]
[13] Ministry of Mines and Energy, 2010. Namibian Renewable Energy Program (NAMREP), Government of the Republic of Namibia, Windhoek. Available at: http://www.mme.gov.na/energy/pdf/Microsoft%20Word%20-%20FINAL%20REPORT_NAMREP_.pdf [Accessed 25 October 2011]
[14] Ministry of Mines and Energy, 2008. Renewable Energy and Energy Efficiency Capacity Building Program (REEECAP). Government of the Republic of Namibia, Windhoek. Available at: http://www.reeei.org.na/projects.php [Accessed 5 October 2012]
[15] Renewable Energy and Energy Efficiency Institute (REEEI), 2012, Vision and mission. Available at http://www.reeei.org.na/mission_vision.html. [Accessed 5 May 2012]
[16] Ministry of Mines and Energy, 1996, Wind Energy Evaluation Programme - Walvis Bay/Lüderitz. Available at: http://www.mme.gov.na/energy/wind.htm. [Accessed 15 April 2012]
[17] Renewable Energy and Energy Efficiency Institute (REEEI), 2012, Prefeasibility study for the establishment of a concentrating solar power plant, draft report. Unpublished.
[18] Institute for Public Policy Research (IPPR), 2009, Planning power: review of electricity policy in Namibia, Research report no. 11, Windhoek.
[19] Renewable Energy and Energy Efficiency Partnership (REEEP), 2009, Policy database details: Namibia. Available at: http://www.reeep.org/index.php?id=9353&text=policy-database&special=viewitem&cid=95. [Acessed: 5 April 2012]
[20] GTZ, 2009, Energy-policy Framework Conditions for Electricity Markets and Renewable Energies. Eschborn. Available at: http://www.reeep.org/index.php?id=9353&text=policy-database&special=viewitem&cid=95 [Accessed 3 May 2012]
[21] Desert Research Foundation of Namibia (DRFN], 2012, DRFN Energy projects. Available at: http://www.drfn.org.na/projects/energy/ [Accessed 12 November 2012]
[22] Renewable Energy Industry Association of Namibia (REIAN), 2011, Description. Available at http://user.web.com.na/reia.namibia/. [Accessed 25 September 2011]
[23] Areva, 2012, Areva resources in Namibia: The Trekkojpe Mine. Available: http://www.areva.com/EN/operations-595/areva-resources-namibia-training-and-mining-projects.html [Accessed 23 March 2012].
73
[24] Ministry of Mines and Energy, 2012, MME strategic plan of 2012/2017, External Stakeholders Consultation on MME drafted Strategic Plan. 2 February 2012. Namibia, Windhoek.
[25] Ndhlukula, K. 2012, “Namibian policy perspectives on solar energy”. Southern African Solar Energy Conference (SASEC). 21 -23 May 2012. South Africa. Stellenbosch.
[26] Andersson, L. 2006, “Electricity sector reforms in Mozambique and Namibia”, master thesis, Lulea University of Technology, Department of business administration and social sciences.
[27] Meyer-Renschhausen, Kudakwashe Ndhlukula, Stephanus Nambili, Nyco Snyders 2010, Development of a Procurement Mechanism for Renewable Energy Resources in Namibia.
[28] Electricity Act of 18 October 2007, Governement Gaeatte of the Repuplique of Namibia, no. 3922. Windhoek. Available at: http://www.ecb.org.na/pdf/Act2007.pdf?m=7&sm=9 [Accessed 4 March 2012]
[29] Ministry of Environment and Tourism, 2011. National Policy for Climate Change. Government of the Republic of Namibia, Windhoek.
[30] Infrastructure Trust Fund European Africa, 2010, Caprivi Interconnector. Available at: http://www.eu-africa-infrastructure-tf.net/activities/grants/caprivi-interconnector.htm [Accessed 21 May 2012]
[31] IRENA, 2011, Renewable Energy Country Profile – Africa. Available at: http://www.irena.org/menu/index.aspx?mnu=cat&PriMenuID=36&CatID=136 [Accessed 18 May 2012]
[32] Renewable Energy and Energy Efficiency Partnership (REEEP), 2012, Policy database details: Botswana. Available at: http://www.reeep.org/index.php?id=9353&text=policy-database&special=viewitem&cid=95. [Acessed: 5 April 2012]
[33] Meyer-Renschhausen, M. 2012, “Evaluation of feed-in tariffs-schemes in African countries”, Southern African Solar Energy Conference (SASEC). 21 -23 May 2012. South Africa. Stellenbosch.
[34] South African Power Pool (SAPP), 2012, SAPP day ahead market (DZM) monthly performance. Available at http://www.sapp.co.zw/docs/DAM%20Market%20Monthly%20Performance%20Report-March%202012.pdf [Accessed 28 April 2012]
[35] IRENA, 2012, Country case study – Renewables readiness assessment – Mozambique. Available at: http://www.irena.org/DocumentDownloads/Publications/RRA_Mozambique_English.pdf [Accessed 6 April 2012]
[36] Pancho Ndebele (SASTELA Chairman), 2012, “The role of concentrating solar power in Southern Africa”. Southern African Solar Energy Conference (SASEC). 21 -23 May 2012. South Africa. Stellenbosch.
[37] EWEA, 2012, Global wind power market. Available at: http://blog.ewea.org/2012/04/global-wind-power-market-is-expected-to-more-than-double-in-next-five-years/ [Accessed 20 May 2012]
74
[38] UNDP Namibia, 2010, UNDP CSP TT NAM Project objectives, deliverables, components & financing plan. Available at: http://www.reeei.org.na/projects.php [Accessed 17 September]
[39] Intergovernmental Panel on Climate Change (IPCC) 2011, IPCC special Report on Renewable
Energy Resources and Climate Change Mitigation.
[40] Ministry of Environment and Tourism, 2011, Namibia’s second communication to the UNFCC, Government of the Republic of Namibia, Windhoek. Available at http://unfccc.int/national_reports/non-annex_i_natcom/items/2716.php. [Accessed 15 December 2011]
[41] UNFCCC, 2012, Consolidated baseline methodology for grid-connected electricity generation from renewable sources shows that solar, wind or biomass power plant project ACM0002, CDM Methodology Booklet. Bonn.
[42] Electricity Control Board (ECB), 2012, Assessment of net metering application and development of net metering rules, Terms of Reference. Windhoek.
[43] World Bank, Group, Electricity Control Board (ECB), 2012, Planning Parameters and Generation Options Draft Report. Windhoek.
CHAPTER 6
[1] Salgado, I., 2007. "Tullow in partnership talks for Kudu gas field". Business Report, Business Report & Independent Online (Pty)
[2] Musaba, L., Chikova, A., Naidoo, P., 2007, "Power Sector Reforms in SAPP Member Countries," Proceedings of the Power Africa Summit 2004, Vodaworld, Midrand, South Africa, 7-10 June 2004.
[3] EWEA, 2012, Basic Cost of Wind Energy. Available at: http://www.ewea.org/index.php?id=1639 [Accessed: 13 May 2012]
[4] REEEI, 2012, Pre-feasibility Study for the Establishment of a Pre-commercial Concentrating Solar Power Plant in Namibia. Draft Report.
[5] IRENA, 2011, Cost of renewables for power generation, Presentation to the workshop “Renewable competitiveness and innovation”, 6 October Bonn
[6] Nampower, 2011, Annual Report 2010. Available at http://www.nampower.com.na/Pages/annual-report.asp. [Accessed 14 October 2011]
[7] Sherbourne, R., 2010, Guide to the Namibian economy 2010, Institute for Public Policy Research. Windhoek.
[8] Pers. Communication, Dr. M. Muyambo, Manager: Technical Regulation at Electricity Control Board (ECB), 22 February 2012.
[9] EIA, 2012, Annual energy outlook of 2012, Energy Prices by Sector and Source. Available at: [Accessed 12 May 2012]
[10] Rutovitz, J. 2010. South African energy sector jobs to 2030. Prepared for Greenpeace Africa by the Institute for Sustainable Futures, University of Technology, Sydney, Australia.

75
[11] Infrastructure Trust Fund European Africa, 2010, Caprivi Interconnector. Available at: http://www.eu-africa-infrastructure-tf.net/activities/grants/caprivi-interconnector.htm [Accessed 21 May 2012]
[12] CO2 prices, 2012, Analysis of the EU CO2 Market, Available at http://www.co2prices.eu/ [Accessed 7 June 2012]
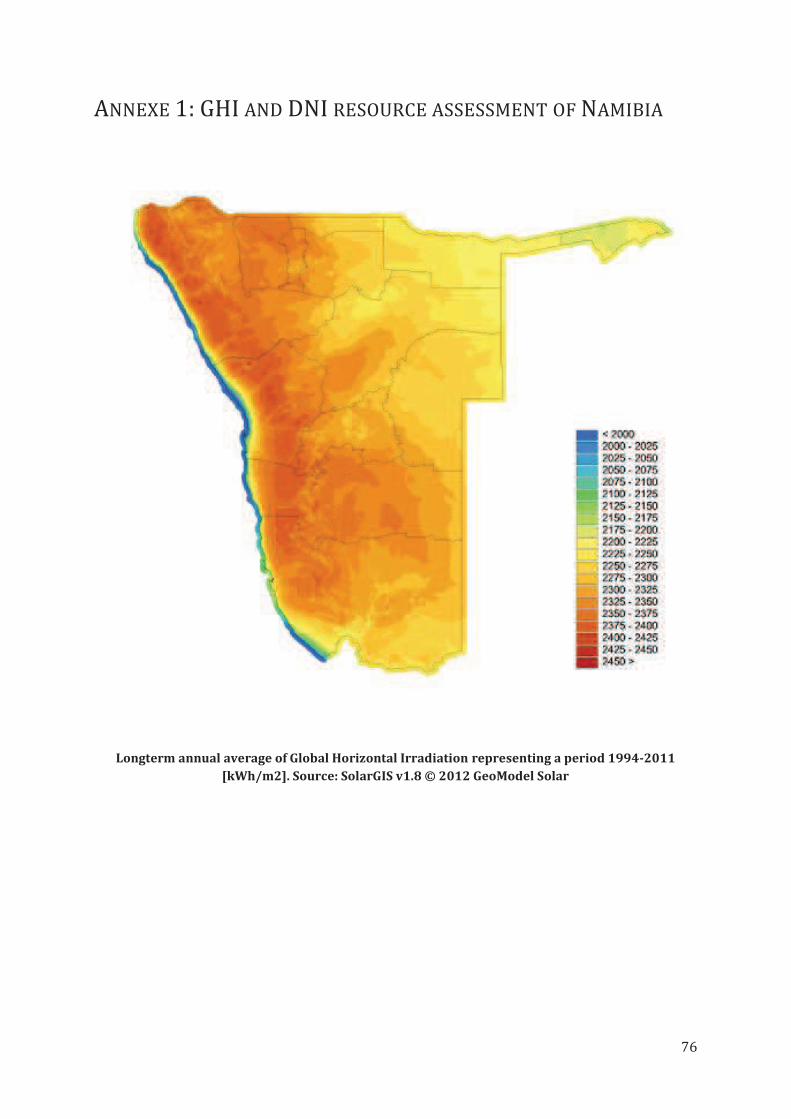
76
ANNEXE 1: GHI AND DNI RESOURCE ASSESSMENT OF NAMIBIA
Longterm annual average of Global Horizontal Irradiation representing a period 1994-2011
[kWh/m2]. Source: SolarGIS v1.8 © 2012 GeoModel Solar
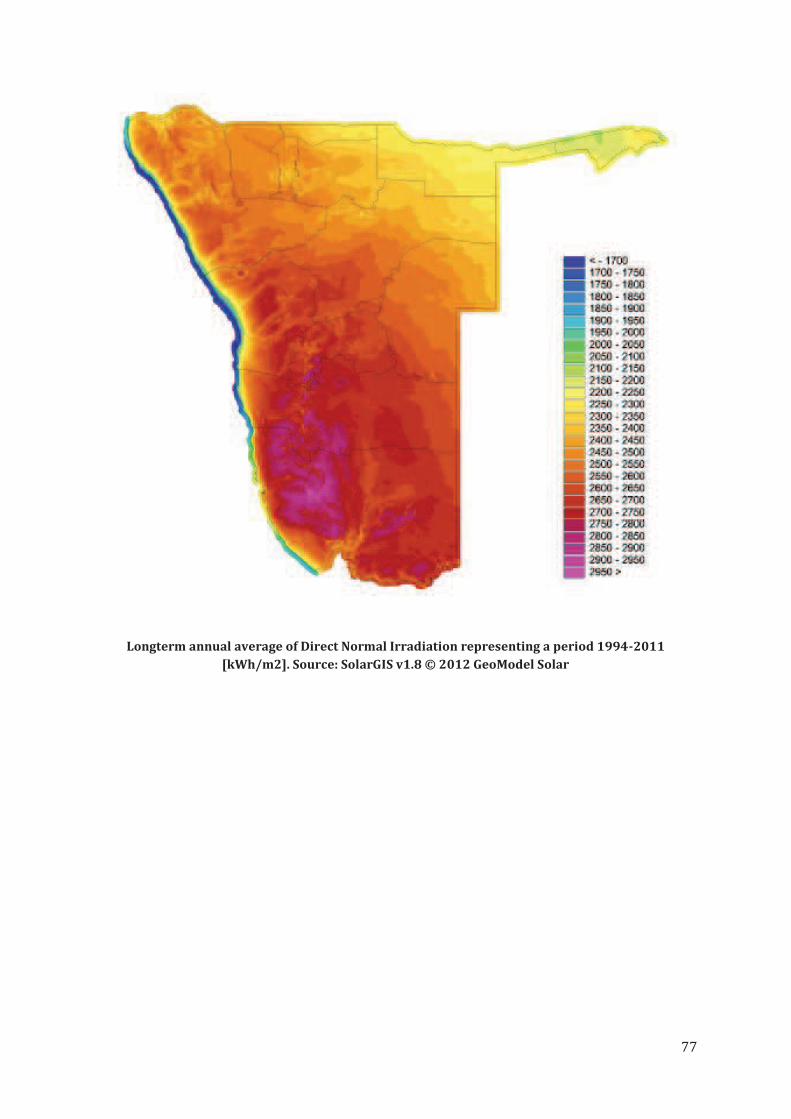
77
Longterm annual average of Direct Normal Irradiation representing a period 1994-2011
[kWh/m2]. Source: SolarGIS v1.8 © 2012 GeoModel Solar
78
ANNEXE 2- PAPER CONFERENCE (SASEC, 2012): “POTENTIAL
AND FUTURE OF CONCENTRATING SOLAR POWER IN NAMIBIA”. LE
FOL, Y., NDHLUKULA, K. 2012
Le Fol, Y., Ndhlukula, K. 2012, “The Potential and Future of Concentrating Solar Power in
Namibia”, Southern African Solar Energy Conference, South Africa, Stellenbosch, 21-23 May
2012.

THE POTENTIAL AND FUTURE OF CONCENTRATING SOLAR
POWER IN NAMIBA
Yoann Le Fol1, Kudakwashe Ndhlukula
2
1 Aalborg University, Department of Development and Planning; Vestre Havnepromenade 5 st. · 9000 Aalborg · Phone:
(+45) 9940 8429; E-mail: [email protected]
2 Renewable Energy and Energy Efficiency Institute; E-mail: [email protected]
Abstract
The Namibian electricity sector has mainly relied on electricity imports from other Southern African Power
Pool (SAPP) members over the last decade. However, a growth in electricity demand and scarce import
options could cause energy shortages as of 2012. Therefore, new power plants ought to be commissioned in
the near future to avoid the forecasted energy crisis. In this context, Concentrating Solar Power (CSP)
generation is regarded as an appropriate alternative to conventional energy technologies, particularly for the
excellent solar regime available in Namibia. The study presents a GIS analysis that identifies suitable areas
for CSP establishment. A broad range of geographical parameters such as solar radiation, topography,
hydrology or land use are examined. The calculations show that the CSP ceiling generation in Namibia is
equivalent to 70% of the worldwide electricity production. Moreover, the study offers a scenario analysis
where concrete CSP alternatives are compared to coal-fired plant projects developed by the national power
utility. Meteonorm and System Advisor Model (SAM) are used to design CSP alternatives located in the area
offering the best combination between high solar irradiation and short distances to the infrastructures.
Despite the affordability concern which has to be addressed with sound financial instruments, CSP represents
a seminal opportunity for the energy sector in Namibia.
Keywords: Namibia, concentrating solar power (CSP), GIS, ceiling generation, levelized cost of electricity
(LCOE) mapping, scenario analysis
1. Introduction
Namibia has 415 MW of installed generation capacity shared among four conventional power plants
(Ruacana hydropower station, Van Eck coal-fired plant, Anixas and Paratus diesel plants) [1]. This power
system is ageing, inefficient and insufficient. Consequently, the national power utility, Nampower, relies on
imports (e.g. 60% in 2010) from other Southern African Power Pool (SAPP) members to secure the
electricity supply. However, a growth in electricity demand estimated at 4% and the expiry of the import
agreement with Zimbabwe in 2013 will expose Namibia to electricity shortage. Nampower forecasts a power
supply deficit of 80 MW by the end of 2012, increasing to 300 MW by 2015. Thus, a revision of the current
system as well as new power plant procurements are necessary. In this context, conventional energy
technologies are particularly considered since they are less capital intensive. For example, Nampower is
currently studying the feasibility of a new 150 to 300 MW coal-fired power plant in Erongo Region.
However, generation deficit could also be tackled with renewable energy technologies which provide
supplementary benefits (e.g. security of supply and sustainability). For instance, Concentrating Solar Power
is a commercially mature and proven technology [2], adaptable to the load demand curve [3] and potentially
competitive with coal-fired power by 2020 [4]. Moreover, CSP is expected to offer substantial efficiency in
Namibia as a result of high solar irradiation (on average 2 500 kWh/m2/y).
The paper evaluates the potential and future of CSP in Namibia. A first section presents a GIS analysis that
identifies suitable areas for CSP deployment and estimates the CSP ceiling generation. Subsequently, a
second section offers a mapping of the Levelized Cost of Electricty (LCOE) for a 50 MW CSP plant in order
to assess the geographic distribution of CSP economic performances across the country. Finally, a third
section compares the possible future of CSP and coal power in Namibia through a scenario analysis
encompassing economic, social and environmental aspects.
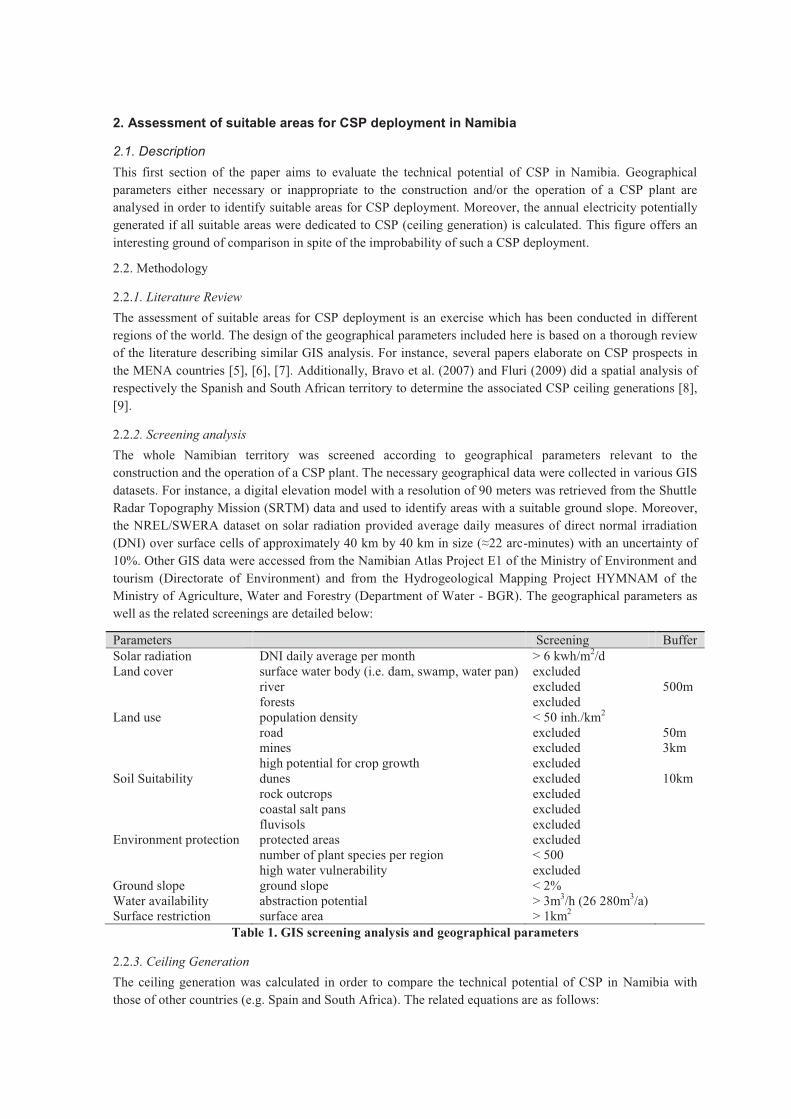
2. Assessment of suitable areas for CSP deployment in Namibia
2.1. Description
This first section of the paper aims to evaluate the technical potential of CSP in Namibia. Geographical
parameters either necessary or inappropriate to the construction and/or the operation of a CSP plant are
analysed in order to identify suitable areas for CSP deployment. Moreover, the annual electricity potentially
generated if all suitable areas were dedicated to CSP (ceiling generation) is calculated. This figure offers an
interesting ground of comparison in spite of the improbability of such a CSP deployment.
2.2. Methodology
2.2.1. Literature Review
The assessment of suitable areas for CSP deployment is an exercise which has been conducted in different
regions of the world. The design of the geographical parameters included here is based on a thorough review
of the literature describing similar GIS analysis. For instance, several papers elaborate on CSP prospects in
the MENA countries [5], [6], [7]. Additionally, Bravo et al. (2007) and Fluri (2009) did a spatial analysis of
respectively the Spanish and South African territory to determine the associated CSP ceiling generations [8],
[9].
2.2.2. Screening analysis
The whole Namibian territory was screened according to geographical parameters relevant to the
construction and the operation of a CSP plant. The necessary geographical data were collected in various GIS
datasets. For instance, a digital elevation model with a resolution of 90 meters was retrieved from the Shuttle
Radar Topography Mission (SRTM) data and used to identify areas with a suitable ground slope. Moreover,
the NREL/SWERA dataset on solar radiation provided average daily measures of direct normal irradiation
(DNI) over surface cells of approximately 40 km by 40 km in size (≈22 arc-minutes) with an uncertainty of
10%. Other GIS data were accessed from the Namibian Atlas Project E1 of the Ministry of Environment and
tourism (Directorate of Environment) and from the Hydrogeological Mapping Project HYMNAM of the
Ministry of Agriculture, Water and Forestry (Department of Water - BGR). The geographical parameters as
well as the related screenings are detailed below:
Parameters Screening Buffer
Solar radiation DNI daily average per month > 6 kwh/m2/d Land cover surface water body (i.e. dam, swamp, water pan) excluded river excluded 500m forests excluded Land use population density < 50 inh./km2 road excluded 50m mines excluded 3km high potential for crop growth excluded Soil Suitability dunes excluded 10km rock outcrops
coastal salt pans excluded excluded
fluvisols excluded Environment protection protected areas excluded number of plant species per region < 500 high water vulnerability excluded Ground slope ground slope < 2% Water availability abstraction potential > 3m3/h (26 280m3/a) Surface restriction surface area > 1km2
Table 1. GIS screening analysis and geographical parameters
2.2.3. Ceiling Generation
The ceiling generation was calculated in order to compare the technical potential of CSP in Namibia with
those of other countries (e.g. Spain and South Africa). The related equations are as follows:
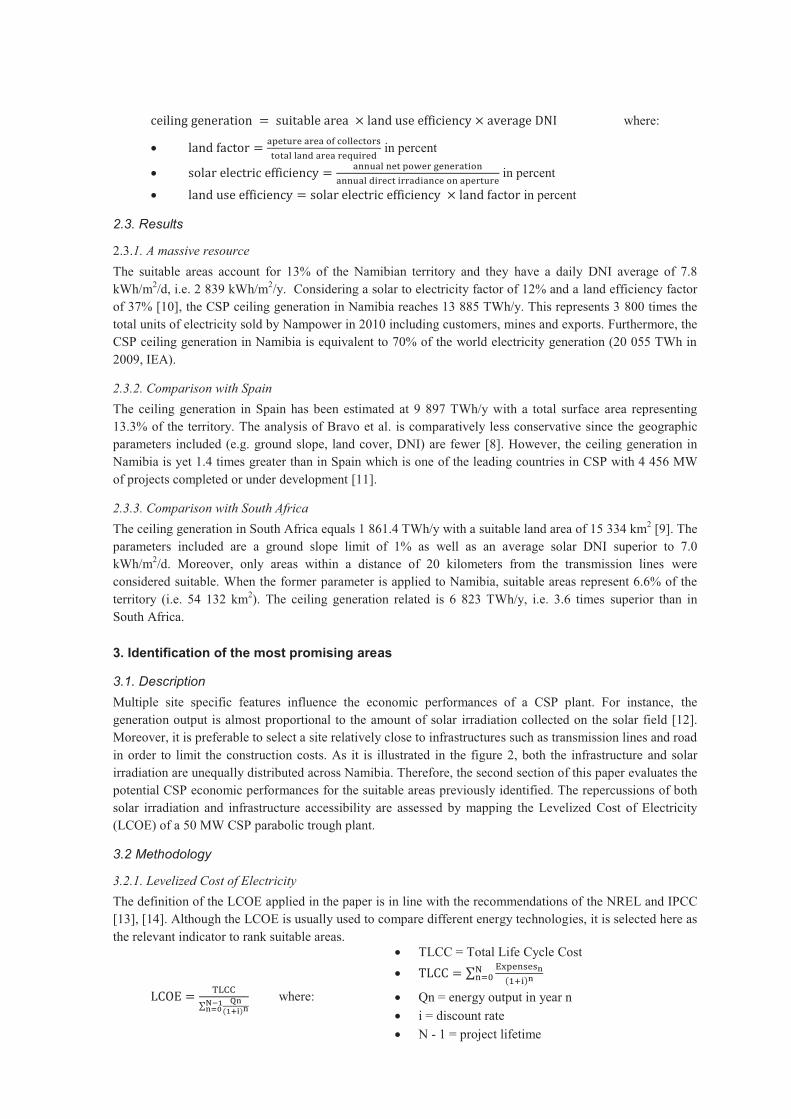
where:
· in percent
· in percent
· in percent
2.3. Results
2.3.1. A massive resource
The suitable areas account for 13% of the Namibian territory and they have a daily DNI average of 7.8
kWh/m2/d, i.e. 2 839 kWh/m2/y. Considering a solar to electricity factor of 12% and a land efficiency factor
of 37% [10], the CSP ceiling generation in Namibia reaches 13 885 TWh/y. This represents 3 800 times the
total units of electricity sold by Nampower in 2010 including customers, mines and exports. Furthermore, the
CSP ceiling generation in Namibia is equivalent to 70% of the world electricity generation (20 055 TWh in
2009, IEA).
2.3.2. Comparison with Spain
The ceiling generation in Spain has been estimated at 9 897 TWh/y with a total surface area representing
13.3% of the territory. The analysis of Bravo et al. is comparatively less conservative since the geographic
parameters included (e.g. ground slope, land cover, DNI) are fewer [8]. However, the ceiling generation in
Namibia is yet 1.4 times greater than in Spain which is one of the leading countries in CSP with 4 456 MW
of projects completed or under development [11].
2.3.3. Comparison with South Africa
The ceiling generation in South Africa equals 1 861.4 TWh/y with a suitable land area of 15 334 km2 [9]. The
parameters included are a ground slope limit of 1% as well as an average solar DNI superior to 7.0
kWh/m2/d. Moreover, only areas within a distance of 20 kilometers from the transmission lines were
considered suitable. When the former parameter is applied to Namibia, suitable areas represent 6.6% of the
territory (i.e. 54 132 km2). The ceiling generation related is 6 823 TWh/y, i.e. 3.6 times superior than in
South Africa.
3. Identification of the most promising areas
3.1. Description
Multiple site specific features influence the economic performances of a CSP plant. For instance, the
generation output is almost proportional to the amount of solar irradiation collected on the solar field [12].
Moreover, it is preferable to select a site relatively close to infrastructures such as transmission lines and road
in order to limit the construction costs. As it is illustrated in the figure 2, both the infrastructure and solar
irradiation are unequally distributed across Namibia. Therefore, the second section of this paper evaluates the
potential CSP economic performances for the suitable areas previously identified. The repercussions of both
solar irradiation and infrastructure accessibility are assessed by mapping the Levelized Cost of Electricity
(LCOE) of a 50 MW CSP parabolic trough plant.
3.2 Methodology
3.2.1. Levelized Cost of Electricity
The definition of the LCOE applied in the paper is in line with the recommendations of the NREL and IPCC
[13], [14]. Although the LCOE is usually used to compare different energy technologies, it is selected here as
the relevant indicator to rank suitable areas.
where:
· TLCC = Total Life Cycle Cost
·
· Qn = energy output in year n
· i = discount rate
· N - 1 = project lifetime
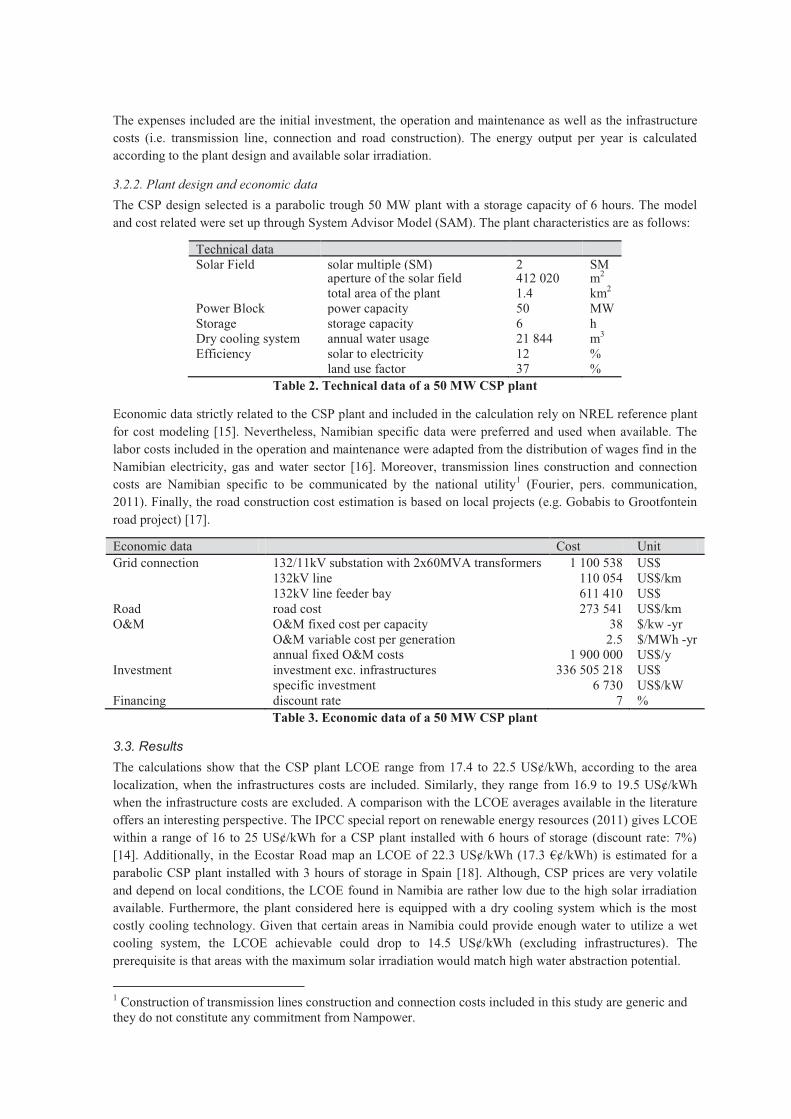
The expenses included are the initial investment, the operation and maintenance as well as the infrastructure
costs (i.e. transmission line, connection and road construction). The energy output per year is calculated
according to the plant design and available solar irradiation.
3.2.2. Plant design and economic data
The CSP design selected is a parabolic trough 50 MW plant with a storage capacity of 6 hours. The model
and cost related were set up through System Advisor Model (SAM). The plant characteristics are as follows:
Technical data Solar Field solar multiple (SM) 2 SM aperture of the solar field 412 020 m2 total area of the plant 1.4 km2 Power Block power capacity 50 MW Storage storage capacity 6 h Dry cooling system annual water usage 21 844 m3 Efficiency solar to electricity 12 % land use factor 37 %
Table 2. Technical data of a 50 MW CSP plant
Economic data strictly related to the CSP plant and included in the calculation rely on NREL reference plant
for cost modeling [15]. Nevertheless, Namibian specific data were preferred and used when available. The
labor costs included in the operation and maintenance were adapted from the distribution of wages find in the
Namibian electricity, gas and water sector [16]. Moreover, transmission lines construction and connection
costs are Namibian specific to be communicated by the national utility1 (Fourier, pers. communication,
2011). Finally, the road construction cost estimation is based on local projects (e.g. Gobabis to Grootfontein
road project) [17].
Economic data
Cost Unit
Grid connection 132/11kV substation with 2x60MVA transformers 1 100 538 US$
132kV line 110 054 US$/km
132kV line feeder bay 611 410 US$
Road road cost 273 541 US$/km O&M O&M fixed cost per capacity 38 $/kw -yr
O&M variable cost per generation 2.5 $/MWh -yr
annual fixed O&M costs 1 900 000 US$/y
Investment investment exc. infrastructures 336 505 218 US$
specific investment 6 730 US$/kW
Financing discount rate 7 %
Table 3. Economic data of a 50 MW CSP plant
3.3. Results
The calculations show that the CSP plant LCOE range from 17.4 to 22.5 US¢/kWh, according to the area
localization, when the infrastructures costs are included. Similarly, they range from 16.9 to 19.5 US¢/kWh
when the infrastructure costs are excluded. A comparison with the LCOE averages available in the literature
offers an interesting perspective. The IPCC special report on renewable energy resources (2011) gives LCOE
within a range of 16 to 25 US¢/kWh for a CSP plant installed with 6 hours of storage (discount rate: 7%)
[14]. Additionally, in the Ecostar Road map an LCOE of 22.3 US¢/kWh (17.3 €¢/kWh) is estimated for a
parabolic CSP plant installed with 3 hours of storage in Spain [18]. Although, CSP prices are very volatile
and depend on local conditions, the LCOE found in Namibia are rather low due to the high solar irradiation
available. Furthermore, the plant considered here is equipped with a dry cooling system which is the most
costly cooling technology. Given that certain areas in Namibia could provide enough water to utilize a wet
cooling system, the LCOE achievable could drop to 14.5 US¢/kWh (excluding infrastructures). The
prerequisite is that areas with the maximum solar irradiation would match high water abstraction potential.
1 Construction of transmission lines construction and connection costs included in this study are generic and they do not constitute any commitment from Nampower.
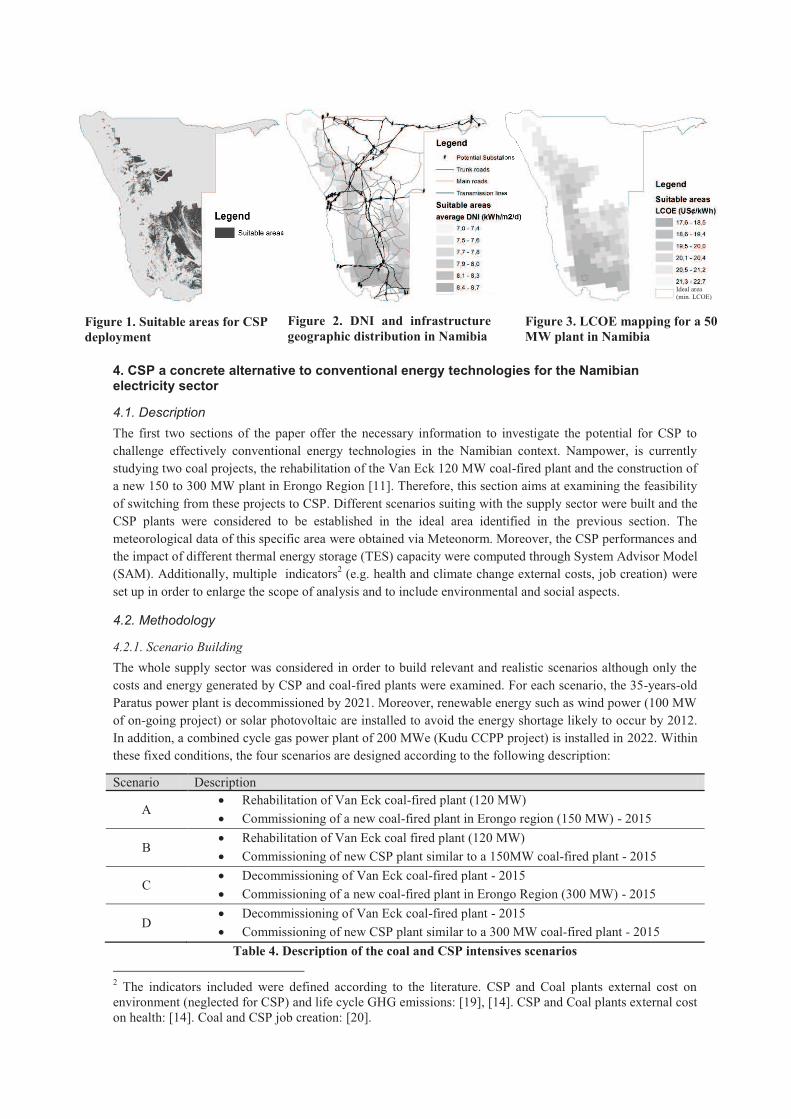
4. CSP a concrete alternative to conventional energy technologies for the Namibian electricity sector
4.1. Description
The first two sections of the paper offer the necessary information to investigate the potential for CSP to
challenge effectively conventional energy technologies in the Namibian context. Nampower, is currently
studying two coal projects, the rehabilitation of the Van Eck 120 MW coal-fired plant and the construction of
a new 150 to 300 MW plant in Erongo Region [11]. Therefore, this section aims at examining the feasibility
of switching from these projects to CSP. Different scenarios suiting with the supply sector were built and the
CSP plants were considered to be established in the ideal area identified in the previous section. The
meteorological data of this specific area were obtained via Meteonorm. Moreover, the CSP performances and
the impact of different thermal energy storage (TES) capacity were computed through System Advisor Model
(SAM). Additionally, multiple indicators2 (e.g. health and climate change external costs, job creation) were
set up in order to enlarge the scope of analysis and to include environmental and social aspects.
4.2. Methodology
4.2.1. Scenario Building
The whole supply sector was considered in order to build relevant and realistic scenarios although only the
costs and energy generated by CSP and coal-fired plants were examined. For each scenario, the 35-years-old
Paratus power plant is decommissioned by 2021. Moreover, renewable energy such as wind power (100 MW
of on-going project) or solar photovoltaic are installed to avoid the energy shortage likely to occur by 2012.
In addition, a combined cycle gas power plant of 200 MWe (Kudu CCPP project) is installed in 2022. Within
these fixed conditions, the four scenarios are designed according to the following description:
Scenario Description
A · Rehabilitation of Van Eck coal-fired plant (120 MW)
· Commissioning of a new coal-fired plant in Erongo region (150 MW) - 2015
B · Rehabilitation of Van Eck coal fired plant (120 MW)
· Commissioning of new CSP plant similar to a 150MW coal-fired plant - 2015
C · Decommissioning of Van Eck coal-fired plant - 2015
· Commissioning of a new coal-fired plant in Erongo Region (300 MW) - 2015
D · Decommissioning of Van Eck coal-fired plant - 2015
· Commissioning of new CSP plant similar to a 300 MW coal-fired plant - 2015
Table 4. Description of the coal and CSP intensives scenarios
2 The indicators included were defined according to the literature. CSP and Coal plants external cost on environment (neglected for CSP) and life cycle GHG emissions: [19], [14]. CSP and Coal plants external cost on health: [14]. Coal and CSP job creation: [20].
Figure 2. DNI and infrastructure
geographic distribution in Namibia
Figure 1. Suitable areas for CSP
deployment
Ideal area (min. LCOE)
Figure 3. LCOE mapping for a 50
MW plant in Namibia
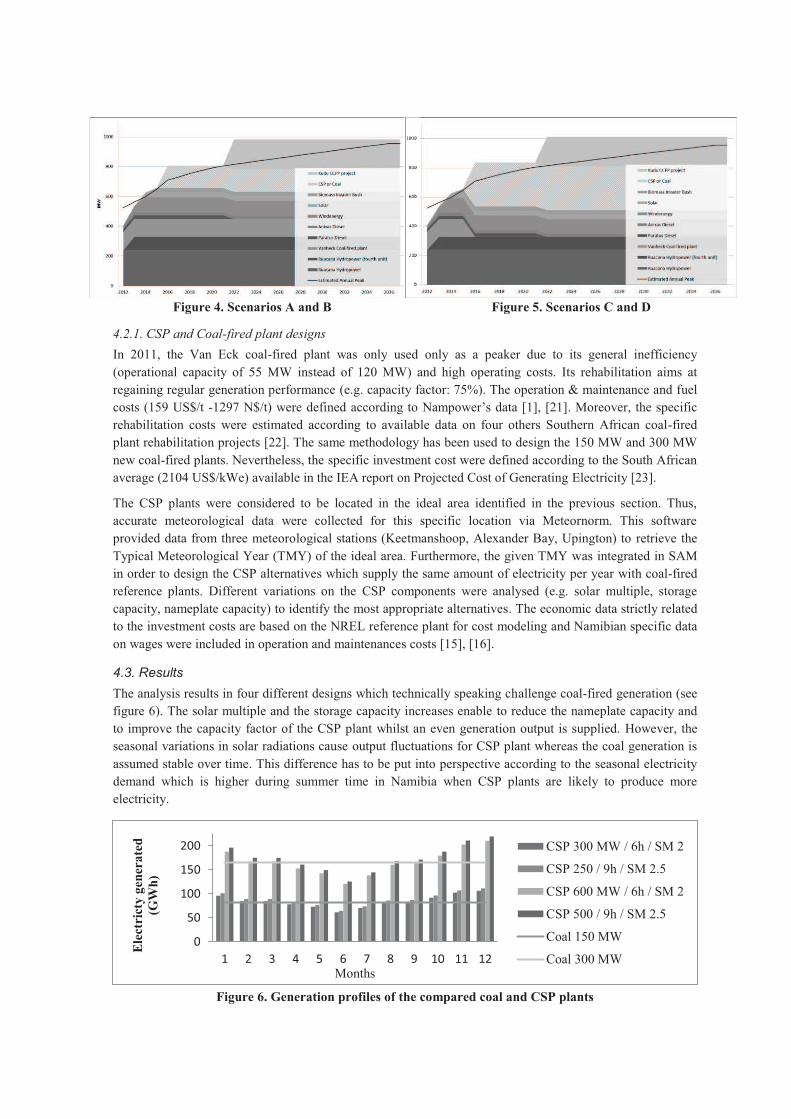
Figure 4. Scenarios A and B Figure 5. Scenarios C and D
4.2.1. CSP and Coal-fired plant designs
In 2011, the Van Eck coal-fired plant was only used only as a peaker due to its general inefficiency
(operational capacity of 55 MW instead of 120 MW) and high operating costs. Its rehabilitation aims at
regaining regular generation performance (e.g. capacity factor: 75%). The operation & maintenance and fuel
costs (159 US$/t -1297 N$/t) were defined according to Nampower’s data [1], [21]. Moreover, the specific
rehabilitation costs were estimated according to available data on four others Southern African coal-fired
plant rehabilitation projects [22]. The same methodology has been used to design the 150 MW and 300 MW
new coal-fired plants. Nevertheless, the specific investment cost were defined according to the South African
average (2104 US$/kWe) available in the IEA report on Projected Cost of Generating Electricity [23].
The CSP plants were considered to be located in the ideal area identified in the previous section. Thus,
accurate meteorological data were collected for this specific location via Meteornorm. This software
provided data from three meteorological stations (Keetmanshoop, Alexander Bay, Upington) to retrieve the
Typical Meteorological Year (TMY) of the ideal area. Furthermore, the given TMY was integrated in SAM
in order to design the CSP alternatives which supply the same amount of electricity per year with coal-fired
reference plants. Different variations on the CSP components were analysed (e.g. solar multiple, storage
capacity, nameplate capacity) to identify the most appropriate alternatives. The economic data strictly related
to the investment costs are based on the NREL reference plant for cost modeling and Namibian specific data
on wages were included in operation and maintenances costs [15], [16].
4.3. Results
The analysis results in four different designs which technically speaking challenge coal-fired generation (see
figure 6). The solar multiple and the storage capacity increases enable to reduce the nameplate capacity and
to improve the capacity factor of the CSP plant whilst an even generation output is supplied. However, the
seasonal variations in solar radiations cause output fluctuations for CSP plant whereas the coal generation is
assumed stable over time. This difference has to be put into perspective according to the seasonal electricity
demand which is higher during summer time in Namibia when CSP plants are likely to produce more
electricity.
Figure 6. Generation profiles of the compared coal and CSP plants
0
50
100
150
200
1 2 3 4 5 6 7 8 9 10 11 12
Ele
ctri
cty
gen
era
ted
(GW
h)
Months
CSP 300 MW / 6h / SM 2
CSP 250 / 9h / SM 2.5
CSP 600 MW / 6h / SM 2
CSP 500 / 9h / SM 2.5
Coal 150 MW
Coal 300 MW
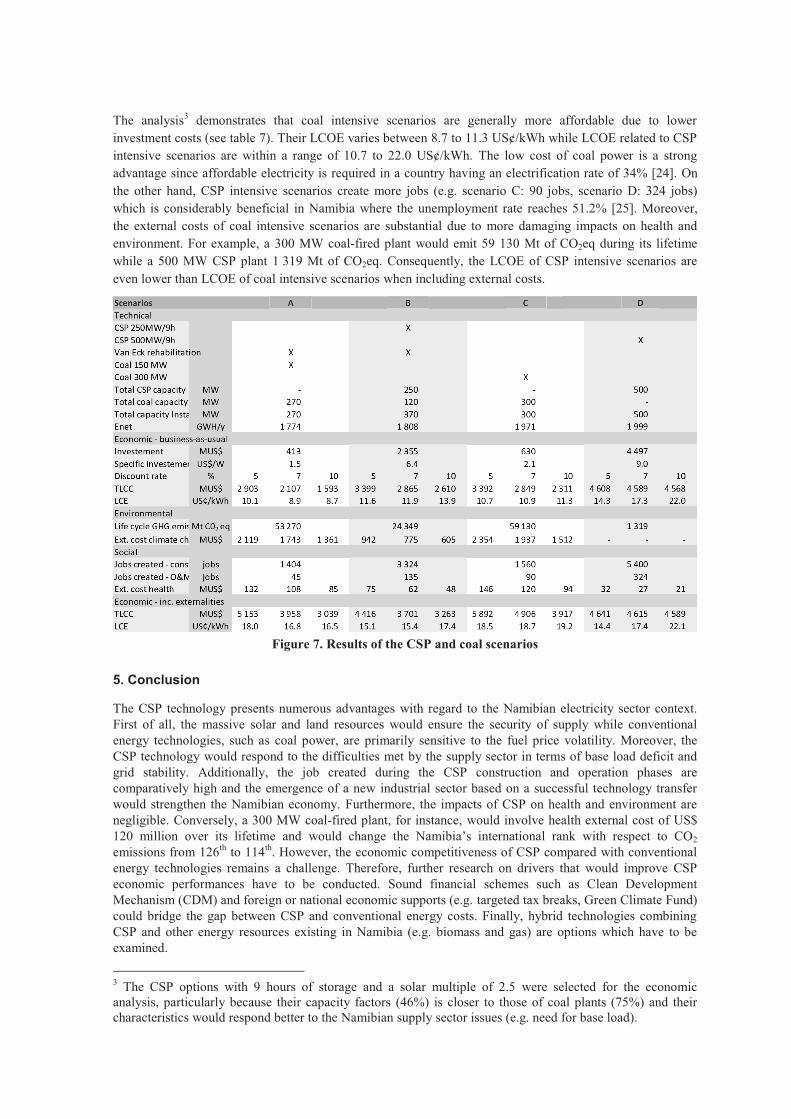
The analysis3 demonstrates that coal intensive scenarios are generally more affordable due to lower
investment costs (see table 7). Their LCOE varies between 8.7 to 11.3 US¢/kWh while LCOE related to CSP
intensive scenarios are within a range of 10.7 to 22.0 US¢/kWh. The low cost of coal power is a strong
advantage since affordable electricity is required in a country having an electrification rate of 34% [24]. On
the other hand, CSP intensive scenarios create more jobs (e.g. scenario C: 90 jobs, scenario D: 324 jobs)
which is considerably beneficial in Namibia where the unemployment rate reaches 51.2% [25]. Moreover,
the external costs of coal intensive scenarios are substantial due to more damaging impacts on health and
environment. For example, a 300 MW coal-fired plant would emit 59 130 Mt of CO2eq during its lifetime
while a 500 MW CSP plant 1 319 Mt of CO2eq. Consequently, the LCOE of CSP intensive scenarios are
even lower than LCOE of coal intensive scenarios when including external costs.
Figure 7. Results of the CSP and coal scenarios
5. Conclusion
The CSP technology presents numerous advantages with regard to the Namibian electricity sector context.
First of all, the massive solar and land resources would ensure the security of supply while conventional
energy technologies, such as coal power, are primarily sensitive to the fuel price volatility. Moreover, the
CSP technology would respond to the difficulties met by the supply sector in terms of base load deficit and
grid stability. Additionally, the job created during the CSP construction and operation phases are
comparatively high and the emergence of a new industrial sector based on a successful technology transfer
would strengthen the Namibian economy. Furthermore, the impacts of CSP on health and environment are
negligible. Conversely, a 300 MW coal-fired plant, for instance, would involve health external cost of US$
120 million over its lifetime and would change the Namibia’s international rank with respect to CO2
emissions from 126th to 114th. However, the economic competitiveness of CSP compared with conventional
energy technologies remains a challenge. Therefore, further research on drivers that would improve CSP
economic performances have to be conducted. Sound financial schemes such as Clean Development
Mechanism (CDM) and foreign or national economic supports (e.g. targeted tax breaks, Green Climate Fund)
could bridge the gap between CSP and conventional energy costs. Finally, hybrid technologies combining
CSP and other energy resources existing in Namibia (e.g. biomass and gas) are options which have to be
examined.
3 The CSP options with 9 hours of storage and a solar multiple of 2.5 were selected for the economic analysis, particularly because their capacity factors (46%) is closer to those of coal plants (75%) and their characteristics would respond better to the Namibian supply sector issues (e.g. need for base load).
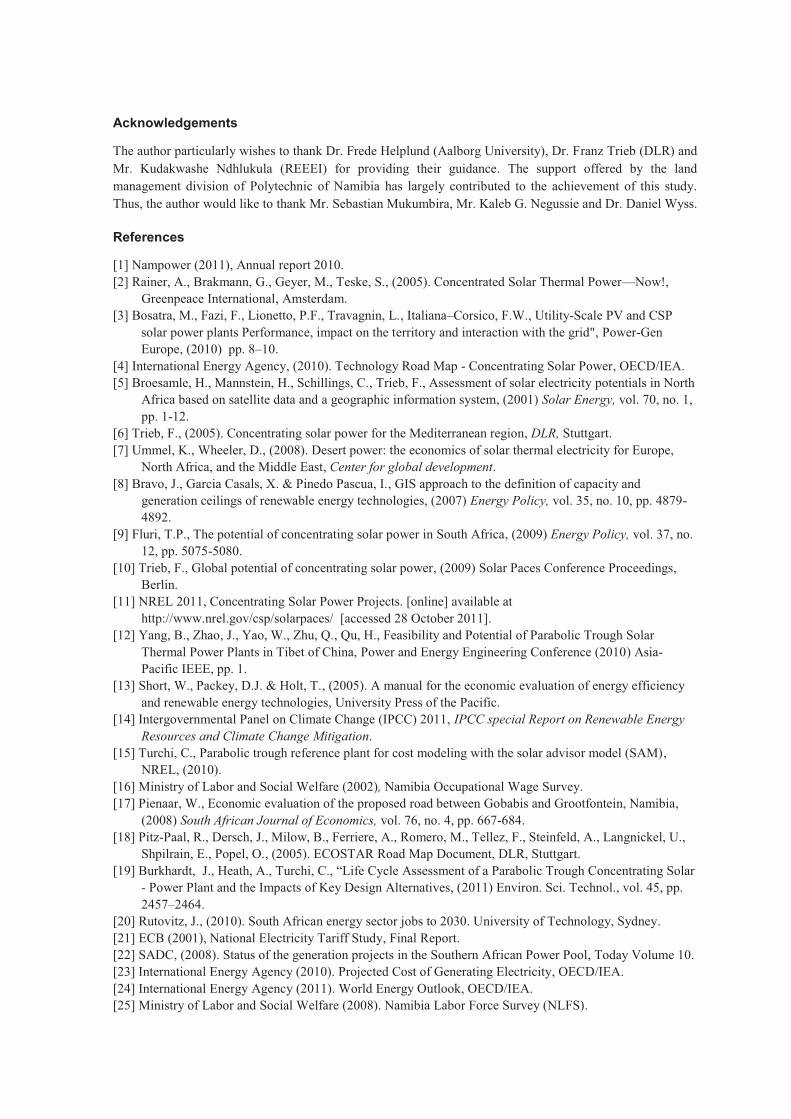
Acknowledgements
The author particularly wishes to thank Dr. Frede Helplund (Aalborg University), Dr. Franz Trieb (DLR) and
Mr. Kudakwashe Ndhlukula (REEEI) for providing their guidance. The support offered by the land
management division of Polytechnic of Namibia has largely contributed to the achievement of this study.
Thus, the author would like to thank Mr. Sebastian Mukumbira, Mr. Kaleb G. Negussie and Dr. Daniel Wyss.
References
[1] Nampower (2011), Annual report 2010.
[2] Rainer, A., Brakmann, G., Geyer, M., Teske, S., (2005). Concentrated Solar Thermal Power—Now!,
Greenpeace International, Amsterdam.
[3] Bosatra, M., Fazi, F., Lionetto, P.F., Travagnin, L., Italiana–Corsico, F.W., Utility-Scale PV and CSP
solar power plants Performance, impact on the territory and interaction with the grid", Power-Gen
Europe, (2010) pp. 8–10.
[4] International Energy Agency, (2010). Technology Road Map - Concentrating Solar Power, OECD/IEA.
[5] Broesamle, H., Mannstein, H., Schillings, C., Trieb, F., Assessment of solar electricity potentials in North
Africa based on satellite data and a geographic information system, (2001) Solar Energy, vol. 70, no. 1,
pp. 1-12.
[6] Trieb, F., (2005). Concentrating solar power for the Mediterranean region, DLR, Stuttgart.
[7] Ummel, K., Wheeler, D., (2008). Desert power: the economics of solar thermal electricity for Europe,
North Africa, and the Middle East, Center for global development.
[8] Bravo, J., Garcia Casals, X. & Pinedo Pascua, I., GIS approach to the definition of capacity and
generation ceilings of renewable energy technologies, (2007) Energy Policy, vol. 35, no. 10, pp. 4879-
4892.
[9] Fluri, T.P., The potential of concentrating solar power in South Africa, (2009) Energy Policy, vol. 37, no.
12, pp. 5075-5080.
[10] Trieb, F., Global potential of concentrating solar power, (2009) Solar Paces Conference Proceedings,
Berlin.
[11] NREL 2011, Concentrating Solar Power Projects. [online] available at
http://www.nrel.gov/csp/solarpaces/ [accessed 28 October 2011].
[12] Yang, B., Zhao, J., Yao, W., Zhu, Q., Qu, H., Feasibility and Potential of Parabolic Trough Solar
Thermal Power Plants in Tibet of China, Power and Energy Engineering Conference (2010) Asia-
Pacific IEEE, pp. 1.
[13] Short, W., Packey, D.J. & Holt, T., (2005). A manual for the economic evaluation of energy efficiency
and renewable energy technologies, University Press of the Pacific.
[14] Intergovernmental Panel on Climate Change (IPCC) 2011, IPCC special Report on Renewable Energy
Resources and Climate Change Mitigation.
[15] Turchi, C., Parabolic trough reference plant for cost modeling with the solar advisor model (SAM),
NREL, (2010).
[16] Ministry of Labor and Social Welfare (2002), Namibia Occupational Wage Survey.
[17] Pienaar, W., Economic evaluation of the proposed road between Gobabis and Grootfontein, Namibia,
(2008) South African Journal of Economics, vol. 76, no. 4, pp. 667-684.
[18] Pitz-Paal, R., Dersch, J., Milow, B., Ferriere, A., Romero, M., Tellez, F., Steinfeld, A., Langnickel, U.,
Shpilrain, E., Popel, O., (2005). ECOSTAR Road Map Document, DLR, Stuttgart.
[19] Burkhardt, J., Heath, A., Turchi, C., “Life Cycle Assessment of a Parabolic Trough Concentrating Solar
- Power Plant and the Impacts of Key Design Alternatives, (2011) Environ. Sci. Technol., vol. 45, pp.
2457–2464.
[20] Rutovitz, J., (2010). South African energy sector jobs to 2030. University of Technology, Sydney.
[21] ECB (2001), National Electricity Tariff Study, Final Report.
[22] SADC, (2008). Status of the generation projects in the Southern African Power Pool, Today Volume 10.
[23] International Energy Agency (2010). Projected Cost of Generating Electricity, OECD/IEA.
[24] International Energy Agency (2011). World Energy Outlook, OECD/IEA.
[25] Ministry of Labor and Social Welfare (2008). Namibia Labor Force Survey (NLFS).