master plan - together north...
TRANSCRIPT

UNION COUNTY
NEW JERSEY
MASTER PLAN
GOALS & OBJECTIVES
DEMOGRAPHICS
LAND USE PLAN
CIRCULATION/TRANSPORTATION PLAN
ECONOMIC DEVELOPMENT PLAN
June, 1998
UNION COUNTY MASTER PLAN
UNION COUNTY BOARD OF CHOSEN FREEHOLDERS
Daniel P. Sullivan ....................................................................................................... Chairperson
Nicholas P. Scutari ............................................................................................. Vice-Chairperson
Donald Goncalves ........................................................................................................ Freeholder
Chester Holmes ............................................................................................................ Freeholder
Lewis Mingo, Jr. .......................................................................................................... Freeholder
Alexander Mirabella ..................................................................................................... Freeholder
Mary P. Ruotolo. .......................................................................................................... Freeholder
Deborah P. Scanlon. ..................................................................................................... Freeholder
Linda Stender ............................................................................................................... Freeholder
UNION COUNTY PLANNING BOARD
Linda Stender ................................................................................................. Freeholder Member
Deborah P. Scanlon ........................................................................................ Freeholder Member
John O’Shea ................................................................................................................... Chairman
Livio Mancino ........................................................................................................ Vice Chairman
Janet Prince .................................................................................................................... Secretary
Ralph Liccardi .................................................................................................................. Member
William Malone. ............................................................................................................... Member
Eugene Pepe..................................................................................................................... Member
David Graves..................................................................................................... Alternate Member
Patrick Scalon ................................................................................................... Alternate Member
Neil Cohen, Esq. .............................................................................................................. Counsel
UNION COUNTY STAFF
Michael J. Lapolla ............................................................................................... County Manager
George W. Devanney .............................................................................. Deputy County Manager
Mauro Checchio ............................................................... Director, Division of Policy & Planning
Carol I. Cohen ...................................................................................................... County Counsel
Armand A. Fiorletti, P.E. ..................................................................................... County Engineer
Richard S. Mueller......................................................................................... Supervising Planner
Ron Weening ...........................................................................Supervising Transportation Planner
Scott Bauman ......................................................................................................... Senior Planner
E. Wesley Day ........................................................................................................ Senior Planner
Mary Jane Milway .............................................................................................. Assistant Planner
Robert J. Travisano .................................................................. Program Development Specialist I
Sal Antonelli ................................................................................... Economic Development Rep I
William Inglefield ........................................................................... Economic Development Rep I
UNION COUNTY MASTER PLAN
i
TABLE OF CONTENTS
INTRODUCTION ................................................................................................................. 1-1
GOALS AND OBJECTIVES ............................................................................................... 1-2
Housing ....................................................................................................................... 1-2
Development................................................................................................................ 1-3
Transportation/Circulation ........................................................................................... 1-4
Economic Development ............................................................................................... 1-5
DEMOGRAPHICS ............................................................................................................... 2-1
Population ................................................................................................................... 2-1
Demographic Characteristics ........................................................................................ 2-5
Population Projections ................................................................................................. 2-6
Housing ......................................................................................................................2-14
Employment/Labor Force............................................................................................2-20
School Enrollments .....................................................................................................2-22
LAND USE PLAN ................................................................................................................. 3-1
Residential ................................................................................................................... 3-1
Commercial ................................................................................................................. 3-5
Industrial ..................................................................................................................... 3-6
County Parks ............................................................................................................... 3-7
Municipal Parks ........................................................................................................... 3-9
Reservations ................................................................................................................ 3-9
Cemeteries ................................................................................................................... 3-9
Hospitals ...................................................................................................................... 3-9
Golf Courses ...............................................................................................................3-10
Airports ......................................................................................................................3-10
Colleges ......................................................................................................................3-10
Terminals ....................................................................................................................3-11
Port Elizabeth/Port Newark ........................................................................................3-11
CIRCULATION/TRANSPORTATION PLAN ................................................................... 4-1
Roadway System ......................................................................................................... 4-1
Interstates/Freeways .................................................................................................... 4-4
Principal Arterials ........................................................................................................ 4-5
Minor Arterials ............................................................................................................ 4-5
Collectors .................................................................................................................... 4-6
Local Roads ................................................................................................................. 4-6
New Jersey Highway Access Management Code .......................................................... 4-6
UNION COUNTY MASTER PLAN
ii
PASSENGER RAIL SERVICE ............................................................................................ 4-9
FREIGHT RAIL SERVICE ................................................................................................4-11
BUS SERVICE .....................................................................................................................4-12
AIRPORT SERVICE ...........................................................................................................4-14
WATERWAYS ....................................................................................................................4-17
Port Dredging .............................................................................................................4-18
ECONOMIC DEVELOPMENT PLAN ............................................................................... 5-1
Union County Employment - 1983 to 1993 .................................................................. 5-2
Economic and Labor Market Indicators ....................................................................... 5-6
Economic Developments and Future Economic Development Plans ............................5-13
Economic Outlook ......................................................................................................5-21
TABLES
TABLE 2-1 - POPULATION 1860-1995, UNION COUNTY ............................................... 2-2
TABLE 2-2 - POPULATION 1930-1994, UNION COUNTY MUNICIPALITIES ............... 2-3
TABLE 2-3 - POPULATION 1970 - 2000, REGIONAL COUNTIES
& NEW JERSEY ............................................................................................. 2-4
TABLE 2-4 - 1990 POPULATION BY RACE AND HISPANIC ORIGIN,
UNION COUNTY MUNICIPALITIES ........................................................... 2-7
TABLE 2-5 - POPULATION PROJECTIONS 2000- 2020, UNION COUNTY .................... 2-8
TABLE 2-6 - POPULATION PROJECTIONS BY AGE GROUP 1994- 2010,
UNION COUNTY ..........................................................................................2-11
TABLE 2-7 - 1970 - 1990 HOUSING UNIT TYPE, UNION COUNTY ..............................2-14
TABLE 2-8 - HOUSING UNIT STOCK, UNION COUNTY MUNICIPALITIES ...............2-16
TABLE 2-9 - NET RESIDENTIAL BUILDING PERMITS BY
MUNICIPALITY 1986 - 1996*UNION COUNTY MUNICIPALITY ............2-17
TABLE 2-10 -HOUSING UNITS 1970-1990, UNION COUNTY MUNICIPALITIES .........2-18
TABLE 2-11 -AGE OF HOUSING UNITS, UNION COUNTY ............................................2-19
TABLE 2-12 -EMPLOYMENT BY INDUSTRIAL GROUP, UNION COUNTY .................2-21
TABLE 2-13 -LABOR FORCE UNION COUNTY ...............................................................2-22
TABLE 2-14 -PUBLIC SCHOOL ENROLLMENT 1989 AND 1993, UNION COUNTY .....2-23
TABLE 2-15 –PROJECTIONS OF POPULATION BY SCHOOL AGE................................2-23
TABLE 3-1 - LAND USE PLAN & MUNICIPAL ZONING DISTRICTS ............................ 3-4
TABLE 3-2 - UNION COUNTY PARKS .............................................................................. 3-7
TABLES

UNION COUNTY MASTER PLAN
iii
(Continued)
TABLE 4-1 - ROADWAY SYSTEM CLASSIFICATION .................................................... 4-2
TABLE 4-2 - NEW JERSEY HIGHWAY ACCESS MANAGEMENT CODE,
UNION COUNTY ........................................................................................... 4-8
TABLE 4-3 - PASSENGER RAIL SERVICE, UNION COUNTY .......................................4-10
TABLE 4-4 - NEW JERSEY TRANSIT BUS SERVICE, UNION COUNTY ......................4-13
TABLE 5-1 - PRIVATE SECTOR COVERED JOBS, SELECTED YEARS 1980 - 1996
UNION COUNTY AND NEW JERSEY ......................................................... 5-3
TABLE 5-2 - UNION COUNTY POPULATION 1980-1990, BIRTHS, DEATHS,
MIGRATION .................................................................................................. 5-7
FIGURES
FIGURE 2-1- POPULATION 1860-1994, UNION COUNTY ............................................... 2-2
FIGURE 2-2 - POPULATION BY AGE COHORT - 1990-2010, UNION COUNTY ...........2-12
FIGURE 3-1- LAND USE PLAN ........................................................................................... 3-3
FIGURE 4-1 - ROADWAY SYSTEM MAP ........................................................................... 4-1
FIGURE 4-2 - FUNCTIONAL CLASSIFICATION MAP ....................................................... 4-3
FIGURE 4-3 - TRANSPORTATION PLAN ..........................................................................4-15

UNION COUNTY MASTER PLAN
1-1
INTRODUCTION
Phase I of the Union County Master Plan presents the Planning Board’s recommendations for the
future of Union County as it relates to population, land use, transportation and circulation, and
economic development. It represents the direction that the County should pursue to achieve the
optimum relationship between land uses, protection of the natural environment and development of
efficient transportation systems.
The statutory authority for the development of a County Master Plan is set forth in the New Jersey
County and Regional Planning Act N.J.S.A. 40:27-2 et seq. that states:
“The County Planning Board shall make and adopt a master plan for the physical
development of the County. The master plan of a County, with the accompanying maps,
plats, charts, and descriptive and explanatory matter, shall show the County Planning
Board’s recommendations for the development of the territory covered by the plan, and may
include, among other things, the general location, character, and extent of streets or roads,
viaducts, bridges, waterway and waterfront developments, parkways, playgrounds, forests,
reservations, parks, airports and other public ways, grounds, places and spaces; the general
location and extent of forests, agricultural areas, and open-development areas for purposes
of conservation, food and water supply, sanitary and drainage facilities, or the protection of
urban development, and such other features as may be important to the development of the
County.
The County Planning Board shall encourage the cooperation of the local municipalities
within the County in any matters whatsoever which may concern the integrity of the County
master plan and to advise the Board of Chosen Freeholders with respect to the formulation
of development programs and budgets for capital expenditures.”
UNION COUNTY MASTER PLAN
1-2
GOALS AND OBJECTIVES
The Union County Master Plan has a variety of planning goals and objectives designed to address
major issues and influences that impact Union County’s housing, land use, transportation/circulation
and economic development. The County goals and objectives recognize the interrelationships of
related policies of municipalities, regional agencies and the State regarding the future development of
Union County. The achievement of these goals and objectives will require decision making at many
levels of government, as well as private sector. The goals and objectives form the basis for the
creation and implementation of specific programs and actions designed to achieve the more
generalized goals and objectives.
Housing
Goal:
Promote the provision of a broad range of housing opportunities for all income levels and household
types by encouraging the maintenance or rehabilitation of the existing housing stock and through the
construction of new housing units.
Objectives:
Promote the continued construction of quality single family homes suitable for persons of all
of income levels.
Encourage municipalities to zone for a variety of housing types and densities.
Encourage the rehabilitation of substandard or vacant structures
Encourage the construction of multi-family apartment and townhouse units in either rental,
condominium or fee simple ownership for all age groups, household types and income levels.

UNION COUNTY MASTER PLAN
1-3
Encourage the expansion of existing public, non-profit and inclusionary low-income and
senior housing opportunities.
Encourage participation in programs designed to promote the maintenance and rehabilitation
of housing, including low interest loans, grants, tax incentives, Regional Contribution
Agreements.
Development
Goal:
To facilitate the development of Union County by directing new growth to environmentally suitable
areas that can be provided with essential infrastructure and support facilities and to revitalize the
urban centers and corridors within the County.
Objectives:
Identify land areas suitable for residential, commercial and industrial development sufficient to
accommodate reasonable projections of future needs.
Identify land areas that are environmentally sensitive including lands that have physiographic
characteristics including floodplains, freshwater and/or saline wetlands, steep slopes, rock
outcroppings and mature forests.
Promote new development and redevelopment that is consistent and compatible with existing
settlement patterns.
Promote the revitalization of urban centers and older suburban areas through industrial and
commercial adaptive reuse, economic development programs, environmental clean-up of
contaminated sites, upgrading of community infrastructure, and upgrading of transportation
and transit facilities.
UNION COUNTY MASTER PLAN
1-4
Promote the continued development and expansion of recreational facilities to meet the
recreational needs of existing and future residents and encourage the maintenance of open
space and the protection of sensitive environmental features.
Transportation/Circulation
Goal:
To promote the development of an improved and balanced, multi-modal transportation system that
integrates and links highway, bus, rail, air, waterborne transport systems and pedestrian and bicycle
facilities.
Objectives:
Continue the development and maintenance programs for an efficient County highway system
to service existing and future traffic needs.
Upgrade existing roads to higher design standards where applicable and feasible.
Support and implement transportation plans and programs that reduce negative impacts on
the environment such as requirements to reduce hydrocarbons, carbon monoxide and nitrogen
oxide emissions from automobiles.
Provide coordinated development of land use density/intensity and transportation systems that
will support and sustain regional transportation systems for rail and bus service.
Encourage the improvement of existing and construction of new rail stations, bus shelters and
parking support facilities.
Review and coordinate local bus routes and rail schedules to address potential ridership
demands and destination needs.

UNION COUNTY MASTER PLAN
1-5
Encourage public and private efforts to retain and rehabilitate the existing rail network and
encourage upgraded freight line services.
Promote transportation improvements that will encourage increased inter-modal passenger
and freight transportation movements especially those related to the Port Elizabeth/Port
Newark regional and international transportation facilities.
Support the expansion and improvement of facilities at Newark International Airport to meet
increased operational and safety requirements, passenger demands, and expansion of monorail
and light rail passenger links with other transportation services and regional urban centers.
Improve waterborne transportation by encouraging navigational surveys, the implementation
of regular maintenance dredging of state and federal waterways to their authorized width and
depth, maintenance of channel markers and other navigational aids through improvements to
the inlets and upgrading of port facilities and service.
Economic Development
Goal:
Continue County sponsored economic development efforts to reduce unemployment, provide year-
round employment opportunities and enhance the tax base by encouraging compatible industrial,
commercial, office and retail facilities to locate or expand in Union County.
Objectives:
Promote the development of industrial parks, marine terminal facilities and air terminal
facilities in the County.

UNION COUNTY MASTER PLAN
1-6
Encourage the expansion or location of industrial firms, office, research and development
firms in areas that are capable of being serviced by County and regional facilities and
infrastructure.
Maintain relationships with federal, state, regional and municipal officials involved with
economic development activities relative to Union County.
Conduct and/or provide assistance on feasibility and technical studies addressing economic
development issues associated with airports, marine terminal facilities, capital improvements,
natural resources and other related issues.
Promote the reclamation and redevelopment of brownfields within the County.

UNION COUNTY MASTER PLAN
2-1
DEMOGRAPHICS
The population of Union County has undergone dramatic changes in terms of the number of residents,
age characteristics, racial composition, employment characteristics and other characteristics since the
County was formed on March 19, 1857. While population growth continued for more than 100
years, Union County’s population peaked in 1970 and has been declining gradually since that time.
Demographic data tabulated every 10 years by the U.S. Bureau of the Census and by various agencies
in New Jersey provide statistical data on past trends and some insight into the future composition and
demographic characteristics of the residents of Union County. This section presents key demographic
information for Union County and its municipalities. Historic population changes, the number and
characteristics of existing residents, housing data, employment and labor force data and school district
enrollment data are reviewed. Projections of the future population of the County and its
municipalities at five year increments from 1990 through the year 2020 are provided to assist decision
making for the next 20 years.
The Union County Department of Economic Development, Division of Policy and Planning maintains
a County Data Book. The Data Book contains additional information, statistics and Census
information on Land Use, Demography, Housing, Income, Employment, Transportation, Tax
Information and Education. The Data Book and its revisions can be used as a supplement to this
section of the Master Plan for demographic statistical data for Union County and its 21 municipalities.
Population
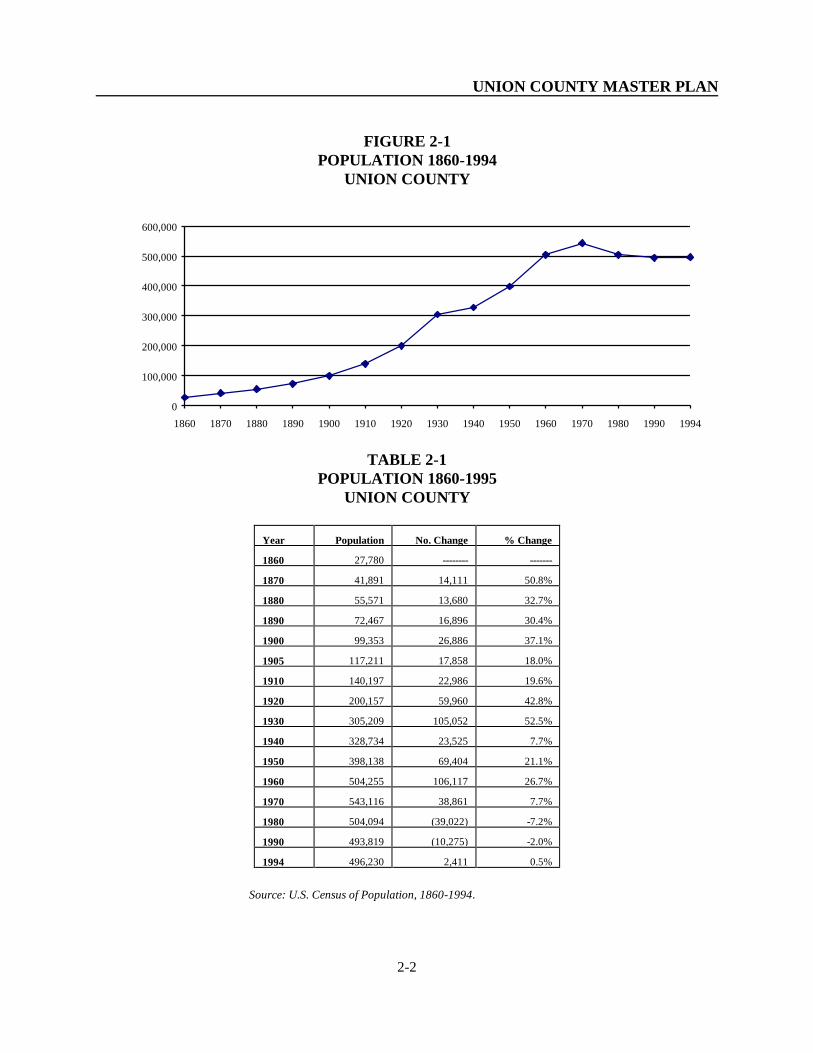
The population of Union County increased steadily from its formation in 1857 through 1970. Since
1970 the population of Union County and 18 of its 21 municipalities has experienced moderate
declines. Between 1970 and 1980 the County population decreased 7.2 percent from 543,116 to
504,094 with a further decrease of 2.0 percent to 493,819 by 1990. However, the population showed
a slight increase of 0.5 percent to 496,230 as of the 1994 Census estimate.
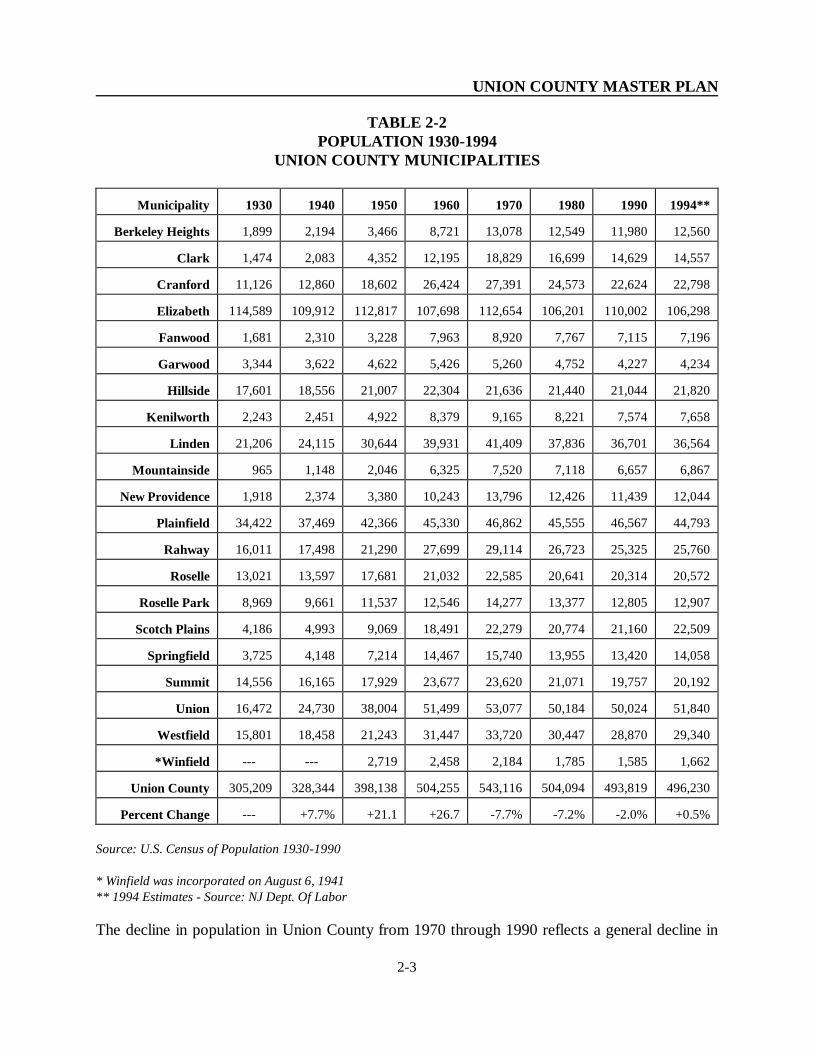
Figure 2-1 and Table 2-1 presents the rate of population growth in Union County between 1860 and
1994. Table 2-2 presents the population for Union Counties municipalities between 1930 and 1994.
UNION COUNTY MASTER PLAN
2-2
FIGURE 2-1
POPULATION 1860-1994
UNION COUNTY
TABLE 2-1
POPULATION 1860-1995
UNION COUNTY
Year
Population
No. Change
% Change
1860
27,780
--------
-------
1870
41,891
14,111
50.8%
1880
55,571
13,680
32.7%
1890
72,467
16,896
30.4%
1900
99,353
26,886
37.1%
1905
117,211
17,858
18.0%
1910
140,197
22,986
19.6%
1920
200,157
59,960
42.8%
1930
305,209
105,052
52.5%
1940
328,734
23,525
7.7%
1950
398,138
69,404
21.1%
1960
504,255
106,117
26.7%
1970
543,116
38,861
7.7%
1980
504,094
(39,022)
-7.2%
1990
493,819
(10,275)
-2.0%
1994
496,230
2,411
0.5%
Source: U.S. Census of Population, 1860-1994.
0
100,000
200,000
300,000
400,000
500,000
600,000
1860 1870 1880 1890 1900 1910 1920 1930 1940 1950 1960 1970 1980 1990 1994
UNION COUNTY MASTER PLAN
2-3
TABLE 2-2
POPULATION 1930-1994
UNION COUNTY MUNICIPALITIES
Municipality
1930
1940
1950
1960
1970
1980
1990 1994**
Berkeley Heights
1,899
2,194
3,466
8,721
13,078
12,549
11,980
12,560
Clark
1,474
2,083
4,352
12,195
18,829
16,699
14,629
14,557
Cranford
11,126
12,860
18,602
26,424
27,391
24,573
22,624
22,798
Elizabeth
114,589
109,912
112,817
107,698
112,654
106,201
110,002
106,298
Fanwood
1,681
2,310
3,228
7,963
8,920
7,767
7,115
7,196
Garwood
3,344
3,622
4,622
5,426
5,260
4,752
4,227
4,234
Hillside
17,601
18,556
21,007
22,304
21,636
21,440
21,044
21,820
Kenilworth
2,243
2,451
4,922
8,379
9,165
8,221
7,574
7,658
Linden
21,206
24,115
30,644
39,931
41,409
37,836
36,701
36,564
Mountainside
965
1,148
2,046
6,325
7,520
7,118
6,657
6,867
New Providence
1,918
2,374
3,380
10,243
13,796
12,426
11,439
12,044
Plainfield
34,422
37,469
42,366
45,330
46,862
45,555
46,567
44,793
Rahway
16,011
17,498
21,290
27,699
29,114
26,723
25,325
25,760
Roselle
13,021
13,597
17,681
21,032
22,585
20,641
20,314
20,572
Roselle Park
8,969
9,661
11,537
12,546
14,277
13,377
12,805
12,907
Scotch Plains
4,186
4,993
9,069
18,491
22,279
20,774
21,160
22,509
Springfield
3,725
4,148
7,214
14,467
15,740
13,955
13,420
14,058
Summit
14,556
16,165
17,929
23,677
23,620
21,071
19,757
20,192
Union
16,472
24,730
38,004
51,499
53,077
50,184
50,024
51,840
Westfield
15,801
18,458
21,243
31,447
33,720
30,447
28,870
29,340
*Winfield
---
---
2,719
2,458
2,184
1,785
1,585
1,662
Union County
305,209
328,344
398,138
504,255
543,116
504,094
493,819
496,230
Percent Change
---
+7.7%
+21.1
+26.7
-7.7%
-7.2%
-2.0%
+0.5%
Source: U.S. Census of Population 1930-1990
* Winfield was incorporated on August 6, 1941
** 1994 Estimates - Source: NJ Dept. Of Labor
The decline in population in Union County from 1970 through 1990 reflects a general decline in

UNION COUNTY MASTER PLAN
2-4
population in northeastern New Jersey. Bergen, Essex, Passaic and Union Counties reached their
peak population in 1970 while Hudson has had a declining population since its peak in 1930. During
a period when the State of New Jersey experienced an 7.8 percent increase in population from
7,168,164 to 7,730,188 between 1970 and 1990, Bergen County experienced a decrease of 8.1
percent, Essex County a decrease of 16.3 percent, Hudson County a decrease of 9.2 percent, Passaic
a decrease of 1.7 percent and Union County a decrease of 9.1 percent.
The regional population is expected to increase slightly by the year 2000 (0.4 percent). Essex County
is the only county expected by to decline in population. In comparison, the State is expected to
increase by 5.2 percent between 1990 and 2000 (See Table 2-3).
TABLE 2-3
POPULATION 1970 - 2000
REGIONAL COUNTIES & NEW JERSEY
Location
1970
1980
1990
Percent
Change
1970-1990
Population
Projection
2000
Percent
Change
1990-2000
Bergen County
898,012
845,385
825,380
-8.1%
856,100
3.7%
Essex County
929,986
851,304
778,206
-16.3%
756,100
-2.8%
Hudson County
609,266
556,972
553,099
-9.2%
555,400
0.4%
Passaic County
460,782
447,585
453,060
-1.7%
453,302
0.1%
Union County
543,116
504,094
493,819
-9.1%
495,600
0.4%
Regional Total
3,441,162
3,205,340
3,103,564
-9.8%
3,116,502
0.4%
New Jersey
7,168,164
7,365,011
7,730,188
7.8%
8,135,000
5.2%
Sources: U. S. Census of Population, 1970-1990.
New Jersey Department of Labor Projections 2/97 for 2000 projection.
The decline in population in Union County and northeastern New Jersey occurs in part from the
UNION COUNTY MASTER PLAN
2-5
migration from the State and an out-migration from the County and region to southern and western
portions of the State. Part of the “decline” in population can be also be attributed to demographic
change which has occurred in the older, more developed portions of New Jersey since 1960 namely
the aging of the resident population and the associated decline in the number of persons per
household. Even though the population declined 2.0 percent from 1980 to 1990 the number of
housing units and households increased by 2.3 percent. This caused the number of persons per
household to decrease from 2.8 in 1980 to 2.7 in 1990.
The declining population in Union County and northeastern New Jersey since 1970 is not isolated to
New Jersey; the Northeast United States region experienced the lowest population gain in the nation
numerically and also the lowest rate of increase since 1970. New Jersey experienced its lowest rate in
population increase (2.7 percent) from 1970 to 1980 compared to any decade since the first Census in
1790.
Demographic Characteristics
Demographic characteristics which are of major significance in defining the Union County population
include the age/sex distribution, race and cultural origin. These are described below.
Census data provides statistical data by age group within the County. The 0 to 9 age category
included 62,737 persons in 1990. The 10-19 age group included 58,728 persons; the 20 to 29 age
group included 77,565 persons; and the 30 to 39 age group included 81,276 persons. The population
in the older age groups included 64,465 in the 40 to 49 age group, 49,645 in the 50 to 59 age group,
50,342 in the 60 to 69 age group, 33,778 in the 70 to 79 age group and 15,283 persons in the 80+
age group. Similar to other counties, 48.0 percent of the Union County population is male and 52.0
percent is female. This distribution is similar in the municipalities of the County.
UNION COUNTY MASTER PLAN
2-6
Table 2-4 presents the population by race and Hispanic origin for each of the municipalities. In terms
of racial characteristics, Union County is predominately white. In the 1990 Census, 367,247 persons
or 74.4 percent of the County population was recorded as white. Of the minority population, black
residents represented the largest group comprising 92,994 persons or 18.8 percent of the total
population. Asian and Pacific Islanders represent 2.8 percent of the population or 13,619 persons.
The Census reported 700 American Indians/Eskimos or Aleuts in Union County or 0.1 percent of the
total population. The remaining 3.9 percent of the population represented other minority categories.
Of the total population, 66,885 or 13.5 percent of the County population was of “Hispanic origin.”
“Hispanic origin” residents include white and black residents who are or are descendents from
persons of Latin American, Caribbean and other Hispanic speaking countries. A majority of the
County’s 43,050 Hispanic residents (64.4 percent), lived in the City of Elizabeth in 1990.
Population Projections
This section presents population projections for Union County. Several population projection
models are presented along with projections prepared by the New Jersey Department of Labor for the
years 2000, 2010 and 2020. While population projection models can produce a broad range of
results, it is expected that the County population will decline from 493,819 in 1990 to approximately
490,000 in 2020 based on analysis of existing demographic data and trends. A “projection” is defined
“as the measurement of a future condition that would exist if the assumptions and procedures of the
method prove to be empirically valid in the future.” Projections are based on one or more
assumptions including a continuation of past conditions, present conditions, or trended changes in
historical conditions. Projections can also be based on entirely new transition rates.

UNION COUNTY MASTER PLAN
2-7
TABLE 2-4
1990 POPULATION BY RACE AND HISPANIC ORIGIN
UNION COUNTY MUNICIPALITIES
Municipality
Total
Population
White
Black
Am. Indian/
Eskimo &
Aleut
Asian &
Pacific
Islander
Other
Hispanic
Origin*
Berkeley Heights
11,980
10,995
164
2
779
40
225
Clark
14,629
14,316
15
6
240
52
428
Cranford
22,633
21,558
689
7
331
48
543
Elizabeth
110,002
72,098
21,833
297
3,002
12,772
43,050
Fanwood
7,115
6,413
372
2
297
31
157
Garwood
4,227
4,160
11
1
30
25
114
Hillside
21,044
11,157
8,578
30
812
467
2,807
Kenilworth
7,574
7,238
188
7
90
51
394
Linden
36,701
28,173
7,344
49
552
583
2,700
Mountainside
6,657
6,434
45
3
164
11
126
New Providence
11,439
10,773
62
5
560
39
309
Plainfield
46,567
12,338
30,573
252
493
2,911
6,996
Rahway
25,325
19,092
5,119
38
606
470
1,912
Roselle
20,314
11,461
7,726
39
534
554
2,323
Roselle Park
12,805
11,797
137
6
679
186
935
Scotch Plains
21,160
17,729
2,349
37
968
77
598
Springfield
13,420
12,625
463
6
286
40
277
Summit
19,757
17,815
1,118
16
607
201
1,044
Union
50,024
43,277
4,694
57
1,675
321
2,239
Westfield
28,870
26,408
1,323
20
1,019
100
589
Winfield
1,576
1,559
4
0
0
11
31
Union County Total
493,819
367,416
92,807
880
13,726
18,990
67,797
* Hispanic Origin residents are included in White, Black and Other categories.
Source: U.S. Census of Population 1990.

UNION COUNTY MASTER PLAN
2-8
In order to develop reasonable population projections for Union County, a variety of population
projection models were evaluated including cohort survival, linear, geometric, parabolic, modified
exponential, Gompertz and logistic models. Several calculations for each model were produced using
different starting point years to assess the applicability and functionality of the models. It should be
noted as indicated in the above definition of a projection that an infinite number of projections can be
calculated by using different models with different starting years and other variables. Therefore, in
preparing meaningful population projections for the County, other factors about the County must be
considered to limit the number of possible outcomes that the models can produce. Such factors
include the lack of vacant land available for construction, decreases in household size, the
composition of age groups, birth and death rates out-migration of residents, and the annual number of
residential building permits. Although projections are based on past demographic trends they are not a
forecast and are not intended to be official. They are for reference purposes only. Dramatic changes
or disruptions in the economic and demographic conditions in the future can impact and could
invalidate the projections. Presented in Table 2-5 are population projections for Union County using
the most common projection models. As can be seen the results of these models produce projected
populations for the year 2020 ranging from 635,476 to 415,082.
TABLE 2 -5
POPULATION PROJECTIONS 2000- 2020
UNION COUNTY
Projection Models
Actual
1990
Estimated
1994
Projected
2000 2010 2020 Modified Exponential
493,819
496,230
491,113
490,401
490,213
Gompertz
493,819
496,230
491,018
490,247
490,035
Logistic
493,819
496,230
490,921
490,088
489,848
Cohort Survival
493,819
496,230
483,128
464,381
427,957
Parabolic
493,819
496,230
512,291
559,510
635,476
Linear
493,819
496,230
464,379
439,731
415,082
Geometric
493,819
496,230
466,658
444,976
424,301
Sources: US Census Data for years 1960 through 1990 used for base data. Models used are in “Spreadsheet
Models for Urban Analysis”; Klosterman, Brail and Bossard. 1993.
The Modified Exponential, Gompertz and Logistic Models assume that growth will move toward, or

UNION COUNTY MASTER PLAN
2-9
from, an asymptotic upper or lower growth limit. The projections take the form of an S-shaped curve
in which growth begins slowly, increases rapidly for a while then slows as it approaches a fixed upper
growth limit. These models produced nearly identical projections to the year 2020, and as will be
shown below, produced results similar to those of the New Jersey Department of Labor. These
projections appear to be the most reasonable of the models reviewed in light of the fact that the
population growth in Union County is following an S-curve in which there was rapid growth after the
1940's through the 1970's but has begun to reach the upper limit of growth in the 80's and 90's due to
the unavailability of vacant land, high out-migration, a decrease in the household size and a slowing
economy.
The Cohort Survival Model projections uses the age cohorts of males and females, fertility, and net-
migration levels as the basis for projections. The cohort component technique is one of the oldest and
most widely used procedures for projecting populations. It projects a decreasing County population
through the year 2020 and produced population estimates approximately 15 percent lower than the
modified exponential, Gompertz and Logistic models. The cohort model should be considered a valid
model. This model appears to produce reasonable projections for the County.
The parabolic, linear, and geometric models were also reviewed. The Parabolic Model is a model that
assumes growth increases or decreases by a constant amount in the future. This model produced
extremely high projections for the County, especially for the year 2020. The Linear Model assumes
that the dependant variable (population) will always increase or decrease by equal amounts for equal
time periods. The linear model produced a very low population projection. This is due to the fact the
population decreased, the 80's and 90's and this decease was continued into the future. The geometric
curve assumes that growth will correspond to a constant growth rate or decline. The geometric
produced results similar to the linear model. The parabolic, linear and geometric do not appear to be
as reasonable as the other models reviewed.
UNION COUNTY MASTER PLAN
2-10
Population projections have also been prepared by the New Jersey Department of Labor by age group
categories for 2000, 2005, and 2010. Estimates have been prepared for 1994. Based on population
estimates, the Union County population increased slightly between the 1990 Census and 1994 from
493,819 persons to 496,230 persons, however, the County population is expected to continue the
post-1970 decline through the year 2010. The projected population is expected to be 490,400
persons in 2010. This is comparable to several of the mid-level projections which were calculated.
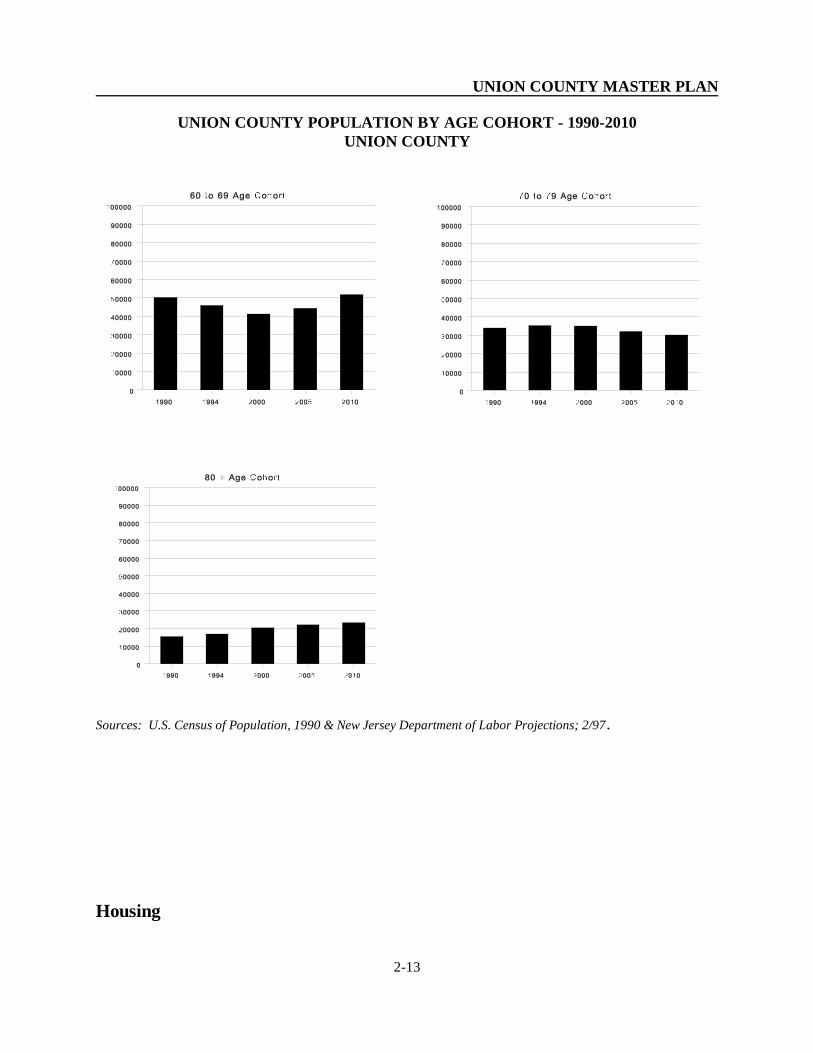
The projections of population by age category show a variety of changes. The 0 to 9 and the 30 to 39
age categories are expected to have a rapid decrease in population from 1994 through 2010. The 10-
19 and 40-49 age categories are expected to increase to 2005 then decline between 2005 and 2010.
The 20-29 age category is expected in decrease to 2005 then increase between 2005 and 2010. The
50 to 59 age category shows the largest increase in population between 1994 and 2010. The 80+
age category is also expected to increase to the year 2010. The 60 to 69 age group is expected to
increase after the year 2000 and then rapidly increase to the year 2010. The 70 to 79 age category is
expected to decline between 1994 and 2010. Table 2-6 presents these estimates for Union County and
Figure 2-2 shows these estimates graphically.

UNION COUNTY MASTER PLAN
2-11
TABLE 2 - 6
POPULATION PROJECTIONS BY AGE GROUP 1994- 2010
UNION COUNTY
Population Projections
Age
1990 Census
1994
2000
2005
2010
0 to 9
62,737
66,801
66,100
61,100
55,900
10 to 19
58,728
58,141
62,000
65,000
64,200
20 to 29
77,565
65,905
57,000
57,200
61,100
30 to 39
81,276
85,338
76,100
63,200
57,300
40 to 49
64,465
69,749
76,900
79,900
72,300
50 to 59
49,645
52,012
60,500
68,100
74,100
60 to 69
50,342
45,966
41,400
44,400
51,900
70 to 79
33,778
35,288
35,100
32,100
30,200
80 +
15,283
17,030
20,500
22,200
23,400
Total
493,819
496,230
495,600
493,200
490,400
Source: Projections by Age Group by County: New Jersey 1994 - 2010;
N. J. Department of Labor 2/97
FIGURE 2-2

UNION COUNTY MASTER PLAN
2-12
POPULATION BY AGE COHORT - 1990-2010
UNION COUNTY
FIGURE 2-2 (continued)
UNION COUNTY MASTER PLAN
2-13
UNION COUNTY POPULATION BY AGE COHORT - 1990-2010
UNION COUNTY
Sources: U.S. Census of Population, 1990 & New Jersey Department of Labor Projections; 2/97.
Housing

UNION COUNTY MASTER PLAN
2-14
The Union County population decline did not result in a decline in the total number of housing units
between 1970 and 1990. Since 1970 there has been a net increase of 12,705 housing units in Union
County for a total of 187,033 housing units in 1990. Of this total 106,325 units were in single
attached and detached structures; 28,701 units were in two unit structures; 15,538 units were in 3 to
4 unit structures; 15,930 units were in 5 to 19 unit structures and 17,832 were in structures having
20 or more units. Mobile homes or trailers accounted for 167 units and 2,540 were listed as “other”
units (See Table 2-7).
TABLE 2-7
1970 - 1990 HOUSING UNIT TYPE
UNION COUNTY
1970-1990 Change
Unit Type 1970 1990 Number Percent
Single Attached/Detached
99,595
106,325
6,730
6.8%
2 Units
30,893
28,701
(2,192)
-7.1%
3 & 4 Units
14,294
15,538
1,244
8.7%
5 to 19 Units
13,145
15,930
2,785
21.2%
20 Units or Greater
16,234
17,832
1,598
9.8%
Mobile Homes or Trailers
167
167
0
0.0%
Other
N/A
2,540
2,540
N/A
Total
174,328
187,033
12,705
7.3%
Source: U.S. Census 1970 & 1990.
Generally, year-round units in Union County are owner-occupied, which is consistent with the
single-family unit. In 1990, of the total occupied units 112,508 units were owner occupied units,
67,568 were renter occupied units and 6,957 units were vacant housing units. In some municipalities
the number of renter occupied units exceeds the number of owner occupied units. This occurs in the
City of Elizabeth where there are 26,706 renter occupied units and 12,395 owner-occupied units. In
Plainfield there are 8,341 renter-occupied units and 7,722 owner-occupied units (See Table 2-8,
Housing Unit Stock).
UNION COUNTY MASTER PLAN
2-15
In 1990 the Median Value of Housing Units in Union County was $179,800. The highest median
value of owner-occupied units in the County is in Summit at $316,600. The lowest median value is
in Hillside at $138,500. Winfield’s median value of owner-occupied units is $14,999. Winfield has
only 612 owner-occupied units.
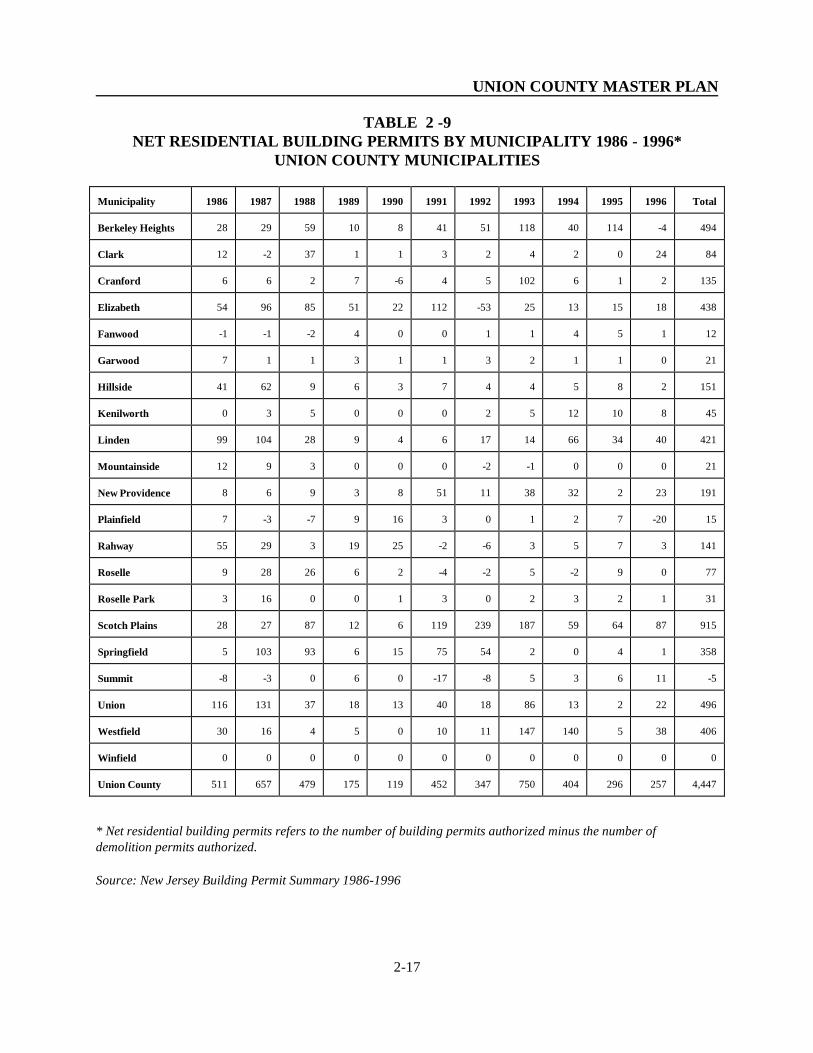
Table 2-9 shows the number of net residential permits constructed by municipality between 1986 and
1996 as compiled by the New Jersey Department of Labor in the Building Permit Survey (net
residential building permits is the number of permits issued minus the number of demolitions). The
largest increase of net permits during this time period occurred in Scotch Plains (915), Union
Township (496), Berkeley Heights (494), Elizabeth (438) and Linden (421). Several municipalities
had little or no increase in their residential units during this period. These municipalities included
Summit (5 units), Winfield (unchanged), Fanwood (12), Plainfield (15) Mountainside and Garwood
(21). Between 1986 and 1996 there has been a net increase of 4,447 units in Union County.
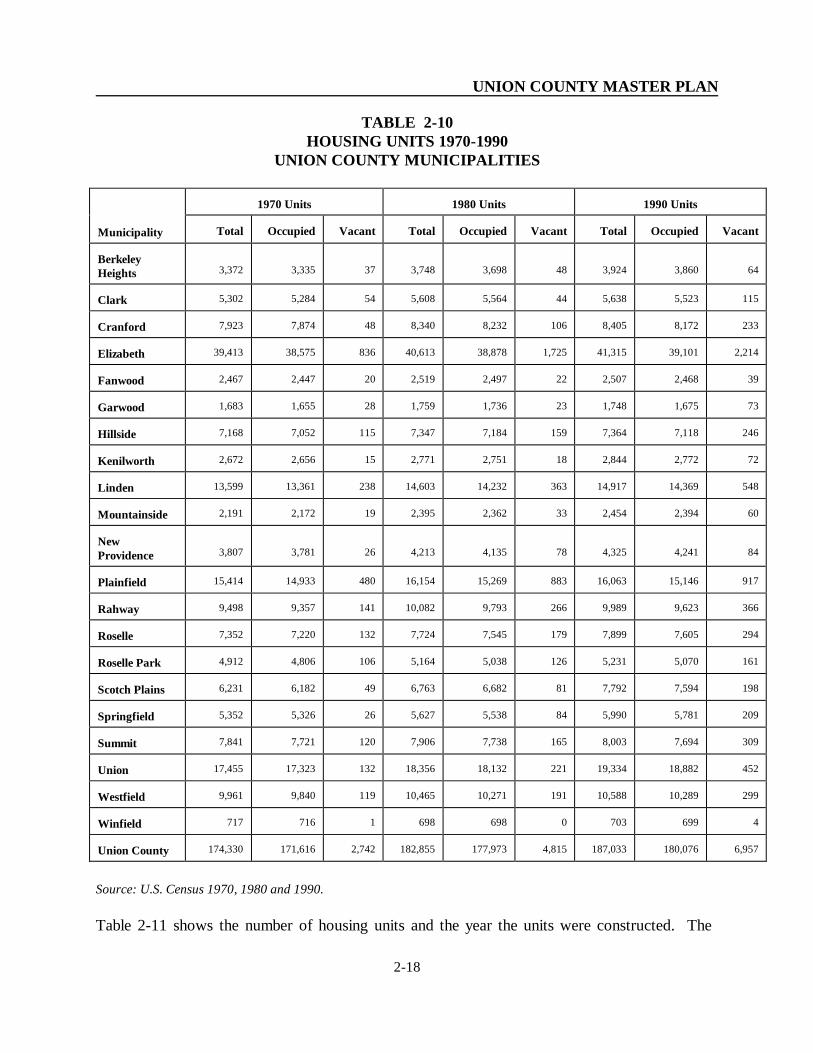
Table 2-10 shows the total number of units, and vacant units by municipality for the years 1970,
1980 and 1990. The vacancy rate has climbed from 1.6 percent in 1970 to 3.7 percent in 1990. This
is due to the decrease in total population and an increase in the number of housing units.

UNION COUNTY MASTER PLAN
2-16
TABLE 2 - 8
HOUSING UNIT STOCK
UNION COUNTY MUNICIPALITIES
1990 YEAR-ROUND HOUSING UNITS
Municipality
1980
Census
1990
Census
Percent
Change
1980-1990
Owner
Occupied
Renter
Occupied
Vacant
Median Value of Owner
Occupied Units
Berkeley Heights
3,748
3,924
4.7%
3,513
347
64
$262,800
Clark
5,608
5,638
0.5%
4,488
1,035
115
$197,300
Cranford
8,340
8,405
0.8%
6,695
1,477
233
$200,300
Elizabeth
40,613
41,315
1.7%
12,395
26,706
2,214
$145,000
Fanwood
2,519
2,507
-0.5%
2,300
168
39
$191,300
Garwood
1,759
1,748
-0.6%
1,088
587
73
$166,900
Hillside
7,347
7,364
0.2%
5,288
1,830
246
$138,500
Kenilworth
2,771
2,844
2.6%
2,215
557
72
$167,300
Linden
14,603
14,917
2.2%
8,797
5,572
548
$151,300
Mountainside
2,395
2,454
2.5%
2,302
92
60
$285,900
New Providence
4,213
4,325
2.7%
3,203
1,038
84
$246,100
Plainfield
16,154
16,063
-0.6%
7,722
8,341
917
$140,400
Rahway
10,082
9,989
-0.9%
6,324
3,299
366
$150,700
Roselle
7,724
7,899
2.3%
4,718
2,887
294
$139,500
Roselle Park
5,164
5,231
1.3%
2,990
2,080
161
$159,800
Scotch Plains
6,763
7,792
15.2%
6,185
1,409
198
$208,600
Springfield
5,627
5,990
6.5%
4,093
1,688
209
$216,300
Summit
7,906
8,003
1.2%
5,214
2,480
309
$316,600
Union
18,356
19,334
5.3%
14,530
4,352
452
$175,300
Westfield
10,465
10,588
1.2%
8,363
1,926
299
$256,600
Winfield
698
703
0.7%
612
87
4
$14,999
Union County
182,835
187,033
2.3%
112,508
67,568
6,957
$179,800
Source: U.S. Census of Population 1980 and 1990.
UNION COUNTY MASTER PLAN
2-17
TABLE 2 -9
NET RESIDENTIAL BUILDING PERMITS BY MUNICIPALITY 1986 - 1996*
UNION COUNTY MUNICIPALITIES Municipality
1986
1987
1988
1989
1990
1991
1992
1993
1994
1995
1996
Total
Berkeley Heights
28
29
59
10
8
41
51
118
40
114
-4
494
Clark
12
-2
37
1
1
3
2
4
2
0
24
84
Cranford
6
6
2
7
-6
4
5
102
6
1
2
135
Elizabeth
54
96
85
51
22
112
-53
25
13
15
18
438
Fanwood
-1
-1
-2
4
0
0
1
1
4
5
1
12
Garwood
7
1
1
3
1
1
3
2
1
1
0
21
Hillside
41
62
9
6
3
7
4
4
5
8
2
151
Kenilworth
0
3
5
0
0
0
2
5
12
10
8
45
Linden
99
104
28
9
4
6
17
14
66
34
40
421
Mountainside
12
9
3
0
0
0
-2
-1
0
0
0
21
New Providence
8
6
9
3
8
51
11
38
32
2
23
191
Plainfield
7
-3
-7
9
16
3
0
1
2
7
-20
15
Rahway
55
29
3
19
25
-2
-6
3
5
7
3
141
Roselle
9
28
26
6
2
-4
-2
5
-2
9
0
77
Roselle Park
3
16
0
0
1
3
0
2
3
2
1
31
Scotch Plains
28
27
87
12
6
119
239
187
59
64
87
915
Springfield
5
103
93
6
15
75
54
2
0
4
1
358
Summit
-8
-3
0
6
0
-17
-8
5
3
6
11
-5
Union
116
131
37
18
13
40
18
86
13
2
22
496
Westfield
30
16
4
5
0
10
11
147
140
5
38
406
Winfield
0
0
0
0
0
0
0
0
0
0
0
0
Union County
511
657
479
175
119
452
347
750
404
296
257
4,447
* Net residential building permits refers to the number of building permits authorized minus the number of
demolition permits authorized.
Source: New Jersey Building Permit Summary 1986-1996
UNION COUNTY MASTER PLAN
2-18
TABLE 2-10
HOUSING UNITS 1970-1990
UNION COUNTY MUNICIPALITIES
Municipality
1970 Units
1980 Units
1990 Units
Total
Occupied
Vacant
Total
Occupied
Vacant
Total
Occupied
Vacant
Berkeley
Heights
3,372
3,335
37
3,748
3,698
48
3,924
3,860
64 Clark
5,302
5,284
54
5,608
5,564
44
5,638
5,523
115
Cranford
7,923
7,874
48
8,340
8,232
106
8,405
8,172
233
Elizabeth
39,413
38,575
836
40,613
38,878
1,725
41,315
39,101
2,214
Fanwood
2,467
2,447
20
2,519
2,497
22
2,507
2,468
39
Garwood
1,683
1,655
28
1,759
1,736
23
1,748
1,675
73
Hillside
7,168
7,052
115
7,347
7,184
159
7,364
7,118
246
Kenilworth
2,672
2,656
15
2,771
2,751
18
2,844
2,772
72
Linden
13,599
13,361
238
14,603
14,232
363
14,917
14,369
548
Mountainside
2,191
2,172
19
2,395
2,362
33
2,454
2,394
60
New
Providence
3,807
3,781
26
4,213
4,135
78
4,325
4,241
84 Plainfield
15,414
14,933
480
16,154
15,269
883
16,063
15,146
917
Rahway
9,498
9,357
141
10,082
9,793
266
9,989
9,623
366
Roselle
7,352
7,220
132
7,724
7,545
179
7,899
7,605
294
Roselle Park
4,912
4,806
106
5,164
5,038
126
5,231
5,070
161
Scotch Plains
6,231
6,182
49
6,763
6,682
81
7,792
7,594
198
Springfield
5,352
5,326
26
5,627
5,538
84
5,990
5,781
209
Summit
7,841
7,721
120
7,906
7,738
165
8,003
7,694
309
Union
17,455
17,323
132
18,356
18,132
221
19,334
18,882
452
Westfield
9,961
9,840
119
10,465
10,271
191
10,588
10,289
299
Winfield
717
716
1
698
698
0
703
699
4
Union County
174,330
171,616
2,742
182,855
177,973
4,815
187,033
180,076
6,957
Source: U.S. Census 1970, 1980 and 1990.
Table 2-11 shows the number of housing units and the year the units were constructed. The

UNION COUNTY MASTER PLAN
2-19
relatively old age of the housing in Union County is reflected by the fact that 30.3 percent of the
187,033 housing units in the County is more than 50 years old (1939 or earlier) and that 72.1 percent
of all housing units was built prior to 1960. 47.6 percent of the County housing stock was
constructed before 1950 and 5.1 percent of the housing stock was constructed between 1980 and
March 1990.
TABLE 2 -11
AGE OF HOUSING UNITS
UNION COUNTY
Year Structure Built
Number of Units
Percent
1989 to March 1990
1,091
0.6%
1985 to 1988
4,500
2.4%
1980 to 1984
3,888
2.1%
1970 to 1979
13,478
7.2%
1960 to 1969
29,124
15.6%
1950 to 1959
45,804
24.5%
1940 to 1949
32,424
17.3%
1939 or Earlier
56,724
30.3%
Total
187,033
100.0%
Source: U.S. Census 1990
Employment/Labor Force
UNION COUNTY MASTER PLAN
2-20
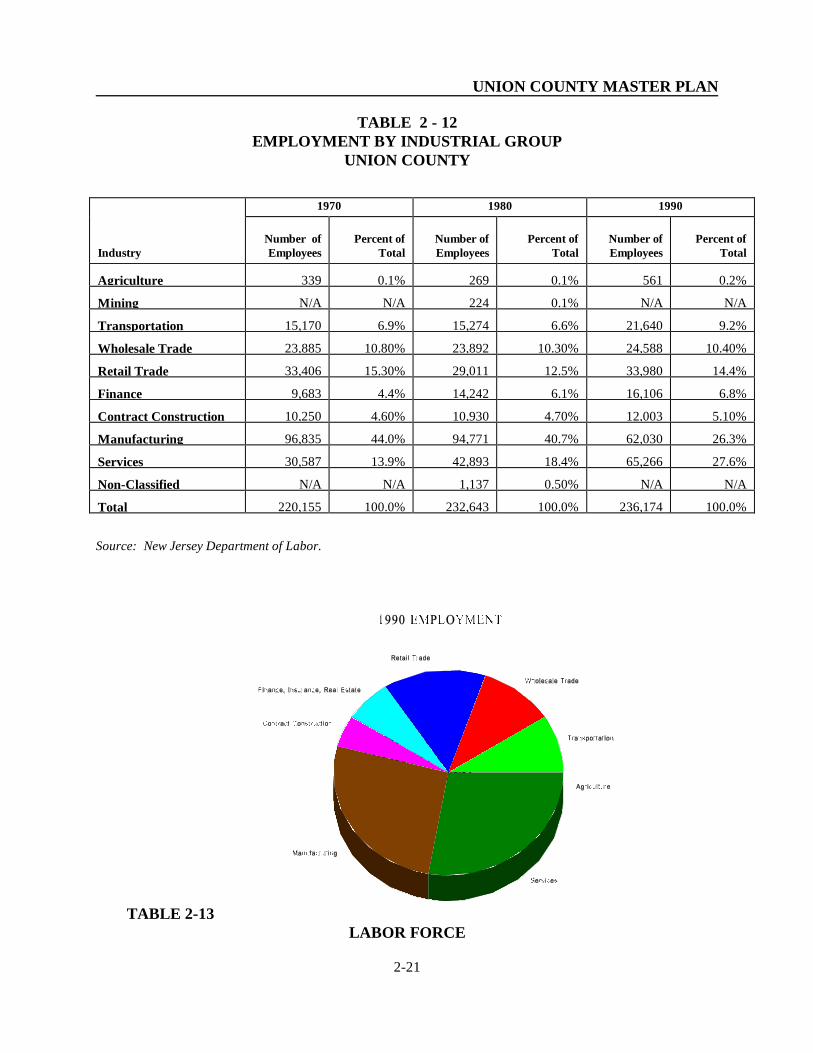
Although the total population of Union County declined between 1970 and 1990, the number of
employees in the County increased 7.3 percent during the same time period. In 1970 a total of
220,155 persons were employed. The largest industrial group at that time was manufacturing with
44 percent of the workforce employed in manufacturing; 15 percent employed in retail trade; 14
percent in services and 11 percent in wholesale trade. The composition of the workforce remained
nearly the same in 1980 and 1990 with the exception of the manufacturing and services groups (see
Table 2-12). Manufacturing, which dominated the percentage of workforce in 1970, declined from
44 percent in 1970 to 26 percent in 1990. During this same time period the services employment
group increased from 14 percent to nearly 28 percent.
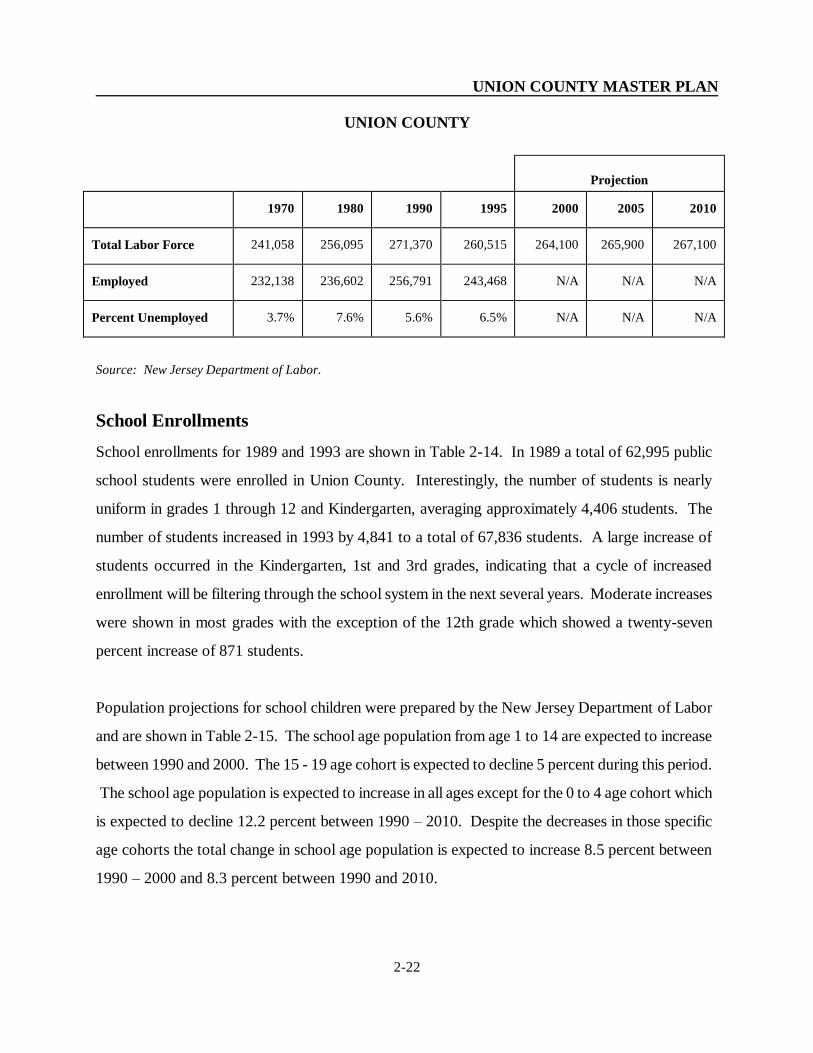
The long term trend in total labor force has been a slight increase each decade since 1970. In 1970
the total labor force was 241,058 persons with 232,138 persons employed. In 1980 the total labor
force increased to 256,095 persons with 236,602 persons employed. In 1990 it increased to 267,200
persons and 251,900 persons employed. The short term trend shows increases and decreases in
labor force and employment between these time periods. The New Jersey Department of Labor
projections indicate continued increases in the total labor force to 2010. Table 2-13, Labor Force in
Union County, shows the labor force in 1970, 1980 and 1990 with projections for 2000 and 2010.
The percent of unemployment is also shown in this table. The unemployment rate varies from
decade to decade.
Despite the expanding economy over the past 20 years there are still many more workers in the
County’s labor force than there are local employment opportunities, requiring many residents to
commute to jobs outside the County and the state. It is estimated that 40.5 percent of the workers
16 years and older worked outside Union County and 7.8 percent worked outside New Jersey in
1989.
UNION COUNTY MASTER PLAN
2-21
TABLE 2 - 12
EMPLOYMENT BY INDUSTRIAL GROUP
UNION COUNTY
Industry
1970 1980 1990
Number of
Employees
Percent of
Total
Number of
Employees
Percent of
Total
Number of
Employees
Percent of
Total Agriculture
339
0.1%
269
0.1%
561
0.2%
Mining
N/A
N/A
224
0.1%
N/A
N/A
Transportation
15,170
6.9%
15,274
6.6%
21,640
9.2%
Wholesale Trade
23,885
10.80%
23,892
10.30%
24,588
10.40%
Retail Trade
33,406
15.30%
29,011
12.5%
33,980
14.4%
Finance
9,683
4.4%
14,242
6.1%
16,106
6.8%
Contract Construction
10,250
4.60%
10,930
4.70%
12,003
5.10%
Manufacturing
96,835
44.0%
94,771
40.7%
62,030
26.3%
Services
30,587
13.9%
42,893
18.4%
65,266
27.6%
Non-Classified
N/A
N/A
1,137
0.50%
N/A
N/A
Total
220,155
100.0%
232,643
100.0%
236,174
100.0%
Source: New Jersey Department of Labor.
TABLE 2-13
LABOR FORCE
UNION COUNTY
TABLE 2-13
LABOR FORCE
UNION COUNTY MASTER PLAN
2-22
UNION COUNTY
Projection
1970
1980
1990
1995
2000
2005
2010
Total Labor Force
241,058
256,095
271,370
260,515
264,100
265,900
267,100
Employed
232,138
236,602
256,791
243,468
N/A
N/A
N/A
Percent Unemployed
3.7%
7.6%
5.6%
6.5%
N/A
N/A
N/A
Source: New Jersey Department of Labor.
School Enrollments
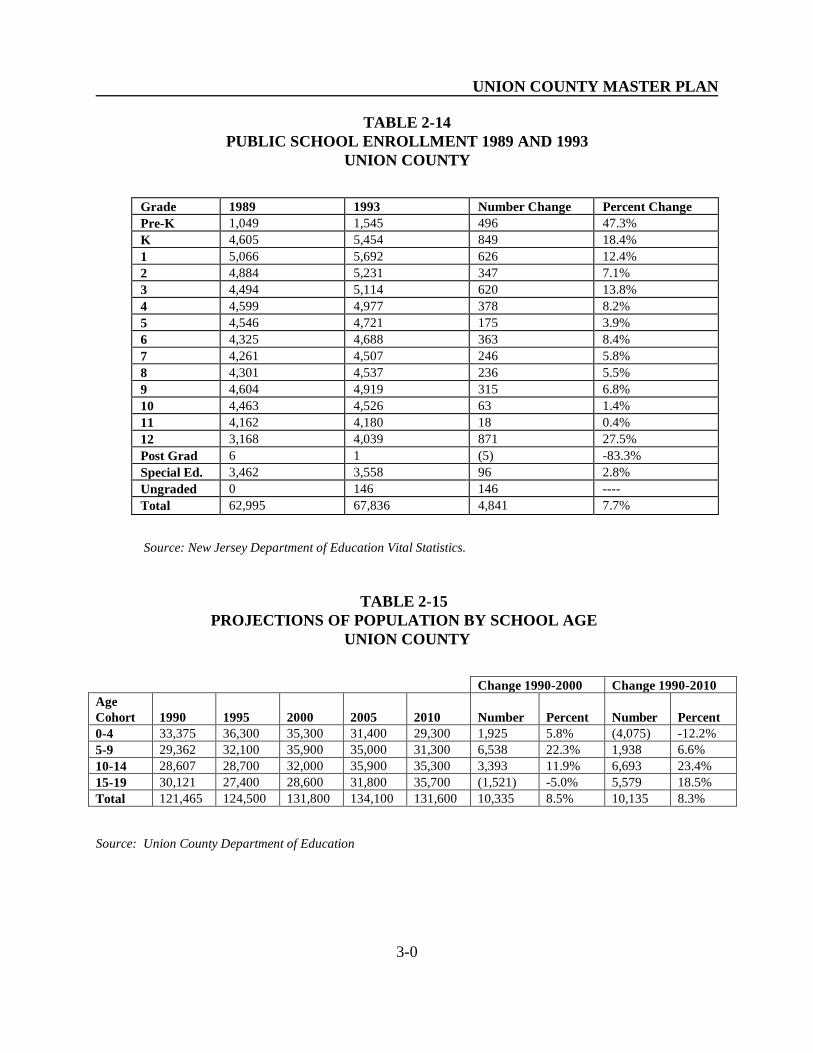
School enrollments for 1989 and 1993 are shown in Table 2-14. In 1989 a total of 62,995 public
school students were enrolled in Union County. Interestingly, the number of students is nearly
uniform in grades 1 through 12 and Kindergarten, averaging approximately 4,406 students. The
number of students increased in 1993 by 4,841 to a total of 67,836 students. A large increase of
students occurred in the Kindergarten, 1st and 3rd grades, indicating that a cycle of increased
enrollment will be filtering through the school system in the next several years. Moderate increases
were shown in most grades with the exception of the 12th grade which showed a twenty-seven
percent increase of 871 students.
Population projections for school children were prepared by the New Jersey Department of Labor
and are shown in Table 2-15. The school age population from age 1 to 14 are expected to increase
between 1990 and 2000. The 15 - 19 age cohort is expected to decline 5 percent during this period.
The school age population is expected to increase in all ages except for the 0 to 4 age cohort which
is expected to decline 12.2 percent between 1990 – 2010. Despite the decreases in those specific
age cohorts the total change in school age population is expected to increase 8.5 percent between
1990 – 2000 and 8.3 percent between 1990 and 2010.
UNION COUNTY MASTER PLAN
3-0
TABLE 2-14
PUBLIC SCHOOL ENROLLMENT 1989 AND 1993
UNION COUNTY
Grade 1989 1993 Number Change Percent Change
Pre-K 1,049 1,545 496 47.3%
K 4,605 5,454 849 18.4%
1 5,066 5,692 626 12.4%
2 4,884 5,231 347 7.1%
3 4,494 5,114 620 13.8%
4 4,599 4,977 378 8.2%
5 4,546 4,721 175 3.9%
6 4,325 4,688 363 8.4%
7 4,261 4,507 246 5.8%
8 4,301 4,537 236 5.5%
9 4,604 4,919 315 6.8%
10 4,463 4,526 63 1.4%
11 4,162 4,180 18 0.4%
12 3,168 4,039 871 27.5%
Post Grad 6 1 (5) -83.3%
Special Ed. 3,462 3,558 96 2.8%
Ungraded 0 146 146 ----
Total 62,995 67,836 4,841 7.7%
Source: New Jersey Department of Education Vital Statistics.
TABLE 2-15
PROJECTIONS OF POPULATION BY SCHOOL AGE
UNION COUNTY
Change 1990-2000 Change 1990-2010
Age
Cohort
1990
1995
2000
2005
2010
Number
Percent
Number
Percent
0-4 33,375 36,300 35,300 31,400 29,300 1,925 5.8% (4,075) -12.2%
5-9 29,362 32,100 35,900 35,000 31,300 6,538 22.3% 1,938 6.6%
10-14 28,607 28,700 32,000 35,900 35,300 3,393 11.9% 6,693 23.4%
15-19 30,121 27,400 28,600 31,800 35,700 (1,521) -5.0% 5,579 18.5%
Total 121,465 124,500 131,800 134,100 131,600 10,335 8.5% 10,135 8.3%
Source: Union County Department of Education
UNION COUNTY MASTER PLAN
3-1
LAND USE PLAN
This Section presents the Land Use Plan Element for Union County. The Land Use Plan Element
serves as the primary basis for guiding the extent and intensity of future development within Union
County. It was prepared to identify existing residential and non-residential land use development
patterns which have occurred within the County. It also reflects the extent and intensity of
development planned for the future by Union County municipalities for varying types of land use
including residential, commercial, industrial and public areas.
Union County is nearly fully developed. The Land Use Plan Map was prepared, therefore, to reflect
a composite of the Master Plan, land use plan and zoning designations for each of the municipalities.
In this way the Union County Land Use Plan provides a uniform comparison of zoning or land use
designations based upon categories of land development which are found throughout the County.
For example, the residential development of the Land Use Plan is identified into single-family
residential categories including lot sizes of 10,001 square feet and or greater; 5,001 to 10,000 square
feet and 5,000 square feet or less. Two to four family and multi-family development is also
identified. All zoning classifications by the municipalities throughout the County have been
incorporated into the County Land Use Plan designations for identification and comparison. Table
3-1 presents the Land Use Plan categories and the municipal zoning district or land use plan
categories which comprise the categories utilized in the Land Use Plan. Figure 3-1 presents the
Land Use Plan Map for Union County.
Residential
Residential land use is comprised of five (5) categories of single family, two to four families and
multi-family residential development as follows:
Single Family
Single-family residential use is divided into 3 classifications based on existing or required square
footage of lots including 5,000 sq. ft. or less lots; 5,001 sq. ft. to 10,000 sq. ft. lots, and 10,001 sq.
ft. and greater lots. Single-family residential developments in Union County is comprised of lots

UNION COUNTY MASTER PLAN
3-2
ranging from 5,000 to 10,000 sq. ft.
The 10,001 sq. ft. and larger lots in Union County are generally located in the western portion of the
County away from the older commercial and industrial areas. The 5,000 to 10,000 sq. ft. lots occur
in areas which provide a transition between the higher density single family and lower density single
family lots. This is the predominant single-family land use category in Union County. 5,000 sq. ft.
lots or less are the highest density of single family development. These types of lots are found
primarily in Hillside and Rahway. Additional areas are found in Roselle, Cranford and Summit.
5,000 sq. ft. lots or less cover the smallest geographical area of the single family categories.
Two to Four Family & Multi-Family
Two to four family and multi-family residential land uses are provided in the plan. Two to four
family and multi-family areas are found primarily in the eastern portion of the County with smaller
areas in the western portion of the County.
Two to four family development is most prevalent in Elizabeth with some smaller areas of two to
four family throughout the County usually adjacent to commercial areas.
Union County has a variety of multi-family development types including apartments, townhouses and
planned unit developments. Multi-family development areas are located primarily in the eastern
portion of the County especially in Elizabeth and Linden. There are small scattered areas of multi-
family throughout other municipalities in the County.
TABLE 3-1
LAND USE PLAN

UNION COUNTY MASTER PLAN
3-3
TABLE 3-1
MUNICIPAL ZONING DISTRICTS
(Insert)
UNION COUNTY MASTER PLAN
3-4
Commercial
The commercial designation includes office, regional, community and neighborhood level
commercial and special development districts. The commercial designations vary at the municipal
level in municipal master plans and ordinances. Commercial areas in Union County occur along
UNION COUNTY MASTER PLAN
3-5
major roadways and are clustered within town centers and center cities. Commercial areas include
general business activities such as retail, food services, business services and personal services. Lot
sizes are generally in the range of 5,000 to 10,000 sq. ft.
Office
Office development includes professional offices as well as research/laboratory facilities. Small
pockets of office development are found adjacent to the general commercial category along major
roadways in Roselle Park, Linden, Clark, Springfield, and Mountainside. Larger areas of office land
use including research/laboratory facilities are located in Berkeley Heights, Summit and Cranford.
Neighborhood & General Commercial
Neighborhood and General Commercial is prevalent throughout all of the County municipalities.
The pattern of general commercial areas is linear since such areas are found adjacent to major
roadways. General Commercial also defines broader center city limits such as Elizabeth and
Plainfield.
Special Development Districts
Several Special Development Districts are located throughout the County. Improvement Districts
encourage development and redevelopment for commercial, office and other planned uses. The
Linden Airport is designated as a Special Development District, however, it is shown as “airport” on
the Land Use Map. The north side of the field is planned to be developed for a new hotel and
conference center containing restaurants, movie theaters and retail stores which will be developed
over several years.
The City of Elizabeth has six (6) Special Improvement Districts. They include:
1) Kapkowski Road Redevelopment Area located along Kapkowski Road and the Great Ditch.
2) Sea Port Industrial Center located along the Arthur Kill at the end of Trumball Street.
3) Elizabeth Waterfront and Elizabethport Phase II Districts located along Front Street and
First Street
UNION COUNTY MASTER PLAN
3-6
4) New Point Urban Renewal Project located along Trumball Street near the New Jersey
Turnpike.
5) Midtown Redevelopment District located along Union Street and East Jersey Street
6) Special Improvement District located along Jefferson Street
There are two (2) improvements districts in Plainfield along North Avenue and West Front Street.
The Hillside Urban Enterprise Zone (UEZ) is located in the industrial section of Hillside including
Route 22, Liberty Avenue and route 78 corridors
A Transportation Development District (TDD) is located along the U.S. 1 and 9 corridor,
which includes the Port Elizabeth and Linden Airport areas. It was established as a tool to
address the demands associated with the surge in economic development opportunities within the
corridor. The TDD will target investment along the corridor to address the mobility needs of
new development over a 20 year planning horizon.
Industrial
Industrial areas are commonly defined by municipalities as heavy, medium and light industrial areas.
The location of such zones is dependent on their proximity to highways and transportation routes
including rail and sea; proximity to electric and sewer; availability of land and water supply; and
proximity to population and employment bases.
Light Industrial
A light industrial facility is one that does not produce large quantities of air pollution, water pollution
or hazardous wastes. Assembly processes, manufacturing and warehousing are typical activities in
this designation. Light industrial areas are found in the interior of the County, especially along the
rail lines in Union Township, Garwood, Cranford and Roselle.
UNION COUNTY MASTER PLAN
3-7
Medium Industrial
Medium industrial facilities are not as well defined as light or heavy industrial. These facilities
contain elements of both. Medium industrial areas are found in Elizabeth along the waterfront and
near the Newark Airport.
Heavy Industrial
Heavy industrial areas include those areas of large scale manufacturing and industrial processes.
Examples include chemical and food processing plants. Heavy industrial development is dominant in
Linden due to the large number of refineries and large scale manufacturing facilities.
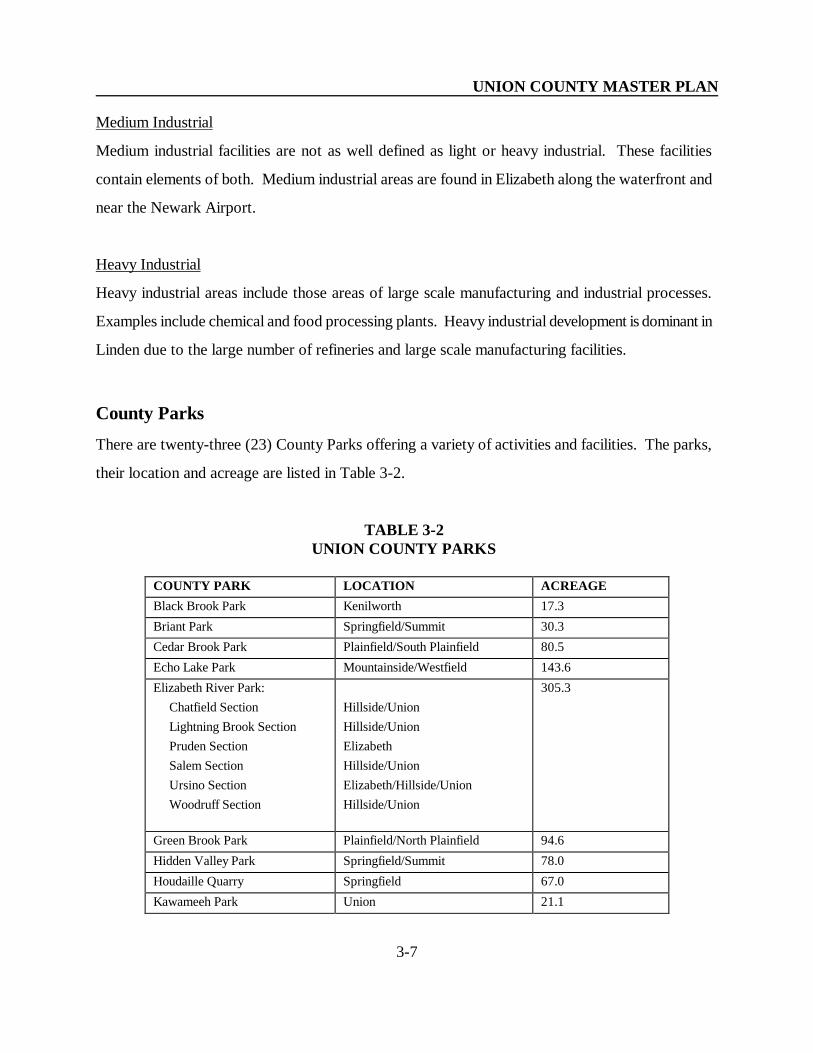
County Parks
There are twenty-three (23) County Parks offering a variety of activities and facilities. The parks,
their location and acreage are listed in Table 3-2.
TABLE 3-2
UNION COUNTY PARKS
COUNTY PARK LOCATION ACREAGE
Black Brook Park Kenilworth 17.3
Briant Park Springfield/Summit 30.3
Cedar Brook Park Plainfield/South Plainfield 80.5
Echo Lake Park Mountainside/Westfield 143.6
Elizabeth River Park:
Chatfield Section
Lightning Brook Section
Pruden Section
Salem Section
Ursino Section
Woodruff Section
Hillside/Union
Hillside/Union
Elizabeth
Hillside/Union
Elizabeth/Hillside/Union
Hillside/Union
305.3
Green Brook Park Plainfield/North Plainfield 94.6
Hidden Valley Park Springfield/Summit 78.0
Houdaille Quarry Springfield 67.0
Kawameeh Park Union 21.1
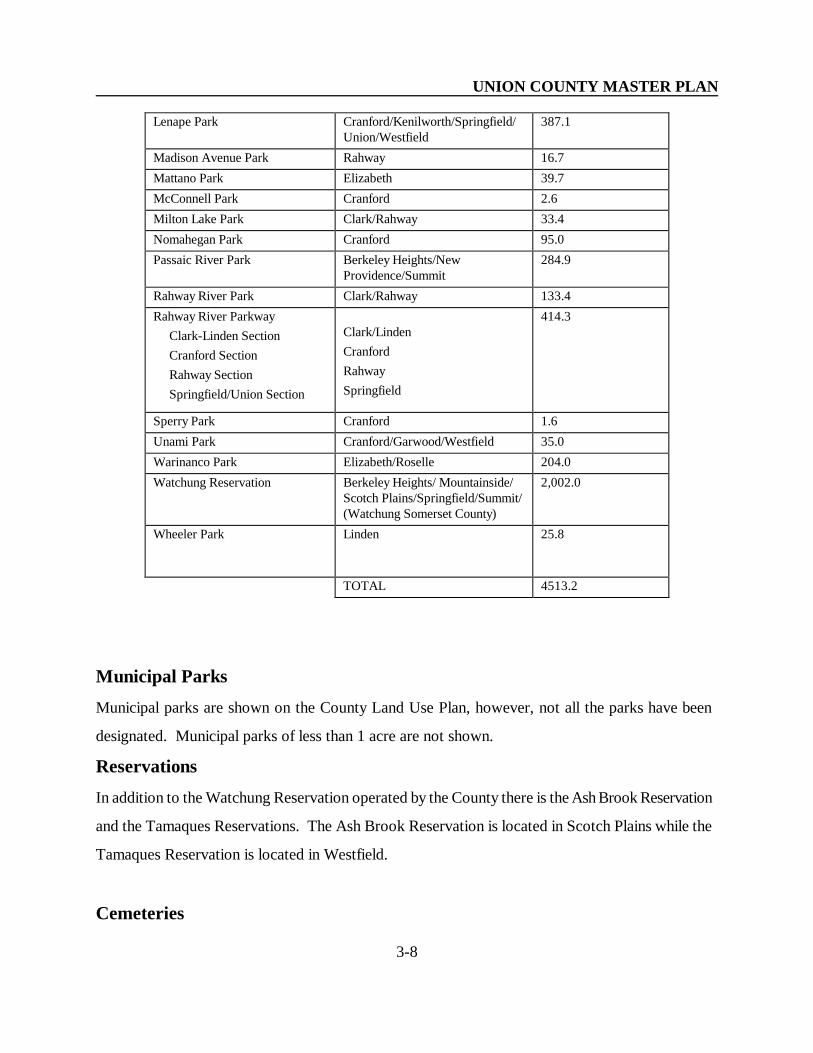
UNION COUNTY MASTER PLAN
3-8
Lenape Park Cranford/Kenilworth/Springfield/
Union/Westfield
387.1
Madison Avenue Park Rahway 16.7
Mattano Park Elizabeth 39.7
McConnell Park Cranford 2.6
Milton Lake Park Clark/Rahway 33.4
Nomahegan Park Cranford 95.0
Passaic River Park Berkeley Heights/New
Providence/Summit
284.9
Rahway River Park Clark/Rahway 133.4
Rahway River Parkway
Clark-Linden Section
Cranford Section
Rahway Section
Springfield/Union Section
Clark/Linden
Cranford
Rahway
Springfield
414.3
Sperry Park Cranford 1.6
Unami Park Cranford/Garwood/Westfield 35.0
Warinanco Park Elizabeth/Roselle 204.0
Watchung Reservation Berkeley Heights/ Mountainside/
Scotch Plains/Springfield/Summit/
(Watchung Somerset County)
2,002.0
Wheeler Park Linden
25.8
TOTAL 4513.2
Municipal Parks
Municipal parks are shown on the County Land Use Plan, however, not all the parks have been
designated. Municipal parks of less than 1 acre are not shown.
Reservations
In addition to the Watchung Reservation operated by the County there is the Ash Brook Reservation
and the Tamaques Reservations. The Ash Brook Reservation is located in Scotch Plains while the
Tamaques Reservation is located in Westfield.
Cemeteries

UNION COUNTY MASTER PLAN
3-9
There are several cemeteries of various sizes located throughout the County. Several cemeteries are
50 acres or greater in area including the Evergreen Cemetery in Hillside, Rose Hill and Linden Park
Cemeteries in Linden, Hollywood Memorial Park Cemetery in Union, and Fairview Cemetery in
Westfield.
Hospitals
Union County has nine hospitals offering a variety of core and specialized units. These hospitals
include the following:
HOSPITAL LOCATION
John E. Runnells Hospital Berkeley Heights
Muhlenburg Hospital Plainfield
Childrens Specialized Hospital Mountainside
Overlook Hospital Summit
Rahway Hospital Rahway
St. Elizabeth Hospital Elizabeth
Elizabeth General Medical Center Elizabeth
Elizabeth Medical Center Nursing
Home
Elizabeth
Union Hospital Union
Fair Oaks (Psychiatric) Summit
Golf Courses
There are ten public and private golf courses in Union County. These include the following:
GOLF COURSE TYPE LOCATION
Ash Brook Golf Course Public Scotch Plains
Baltusrol Golf Course Private Springfield
Canoe Brook Country Club Private Summit
Echo Lake Country Club Private Westfield
Galloping Hill Golf Course Public Kenilworth
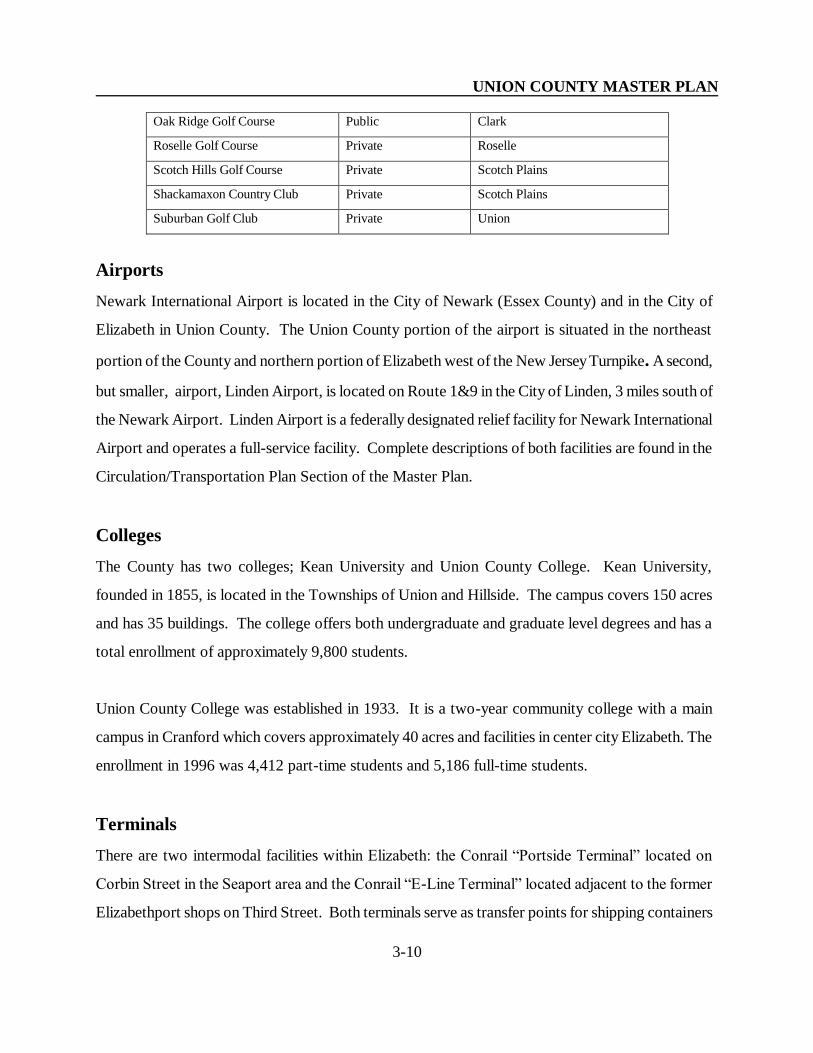
UNION COUNTY MASTER PLAN
3-10
Oak Ridge Golf Course Public Clark
Roselle Golf Course Private Roselle
Scotch Hills Golf Course Private Scotch Plains
Shackamaxon Country Club Private Scotch Plains
Suburban Golf Club Private Union
Airports
Newark International Airport is located in the City of Newark (Essex County) and in the City of
Elizabeth in Union County. The Union County portion of the airport is situated in the northeast
portion of the County and northern portion of Elizabeth west of the New Jersey Turnpike. A second,
but smaller, airport, Linden Airport, is located on Route 1&9 in the City of Linden, 3 miles south of
the Newark Airport. Linden Airport is a federally designated relief facility for Newark International
Airport and operates a full-service facility. Complete descriptions of both facilities are found in the
Circulation/Transportation Plan Section of the Master Plan.
Colleges
The County has two colleges; Kean University and Union County College. Kean University,
founded in 1855, is located in the Townships of Union and Hillside. The campus covers 150 acres
and has 35 buildings. The college offers both undergraduate and graduate level degrees and has a
total enrollment of approximately 9,800 students.
Union County College was established in 1933. It is a two-year community college with a main
campus in Cranford which covers approximately 40 acres and facilities in center city Elizabeth. The
enrollment in 1996 was 4,412 part-time students and 5,186 full-time students.
Terminals
There are two intermodal facilities within Elizabeth: the Conrail “Portside Terminal” located on
Corbin Street in the Seaport area and the Conrail “E-Line Terminal” located adjacent to the former
Elizabethport shops on Third Street. Both terminals serve as transfer points for shipping containers

UNION COUNTY MASTER PLAN
3-11
between trains, trucks and ships.
Port Elizabeth/Port Newark
The Port Newark/Elizabeth Marine Terminal includes Port Newark located in Newark (Essex
County) north of the Elizabeth Channel and including the Newark Channel. The Elizabeth Port
Authority Marine Terminal is located in Elizabeth south of the Elizabeth Channel. Elizabeth is
known as “America’s Containership Capital.”
The Port Newark/Elizabeth Marine Terminal handles more than two-thirds of all the cargo in the
New York/New Jersey area and more intermodal containers than any other port in the nation. The
complex contains approximately 2,230 acres, has 3 miles of ship berths and 3.5 million square feet of
warehouse space.
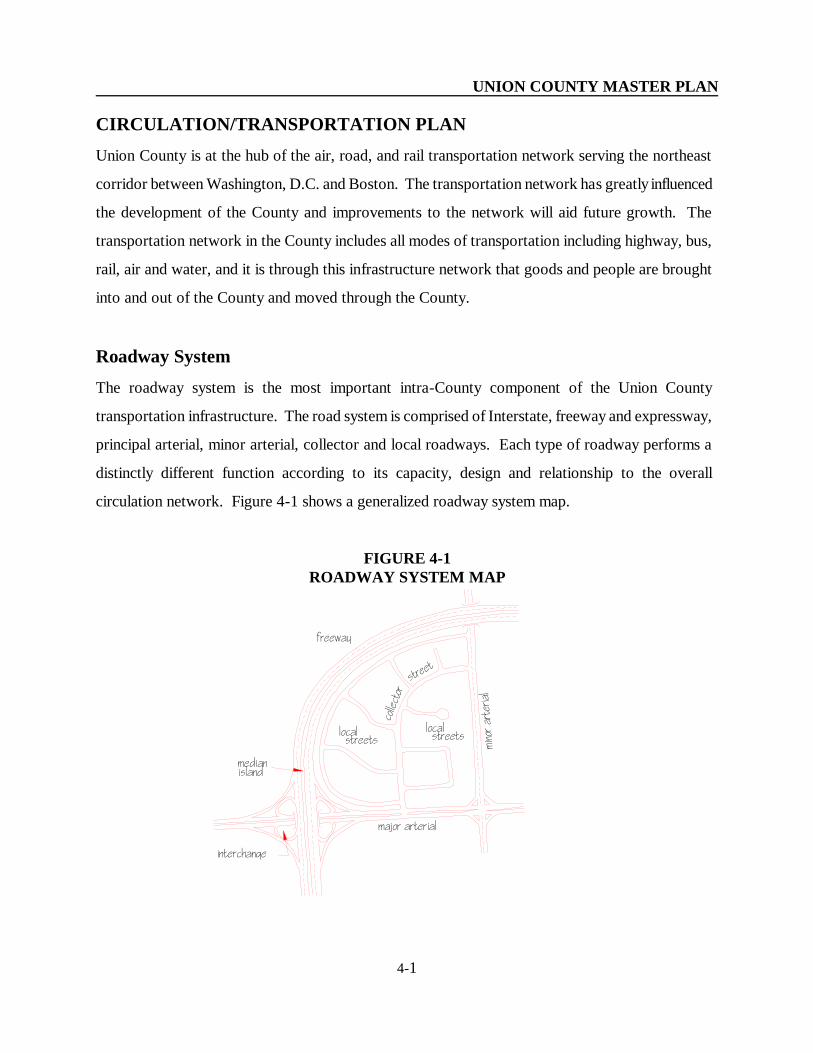
UNION COUNTY MASTER PLAN
4-1
CIRCULATION/TRANSPORTATION PLAN
Union County is at the hub of the air, road, and rail transportation network serving the northeast
corridor between Washington, D.C. and Boston. The transportation network has greatly influenced
the development of the County and improvements to the network will aid future growth. The
transportation network in the County includes all modes of transportation including highway, bus,
rail, air and water, and it is through this infrastructure network that goods and people are brought
into and out of the County and moved through the County.
Roadway System
The roadway system is the most important intra-County component of the Union County
transportation infrastructure. The road system is comprised of Interstate, freeway and expressway,
principal arterial, minor arterial, collector and local roadways. Each type of roadway performs a
distinctly different function according to its capacity, design and relationship to the overall
circulation network. Figure 4-1 shows a generalized roadway system map.
FIGURE 4-1
ROADWAY SYSTEM MAP

UNION COUNTY MASTER PLAN
4-2
All roadways within Union County have been classified by the New Jersey Department of
Transportation according to the Functional Classification of Highways developed by the Federal
Highway Administration (last revised in 1990). The Federal Highway Administration functional
classification system includes standards for rural and urban areas. Union County is entirely within an
“Urban Area” that encompasses all of northeastern New Jersey and the New York Metropolitan
Area. There are four functional highway categories for “Urban Areas”: interstates, freeways and
expressways; principal arterials; minor arterials; and collectors. All other streets and roads are
broadly classified as “local roadways”. The standards for the Federal roadway functional
designations are based upon the character of services they are intended to provide. These are
described below in Table 4-1. Figure 4-2 delineates the Functional Classification Circulation Plan for
Union County.
TABLE 4-1
ROADWAY SYSTEM CLASSIFICATION
Interstate/Freeway
A limited access highway with no grade crossings
Principal Arterials
A street with access control, channelized intersections, restricted parking, and that collects
and distributes traffic to and from minor arterials
Minor Arterials
A street with signals at important intersections and stop signals on the side streets and that
collects and distributes traffic to and from collector streets.
Collectors
A street which has the function of both mobility and access.
Local Roads
A street designed to provide vehicular access to abutting property and to discourage
through traffic.

UNION COUNTY MASTER PLAN
4-3
FIGURE 4-2
FUNCTIONAL CLASSIFICATION MAP
(Insert Map)
Interstates/Freeways
UNION COUNTY MASTER PLAN
4-4
The highest functional classification of roadway is interstates/freeways which are roadways with fully
controlled access. Fully controlled access mean that authority to control access is exercised to give
preference to through traffic by providing access connections with selected public roads only and by
prohibiting crossings at grade and direct private driveway connections. Essential interstate/freeway
elements include medians, grade separations at cross street, ramp connections for entrance to and
exit from the through roads, and (in some cases) frontage roads. Interstates/freeways are intended to
provide high levels of safety and efficiency in the movement of high volumes of traffic at high speeds.
Two Interstates, I-78 and I-95 (New Jersey Turnpike), cross through Union County. Interstate 78
extends 10.40 miles through the northern portion of the County including Hillside, Union and
Springfield Townships and along the Watchung Reservation through Mountainside, New Providence
and Berkeley Heights.
Interstate 95 (New Jersey Turnpike) extends 6.25 miles in a north/south direction through Linden
and Elizabeth. Interstate 95 extends through New Jersey from the George Washington Bridge in
northern New Jersey to the Delaware Memorial Bridge in southern New Jersey. Recent
improvements to the New Jersey Turnpike included the widening of the roadway between
Interchange 11 in Woodbridge and Interchange 14 in Newark that includes the section of the
Turnpike extending through Union County. This 13-mile section is the most heavily traveled section
of the Turnpike. The widening was completed in 1996 and resulted in the addition of new fourth
lanes to the northbound and southbound outer roadways. These lanes were designated as High
Occupancy Vehicle (HOV) lanes on December 4, 1996. During the weekday periods of 6:00 to
9:00 a.m. in the northbound lane and 4:00 to 7:00 p.m. in the southbound lane the HOV lanes are
reserved for cars and vans carrying three or more people, buses and motorcycles. At all other times
the lanes are open to all passenger vehicles.
The Turnpike proposes to expand the existing toll plaza at Interchange 13A from 15 lanes to 21
lanes. In addition, the plaza canopy and tunnel will be extended, and utilities, ramp pavement, curbs,

UNION COUNTY MASTER PLAN
4-5
drainage facilities and roadway lighting will be upgraded. The plaza is being expanded in order to
accommodate increased traffic which will be generated by the proposed Jersey Gardens Mall and the
proposed expansion to Newark International Airport. There are no additional improvements planned
within Union County by the New Jersey Turnpike.
One “freeway”, the Garden State Parkway, traverses 6.9 miles of Union County. The Parkway
extends through the central portion of Union County in a north/south direction and includes nine
access points: Interchange 135 in Clark; Interchanges 136 and 137 in Cranford; Interchange 138 in
Kenilworth; Interchanges 139, 140, and 141 in Union; and Interchanges 142/142A in Hillside.
Principal Arterials
The principal arterial system connects major urbanized centers, serves the high traffic volume
corridors and carries a high proportion of the total urban area travel on a minimum of mileage. The
principal arterial system carries most of the trips entering and leaving urban areas as well as most of
the through movements by-passing urban centers and the cities. Because of the nature of the travel
served by the principal arterial system, almost all fully and partially controlled access facilities are
usually part of this functional class. Principal arterial roadways include the following in Union
County: U. S Route 1/9 (6.25 miles), U.S. Route 22 (9.6 miles), State Route 27 (5.6 miles), State
Route 28 (12.3 miles), State Route 82 (4.6 miles), and State Route 124 (2.9 miles).
Minor Arterials
The minor arterial system interconnects with the principal arterial system. It accommodates trips of
moderate length at a somewhat lower level of travel mobility than principal arterials. This system
distributes travel to geographic areas smaller than those identified with the higher system. The minor
arterial system places more emphasis on land access and offers lower traffic mobility. Examples of
minor arterials in Union County include Elizabeth Avenue in Elizabeth, Springfield Avenue in
Berkeley Heights and New Providence and Vauxhall Road in Union Township.
Collector
The collector system provides both land access service and traffic circulation within residential
UNION COUNTY MASTER PLAN
4-6
neighborhoods and commercial and industrial areas. It differs from the arterial system in that
facilities on the collector system may penetrate residential neighborhoods, distributing trips from the
arterials through the area to their ultimate destinations. The collector street also collects traffic from
local streets in residential neighborhoods and channels it into the arterial system. In central business
districts, and in other areas of similar development and traffic density, the collector system may
include the entire street grid.
Examples of collectors include Linden Avenue in Linden, Rahway Avenue in Westfield and Lincoln
Avenue in Cranford.
Local Roads
Local roads including residential streets serve primarily as access to the adjacent property and uses.
On these roads the through traffic is local in nature and extent rather than regional, interstate or
intrastate. While local roadways constitute a high proportion of the roadway mileage in the system,
the traffic volumes generated by the abutting land uses are largely short trips or a relatively small part
of longer trips where the local road connects with major streets or highways of higher classifications.
Due to the relatively low traffic volumes and the extensive mileage, design standards for local roads
and streets are of a comparatively low order as a matter of practicality. However, to provide for
traffic mobility and safety and essential economies in construction, maintenance, and operation, local
roads must be planned, located, and designed to be suitable for predictable traffic operations and
must be consistent with the development abutting the right-of-way. (Due to mapping constraints not
all of the local roadway system within the County is shown in Figure 4-1).
New Jersey Highway Access Management Code
In 1989, the New Jersey Municipal Land Use Law was amended by the State Highway Access
Management Act. The act authorizes the NJDOT, county and municipalities to adopt access
management codes. Where such codes have been adopted, no permits for construction of a building
or structure can be issued unless the proposed access conforms to the adopted codes of the entity
with jurisdiction over the road. The NJDOT prepared a Statewide Access Management Code in

UNION COUNTY MASTER PLAN
4-7
April 1992 and updated in 1994 which sets standards for highway access and desired roadway design
based on roadway segments. The code provides standards for highway access for:
Minimum spacing of driveways
Minimum corner clearance
Regulation of the number of driveways per property frontage
Consolidation of access for adjoining properties
Consolidation of access for parcels assembled for one purpose, plan, entity, or usage.
Designation of the number of driveways permitted to each existing property and denial of
additional driveways regardless of future subdivision.
Minimum sight distance
Encouraging connections between adjacent property
Adequate internal design and circulation
The New Jersey Highway Access Management Code roadway segments are shown in Table 4-2.
TABLE 4-2
NEW JERSEY HIGHWAY ACCESS MANAGEMENT CODE
UNION COUNTY
1 2 3 4 5 6 7
Desired
N.J Mile Posted Access Typical
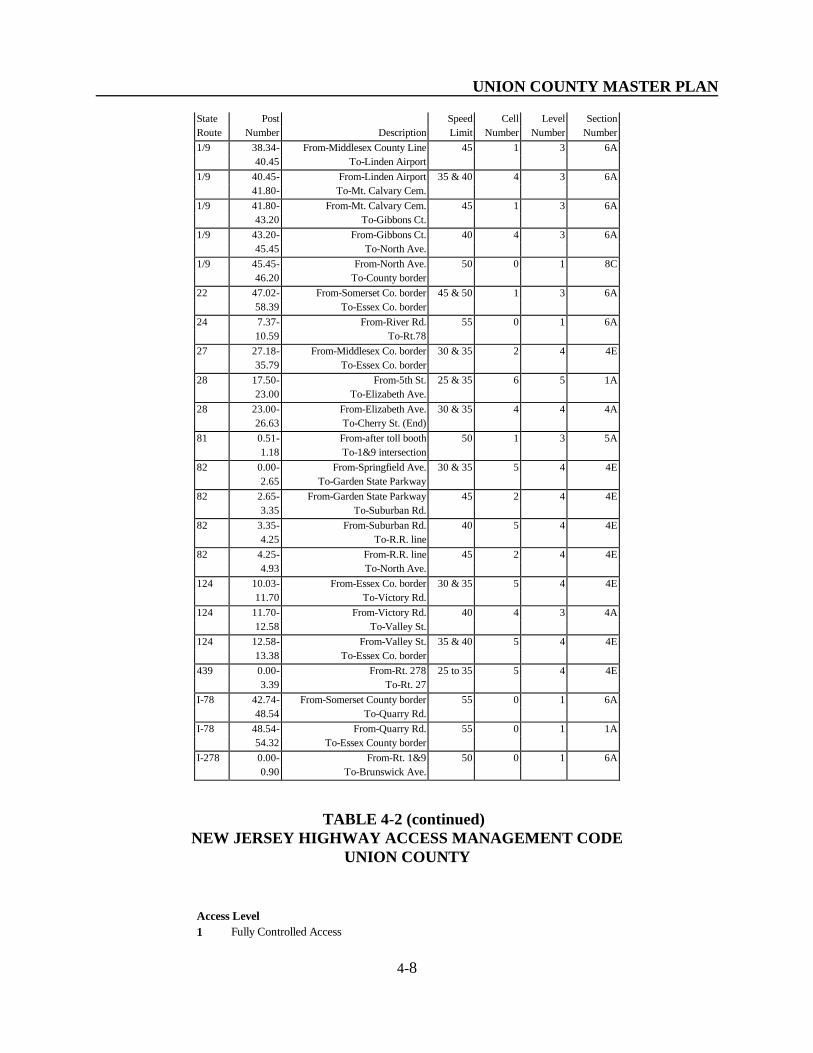
UNION COUNTY MASTER PLAN
4-8
State Post Speed Cell Level Section
Route Number Description Limit Number Number Number
1/9 38.34- From-Middlesex County Line 45 1 3 6A
40.45 To-Linden Airport
1/9 40.45- From-Linden Airport 35 & 40 4 3 6A
41.80- To-Mt. Calvary Cem.
1/9 41.80- From-Mt. Calvary Cem. 45 1 3 6A
43.20 To-Gibbons Ct.
1/9 43.20- From-Gibbons Ct. 40 4 3 6A
45.45 To-North Ave.
1/9 45.45- From-North Ave. 50 0 1 8C
46.20 To-County border
22 47.02- From-Somerset Co. border 45 & 50 1 3 6A
58.39 To-Essex Co. border
24 7.37- From-River Rd. 55 0 1 6A
10.59 To-Rt.78
27 27.18- From-Middlesex Co. border 30 & 35 2 4 4E
35.79 To-Essex Co. border
28 17.50- From-5th St. 25 & 35 6 5 1A
23.00 To-Elizabeth Ave.
28 23.00- From-Elizabeth Ave. 30 & 35 4 4 4A
26.63 To-Cherry St. (End)
81 0.51- From-after toll booth 50 1 3 5A
1.18 To-1&9 intersection
82 0.00- From-Springfield Ave. 30 & 35 5 4 4E
2.65 To-Garden State Parkway
82 2.65- From-Garden State Parkway 45 2 4 4E
3.35 To-Suburban Rd.
82 3.35- From-Suburban Rd. 40 5 4 4E
4.25 To-R.R. line
82 4.25- From-R.R. line 45 2 4 4E
4.93 To-North Ave.
124 10.03- From-Essex Co. border 30 & 35 5 4 4E
11.70 To-Victory Rd.
124 11.70- From-Victory Rd. 40 4 3 4A
12.58 To-Valley St.
124 12.58- From-Valley St. 35 & 40 5 4 4E
13.38 To-Essex Co. border
439 0.00- From-Rt. 278 25 to 35 5 4 4E
3.39 To-Rt. 27
I-78 42.74- From-Somerset County border 55 0 1 6A
48.54 To-Quarry Rd.
I-78 48.54- From-Quarry Rd. 55 0 1 1A
54.32 To-Essex County border
I-278 0.00- From-Rt. 1&9 50 0 1 6A
0.90 To-Brunswick Ave.
TABLE 4-2 (continued)
NEW JERSEY HIGHWAY ACCESS MANAGEMENT CODE
UNION COUNTY
Access Level
1 Fully Controlled Access

UNION COUNTY MASTER PLAN
4-9
2 Access along Street or Interchange only
3 Right-turn access with provision for left-turn access via jughandle
4 Driveway with provision for left-turn access via left-turn lane
5 Driveway with provision for left-turn access (limited by spacing requirements and
safety considerations)
6 Driveway access limited by edge clearance and safety considerations
Desired Typical Section
DTS R.O.W. Description
1A Existing Same lane, shoulder, and parking conditions as exist.
4A 114' 4 lanes, divided, with shoulders
4E 102' 4 lanes, undivided, with shouldrrs, parking (urban situation)
5A 131' 5 lanes (2 lanes, 1 direction + 3 lanes, opposite direction), divided, with
shoulders
6A 148' 6 lanes, divided, with shoulders
8C 234' 8 lanes, divided, with CD Roads
* Not Applicable to single family lots.
Sources:
Column 1,2,3,4 - N.J State Highway Straight Line Diagrams. 1987
Column 6,7 - State Highway Access Management Code, N.J.A.C. 16:47. Effective
September 21, 1992.
Prepared By: T&M Associates November 2, 1997
PASSENGER RAIL SERVICE
Passenger rail service is provided by New Jersey Transit along three main rail lines and two minor
branch lines in Union County. The main rail lines are the Raritan Valley, the Amtrak Northeast
Corridor Line and the Conrail North Jersey Coast Line. The Raritan Valley Line runs between High
Bridge in Hunterdon County and Penn Station in Newark. It extends through the central portion of
Union County through Plainfield, Fanwood, Scotch Plains, Westfield, Garwood, Cranford, Union
and Hillside. The North Jersey Coast Line runs between Bay Head and Rahway. The North Jersey
Coast Line merges with the Northeast Corridor Line which extends through New Jersey between
Trenton and New York City and connecting Boston and Washington. In Union County, the North
Jersey Coast and Northeast Corridor Lines extend from south of Rahway and continue north through
Linden and Elizabeth.
Two other New Jersey Transit rail branches are located in the northwest portion of Union County
and including a portion of the Gladstone Branch running through Berkeley Heights, New Providence
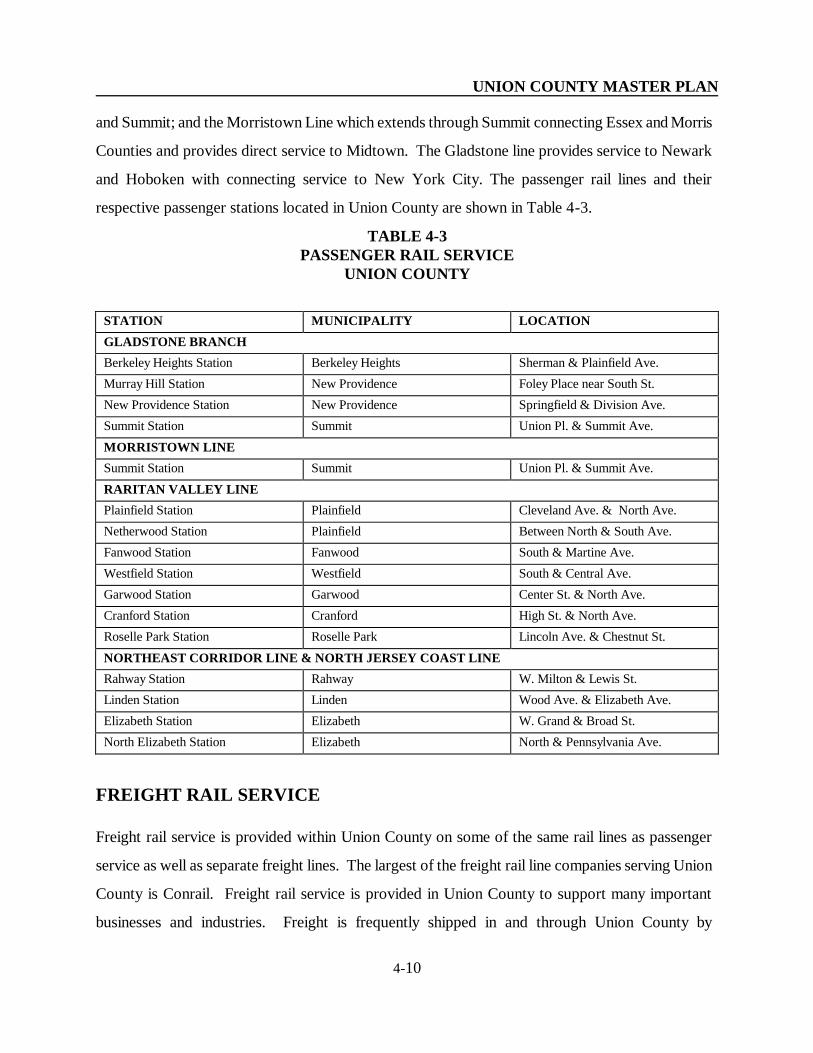
UNION COUNTY MASTER PLAN
4-10
and Summit; and the Morristown Line which extends through Summit connecting Essex and Morris
Counties and provides direct service to Midtown. The Gladstone line provides service to Newark
and Hoboken with connecting service to New York City. The passenger rail lines and their
respective passenger stations located in Union County are shown in Table 4-3.
TABLE 4-3
PASSENGER RAIL SERVICE
UNION COUNTY
STATION MUNICIPALITY LOCATION
GLADSTONE BRANCH
Berkeley Heights Station Berkeley Heights Sherman & Plainfield Ave.
Murray Hill Station New Providence Foley Place near South St.
New Providence Station New Providence Springfield & Division Ave.
Summit Station Summit Union Pl. & Summit Ave.
MORRISTOWN LINE
Summit Station Summit Union Pl. & Summit Ave.
RARITAN VALLEY LINE
Plainfield Station Plainfield Cleveland Ave. & North Ave.
Netherwood Station Plainfield Between North & South Ave.
Fanwood Station Fanwood South & Martine Ave.
Westfield Station Westfield South & Central Ave.
Garwood Station Garwood Center St. & North Ave.
Cranford Station Cranford High St. & North Ave.
Roselle Park Station Roselle Park Lincoln Ave. & Chestnut St.
NORTHEAST CORRIDOR LINE & NORTH JERSEY COAST LINE
Rahway Station Rahway W. Milton & Lewis St.
Linden Station Linden Wood Ave. & Elizabeth Ave.
Elizabeth Station Elizabeth W. Grand & Broad St.
North Elizabeth Station Elizabeth North & Pennsylvania Ave.
FREIGHT RAIL SERVICE
Freight rail service is provided within Union County on some of the same rail lines as passenger
service as well as separate freight lines. The largest of the freight rail line companies serving Union
County is Conrail. Freight rail service is provided in Union County to support many important
businesses and industries. Freight is frequently shipped in and through Union County by

UNION COUNTY MASTER PLAN
4-11
“intermodal” trains that are specialized trains carrying truck trailers or shipping containers
“piggyback” style to key terminals within the region. These containers are transferred on and off the
railcars for local pickup and delivery by trucks provided by nearly 200 truck companies in the area
The intermodal shipping containers can also be transported by ocean-going vessels located at the
Port Newark/Elizabeth Marine Terminal.
General freight rail lines provide bulk shipment needs of many different types of business and
industries for such types of products as lumber, steel, frozen and canned foods, newspaper and
printed products, and recycled materials.
Freight lines are important in Union County for the vehicle assembly plant in Linden, the
Newark/Elizabeth Port, and the chemical industry including refineries along the Arthur Kill. Spur
rail lines located in Linden carry parts to the automobile assembly plant and carry chemicals and
refined petrochemical products. In Elizabeth the rail lines primarily serve the Port Terminal.
There are two intermodal facilities within Elizabeth: the Conrail “Portside Terminal” located on
Corbin Street in the Seaport area and the Conrail “E-Line Terminal” located adjacent to the former
Elizabethport Shops on Third Street. Both terminals serve as transfer points for shipping containers
between trains, trucks and ships. Freight rail lines are shown on Figure 4-3.
In August, 1998, it is anticipated that the CSX Corporation and Norfolk Southern Corporation will
divide Conrail and merge its repsective assets into their systems. This merger will restructured the
rail system along the East Coast and New Jersey. It will restore balanced rail competition to New
Jersey for the first time in 20 years. The merger will allow Norfolk Southern to retail Conrail’s
trackage rights over Amtrack’s New Jersey Service and over other passenger rail lines including
New Jersey Transit. This will provide major service improvements and access to rail lines within
Union County including: improved service between the Midwestern auto markets and the General
Motors plant in Linden; new freight service between New Jersey and Buffalo, Detroit, Chicago, St.
Louis and Kansas City; a $25 million investment to expand and improve intermodal facilities; and
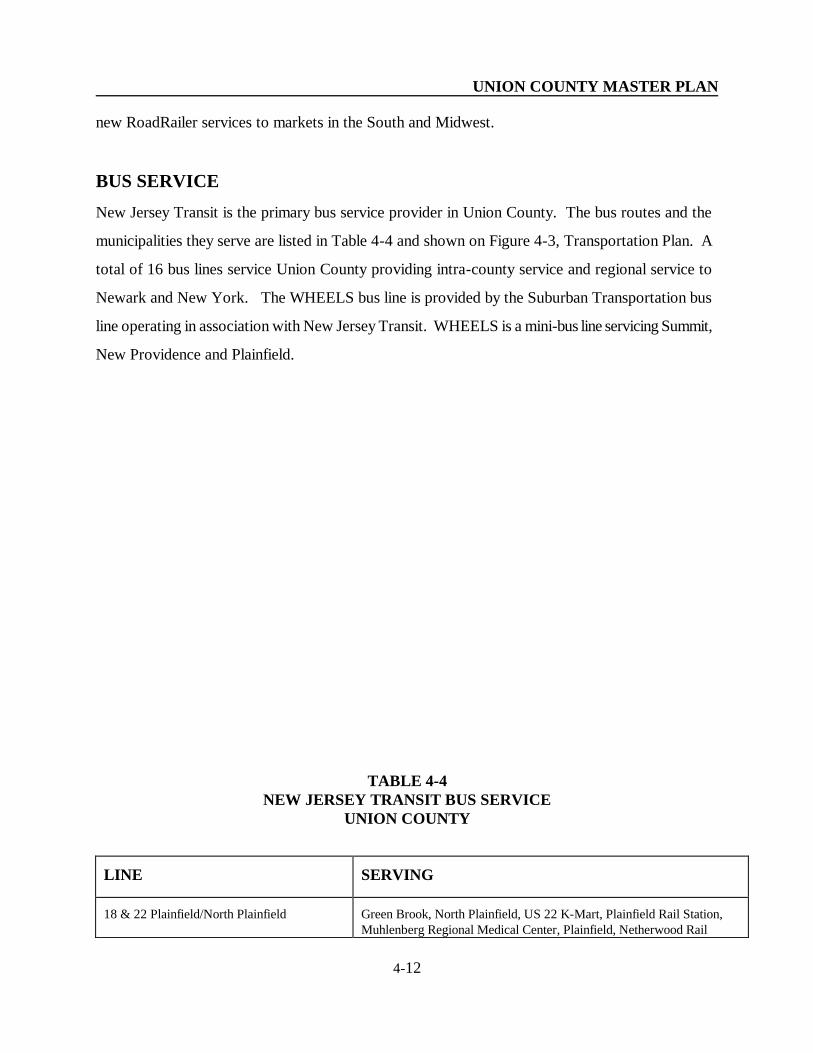
UNION COUNTY MASTER PLAN
4-12
new RoadRailer services to markets in the South and Midwest.
BUS SERVICE
New Jersey Transit is the primary bus service provider in Union County. The bus routes and the
municipalities they serve are listed in Table 4-4 and shown on Figure 4-3, Transportation Plan. A
total of 16 bus lines service Union County providing intra-county service and regional service to
Newark and New York. The WHEELS bus line is provided by the Suburban Transportation bus
line operating in association with New Jersey Transit. WHEELS is a mini-bus line servicing Summit,
New Providence and Plainfield.
TABLE 4-4
NEW JERSEY TRANSIT BUS SERVICE
UNION COUNTY
LINE
SERVING
18 & 22 Plainfield/North Plainfield
Green Brook, North Plainfield, US 22 K-Mart, Plainfield Rail Station,
Muhlenberg Regional Medical Center, Plainfield, Netherwood Rail

UNION COUNTY MASTER PLAN
4-13
Station, Fanwood, Union County Vo-Tech and Scotch Plains M19
Piscataway, Plainfield, Plainfield Rail Station, Muhlenberg Regional
Medical Center, South Plainfield, Middlesex Mall, Edison, Metuchen,
Metuchen Rail Station 25 Springfield Avenue
Maplewood, Irvington, Newark
52 Morris Avenue
Springfield, Union, Elizabeth
26 Irvington/Elizabeth
Elizabeth, Union, Hillside, Irvington
56 Elizabeth-Winfield
57 Tremley
Elizabeth, Linden, Roselle, Cranford, Winfield
58 Elizabeth/Kenilworth
Cranford, Kenilworth, Roselle Park, Elizabeth
59 Plainfield/Newark
Dunellen, Plainfield, Scotch Plains, Westfield, Garwood, Cranford,
Union County College, Roselle, Elizabeth, Hillside, Newark 62 Newark/Woodbridge/ Perth Amboy
Perth Amboy, Edison, Woodbridge, Carteret, Woodbridge Center Mall,
Iselin, Rahway, Roselle, Linden, Elizabeth, Newark Airport 70 Newark/Livingston Mall
Florham Park, Livingston, Summit, Springfield, Millburn, Maplewood,
Irvington, Newark 94 Stuyvesant/Crosstown
Bloomfield, East Orange, Newark, Irvington, Union, Roselle Park,
Roselle, Linden 112 Clark/New York
Scotch Plains, Clark, Linden, Roselle, Elizabeth, New York
113 Dunellen/New York
Dunellen, Plainfield, Scotch Plains, Fanwood, Westfield, Garwood,
Cranford, Roselle Park, Hillside, Elizabeth, New York 114 Bridgewater/New York
117 Somerville/New York
Bridgewater, Somerville, Bound Brook, Dunellen, Plainfield, Scotch
Plains, Mountainside, Springfield, Union, Hillside, New York 115 Rahway/New York
Avenel, Rahway, Roselle, Linden, Elizabeth, New York
986 Summit/Murray Hill/Plainfield
WHEELS Suburban Transportation Service
Summit, New Providence, Murray Hill, Berkeley Heights, Watchung,
North Plainfield, Plainfield
Source: New Jersey Transit, 1997
AIRPORT SERVICE
Union County is served by three major regional airports located for interstate and international
travel. They include Newark International Airport, LaGuardia Airport and John F. Kennedy Airport
all of which are operated by the Port Authority of New York/New Jersey. A fourth, but smaller,
airport, Linden Airport, is located on Route 1&9 in the City of Linden 3 miles south of the Newark
Airport.
UNION COUNTY MASTER PLAN
4-14
Newark International Airport is located in the City of Newark (Essex County) and in the City of
Elizabeth in Union County. The Union County portion of the airport is situated in the northeast
portion of the County and northern portion of Elizabeth west of the New Jersey Turnpike. Newark
Airport opened on October 1, 1928 and set the standard for modern airport design. When the
airport terminal facility was dedicated by Emelia Earhart in 1934 it was the largest airport in the
world and was used primarily for airmail. After the airline industry was deregulated in the late
1970's Newark Airport experienced rapid growth in passenger travel. In 1996 Newark Airport had a
total of 29,107,459 passengers. This included 24,519,700 passengers traveling domestically and
4,587,759 passengers traveling internationally. In comparison, John F. Kennedy Airport had
31,155,411 passengers and LaGuardia had 20,699,136 passengers in 1996. All three airports
showed increases in passenger travel between 1995 and 1996, with the largest being at Newark
Airport, 9.3 percent.
FIGURE 4-4
TRANSPORTATION PLAN
(Insert Map)
UNION COUNTY MASTER PLAN
4-15
Recent improvements to Newark Airport include the International Terminal and new monorail
facilities which connect the various terminal facilities and major parking lots. The Newark
International Terminal opened on January 24, 1996 in Terminal B. The 1.9-mile monorail connects
Newark Airport’s three passenger terminals with long-term parking lots and rental car facilities. It
was opened on May 31, 1996. The monorail, which carries more than 20,000 passengers a day, will
be extended to a new rail station to be constructed in Elizabeth along the Northeast Corridor/North
Jersey Coast line to link with Amtrak and NJ Transit trains.

UNION COUNTY MASTER PLAN
4-17
NEWARK INTERNATIONAL AIRPORT
Pending improvements to the Newark Airport include the extension of Runway 4L-22R 1,800 feet to
the southwest (within Union County) and 1,000 feet to the northeast (in Essex County). This
improvement is subject to federal approval of an environmental assessment. The $93 million project
was approved on February 6, 1997 by the Port Authority of New York and New Jersey. The
expansion will improve airport operations and flexibility.
A light rail transit system known as the “Newark/Elizabeth Rail Link” connecting the Airport with
the downtown areas of Newark and Elizabeth, providing 12 stops along its route is currently being
studied. Possible extensions to Plainfield, Summit, Elizabeth and the Jersey Gardens Mall are also
being considered.
Nearby Linden Airport encompasses approximately 188 acres, has two runways and is home to 128
aircraft which includes 116 single engine planes, 9 multi-engine planes and 3 helicopters. The airport
offers fuel, maintenance, aircraft storage, charter service and flight instruction. It hosts the
helicopter fleet for the President of the United States when he visits the New York/New Jersey area.
Linden Airport is in the process of closing one of its two runways (Runway 14/32). The north side
of the field is planned to be developed for a new hotel and conference center containing restaurants,

UNION COUNTY MASTER PLAN
4-18
movie theaters, and retail stores. The south side of the field will accommodate tenants, 80 T-
hangars, six conventional hangars, and an aircraft tie-down area.
WATERWAYS
The Arthur Kill is a narrow waterway lying between eastern Union County and New York’s
Borough of Staten Island. It is one of the busiest waterways in the world. It serves as a channel into
Upper New York Harbor and Raritan Bay and is the gateway to and from the Atlantic Ocean for the
Port Newark/Elizabeth Marine Terminal.
The Port Newark/Elizabeth Marine Terminal handles more than two-thirds of all the cargo in the
New York/New Jersey area and more intermodal containers than any other port in the nation. The
complex contains approximately 2,230 acres, has 3 miles of ship berths and 3.5 million square feet of
warehouse space. The Port Newark/Elizabeth Marine Terminal includes Port Newark located in
Newark (Essex County) north of the Elizabeth Channel and including the Newark Channel. The
Elizabeth Port Authority Marine Terminal is located in Elizabeth south of the Elizabeth Channel.
Elizabeth is known as “America’s Containership Capital.” The Port Elizabeth Marine Terminal
includes 23 container cranes serving three fully equipped containership terminals, 16 freight
distribution buildings with more than 2 million square feet of space, and numerous other buildings.
Sea-Land operates a terminal with 7 cranes on 232 acres, including 4,519 feet of wharf.
Maher Terminal Inc., the largest container terminal operator, operates two terminals with a total of
7,350 feet of berthing space, approximately 453 acres of upland area, miscellaneous buildings and 14
container cranes. The Port Authority has recently constructed three multi-level buildings, each
44,000 sq. ft. in size with eight 5,500 sq. ft. units known as Expressport Plaza. Figure 4-3,
Transportation Plan shows passenger and freight rail service, railroad passenger stations, bus service
lines, terminals, airports and the Seaport.

UNION COUNTY MASTER PLAN
4-19
The Howland Hook container terminal opened in the fall of 1996 after renovations. Howland Hook
is a 187 acre marine terminal located in Staten Island, New York near the Goethals Bridge. The
Goethals connects Staten Island with Elizabeth, spanning the Arthur Kill. The terminal consists of
2,500 linear feet of berth, capable of handling 3 vessels simultaneously and has the capacity to
handle 425,000 containers annually.
The Port Authority proposes to construct a new bridge near the existing Goethals Bridge to improve
traffic capacity of Route 278 (Staten Island Expressway) across the Arthur Kill. Once completed,
the current two-way traffic on the Goethals Bridge would be split into one-way traffic on the two
bridges; the existing Goethals Bridge would carry westbound traffic and the new bridge would carry
eastbound traffic.
Port Dredging
Dredging began in July 1997 on key channels and berths in Port Newark and Elizabeth and in the
Port Jersey channel on the Bayonne peninsula. A new underwater containment area is being created
in Newark Bay to handle approximately 1.5 million cubic yards of the material. The State is
reviewing eight options for the short-term disposal of dredged materials in the containment area
through the year 2002. A review of long term disposal solutions that are economically feasible are
still being reviewed. Long term solutions will be crucial for the port if it to become the hub port of
the North Atlantic coast. It is estimated by the Port Authority the container traffic could grow to
four million units by the year 2010.
PORT ELIZABETH/NEWARK
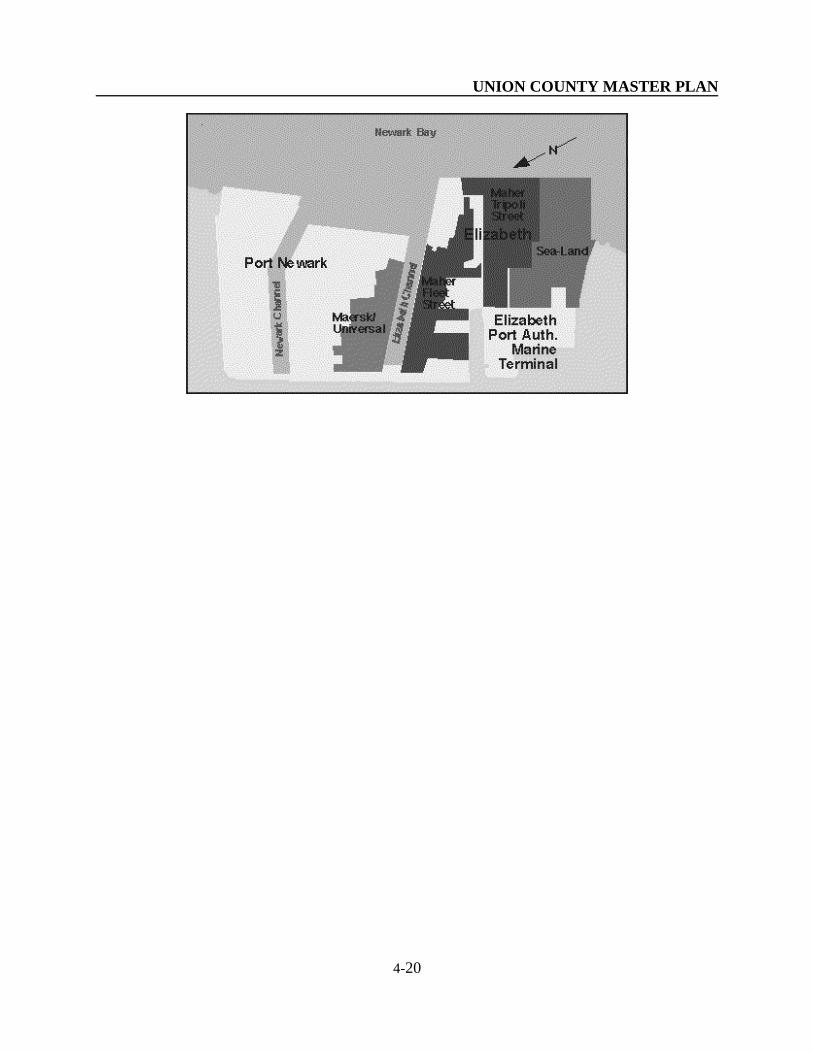
UNION COUNTY MASTER PLAN
4-20

UNION COUNTY MASTER PLAN
5-21
UNION COUNTY MASTER PLAN
5-1
ECONOMIC DEVELOPMENT PLAN
This plan presents an analysis of Union County’s economy. It begins with the geographic location
and situation of the County and reviews economic activities following the 1981-82 recession,
through the 1993 economic recovery, to the present. The plan presents the factors that have affected
and will continue to affect the economy including population, housing, income, labor force and labor
supply/demand. The current economic developments and plans by industry within and adjacent to
the County are discussed such as the Jersey Gardens Mall and the Cross-County Rail Project.
Finally, the plan projects the future economic outlook for Union County into the next Century.
Union County, with an estimated 1994 population of 496,230, distributed over only 103 square
miles, is one of New Jersey's most densely populated counties: 4,800 persons/sq. mi. (In comparison
there are 1,066 persons/sq. mi. in the State.) Union County is also one of the most historic areas in
the state. Settled in 1664, it become the first capitol of the Province of New Jersey, and now
contains many historic sites associated with important events throughout its centuries of
development. The county's major city is Elizabeth, the fourth largest city in the State. Union
County is part of the Newark Metropolitan Area which also includes Essex, Morris, Sussex and
Warren counties.
Union County is a vital part of New Jersey’s transportation hub, directly linked with the
transportation facilities of the state through several major rail lines and an extensive network of
highways. U.S. Routes 1 & 9 and 22, the New Jersey Turnpike, the Garden State Parkway and
Interstates 78 and 278 all transverse Union County. The Goethals Bridge links the County to the
New York City area through Staten Island. Railroad lines serving Union County include the Amtrak
Northeast Corridor Line, Raritan Valley, North Jersey Coast, Gladstone and Morristown lines. In
addition, two major transportation centers are located partly within Union County: Newark
International Airport and Port Elizabeth. Newark International is one of the nation's fastest growing
airports, and Port Elizabeth has container-ship facilities that make it the busiest port on the East
UNION COUNTY MASTER PLAN
5-2
Coast and one of the busiest shipping ports in the nation.
Many leading companies have facilities in Union County including two of the world's largest
corporations, AT&T and General Motors (GM). In Berkeley Heights is located AT&T’s recent
corporate spinoff of its research and development company, Lucent Technologies. In Linden, GM
operates a vehicle assembly plant that produces both light trucks and sport utility vehicles. The
pharmaceutical industry, the largest manufacturing industry in New Jersey, is well represented in the
County by Merck & Co. in Rahway, Novartis in Summit and Schering-Plough Corporation in Union
Township. The Tosco Corporation Refinery in Linden is the largest refinery on the east coast.
Union County Employment - 1983 to 1993
The following analysis is based on data collected from private establishments covered under New
Jersey's Unemployment Insurance (UI) Law. This analysis compares data for the cyclical period
from 1983, an economic recovery year following the 1981-1982 recession, to 1993, also a year of
economic recovery following the 1990-1991 national recession. This ten-year span ran the gamut
economically in the State, ranging from boom to bust to recovery. The greatest job growth in New
Jersey's history occurred during the 1980s (April 1982-March 1989) that was followed by the
longest and severest contraction since the Great Depression (March 1989-May 1992). While the
turnaround began in the Spring of 1992 and expansion continued into 1993, it was not until 1994
that the recovery gained momentum, creating more jobs than any year since 1988. The recovery
slowed in 1995 and has remained steady in 1996 and has continued into 1997.
During the mid- and late-1980s, as most of New Jersey experienced economic expansion, Union
County's older and more fully developed industrial base was in decline. Employment in the county
reached a peak level of 237,423 in 1985 before falling each year to the low point in 1993 of 198,925.
There was positive job growth between 1993 and 1994. In 1995 and 1996 the number of jobs has
remained steady. For the 1985-to-1996 period total private-sector employment in Union County
decreased by 37,498 or 15.8 percent. This was in comparison with the statewide gain of 6.4 percent

UNION COUNTY MASTER PLAN
5-3
over the same period (See Table 5-1).
Union County's negative rate of growth (-15.8%) was driven by continuous losses in the once
dominant manufacturing industry division, by downturns in several service-producing industries and
by the county's mature state of overall development.
TABLE 5-1
PRIVATE SECTOR COVERED JOBS
SELECTED YEARS 1980 - 1996
UNION COUNTY AND NEW JERSEY
1980
1985
1992
1993
1994
1995
1996
Union County
229,614
237,423
199,354
198,925
203,968
199,946
199,925
New Jersey
2,506,358
2,833,177
N/A
2,872,495
2,928,870
2,972,129
3,015,429
Source: New Jersey Department of Labor
In the County urban areas, particularly in Elizabeth, Linden and Plainfield, stringent environmental
regulations, changing market demands and obsolete physical plants continued to be main reasons for
the decline in the number of manufacturing jobs. In the early 1990s, downsizing in the defense
industry, cautious consumer spending and the recessionary economic cycles experienced by many
international trading partners also affected factory employment levels. From 1983 to 1993,
manufacturing employment fell by 26,100 or 35.2 percent (versus a 27.5 percent decline in the
State). More than 215 manufacturing employers left the County. Four of the County's seven largest
industrial classifications accounted for over half of the total loss in factory employment: electrical
machinery (-3,900), fabricated metals (-3,500), chemicals (-3,300) and industrial machinery (-2,700).
Employment in chemicals, the County's largest manufacturing industrial classification, remained
fairly consistent until 1993 when the impact of plant closings and corporate downsizings began.
Contributing to the employment loss in the County were the closings of GAF (-200) and American
UNION COUNTY MASTER PLAN
5-4
Cyanamid (-250) both in Linden, and the downsizing at Ciba-Geigy (-400) in Summit.
Construction employment dropped slightly (-900 or -9.4%) in Union County over the ten-year
period, compared with a small statewide gain of 3.0 percent. The level of employment remained
near its 1987 peak level (11,800) through 1989. During the recession, construction employment
was particularly hard-hit, falling to its lowest level in a decade in 1991 (8,700) before rebounding
slightly in 1992 and 1993. The level of employment in New Jersey peaked in 1988 and, like Union
County, began to fall due to overbuilding and the 1990-1991 recession before beginning to rebound
in 1993 and 1994.
The service-producing sector, which accounted for seven out of every ten jobs in Union County in
1993, declined by 3,100 jobs or -2.2 percent from 1983 to a level of 138,700 in 1993. This was in
sharp contrast to the State's 26.3 percent gain over the same ten-year span.
Over the 1983-1993 period, the services subcategory, which includes health, business, legal, personal
and amusement services, including cultural tourism and recreation, was the County's largest source
of employment, increasing by 8,400 or 15.9 percent (versus 46.1% statewide). This was the only
industry category to add jobs in the service-producing sector over the period. Employment in this
division increased fairly steadily from 1983 until reaching its peak level of 63,600 in 1990. The
effects of the 1990-1991 national recession resulted in employment losses in 1991 and 1992 before a
small rebound occurred in 1993. Health services, the largest industry in the services subcategory,
has been an area of sustained employment growth (37.8%) driven by changing demographic trends,
increasing health care expenditures and advances in medical technology over the decade.
Employment in the wholesale/retail trade industry division, the county's third largest source of
employment declined by 9,400 or 16.8 percent from 1983 to 1993. In comparison, New Jersey
registered a 10.6 percent gain in comparable employment during the same period. After peaking in
1988 (58,700), trade payrolls in Union County fell in 1993 to 46,500, the lowest level of the
previous decade and 9,400 (-16.8%) fewer jobs than in 1983. Financial problems led to leveraged
buyouts, mergers and store closings (Macy's and Lord & Taylor for example) followed by a

UNION COUNTY MASTER PLAN
5-5
prolonged period of reduced consumer spending which began with the 1990-1991 recession and
continued through 1993. However, the development of warehouse clubs, off-price and retail
superstores in the County became one of the few bright spots for employment growth in the
post-recession period and is expected to increase in the coming decade as older industrial and retail
facilities are redeveloped for such facilities..
Over the 1983-1993 period, employment in the transportation/communications/public utilities
industry division remained relatively unchanged (-250 or -1.3%) compared with an increase of 15.5
percent in the State. During this decade, all of Union County's job loss was in the transportation
component employment which peaked in 1985 at 17,300 and then generally declined, reaching the
period's lowest point (13,300) in 1993. From 1987 to 1989, employment drastically dropped at the
County's port facilities, primarily because of cutbacks at Sea-Land, Inc., a major port employer.
Nevertheless, over the long term, the County's employment in transportation is expected to be
enhanced by Newark International Airport and Port Elizabeth, one of the largest container terminals
in the world and is the home of The Port Newark-Port Elizabeth US-Foreign Trade Zone, the largest
in the country.
From 1983 to 1993, employment in the finance/insurance/real estate industry division decreased by
1,900 (-13.5%) in Union County to a level of 11,900, compared with a substantial increase of 30.8
percent in New Jersey. The number of jobs in the County increased annually from 1983 to a peak in
1986 (15,500). Employment levels stabilized near the peak level through 1988 before
beginning to slide, with a decline of 3,400 jobs from 1988 to 1993. The drop in employment was
largely the result of several factors: overbuilding in the office/commercial component during the
mid-1980s; the softness in the County's real estate market in the late 1980's and early 1990's; and the
banking crisis that not only impacted banks but also insurance companies (including the Mutual
Benefit Insurance Company which was placed in receivership) and realtors in New Jersey.
UNION COUNTY MASTER PLAN
5-6
Comparing the 1993 distribution of jobs by industrial classification in the County with the State,
Union County's percentage of total manufacturing jobs of 24.5 percent far exceeded that of the State
at 18.1 percent. Among selected factory-type industries, the County had higher proportions of its
jobs in fabricated metals, industrial machinery and chemicals than the State, while the county had
smaller shares of factory jobs in electronic equipment and apparel. In Union County, employment in
the chemical industry is concentrated in production rather than in research or corporate
administration as in other areas of the State. In the construction industry division, Union County had
a higher proportion of jobs than the State, 4.6 percent and 4.1 percent respectively, in 1993.
The proportion of total service-producing employment covered by unemployment insurance to the
total of covered jobs was smaller in the County (70.9%) in 1993 than in the State (77.2%). The
County had a smaller share of jobs than the State in all major individual industry divisions, except in
transportation/communications/public utilities where Union County had a high concentration of
trucking, waterway and air transport employment.
Economic and Labor Market Indicators
Population
Union County has been experiencing a declining resident population since the mid-1970's. The
County is a highly developed, urban/suburban county with 21 municipalities including the historic,
urban centers of Elizabeth and Plainfield, to more suburban municipalities such as Westfield,
Cranford and Summit, which developed along commuter rail lines serving the County. According
to the 1990 Census, the population of Union County decreased from 504,094 to 493,819 between
1980 to 1990, a loss of 10,275 or 2.0 percent of the population. This compared to an increase of 5.0
percent for the State. The County population loss was primarily due to out-migration rather than to
natural decrease (deaths vs. births). In fact, between 1980 and 1990 there was a natural increase of
15,584 resulting from 65,262 births and 49,678 deaths. See Table 5-2. Union County ranked
seventh among New Jersey's 21 counties in total population in 1990, down from fifth place in 1980.
TABLE 5-2
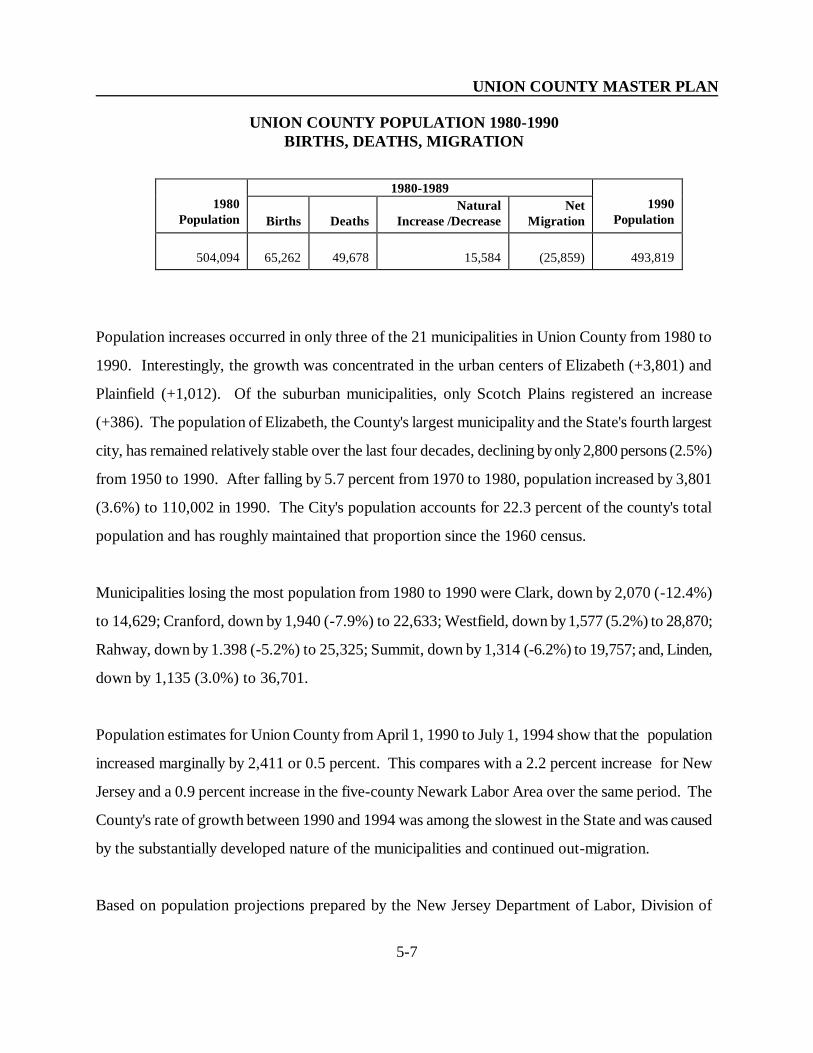
UNION COUNTY MASTER PLAN
5-7
UNION COUNTY POPULATION 1980-1990
BIRTHS, DEATHS, MIGRATION
1980
Population
1980-1989
1990
Population
Births
Deaths
Natural
Increase /Decrease
Net
Migration
504,094
65,262
49,678
15,584
(25,859)
493,819
Population increases occurred in only three of the 21 municipalities in Union County from 1980 to
1990. Interestingly, the growth was concentrated in the urban centers of Elizabeth (+3,801) and
Plainfield (+1,012). Of the suburban municipalities, only Scotch Plains registered an increase
(+386). The population of Elizabeth, the County's largest municipality and the State's fourth largest
city, has remained relatively stable over the last four decades, declining by only 2,800 persons (2.5%)
from 1950 to 1990. After falling by 5.7 percent from 1970 to 1980, population increased by 3,801
(3.6%) to 110,002 in 1990. The City's population accounts for 22.3 percent of the county's total
population and has roughly maintained that proportion since the 1960 census.
Municipalities losing the most population from 1980 to 1990 were Clark, down by 2,070 (-12.4%)
to 14,629; Cranford, down by 1,940 (-7.9%) to 22,633; Westfield, down by 1,577 (5.2%) to 28,870;
Rahway, down by 1.398 (-5.2%) to 25,325; Summit, down by 1,314 (-6.2%) to 19,757; and, Linden,
down by 1,135 (3.0%) to 36,701.
Population estimates for Union County from April 1, 1990 to July 1, 1994 show that the population
increased marginally by 2,411 or 0.5 percent. This compares with a 2.2 percent increase for New
Jersey and a 0.9 percent increase in the five-county Newark Labor Area over the same period. The
County's rate of growth between 1990 and 1994 was among the slowest in the State and was caused
by the substantially developed nature of the municipalities and continued out-migration.
Based on population projections prepared by the New Jersey Department of Labor, Division of
UNION COUNTY MASTER PLAN
5-8
Labor Market and Demographic Research, the County population is expected to remain relatively
stable between 1990 to 2005 and then decline slightly by 2010; a demographic pattern consistent
with other older, industrialized counties in the northeastern region of New Jersey. During the period
1990-2005, the State population is projected to increase by 10.0 percent rate. The age group 40-59
that contains members of the “baby boom” generation (persons born between 1946 and 1964) should
continue to show the largest change as this population ages and begin to leave the labor force. By
2010, the 40-59 age group is projected to show the largest growth increasing by 32,300 (28.3%) in
Union County compared with 39.8 percent in the State. Also of concern, a projected decline in the
number of traditional labor force entrants (20-29 year old age group) will intensify throughout the
1990's. From 1990 to 2010, the drop in this age group, the "baby-bust” generation, is projected to
be greater in the County than in the State (-21.2% versus -11.1%). Similar to the statewide
projections, minorities are expected to account for the majority of the population growth in Union
County by 2010.
Housing
Data from the 1990 Census show that despite the decline in population in Union County from 1980
to 1990, the number of housing units increased during the decade by 2.3 percent; thus the population
per household declined. In comparison, the housing stock in New Jersey increased by 10.9 percent
from 1980 to 1990. In Union County the greatest increase was 1,029 housing units (15.2%) in
Scotch Plains, however, all but four communities increased their supply of housing. Fanwood,
Garwood, Plainfield and Rahway posted losses totaling 187 units which accounted for only about 1.0
percent of the total housing stock in the county. New housing units in five municipalities accounted
for 80.7 percent of the County's gain from 1980 to 1990. Following Scotch Plains, Union Township
increased its housing stock by 978 units; Elizabeth by 702 units; Springfield by 363 units; and Linden
by 314 units.
There was less planned residential building activity in the County than in other parts of the State
during the 1980-1990 period due to the limited amount of developable land, the relatively high cost
of land and population losses. From a level of 562 in 1983, the number of authorized residential
UNION COUNTY MASTER PLAN
5-9
units rose to a peak of 1,144 in 1985 but dropped to about half that level from 1986 through 1988.
In 1989 and 1990, planned homebuilding in Union County dropped to the lowest level of the entire
1983-1993 period, to 264 units in 1989 and 170 units in 1990. The combined effects of the
recession, low consumer confidence and restrictive lending practices, all contributed to the decline in
the level of homebuilding. In 1991, a small rebound in planned homebuilding activity (518 units)
began in the County. This was a year ahead of the Statewide reversal that began in post-recession
1992. Activity remained relatively stable in 1992 (458 units) before increasing to 785 units in 1993.
Since 1993, however, the number of residential building permits has been decreasing. In 1994, 443
building permits were issued; in 1995 (314) and in 1996 (267).
Income
In spite of a declining population, the Union County total personal income of $16,036,957 accounted
for 6.7 percent of the State's total personal income in 1995. From 1982 to 1995, total
personal income grew at a slower rate in Union County (102.8%) than in the State (129.5%). This
was primarily the result of population losses, changing types of employment (industrial to services)
and relatively high unemployment during the period.
Per capita personal income in Union County was $32,285 in 1995, up by 106.0 percent from 1982,
compared with an increase of 114.6 percent for the State. Of the State's 21 counties, Union County
ranked 9th highest in per capita personal income and was $2,344 higher per capita than the State
level of $29,941 in 1995.
Labor Force1
1 Readers of the following analysis of labor force trends in Union County are reminded that the labor
force estimates for 1990, 1991, 1992 and 1993 have been revised to 1990 Census population
controls and to a Census undercount adjustment and are not comparable with those before 1990.
Also, estimates for 1994 and later are not comparable to prior years due to a major revision of the
monthly household survey by the U.S. Department of Labor's Bureau of Labor Statistics (BLS).
UNION COUNTY MASTER PLAN
5-10
The labor force in Union County in the early 1990's experienced a relatively high rate of
unemployment. For the 1990-to-1992 period, the annual average unemployment rate in Union
County increased from 4.6 percent in 1990 to 9.5 percent in 1992 (fourth highest in the northeastern
region). In 1993 the rate dropped to 7.4 percent. Despite the diverse economy in Union County,
substantial job losses occurred in every industry (with the exception of transportation/
communications/public utilities), which contributed to the overall decline during 1990-1993.
Economic restructuring and downsizing affected blue and white collar workers. Resident workers
laid off from manufacturing and construction jobs in the County and the surrounding areas along
with the high rates of unemployment in the cities of Elizabeth and Plainfield also contributed to the
high unemployment rate within the County.
Union County's rate of unemployment averaged 6.8 percent of the labor force in 1994, a rate slightly
below the five-county Newark Labor Area of 7.0 percent. In comparison, the State rate was 6.8
percent for the same period. During 1994 the unemployment rate in Union County fluctuated but
generally moved downward after a peak of 8.4 percent in March. This pattern was consistent with
the State as a whole. In the second half of 1994, unemployment rates consistently moved lower
reaching a low in December of 5.7 percent. As noted in the footnote for this section, unemployment
rates in 1994 are not comparable to prior years because of major changes in the monthly household
survey utilized by the U.S. Department of Labor's Bureau of Labor Statistics (BLS) to calculate
unemployment rates.
In 1994, almost 75 percent of the County's suburban municipalities had unemployment rates below
the State level. In the communities of Berkeley Heights, Cranford, Fanwood, New Providence and
Summit, unemployment rates averaged less than 4.0 percent in 1994, but the overall County statistics
are greatly affected by the cities of Elizabeth and Plainfield. In 1994, over one-third of the County's
unemployed lived in Elizabeth where the unemployment rate was 11.6 percent, the highest rate in the
county and sixth highest among larger municipalities (population over 50,000 persons) in the State.
The City of Plainfield, the third largest municipality in the county, posted an annual average
unemployment rate of 10.2 percent in 1994. The number of unemployed in these two cities alone

UNION COUNTY MASTER PLAN
5-11
accounted for 48.0 percent of the total unemployed in Union County. While still relatively high, the
1994 unemployment rates in Elizabeth and Plainfield were the lowest since 1991.
In Union County, Elizabeth, Linden and Plainfield qualify as Labor Surplus Areas or areas of high
unemployment where employers are given preference when bidding on Federal contracts. In 1985,
portions of Elizabeth, Plainfield and Hillside (1996) were designated by the New Jersey Urban
Enterprise Zone Authority as Urban Enterprise Zones (UEZ). The UEZ's, which are administered by
the New
Jersey Department of Commerce, are designed to attract and to retain businesses within the zones
by offering special benefits, including :
Qualified retailers may charge 50 percent of New Jersey sales tax on “in person” purchases;
Sales tax exemptions for materials and for tangible personal property;
A one-time corporation tax credit of $1,500 for the full-time hiring of residents of a city where
a Zone is located who have been unemployed or dependent upon public assistance for at least 90
days or
Corporation tax credit of $500 for hiring resident within the zone, within another zone or within
a qualifying municipality
Subsidized unemployment insurance costs, for certain new employees;
An eligible firm may receive an incentive tax credit of 8 percent of investment in the Zone by an
approved “in lieu” agreement;
Labor Supply/Demand
A number of factors affect the relationship between labor supply and demand within a given labor
market. The low unemployment rates during much of the 1980's were evidence of a scarcity of
labor: most qualified workers were able to find work. During the recession in the late 1980's the
demand for labor decreased which resulted in an increase in unemployment and an increase in the
supply of labor. The structural change in the economy, which trended from manufacturing to a more

UNION COUNTY MASTER PLAN
5-12
diverse, service-oriented economy, will continue to affect the County labor force.
The supply of labor in Union County is greatly affected by the commuting patterns of County
residents and the easy accessibility of worksites within the County to non-County residents.
According to the 1990 Census, 70.0 percent of the County resident labor force (173,906) aged 16
years and older reported to worksites within the Newark Primary Metropolitan Statistical Area
(PMSA) which includes Essex, Morris, Sussex and Union Counties. Approximately 52.0 percent of
these workers were employed in Union County. Of those residents reporting to worksites outside
the PMSA, 73,300 or 30.0 percent of the working population, an estimated 17,000, 7.0 percent
commuted to jobs in New York City. Other New Jersey counties which attracted Union County
commuters included Essex (35,500, or 14.4%), Middlesex (24,400, or 9.9%), Somerset (11,200 or
4.5%) and Hudson (6,600, or 2.7%).
Union County's diversified economy and excellent transportation network also attract workers from
outside the County. According to the 1990 Census, an estimated 85,600 workers commuted to
Union County from nearby New Jersey counties. Six neighboring counties provided the greatest
number of incoming commuters; Middlesex (26,800), Essex (26,200), Somerset (11,800), Morris
(8,800), Hudson (5,100) and Bergen (4,000).
Economic Developments and Future Economic Development Plans
Manufacturing
Manufacturing jobs in Union County will continue to be affected by companies corporate decisions
pertaining to existing or planned facilities moving in the County, particularly those in Elizabeth.
Ritter-Sysco Foods Corp., a major national distributor of food to corporate and institutional clients
moved from its outdated Elizabeth distribution facility to a 345,000-sq. ft. warehouse building in
Jersey City (Hudson County) in 1994. Most of the company's 430 employees at the Elizabeth facility
UNION COUNTY MASTER PLAN
5-13
transferred to the new location. In addition, Thomas & Betts moved its Elizabeth-based production
of electrical fittings to company locations in Canada and the South in the spring of 1995 with a loss
of 200 jobs.
The pharmaceutical industry, a long time mainstay for both the State and County economies,
continue their bid to be competitive but have shown mixed results from a County perspective with an
upgrade of facilities but loss of jobs. Both Merck & Co. (Rahway) and Schering-Plough (Union
Township/Kenilworth) made substantial investments to upgrade their research and development
facilities over the past few years. Merck & Co. opened two new research and development
laboratories at the P. Roy Vagelos Research and Development Center on the company's Rahway
campus. These were a 60,000-sq.ft. lab for the development of safe and environmentally sensitive
chemical processing for drugs under development and a 100,000 square foot biological supply
laboratory and medical waste incinerator. In early 1995, Schering-Plough received FDA approval to
begin production at its new $30-million clinical production facility in Union Township. However,
competition driven by cost containment incentives within the health care industry has intensified and
so have announcements of corporate downsizing and mergers. Chase Pharmaceutical, a Newark-
based manufacturer, moved its operations and 210 jobs to North Carolina in March, 1996. In April
1996, Sandoz and Ciba agreed to the merger of the two Basel-based Swiss enterprises; the largest
corporate merger in history. The merged company became known as Novartis.
Transportation/Communications/Public Utilities
Payrolls in the transportation/communications/public utilities industry division, especially the
transportation component, will benefit from ongoing and proposed redevelopment projects at
Newark International Airport, Port Elizabeth and the surrounding area. The “Portway” project
proposed by the New Jersey Department of Transportation involves a number of related
transportation projects within the Newark-Elizabeth Seaport-Airport complex and adjacent industrial
areas. The project is being designed to provide traffic congestion relief, safer operations, improved
air quality, more efficient intermodal transfers, local economic development, job retention and
stronger links to the global economy.

UNION COUNTY MASTER PLAN
5-14
Monorail
The construction of the $378-million, 1.9 mile monorail line at the Newark International Airport,
which opened in May 1996, is the first monorail in the New York-New Jersey Metropolitan Area. It
links seven stations within the airport to carry passengers between the three main terminals, the
remote parking lots and the rental car area. A light rail transit system known as the
“Newark/Elizabeth Rail Link” connecting the Airport with the downtown areas of Newark and
Elizabeth, providing 12 stops along its route, is currently being studied. Possible extensions to
Plainfield and Summit are also being considered. One additional rail study, the Heritage Light Rail
System, would connect downtown Elizabeth with historic sites and with the Jersey Gardens Mall.
Newark Airport Improvements
The Newark Airport completed a $58 million retrofitting for an air cargo building in 1995. Federal
Express is the major tenant in the 210,000-sq. ft. terminal along with Delta Airlines, Airborne
Express and EVA Airways. A $93 million runway extension project was approved in February 1997
by the Port Authority. The project expansion will improve airport operations and flexibility.
Port Elizabeth Improvements
Port Elizabeth continues to expand its cargo volume which includes bulk cargo, auto and ship to rail
cargo handling. The Port is maintaining its market share and continues to be the busiest Port on the
East Coast as of 1996. An Express Rail facility was recently constructed at the Port. The facility is
a daily rail service that connects the Port and Union County to all Midwest and Canadian markets.
Legislation was recently signed allocating $32 million to begin the Port dredging project. The
dredging of the Elizabeth waterway corridor is critical for continued marine commerce access to
Port Elizabeth and Newark.
Transportation Development District
The New Jersey Department of Transportation recently approved an application in 1997 by Union

UNION COUNTY MASTER PLAN
5-15
County for a $300,000 grant for a “Transportation Development District” (TDD). This planning and
implementation project is envisioned to provide solutions to many of the infrastructure needs in the
Port area. It will concentrate on improvement of accesses for rail and truck and adjacent major
commercial and retail development
Intermodal Freight System
The Union County Intermodal Freight System Plan is a strategy to revitalize the Rahway Valley,
Staten Island and other rail line segments of the County. This will enable the County to offer new
transportation and distribution options, such as Intermodalism, Warehousing, Value Added Services,
and Logistic Management, and to expand links to the global marketplace. The first phase of the plan
will be a Reconstruction and Rehabilitation Phase to begin in 1998. A marketing plan will then be
developed over the next two years that is designed to assist rail operators to determine businesses to
be served and to work with local officials in addressing community concerns relative to the
resumption of rail services. The intermodal freight system is designed to generate business retention,
business expansion, new markets and potential creation of more than 1,000 new jobs on the initial
rail line segments.
Cross-County Rail Link Project
The Cross-County Rail Project is a plan to improve east/west public transit through the County. The
County has recommended a seamless transit route from Plainfield to Elizabeth Port with access to
the Newark Airport Monorail System. The County has secured $300,000 in funding from the
Federal Transit Administration (FTA) to conduct a planning and feasibility study in this corridor. The
impact of the plan is projected to provide expanded employment opportunities in the revitalized Port
Area; an expanded connectivity with Newark Airport and the developing mega-mall retail area in
Elizabeth; and relief of traffic congestion in the Plainfield-Elizabeth corridor, the Port area and along
Routes 1 & 9.
South Avenue Corridor Study
Another important study to expand redevelopment opportunities is the South Avenue Corridor

UNION COUNTY MASTER PLAN
5-16
Study. This study will examine both North and South Avenue intersections and recommend traffic
flow improvements in this congested corridor as well as identifying redevelopment opportunities.
The data collected from this study will support the effort to re-establish rail transit service from
Plainfield to Elizabeth and the redevelopment centers in Elizabeth Port. Another contribution to
improving the corridor will be the ITS (Intelligent Transportation System) project that will be
computerizing the traffic signalization system along South Avenue.
Retail
Several large retail projects which are expected to create thousands of new jobs are being
implemented in Elizabeth. The largest of these projects began construction in 1997 on a 166-acre
site located in the city's Urban Enterprise Zone near Exit 13A. The OENJ Corp. is developing a
$320-million complex consisting of a 1.2-million square foot retail discount mall with 250 mall
shops, 12 major anchor stores and 18 restaurants. The project is known as the “Jersey Gardens
Mall” is expected to create an estimated 1,700 construction jobs and over 5,200 permanent jobs.
Elizabeth Urban Enterprise Zone
Retail expansion in Elizabeth’s Urban Enterprise Zone has been and will continue to be a major
source of job growth. Most notably, the Elizabeth Center at Exit 13A, a three-building complex
developed by IKEA, is planning future expansion.
Route 22 Corridor
Retail development is also expected to occur along the Route 22 retail corridor in Union County
that has attracted a number of superstores including the Take Good Care health care superstore (40
jobs), a newcomer that opened in Springfield Township in April 1996.
Route 1 & 9 Corridor
Preliminary plans were being finalized in 1997 for a $150-million retail and entertainment complex
on a portion of the Linden Airport. The north side of the field is planned to be developed for a new
hotel and conference center containing restaurants, movie theaters, and retail stores.
UNION COUNTY MASTER PLAN
5-17
Cultural Tourism Development
By the dawn of the 21st century, tourism is expected to become the leading retail industry in the
United States. More income will be generated by cultural tourism than any other component of the
tourism industry.
According to Longwoods International, New Jersey’s tourism generated $24.6 billion in total
expenditures in 1996. Tourism spending impacts a variety of retail and service industries including
accommodations, dining, travel, entertainment, and entertainment needs that would otherwise be
sought elsewhere. Nurturing these quality of life resources can make a county an ideal place in
which to live, work and visit.
State planners envision that within the next ten years, tourism will be recognized as a vital
component of the state’s economy, and the state will also be recognized for the breadth of its
tourism offerings. Additionally, the economic and community benefits of tourism will be more
integrated in urban and rural development strategies.
Union County, which has one of the longest (334 years) and riches histories in the United States, has
the resources to develop its cultural tourism potential. Sites related to royal government, the
American Revolution, development of the federal government, State government, Victorian
suburban development, inventions, industrial innovations, immigration and more are found in Union
County. In addition, arts initiatives are already in place, several historic sites (Liberty Hall in Union
and Merchants and Drovers Tavern in Rahway) expect to open first-class museums by the year 2000,
the Union County Arts Center, Westfield Symphony Orchestra, NJ Center for Visual Arts, are
flourishing, other smaller theaters and museums are developing, and the County has a first class
parks system. These are factors that represent a good start to the development of the cultural
tourism industry here in Union County.
The County seat and Union County has an early history that rivals that of Virginia and
Massachusetts. The basic elements for cultural tourism development focusing on this period of

UNION COUNTY MASTER PLAN
5-18
history exist in Elizabeth, which can be marketed as the colonial capital of New Jersey and an
important contributor to the formation of national and state government. In addition to the Belcher-
Ogden Mansion, the Bonnell House, Boxwood Hall, the Presbyterian Church and the St. John’s
Parsonage offering cultural tourism opportunities, Liberty Hall, located just over the Elizabeth city
line in Union, is being developed as a museum/educational complex that will open April 1999. The
City of Elizabeth has recently restored the Central Railroad Station and is anticipating restaurant
development in an area undergoing multi-use redevelopment.
Elizabeth has potential to figure in the cultural tourism industry. A historic tourism package, which
would include Liberty Hall, a County museum comprised of Belcher-Ogden and Bonnell House,
Boxwood Hall, and the Presbyterian Church would be a principal attraction to lure heritage tourists
into the city.
Tourism development in the County would be bolstered by existing efforts in Rahway and Plainfield.
In Rahway, restoration and development of the Union County Arts Center is progressing at a steady
rate. The City of Rahway has created an Arts Guild that is restoring a nineteenth century library, and
has adopted ordinances to benefit artists and craftsmen and antiques stores in the business district.
The Merchants and Drovers Tavern has received major federal and state grant funding. It is
currently undergoing development as a museum of early tavern life and stagecoach transportation. A
1999 opening is planned. The Doctor William Robinson House Museum in Clark, the best preserved
seventeenth century building in New Jersey, could be part of a cultural tourism package for the area.
New Jersey Transit is nearing completion of a multi-million dollar station.
Plainfield is actively soliciting designation as the site of the New Jersey Railroad and Transportation
Museum. The city, with architecturally significant civic and religious buildings and private homes,
has seven historic districts. The Drake House Museum, with colonial and Victorian collections, has
the potential for becoming an outstanding facility. House tours, band concerts, orchestral
performances and a variety of other arts and history events are regular occurrences in the city. New

UNION COUNTY MASTER PLAN
5-19
Audiences for Plainfield, the emerging arts organization representing cultural groups and individual
artists, recently presented their Action Plan 2000 detailing actions needed to implement the vision of
Plainfield as a hub of cultural activities for the area.
Support of tourism initiatives in Elizabeth, Rahway and Plainfield should have significant effect
throughout the communities of Union County. Complementary historic sites in Hillside, Berkeley
Heights, New Providence, Summit, Union, Springfield, Scotch Plans, Fanwood, Westfield, Cranford,
Roselle, Mountainside will also become part of the cultural tourism package drawing tourists initially
attracted to tourism attractions in the larger communities out to the surrounding communities.
Special weekend events organized by county, local governments, chambers of commerce, non-profit
organizations and civic groups will give visitors reason to come into Union County on a regular
basis. In additional to history and arts events, attractions such as bike races and ethnic festivals will
attract visitors. The Union County Park System, one of the state’s finest, has swimming pools, golf
courses, riding stables, a skating rink, a large reservation that includes a nature and science center as
well as historic sites, and other amenities that should be marketed as part of a tourism package.
Union County is favored by excellent rail, air and highway transportation, facilitating access to sites
and events.
Other Construction
Several recently completed and ongoing development projects helped bolster employment in the
County construction industry division. In Elizabeth, a three-year, $58-million expansion and
renovation project on Saint Elizabeth Hospital's patient towers was completed in 1994. The
$328-million expansion of the New Jersey Turnpike from Exit 14 in Newark to Exit 11 in
Woodbridge (Middlesex County) will continue through 1999. Kean University in Union Township
spent $7 million to renovate the Student College Center in 1997.
Other construction projects under way in 1997-1998 include a major redevelopment site in the heart
of the City of Plainfield business district. The former Tepper's Department Store is being

UNION COUNTY MASTER PLAN
5-20
redeveloped into "The Green at Plainfield," a $50-million, multi-use, barrier-free project. Plans call
for two floors of outlet-type, retail stores at and below street level with one floor of office space on
the second floor and, an estimated 200 "assisted living" housing units for senior citizens developed
on the upper floors.
In Elizabeth, the City Council awarded a development contract in 1996 to Sea Crest Enterprises for
the $100-million Midtown Redevelopment Project. The long-awaited redevelopment plan for this
20-acre site in downtown Elizabeth calls for restoration of the historic Central Jersey Railroad
Station, several hundred units of market-rate and multi-family housing, and a 40,000-sq. ft.
mixed-use, commercial building on Broad Street.
A new train station on the Raritan Valley Line, at Morris Avenue, named the Townley Station is
proposed in Union Township adjacent to Kean University, Schering-Plough and the Elizabethtown
Gas Company, Morris Avenue Complex. It will be designed to reduce congestion which has been
increasing along Route #82 (Morris Avenue) between the City of Elizabeth and Union Township. In
1997 the U.S. Congress approved $23 million in funding for construction of the station, retail
facilities and commuter parking facilities that will be operated by New Jersey Transit.
Economic Outlook
The overall rate of growth in Union County's economy through 2000 is expected to be relatively
modest, lagging the pace of recovery in the Northern New Jersey Region and the State as a whole.
While unemployment rates have improved, the pockets of chronic high unemployment in the
County’s urban centers will cause the County's overall unemployment rate to remain slightly higher
than the State in the coming year.
The New Jersey Department of Labor's Division of Labor Market and Demographic Research
prepared State and county industry and occupational projections for the year 2005. The last year of
UNION COUNTY MASTER PLAN
5-21
historic data used as input to the projections is the base year of 1990. While State analysts realized
that a recession was under way, they underestimated its length and severity, making it highly unlikely
that the projected total growth rates from 1990 to 2005 as well as the year 2005 job levels will be
realized. The projections, however, remain useful in pointing to direction of change and long-run
trends for specific industries and occupations which will be sources of job growth or decline as well
as geographic strengths and weaknesses during the 1990-2005 period.
Between 1990 and 2005, wage and salary employment in Union County is projected to remain
relatively stable, increasing by 5,600 or 2.2 percent, far below the 14.0 percent increase projected
for the State during the same period. Over the fifteen-year period, the County's annual growth rate
was projected to remain constant at 0.1 percent, one of the lowest in the State.
Job growth in Union County will be primarily dependent on the momentum and recovery of the
service based industry. The service-producing sector was expected to account for all of the net job
growth in Union County during the 1990-2005 period. Over the fifteen-year period, the services
subcategory was expected to grow by an estimated 17,200 jobs or 25.8 percent, with business and
health services accounting for much of this increase. This may be dampened by hospital mergers and
affiliations designed to address the growing managed care health insurance network. Another
industry division that was projected to expand during this period is transportation/
communications/public utilities (TCPU) up by 2,000 jobs or 9.8 percent. Employment growth in
TCPU should continue and will be paced by businesses involved in increased passenger and air cargo
volume at Newark International Airport and at the Port Newark/Port Elizabeth Marine Terminal and
related industries, including trucking. Employment in government and education was projected to
grow by 1,700 jobs. The finance/insurance/real estate industry division in Union County was
projected to remain stable at the 1990 level of 13,900 jobs through the projection period. The only
industry division projected to decline during this period was wholesale/retail trade, down by 3,100,
or -5.7 percent, by 2005 primarily due to Union County's substantially developed nature and
changing demographic trends. These projections, however, can change with the development of the
Elizabeth Urban Enterprise Zone and Redevelopment Project, the development of the Plainfield
UNION COUNTY MASTER PLAN
5-22
Urban Enterprise Zone and the Linden Airport retail and entertainment complex.
In the goods-producing sector, both the manufacturing and construction industry divisions were
projected to decline from 1990 to 2005. Construction jobs were expected to fall by 900 or 8.4
percent by 2005. Also, the long-term decline in the manufacturing industry division in Union County
should continue, losing another 11,300 jobs or 19.4 percent from 1990-2005, a continuation of
existing trends throughout the State.
In making projections, with a 1990 base year, this N.J. Department of Labor notes that the two
factors that most affected employment levels of major occupational groups were the growth rates of
specific industries and the changing occupational structure within industries. Job openings arise from
both new jobs and the need to replace workers who retire, change occupations or leave the area
labor force. In Union County, close to 80.0 percent of the average number of annual openings
projected between 1990 and 2005 were expected to be replacement jobs rather than new jobs.
Occupational employment projections for Union County through 2005 reflected the slow
employment growth projected for the County as a whole during this period. Of the eight major
occupational categories for which data were prepared, four categories in Union County were
projected to decline as opposed to only one statewide. In addition, in the occupational categories
where growth was projected for both the State and the County, the County's growth rates were
projected to significantly lag behind those of the State. The changing composition of the Union
County economy, the continued shift from manufacturing, and the elimination of middle management
and administrative jobs in County businesses were expected to be partially responsible for the
change.
Professional and technical (9,800 new jobs or 18.5%), and service (5,200 or 15.0%) occupations
were projected to register the highest rates of growth in the County and the State over the
fifteen-year period. The only other occupational categories projected to increase in Union County
were the executive, administrative and managerial (1,100 jobs or 7.7%) and gardening and animal

UNION COUNTY MASTER PLAN
5-23
care (300 or 22.2%) occupations. Reflecting the County's continued loss of manufacturing jobs, the
operators, fabricators and laborers category was expected to decline by an estimated 7,200 jobs
(-15.5%), a pace substantially ahead of the 2.4 percent loss projected for New Jersey. In a related
occupation, precision production employment in the county was projected to fall by 2,200 jobs
(-7.1%) compared with a projected increase of 7.3 percent statewide. Administrative support and
clerical occupations were also projected to decline by an estimated 2,050 jobs (-3.7%) reflecting the
nationwide trend toward corporate downsizing and office automation (e.g., word processing by
professional and less by clerical staff). Marketing and sales occupations in Union are also predicted
to decline (-0.7%) while advancing statewide by 17.2 percent during the projection period.