master plan for public postsecondary … · august, 2015 . 2 the louisiana public ... the number of...
TRANSCRIPT

Fourth Annual Review of the
Master Plan for
Postsecondary Education in Louisiana: 2011
“Improving, Innovating and Doing so Efficiently and Effectively”
Board of Regents
August, 2015

2
The Louisiana public postsecondary education community consists of the Louisiana Community and
Technical College System, the Louisiana State University System, the Southern University System, the
University of Louisiana System and several specialized units. The Board of Regents (BoR), a state agency
created by the 1974 Louisiana Constitution, coordinates all public postsecondary education in Louisiana.
Through statewide academic planning and review, budgeting and performance funding, research, and
accountability, Regents coordinates the efforts of the State's public colleges, universities and professional
schools, while representing the public postsecondary education community before all branches of
government and the public.

3
TABLE OF CONTENTS
Executive Summary ………………………………………………………………. 4
Background and Introduction ……………………………………………………… 6
Chapter 1: Goal 1 ………………………………………………………………. 9
Chapter 2: Goal 2 ……………………………………………………………… 22
Chapter 3: Goal 3 ……………………………………………………………… 33
Chapter 4: Summary and Analysis of Progress ……………………………………. 40

4
EXECUTIVE SUMMARY
In 2011, the Louisiana Board of Regents (BoR), through the development and implementation of
the Master Plan, advanced its vision for the future of postsecondary education by adopting the
following three broad goals:
1. Increase the educational attainment of the State’s adult population to the Southern
Regional Education Board (SREB) States’ average by 2025;
2. Invest strategically in university research; and
3. Achieve greater efficiency and accountability in the postsecondary education system.
The Plan outlines 17 objectives, over 70 activities and more than 85 performance measures to
achieve these goals. Through these goals, related activities and the measurable performance
metrics, the Plan assures that its implementation will be monitored, evaluated and reported
throughout its duration.
In 2012, the Master Plan was recognized by the U.S. Chamber of Commerce’s Institute for a
Competitive Workforce as a catalyst for creating a “policy environment that promotes
improvement and deserves recognition.” In the Chamber’s Leaders and Laggards: A State-by-
State Report Card on Public Postsecondary Education, Louisiana received an “A” for having
broad policies that foster student success and encourage postsecondary productivity. Louisiana
was recognized as a leader because of the concrete objectives and performance measures
contained in the Master Plan.
This is the fourth annual evaluation of the 2011 Master Plan. Subsequent annual evaluations will
be forthcoming through 2025, culminating in a long-term analysis of the fifteen year
implementation of the Plan.
Goal 1
Progress toward Goal 1 is evident in the increased preparation of high school graduates, the
increasing number of students who are participating in the Louisiana Transfer degree program,
and increasing graduation rates at public postsecondary institutions. In the fourth year of Master
Plan reporting, the percentage of high school graduates who completed the LA Core-4
Curriculum increased from a baseline level of 65.8% to 78.9%. The implementation of
compulsory ACT test-taking has made ACT composite score comparisons inconsistent, but from
an opportunity and access perspective, the 100% testing policy has given every public high
school student in the State the opportunity to gauge their college readiness. Additionally, the
number of high school students enrolled in postsecondary courses has increased 23.3%, from
18,551 in fall 2010 to 22,875 in fall 2014. At the postsecondary level, the number of students
who are participating in the Louisiana Transfer degree program has increased from 214 in fall
2010 (the first semester the degree program was offered) to 3,648 in fall 2014. Graduation rates
at Louisiana’s public postsecondary institutions are also on the rise, increasing from 5.7% to
7.8% at two-year institutions and from 42.2% to 48.9% at four-year institutions.
However, there are still measures that have shown little to no progress. While the overall
statewide 1st to 2nd year retention rate has remained relatively stable (74.5% in the baseline year
5
and 72.9% in the fourth year of Master Plan reporting), two-year and technical college students
continue to struggle with year-to-year and fall-to-spring retention. Of greater concern is that
enrollment of adult learners (those students age 25 and older) in postsecondary education courses
dropped 11.8% from a baseline level of 55,557 to 48,970 in year four of Master Plan reporting.
Goal 2
Goal 2 metrics have remained relatively stable, with several research metrics, particularly those
related to campus research expenditures, showing significant growth over baseline reporting. The
National Science Foundation’s (NSF) methodology for reporting expenditures from
industry/business sources has recently changed however, complicating comparisons of current
data with data submitted in previous years. The BOR recently replaced “Queen Bee”, the core
super computer purchased in 2007 for the LONI Research Network. Replacing this out-of-date
hardware with new state-of-the-art equipment has allowed research computation in Louisiana to
continue at a very high level, enabled a broad and diverse catalog of research, and provided a
peak performance of nearly 1.5 PetaFlops (over 30 times faster than Queen Bee). Unfortunately,
significant reductions to higher education’s state general fund appropriations have reduced
campuses’ discretionary funds to support faculty research projects, lab upgrades, start-up
packages, library acquisitions, and other critical elements in advancing the culture and practice
of state-of-the-art research.
Goal 3
Progress towards Goal 3 has occurred through the continued implementation and refinement of
the performance-based funding formula, participation in Complete College American (CCA)
reporting, the implementation of an annual academic program review process, and the continued
assessment of the BOR co-requisite pilot program. In addition, during the last four years of
Master Plan reporting, most institutions met their targeted GRAD Act goals, and were
subsequently awarded increased tuition authority and retained their performance funding.

BACKGROUND
&
INTRODUCTION

7
Development and Implementation of a Master Plan for Postsecondary Education in Louisiana
The benefits of postsecondary education to both the individual and the State are undisputed. For
the individual, postsecondary education provides intellectual and financial opportunities, which
pay dividends throughout life. For the State, economic growth is tied to citizens that are
employed and productive. A highly functioning postsecondary education system provides a pool
of skilled and talented workers who pay taxes and rely less on government services.
Additionally, research intensive universities attract highly-skilled and creative individuals as
well as provide the breeding ground for new inventions, patents, technology spin-offs and startup
companies. Postsecondary education is vitally important to both the individual and the State;
therefore, Louisiana must strengthen and continue to maintain a public postsecondary education
system that is adequately funded and accountable.
Article VIII, §5 D (4) of Louisiana’s Constitution requires the Board of Regents (BoR) to
“formulate and make timely revision of a master plan for postsecondary education…” Since
1976, the BoR has produced and implemented six master plans for public postsecondary
education in Louisiana.
In August 2011, the BoR adopted the Master Plan for Public Postsecondary Education in
Louisiana: 2011, outlining the long-term goals for the State’s colleges and universities through
2025. The vision outlined in the Plan was guided by the reality that Louisiana must raise the
educational attainment of its adult citizens if it is to compete successfully in the 21st century
world economy. The Plan also addressed the need to strategically invest in targeted research to
sustain and expand the State’s economic development. Finally, because of the significant role
postsecondary education plays in the State’s economy and overall well-being of its citizenry,
increased accountability was included as a specific goal and emerged as a common theme
throughout the entire Plan.
The Board of Regents advanced its vision for the future of postsecondary education by adopting
the following three broad goals:
1. Increase the educational attainment of the State’s adult population to the Southern
Regional Education Board (SREB) States’ average by 2025;
2. Invest strategically in university research; and
3. Achieve greater efficiency and accountability in the postsecondary education system.
To assess progress towards the three goals, the Plan contains 17 objectives, over 70 activities,
and more than 85 performance measures. This document is the fourth report on the State’s
progress in the implementation of the 2011 Master Plan. Subsequent annual evaluations will be
forthcoming through 2025, culminating in a long-term analysis of the fifteen year
implementation of the Plan. As with many strategic plans, the Master Plan is not a static plan.
Therefore, it is reviewed, revised, and reworked by the BoR staff to assess the effectiveness of
the objectives, performance measures, and activities. As such, staff may remove measures that
are no longer valid in the assessment of progress towards a specific objective or goal. Likewise,

8
staff may add measures, which more fully assess progress towards articulated objectives or
goals.
Many of the performance measures are quantitative in nature and are therefore tracked and
reported within this document in numeric fashion. Such measures are contained in tables
throughout the report. These tables display baseline and year 4 data as well as arrows to depict
status from baseline year to year 4.
It should also be noted that, in some cases, a decrease from baseline actually represents positive
growth, as is the case in the decline in the number of students requiring remedial education. In
such instances, a green arrow is displayed, despite the numeric decline. Additionally, an increase
from the baseline could represent a negative shift. An example of this would be an increase in
the number of high school graduates who scored below the ACT “cut score” in Math and
English. This increase denotes a negative change.
Moreover, in some circumstances, the fluctuations (both increases and decreases) from the
baseline to year 4 could be the result of policy, demographic, and/or economic changes. For
instance, a policy implemented in 2013 by the Louisiana Department of Education (LDOE)
called for compulsory ACT test taking in an effort to promote postsecondary readiness and
participation. This shift in State policy attributed to an increase in the proportion of students
taking the ACT. Consequently, with increased participation, there is a broader range of talents
taking the test. It is not surprising that the average composite ACT score has declined since this
policy was implemented in 2013.
There are also a handful of measures that, due to their nature, are reported in narrative form.
These qualitative or additional measures follow the tables of quantitative measures in each
section, as applicable.
- Yellow arrows indicate no change between
baseline year and year 4
- Green arrows indicate positive movement between baseline year and year 4.
- Red arrows indicate negative movement between baseline year and year 4

CHAPTER 1
Goal 1: Increase the educational attainment of the State’s adult
population to the SREB State’s average by 2025.

10
Goal 1: Increase the educational attainment of the State’s adult
population to the SREB State’s average by 2025.
Overview
To contribute to the State’s economic prosperity through the development of a skilled, educated
citizenry and fill a demand for the local, regional and state economy, the Board of Regents
established the goal of increasing the educational attainment (measured originally at the associate
degree level and above) of its adult citizens to the Southern Regional Education Board (SREB)
average by 2025. When the initial goal was set in 2011, the estimated average educational
attainment rate of the SREB region in 2025 was 42%. Currently 35.1% of Louisiana’s adult
residents (ages 25-64) possess some postsecondary credential. Today, due to many SREB states’
progress towards their educational attainment goals and the inclusion of certificates in the
attainment calculation, the estimated average in 2025 is 46%. To achieve this goal, Louisiana’s
postsecondary education institutions (public, private non-profit and proprietary) will need to
graduate approximately 148,277 students by academic year 2025-2026. Producing the 148,277
graduates will require an annual increase of 1,629 graduates per year (compounded).1 In
developing the objectives for this goal, the Board focused on access to, participation in, and
completion of postsecondary education programs for all citizens, in addition to recent high
school graduates.
OBJECTIVES TO REACH GOAL 1
Objective 1-1: Through collaboration with the Board of Elementary and Secondary Education
(BESE), graduate more students from high school ready for college or career.
Performance Measures for Objective 1-1
Performance Measure
Baseline
Yr.
Baseline
Data
Yr. 4
Data
Chg.
From
Baseline
Status
Number of students
participating in LOUISIANA
GEAR UP
Fall 2010 8,261 3,238 -5,023
Percentage of high school
graduates completing the LA
Core-4 Curriculum (public and
non-public school graduates)
AY 10-11 65.8%* 78.9% 13.1%
Average ACT composite scores
of high school graduating class
AY 09-10 20.1 19.2 -0.9
1 National Center for Higher Education Management, “Setting Educational Attainment Targets in Louisiana,”
presentation to Louisiana Board of Regents, May 2014.
*Students graduated with Core-4 for the first time in AY 11-12. Thus, baseline data (AY 10-11) represents the percentage of
graduates completing the Regents Core.

11
Performance Measures for Objective 1-1, continued.
Performance Measure
Baseline
Yr.
Baseline
Data
Yr. 4
Data
Chg.
From
Baseline
Status
from
Baseline
Percent of public high school
graduates passing (scoring a 3
or higher) on one AP exam
while in high school
Graduating
Class of
2010
4.6% 5.3% 0.7
Number of high school
graduates (public and non-
public)
AY 10-11 43,041 44,908 1,867
Number of high school
graduates scoring 19 or below
on the Math sub-section of the
ACT (# of students who would
require remedial education in
Math)
AY 09-10 18,292 28,775 -10,483
Number of high school
graduates scoring 18 or below
on the English sub-section of
the ACT (# of students who
would require remedial
education in English)
AY 09-10 12,493 21,438 -8,945
Number of high school students
with dual enrollment in
career/technical skills courses
AY
09-10
1,125 1,326 201
Observations on Performance Measures for Objective 1-1:
Decreases in the number of students participating in GEAR UP due to Program’s Cohort
Model
LA GEAR UP strives to increase the number of low-income students who are college ready.
The work of the LA GEAR UP program supports student achievement and prepares them to
apply, enroll and graduate from college. LA GEAR UP follows a cohort model, with
participation beginning in the 6th
and 7th grade. During fall 2014, LA GEAR UP was in its
seventh year, serving 3,238 11th
and 12th
grade students in 30 schools in 12 parishes. Enrollment
was down from 5,999 in the previous reporting cycle due to students graduating.

12
Increase in the number of high students taking the LA Core-4 curriculum.
Several studies through the years have confirmed that students who take a strong high school
core are more likely to be ready for college or career than those who do not. Since 2005, when
statewide minimum university admission requirements were first implemented, there has been a
steady increase in the number of high school graduates that have completed the Regents’ HS
Core for admission. The Board of Regents adopted the Louisiana Department of Education’s LA
Core-4 curriculum in 2010 to streamline communication and simplify student planning. In 2014-
15, the number of students completing the Core has reached 78.9%, a 13.1 percentage point
increase since AY 2010-11.
Decrease in ACT composite score and increase in number of students scoring below the
math and English “cut scores” due to implementation of compulsory ACT test-taking
In 2013, the Louisiana Department of Education (LDOE) Education implemented compulsory
ACT test taking in an effort to promote postsecondary readiness and participation. The shift in
State policy attributed to an increase in the proportion of students taking the ACT. It is not
surprising that the state average ACT declined and the range of scores became broader, given
that a greater number of students were tested, which represented a wider cross-section of talents
taking the test. In fact, in year 1 (class of 2011) and 2 (class of 2012) of Master Plan reporting,
Louisiana’s average ACT composite scores matched the SREB averages of 20.2 and 20.3,
respectively. For the class of 2013 and 2014, Louisiana’s average is 0.5 and 0.9 below the SREB
average of 20.0. It should be noted that similar to Louisiana, many states that implemented
policies that call for mandatory ACT test taking also saw a decline in the average ACT
composite score in the early years of implementation.
Additionally, beginning with the class of 2013, ACT included results for students who took the
test with ACT-approved accommodations in the state average score. Approved accommodations
include extended testing time, alternate test formats, stop-the-clock breaks and multiply-day test
administration for students with diagnosed and documented disabilities. Traditionally these
students have lower ACT composite scores. In 2013, 6% of Louisiana’s graduating seniors took
the ACT with approved accommodations, compared with 3% in the entire SREB region.2
It should be noted that prior to implementation of compulsory ACT test-taking and the reporting
of students with ACT- approved accommodations, the average ACT composite score for
Louisiana’s high school graduating class improved over the baseline year both year 1 and year 2,
and the number of students scoring below the math and English “cut scores” for placement into
college-level courses decreased from the baseline in both year 1 and year 2.
Interestingly, while the overall ACT composite average decreased in Louisiana, the number of
high school seniors earning scores of 18 or above on the ACT increased. Among high school
seniors in spring 2015, 24,619 students earned a college-going score (18 or above), an increase
of nearly 1,000 students from 23,660 in 2014. This finding suggests that more students are
college ready in Louisiana.
2 The Southern Regional Education Board, “The ACT and SAT: No Longer Used Just as College Admission Tests,” Fall 2014

13
It is also important to note that Louisiana’s ACT-tested 2014 graduating class had 27% potential
first-generation students, or students whose parents did not enroll in postsecondary education.
This compares to 18% of ACT-tested graduates nationwide. These findings suggest that recent
policy changes are removing the social and economic burdens some eligible students were facing
and encouraging many of them to pursue a postsecondary option that they may not have
otherwise considered.
Cohort High School Graduation Rate
Although the four-year cohort high school graduation rate is not one of the performance
measures outlined in the Master Plan, it is, along with the number of high school graduates, an
important measure of the effectiveness of secondary education in the State. The Federal Adjusted
Cohort Graduation Rate (ACGR), which is considered the gold standard for calculating this
statistic, requires that schools identify and track students from an original cohort (beginning in
their 9th
grade year) for four years. In Louisiana, the ACGR has continually increased, reaching
73.5% in 2013. This represents a 12.2% percentage point increase since 20013,4
.
While the graduation rates for minority groups, particularly African Americans and Hispanics
have increased by nearly 4% from 2011 to 2013, there still remains a large achievement gap
between African Americans and Hispanics, compared to their Caucasian counterparts. In
Louisiana, the 2013 ACGR among African American students was 66%, and 73% among
Hispanics; compared to 80% for Caucasians. These findings suggest that continued efforts are
needed to narrow the achievement gap between Caucasians and minorities
Objective 1-2: Increase the college-going rate of high school graduates.
Performance Measures for Objective 1-2:
Performance Measure
Baseline
Yr.
Baseline
Data
Yr. 4
Data
Chg.
From
Baseline
Status
from
Baseline
Percentage of recent
high school graduates
enrolled in college
(within 2 fall semesters)
AY 08-09
Graduates
59.2% 61.6% 2.4%
Number of recent high
school graduates
enrolled in college
(within 2 fall semesters)
AY 08-09
Graduates
25,091 27,359 2,268
3 National Center for Education Statistics, 2014. 4 The Adjusted Cohort Graduation Rate (ACGR) is calculated by dividing the is the number of students who graduate in 4 years
with a regular high school diploma by the number of students who form the adjusted cohort for the graduating class. Students are
identified in the beginning of their 9th grade year (or the earliest high school grade) and tracked over four years. The calculation
accounts for students who subsequently transfer into the cohort and subtracting any students who subsequently transfer out,
emigrate to another country, or die.

14
Performance Measure
Baseline
Yr.
Baseline
Data
Yr. 4
Data
Chg.
From
Baseline
Status
from
Baseline
Number of high school
students enrolled in
postsecondary education
courses
Fall 2010 18,551 22,875 4,324
Number of student
credit hours (SCH’s)
generated by high
school students enrolled
in postsecondary
education courses
Fall 2010 84,387 97,187 12,800
Total number of
students on GO Grants
AY 10-11 30,797 23,949 -6,848
Number of first-time
students on GO Grants
AY 10-11 17,065 11,275 -5,790
Graduation rate of
students on state
scholarships (TOPS)
Entering
class of
AY 03-04
59% 61% 2.0
Observations on Performance Measures for Objective 1-2:
Increase in Number of High School Students Enrolled in Postsecondary Education
Over the last decade, the increased focus on accountability has led to a greater focus on
graduating all students and ensuring they are college ready. In Louisiana, enhanced state funding
to support dual enrollment participation and a corresponding change in state law have likely
contributed to the significant increases in the number of Louisiana high school students enrolled
in college courses. In fact, since year 1 (class of 2011) of Master Plan reporting, the number of
high school students enrolled in college courses at postsecondary institutions increased by 4,324.
These numbers are predicted to continually increase as the state’s accountability measures for
high schools encourage dual enrollment participation.
Decline in students on Go-Grants
A 2011 study conducted by Noel-Levitz and the American Institutes for Research (AIR) found
that setting a target of meeting 60% of student financial need with Go Grant funding and all
other forms of gift aid would be the most cost-effective path for the State of Louisiana to

15
increase retention and graduation rates in the face of increasingly stringent fiscal constraints.5 In
light of the Noel-Levitz/AIR study findings and the limited funding available for this program,
the BOR approved changes to the Go Grant Framework, including changes to the minimum and
maximum annual award amounts and the manner in which postsecondary institutions package
students’ awards. As a result, beginning with the 13-14 academic year, annual Go Grant
minimum and maximum award amounts were increased and institutions were required by the
Louisiana Office of Student Financial Assistance (LOSFA) to make a good faith effort to
distribute their Go Grant allocations in a manner that reaches students with the most financial
need in an effort to bring their maximum financial need met with gift aid to 60%.6 As a result,
the total number of students receiving the award declined due to institutions’ more strategic use
of Go Grant funds.
Objective 1-3: Increase the number of adults age 25 and older enrolled in postsecondary
education programs.
Performance Measure
Baseline
Yr.
Baseline
Data
Yr. 4
Data
Chg.
From
Baseline
Status
from
Baseline
Number of students 25 or
older enrolled in adult
basic education programs
AY 09-10 13,577 11,612 -1,965
Total number of GED’s
awarded each year to
students 25 or older
AY 09-10 2,448 2,139 -309
Number of adults (age 25
or older) enrolled in
postsecondary courses
Fall 2010 55,557 48,970 -6,587
Number of degree
programs delivered
through 50%-99%
distance education
(hybrid)
AY 12-13 139 140 1
Number of degree
programs delivered
through 100% distance
education
AY 12-13 168 242 74
5 Noel-Levitz and the American Institutes for Research, “Targeting Financial Aid for Improved Retention Outcomes: The Potential Impact of Redistributing State Gift Aid on Student Retention Among Pell Grant Recipients in Louisiana’s Statewide and Regional Universities,” 2011 6 LOSFA Student Financial Aid Bulletin S2013-01

16
Observations on Performance Measures for Objective 1-3:
Decline in adult basic education enrollment and the number GED’s conferred
The data reveal that the number of adults enrolled in adult basic education (ABE) programs and
the number of GED’s awarded has declined from the baseline year to the fourth year of Master
Plan reporting. These data are troubling considering that approximately 360,000 Louisiana
residents between the ages of 25 and 64 have no high school credential. During the 2010
Regular Legislative Session, the Louisiana Legislature finalized a multi-year transfer of
responsibility for adult education programs from the Board of Elementary and Secondary
Education (BESE) to the Board of Supervisors of the Louisiana Community and Technical
College System (LCTCS). The implementation of WorkReady U, which resulted in a shift in
focus from primary instructional services for 16-18 year olds to the adult learner age 19 and
older, leading to a decline in statewide enrollment in adult basic education (ABE) programs.
BOR anticipates increases in these numbers in the coming years with the continued rebranding of
ABE into WorkReadyU.
Decline in enrollment of adult learners (aged 25 and older)
The enrollment of adult learners (those students age 25 and older) dropped 11.8% from a
baseline level of 55,557 to 48,970 in year four of Master Plan reporting. This is reflective of a
national trend in which the number of adult learners enrolled in postsecondary education
declined 3% (with overall enrollment increasing 2%) and may be attributable to the improving
national economy.7 Currently, only 35.1% of Louisiana adults age 25-64 have an undergraduate
college credential.8 Of those without a college credential, approximately 15% have no high
school credential and 22% have some postsecondary education but no credential.9 To reach the
SREB average by 2025, enrollment of adult learners in postsecondary institutions is important.
Unfortunately, over the last few years, the number of adult learners enrolled in postsecondary
education in Louisiana has continued to decline.
Number of online degree programs added as a Master Plan measure
Recognizing the significant role that electronic learning will play in making postsecondary
education more accessible to adult learners, BOR staff added two new measures to the Master
Plan annual review: the number of degree programs delivered through 50%-99% distance
education (hybrid programs) and the number of degree programs delivered through 100%
distance education. BOR began collecting these data from campuses in 2012-13 within the
Curriculum Inventory (CRIN) data system. In April 2014, the BOR launched Louisiana Online
(www.louisianaonline.org), a website which provides a comprehensive listing of Louisiana
institutions’ online and hybrid degree programs. The number of degree programs offered via
distance education has continued to increase. In fact, data indicate that 382 programs are
currently delivered through distance education, as compared to 307 in AY 12-13.
7 National Center for Education Statistics, Digest of Education Statistics, Table 224 8 U.S. Census Bureau 9 The Southern Regional Education Board, “Louisiana 2014 State Progress Report: Challenge to Lead 2020 Goals for Education”

17
Qualitative Measures
Bridging the digital divide is becoming increasingly important as adult learners and distance
learners require different engagement approaches to meet their needs. The Master Plan calls for
reporting the number of rural parishes/communities with broadband access. Currently, no
definitive, up-to-date and public data source exists for tracking the number of rural
parishes/communities in Louisiana with broadband access.
Objective 1-4: Improve postsecondary persistence/retention rates. (1st to 2
nd Year and 1
st
to 3rd
Year).
Performance Measures for Objective 1-4:
Performance Measure
Baseline
Yr.
Baseline
Data
Yr. 4
Data
Chg.
From
Baseline
Status
from
Baseline
Statewide 1st to 2
nd year
retention rate of first-time,
full-time, degree-seeking
students
Fall 09 to
Fall 10
74.5% 72.9% -1.6
Statewide 1st to 2
nd year
retention rate of first-time,
full-time, degree-seeking
students for two-year
colleges
Fall 09 to
Fall 10
58.8% 54.5% -4.3
Statewide 1st to 2
nd year
retention rate of first-time,
full-time, degree-seeking
students for four-year
universities
Fall 09 to
Fall 10
80.8% 81.9% 1.1%
Statewide 1st to 3
rd year
retention rate for first-
time, full-time, degree-
seeking students (four-
year universities)
Fall 08 to
Fall 10
72.4% 72.9% 0.5
Statewide fall to spring
retention rate of first-time,
full-time, degree-seeking
students (technical
colleges)
Fall 09 to
Spring 10
76.9% 68.9% -8.0

18
Observations on Performance Measures for Objective 1-4:
Retention Rates at Colleges and Universities
Data indicate gains in the 1st to 2
nd year retention rates at four-year universities. However, 1
st to
2nd
year retention rates at two-year colleges decreased from 58.8% to 54.5%. This decrease at
the two-year institution may be a result of the improving economy, as many students who
enrolled in certificate and associate degree programs to re-tool their skills during waning
economic times returned to the workforce before completing their studies.
Objective 1-5: Increase graduation of transfer students.
Performance Measures for Objective 1-5:
Performance Measure
Baseline
Yr.
Baseline
Data
Yr. 4
Data
Chg.
From
Baseline
Status
from
Baseline
Number of students
declaring an
AALT/ASLT major
Fall 2010 214 3,648 3,434
Number of students
graduating with an
AALT/ASLT degree
AY
10-11
7 129 122
Number of
AALT/ASLT graduates
who enroll in a
university the following
fall after completing the
degree
AY
11-12
2 72 70
Number of students
graduating with any
associate degree (from
two year and technical
institutions only)
AY
09-10
3,368 4,765 1,397
Graduation rate of
baccalaureate
candidates who began at
two-year colleges
Fall 2003 45.9% 48.9% 3.0
*The earliest point at which a student could have graduated with an AALT/ASLT degree was spring 2011. Therefore
AY 11-12 serves as the baseline year for reporting the number of AALT/ASLT graduates who enroll in a university
the following fall after completing the degree.

19
Objective 1-6: Increase the rate and number of students earning a postsecondary
Credential
Performance Measures for Objective 1-6:
Performance Measure
Baseline
Yr.
Baseline
Data
Yr. 4
Data
Chg.
From
Baseline
Status
from
Baseline
Statewide graduation rate
(within 150% of time) at
two-year institutions
(associate level and
below)
Entering
class of
fall 2003
5.7% 7.8% 2.1
Statewide graduation rate
(within 150% of time) at
four-year universities
(bachelor’s only)
Entering
class of
fall 2003
42.2% 48.9% 6.7
Number of 1-year
certificate recipients
AY
09-10
3,736 6,680 2,944
Number of diploma
recipients
AY
09-10
2,757 2,809 52
Number of associate
recipients
AY
09-10
4,429 5,743 1,314
Number of post-associate
recipients
AY
09-10
19 25 6
Number of baccalaureate
degree recipients
AY
09-10
17,941 18,540 599
Number of post-
baccalaureate recipients
AY
09-10
25 135 110
Number of masters
recipients
AY
09-10
4,513 5,076 563
Number of post-masters
recipients
AY
09-10
1 23 22

20
Performance Measure
Baseline
Yr.
Baseline
Data
Yr. 4
Data
Chg.
From
Baseline
Status
from
Baseline
Number of specialists
recipients
AY
09-10
52 43 -9
Number of doctorate
recipients
AY
09-10
523 566 43
Number of professional
degree recipients
AY
09-10
885 997 112
Number of post-
professional recipients
AY
09-10
23 17 -6
Completer productivity:
ratio of completers to
enrollment
AY
09-10
5.82 5.0 -0.82
Total number of
graduates (unduplicated)
AY
09-10
26,874 30,726 3,852
Completer totals are unduplicated at the award level.
Observations on Performance Measures for Objective 1-6:
Number of completers (unduplicated at the award level) on the rise
Since academic year 2009-2010 (the baseline year for Master Plan reporting), there has been a
marked increase in the number of completers at all degree levels, with a 16.4% increase in
completers at the associate level and below, a 2.9% increase in baccalaureate completers, and a
12% increase in completers at the master’s level and above (with varying degrees of duplication
across degree levels).
Total number of graduates added as a Master Plan measure
While analyzing the number of completers at the various award levels is important, the annual
number of graduates (the number of citizens with a credential) is the ultimate measure of the
State’s progress toward the goal of reaching the SREB states’ average educational attainment.
Because many students receive multiple awards at different levels (for example, a student may
receive a certificate in one academic year and an associate degree the next), tracking an
aggregate number of completers (unduplicated only at the award level) on an annual basis may
overstate the State’s progress in reaching the educational attainment goal. Tracking unduplicated
graduates annually is a more accurate measure of the State’s progress toward increasing the
percentage of adults (age 25-64). In academic year 2009-10, Louisiana’s public postsecondary
21
institutions produced 26,874 graduates. Four years later, in academic year 2013-14, that number
had increased 14.3% to 30,726. While these numbers show improvement, to get to the SREB
states’ average educational attainment goal by 2025, the State will need to produce
approximately 1,629 graduates compounded through year 2025-26.

CHAPTER 2
Goal 2: Foster Innovation through Research in Science and
Technology in Louisiana

23
Goal 2: Foster Innovation through Research in Science and
Technology in Louisiana
Overview
Cutting-edge research and innovation, and resulting scientific advancements, technology
transfers, and industrial partnership, are critical to maintaining a vibrant scientific and
technological culture across post-secondary education, as well as fostering sustainable economic
development in Louisiana. To capitalize on existing research strengths and plan strategically for
future investment, the Board of Regents, systems and campuses have adopted the Fostering
Innovation through Research in Science and Technology in Louisiana (FIRST Louisiana)
statewide science and technology plan. This plan, along with Louisiana Economic
Development’s Blue Ocean targets, offers context for institutional planning and provides the
foundation for a targeted statewide approach to research, development and innovation. These two
plans are at the heart of the Board’s research objectives.
In the fourth year of Master Plan reporting, most research metrics, particularly related to campus
research expenditures, continue to show growth over baseline reporting, though increases have
not been steady in recent years. It is notable that the National Science Foundation (NSF), the
source for most data on university-based research expenditures and activity, publishes data more
than one year after they are collected, so many of the currently available data used for
benchmarking and early years of Master Plan reporting predate the Board’s adoption of the
Master Plan. In addition, NSF’s methodology for reporting expenditures from industry/business
sources has recently changed, complicating comparisons of current data with data collected in
previous years.
Changes in research cultures often occur gradually, and data sets lag in capturing in real time
attitudinal and disciplinary evolutions resulting from policy directives. In addition, data
collection methodologies related to research, particularly at the National Science Foundation
(NSF), are in flux; changes lead to difficulties in understanding the relationships among data sets
produced with differing methodologies. Finally, significant reductions to higher education’s state
general fund appropriations have reduced campuses’ discretionary funds to support faculty
research projects, lab upgrades, start-up packages, library acquisitions, and other critical
elements in advancing the culture and practice of state-of-the-art research. Reductions in tenured
and tenure-track faculty also affect research funding and activity, as remaining faculty are
assigned heavier teaching loads.
OBJECTIVES TO REACH GOAL 2
Objective 2-1: Maintain and build strength in foundational science and technology disciplines
identified in FIRST Louisiana.
Strength across the spectrum of foundational science disciplines is a necessary base of support
for the kinds of more targeted, high-impact research that can be translated into products,
services, and industrial partnerships. Faculty members in foundational sciences must be research-

24
active, engaging students, colleagues, and other partners in the pursuit of new knowledge. The
employment market for research-active faculty (those holding active R&D grants/contracts) is
extremely competitive. Institutions must maintain market-based salaries to attract and retain
these highly productive individuals.
Performance Measures for Objective 2-1:
Performance
Measure
Baseline
Yr.
Baseline
Data
Yr. 4 Data
Chg. From
Baseline
Status
Number and
percent of
faculty holding
active R&D
grants/contracts
at LSU A&M
Yr. 1 of
GRAD
Act
562
(51.6%)
471
(46.9%)
-91
Number and
percent of
faculty holding
active R&D
grants/contracts
at LSUHSCNO
Yr. 1 of
GRAD
Act
103*
(17.6%)
128
(28.7%)
25
Number and
percent of
faculty holding
active R&D
grants/contracts
at LSUHSCS
Yr. 1 of
GRAD
Act
85
(33.0%)
77
(49.0%)
-8
Number and
percent of
faculty holding
active R&D
grants/contracts
at LA Tech
Yr. 1 of
GRAD
Act
121
(38.2%)
108
(37.1%)
-13
*Baseline data was not available in AY 2010-11; thus this measure was first collected in AY 2011-12.

25
Performance
Measure
Baseline
Yr.
Baseline
Data
Yr. 4 Data
Chg. From
Baseline
Status
Number and
percent of faculty
holding active
R&D
grants/contracts at
ULL
Yr. 1 of
GRAD
Act
168
(21.2%)
133
(32.5%)
-35
Number and
percent of faculty
holding active
R&D
grants/contracts at
UNO
Yr. 1 of
GRAD
Act
110
(26.3%)
73
(21.5%)
-37
R&D expenditures
at universities and
colleges from all
funding sources
FY 08 $660,139,000 $671,580,000 $11,441,000
R&D expenditures
at colleges and
universities from
industry sources
FY 08 $20,853,000 $41,133,000 $20,280,000
Observations on Performance Measures for Objective 2-1:
Data indicate that the number of research-active faculty across the foundational sciences has
decreased. From baseline year to year 4 of Master Plan reporting, Louisiana’s research
universities report 176 fewer faculty holding active R&D grants and contracts, though
percentages are steady. Research expenditures across all funding sources, however, have showed
growth, from $660 million in FY 2008 to $671 million in FY 2013, an increase of 1.7% over the
baseline year, though FY 2012 data showed a much more significant 5% increase. While gains in
research expenditures during the Master Plan years are positive, they are attributable in part to
availability of American Recovery and Reinvestment Act (ARRA) funds. More notable is the
significant growth of research expenditures from industry/business sources, which continued to
grow in FY 2014, increasing $20 million over the baseline. NSF’s methodology for reporting
expenditures from business sources has recently been revised, so the baseline figures are not
fully comparable to current-year data and it is difficult to identify the factors contributing to this
impressive growth.
Objective 2-2: Promote multidisciplinary and multi-institutional collaborative research efforts.
Science and technology research has moved from largely discipline-based endeavors to large-
scale, broadly inclusive multidisciplinary, multi-institutional partnerships. This approach allows
scientists to approach investigations and hypotheses holistically, from larger bases of knowledge,
26
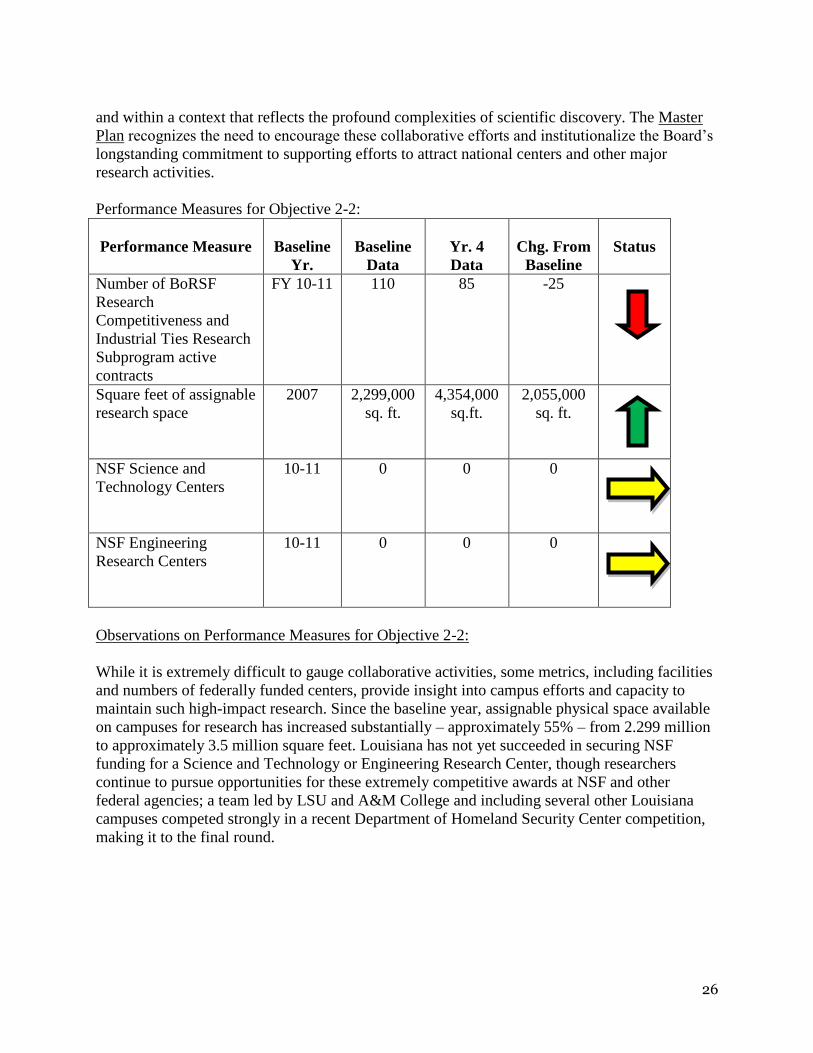
and within a context that reflects the profound complexities of scientific discovery. The Master
Plan recognizes the need to encourage these collaborative efforts and institutionalize the Board’s
longstanding commitment to supporting efforts to attract national centers and other major
research activities.
Performance Measures for Objective 2-2:
Performance Measure
Baseline
Yr.
Baseline
Data
Yr. 4
Data
Chg. From
Baseline
Status
Number of BoRSF
Research
Competitiveness and
Industrial Ties Research
Subprogram active
contracts
FY 10-11 110 85 -25
Square feet of assignable
research space
2007 2,299,000
sq. ft.
4,354,000
sq.ft.
2,055,000
sq. ft.
NSF Science and
Technology Centers
10-11 0 0 0
NSF Engineering
Research Centers
10-11 0 0 0
Observations on Performance Measures for Objective 2-2:
While it is extremely difficult to gauge collaborative activities, some metrics, including facilities
and numbers of federally funded centers, provide insight into campus efforts and capacity to
maintain such high-impact research. Since the baseline year, assignable physical space available
on campuses for research has increased substantially – approximately 55% – from 2.299 million
to approximately 3.5 million square feet. Louisiana has not yet succeeded in securing NSF
funding for a Science and Technology or Engineering Research Center, though researchers
continue to pursue opportunities for these extremely competitive awards at NSF and other
federal agencies; a team led by LSU and A&M College and including several other Louisiana
campuses competed strongly in a recent Department of Homeland Security Center competition,
making it to the final round.

27
Objective 2-3: Sustain and advance research commercialization and translational activities
that promote economic development in Louisiana.
Fostering Innovation through Research in Science and Technology in Louisiana (FIRST
Louisiana), the statewide science and technology plan, and Louisiana Economic Development’s
Blue Ocean initiative have identified core and emerging industry sectors in Louisiana that are
ripe for investment and university involvement, and the Master Plan seeks to align state
investments in support of these activities. Leveraging and building upon resources in these areas
is strategically important to developing innovative translational research domains and enhancing
the competitiveness of Louisiana’s core industry sectors. Metrics related to entrepreneurship
activity, including numbers of patents, licenses, and start-up companies provide insight into the
level of Louisiana’s activity in the science and technology marketplace.
Performance Measures for Objective 2-3:
Performance
Measure
Baseline
Yr.
Baseline Data
Yr. 4 Data
Chg. From
Baseline
Status
Amount of
university/
Federal gov’t.
financial
partnership
FY 08 $300,024,000 $298,502,000 -$1,522,000
Amount of
university/state
& local gov’t.
financial
partnership
FY 08 $117,859,000 $93,905,000 -$23,954,000
Amount of
university/
industry
financial
partnership
FY 08 $20,853,000 $41,133,000 $20,280,000
Amount of
institutionally
funded
research
FY 08 $164,104,000 $196,623,000 $32,519,000
Number of
invention
disclosures
FY 09 162 169 7
Number of
Starts-up
formed
FY 09 7 7 0

28
Performance
Measure
Baseline
Yr.
Baseline Data
Yr. 4 Data
Chg. From
Baseline
Status
from
Baseline
Number of
licenses
executed
FY 09 23 33 10
Number total
active licenses
FY 09 169 195 26
Number of new
patent
applications
FY 09 88 86 -2
Number of
U.S. patents
issued
FY 09 26 21 -5
* Dollar
amount of
R&D
expenditures in
LA’s key
economic
development
industries-
LSU A&M
Yr. 1 of
GRAD
Act
$139,062,000 $144,978,000 $5,916,000
* Dollar
amount of
R&D
expenditures in
LA’s key
economic
development
industries-
LSUHSCNO
Yr. 1 of
GRAD
Act
$55,663,400 $53,084,862 -$2,578,538

29
Performance
Measure
Baseline
Yr.
Baseline Data
Yr. 4 Data
Chg. From
Baseline
Status
from
Baseline
* Dollar
amount of
R&D
expenditures in
LA’s key
economic
development
industries-
LSUHSCS
Yr. 1 of
GRAD
Act
$30,335,250 $30,373,000 $37,750
* Dollar
amount of
R&D
expenditures in
LA’s key
economic
development
industries- LA
Tech
Yr. 1 of
GRAD
Act
$17,307,000 $19,419,000 $2,112,000
* Dollar
amount of
R&D
expenditures in
LA’s key
economic
development
industries-
ULL
Yr. 1 of
GRAD
Act
$38,773,000 $44,638,000 $5,865,000
* Dollar
amount of
R&D
expenditures in
LA’s key
economic
development
industries-
UNO
Yr. 1 of
GRAD
Act
$17,440,000 $14,842,000 -$2,598,000

30
Performance
Measure
Baseline
Yr.
Baseline Data
Yr. 4 Data
Chg. From
Baseline
Status
from
Baseline
Amount of
university
revenue
generated from
research
commerciali-
zation,
technology
transfer and
intellectual
property
development
FY 09 $15,892,685 $13,984,665 -$1,908,020
*Data represent a 4-or 5- year average.
Observations on Performance Measures for Objective 2-3:
Most of these metrics show moderate growth from the baseline to the fourth reporting year, even
in the absence of data from Louisiana Tech, which did not report during Year 4 but is included in
baseline and Years 1-3. Numbers of patents applied for and issued have continued to decline, and
the amount of university revenue generated from research commercialization, technology
transfer and intellectual property development, decreased over the baseline year, reversing Year
3’s growth. Though metrics show some improvement, it is important to remember the process for
development of scientific research from the lab bench to the marketplace is extremely long and
complex, and generally cannot be completed within an annual reporting cycle. In addition,
longitudinal analysis shows that these data can be highly variable from year to year.
The majority of the technology transfer and commercialization metrics show moderate growth
from the baseline to the fourth reporting year, despite the absence of data from Louisiana Tech,
which did not report during Year 4, but is included in baseline and Years 1-3. Numbers of
patents applied for and issued have continued to decline, and the amount of university revenue
generated from research commercialization, technology transfer and intellectual property
development, decreased over the baseline year, reversing Year 3’s growth. Though metrics show
some improvement, it is important to remember the process for development of scientific
research from the lab bench to the marketplace is extremely long and complex, and generally
cannot be completed within an annual reporting cycle. In addition, longitudinal analysis shows
that these data can be highly variable from year to year.

31
Objective 2-4: Develop and periodically update campus-based plans for science and
technology research.
Cutting-edge research requires significant resources and campuses must plan carefully for
allocation of such resources based on existing and prospective strengths, as well as long-term
strategic priorities. To encourage strategic planning for research on all research-intensive
campuses, the Master Plan requires campuses with two or more doctoral programs in science and
technology disciplines to submit regular reports relating campus STEM goals, strategies, and
investments to the FIRST Louisiana framework, particularly the Core Industry S&T Sectors and
High Growth Target Industries, as well as LED’s Blue Ocean Sectors. The campus-level
reporting of research and economic development data is also aligned with metrics collected by
the Association of University Technology Managers (AUTM), which provide a view of the
direct economic development impacts of university-based research. Campus Strategic Research
Priorities Reports, submitted every three years with an opportunity for campuses to provide
annual updates, furnish focused research data in relation to the campuses’ identified STEM
research priorities. The first campus reports were submitted to the Regents in June 2013 and
spurred the establishment of six statewide Task Forces to discuss priorities for investments,
develop action plans, and provide reports to the Board and the Louisiana Innovation Council to
consider as the basis for future legislative and/or executive action. Task Force reports were
submitted in 2013, leading to Board action in December 2014 and June 2015 to identify priority
areas and actions to further the State’s success in research commercialization and technology
transfer.
Objective 2-5: Assess and encourage the articulation of statewide priorities for investment with
campus research priorities and activities.
Campuses, as well as the State, must carefully consider and plan to support research priorities
that will position faculty researchers to make major discoveries, contribute to important scientific
knowledge, and capitalize on economic development opportunities. To address this need, the
Master Plan called for foundation of a Master Plan Research Advisory Committee, comprised of
selected research officers and Board of Regents staff, to review completed campus priorities
reports as required in Objective 2-4, identify statewide priorities and opportunities, and make
investment recommendations to the Board of Regents and other state leaders. This committee has
made significant progress in addressing these issues both broadly and in detail. Six Task Forces
were established to continue to define and refine statewide targets in collaboration with LED.
Task Forces, with full participation from LED, during fall of 2014 identified priority actions and
areas for statewide investment. These reports formed the foundation of an external review,
conducted by out-of-state experts, to identify three research areas likely to make major
contributions to Louisiana’s economic development. The three top areas identified were:
Advanced Manufacturing and Materials, Life Sciences and Bioengineering, and Digital Media
and Enterprise Software. In addition, the panel offered several general recommendations for
advancing Louisiana’s research and technology transfer successes, including hiring of a
technology transfer liaison at the Board of Regents and establishing a statewide, competitive
proof-of-concept/prototype fund. The Board of Regents approved the rankings of the panel, as
well as recommendations to further technology transfer and commercialization activities
statewide. Staff are currently implementing Board actions.

32
Objective 2-6: Enhance communication, interactivity, and effectiveness through statewide data
collection consistent with proprietary protections.
University research is increasingly collaborative in nature, with partnerships growing both
among institutions and between higher education researchers and local, regional, national and
international business and industry. To foster such collaborations, campuses must effectively
share information on their research priorities, strengths, ongoing activities, and successes. The
Board has facilitated this by posting all campus-based research priorities reports, as required in
Objective 2-4, on a dedicated webpage; Task Force reports, which include statewide approaches
and priorities in targeted disciplines, were added to the webpage in fall 2014. In addition, to
assist campuses in connecting with potential technology marketers/users, a statewide site has
been created to link interested business and industry with campus technology transfer offices
statewide and with the Association of University Technology Managers’ Global Technology
Portal, which provides a list of university-developed technology available for licensing.

CHAPTER 3
Goal 3: Achieve greater accountability, efficiency and effectiveness
in the postsecondary education system.

34
GOAL 3: Achieve greater accountability, efficiency and effectiveness
in the postsecondary education system.
Overview
Increased accountability, efficiency and effectiveness are common threads that undergird every
element of the Master Plan. Through its clearly defined goals and performance metrics, the Plan
assures that its success will be monitored, measured, and reported throughout its implementation.
Objective 3-1: Advance a performance-based funding formula for higher education that aligns
with the GRAD Act and drives continued improvement in education outcomes and meeting the
workforce needs of the State.
In March 2011, the BOR approved a performance funding formula which is tied to the six-year
agreements established through the LA GRAD Act. While this funding formula is well-
developed, it is important that it be enhanced and improved continuously to assure that campus
priorities emphasize the credentialing of Louisiana citizens in academic programs that address
the needs of Louisiana citizens.
Performance Measures for Objective 3-1:
Performance Measure
Baseline
Yr.
Baseline
Data
Yr. 4
Data
Chg.
From
Baseline
Status
from
Baseline
Change in 1st to 2
nd year
retention rate from prior
year
Fall 09 to
Fall 10
-3.6% 1.3% 4.9
Change in 1st to 3
rd year
retention rate from prior
year
Fall 08-to
Fall 10
0.2% 1.3% 1.1%
Change in Fall to Spring
retention rate (Technical
Colleges only) from prior
year
Fall 09 to
Spring 10
0.4% -3.9% -4.3%
Change in number of
graduates from prior year
AY
09-10
873 1,599 726
Number of Louisiana
residents receiving
credentials (unduplicated
at the award level)
AY
09-10
28,713 35,622 6,909

35
Performance Measure
Baseline
Yr.
Baseline
Data
Yr. 4
Data
Chg.
From
Baseline
Status
from
Baseline
Change in number of
Louisiana residents
receiving credentials from
prior year
AY
09-10
942 2,373 1,431
Percentage change in
number of Louisiana
residents receiving
credentials from prior year
AY
09-10
3.4% 7.13% 3.73
Qualitative Measures
In addition to the measures above, the Master Plan also calls for a demonstrated alignment of the
performance funding metric to each institution’s role, scope and mission. Institutional funding
recommendations are based upon corresponding SREB category peer groups. Additionally, each
institution is measured against its own negotiated GRAD Act targets to track performance.
A $40 million fund, called the Workforce Innovation for a Stronger Economy (WISE) Fund, was
established in 2014 to incentivize collaboration between business/industry and public
postsecondary education. The funding has been significantly reduced to $12.1 million for fiscal
year 2015-16.
Several laws have been enacted that focus on strengthening Louisiana’s performance based
funding model. In particular, Act 462 of 2014 requires the development of a comprehensive
outcomes-based funding formula that requires the equitable distributions across all Louisiana’s
public postsecondary institutions. The Commissioner of Higher Education continues to work
with system presidents in consultation with chancellors, faculty, chief academic officers, chief
financial officers, students, and business and civic leaders to review and recommend to the
legislature an updated performance funding model for public post-secondary education,
including health related institutions and two- and four-year institutions. However, funding
constraints over the last several years have limited the effectiveness of the formula.
Objective 3-2: Serve as the definitive source of information on higher education in Louisiana.
Accountability has become an increasingly important priority in postsecondary education.
Therefore, the BOR continues to measure and monitor student and institutional access and
success. Ensuring that such information is available to the public has also become a primary
focus.

36
Performance Measures for Objective 3-2:
Evidence of systemic review of the BoR data systems and revisions where appropriate
New Initiatives
The BOR’s continued participation in the Complete College America (CCA) initiative (a
national non-profit dedicated to finding ways to increase postsecondary education degree
production and share that information with partner states) and the LA GRAD Act have resulted
in ongoing review of the BOR data systems during the last four years of Master Plan reporting.
The CCA initiative collects the aggregation and reporting of several sub-cohort measures (e.g.,
gender, part-time vs. full-status, and age groups) that until BOR’s participation had not been
measured. These new measures allow staff and the public to understand student outcomes by
demographics. Louisiana’s most recent CCA data may be viewed at the following link: http://completecollege.org/state-data-loader/?state=Louisiana&code=la
Alignment with IPEDS
BOR staff now gathers standard occupational classification (SOC) code data to comply with
Employee Salaries IPEDS reporting requirements. Additionally, data reporting deadlines have
been revised to align BOR data systems and the IPEDS data collection cycle.
Increased Data Collection
Recognizing the growing importance of distance education programs, the BOR has begun
collecting data within its Curriculum Inventory (CRIN) database on the number of programs that
are available 100%, 50%-99%, and less than 50%, online. The BOR is also collecting data on
students enrolled in distance education courses. These data will allow for evaluation of the
performance of students in distance education courses and programs as well as monitor the
growth of distance education.
Web-accessible, user-friendly accountability resources
The GRAD Act is another vehicle to collect and report accountability measures in Louisiana
postsecondary education. The GRAD Act provides for six-year agreements between the BOR
and the State’s public postsecondary education systems and institutions with the goal of
increasing accountability and performance among participating institutions. The GRAD Act
requires the BOR to asses each institution’s yearly progress in meeting a multitude of
performance measures as part of their agreements. In an effort to provide accountability
information to the public, the GRAD Act Annual Report and each institution’s annual reports are
published on the GRAD Act page of the BOR website at www.regents.la.gov, located under
Quick Links.
In 2012, the Governance Commission recommended that the BOR establish a publicly accessible
“dashboard” of performance measures in order to monitor system and institutional success and to
ensure transparency of information for both the Legislature and the general public. In response,
the BOR redesigned its website. A major component of the redesign is a user-friendly and
interactive data dashboard (http://www.regents.la.gov/page/grad-act-dashboard). The data

37
contained within the Dashboard is visually displayed through charts and graphs which represent
the State’s progress in attaining the goals set forth in the LA GRAD Act and the Master Plan. In
the third year of Master Plan reporting, an “Institutional Characteristics” dashboard was added.
This dashboard contains longitudinal data on enrollment, the number of students receiving
financial aid, student demographics, completers, faculty headcounts, and retention and
graduation rates, for the State as a whole and for individual campuses.
Objective 3-3: Review academic programs and eliminate, as appropriate, programs that are
low-performing and/or duplicative.
Proposed new academic programs are carefully reviewed to assess state and regional needs,
curriculum design, and resource requirements. There must be evidence of local student and
prospective employer demand as well as an expectation that the new program would become
self-sustaining after a reasonable implementation period. The statewide program review repeats
that analysis of existing programs to assess whether they should be maintained in the curriculum
inventory, e.g., whether program continuation is justified based on costs, productivity, and
relevance to student or campus progression.
The statewide program review is conducted every other year to provide time for actions triggered
by the review to have an impact on productivity. As part of the process, Regents staff identifies
programs for which a response is required, triggered primarily by the number of degrees
conferred over the last three years:
Degree Level Productivity Threshold
Associate/Baccalaureate/Post-Bachelors Average 8 per year
Master/Post-Master/Specialist Average 5 per year
Professional/Doctoral/Post-Doctoral Average 2 per year
Campuses are encouraged to organize or restructure based on a self-evaluation of their entire
academic program inventory. The process provides opportunity and incentive for a fresh look at
the institution’s program offerings in light of its own fiscal realities.
Performance Measures for Objective 3-3:
Annual report on academic program productivity
In the 2014-15 academic year, 179 programs were included in the review. For each program, the
campus prepared a proposition and justification to continue, consolidate, or terminate the
program. Staff considered campus requests in light of: the statewide inventory and issues of
unnecessary duplication and/or access; current and projected trends in enrollment and
productivity; and the explanation of and interventions to improve the current status.
As a result, in April 2015, 112 programs were conditionally maintained, 9 were consolidated into
new or existing programs, and 58 were terminated (cancelled). All programs must demonstrate
viability or significant growth by the next scheduled review in 2016-17.

38
Availability of program success rate information to the public
The Curriculum Inventory (CRIN) provides program-specific information and is available to the
public via the BoR website. Up-to-date program-specific accreditation information and number
of completers by subject area and institution are available on the web in PDF format.
Objective 3-4: Create a more balanced enrollment mix between two-year and four-year
institutions.
Understanding that two-year colleges can serve as a cost-effective and efficient entry point for
baccalaureate degree seekers, the BOR has worked to implement policies that better balance the
first-time freshmen enrollment mix between two-year and four-year institutions. Through
expanded articulation agreements such as the Louisiana Transfer Degree, Louisiana
postsecondary enrollment is making progress in its goal to obtain a more appropriate enrollment
mix. In fall 2014, 43% of Louisiana’s first-time freshmen began at a two-year or technical
college, compared to 33% nearly a decade earlier.
Performance Measures for Objective 3-4:
Performance Measure
Baseline
Yr.
Baseline
Data
Yr. 4
Data
Chg.
From
Baseline
Status
from
Baseline
Number of technical and
community college
completers
AY
09-10
9,411 14,269 4,858
Number of four-year and
specialty degree
completers
AY
09-10
18,662 26,450 7,788
Number of diploma
completers
AY
09-10
2,757 2,809 52
Number of certificate
completers
AY
09-10
3,736 6,680 2,944
Number of associate and
post-associate
completers
AY
09-10
4,448 5,743 1,295
Number of baccalaureate
completers
AY
09-10
17,941 18,540 599
Number of transfer
students (2 year to 4
year; full time and part
time)
Fall 2010 1,870 2,091 221

39
Performance Measure
Baseline
Yr.
Baseline
Data
Yr. 4
Data
Chg.
From
Baseline
Status
from
Baseline
Change from prior year
in ACT composite of
incoming freshmen class
Fall 2010
entering
class
21 21.1 -0.1
Objective 3-5: Demonstrate improvement in student learning outcomes through measurable
data and reporting that can be shared publicly and used to drive the decision-making process.
When introducing new learning methodologies into postsecondary education, it is important to
determine their efficacy. The BOR is committed to the research and study of best practices in
student learning and to the sharing of those practices among Louisiana’s postsecondary
education institutions.
Performance Measures for Objective 3-5:
Increased student success
In response to a national push by Complete College America (CCA) and the Education
Commission of the States (ECS) to provide co-requisite instruction concurrently with a college-
level, credit-bearing course as a way to improve overall student success, the BOR approved a co-
requisite education pilot program in 2012. National research initiatives suggest that students who
begin in college-level courses with some support, rather than taking remedial classes separately
before being allowed to move on to credit-bearing courses, are more likely to pass the credit-
bearing course and successfully continue in college.
Since 2012, under the BOR pilot, institutions have collected and submitted data to BOR staff
regarding students who earned a Mathematics ACT sub-score of 17 or 18 or an English ACT
sub-score of 16 or 17 (i.e., 2 points below the mandatory “cut score” for being placed into
college-level math and English) and took supplemental instruction in mathematics or English
along with college-level courses as either two co-requisite classes, an extended section, or as
mandatory supplemental instruction. In all, a total of 2,746 students have participated in the pilot
across 20 institutions.
The pilot parameters require students to take a diagnostic test at the beginning and end of the
pilot to assess growth in learning. Throughout the 2014-15 academic year, BOR staff collected
data from institutions participating in the developmental pilot. Given BoR staff’s findings, new
provisions have been implemented for the 2015-16 academic year. Institutions that offer co-
requisite delivery must (1) have professional development opportunities for faculty and staff; (2)
implement attendance and advising policies; and (2) ensure that the supplemental and the
college-level courses are integrated and coordinated in content. During the 2015-16 academic
year, staff will evaluate pilot data collected from participating institutions and expect to make a
recommendation regarding the BOR policy on college level placement.

CHAPTER 4
Summary and Analysis of Progress
Year 4

41
The fourth year of implementation of the 2011 Master Plan included the collection and analysis
of year four data for the performance measures within each of the three overarching goals.
Collectively and measured against the baseline, these data tell a story about the progress being
made in Louisiana public postsecondary education and the areas which will require increasing
focus in the coming years. Below is a brief synopsis of the implementation of each of the three
goals during year four.
GOAL 1: INCREASE THE EDUCATIONAL ATTAINMENT OF THE STATE’S ADULT POPULATION TO
THE SREB STATE’S AVERAGE BY 2025
46 Quantitative Performance Measures
The first goal of the Master Plan focuses on increasing educational attainment among the State’s
adult population, with the long term goal of reaching the SREB average by 2025. Increasing
educational attainment in the State begins with graduating more students from high school ready
for college. In the fourth year of Master Plan reporting, the total number of high school graduates
increased by 1,867 from the baseline level 43,041 in AY 10-11 to 44,908 in AY 14-15. As a
measure of how well-prepared these graduates were:
o 65.8% of the baseline class (the class of 2011) completed the Regents Core;
78.9% of the Class of 2015 completed the LA CORE-4
o The implementation of compulsory ACT test-taking and the inclusion of the
scores of students who took the test with ACT-approved accommodations made
comparisons to the baseline inconsistent over the last two years. The ACT
composite score for the baseline class (the graduating class of 2010) was 20.1. For
the Class of 2014 (with 100% tested), it was 19.2.
o Again, compulsory ACT- test taking made comparisons to the baseline of the
number of students that would require remedial education in math and English
inconsistent.
In the baseline year, 18,292 students in the Class of 2010 scored below the
math cut score. For the Class of 2014 (with 100% tested) that number
increased to 28,775.
The number of students that would require remedial education in English
saw a more dramatic increase, increasing from 12,493 for the Class of
2010 to 21,438 for the Class of 2014.
Correspondingly, compulsory ACT- test taking increased the number of
high school seniors who scored an 18 or above by nearly 1,000 students.
In spring 2015, 24,619 students earned a college-going score (18 or
above), compared to 23,660 in 2014.
In addition to graduating more students from high school prepared for college, increasing
educational attainment also requires increasing the number of high school graduates that enroll in
college. Among the high school graduating class of 2009, 59.2% enrolled in postsecondary
=31 = 15 = 0

42
education within two fall semesters after high school graduation. Four years later that number
increased to 61.6%.
Providing financial support to students increases the likelihood of enrollment. From AY 10-11 to
AY 13-14 the total number of first-time students on GO Grants, the State’s need-based aid
program, decreased from 17,065 to 11,275. This decrease is, largely, a result of changes made by
BOR and LOSFA to the Go Grant Framework, which required institutions, beginning with the
13-14 academic year, to make a good faith effort to distribute their Go Grant allocations in a
manner that reaches students with the most financial need in order to bring the student’s
maximum financial need met with gift aid to 60%. As a result, institutions awarded Go Grants to
fewer students in an effort to award the dollars more strategically.
To reach the SREB average for educational attainment by 2025, Louisiana postsecondary
education will need to focus on adult learners as well as traditional, first-time students.
However, in the fourth year of Master Plan reporting, data reveal that the number of adults
enrolled in adult basic education (ABE) programs and the number of GED’s awarded has
declined from the baseline. Among Louisiana’s adult learners (defined as those aged 25 or
older), the number enrolled in adult basic education (ABE) programs decreased from 13,577 in
AY 09-10 to 11,612 in AY 13-14 and the number receiving GED’s, the credential that serves as
a gateway to postsecondary education for many adults, decreased from 2,448 in AY 09-10 to
2,139 in AY 13-14. And, despite gains in the first year of Master Plan reporting in 2014, the total
number of adult learners enrolled in postsecondary education decreased by 11.8% from the
baseline.
Access to postsecondary education is only one part of the strategy to increase educational
attainment in the State. Retaining and progressing students through postsecondary education is
an important next step. Overall, 1st to 3
rd year retention rates at four-year universities saw a slight
increase from the baseline rate of 72.4% to 72.9%. The statewide 1st to 2
nd year retention rate of
first-time, full-time, degree-seeking students declined slightly from a baseline rate of 74.5% to
72.9%. This decrease was due mostly to decreases in retention rates at two-year institutions,
which saw a decrease in retention rates from 58.8% to 54.4%. Technical colleges saw decreases
in their retention rates as well (which are measured from fall to spring) from a baseline rate of
76.9% to 68.9%. This may be a result of the improving economy, as many students who enrolled
in certificate and associate degree programs to re-tool their skills during waning economic times
returned to the workforce before completing their studies.
Making transfer and articulation among institutions less cumbersome has been a goal of the BOR
for some time. The Louisiana Transfer (LT) Degree, implemented in fall 2010, is the result of
many years of work in this area. The data reveal growing demand for the LT degree. In fall 2010,
the first semester the degree was offered, 214 students declared it as their major. Four years later,
in fall 2014, 3,648 students declared an LT major. Within the first four years of the LT program,
129 students have completed an LT degree.
While access and persistence are important measures, the best indicator of the State’s progress
toward the goal of reaching the SREB average of adult educational attainment is the annual
number of graduates. Overall, the number of graduates increased by roughly 14% from the

43
baseline, from 26,874 in AY 09-10 to 30,726 in AY 13-14. Sustaining the prior year’s growth
and increasing that rate cumulatively through 2025 will be necessary to reach Goal 1.
The State has made progress toward Goal 1, especially in an uncertain funding environment.
That progress is evident in the increased preparation of high school graduates, the increasing
number of students who are participating in the Louisiana Transfer degree program, and
increasing graduation rates at public postsecondary institutions. While some measures showed
improvement, others showed little gain or regressed. Specifically, measures such as 1st to 2nd
year retention at the two-year and technical colleges and enrollment of adult learners (those
students age 25 and older) in postsecondary education continue to decline. The State recognizes
that to increase the educational attainment of the State’s adult population to the SREB average
by 2025, enrollment of adult learners in postsecondary institutions is important. However, over
the last few years, the number of adult learners enrolled in postsecondary education in Louisiana
has continued to decline.
GOAL 2: FOSTER INNOVATION THROUGH RESEARCH IN SCIENCE AND TECHNOLOGY IN
LOUISIANA
29 Quantitative Performance Measures
In the fourth year of Master Plan reporting, several research metrics, particularly related to
campus research expenditures, have shown significant growth over baseline reporting. NSF’s
methodology for reporting expenditures from industry/business sources has recently changed
however, complicating comparisons of current data with data submitted in previous years.
The BOR recently replaced “Queen Bee”, the core super computer purchased in 2007 for the
LONI Research Network. Replacing this out-of-date hardware with new state-of-the-art
equipment has allowed research computation in Louisiana to continue at a very high level,
enabling a broad and diverse catalog of research activities through its peak performance of nearly
1.5 PetaFlops (over 30 times faster than Queen Bee).
Recently, significant reductions to higher education’s state general fund appropriations have
reduced campuses’ discretionary funds to support faculty research projects, lab upgrades, start-
up packages, library acquisitions, and other critical elements in advancing the culture and
practice of state-of-the-art research. To address this shortfall, Board of Regents staff, campus
research officers, and economic development stakeholders are developing mechanisms to target
limited resources in research areas of high priority to Louisiana, including Advanced
Manufacturing and Materials, Life Sciences and Bioengineering, Digital Media and Enterprise
Software, Coastal and Water Management, and Clean Technology and Energy. By focusing on
these limited areas linked to economic development and workforce growth in the State as well as
=13 =13 =3
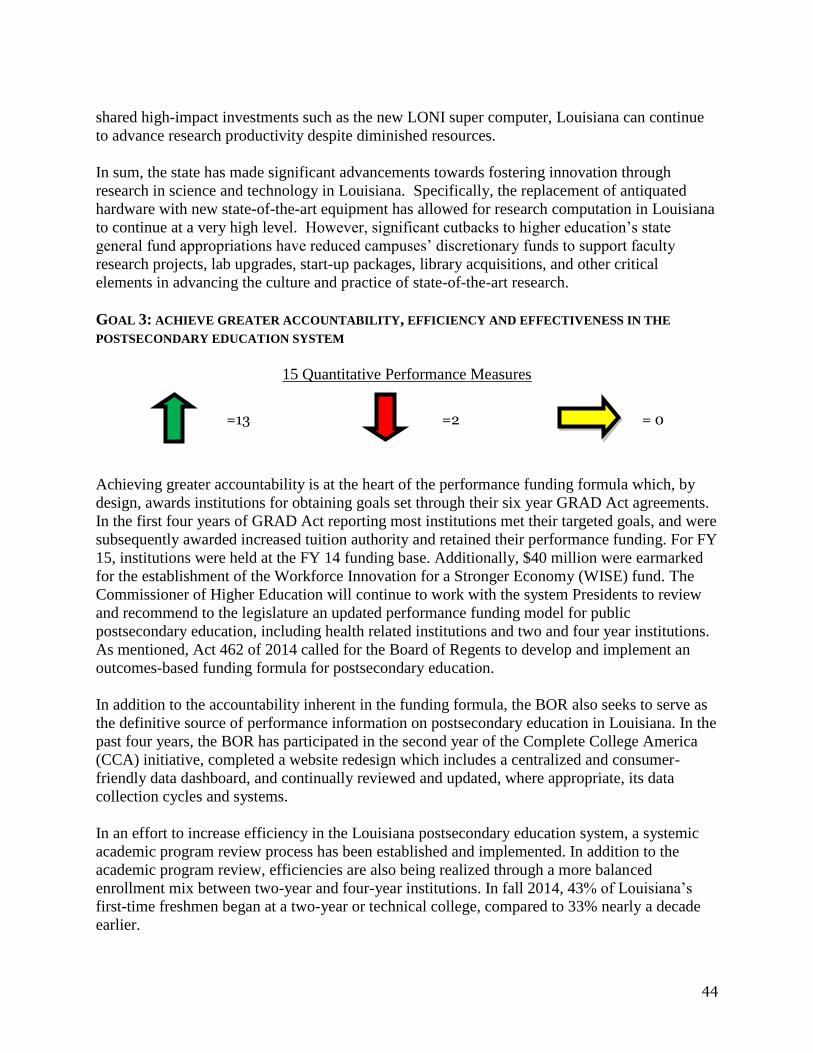
44
shared high-impact investments such as the new LONI super computer, Louisiana can continue
to advance research productivity despite diminished resources.
In sum, the state has made significant advancements towards fostering innovation through
research in science and technology in Louisiana. Specifically, the replacement of antiquated
hardware with new state-of-the-art equipment has allowed for research computation in Louisiana
to continue at a very high level. However, significant cutbacks to higher education’s state
general fund appropriations have reduced campuses’ discretionary funds to support faculty
research projects, lab upgrades, start-up packages, library acquisitions, and other critical
elements in advancing the culture and practice of state-of-the-art research.
GOAL 3: ACHIEVE GREATER ACCOUNTABILITY, EFFICIENCY AND EFFECTIVENESS IN THE
POSTSECONDARY EDUCATION SYSTEM
15 Quantitative Performance Measures
Achieving greater accountability is at the heart of the performance funding formula which, by
design, awards institutions for obtaining goals set through their six year GRAD Act agreements.
In the first four years of GRAD Act reporting most institutions met their targeted goals, and were
subsequently awarded increased tuition authority and retained their performance funding. For FY
15, institutions were held at the FY 14 funding base. Additionally, $40 million were earmarked
for the establishment of the Workforce Innovation for a Stronger Economy (WISE) fund. The
Commissioner of Higher Education will continue to work with the system Presidents to review
and recommend to the legislature an updated performance funding model for public
postsecondary education, including health related institutions and two and four year institutions.
As mentioned, Act 462 of 2014 called for the Board of Regents to develop and implement an
outcomes-based funding formula for postsecondary education.
In addition to the accountability inherent in the funding formula, the BOR also seeks to serve as
the definitive source of performance information on postsecondary education in Louisiana. In the
past four years, the BOR has participated in the second year of the Complete College America
(CCA) initiative, completed a website redesign which includes a centralized and consumer-
friendly data dashboard, and continually reviewed and updated, where appropriate, its data
collection cycles and systems.
In an effort to increase efficiency in the Louisiana postsecondary education system, a systemic
academic program review process has been established and implemented. In addition to the
academic program review, efficiencies are also being realized through a more balanced
enrollment mix between two-year and four-year institutions. In fall 2014, 43% of Louisiana’s
first-time freshmen began at a two-year or technical college, compared to 33% nearly a decade
earlier.
=13 =2 = 0

45
To increase student success, the BOR is committed to implementing and evaluating pilot
programs. In 2012, the BOR implemented a multi-year co-requisite education pilot program.
Since then, BOR staff has collected data from institutions participating in the developmental
pilot. Given BoR staff’s findings, new provisions have been implemented for the 2015-16
academic year. Institutions that offer co-requisite delivery must (1) have professional
development opportunities for faculty and staff; (2) implement attendance and advising policies;
and (2) ensure that the supplemental and the college-level courses are integrated and coordinated
in content.
Improvement towards Goal 3, which calls for greater effectiveness and efficiency in the
postsecondary education system, has occurred through the continued implementation of the
performance-based funding formula, participation in Complete College American (CCA)
reporting, the implementation of an annual academic program review process, and the continued
assessment of the BOR co-requisite pilot program.
OVERALL SUMMARY OF PROGRESS
PERCENTAGE OF PERFORMANCE MEASURES THAT SHOWED IMPROVEMENT OVER BASELINE
YEAR 1 YEAR 2 YEAR 3 YEAR 4
GOAL 1 72.2% 64.1% 59.2% 57.4%
GOAL 2 53.5% 62.0% 57.1% 44.8%
GOAL 3 80.0% 86.6% 66.6% 86.6%