master drainage plan - c.ymcdn.com · incorporate roadside ditch adequacy determination into...
TRANSCRIPT
10/5/2015
1
│
STORM WATER EVALUATION ENHANCEMENT TOOL (SWEET)
FOR THE CITY OF HOUSTON
September 3, 2015 TFMA Fall Summit ‘15
│
City of Houston:
Carol Ellinger Haddock, P.E. – Sr. Assistant Director
Paresh Lad – Sr. Project Manager
RPS-Klotz Associates:
Gary Struzick, P.E. – Sr. Technical Advisor
William Conlan, P.E. – Sr. Project Manager
Phil Bullock, P.E. – Project Engineer
Manuel Razo, GISP – Sr. GIS Technician
THE TEAM
2
│
Identify Areas of ‘Need’
Ability to identify, prioritize & rank City-
wide
Move away from reactive process and
subjective inputs
Use new technology
HOUSTON’S CHALLENGES
3

10/5/2015
2
│
THE SOLUTION
4
Identify Need
•Comprehensive Drainage Plan, Flooding Complaints, Structural Flooding Damage, Mobility
Assess/Evaluate Need AreasStudy needs through pre-engineering
Score and Rank Needs
•Use City-wide data
Prioritize Candidate Projects
•Use a cost-benefit score
•Refer candidates to CIP for programming
Implement Projects
•Design & Construction
Operate System
•Maintenance & Repair
│
GIS Based Tool
Easily Updatable/Dynamic
Consistent/Replicable Results
Transparent
THE TOOLBAR
5
│
Existing Conditions
DEA adequacy- Polygon
Flood Complaints – Point
Ponding over 2ft – Raster
Capacity
Structural Flooding - Point
FEMA Repetitive Losses - Point
NFIP Losses - Point
Regulatory
Impassable Streets Complaints - Point
SWEET TOOLBAR - STORM
6

10/5/2015
3
│
Expand on current CDP coverage and detail
Determine Level of Service (LOS) of areas served by roadside ditch
Update LOS determination of areas served by closed conduit storm sewer
Incorporate roadside ditch adequacy determination into city-wide Drainage Evaluation Analysis (DEA)
Utilize improved technology and data to refine process and accuracy of calculations
PURPOSE OF UPDATES
7
│
Determine LOS in Roadside Ditch
Delineate drainage areas at control points (U/S node of culverts)
Determine % Impervious to define flow for design storms
Determine carrying capacity of each ditch segment through cross sectional area with calculated slope (Manning’s Eq’n)
Determine LOS in Storm Sewer Systems
Analyzed 18” and larger pipes that are longer than 30-ft
Delineate drainage area at control points (Manholes)
Define flows using % Impervious raster
Determine carrying capacity with variable velocity based on pipe diameter
DEA UPDATE PROCESS
8
│
ROADSIDE DITCH NETWORK
9

10/5/2015
4
│
DATA GATHERING PROCESS
│
TYPICAL CROSS SECTION
11
│
PYTHON Programming Script
Free, cross-platform, open- source
Incorporated into ArcGIS (9.0 release)
Large processing time
Access in ArcMap and ArcCatalog
1. DEM Slice Script (67 DEMs into 16 Grids)
Systematic sorting of geodatabase
Contains processes rasters
2. Drainage Area Script
Over 62,500 points to delineate watersheds
Automated process• Ensures consistency, timeliness, and accuracy
Zonal statistics tool used to calculate imperviousness
PROGRAMMATIC AUTOMATION
12
10/5/2015
5
│
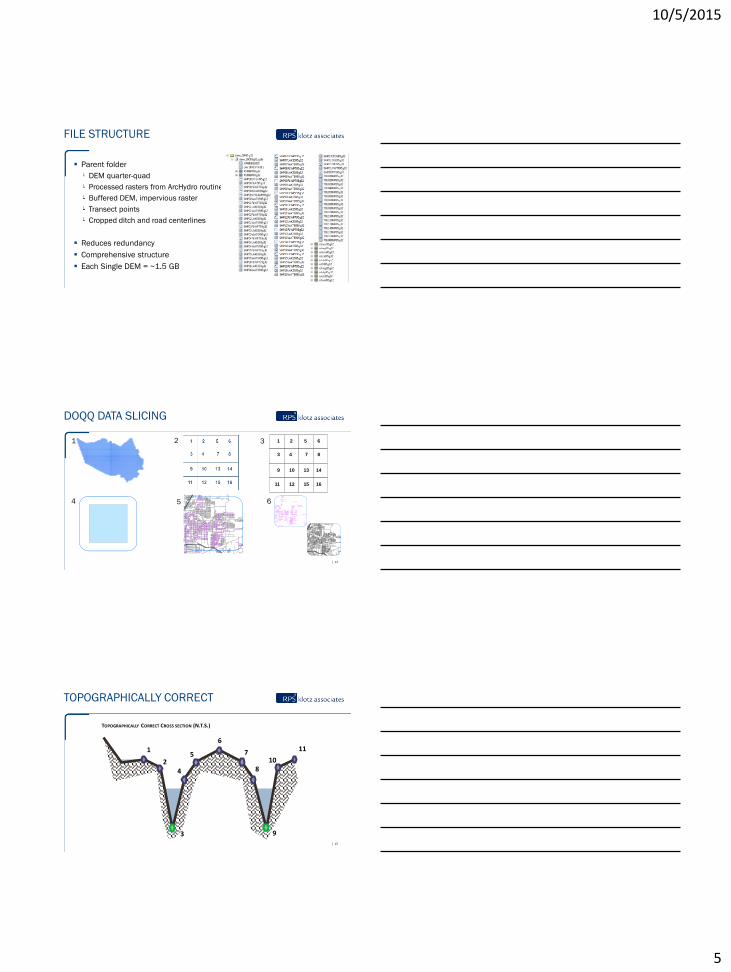
Parent folder
DEM quarter-quad
Processed rasters from ArcHydro routine
Buffered DEM, impervious raster
Transect points
Cropped ditch and road centerlines
Reduces redundancy
Comprehensive structure
Each Single DEM = ~1.5 GB
FILE STRUCTURE
13
│
DOQQ DATA SLICING
14
1 2 1 2
3 4
5
7
6
8
9
11
10
12
13
15
14
16
3
4 5 6
│
TOPOGRAPHICALLY CORRECT
15
1
2
3
4
5
6
7
8
9
10
11
TOPOGRAPHICALLY CORRECT CROSS SECTION (N.T.S.)

10/5/2015
6
│
HYDROLOGICALLY CORRECT
16
│
INCORRECT CULVERT DIRECTION
17
│
REFINING CULVERT DIRECTION
18
Roadside Ditch
Flowline
Downstream Elev:
45.1213
Culvert Line
Upstream Elev:
45.1214
Roadside Ditch
Flowline
Shortened
Drainage Area

10/5/2015
7
│
FLIPPING CULVERT DIRECTION
19
Roadside Ditch Flowline
Correct Culvert Direction
Roadside Ditch
Flowline
Incorrect Culvert
Direction
ALL RED
ALL GREEN
MIXED RED
& GREENMIXED RED
& GREEN
│
MINI-LAKES ROUTINE
20
│
QUAD COVERAGE 29095G32
21
• 4,359 individual
delineations
10/5/2015
8
│
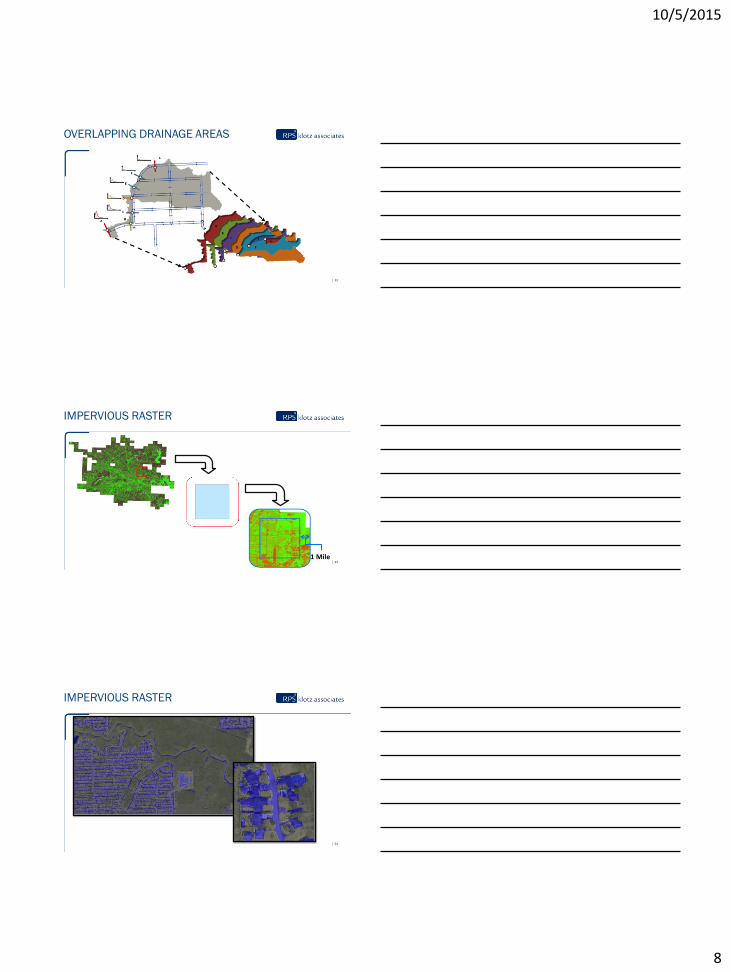
OVERLAPPING DRAINAGE AREAS
22
│
IMPERVIOUS RASTER
23
1 Mile
│
IMPERVIOUS RASTER
24

10/5/2015
9
│
CONTROL POINT DETERMINATION
25
41.2841.24
40.52
38.75
39.98
40.85 40.82
40.37
38.53
39.34
40.04
Elev
atio
n (
Ft)
Station (Ft)
Acting Control Point
for Roadside Ditch
containing Points 1-5Acting Control Point
for Roadside Ditch
containing Points 7-11
│
CONTROL POINT DETERMINATION
26
│
ADEQUACY LAYER (SHAPEFILE)
27

10/5/2015
10
│ 28
│
DATA CHECK
29
│
STATISTICS
30
Linework Statistics
LOS Statistics

10/5/2015
11
│
STORM WATER EVALUATION ENHANCEMENT TOOL (SWEET)
FOR THE CITY OF HOUSTON
September 3, 2015 TFMA Fall Summit ‘15
QUESTIONS