master copy
TRANSCRIPT
PREFACE WHY IS ANALYTICS THE CAREER FOR THE FUTURE ?
Analytics can help companies synthesize data into insights that can increase busi-ness revenues and efficiencies. The biggest challenge has been making optimum use of this data.
Professionals with the right analytic skills are in high demand.
McKinsey did a report on “Big data analytics” in 2011 and estimated a shortfall of “140,000 to 190,000 deep analytical talent” resources as well as “1.5 million data-savvy managers” in the US alone.
The possibilities for analytics continue to grow and evolve. Innovations in underlying technologies, platforms and analytic tools, drive this use. The need to evolve with their industries and skills in business analysis is a key part of this evolution. Analytics ensure that professionals keep pace with a fast evolving market.
In fact, we, the authors, believe that the “Masters in Business Administration” de-gree will also evolve to a “Masters in Business Analysis” degree.
So if you are excited about analytics and want to learn more about this field, you can begin your journey with this book. We hope you have a great career!
We live in a digital world inundated by endless amount of data. Facebook, Twitter, YouTube, LinkedIn, and other internet based businesses have led to an explosion of data in our world. Retail, telecom, healthcare, airlines, Hospitality and even the sports industry are collecting and analysing massive amounts of data.
Jigsaw Academy Education Private Limited © 2012 1
WHAT IS ANALYTICS?
Analytics can be defined as “the analysis of data to draw hidden insights to aid deci-sion making”. Businesses now a days generate huge amounts of data. This data con-tains many patterns and trends that, if identified, can act as valuable and powerful guides for business decisions and strategy. For example, an e-retailer like Amazon gets hundreds of thousands of buyers on its website every day. By analysing the be-haviour of the past customers, Amazon is able to predict what new customers may be interested in.
WHY dO I NEEd TO LEARN ANALYTICS?
According to IBM, 90% of the data in this world has been produced in the last 2 years. This is an indicator of the torrent of data that has engulfed all facets of our life. The hu-man mind is not capable of dealing with such large amounts of data. This is especially true in business. Large businesses have thousands of gigabytes of data containing billions of pieces of information. We need specialized tools and techniques to make sense of so much information. Hence, analytics has become a crucial part of managing any business.
Currently, there is a global shortage of trained analytic professionals. Acquiring analytic skills will secure your career for the future.
HOW SHOULd I USE THIS gUIdE?
This guide is meant to serve as a starting point for those who have little or no prior exposure to analytics. If you are seriously interested in this field, we recommend reading this guide from front to back. It's short and easy to understand. There's a printable PDF version for those who'd prefer, and scores of links to resources like blogs, forums, e-groups, websites, videos, white papers and books.
We wish you all the best for your journey to becoming an analytics wiz. We hope you find this guide a useful first step.
INTRO TO BEgINNER’S gUIdE
Are you looking for an exciting and rewarding career? Heard about analytics but don’t know if it is the right choice for you? The Beginner’s Guide to Analytics has been designed by industry experts and provides comprehensive information you need to start off in analytics. Over 25000 readers have already benefited from it and you could be next.
Let’s get you started in the exciting world of analytics!
The Beginner's Guide to Analytics is an in depth tutorial on everything you need to know about analytics as a career. You can download your copy of the world's most read guide on analytics right here.
s
Jigsaw Academy Education Private Limited © 2012 2
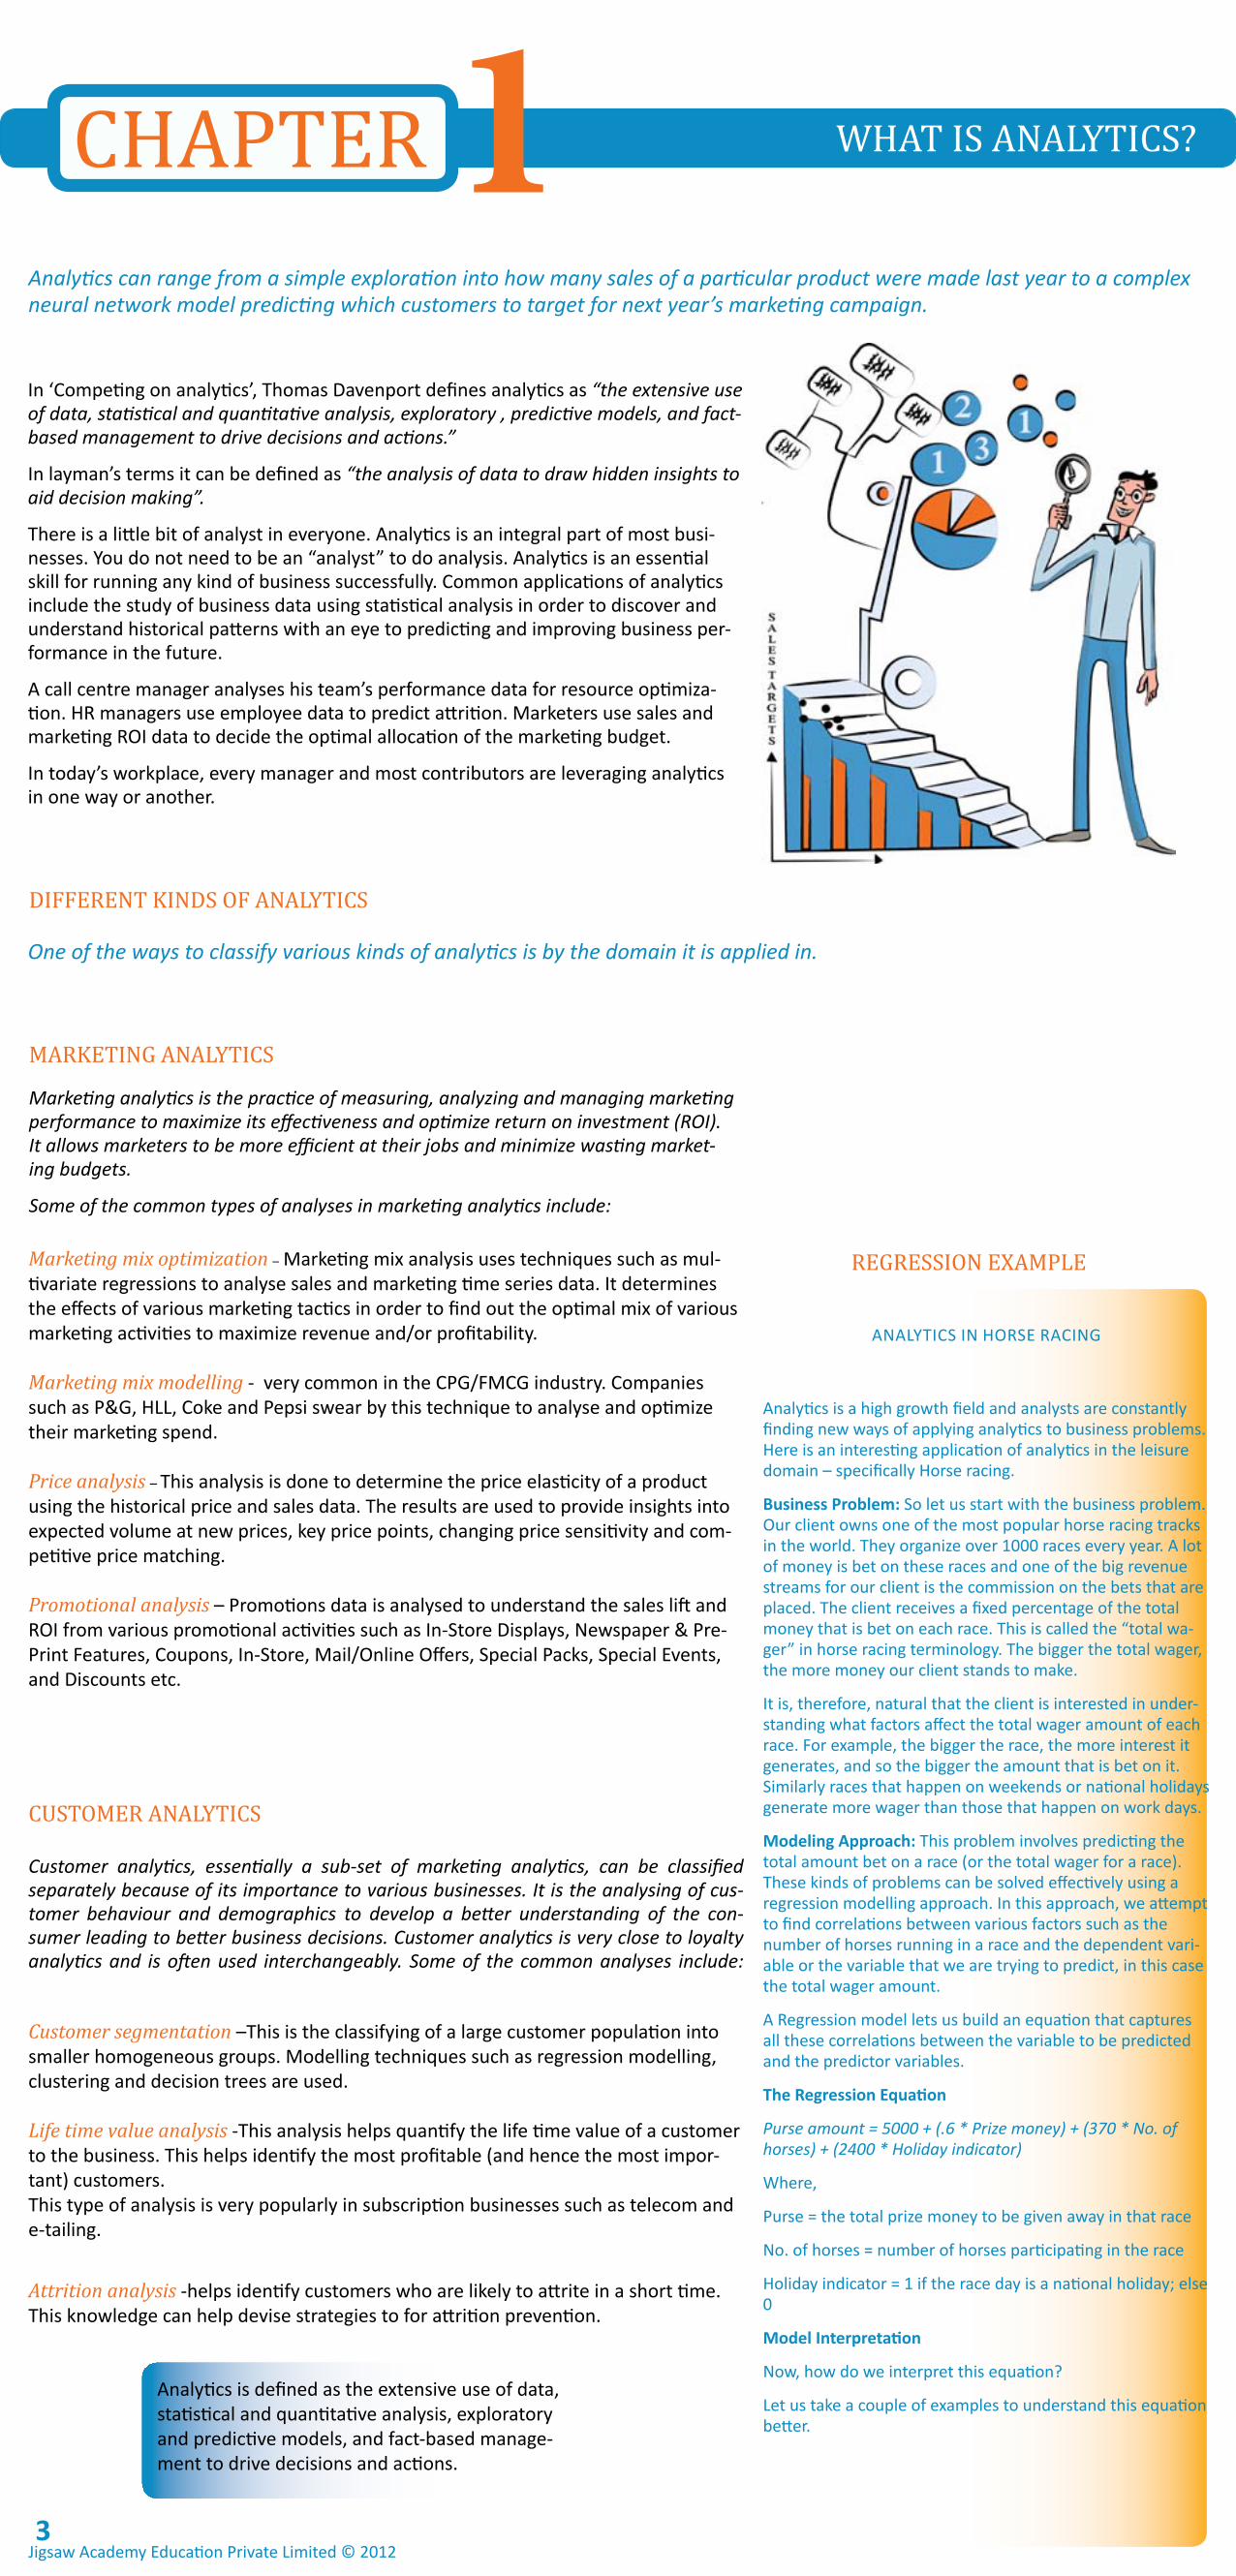
In ‘Competing on analytics’, Thomas Davenport defines analytics as “the extensive use of data, statistical and quantitative analysis, exploratory , predictive models, and fact-based management to drive decisions and actions.”
In layman’s terms it can be defined as “the analysis of data to draw hidden insights to aid decision making”.
There is a little bit of analyst in everyone. Analytics is an integral part of most busi-nesses. You do not need to be an “analyst” to do analysis. Analytics is an essential skill for running any kind of business successfully. Common applications of analytics include the study of business data using statistical analysis in order to discover and understand historical patterns with an eye to predicting and improving business per-formance in the future.
A call centre manager analyses his team’s performance data for resource optimiza-tion. HR managers use employee data to predict attrition. Marketers use sales and marketing ROI data to decide the optimal allocation of the marketing budget.
In today’s workplace, every manager and most contributors are leveraging analytics in one way or another.
AnALYTICS In HORSE RACIng
Analytics is a high growth field and analysts are constantly finding new ways of applying analytics to business problems. Here is an interesting application of analytics in the leisure domain – specifically Horse racing.
Business Problem: So let us start with the business problem. Our client owns one of the most popular horse racing tracks in the world. They organize over 1000 races every year. A lot of money is bet on these races and one of the big revenue streams for our client is the commission on the bets that are placed. The client receives a fixed percentage of the total money that is bet on each race. This is called the “total wa-ger” in horse racing terminology. The bigger the total wager, the more money our client stands to make.
It is, therefore, natural that the client is interested in under-standing what factors affect the total wager amount of each race. For example, the bigger the race, the more interest it generates, and so the bigger the amount that is bet on it. Similarly races that happen on weekends or national holidays generate more wager than those that happen on work days.
Modeling Approach: This problem involves predicting the total amount bet on a race (or the total wager for a race). These kinds of problems can be solved effectively using a regression modelling approach. In this approach, we attempt to find correlations between various factors such as the number of horses running in a race and the dependent vari-able or the variable that we are trying to predict, in this case the total wager amount.
A Regression model lets us build an equation that captures all these correlations between the variable to be predicted and the predictor variables.
The Regression Equation
Purse amount = 5000 + (.6 * Prize money) + (370 * No. of horses) + (2400 * Holiday indicator)
Where,
Purse = the total prize money to be given away in that race
no. of horses = number of horses participating in the race
Holiday indicator = 1 if the race day is a national holiday; else 0
Model Interpretation
now, how do we interpret this equation?
Let us take a couple of examples to understand this equation better.
dIFFERENT KINdS OF ANALYTICS
MARKETINg ANALYTICS
Marketing analytics is the practice of measuring, analyzing and managing marketing performance to maximize its effectiveness and optimize return on investment (ROI). It allows marketers to be more efficient at their jobs and minimize wasting market-ing budgets.
Some of the common types of analyses in marketing analytics include:
Marketing mix optimization – Marketing mix analysis uses techniques such as mul-tivariate regressions to analyse sales and marketing time series data. It determines the effects of various marketing tactics in order to find out the optimal mix of various marketing activities to maximize revenue and/or profitability.
Marketing mix modelling - very common in the CPg/FMCg industry. Companies such as P&g, HLL, Coke and Pepsi swear by this technique to analyse and optimize their marketing spend.
Price analysis – This analysis is done to determine the price elasticity of a product using the historical price and sales data. The results are used to provide insights into expected volume at new prices, key price points, changing price sensitivity and com-petitive price matching.
Promotional analysis – Promotions data is analysed to understand the sales lift and ROI from various promotional activities such as In-Store Displays, newspaper & Pre-Print Features, Coupons, In-Store, Mail/Online Offers, Special Packs, Special Events, and Discounts etc.
CUSTOMER ANALYTICS
Customer analytics, essentially a sub-set of marketing analytics, can be classified separately because of its importance to various businesses. It is the analysing of cus-tomer behaviour and demographics to develop a better understanding of the con-sumer leading to better business decisions. Customer analytics is very close to loyalty analytics and is often used interchangeably. Some of the common analyses include:
Customer segmentation –This is the classifying of a large customer population into smaller homogeneous groups. Modelling techniques such as regression modelling, clustering and decision trees are used.
Life time value analysis -This analysis helps quantify the life time value of a customer to the business. This helps identify the most profitable (and hence the most impor-tant) customers.This type of analysis is very popularly in subscription businesses such as telecom and e-tailing.
Attrition analysis -helps identify customers who are likely to attrite in a short time. This knowledge can help devise strategies to for attrition prevention.
1CHAPTER WHAT IS ANALYTICS?
One of the ways to classify various kinds of analytics is by the domain it is applied in.
Analytics can range from a simple exploration into how many sales of a particular product were made last year to a complex neural network model predicting which customers to target for next year’s marketing campaign.
REgRESSION EXAMPLE
Analytics is defined as the extensive use of data, statistical and quantitative analysis, exploratory and predictive models, and fact-based manage-ment to drive decisions and actions.
Jigsaw Academy Education Private Limited © 2012 3
Race 1
Purse = $20000
no. of horses = 10
Holiday indicator = 0 i.e. race day is not a holiday
Race 2
Purse = $7500
no. of horses = 6
Holiday indicator = 1 i.e. race day is a holiday
Predicted purse
Race 1 = 5000 + (.6 * 20000) + (370 * 10) + (2400 * 0) = 5000 + 12000 + 3700 + 0 = $20700
Race 2 = 5000 + (.6 * 7500) + (370 * 6) + (2400 * 1) = 5000 + 4500 + 2220 + 2400 = $14120
Key takeaways
The most obvious takeaway from this is that the model predicts that about $20k will be bet on the first race and $14k on the second one.
But there are other learnings as well.
For every increase of $100 in the purse, the client can ex-pect an increase of $60 in the total wager
If the number of horses increases by 1, the total wager is expected to increase by $370.
If the race happens on a holiday, one can expect an in-crease in the total wager by about $2400 compared to other days.
Creating business strategy from analytical insights
How does the client benefit from this analysis? This is of course the most pertinent question. How does a business use these insights for their benefit?
In this case, let us examine the 3 factors that have come out significant in the model.
Prize money – We now understand that prize money has a direct correlation with the total wager amount. If you increase the prize money, the total wager amount will also increase. This is perhaps fairly intuitive, especially to those in this business. But our model has not only verified this hunch, but has also helped us quantify the nature of this relationship. For a $100 increase in the prize money, the total wager increases by $60. This information cannot be derived from someone’s experience or intuition. Only real number crunching on data of thousands of races can help us get to this. now, it is up to the client to decide if it makes business sense to increase the prize money of a race or not.
No. of horses in the race – Again, it is fairly obvious to people with experience in this field that the more the number of horses in a race, the more the money bet on it. But our model goes one step further and tells us that we can expect an increase of $370 in the total wager amount if we get an additional horse in the race.
Holiday indicator – The third factor is also not a surprise but more of a validation of intuition. Additionally, we now know that holidays add about $2400 per race to the total wager amount.
Analytics has helped us validate hypotheses about vari-ous affecting factors formed through years of experience. Additionally, it has helped us quantify the nature of the relationships. A smart business manager will use this in-formation to make more informed decisions and prioritise more effectively.
In this case, our client deduced that his efforts are best spent on ensuring that he maximises the number of horse running in each race.
RISK ANALYTICS
Risk analytics refers to analyses that are performed to understand, quantify and manage the risk associated with an activity. Common use of risk analytics includes identifying high-risk customers for a credit card or a loan company. Some of the popular analyses include:
Acquisition modelling – This is usually done on applications data (i.e. data collect-ed at the time of the application) and predicts the likelihood of future default. This helps identify un
WEB ANALYTICS
Web analytics is the analysis of internet data to understanding and optimizing web usage.It provides information about the number of visitors, hits and page views to a website. It helps gauge traffic and popularity trends which is useful for market re-search.
The use of Web analytics enables a business to retain and attract customer and in-crease their profitability. There are two categories of web analytics: off-site and on-site web analytics.
Behavioural scoring – help predict the risk and profitability of existing customers using their transaction and credit history. It also helps classify customers based on their risk profile.
Basel II analytics - The International Committee on Banking Supervision (Basel Committee) issued the Basel II Accord to improve the risk management practices of the world’s banks. This has resulted in the availability of an extensive amount of data. Analysis of this data can provide more accurate estimations of risk exposures and the capital set aside to guard against the financial and operational risk. Base II analytics includes:
• Computation of Probability of Default (PD) • Computation of Loss given Default (LgD) • Computation of Exposure at Default (EAD) • Collection Scorecard development
Off-site web analytics - refers to web measurement and analysis regardless of whether you own or maintain a website. It includes the measurement of a web-site’s potential audience (opportunity), share of voice (visibility), and buzz (com-ments) on the internet.
On-site web analytics - measure a visitor’s journey once on your website. This includes its drivers and conversions. For example, it tracks pages that encourage people to make a purchase and measures the commercial performance of the web-site. This data is typically compared against key performance indicators, and is used to improve a web site or marketing campaign’s audience response.
HUMAN RESOURCE ANALYTICS
Most large organizations have some form of a human resource information sys-tem that captures employee information such as hiring date, compensation and its growth over time, promotions, roles and performance ratings. Some companies will also capture additional attributes such as skill ratings, previous experience, trainings attended etc.
This kind of information can be the source for important insights. Organizations can predict which of their employees are likely to leave them and use measures to retain the desirable ones and manage the attrition more effectively. Analytics can identify training needs and processes effectively. Data from the vendor manage-ment systems can be used by companies to track efficiency and effectiveness of recruitment processes.
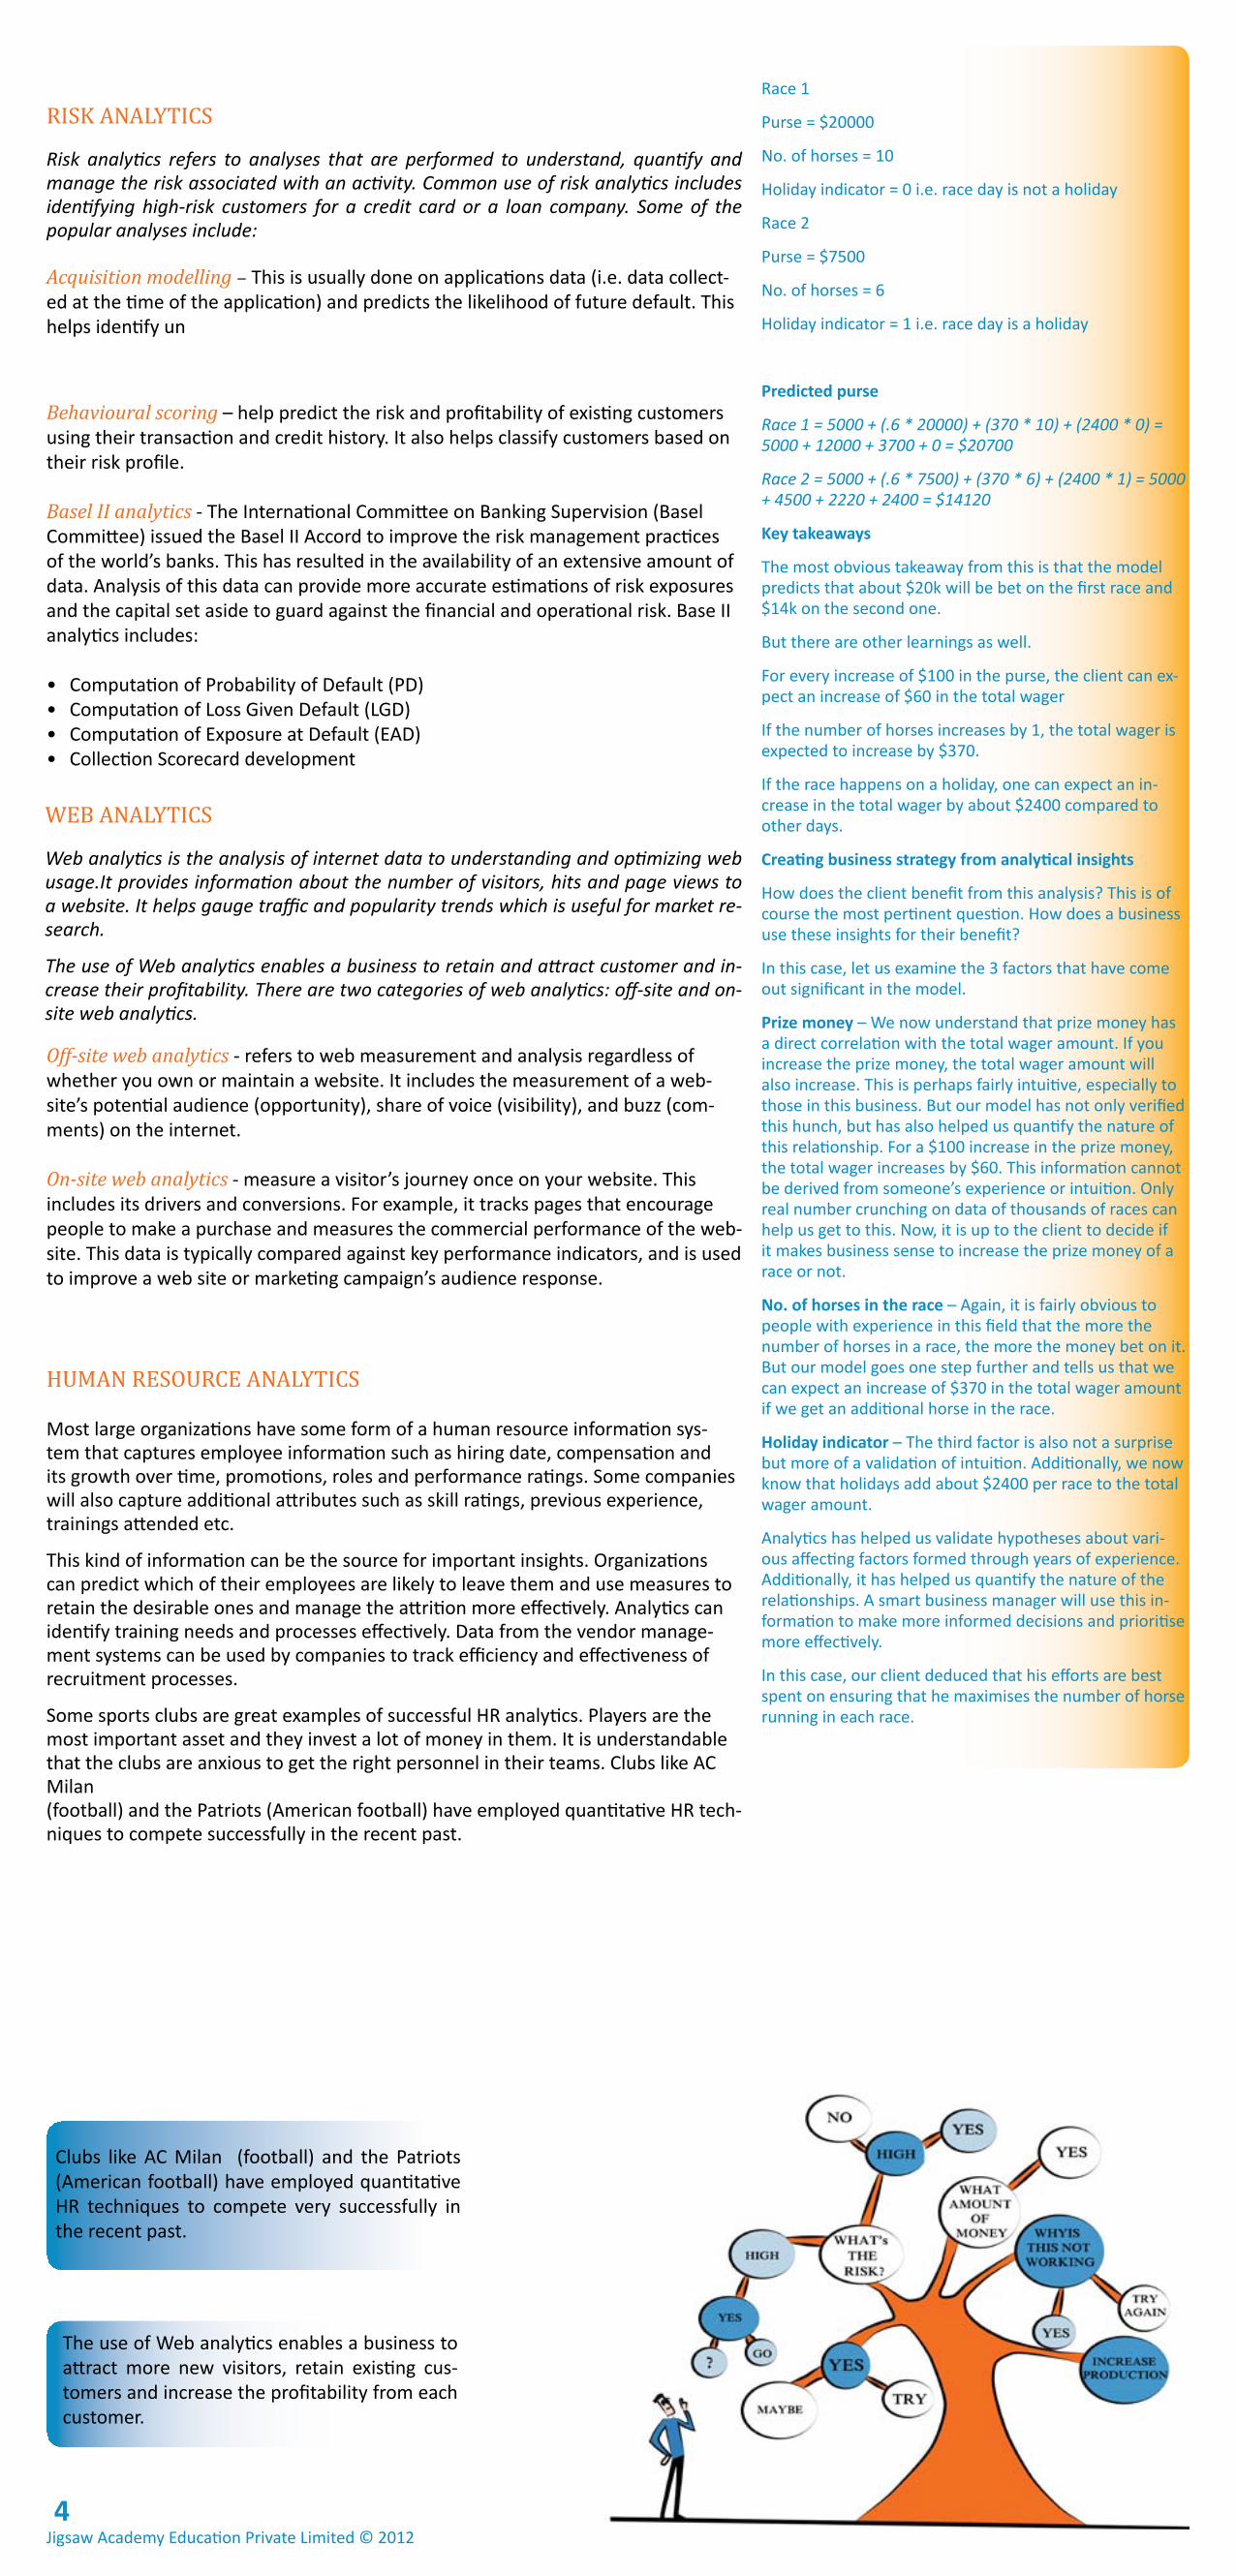
Some sports clubs are great examples of successful HR analytics. Players are the most important asset and they invest a lot of money in them. It is understandable that the clubs are anxious to get the right personnel in their teams. Clubs like AC Milan (football) and the Patriots (American football) have employed quantitative HR tech-niques to compete successfully in the recent past.
The use of Web analytics enables a business to attract more new visitors, retain existing cus-tomers and increase the profitability from each customer.
Clubs like AC Milan (football) and the Patriots (American football) have employed quantitative HR techniques to compete very successfully in the recent past.
Jigsaw Academy Education Private Limited © 20124
FRAUd ANALYTICS
Fraud detection is applicable to many industries- retail, banking, insurance, govern-ment agencies, law enforcement, and more. In banking, fraud can involve using stolen credit cards, forging checks, etc. In insurance, a quarter of the claims contain some form of fraud, resulting in approximately 10% of insurance pay-out dollars. Fraud can range from exaggerated losses to deliberately causing an accident for the pay-out. Since relatively few cases show fraud in a large population, finding these can be tricky.
Fraud analytics involves analysing millions of transactions and/or applications to spot patterns and detect fraud.
Logistic regression, neural networks and decision trees are some modelling tech-niques used in fraud detection.
HEALTHCARE ANALYTICSHealthcare analytics is a fast growing field that focuses on application of analytics in the health care domain. Some of the common analyses include:
Clinical research analytics – This involves analysis of clinical trials data to see whether a drug has a beneficial effect.
Other analyses- include market forecast, marketing effectiveness and sales re-source optimization
These are some of the most common domain-specific applications of analytics. Other applications include R&D analytics, optimization analytics, collections analyt-ics, market research and many more.
For someone who is looking to enter into the field of analytics, it is easy to get overwhelmed by all the different domains and terminologies. However, it’s impor-tant to remember that while analytics can be applied to many domains, the under-lying methodology remains the same regardless of the application. For example, logistic regression can be applied in marketing, risk, sports and web analytics.
Today, we have covered the definition and application of analytics in different domains. We have also learnt that what changes across domains is the data you work with and the business problem you are trying to solve – and not the statisti-cal technique or the basic analytic approach to follow. It is important to have a firm grasp on the different steps of the analytic methodology and underlying statistical techniques.
ANALYTICS TERMINOLOgY
Analytics – Analytics can simply be defined as the process of breaking a problem into simpler parts and using inferences based on data to drive decisions. Analytics is not a tool or a technology; rather it is a way of thinking and acting.At one end, Analytics overlaps with statistics and higher mathematics. At the other, it merges seamlessly with programming and software development.Analytics has wide-spread applications in spheres as diverse as science, astronomy, genetics, financial services, telecom, retail, marketing, sports, gaming and health care.
Business Analytics – This term refers to the application of analytics specifically in business. It includes subsets like –
• Marketing analytics
• Risk analytics
• Fraud analytics
• CRM analytics
Industries which rely extensively on analytics include –
• Retail
• Telecom
• Health care
• Airlines
• Financial Services (Banks, Credit Cards, Loans, Insurance etc.)
• Any industry where large amounts of data is generated
Predictive Analytics – The term emphasizes the predictive nature of analytics (as
• Loyalty analytics
• Operations analytics
• HR analytics
• Consumer goods
• Manufacturing
• Sports
• Hotels
There are many terms that are used in the analytics industry. To someone looking to enter into this field, dealing with such varied terminology is intimidating. Here, we will explain some of the commonly used and misused terms in Analytics.
While analytics can be applied to many domains in different ways, the underlying analytics meth-odology as well as the modeling techniques remain the same regardless of the application. For example, logistic regression can be applied in marketing analytics as well as risk analytics. It can also be applied in web analytics or sports analytics.
Data mining, machine learning, artificial intelli-gence and knowledge discovery are all terms that are often used interchangeably with analytics.
Jigsaw Academy Education Private Limited © 20125
opposed to, say the retrospective nature of tools like OLAP). This is a term that is designed by sales people and marketers to add glamour to any business. “Predic-tive analytics” sounds fancier than just plain “analytics”. In practise, predictive analytics is rarely used in isolation from descriptive analytics. Descriptive analytics – Descriptive analytics refers to a set of techniques used to describe, explore or profile any kind of data. Any kind of reporting usually involves descriptive analytics. Data exploration and preparation are essential ingredients for predictive modelling and rely heavily on descriptive analytics.
Advanced analytics –Advanced analytics is also a marketing driven terminology. “Advanced” adds a little more punch and glamour to “Analytics” and is preferred by marketers.
Big data analytics – This term has gained popularity very recently. According to IBM, the amount of data being produced in the world is increasing so fast that 90% of the data existing today was created in the last 2 years alone. Increasingly so-phisticated tools are required to deal with such vast quantities of data. Hence, the term “big data analytics”
Data Mining – Data mining is the term that is most interchangeably used with “Analytics”. Data Mining is an older term used in the nineties and the early 2000s. However, data mining began to be confused with OLAP and led to a drive to use descriptive terms like “Predictive analytics”. According to google trends, “Analytics” overtook “Data mining” in 2005 and is about 5 times more popular now.
Knowledge Discovery – Knowledge discovery also means analytics, predictive ana-lytics, advanced analytics, big data analytics and data mining.
Artificial Intelligence – The term “Artificial intelligence” was popular in the early stages of computing and analytics (in the 70s and 80s) but is now almost obsolete.There were a lot of comparisons between computing and human learning process and this is reflected in the terminology.
Machine Learning – Similar to “Artificial intelligence” this term too has lost its popularity to words like “Analytics” and its derivatives.
Business Intelligence (BI) – The phrase had promise when it stormed to popularity in the late 90s. It started off as a broad phase that encompassed descriptive and predictive analytics. However, it soon got mixed up with OLAP and reporting .now its usage is largely in that context.
OLAP – Online analytical processing refers to descriptive analytic techniques of slicing and dicing data to understand and discover patterns and insights. The term is derived from another term “OLTP” – online transaction processing which comes from the data warehousing world.
Reporting – “Reporting” is perhaps the most unglamorous term in the world of analytics. Yet it is also one of the most widely used practices within the field. All businesses use reporting to aid decision making. While it is not “Advanced analyt-ics” or even “Predictive analytics”, effective reporting requires a lot of skill and a good understanding of the data and domain.
Data warehousing – Ok, this may actually be considered more unglamorous than even “Reporting”. Data warehousing is the process of managing a database and involves extraction, transformation and loading (ETL) of data. Data warehousing precedes analytics. The data managed in a data warehouse is usually taken out and used for business analytics.
Statistics - Statistics is the study of the collection, organization, and interpretation of data. Data mining does not replace traditional statistical techniques. Rather, it is an extension of statistical methods the result of a major change in the statistics community. The increased power of computers and their lower cost, coupled with the need to analyze enormous data sets with millions of rows, have allowed the development of new techniques based on a brute-force exploration of possible solutions.
LINKS TO WIKIPEdIA
• http://en.wikipedia.org/wiki/Analytics
• http://en.wikipedia.org/wiki/Business_analytics
• http://en.wikipedia.org/wiki/Predictive_analytics
• http://en.wikipedia.org/wiki/Big_data
• http://en.wikipedia.org/wiki/Data_min-ing
• http://en.wikipedia.org/wiki/Knowledge_discovery
• http://en.wikipedia.org/wiki/Artifi-cial_intelligence
• http://en.wikipedia.org/wiki/Ma-chine_learning
• http://en.wikipedia.org/wiki/Busi-ness_intelligence
• http://en.wikipedia.org/wiki/Olap
• http://en.wikipedia.org/wiki/Data_warehouse
• http://en.wikipedia.org/wiki/Statis-tics
A strong quantitative aptitude as well as a high degree of comfort in dealing with num-bers and data are two of the most important attributes required to succeed in analytics.
Jigsaw Academy Education Private Limited © 20126
2CHAPTER IS ANALYTICS RIgHT FOR ME?
Are you unsure about analytics being the right career choice for you? In this article we will discuss what it takes to succeed in analytics.
Analytics plays a strategic role in running any business and is thus becoming a career of choice for MBAs. Engineers and MCAs have also made a mark in this fast growing field.
Jigsaw Academy Education Private Limited © 20127
The purpose of this section is to identify the qualities desired in analyst as well as list the skills and knowledge required to succeed.
Keen sense of intellectual curiosity: People who do well in analytics typically have a keen sense of inquisitiveness. They want to know the whys and hows of any situa-tion. There has to be an interest in understanding the business issue and working out the specifics of the solution.
Mathematically oriented: To do well in analytics, you need to be comfortable with mathematical concepts, and not be afraid to use mathematical tools. This is not the career for you if the word Mathematics strikes fear in your heart!
Big picture vision: It is important to always remember the larger business issue that is being addressed through the process of working with data and dealing with mi-nutiae.
Detail oriented: While it is important to remember the big picture, it is critical to pay attention to the details. While working with large volumes of data it is easy to lose sight of the specifics that add insight and understanding to solving business is-sues.
Interpretation skills: An analyst has to have the ability to interpret and solve prob-lems. numbers by themselves mean nothing. Experience and domain understand-ing give one the ability to interpret the results in the business context. The results aid in building strategies for business development.
There are other skills that one can acquire through education, training and experi-ence.
• Knowledge of Statistics • Knowledge of analytic tools like SAS, R, Excel, SQL, SPSS, Knowledgestudio etc. • Knowledge of the analytics methodology – the different steps to be followed for
any analytics project • Predictive modelling techniques such as regression, decision trees, clustering,
market basket analysis etc. • Experience with large data sets • Project work such as segmentation, attrition modelling etc.
WHAT dOES IT TAKE TO SUCCEEd IN ANALYTICS?
Academic Qualifications for AnalyticsAnalytics is attracting talent from many different fields. Previously, candidates with a masters or doctoral degree in Statistics or Economics were preferred.Today gradu-ates, postgraduates and PhDs from all quantitative such as math, science and com-merce are part of the industry:
• BBAs and MBAs
• MCA- their expertise in programming languages and database management sys-tems
• B.E.s and B.Techs- A combination of engineering and MBA is an asset in this field.
• Qualified people from Pharmaceutical and Health sciences.
• Professors
ANALYTICS CAREER IN INdIA
There are certain factors to be kept in mind :
• Indian Analytics companies have international clients giving the opportunity to work and travel globally.
• Working non-standard hours is typical but night shifts are not common. Shift timings are usually either 9am to 5pm or 12pm to 8pm.
• Since the basic statistical techniques remain constant irrespective of the domain, analysts can move from one domain to the other with relative ease. It provides an opportunity to work across multiple industries.
• growth in analytics is largely merit driven. A good analyst on a fast track could easily move up to middle management in less than 5 years. Similarly, you could be stuck at the same level for more than 2-3 years, if you do not pick up the skills required to move up to the next level.
• Analytics softwares have evolved a lot in the past 2 decades. Tools have become sophisticated, faster and user-friendly, with intuitive, easy to learn gUIs.
• The focus of a good analyst is to translate a business problem into an analytic problem and an analytic solution into business strategy.
3CHAPTER HOW dO I LEARN MORE ON ANALYTICS?
Competing on Analytics by Thomas Davenport
This is a much-needed addition to the literature of analytics. The book describes how some leading international companies are using analytics to out-smart their competition. The book is full of case studies as diverse as retail to pharmaceuticals to sports to telecom. This book is a valuable resource in under-
standing how companies like Amazon, netflix and Capital One have developed analytics as their key differentiator.
In this section, we will cover three sources of information on analytics –
• Books• Blogs• Other internet resources
BOOKS ON ANALYTICS
There are a lot of good books written on analytics. not all of them are easily avail-able in the Indian market. Many of these titles can be ordered from online book stores like Flipkart. The books which have an Indian publisher are usually cheaper whereas foreign publications are more expensive.
We have divided our list of favourite books into two sections.
The first section covers books on the fundamentals of analytics and business statis-tics. We have also included books showcasing applications of analytics in various industries.
The second section consists of books around specific analytic tools or software. These books cover tools like SAS, SPSS, R, SQL and excel.
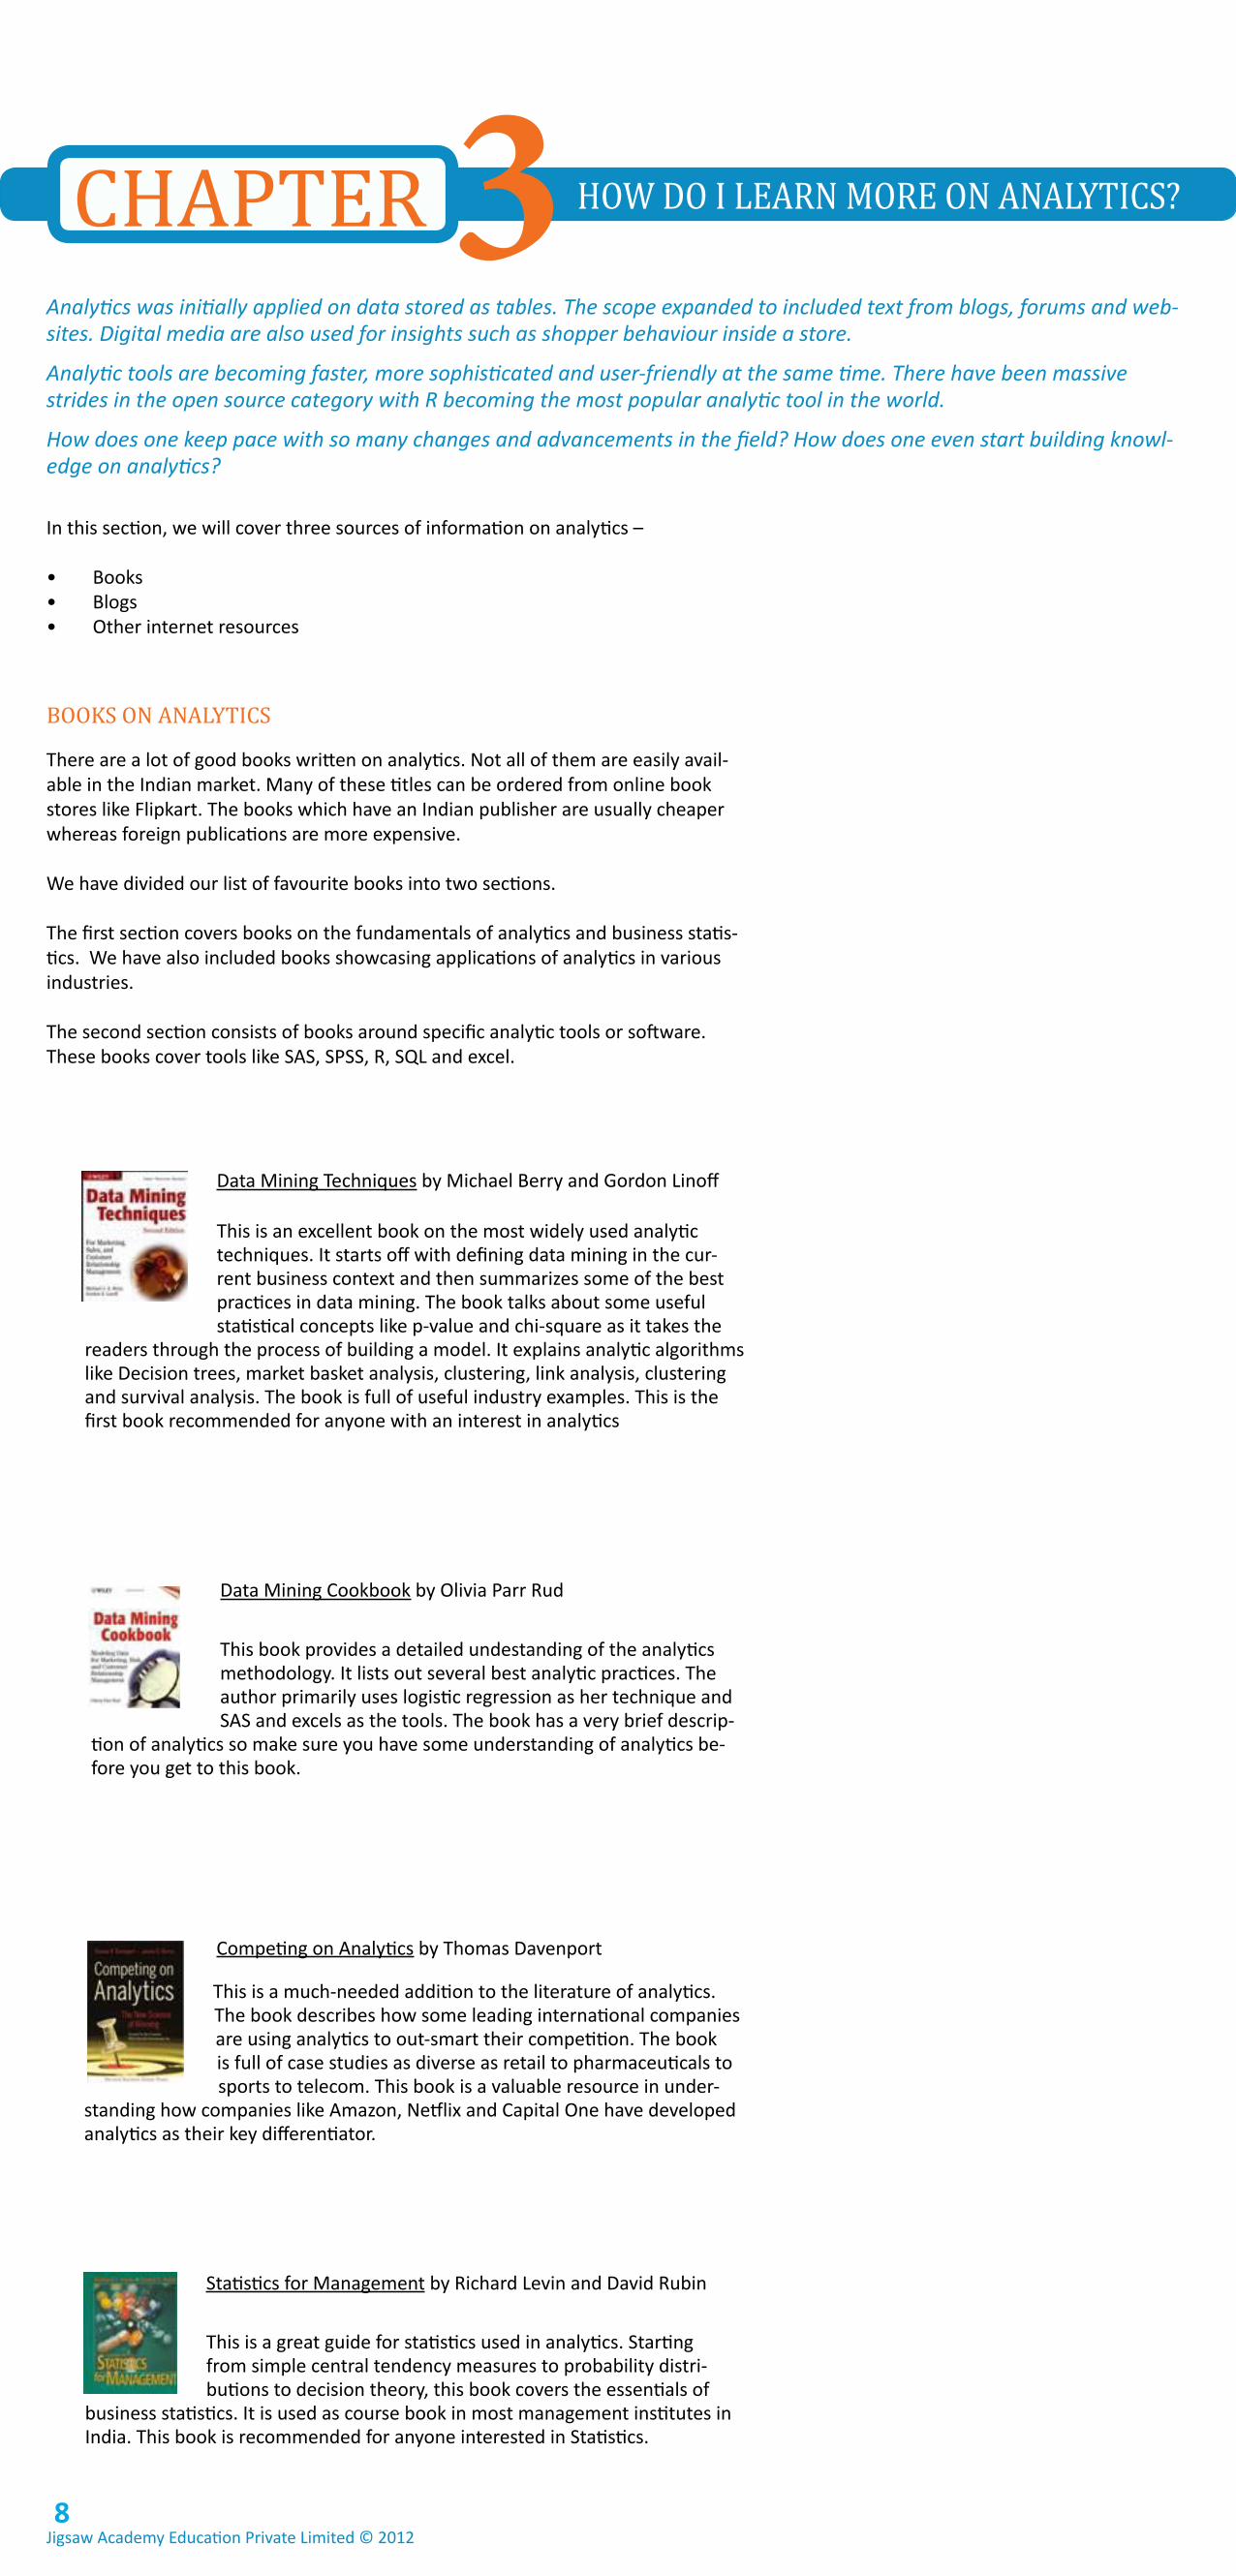
This is an excellent book on the most widely used analytic techniques. It starts off with defining data mining in the cur-rent business context and then summarizes some of the best practices in data mining. The book talks about some useful statistical concepts like p-value and chi-square as it takes the
readers through the process of building a model. It explains analytic algorithms like Decision trees, market basket analysis, clustering, link analysis, clustering and survival analysis. The book is full of useful industry examples. This is the first book recommended for anyone with an interest in analytics
Data Mining Techniques by Michael Berry and gordon Linoff
This book provides a detailed undestanding of the analytics methodology. It lists out several best analytic practices. The author primarily uses logistic regression as her technique and SAS and excels as the tools. The book has a very brief descrip-
tion of analytics so make sure you have some understanding of analytics be-fore you get to this book.
Data Mining Cookbook by Olivia Parr Rud
This is a great guide for statistics used in analytics. Starting from simple central tendency measures to probability distri-butions to decision theory, this book covers the essentials of
business statistics. It is used as course book in most management institutes in India. This book is recommended for anyone interested in Statistics.
Statistics for Management by Richard Levin and David Rubin
Analytics was initially applied on data stored as tables. The scope expanded to included text from blogs, forums and web-sites. Digital media are also used for insights such as shopper behaviour inside a store.
Analytic tools are becoming faster, more sophisticated and user-friendly at the same time. There have been massive strides in the open source category with R becoming the most popular analytic tool in the world.
How does one keep pace with so many changes and advancements in the field? How does one even start building knowl-edge on analytics?
Jigsaw Academy Education Private Limited © 20128
This book has an easy style that will appeal to beginners. Some of the more complex topics may not be adequately addressed but a good book as an introduction.
Predictive Data Mining by Sholom Weiss
Freakonomics by Steven Levitt
Freakonomics is an easy, interesting read, even for people who do not understand Statistics. The author uses the power of ana-lytics to turn conventional wisdom on its head. With hypotheses like ‘Legalization of abortions has led to crime reduction’ the
book throws up some very interesting questions for its readers. A must-read for everyone.
Moneyball by Michael Lewis
This book studies the use of analytics in the sports industry. It case studies the Oakland Athletics, a US baseball team, with a payroll budget of less than a 3rd of some their rivals. De-spite being small they have consistently been one of the best teams. The author shows how they leveraged analytics to get
their advantage. OA analyzed metrics that were different from the ones tra-ditionally looked at, but which they thought were more relevant to winning. A good example of analytics being used innovatively.
BOOKS ON ANALYTICS TOOLS
Little SAS Book by Lora Delwiche
This is a good book to learn SAS. It is readable as it is composed of two-page articles. Each one focuses on a specific task or func-tion of SAS. The book is divided in 10 chapters that go through
reading data sets, building reports, combining data sets, writing macros, using graphics, debugging SAS programs, etc. The book is a good reference for sim-ple tasks. Any simple task you don’t know? Just look in the index and you will find the corresponding function. However, for more advanced topics, the book is a bit light. Well, that’s what the title also says.
SAS Programming by Example by Ron Cody
It is one of the best books available for beginners in SAS. The book is simple and easy to read with many industry examples for better understanding. The book deals with the essentials of analytics and reporting using SAS.
Data Manipulation in R by Phil Spector
This thin book provides a solid introduction to many of the functions and packages for importing, manipulating and pro-cessing data in R. Using a variety of examples based on data sets included with R, along with easily simulated data sets, the book is recommended to anyone who wants to learn R.
Data Analysis using SQL and Excel by gordon Linoff
A good book on understanding how tools like SQL and Excel can be leveraged to extract useful business information from rela-tional databases. The book is organized around chapters that become increasingly complex in the use of SQL, Excel, and data mining concepts.
Jigsaw Academy Education Private Limited © 20129
Here is a list of the top learning resources for learning SAS language to work in this exciting field:
Books by SAS Press – The SAS Institute have a separate publishing division that focuses on the analytics ecosystem by generating and publishing a steady stream of books and literature on the SAS language.
The SAS-L Email Group- the SAS-L email group is a supportive and helpful resource for programmers at any level when stuck in a particular program. The archives are available at http://listserv.uga.edu/archives/sas-l.html . People posting on the list are expected to paste a sample of the dataset structure, and a clear explanation of what they are trying to achieve.
The SAS Community Website- SAS Users have an online wiki for collaboratively add-ing in code samples, programs and sharing tips. The site is available at http://www.sascommunity.org/wiki/Main_Page and it is quite useful in terms of daily tips to improve SAS language skills, blogs and papers.
Blogs at SAS.com – This is a collection of blogs that deal with business analytics, and technical application in various domains and SAS related happenings. With almost 29 blogs, http://blogs.sas.com is one of the better locations to build your perspective in business analytics and not just the technical aspects of writing code. SAS blogs are exclusively maintained by the SAS Institute team of communication people and feature experts from across multiple businesses.
SAS Online Document- SAS online document is the documentation available for ev-eryone by web access. It is like a big book or HTML library and you can view the lat-
Decisionstats www.decisionstats.com - Ajay Ohri, an alumnus of IIM Lucknow, has one of the most popular blogs in the field of analytics. A salient feature is an Inter-views section where leading analytics figures have been interviewed. He has been publishing articles almost at the rate of 1 a day for the last three and half years and has close to 1500 articles published on his blog.
Data Mining Blog - http://www.dataminingblog.com/ - This blog by Sandro Saitta, a Swiss national, covers research issues, recent applications, important events, inter-views with leading actors, current trends and book reviews in the field of analyt-ics. The blog has some interesting book reviews but what we like the most about this blog is the comprehensive list of analytics blogs.
This blog is written by Michael Berry and gordon Linoff, two of the leading figures in the field of analytics. The two have written some of the most popular books in this field. Their books are used extensively in data mining courses by Universities across the globe. The blog is filled with excellent tips and knowledge nuggets from the writers’ vast experience in analytics consulting and is a must-read for any busi-ness analyst.
Flowing Data - http://flowingdata.com/ - FlowingData is the visualization and sta-tistics site that shows different applications of data analysis. The blog is written by nathan Yau, a PhD candidate in UCLA. nathan wants to make data useful for even those who are not very data savvy through effective use of visual techniques.
Abbott Analytics - http://abbottanalytics.blogspot.com/ - The Abbot analytics blog is about “Tips, tricks, and comments in data mining and predictive analytics, including data preprocessing, visualization, modeling, and model deployment”
The blog is hosted by Dean Abbott, president of Abbott Analytics in California, USA. Mr. Abbott has over 21 years of experience applying advanced data mining, data preparation, and data visualization methods in real-world data intensive problems, including fraud detection, response modeling and survey analysis.
Thearling’s blog - http://www.thearling.com/ - Kurt Thearling’s website is an excel-lent place to start off if you want to learn about data mining. Kurt is a veteran in the analytics space with extensive experience in some of the leading analytic compa-nies like Capital One, Dun & Bradstreet and Vertex. Kurt is one of the thought lead-ers in this space and has authored several books on analytics.
Though the site does not get updated frequently, it is a treasure trove of interesting infor-mation. Kurt has written a series of articles/papers that cover topics ranging from the ba-sics of data mininging to advanced domain-specific techniques. His articles are written in a clear and concise manner and are easy to understand for beginners as well.
There are many other useful blogs on analytics. If you do a google search for “ana-lytics blogs” or “data mining blogs”, you can find a lot of information. This link has a fairly comprehensive though dated list of data mining blogs: - http://www.kdnug-gets.com/websites/blogs.html
est version at http://support.sas.com/documentation/onlinedoc/91pdf/index.html. It is very useful for fine-tuning your SAS language code and discovering extended functionality to your software as well as troubleshooting or debugging programs.
Papers from SAS Global Users Conference Proceedings ( SUGI) – This is an archive of papers presented at the annual conference for SAS Users. The conferences have been taking place since 1976, and the papers represent the best innovative uses in the language. They can be accessed online at http://support.sas.com/events/sas-globalforum/previous/online.html
www.thearling.com is an excellent resource for those starting off in analytics. www.datamining-blog.com is a great blog that covers news and de-velopments in analytics.
BLOgS ON ANALYTICS
Blogs are a useful learning resource for any topic these days. Analytics has its fair share of bloggers. Here is a list of some useful blogs on analytics.
SAS RESOURCES
Though the SAS language is almost 45 years old now, it remains one of the most widely used statistical programming lan-guages, competing with RSPSS, Matlab and Stata. It is facing competition with the open source language R in academia, research and customized applications
SAS global user’s conference contains an ar-chive of white papers presented at the annual conference for SAS users. SUgI is a useful re-source for any SAS user.
Jigsaw Academy Education Private Limited © 201210
R is the most popular open source analytic tool in the world. There are several resources for the R language.
There are numerous books on R*. The good news is that like R, many of these books are also available for free.
Analyticbridge is a community for analysts. This is a wonderful site to network within the ana-lytics community.
Jigsaw Academy Education Private Limited © 201211
RESOURCES ON R
BOOKS ON R
• An Introduction to R PDF HTML - W. n. Venables, D. M. Smith and the R Develop-ment Core Team
• R for Beginners PDF - Emmanuel Paradis
• Using R for Data Analysis and graphics: Introduction, Code and Commentary PDF - J. H. Maindonald
• SimpleR: Using R for Introductory Statistics PDF - John Verzani
• The R guide PDF - W. J. Owen
• Introduction to Probability and Statistics Using R URL - g. Jay Kerns
• The R Inferno PDF - Patrick Burns
• An Introduction to R PDF - Longhow Lam PDF
Some of the books you have to pay for:
• Statistics: An Introduction using R - Michael J. Crawley
• The R Book - Michael J. Crawley
• A Beginner’s guide to R - Alain F. Zuur, Elena n. Leno, Erik H.W.g. Meesters
• A First Course in Statistical Programming with R - W. John Braun and Duncan J. Murdoch
• A Handbook of Statistical Analyses Using R - Brian S. Everitt and Ibrsten Hothorn
• A Modern Approach to Regression with R - Simon J. Sheather
• Data Manipulation with R - Phil Spector
• Introductory Statistics with R - Peter Dalgaard
• R for SAS and SPSS Users - Robert A. Muenchen
• R graphics - Paul Murrell
• R in a nutshell: A Desktop Quick Reference - Joseph Adler
• There is a lot more documentation on R available at http://cran.r-project.org/other-docs.html
Courtesy stackoverflow.com
OTHER ONLINE RESOURCES
Kdnuggets – www.kdnuggets.com – Established in 1997, this website is a compre-hensive resource for anything related to data mining and analytics. Visit this site to learn about news, events and jobs in analytics. They also have links to datasets and training material on analytics.
Analyticbridge – www.analyticbridge.com – Describes itself as the social network for analytics professionals. This is a wonderful site to connect and network within the analytics industry. It is also useful to stay updated on the latest news and events in the field.
LINKEdIN gROUPS
LinkedIn has thousands of groups that are like virtual communities where people of similar interests can share knowledge. Some of the popular analytics related groups are :
• Advanced analytics• Business analytics• Customer analytics group• global analytics network• India analytics network• Kdnuggets analytics and data mining• SAS analytics and BI• SAS and analytics users• Your analytics career

YOUTUBE
These are some must-watch videos on Analytics
How it works: Analytics: http://youtu.be/_HbjsnaUJ2A
A brief history of intelligence: http://youtu.be/yVIcIRcAhxc
What can Business Analytics Do for You?: http://youtu.be/uP89kaDU40c
REvolutionAnalytics: This channel has many interesting videos on big data analytics using the open-source software R
SASsoftware: SAS’s channel talks primarily about SAS but also has some good vid-eos on analytics.
Googleanalytics: The official channel for all videos about and related to google Analytics.
IBMbusinessanalytics: IBM’s youtube channel focusing on analytics and its business application.
Jigsawacademy: Our own channel provides informative videos on analytics, inter-views with industry leaders as well as snippets of our lectures.
Jigsaw Academy Education Private Limited © 201212
4CHAPTER INdUSTRIES THAT USE ANALYTICS
Analytics can be applied to virtually any business or business process. Whether you are dealing in a niche product, com-modity, monopoly or a competitive market, there is potential for analytical competition.
Logistics
Business to Business
Telecom
Sports
Value-add Services
Analytics Service Providers:
• genpact• Evalueserve• Ugam Solutions• WnS• EXL Service• Absolutdata• CrossTab Decision-Craft• Fractal Analytics• Meritus• IMRB
Financial Services:
• Amex• Citibank• HSBC• Standard Chartered Bank• Fair Isaac India
• Modelytics• Denuosource• Mu-Sigma• Latent View Analytics• Dexterity• Pharmarc
• Manthan Systems• Irevena• global Analytics Inc.• Dunnhumbly
• ICICI Bank• HDFC Bank• Bajaj Allianz Insurance
• Bharati Axa Insurance• Fidelity
IT Companies:
• Dell• HP• IBM• Infosys• Wipro• Igate• Tata Consultancy Services• Cognizant• HCL
Retail:
• Target• Tesco• Shopperstop• Arvind Mills• Pantaloons
E-commerce:
• Amazon• Rediff• Bharatmatrimony• Times of India• Ebay
Healthcare:
• novartis• Reddylabs• IMS Health
Consulting Companies:
• Dun & Bradstreet• McKinsey• Accenture
FMCG:
• HLL• P&g• Pepsi• Coke
Telecom:
• nokia networks• Vodafone Telecommunications
Manufacturing:
• Caterpillar
However, some industries are clearly more amenable to analytics than others. If a business generates a lot of transaction data, competing on analytics is a natural strategy.
Financial Services
Retail
FMCG
Pharmaceuticals
Travel
Hospitality and Entertainment
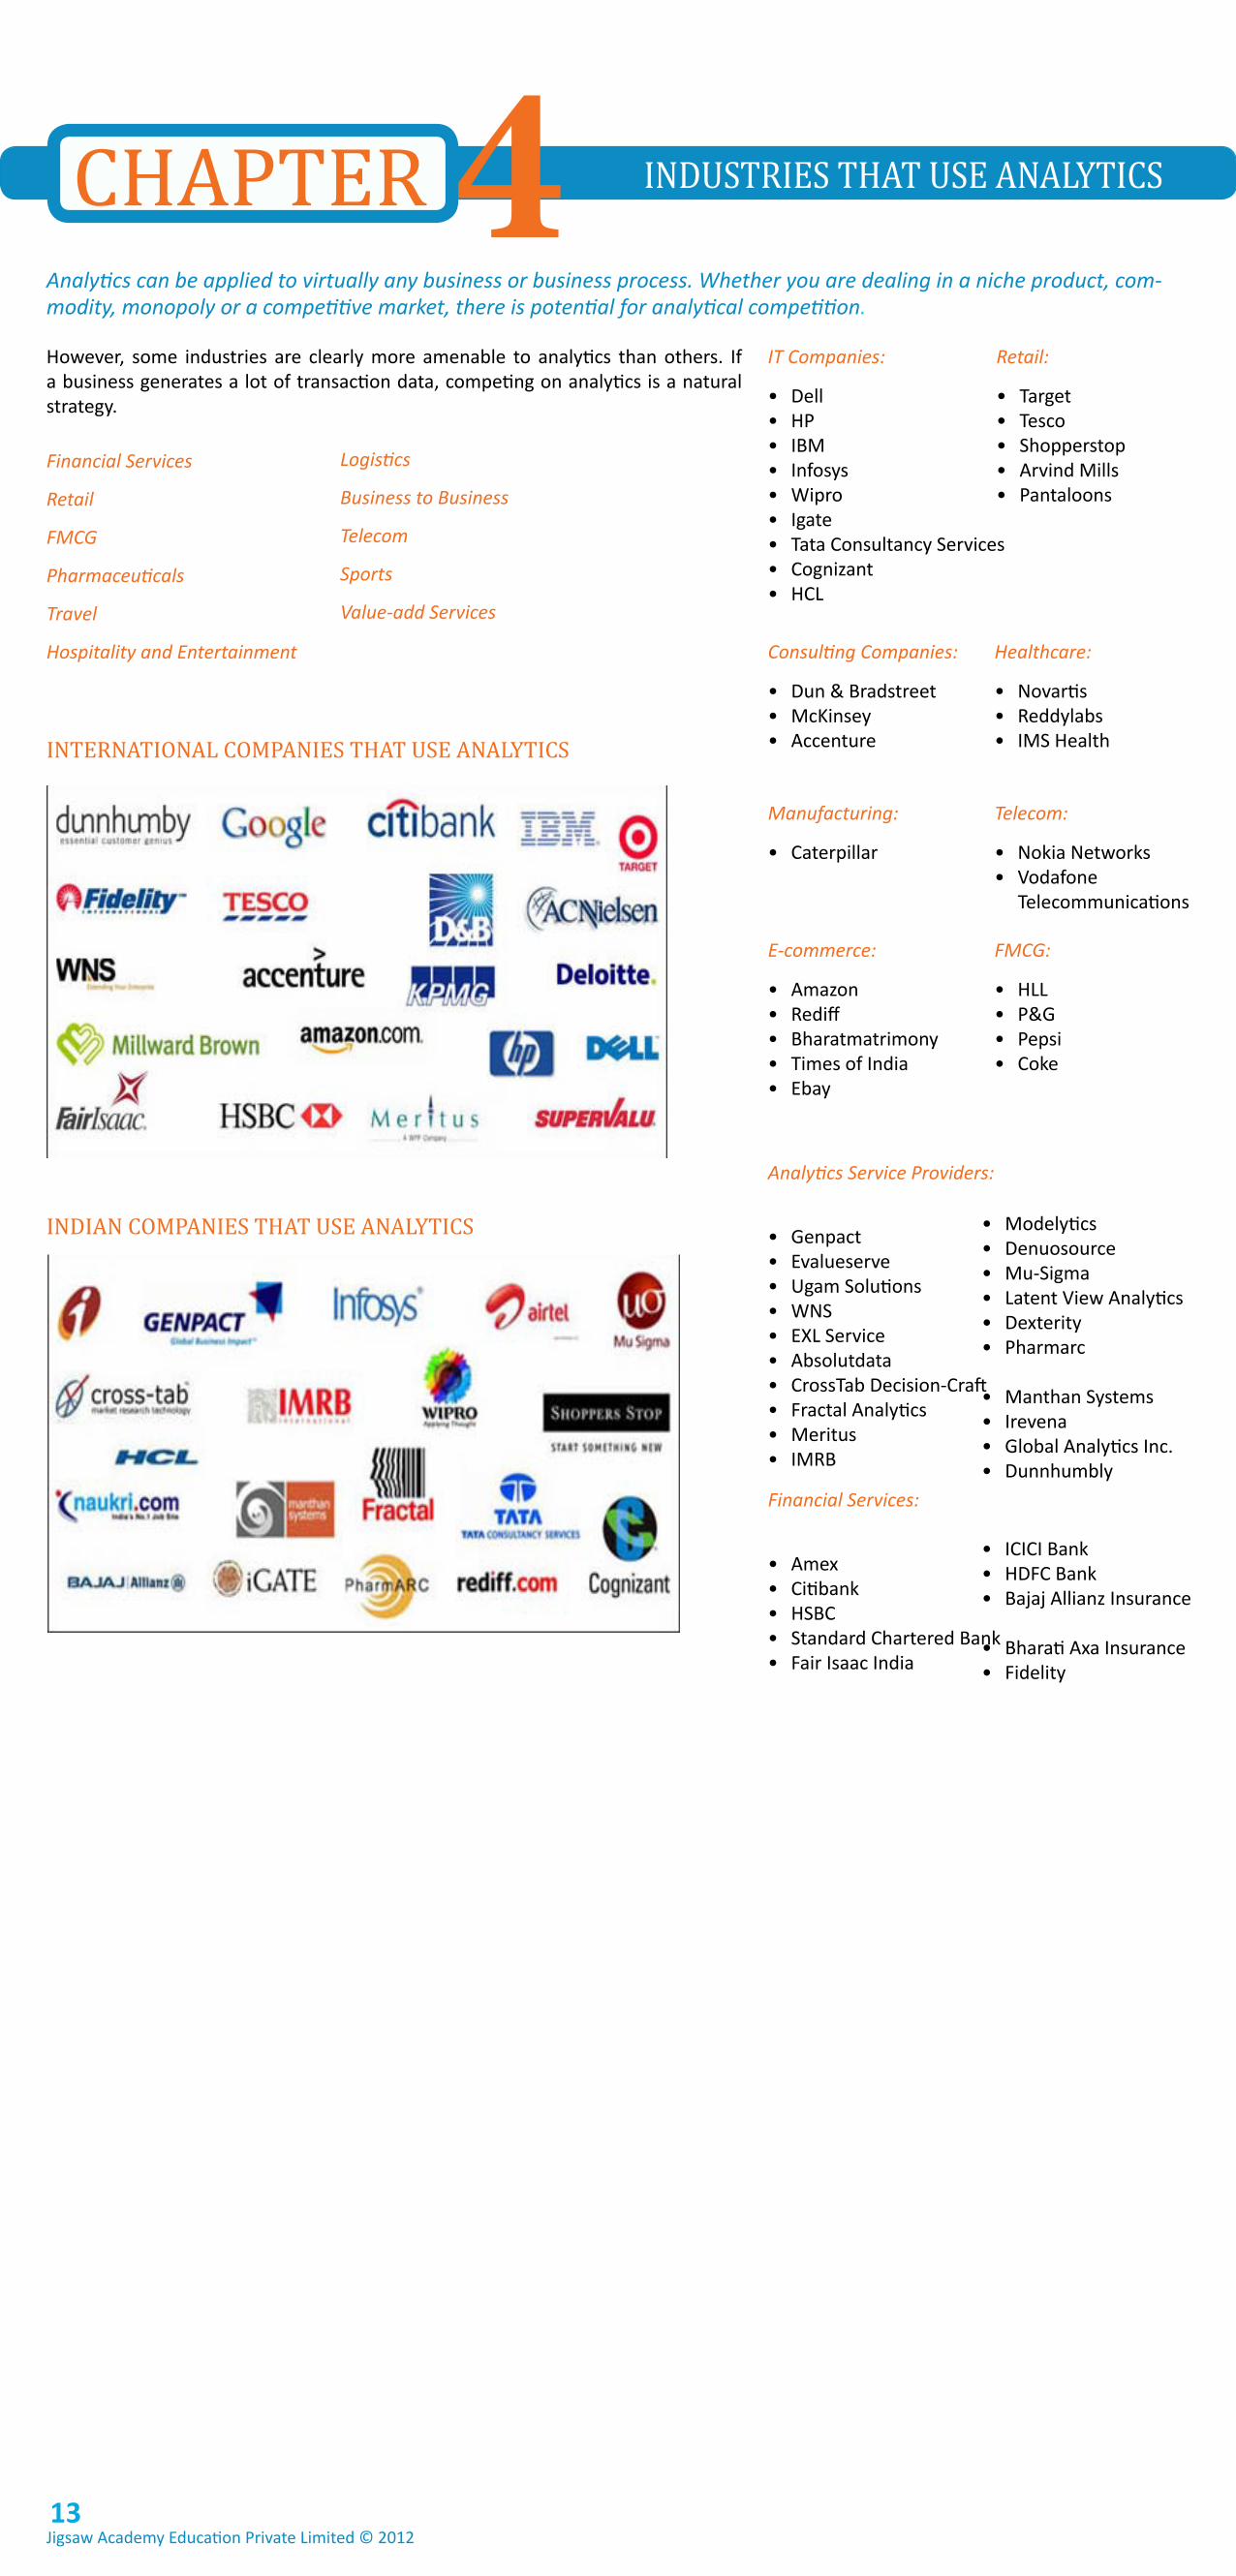
INTERNATIONAL COMPANIES THAT USE ANALYTICS
INdIAN COMPANIES THAT USE ANALYTICS
Jigsaw Academy Education Private Limited © 201213
5 TOOLS FOR ANALYTICSCHAPTER
Here is a list of 10 most popular analytic tools used in the business world.
COMMERCIAL SOFTWARES
MS Excel: Almost every business has access to MS Office suite and Excel. Excel is an excellent reporting and dash boarding tool. For most business projects, even if you run the heavy statistical analysis on different software, you will still end up using Excel for the reporting and presentation.
Latest versions of Excel can handle tables with up to 1 million rows making it a pow-erful yet versatile tool.
SAS: SAS is the 5000 pound gorilla of the analytics world and claims to be the largest independent vendor in the business intelligence market. It is the most commonly used software in the Indian analytics market despite its monopolistic pricing. SAS software has wide ranging capabilities from data management to advanced analyt-ics.
SPSS Modeler (Clementine): SPSS Modeler is a data mining software tool by SPSS Inc., an IBM company. It was originally named SPSS Clementine. This tool has an intuitive gUI and its point-and-click modelling capabilities are very comprehensive.
Statistica: is a statistics and analytics software package developed by StatSoft. It provides data analysis, data management, data mining, and data visualization proce-dures. Statistica supports a variety of analytic techniques and is capable of meeting most needs of the business. The gUI is not the most user-friendly and it may take a little more time to learn than some tools but it is a competitively priced product that is value for money.
Salford systems: provides a host of predictive analytics and data mining tools for businesses. The company specialises in classification and regression tree algorithms. Its MARS algorithm was originally developed by world-renowned Stanford statisti-cian and physicist, Jerome Friedman. The software is easy to use and learn.
KXEN: is one of the few companies that are driving automated analytics. Their prod-ucts, largely based on algorithms developed by the Russian mathematician Vladimir Vapnik, are easy to use, fast and can work with large amounts of data. Some users may not like the fact that KXEn works like a ‘black box’ and in most cases, it is diffi-cult to understand and explain the results.
Angoss: Like Salford systems, Angoss has developed its products around classifica-tion and regression decision tree algorithms. The tools are easy to learn and use, and the results easy to understand and explain. The gUI is very user friendly and a lot of features have been added over the years to make this a powerful tool.
MATLAB: is statistical computing software developed by MathWorks, MATLAB allows matrix manipulations, plotting of functions and data, implementation of algorithms and creation of user interfaces. There are many add-on toolboxes that extend MAT-LAB to specific areas of functionality, such as statistics, finance, image processing, bioinformatics, etc. Matlab is not a free software. However, there are clones like Octave and Scilab which are free and have similar functionality.
Open Source Software
R: R is a programming language and software environment for statistical comput-ing and graphics. The R language is an open source tool and is widely used by the academia. For business users, the programming language does represent a hurdle. However, there are many gUIs available that can sit on R and enhance its user-
The range of analytical software goes from relatively simple statistical tools in spread sheets (ex-MS Excel) to statistical software packages (ex-KXEN, Statistica) to sophisticated business intelligence suites (ex-SAS, Oracle, SAP, IBM among the big players). Open source tools like R and Weka are also gaining popularity. Companies are also developing in-house tools designed for specific purposes.
SAS is currently amongst the most popular analytic tools in the business. IBM products such as SPSS and modeler are also fairly pop-ular. R, the open source tool, is the tool for the future. WPS is a low-cost alternative for SAS users.
Jigsaw Academy Education Private Limited © 201214
friendliness.
Weka: Weka (Waikato Environment for Knowledge Analysis) is a popular suite of machine learning software, developed at the University of Waikato, new Zealand. Weka, along with R, is amongst the most popular open source software used by the
WHICH IS THE BEST ANALYTICS SOFTWARE TO LEARN?
The next question that arises, especially for someone aspiring to get into the field of analytics, is “Which is the best ana-lytics software to learn?”The analytics software market has numerous players – from billion dollar corporations to 1-man shops- offering highly sophisticated, even self-learning platforms to niche, custom-made solutions.
SAS
SAS is undoubtedly the reigning king in the market. Most large global companies and cash-rich businesses tend to go for this software. In India, most medium and large analytics service providers use SAS for predictive modelling and advanced data mining.
There are many different software available from the SAS institute. Some of them are fairly generic and domain agnostic while some are domain-specific for niche purpose. Base SAS is the cheapest and most widely used. It is a code-based tool that uses the SAS language for coding. While some of the tasks like data import can be performed using the gUI, most tasks require a knowledge of the SAS language.
Being a code-based tool, Base SAS is not very easy to learn. However, other than Excel, it is one of the most popular analytics software in the business market.
SAS has another tool called “E-miner”. E-miner is a gUI based version of Base SAS where you can perform complex data manipulation and modelling tasks just by clicks and drags. E-miner has additional advanced analytics capabilities that are not present in the base SAS version. Capabilities to perform market basket analysis, decision trees, neural networks and support vector machines make e-miner a very comprehensive and user-friendly tool.
The biggest drawback of this software is the high price that the SAS institute insists on charging for it.Deployment of this tool in a mid-size organization can run into millions of dollars. In India, apart from the large MnC banks like Citibank, Barclays etc. few companies are able to afford this tool.
IBM
With some major acquisitions in the last few years, IBM has suddenly become a lead player in the analytics software market. While COgnOS is largely considered as a business intelligence tool, SPSS and IBM modeler (previously SPSS Clementine) are also big players. SPSS is more popular in the market research field than the busi-ness analytics field. IBM modeler is comparable to SAS e-miner both in terms of fea-tures as well as pricing and hence has the same pros and cons.
SOFTWARES OF THE FUTURE
R
R is the most popular open-source (FREE) analytics software in the world. Within the analytics community, its popularity easily surpasses that of any other tool. And it is easily the tool of choice for most academicians and scientists. Businesses, however, have been slow to adopt R and a lot of this can be because of intellectual property issues arising out of codes and algorithms written on an open source plat-form.
While R is again a code based package similar to Base SAS, there are gUIs available for it. The Revolution analytics gUI for enterprise R is an awaited new addition to the analytics software market. The gUI cuts down on the learning time for R and even though it is not free, it still makes for a very cost-effective solution.
numerous companies have expressed a desire to move to R. They are, however, unsure about training their existing resources and building a pipeline of trained re-sources for the future.
As a new generation of analysts starts to move towards building R skills, companies will surely move to this platform.
With its ever-increasing capability list, and low/no-cost pricing, R is the reigning analytics software for the future.
WPS
WPS is a tool that has been around for some time but has not been able to gain the popularity it deserves. This tool, now acquired by IBM, is virtually a clone of Base SAS. It uses the same SAS language, has a similar interface and identical algorithms. In fact, most of your SAS codes will run on the WPS platform and most SAS users can transition to this tool with a simple, 2-day training.
The software is completely legitimate, having won numerous cases filed by the SAS institute.
WPS is very attractively priced compared to Base SAS saving over 50% in costs for companies if they move from SAS to WPS.
Once IBM gets around to marketing this tool effectively, it seriously dent SAS’s stranglehold on the market. With a pool of SAS trained resources available to them, companies will find moving from SAS to WPS a walk in the park.
With such a short learning and adoption time, WPS is the second most exciting tool for the future.
SASWPs R
Jigsaw Academy Education Private Limited © 201215
6 MOdELLINg TECHNIQUESCHAPTER REgRESSION MOdELLINgRegression models are widely used in analytics, as they are the easiest to understand and interpret. Regression techniques allow the identification and estimation of possible relationships between a pattern or variable, and factors that influence that pattern. For example, a company may be inter-ested in understanding the effectiveness of its marketing strategies. It may deploy a variety of marketing activities in a given time period, like TV, radio and print advertising, and social media campaigns. A regression model can be used to understand and quantify which of its marketing activities actu-ally drive sales, and to what extent. The advantage of regression over sim-ple correlations is that it allows you to control for the impact of multiple factors that influence your variable of interest, or the “target” variable. For example, things like price changes or competitive activities also influence a brand’s sales, and the regression model accounts for the impacts of these factors on sales.
Types of Regression Analysis
There are several different types of regression techniques, including :
Linear regressions- assumes that there is a linear relationship between the predictors (or the factors) and the target variable.
Non-linear regression- allows modelling of non-linear relationships,
Logistic regressions - useful when your target variable is binomial (1,0 – Ac-cept or Reject)
Time Series Regressions- used to forecast future behaviour of variables based on historical time ordered data.
Regression techniques are widely used in various business needs. These models are built to understand historical data and relationships to assess marketing effectiveness, price changes on sales, ranking people on propensity, responds of a direct mailing campaign, to flag potentially fraudulent applications, to assess cross-sell and up-sell opportunities across an exist-ing customer base, to predict attrition or churn, and many more.
BUSINESS APPLICATIONS
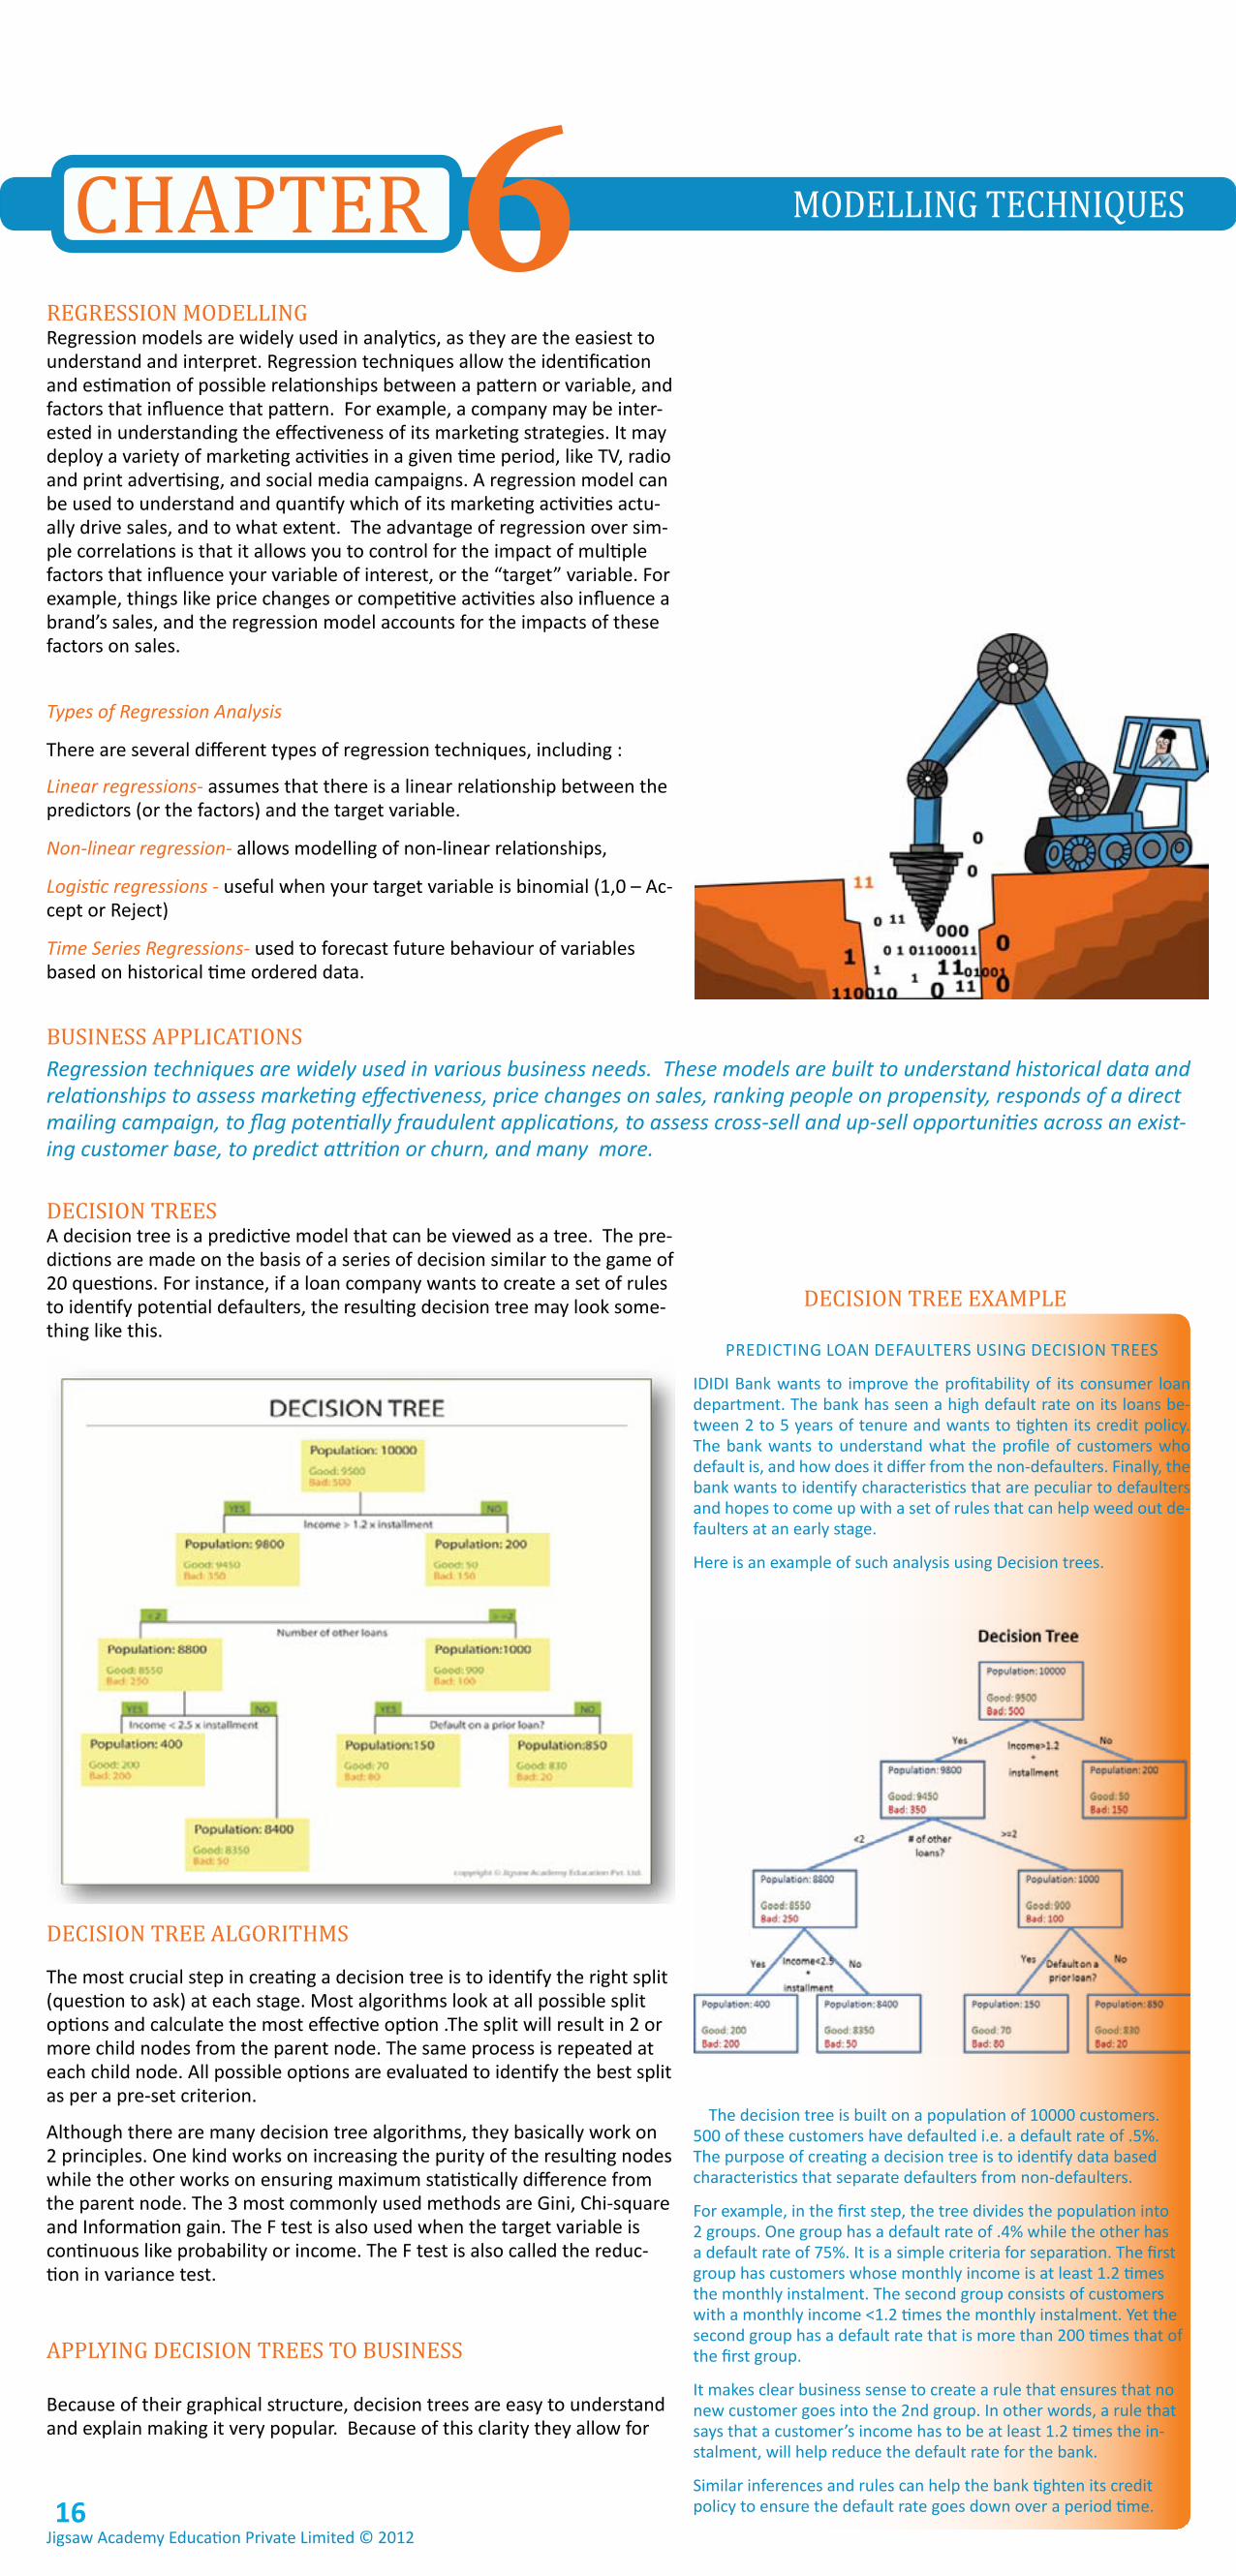
dECISION TREESA decision tree is a predictive model that can be viewed as a tree. The pre-dictions are made on the basis of a series of decision similar to the game of 20 questions. For instance, if a loan company wants to create a set of rules to identify potential defaulters, the resulting decision tree may look some-thing like this.
dECISION TREE ALgORITHMS
The most crucial step in creating a decision tree is to identify the right split (question to ask) at each stage. Most algorithms look at all possible split options and calculate the most effective option .The split will result in 2 or more child nodes from the parent node. The same process is repeated at each child node. All possible options are evaluated to identify the best split as per a pre-set criterion.
Although there are many decision tree algorithms, they basically work on 2 principles. One kind works on increasing the purity of the resulting nodes while the other works on ensuring maximum statistically difference from the parent node. The 3 most commonly used methods are gini, Chi-square and Information gain. The F test is also used when the target variable is continuous like probability or income. The F test is also called the reduc-tion in variance test.
APPLYINg dECISION TREES TO BUSINESS
Because of their graphical structure, decision trees are easy to understand and explain making it very popular. Because of this clarity they allow for
PREDICTIng LOAn DEFAULTERS USIng DECISIOn TREES
IDIDI Bank wants to improve the profitability of its consumer loan department. The bank has seen a high default rate on its loans be-tween 2 to 5 years of tenure and wants to tighten its credit policy. The bank wants to understand what the profile of customers who default is, and how does it differ from the non-defaulters. Finally, the bank wants to identify characteristics that are peculiar to defaulters and hopes to come up with a set of rules that can help weed out de-faulters at an early stage.
Here is an example of such analysis using Decision trees.
The decision tree is built on a population of 10000 customers. 500 of these customers have defaulted i.e. a default rate of .5%. The purpose of creating a decision tree is to identify data based characteristics that separate defaulters from non-defaulters.
For example, in the first step, the tree divides the population into 2 groups. One group has a default rate of .4% while the other has a default rate of 75%. It is a simple criteria for separation. The first group has customers whose monthly income is at least 1.2 times the monthly instalment. The second group consists of customers with a monthly income <1.2 times the monthly instalment. Yet the second group has a default rate that is more than 200 times that of the first group.
It makes clear business sense to create a rule that ensures that no new customer goes into the 2nd group. In other words, a rule that says that a customer’s income has to be at least 1.2 times the in-stalment, will help reduce the default rate for the bank.
Similar inferences and rules can help the bank tighten its credit policy to ensure the default rate goes down over a period time.
dECISION TREE EXAMPLE
Jigsaw Academy Education Private Limited © 201216
more complex profit and ROI models to be easily added on top of the pre-dictive model.
Their high level of automation and the ease of translating these models into SQL the technology has also Their high level of automation and the ease of translating these models into SQL the technology has also proven to be easy to integrate with existing IT processes, requiring little pre-pro-cessing and cleansing of the data.
Apart from predictive modelling, decision trees are useful in other ways too. During the data exploration stage of a project, decision trees are a quick and effective way of understanding impact of numerous and impor-tant variables .A real life business situation could involve thousands of vari-ables and decision trees are a quick and easy way of reducing to a manage-able number.
Decision trees are also very useful in understanding variable interactions. Sometimes two or more variables could combine to become powerful. For example, the target market for Yamaha motorcycles will be males between a certain age group and income band. Just the income, gender or age may not be as powerful in segmenting this market.
Trees can be used to impute missing values. Sometimes trees can help interpret model results that could otherwise be difficult to understand. For example a neural net may generate output that can’t be interpreted eas-ily. Applying decision trees using the prediction of neural net as the target variable can generate rules that provide broad understanding of the neural net model.
Features of a good decision tree
A good decision tree follows Occam’s razor. It delivers a high level of accu-racy using as few variables as possible. A good tree is easy to visualize and interpret. Like all models, it should make intuitive sense.
When to use decision trees
Decision trees are the technique of choice when the problem is binary (0/1, yes/no). It is not the first choice for estimating continuous values. It is widely used in business, especially in situations, where the interpretation of results is more important than the accuracy. Use decision trees when time is critical. Decision trees work the best for initial data exploration in any project.
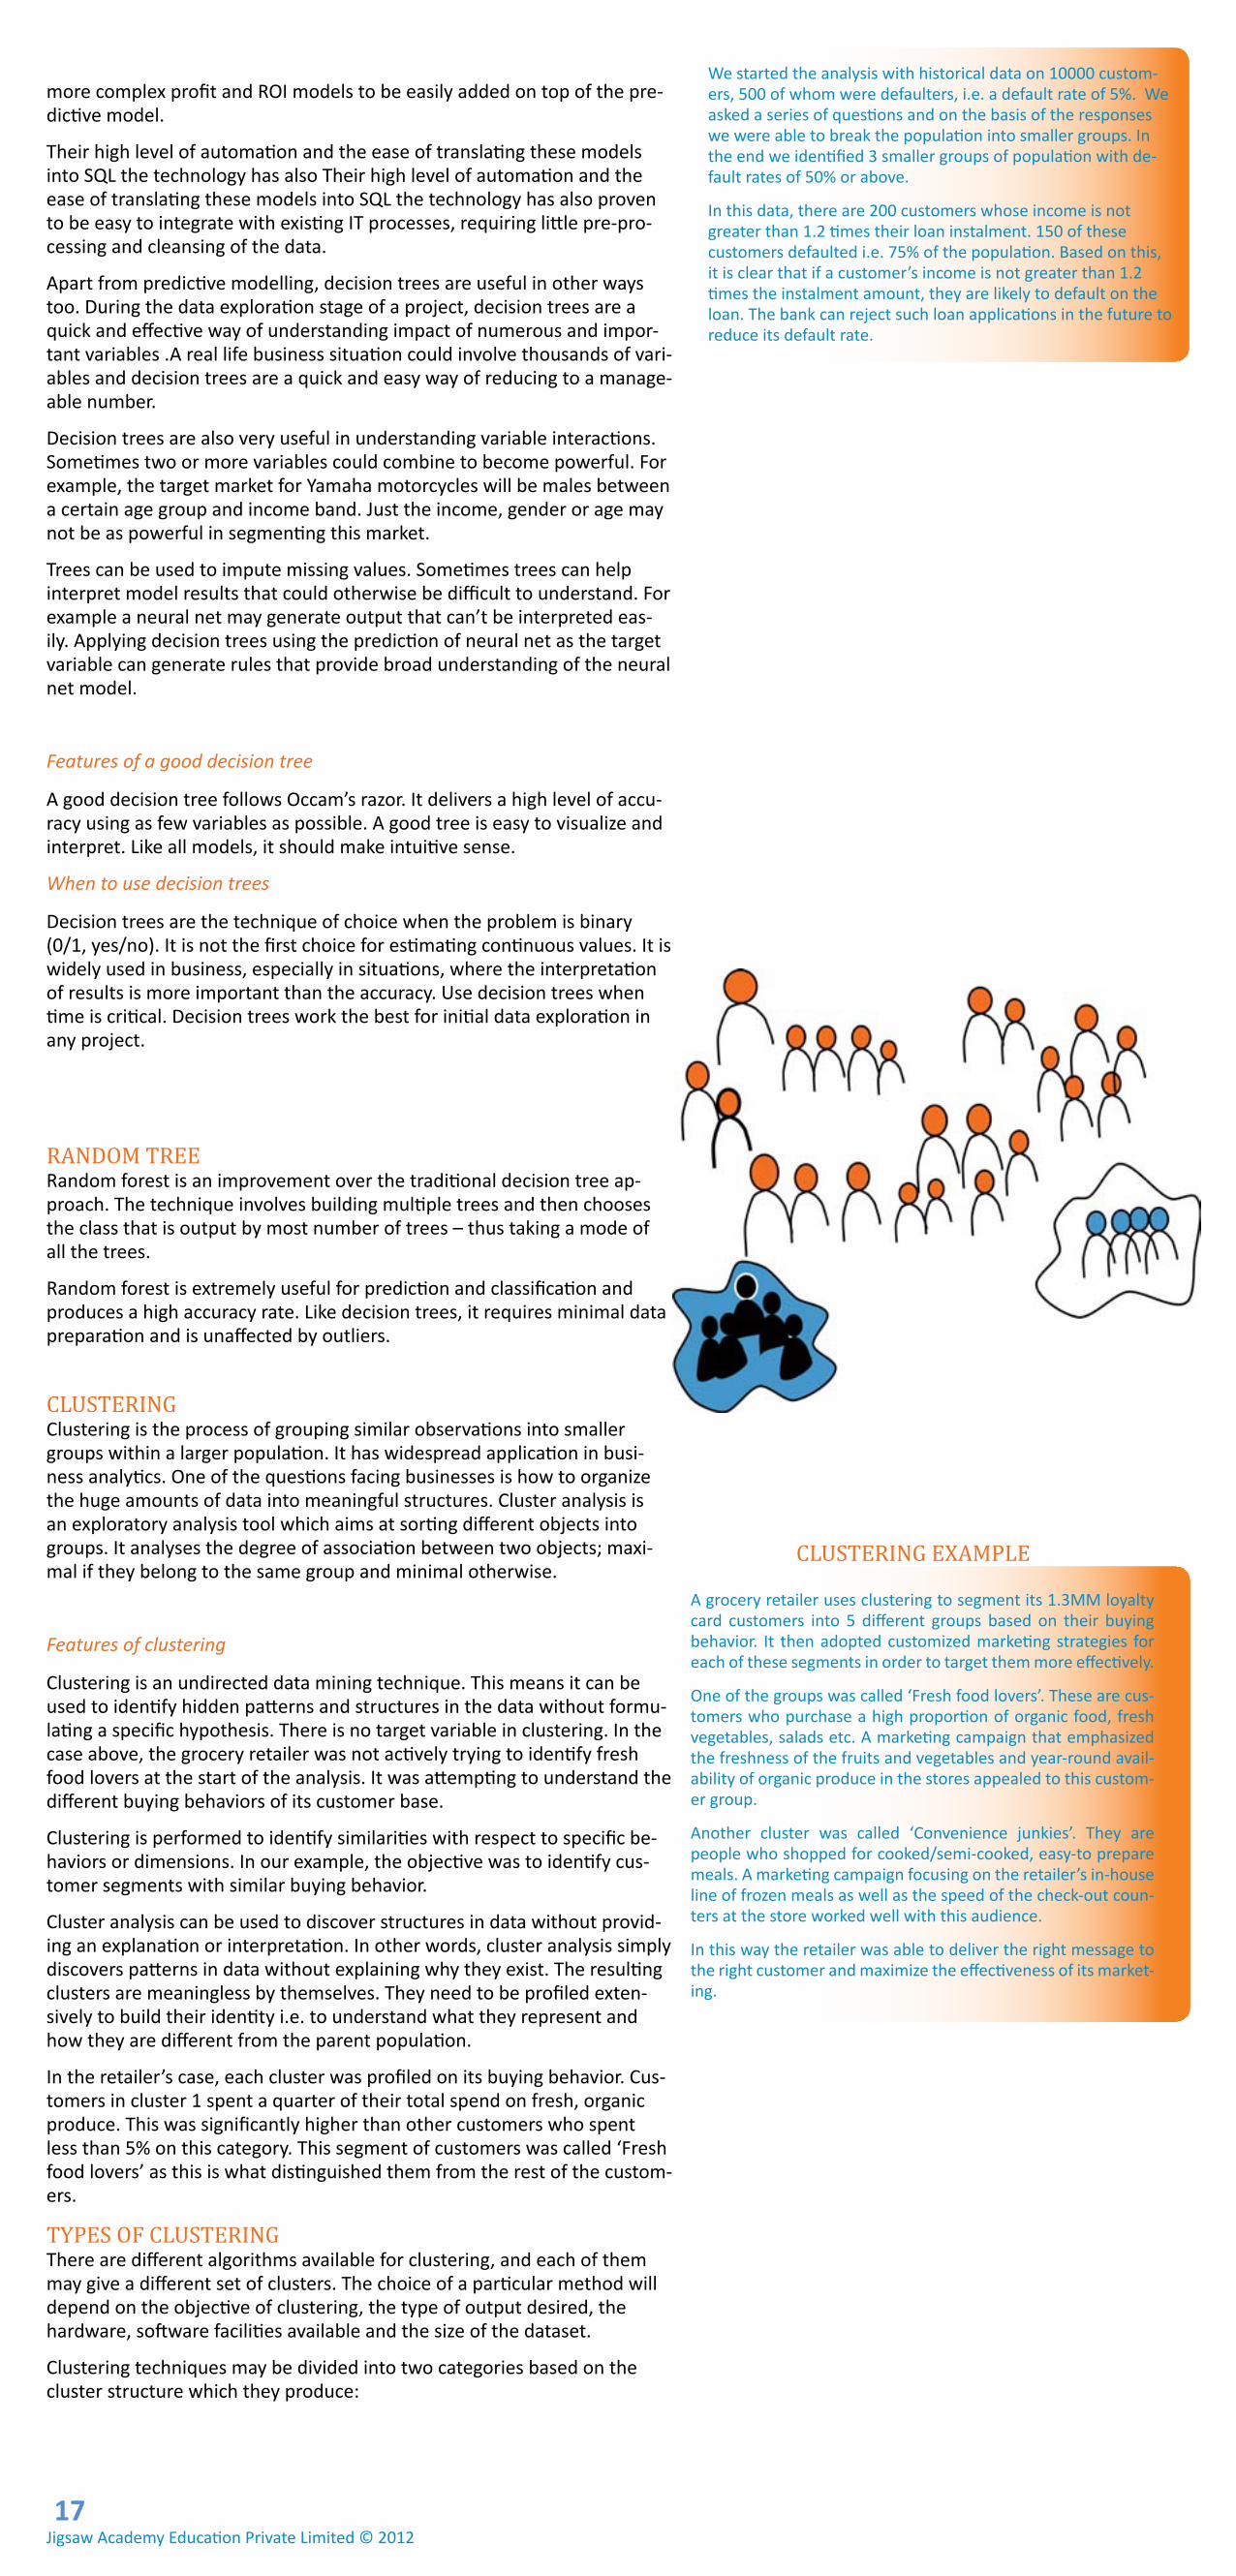
RANdOM TREERandom forest is an improvement over the traditional decision tree ap-proach. The technique involves building multiple trees and then chooses the class that is output by most number of trees – thus taking a mode of all the trees.
Random forest is extremely useful for prediction and classification and produces a high accuracy rate. Like decision trees, it requires minimal data preparation and is unaffected by outliers.
CLUSTERINgClustering is the process of grouping similar observations into smaller groups within a larger population. It has widespread application in busi-ness analytics. One of the questions facing businesses is how to organize the huge amounts of data into meaningful structures. Cluster analysis is an exploratory analysis tool which aims at sorting different objects into groups. It analyses the degree of association between two objects; maxi-mal if they belong to the same group and minimal otherwise.
Features of clustering
Clustering is an undirected data mining technique. This means it can be used to identify hidden patterns and structures in the data without formu-lating a specific hypothesis. There is no target variable in clustering. In the case above, the grocery retailer was not actively trying to identify fresh food lovers at the start of the analysis. It was attempting to understand the different buying behaviors of its customer base.
Clustering is performed to identify similarities with respect to specific be-haviors or dimensions. In our example, the objective was to identify cus-tomer segments with similar buying behavior.
Cluster analysis can be used to discover structures in data without provid-ing an explanation or interpretation. In other words, cluster analysis simply discovers patterns in data without explaining why they exist. The resulting clusters are meaningless by themselves. They need to be profiled exten-sively to build their identity i.e. to understand what they represent and how they are different from the parent population.
In the retailer’s case, each cluster was profiled on its buying behavior. Cus-tomers in cluster 1 spent a quarter of their total spend on fresh, organic produce. This was significantly higher than other customers who spent less than 5% on this category. This segment of customers was called ‘Fresh food lovers’ as this is what distinguished them from the rest of the custom-ers.
TYPES OF CLUSTERINgThere are different algorithms available for clustering, and each of them may give a different set of clusters. The choice of a particular method will depend on the objective of clustering, the type of output desired, the hardware, software facilities available and the size of the dataset.
Clustering techniques may be divided into two categories based on the cluster structure which they produce:
We started the analysis with historical data on 10000 custom-ers, 500 of whom were defaulters, i.e. a default rate of 5%. We asked a series of questions and on the basis of the responses we were able to break the population into smaller groups. In the end we identified 3 smaller groups of population with de-fault rates of 50% or above.
In this data, there are 200 customers whose income is not greater than 1.2 times their loan instalment. 150 of these customers defaulted i.e. 75% of the population. Based on this, it is clear that if a customer’s income is not greater than 1.2 times the instalment amount, they are likely to default on the loan. The bank can reject such loan applications in the future to reduce its default rate.
A grocery retailer uses clustering to segment its 1.3MM loyalty card customers into 5 different groups based on their buying behavior. It then adopted customized marketing strategies for each of these segments in order to target them more effectively.
One of the groups was called ‘Fresh food lovers’. These are cus-tomers who purchase a high proportion of organic food, fresh vegetables, salads etc. A marketing campaign that emphasized the freshness of the fruits and vegetables and year-round avail-ability of organic produce in the stores appealed to this custom-er group.
Another cluster was called ‘Convenience junkies’. They are people who shopped for cooked/semi-cooked, easy-to prepare meals. A marketing campaign focusing on the retailer’s in-house line of frozen meals as well as the speed of the check-out coun-ters at the store worked well with this audience.
In this way the retailer was able to deliver the right message to the right customer and maximize the effectiveness of its market-ing.
CLUSTERINg EXAMPLE
Jigsaw Academy Education Private Limited © 201217
The non-hierarchical methods -divide a dataset of n objects into M clus-ters. K-means, a non-hierarchical technique, is the most commonly used one in business analytics.
The hierarchical methods- produce a set of nested clusters in which each pair of objects or clusters is progressively nested in a larger cluster until only one cluster remains.
WHEN TO USE CLUSTERINg
Clustering is primarily used to perform segmentation, be it customer, prod-uct or store. We have already talked about customer segmentation using cluster analysis in the example above. Similarly products can be clustered together into hierarchical groups based on their attributes like use, size, brand, flavor etc.; stores with similar characteristics – similar sales, size, customer base etc., can be clustered together.
Clustering can also be used for anomaly detection, for example, identify-ing fraud transactions. Cluster detection methods can be used on a sample containing only good transactions to determine the shape and size of the “normal” cluster. When a transaction comes along that falls outside the cluster for any reason, it is suspect. This approach has been used in medi-cine to detect the presence of abnormal cells in tissue samples and in tele-communications to detect calling patterns indicative of fraud.
Clustering is often used to break large set of data into smaller groups that are more amenable to other techniques. For example, logistic regression results can be improved by performing it separately on smaller clusters that behave differently and may follow slightly different distributions.
ASSOCIATION RULES
Affinity grouping or rule induction is one of the most popular data mining techniques. This unsupervised learning technique works by mining through large databases to identify patterns. These patterns are hidden deep inside the data, creating a set of rules and assigning a measure of strength and likelihood of occurrence for the rules.
One of the most interesting applications of this technique is on the point of sale (POS) data to identify what products sell together. Such groups of products can be useful to make recommendations to customers Customers who have bought one item from a group are more likely to buy the rest of the items within that group.
Web retailers use this tool to make recommendations based on what other people have bought in the past. Amazon is a great example of this. now more websites are offering this facility.
Brick and mortar retailers can make recommendations in different ways – placing associated products close by in the store, bundling them in promo-tions etc.
While association rules are very insightful, they have to be used with care. In a typical retail business there are hundreds of products which mean endless combinations are possible. An analyst can quickly get over-whelmed with the number of rules being generated and may not be able to determine the useful ones. A good yardstick to measure the strength or the power of a rule is necessary.
A related problem with association rules is that they provide a lot of re-dundant information. Most of the generated rules tell us what we already know – People who buy apples are likely to buy bananas too. Or any other fruit for that matter. But we already know this and so fruits are kept to-gether and often promoted together.
But sometimes the analysis can provide deeper information. Wal-Mart may already know about the association between candy and doll sales (both are liked by little children) but the analysis can identify which doll links the most.
Rules can also be used to associate time of day or the day of week with product sales. A convenience store finds that lottery sales peak during lunch hours while newspapers don’t sell much after 11 am. It decides to replace the newspaper rack with a second lottery rack every day before noon. Similarly weekend trends can be identified through association rules as well.
An important thing to keep in mind while using association rules is that rules don’t imply causality. Buying milk doesn’t lead to buying bread even if the rule If milk, then bread is very strong. It just means there is a strong association between milk and bread.
The rules generated by decision trees cover all data points (or every sce-nario) and there are no overlaps between rules. In other words they are exhaustive as well as mutually exclusive. Induction rules tend not to be exhaustive (at least after the pruning) and are not mutually exclusive. For example, if bread then milk and if bread then eggs are 2 different associa-tion rules for the same situation.
NEURAL NETWORKS
neural networks are another popular data mining technique that can be applied to perform predictive modelling and unsupervised learning in the form of clustering. They have found application in fraud detection, credit scoring and store clustering to name a few.
Are they the best?
neural networks, or rather artificial neural networks, mimic the way the human brain works – detecting patterns, making predictions and learn-ing from experience. It is tempting to conclude that since neural networks
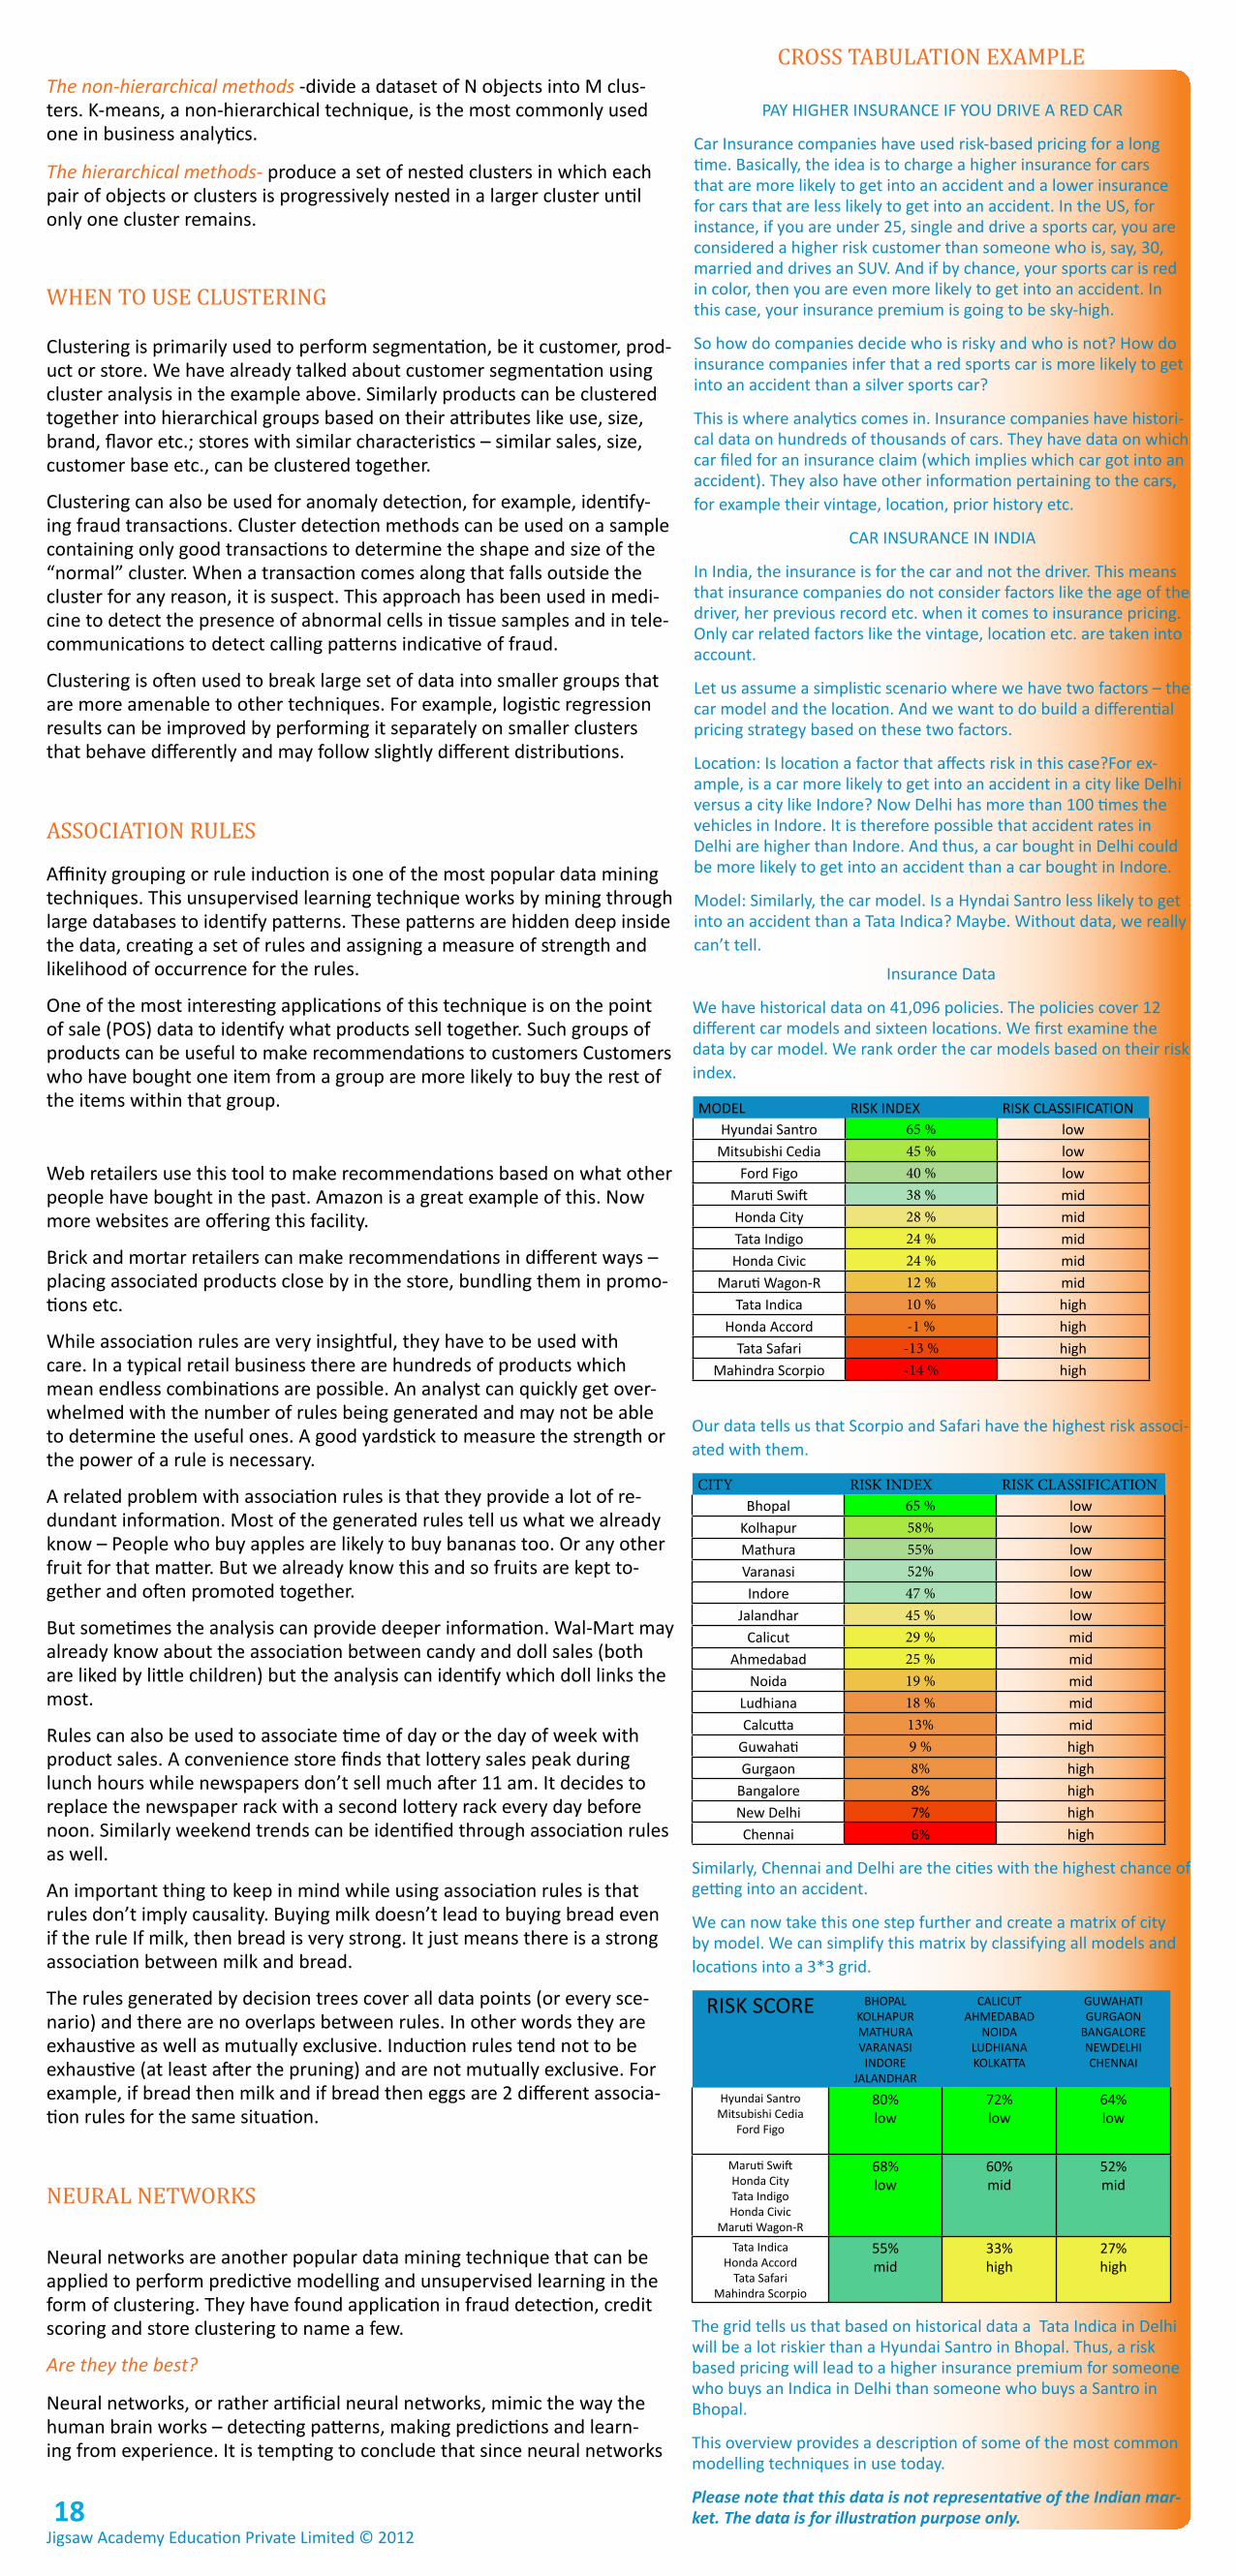
Our data tells us that Scorpio and Safari have the highest risk associ-ated with them.
CITY RISK INDEX RISK CLASSIFICATIONBhopal 65 % low
Kolhapur 58% lowMathura 55% lowVaranasi 52% lowIndore 47 % low
Jalandhar 45 % lowCalicut 29 % mid
Ahmedabad 25 % midnoida 19 % mid
Ludhiana 18 % midCalcutta 13% mid
guwahati 9 % highgurgaon 8% high
Bangalore 8% highnew Delhi 7% highChennai 6% high
Similarly, Chennai and Delhi are the cities with the highest chance of getting into an accident.
We can now take this one step further and create a matrix of city by model. We can simplify this matrix by classifying all models and locations into a 3*3 grid.
RISK SCORE BHOPALKOLHAPURMATHURAVARAnASI
InDOREJALAnDHAR
CALICUTAHMEDABAD
nOIDALUDHIAnAKOLKATTA
gUWAHATIgURgAOn
BAngALOREnEWDELHICHEnnAI
Hyundai SantroMitsubishi Cedia
Ford Figo
80%low
72%low
64%low
Maruti SwiftHonda CityTata IndigoHonda Civic
Maruti Wagon-R
68%low
60%mid
52%mid
Tata IndicaHonda Accord
Tata SafariMahindra Scorpio
55%mid
33%high
27%high
The grid tells us that based on historical data a Tata Indica in Delhi will be a lot riskier than a Hyundai Santro in Bhopal. Thus, a risk based pricing will lead to a higher insurance premium for someone who buys an Indica in Delhi than someone who buys a Santro in Bhopal.
This overview provides a description of some of the most common modelling techniques in use today.
Please note that this data is not representative of the Indian mar-ket. The data is for illustration purpose only.
PAY HIgHER InSURAnCE IF YOU DRIVE A RED CAR
Car Insurance companies have used risk-based pricing for a long time. Basically, the idea is to charge a higher insurance for cars that are more likely to get into an accident and a lower insurance for cars that are less likely to get into an accident. In the US, for instance, if you are under 25, single and drive a sports car, you are considered a higher risk customer than someone who is, say, 30, married and drives an SUV. And if by chance, your sports car is red in color, then you are even more likely to get into an accident. In this case, your insurance premium is going to be sky-high.
So how do companies decide who is risky and who is not? How do insurance companies infer that a red sports car is more likely to get into an accident than a silver sports car?
This is where analytics comes in. Insurance companies have histori-cal data on hundreds of thousands of cars. They have data on which car filed for an insurance claim (which implies which car got into an accident). They also have other information pertaining to the cars, for example their vintage, location, prior history etc.
CAR InSURAnCE In InDIA
In India, the insurance is for the car and not the driver. This means that insurance companies do not consider factors like the age of the driver, her previous record etc. when it comes to insurance pricing. Only car related factors like the vintage, location etc. are taken into account.
Let us assume a simplistic scenario where we have two factors – the car model and the location. And we want to do build a differential pricing strategy based on these two factors.
Location: Is location a factor that affects risk in this case?For ex-ample, is a car more likely to get into an accident in a city like Delhi versus a city like Indore? now Delhi has more than 100 times the vehicles in Indore. It is therefore possible that accident rates in Delhi are higher than Indore. And thus, a car bought in Delhi could be more likely to get into an accident than a car bought in Indore.
Model: Similarly, the car model. Is a Hyndai Santro less likely to get into an accident than a Tata Indica? Maybe. Without data, we really can’t tell.
Insurance Data
We have historical data on 41,096 policies. The policies cover 12 different car models and sixteen locations. We first examine the data by car model. We rank order the car models based on their risk index.
MODEL RISK InDEX RISK CLASSIFICATIOnHyundai Santro 65 % low
Mitsubishi Cedia 45 % lowFord Figo 40 % low
Maruti Swift 38 % midHonda City 28 % midTata Indigo 24 % midHonda Civic 24 % mid
Maruti Wagon-R 12 % midTata Indica 10 % high
Honda Accord -1 % highTata Safari -13 % high
Mahindra Scorpio -14 % high
CROSS TABULATION EXAMPLE
Jigsaw Academy Education Private Limited © 201218

learn from experience, they will outperform other techniques by improving over time. However, this is not true. neural networks learn and improve like other techniques do and they do this in a clumsy one-record-at-a-time manner unlike the other techniques.
When to use neural networks?
The results of neural networks are hard to interpret and explain. In fact, this tech-nique works like a black-box. You can get the right answer but you may not under-stand how exactly you got it. In light of this, it is best to use neural networks when you have a high degree of familiarity with the input variables as well as the pre-dicted variable and you have a clear idea of what you want to model. Apart from prediction, they can be used for clustering, outlier detection and variable selec-tion as well.
Data preparation is often an involved and complex process. The fields need to be chosen carefully and the data needs to be standardized. The predictor variables need to be numeric and the output is also numeric.
neural networks do not produce easily understood rules that explain how insight was arrived at. Yet, it is possible to understand the relative importance of inputs into the network by using sensitivity analysis. In many business situations, under-standing the comparative importance of inputs is almost as good as having clear rules.
There are many analytic tools such as IBM modeler, Statistica and e-miner that have neural network capabilities. R has many packages for this purpose as well.
WHICH ANALYTIC TECHNIQUE TO CHOOSE?
This is often the hardest question at the start of the analysis. There are numerous different analytic techniques that are used to solve different kinds of problems. While different techniques work well with specific kinds of problems, it is often hard to pick one technique as the best solution in real-world cases. Analysts often try multiple approaches and then use the one that makes the most amount of sense. The choice of technique is often governed by availability as well. Most soft-ware packages will offer a sub-set of all the techniques and the analyst has to pick the best option from the available ones.
Some tips on modeling
• It is better to pick a simple, stable, easily explainable model than a complex, less stable and more accurate model.
• It is better to do a quick-and-dirty analysis and implement actions quickly than wait to complete a long and refined analysis.
• It is better to spend more time understanding and exploring the data than building numerous sophisticated models.
People who buy milk and bananas are more likely to buy cornflakes.
If milk and bananas, then cornflakes
People who buy one diet product are interested in other diet products.
If diet coke, then low fat mayo
People pick up chips when they buy beer.
If chips, then beer
ASSOCIATION RULES EXAMPLE
neural networks are like a “black box”. You put in the inputs, tweak some parameters, and you get the end results. It is very hard to explain how the algorithm came to the final results.
Jigsaw Academy Education Private Limited © 201219

7 CAREER PATH IN ANALYTICSCHAPTER The Analyst
The entry level role in the field of analytics is that of an analyst. This role offers you a chance to work on projects in a team, building expertise in the domain as well as the analytical tools and techniques. Basic knowledge of statistics is mandatory. You need to be familiar with widely used statistical concepts like p-value, probability distributions, chi-square etc. In addition, knowledge of common analytical tech-niques like logistic regression, clustering and decision trees is highly desirable.
The Senior Analyst
You will spend anywhere from 18 to 36 months in your first role before moving to the next level i.e. a senior analyst. If you have a PhD, you could directly join at this level. In this role, you will be expected to work independently on projects, even leading some of the smaller ones. You will continue to learn new methodologies as well as build domain knowledge.
The Team Lead
After spending another 2 to 4 years in this role, you will move to a team lead or lead consultant level. At this stage, many people will move into a people manage-ment track where they get to demonstrate their leadership and people manage-ment skills. However, some people with a more technical bent may choose to become subject matter experts (SMEs) instead. As an SME, you will provide lead-ership in defining and executing analytic methodologies for specific projects as well as develop new techniques to improve current processes. At this level, you will also be expected to manage most of the communication with clients regarding the projects you are working on.
The Manager
The next role in your career will be that of a manager. As an analytics manager you will be responsible for a team of 5 to 30 people. You may have 1 or more team leads working under you. If you are on the SME track, you may not have a perma-nent team assigned to you but you would be expected to provide thought leader-ship on individual projects.
The Associate Vice President
The next role is that of a senior manager followed by the Associate vice president (AVP).
growth in analytics is largely merit-based. You would need to demonstrate strong quantitative skills and an analytical aptitude in the early years. However, as you move up, communication and people management skills become differentiating factors.
Jigsaw Academy Education Private Limited © 201220
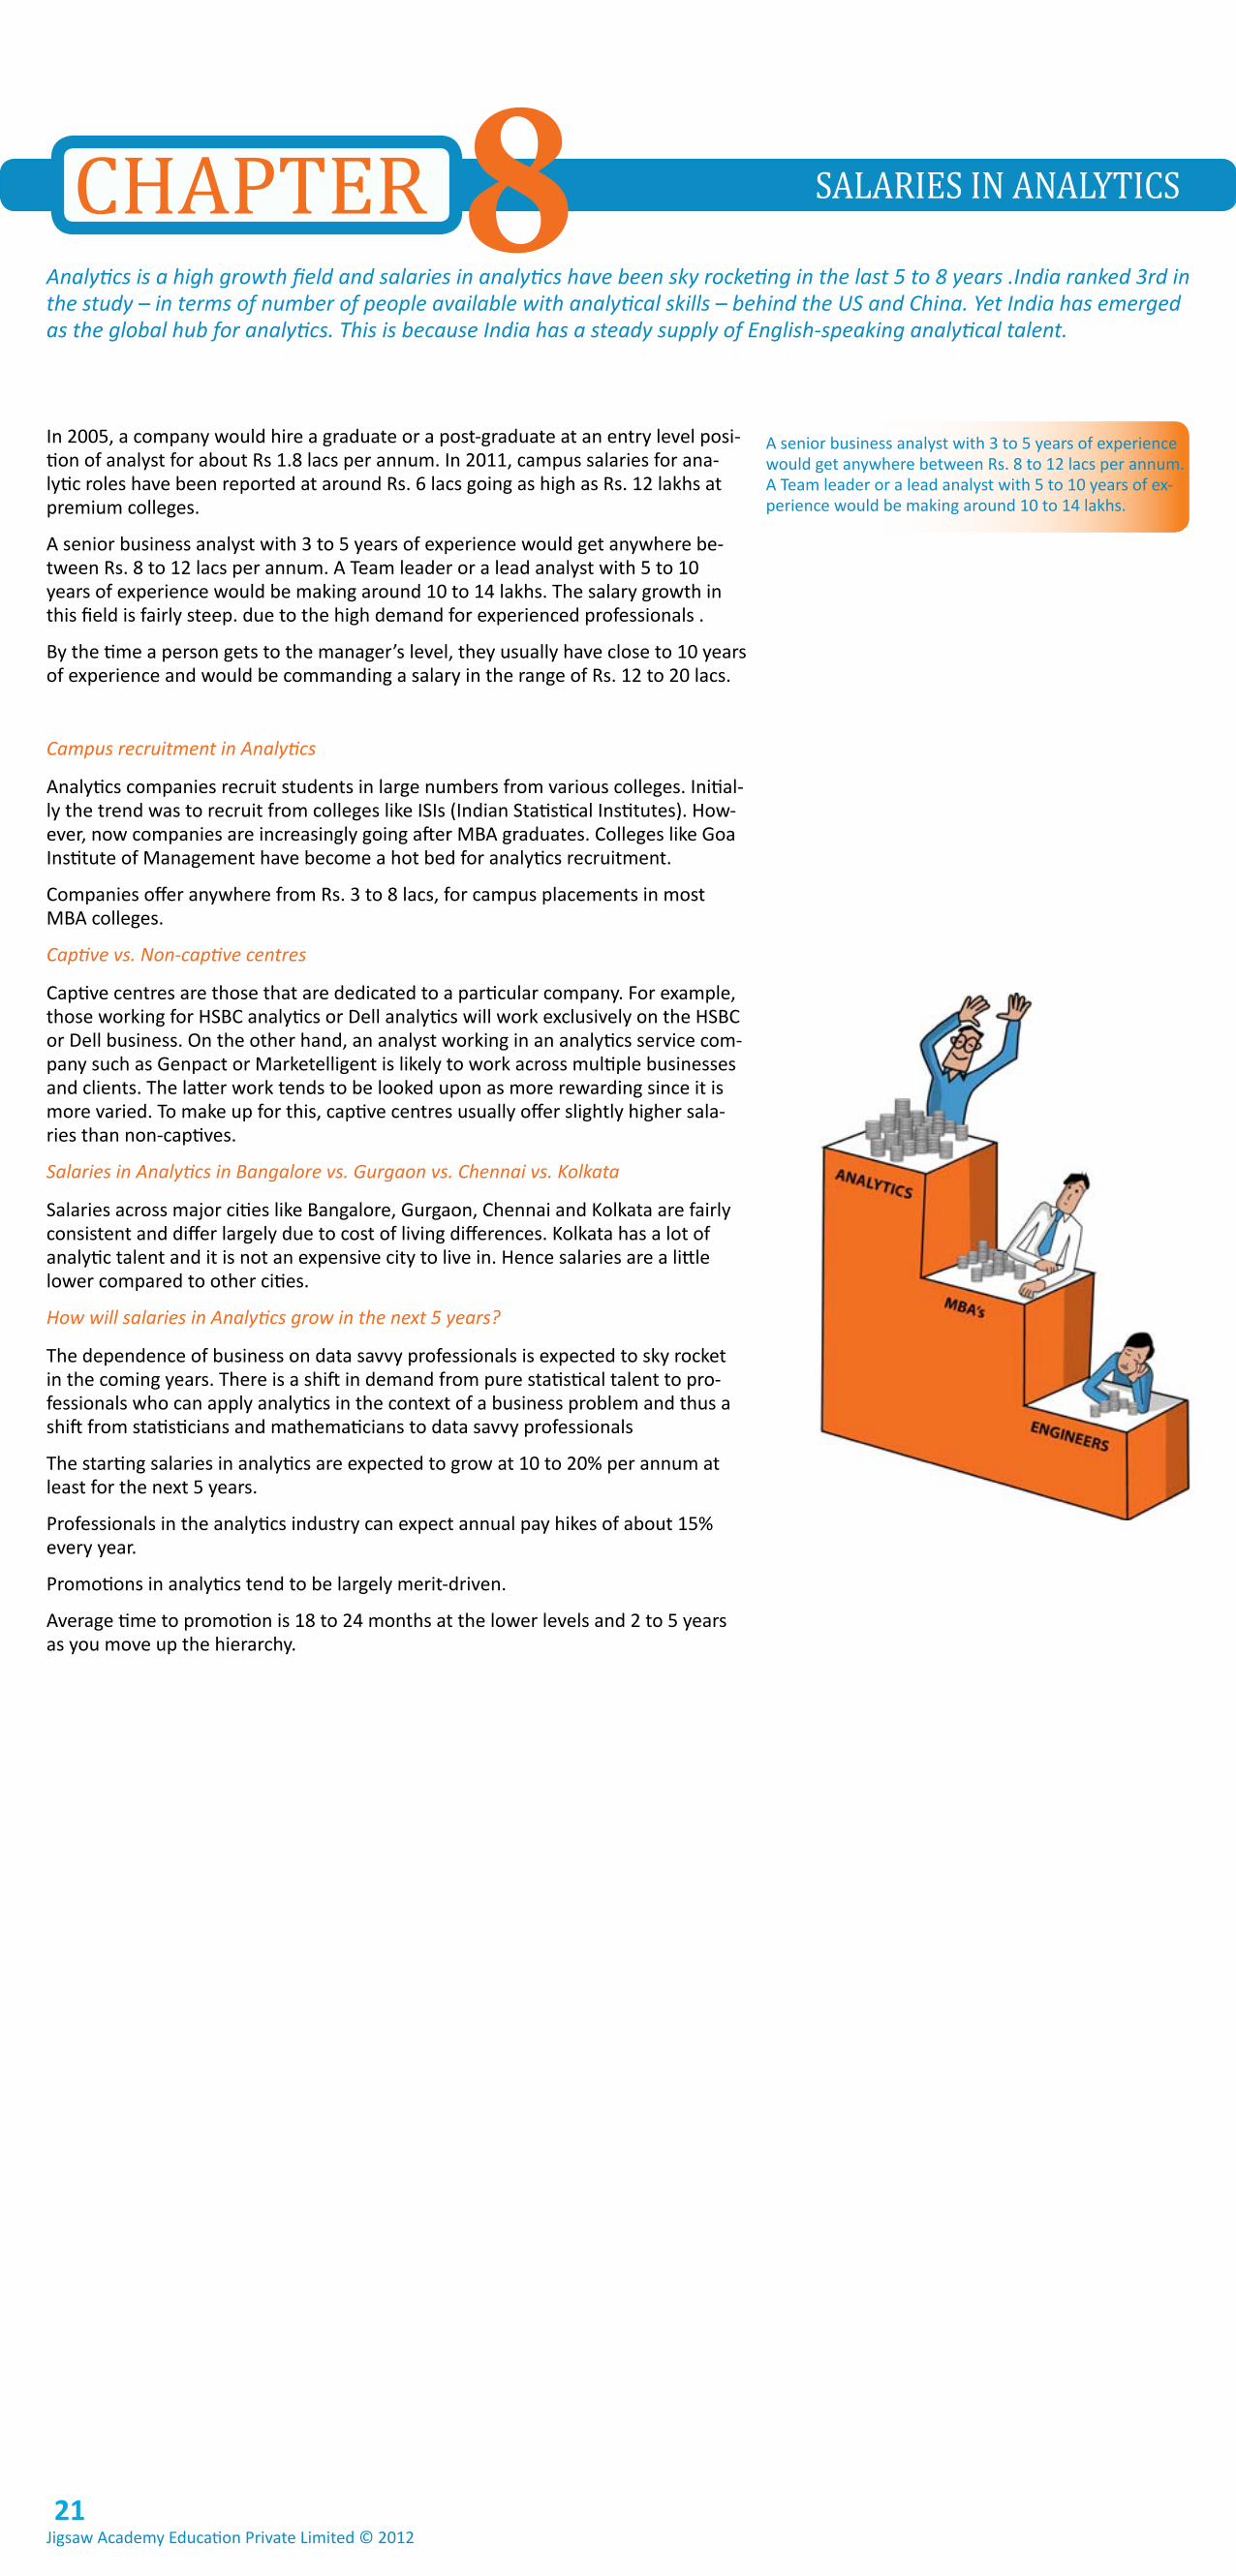
In 2005, a company would hire a graduate or a post-graduate at an entry level posi-tion of analyst for about Rs 1.8 lacs per annum. In 2011, campus salaries for ana-lytic roles have been reported at around Rs. 6 lacs going as high as Rs. 12 lakhs at premium colleges.
A senior business analyst with 3 to 5 years of experience would get anywhere be-tween Rs. 8 to 12 lacs per annum. A Team leader or a lead analyst with 5 to 10 years of experience would be making around 10 to 14 lakhs. The salary growth in this field is fairly steep. due to the high demand for experienced professionals .
By the time a person gets to the manager’s level, they usually have close to 10 years of experience and would be commanding a salary in the range of Rs. 12 to 20 lacs.
Campus recruitment in Analytics
Analytics companies recruit students in large numbers from various colleges. Initial-ly the trend was to recruit from colleges like ISIs (Indian Statistical Institutes). How-ever, now companies are increasingly going after MBA graduates. Colleges like goa Institute of Management have become a hot bed for analytics recruitment.
Companies offer anywhere from Rs. 3 to 8 lacs, for campus placements in most MBA colleges.
Captive vs. Non-captive centres
Captive centres are those that are dedicated to a particular company. For example, those working for HSBC analytics or Dell analytics will work exclusively on the HSBC or Dell business. On the other hand, an analyst working in an analytics service com-pany such as genpact or Marketelligent is likely to work across multiple businesses and clients. The latter work tends to be looked upon as more rewarding since it is more varied. To make up for this, captive centres usually offer slightly higher sala-ries than non-captives.
Salaries in Analytics in Bangalore vs. Gurgaon vs. Chennai vs. Kolkata
Salaries across major cities like Bangalore, gurgaon, Chennai and Kolkata are fairly consistent and differ largely due to cost of living differences. Kolkata has a lot of analytic talent and it is not an expensive city to live in. Hence salaries are a little lower compared to other cities.
How will salaries in Analytics grow in the next 5 years?
The dependence of business on data savvy professionals is expected to sky rocket in the coming years. There is a shift in demand from pure statistical talent to pro-fessionals who can apply analytics in the context of a business problem and thus a shift from statisticians and mathematicians to data savvy professionals
The starting salaries in analytics are expected to grow at 10 to 20% per annum at least for the next 5 years.
Professionals in the analytics industry can expect annual pay hikes of about 15% every year.
Promotions in analytics tend to be largely merit-driven.
Average time to promotion is 18 to 24 months at the lower levels and 2 to 5 years as you move up the hierarchy.
8 SALARIES IN ANALYTICSCHAPTER Analytics is a high growth field and salaries in analytics have been sky rocketing in the last 5 to 8 years .India ranked 3rd in the study – in terms of number of people available with analytical skills – behind the US and China. Yet India has emerged as the global hub for analytics. This is because India has a steady supply of English-speaking analytical talent.
A senior business analyst with 3 to 5 years of experience would get anywhere between Rs. 8 to 12 lacs per annum. A Team leader or a lead analyst with 5 to 10 years of ex-perience would be making around 10 to 14 lakhs.
Jigsaw Academy Education Private Limited © 201221
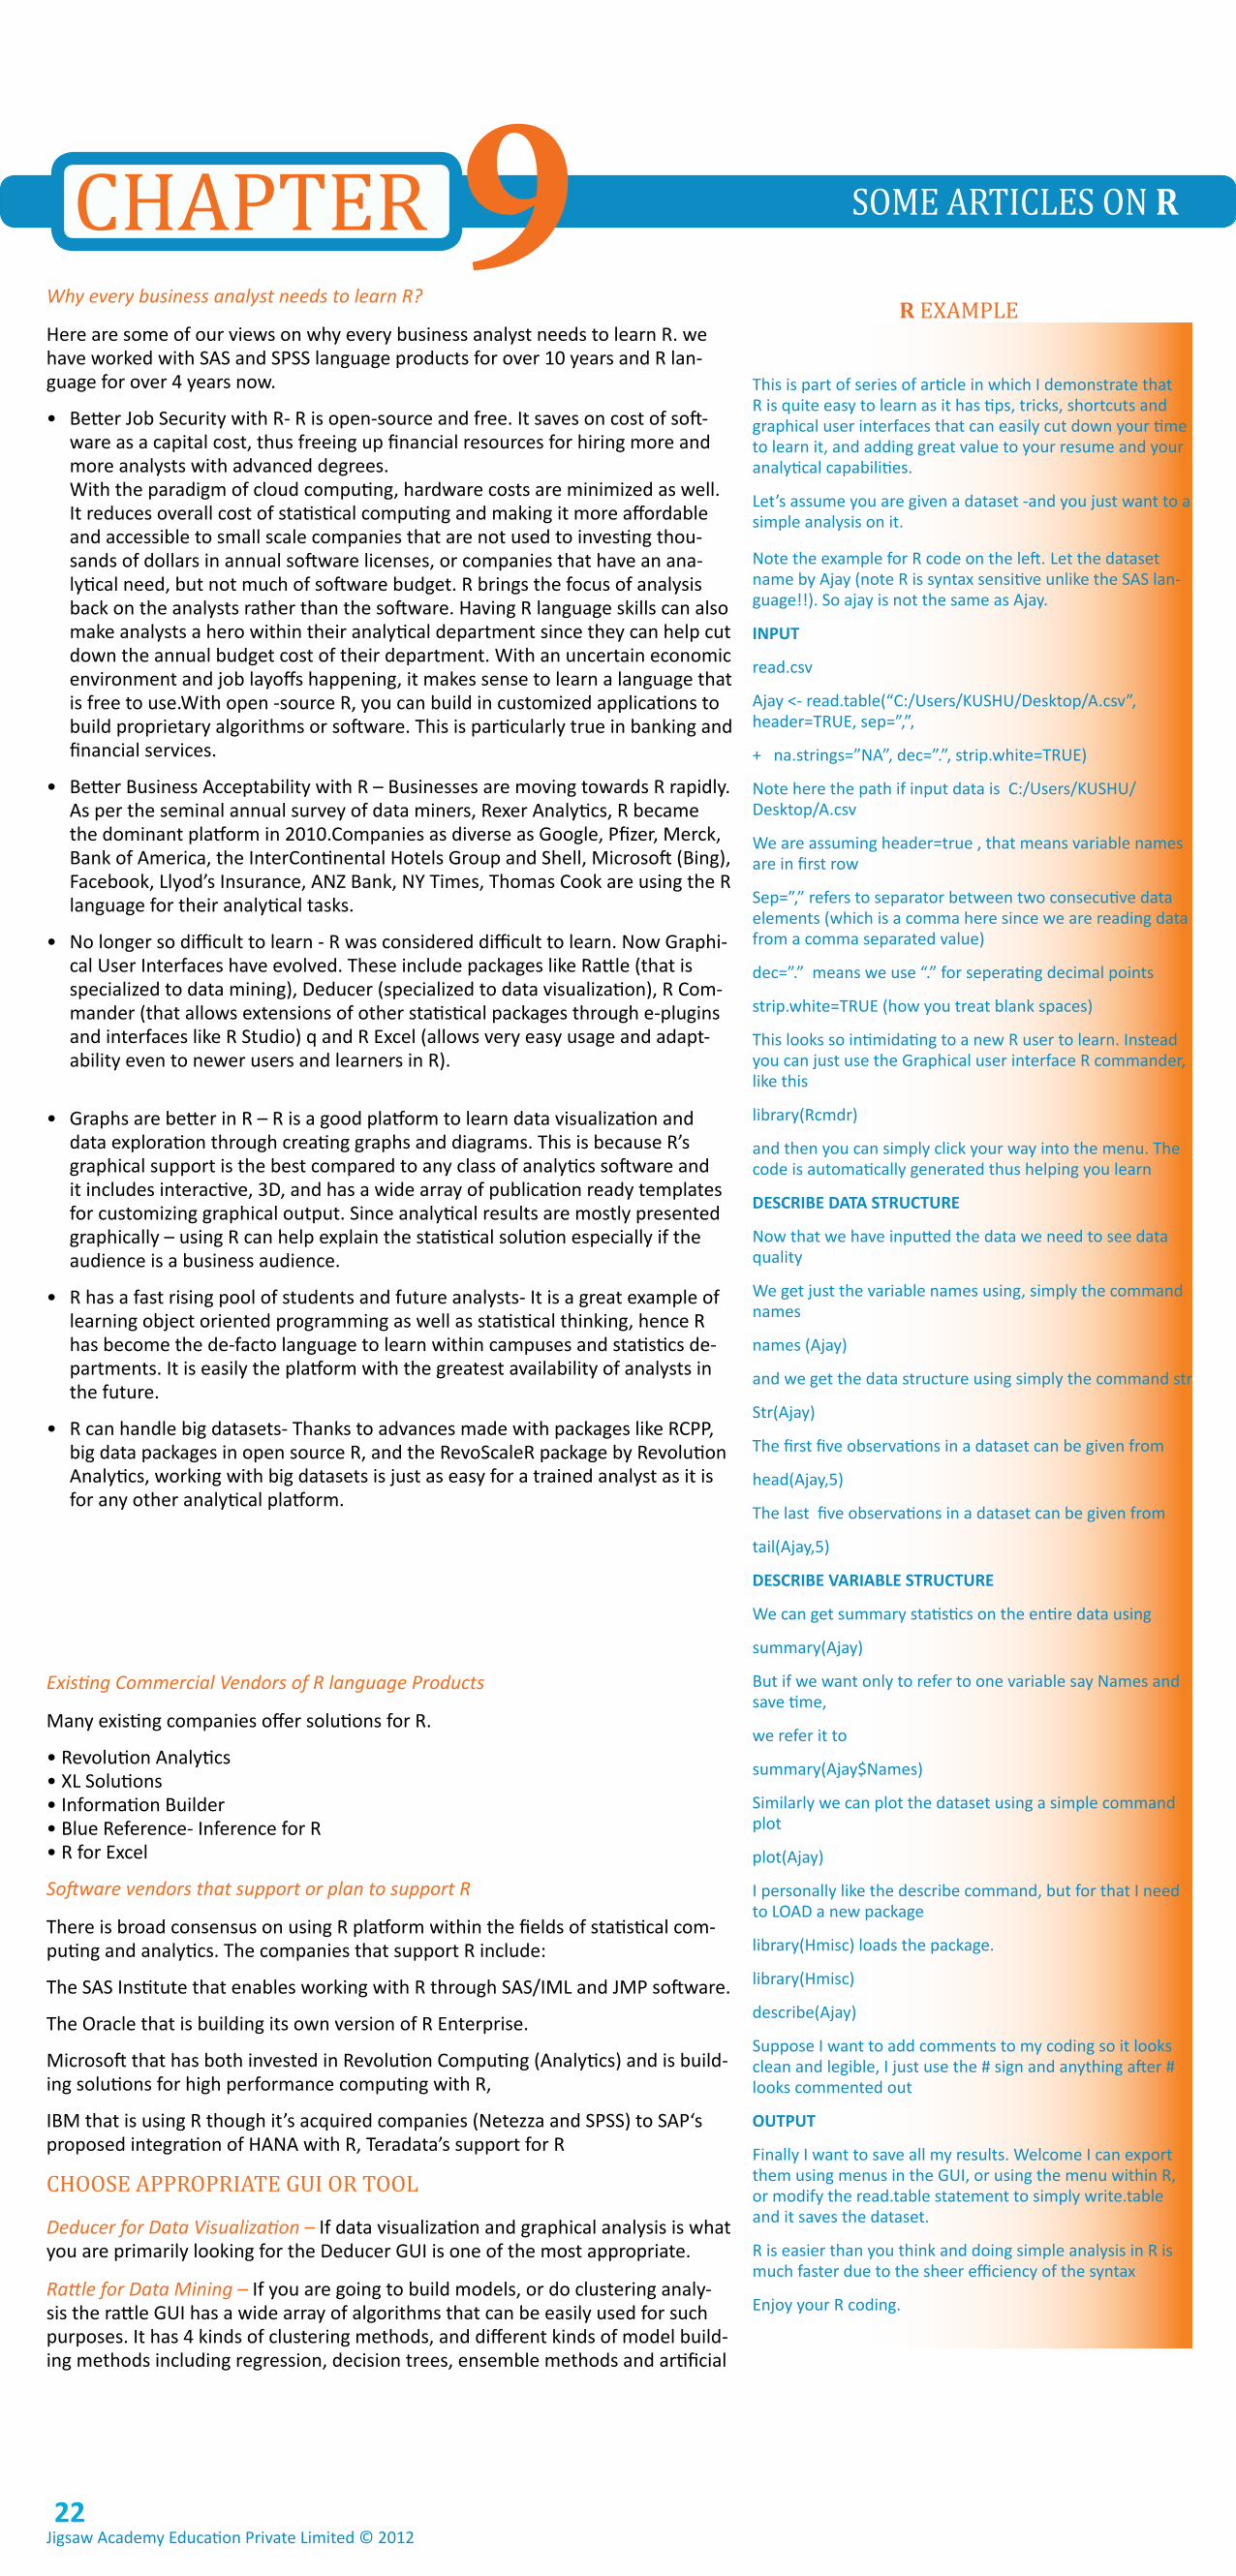
9 SOME ARTICLES ON RCHAPTER Why every business analyst needs to learn R?
Here are some of our views on why every business analyst needs to learn R. we have worked with SAS and SPSS language products for over 10 years and R lan-guage for over 4 years now.
• Better Job Security with R- R is open-source and free. It saves on cost of soft-ware as a capital cost, thus freeing up financial resources for hiring more and more analysts with advanced degrees. With the paradigm of cloud computing, hardware costs are minimized as well. It reduces overall cost of statistical computing and making it more affordable and accessible to small scale companies that are not used to investing thou-sands of dollars in annual software licenses, or companies that have an ana-lytical need, but not much of software budget. R brings the focus of analysis back on the analysts rather than the software. Having R language skills can also make analysts a hero within their analytical department since they can help cut down the annual budget cost of their department. With an uncertain economic environment and job layoffs happening, it makes sense to learn a language that is free to use.With open -source R, you can build in customized applications to build proprietary algorithms or software. This is particularly true in banking and financial services.
• Better Business Acceptability with R – Businesses are moving towards R rapidly. As per the seminal annual survey of data miners, Rexer Analytics, R became the dominant platform in 2010.Companies as diverse as google, Pfizer, Merck, Bank of America, the InterContinental Hotels group and Shell, Microsoft (Bing), Facebook, Llyod’s Insurance, AnZ Bank, nY Times, Thomas Cook are using the R language for their analytical tasks.
• no longer so difficult to learn - R was considered difficult to learn. now graphi-cal User Interfaces have evolved. These include packages like Rattle (that is specialized to data mining), Deducer (specialized to data visualization), R Com-mander (that allows extensions of other statistical packages through e-plugins and interfaces like R Studio) q and R Excel (allows very easy usage and adapt-ability even to newer users and learners in R).
• graphs are better in R – R is a good platform to learn data visualization and data exploration through creating graphs and diagrams. This is because R’s graphical support is the best compared to any class of analytics software and it includes interactive, 3D, and has a wide array of publication ready templates for customizing graphical output. Since analytical results are mostly presented graphically – using R can help explain the statistical solution especially if the audience is a business audience.
• R has a fast rising pool of students and future analysts- It is a great example of learning object oriented programming as well as statistical thinking, hence R has become the de-facto language to learn within campuses and statistics de-partments. It is easily the platform with the greatest availability of analysts in the future.
• R can handle big datasets- Thanks to advances made with packages like RCPP, big data packages in open source R, and the RevoScaleR package by Revolution Analytics, working with big datasets is just as easy for a trained analyst as it is for any other analytical platform.
Existing Commercial Vendors of R language Products
Many existing companies offer solutions for R.
• Revolution Analytics • XL Solutions • Information Builder • Blue Reference- Inference for R • R for Excel
Software vendors that support or plan to support R
There is broad consensus on using R platform within the fields of statistical com-puting and analytics. The companies that support R include:
The SAS Institute that enables working with R through SAS/IML and JMP software.
The Oracle that is building its own version of R Enterprise.
Microsoft that has both invested in Revolution Computing (Analytics) and is build-ing solutions for high performance computing with R,
IBM that is using R though it’s acquired companies (netezza and SPSS) to SAP‘s proposed integration of HAnA with R, Teradata’s support for R
CHOOSE APPROPRIATE gUI OR TOOL
Deducer for Data Visualization – If data visualization and graphical analysis is what you are primarily looking for the Deducer gUI is one of the most appropriate.
Rattle for Data Mining – If you are going to build models, or do clustering analy-sis the rattle gUI has a wide array of algorithms that can be easily used for such purposes. It has 4 kinds of clustering methods, and different kinds of model build-ing methods including regression, decision trees, ensemble methods and artificial
This is part of series of article in which I demonstrate that R is quite easy to learn as it has tips, tricks, shortcuts and graphical user interfaces that can easily cut down your time to learn it, and adding great value to your resume and your analytical capabilities.
Let’s assume you are given a dataset -and you just want to a simple analysis on it.
note the example for R code on the left. Let the dataset name by Ajay (note R is syntax sensitive unlike the SAS lan-guage!!). So ajay is not the same as Ajay.
INPUT
read.csv
Ajay <- read.table(“C:/Users/KUSHU/Desktop/A.csv”, header=TRUE, sep=”,”,
+ na.strings=”nA”, dec=”.”, strip.white=TRUE)
note here the path if input data is C:/Users/KUSHU/Desktop/A.csv
We are assuming header=true , that means variable names are in first row
Sep=”,” refers to separator between two consecutive data elements (which is a comma here since we are reading data from a comma separated value)
dec=”.” means we use “.” for seperating decimal points
strip.white=TRUE (how you treat blank spaces)
This looks so intimidating to a new R user to learn. Instead you can just use the graphical user interface R commander, like this
library(Rcmdr)
and then you can simply click your way into the menu. The code is automatically generated thus helping you learn
DESCRIBE DATA STRUCTURE
now that we have inputted the data we need to see data quality
We get just the variable names using, simply the command names
names (Ajay)
and we get the data structure using simply the command str
Str(Ajay)
The first five observations in a dataset can be given from
head(Ajay,5)
The last five observations in a dataset can be given from
tail(Ajay,5)
DESCRIBE VARIABLE STRUCTURE
We can get summary statistics on the entire data using
summary(Ajay)
But if we want only to refer to one variable say names and save time,
we refer it to
summary(Ajay$names)
Similarly we can plot the dataset using a simple command plot
plot(Ajay)
I personally like the describe command, but for that I need to LOAD a new package
library(Hmisc) loads the package.
library(Hmisc)
describe(Ajay)
Suppose I want to add comments to my coding so it looks clean and legible, I just use the # sign and anything after # looks commented out
OUTPUT
Finally I want to save all my results. Welcome I can export them using menus in the gUI, or using the menu within R, or modify the read.table statement to simply write.table and it saves the dataset.
R is easier than you think and doing simple analysis in R is much faster due to the sheer efficiency of the syntax
Enjoy your R coding.
R EXAMPLE
Jigsaw Academy Education Private Limited © 201222
Tips for beginners in R
1. In may last article, I mentioned R is the next big thing to learn in analytics. However R documentation is not easy to pick up and it is a more advanced language than other statistical computing platforms. My advice is not to get overwhelmed by the flexible nature of R. R is supposed to have a steep learn-ing curve, but some things can be learnt quite fast in R especially if you are a business analyst. Here are some basic tips, tricks and techniques to learn R as business analytics platform relatively quickly.
2. Download the software from the www.r-project.org website.
3. Read the basics of R from online manuals. You can read manuals on R at http://cran.r-project.org/manuals.html . The R Online Documentation is quite well organized.
4. Do not flood the R help email groups given at http://www.r-project.org/mail.html with questions unless you have searched the Internet for answers.
5. Command Line Programming can make a beginner uneasy when learning a new language. One of the reasons is to remember new syntax and commands. For-tunately R has a great collection of graphical User Interfaces of gUIs. Use some gUIs to move straight to click and point analysis.
6. Use CRAn Views for dedicated help on topics http://cran.r-project.org/web/views/.These include subjects from regression, clustering, high performance computing, time series analysis and others.
7. Buy a good book for beginners in R. There are 115 books listed at http://www.r-project.org/doc/bib/R-books.html. I personally like “R for SAS and SPSS users”
8. Watch video tutorials on YouTube specific to R Programming. One such series of tutorials is at http://www.youtube.com/user/Tutorlol
9. Subscribe to blogs (almost 300 of them) pertaining to R at http://www.r-blog-gers.com/. This website basically pulls in content from almost all the blogs per-taining to R and you can subscribe to it by email.
neural networks.
R Commander for Statistical Analysis and Time Series (using e-pack plugin) – The R Commander graphical User Interface is one of the simplest gUIs in R. It is one of the most widely used, and is extensible by at least a dozen plugins that basically help bring drop-down menu functionality for packages.
Red-R for Workflow based programming – This is a relatively newer project than others, but it is based on work flow programming.
Revolution Analytics Enterprise R for Business Analytics on large datasets (using RevoScaleR package) – Using the RevoScaleR package you can basically do analysis on larger datasets. note that for ordinary R, you are limited to size of RAM for the size of the datasets. You should also use Revolution Analytics Enterprise R if you need dedicated customer support.
R Studio- for developers who need an IDE
Jigsaw Academy Education Private Limited © 201223

CONTRIBUTINg AUTHORS
gAURAv vOHRAgaurav is an MBA from IIM Bangalore and has over a decade of experience in the field of ana-lytics. He has worked across multiple verticals including financial services, retail, FMCg, tele-com, pharmaceuticals and leisure industries. gaurav likes to work with different analytic tools including Knowledgestudio, SAS, SPSS, Statistica, KXEn, WPS and CART.
SARITA dIgUMARTISarita has a Master’s degree in Quantitative Economics, from Tufts University, Boston, and a Pg Diploma in Management from T.A. Pai Management Institute, Manipal. She has over 10 years of analytics and consulting experience across diverse domains including FMCg, retail and healthcare. She has worked in both India and the US, helping clients tackle complex business problems applying analytical techniques.
AjAY OHRI Ajay Ohri is an independent writer and blogger in the field of analytics since 2007. He is an engineer from Delhi College of Engineering and an MBA from IIM, Lucknow.His Decisionstats.com website has more than 15,000 hits per month and has carried more than 90 interviews with authors, analysts, founders, and senior management leaders of practically the entire ana-lytics industry. Ajay has been a proponent of R since its early days and is currently working on a book.
ANSHUMAN ACHARYAAnshuman is a graduate of IIT-Kanpur and IIM-Bangalore with over eleven years of experi-ence. For the past five years, he has been with Wal-Mart, India operations and worked across finance, strategy, merchandising and supply chain. He has four years of experience consulting global CPg manufacturers and US retailers across formats. His other interests are theatre and training.
Jigsaw Academy Education Private Limited © 201224