maßzahlen zur heterogenität in metaanalysen - kritisch ... · what is measured?how to measure?why...
TRANSCRIPT

What is measured? How to measure? Why measuring? What next? References
Maßzahlen zur Heterogenitat in Metaanalysen –kritisch diskutiert
Gerta Rucker
Institut fur Medizinische Biometrie und Medizinische Informatik, Universitatsklinikum FreiburgDeutsches Cochrane Zentrum, Freiburg
IQWiG im Dialog, Koln, Freitag, den 17. Juni 2011
1/22
What is measured? How to measure? Why measuring? What next? References
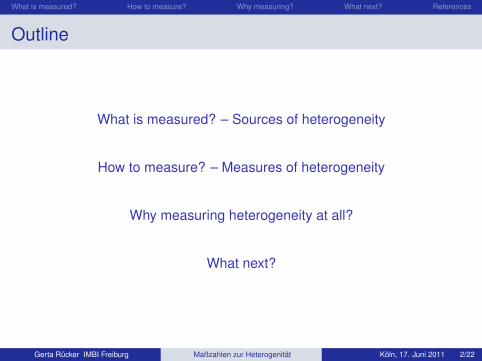
Outline
What is measured? – Sources of heterogeneity
How to measure? – Measures of heterogeneity
Why measuring heterogeneity at all?
What next?
Gerta Rucker IMBI Freiburg Maßzahlen zur Heterogenitat Koln, 17. Juni 2011 2/22
What is measured? How to measure? Why measuring? What next? References
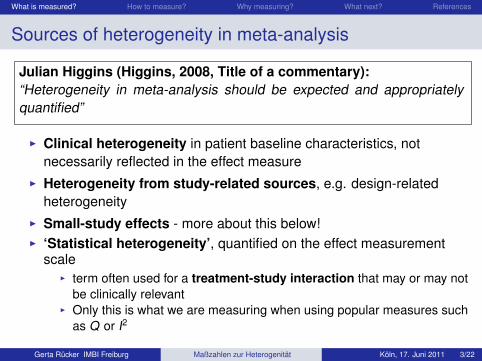
Sources of heterogeneity in meta-analysis
Julian Higgins (Higgins, 2008, Title of a commentary):“Heterogeneity in meta-analysis should be expected and appropriatelyquantified”
I Clinical heterogeneity in patient baseline characteristics, notnecessarily reflected in the effect measure
I Heterogeneity from study-related sources, e.g. design-relatedheterogeneity
I Small-study effects - more about this below!I ‘Statistical heterogeneity’, quantified on the effect measurement
scaleI term often used for a treatment-study interaction that may or may not
be clinically relevantI Only this is what we are measuring when using popular measures such
as Q or I2
Gerta Rucker IMBI Freiburg Maßzahlen zur Heterogenitat Koln, 17. Juni 2011 3/22
What is measured? How to measure? Why measuring? What next? References
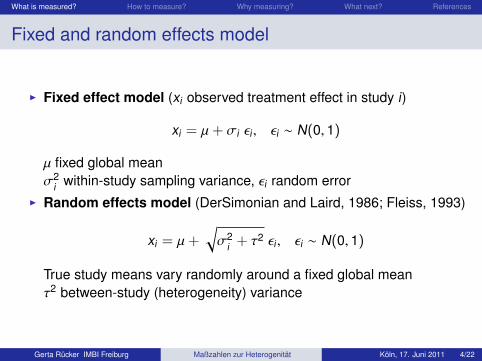
Fixed and random effects model
I Fixed effect model (xi observed treatment effect in study i)
xi = µ+ σi εi , εi ∼ N(0, 1)
µ fixed global meanσ2
i within-study sampling variance, εi random errorI Random effects model (DerSimonian and Laird, 1986; Fleiss, 1993)
xi = µ+√σ2
i + τ2 εi , εi ∼ N(0, 1)
True study means vary randomly around a fixed global meanτ2 between-study (heterogeneity) variance
Gerta Rucker IMBI Freiburg Maßzahlen zur Heterogenitat Koln, 17. Juni 2011 4/22
What is measured? How to measure? Why measuring? What next? References
Fixed and random effects model
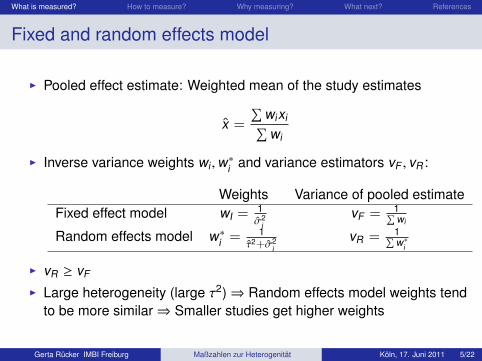
I Pooled effect estimate: Weighted mean of the study estimates
x =
∑wixi∑wi
I Inverse variance weights wi ,w∗i and variance estimators vF , vR :
Weights Variance of pooled estimateFixed effect model wI = 1
σ2i
vF = 1∑wi
Random effects model w∗i = 1τ2+σ2
ivR = 1∑
w∗i
I vR ≥ vF
I Large heterogeneity (large τ2)⇒ Random effects model weights tendto be more similar⇒ Smaller studies get higher weights
Gerta Rucker IMBI Freiburg Maßzahlen zur Heterogenitat Koln, 17. Juni 2011 5/22
What is measured? How to measure? Why measuring? What next? References
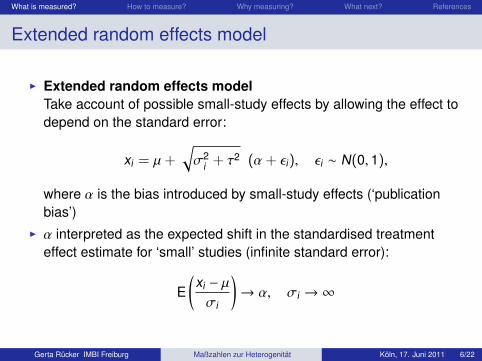
Extended random effects model
I Extended random effects modelTake account of possible small-study effects by allowing the effect todepend on the standard error:
xi = µ+√σ2
i + τ2 (α+ εi), εi ∼ N(0, 1),
where α is the bias introduced by small-study effects (‘publicationbias’)
I α interpreted as the expected shift in the standardised treatmenteffect estimate for ‘small’ studies (infinite standard error):
E(xi − µ
σi
)→ α, σi → ∞
Gerta Rucker IMBI Freiburg Maßzahlen zur Heterogenitat Koln, 17. Juni 2011 6/22
What is measured? How to measure? Why measuring? What next? References
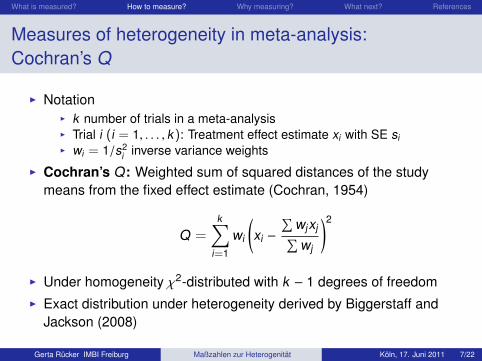
Measures of heterogeneity in meta-analysis:Cochran’s Q
I NotationI k number of trials in a meta-analysisI Trial i (i = 1, . . . , k): Treatment effect estimate xi with SE siI wi = 1/s2
i inverse variance weights
I Cochran’s Q: Weighted sum of squared distances of the studymeans from the fixed effect estimate (Cochran, 1954)
Q =k∑
i=1
wi
(xi −
∑wjxj∑wj
)2
I Under homogeneity χ2-distributed with k − 1 degrees of freedomI Exact distribution under heterogeneity derived by Biggerstaff and
Jackson (2008)
Gerta Rucker IMBI Freiburg Maßzahlen zur Heterogenitat Koln, 17. Juni 2011 7/22
What is measured? How to measure? Why measuring? What next? References
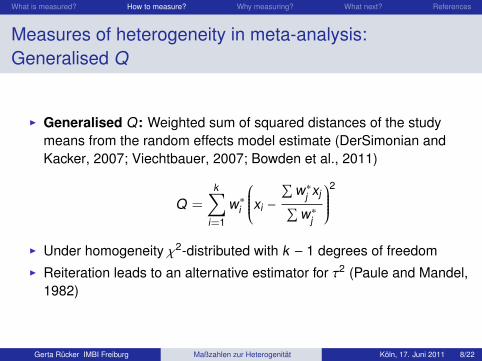
Measures of heterogeneity in meta-analysis:Generalised Q
I Generalised Q: Weighted sum of squared distances of the studymeans from the random effects model estimate (DerSimonian andKacker, 2007; Viechtbauer, 2007; Bowden et al., 2011)
Q =k∑
i=1
w∗i
xi −
∑w∗j xj∑w∗j
2
I Under homogeneity χ2-distributed with k − 1 degrees of freedomI Reiteration leads to an alternative estimator for τ2 (Paule and Mandel,
1982)
Gerta Rucker IMBI Freiburg Maßzahlen zur Heterogenitat Koln, 17. Juni 2011 8/22
What is measured? How to measure? Why measuring? What next? References
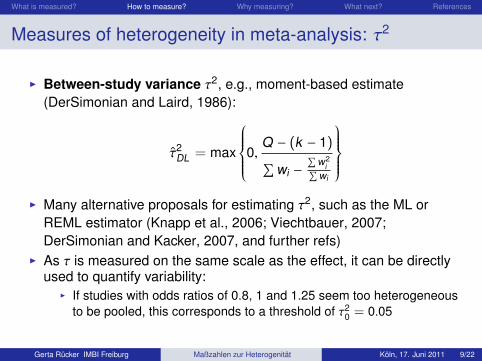
Measures of heterogeneity in meta-analysis: τ2
I Between-study variance τ2, e.g., moment-based estimate(DerSimonian and Laird, 1986):
τ2DL = max
0,Q − (k − 1)∑
wi −
∑w2
i∑wi
I Many alternative proposals for estimating τ2, such as the ML or
REML estimator (Knapp et al., 2006; Viechtbauer, 2007;DerSimonian and Kacker, 2007, and further refs)
I As τ is measured on the same scale as the effect, it can be directlyused to quantify variability:
I If studies with odds ratios of 0.8, 1 and 1.25 seem too heterogeneousto be pooled, this corresponds to a threshold of τ2
0 = 0.05
Gerta Rucker IMBI Freiburg Maßzahlen zur Heterogenitat Koln, 17. Juni 2011 9/22
What is measured? How to measure? Why measuring? What next? References
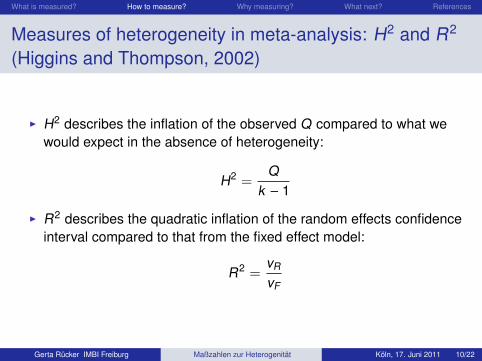
Measures of heterogeneity in meta-analysis: H2 and R2
(Higgins and Thompson, 2002)
I H2 describes the inflation of the observed Q compared to what wewould expect in the absence of heterogeneity:
H2 =Q
k − 1
I R2 describes the quadratic inflation of the random effects confidenceinterval compared to that from the fixed effect model:
R2 =vR
vF
Gerta Rucker IMBI Freiburg Maßzahlen zur Heterogenitat Koln, 17. Juni 2011 10/22
What is measured? How to measure? Why measuring? What next? References
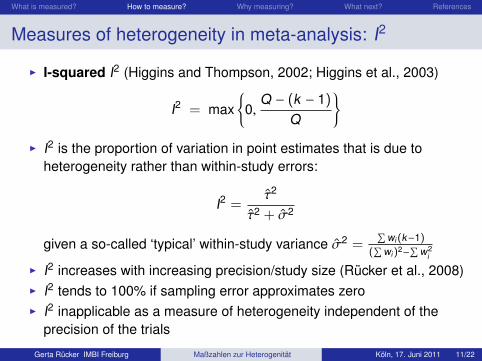
Measures of heterogeneity in meta-analysis: I2
I I-squared I2 (Higgins and Thompson, 2002; Higgins et al., 2003)
I2 = max{
0,Q − (k − 1)
Q
}I I2 is the proportion of variation in point estimates that is due to
heterogeneity rather than within-study errors:
I2 =τ2
τ2 + σ2
given a so-called ‘typical’ within-study variance σ2 =∑
wi(k−1)
(∑
wi)2−∑
w2i
I I2 increases with increasing precision/study size (Rucker et al., 2008)I I2 tends to 100% if sampling error approximates zeroI I2 inapplicable as a measure of heterogeneity independent of the
precision of the trials
Gerta Rucker IMBI Freiburg Maßzahlen zur Heterogenitat Koln, 17. Juni 2011 11/22
What is measured? How to measure? Why measuring? What next? References
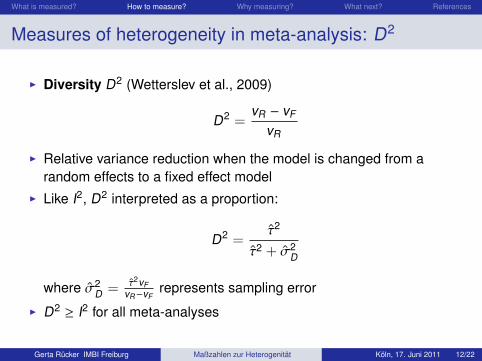
Measures of heterogeneity in meta-analysis: D2
I Diversity D2 (Wetterslev et al., 2009)
D2 =vR − vF
vR
I Relative variance reduction when the model is changed from arandom effects to a fixed effect model
I Like I2, D2 interpreted as a proportion:
D2 =τ2
τ2 + σ2D
where σ2D = τ2vF
vR−vFrepresents sampling error
I D2 ≥ I2 for all meta-analyses
Gerta Rucker IMBI Freiburg Maßzahlen zur Heterogenitat Koln, 17. Juni 2011 12/22
What is measured? How to measure? Why measuring? What next? References
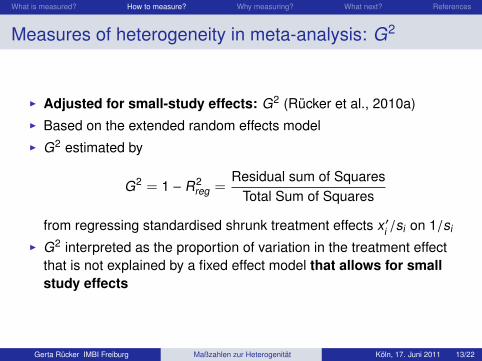
Measures of heterogeneity in meta-analysis: G2
I Adjusted for small-study effects: G2 (Rucker et al., 2010a)I Based on the extended random effects modelI G2 estimated by
G2 = 1 − R2reg =
Residual sum of SquaresTotal Sum of Squares
from regressing standardised shrunk treatment effects x′i /si on 1/si
I G2 interpreted as the proportion of variation in the treatment effectthat is not explained by a fixed effect model that allows for smallstudy effects
Gerta Rucker IMBI Freiburg Maßzahlen zur Heterogenitat Koln, 17. Juni 2011 13/22
What is measured? How to measure? Why measuring? What next? References
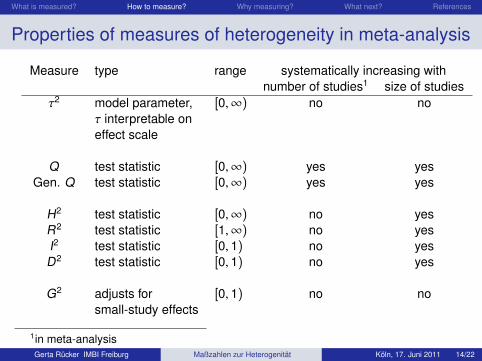
Properties of measures of heterogeneity in meta-analysis
Measure type range systematically increasing withnumber of studies1 size of studies
τ2 model parameter, [0,∞) no noτ interpretable oneffect scale
Q test statistic [0,∞) yes yesGen. Q test statistic [0,∞) yes yes
H2 test statistic [0,∞) no yesR2 test statistic [1,∞) no yesI2 test statistic [0, 1) no yesD2 test statistic [0, 1) no yes
G2 adjusts for [0, 1) no nosmall-study effects
1in meta-analysisGerta Rucker IMBI Freiburg Maßzahlen zur Heterogenitat Koln, 17. Juni 2011 14/22
What is measured? How to measure? Why measuring? What next? References
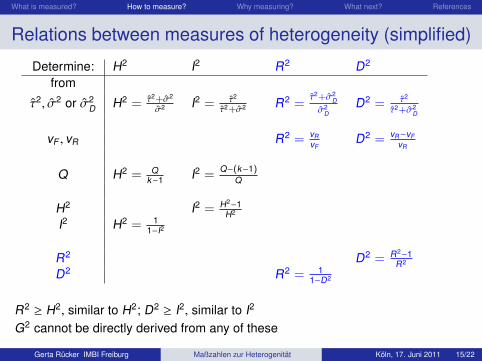
Relations between measures of heterogeneity (simplified)
Determine: H2 I2 R2 D2
from
τ2, σ2 or σ2D H2 = τ2+σ2
σ2 I2 = τ2
τ2+σ2 R2 =τ2+σ2
D
σ2D
D2 = τ2
τ2+σ2D
vF , vR R2 = vRvF
D2 = vR−vFvR
Q H2 = Qk−1 I2 =
Q−(k−1)Q
H2 I2 = H2−1H2
I2 H2 = 11−I2
R2 D2 = R2−1R2
D2 R2 = 11−D2
R2 ≥ H2, similar to H2; D2 ≥ I2, similar to I2
G2 cannot be directly derived from any of these
Gerta Rucker IMBI Freiburg Maßzahlen zur Heterogenitat Koln, 17. Juni 2011 15/22
What is measured? How to measure? Why measuring? What next? References
Common misinterpretation of I2
Note: I2 is not a population parameter, but a simple transformationof the test statistic Q!
I Misinterpretation of I2 is common (Higgins, 2008; Rucker et al., 2008)I Example I: Patsopoulos et al. (2008) present an algorithm that
excludes studies from a meta-analysis aiming to achieve I2 below adesired pre-set threshold
I Example II: Borm et al. (2009): ‘The evidence provided by a singletrial is less reliable than its statistical analysis suggests’
I Assuming a fixed ‘true’ I2, the authors argue that P-values of singletrials should be adjusted for heterogeneity
I Observing larger I2 values for large trials, they call for ‘many smalltrials’ instead of large trials
I This is a misinterpretation of the role of I2 (Rucker et al., 2009)
I The same considerations hold for D2
Gerta Rucker IMBI Freiburg Maßzahlen zur Heterogenitat Koln, 17. Juni 2011 16/22
What is measured? How to measure? Why measuring? What next? References
Why measuring heterogeneity at all?
John Copas (personal communication):I’m cautious about ideas of “measuring” statistical heterogeneity, sincethese are just open to abuse, like having some magical threshold belowwhich we can say that “heterogeneity can be ignored”.
Alex Sutton (from an open peer review2):My way of conducting meta-analysis is to estimate τ2 (ideally with un-certainty), if it is non-zero then I use a random effect model, if it is 0 itreduces automatically to a fixed effect model. In a sense I avoid Q , I2 orother statistics or hypothesis tests to decide model choice. Please clarifywhy we need Q , I2,D2 etc – is it to help decide on model choice or simplyquantify the degree of heterogeneity or both?
2Bowden et al. (2011)Gerta Rucker IMBI Freiburg Maßzahlen zur Heterogenitat Koln, 17. Juni 2011 17/22
What is measured? How to measure? Why measuring? What next? References
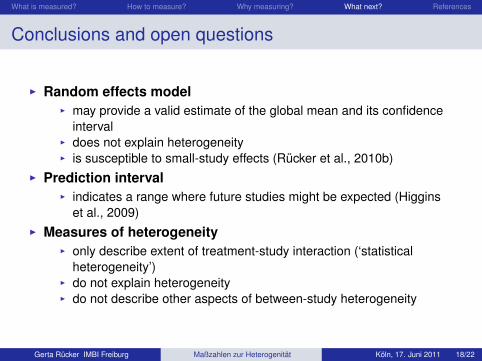
Conclusions and open questions
I Random effects modelI may provide a valid estimate of the global mean and its confidence
intervalI does not explain heterogeneityI is susceptible to small-study effects (Rucker et al., 2010b)
I Prediction intervalI indicates a range where future studies might be expected (Higgins
et al., 2009)I Measures of heterogeneity
I only describe extent of treatment-study interaction (‘statisticalheterogeneity’)
I do not explain heterogeneityI do not describe other aspects of between-study heterogeneity
Gerta Rucker IMBI Freiburg Maßzahlen zur Heterogenitat Koln, 17. Juni 2011 18/22
What is measured? How to measure? Why measuring? What next? References
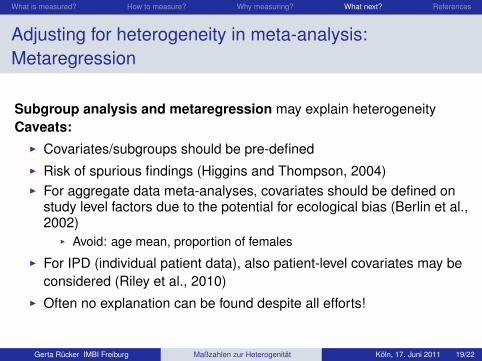
Adjusting for heterogeneity in meta-analysis:Metaregression
Subgroup analysis and metaregression may explain heterogeneityCaveats:I Covariates/subgroups should be pre-definedI Risk of spurious findings (Higgins and Thompson, 2004)I For aggregate data meta-analyses, covariates should be defined on
study level factors due to the potential for ecological bias (Berlin et al.,2002)
I Avoid: age mean, proportion of females
I For IPD (individual patient data), also patient-level covariates may beconsidered (Riley et al., 2010)
I Often no explanation can be found despite all efforts!
Gerta Rucker IMBI Freiburg Maßzahlen zur Heterogenitat Koln, 17. Juni 2011 19/22
What is measured? How to measure? Why measuring? What next? References
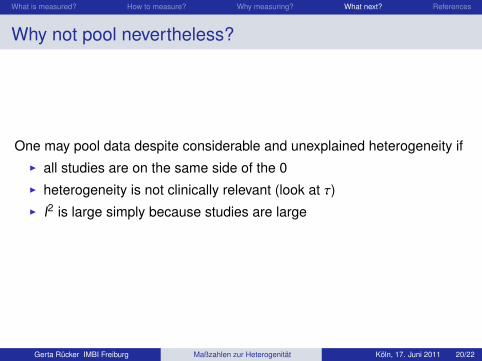
Why not pool nevertheless?
One may pool data despite considerable and unexplained heterogeneity ifI all studies are on the same side of the 0I heterogeneity is not clinically relevant (look at τ)I I2 is large simply because studies are large
Gerta Rucker IMBI Freiburg Maßzahlen zur Heterogenitat Koln, 17. Juni 2011 20/22
What is measured? How to measure? Why measuring? What next? References
Next slides: References
Gerta Rucker IMBI Freiburg Maßzahlen zur Heterogenitat Koln, 17. Juni 2011 21/22
What is measured? How to measure? Why measuring? What next? References
Berlin, J. A., Santanna, J., Schmid, C. H., Szczech, L. A., and Feldman, H. I. (2002).Individual patient- versus group-level data meta-regressions for the investigation oftreatment effect modifiers: Ecological bias rears its ugly head. Statistics in Medicine,21:371–387.
Biggerstaff, B. J. and Jackson, D. (2008). The exact distribution of cochran’s heterogeneitystatistic in one-way random effects meta-analysis. Statistics in Medicine,27(29):6093–6110.
Borm, G. F., Lemmers, O., Fransen, J., and Donders, R. (2009). The evidence provided bya single trial is less reliable than its statistical analysis suggests. Journal of ClinicalEpidemiology, 62(7):711–715.
Bowden, J., Tierney, J. F., Copas, A. J., and Burdett, S. (2011). Quantifying, displaying andaccounting for heterogeneity in the meta-analysis of rcts using standard andgeneralised Q statistics. BMC Medical Research Methodology, 11:41.
Cochran, W. G. (1954). The combination of estimates from different experiments.Biometrics, 10:101–129.
DerSimonian, R. and Kacker, R. (2007). Random-effects model for meta-analysis ofclinical trials: An update. Contemporary Clinical Trials, 28:105–114.
DerSimonian, R. and Laird, N. (1986). Meta-analysis in clinical trials. Controlled ClinicalTrials, 7:177–188.
Fleiss, J. L. (1993). The statistical basis of meta-analysis. Statistical Methods in MedicalResearch, 2:121–145.
Gerta Rucker IMBI Freiburg Maßzahlen zur Heterogenitat Koln, 17. Juni 2011 21/22
What is measured? How to measure? Why measuring? What next? References
Hedges, L. V. (1983). A random effects model for effect sizes. Psychological Bulletin,93:388–395.
Higgins, J. P. (2008). Commentary: Heterogeneity in meta-analysis should be expectedand appropriately quantified. International Journal of Epidemiology, 37(5):1158–1160.
Higgins, J. P., Thompson, S. G., and Spiegelhalter, D. J. (2009). A re-evaluation ofrandom-effects meta-analysis. Journal of the Royal Statistical Society, 172:137–159.
Higgins, J. P. T. and Thompson, S. G. (2002). Quantifying heterogeneity in ameta-analysis. Statistics in Medicine, 21:1539–1558.
Higgins, J. P. T. and Thompson, S. G. (2004). Controlling the risk of spurious findings frommeta-regression. Statistics in Medicine, 23:1663–1682.
Higgins, J. P. T., Thompson, S. G., Deeks, J. J., and Altman, D. G. (2003). Measuringinconsistency in meta-analysis. British Medical Journal, 327:557–560.
Knapp, G., Biggerstaff, B. J., and Hartung, J. (2006). Assessing the amount ofheterogeneity in random-effects meta-analysis. Biometrical Journal, 48:271–285.
Patsopoulos, N. A., Evangelou, E., and Ioannidis, J. P. (2008). Sensitivity of between-studyheterogeneity in meta-analysis: proposed metrics and empirical evaluation.International Journal of Epidemiology, 37(5):1148–1157.
Paule, R. and Mandel, J. (1982). Consensus values and weighting factors. Journal ofResearch of the National Bureau of Standards, 87(5):377–385.
Riley, R. D., Lambert, P., and Abo-Zaid, G. (2010). Meta-analysis of individual participantdata: rationale, conduct, and reporting. BMJ, 340.
Gerta Rucker IMBI Freiburg Maßzahlen zur Heterogenitat Koln, 17. Juni 2011 21/22
What is measured? How to measure? Why measuring? What next? References
Rucker, G., Schwarzer, G., Carpenter, J., Binder, H., and Schumacher, M. (2010a).Treatment effect estimates adjusted for small-study effects via a limit meta-analysis.Biostatistics, 12(1):122–142. Doi:10.1136/jme.2008.024521.
Rucker, G., Schwarzer, G., Carpenter, J., and Schumacher, M. (2010b). ‘Natural weighting’– is it natural? Letter to the editor. Statistics in Medicine, 29:2963–2966. DOI:10.1002/sim.3957.
Rucker, G., Schwarzer, G., Carpenter, J. R., and Schumacher, M. (2008). Undue relianceon I2 in assessing heterogeneity may mislead. BMC Medical Research Methodology,8:79. doi:10.1186/1471-2288-8-79.
Rucker, G., Schwarzer, G., Carpenter, J. R., and Schumacher, M. (2009). Are large trialsless reliable than small trials? Letter to the editor. Journal of Clinical Epidemiology,62:886–889.
Sidik, K. and Jonkman, J. N. (2005). Simple heterogeneity variance estimation formeta-analysis. JRSS Series C (Applied Statistics), 54(2):367–384.
Viechtbauer, W. (2007). Confidence intervals for the amount of heterogeneity inmeta-analysis. Statistics in Medicine, 26:37–52.
Viechtbauer, W. (2010). Conducting meta-analyses in R with the metafor package. Journalof Statistical Software, 36(3):1–48.
Wetterslev, J., Thorlund, K., Brok, J., and Gluud, C. (2009). Estimating requiredinformation size by quantifying diversity in random-effects model meta-analyses. BMCMedical Research Methodology, 9(1):86.
Gerta Rucker IMBI Freiburg Maßzahlen zur Heterogenitat Koln, 17. Juni 2011 22/22
What is measured? How to measure? Why measuring? What next? References
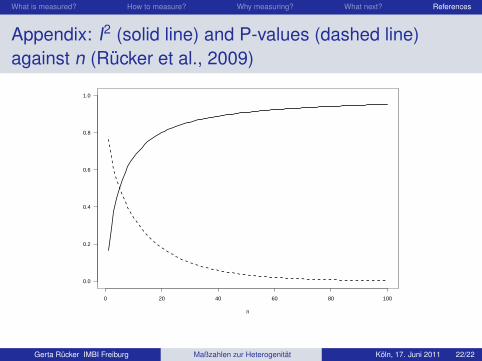
Appendix: I2 (solid line) and P-values (dashed line)against n (Rucker et al., 2009)
0 20 40 60 80 100
0.0
0.2
0.4
0.6
0.8
1.0
n
Gerta Rucker IMBI Freiburg Maßzahlen zur Heterogenitat Koln, 17. Juni 2011 22/22