massport and faa rnav pilot study overview public briefing
TRANSCRIPT
Massport and FAA RNAV Pilot Study Overview Public Briefing
February 22, 2017
State Transportation Bld. Boston, MA
As of 02/08/2017

Agenda
• Welcoming Remarks – Tom Glynn (Massport CEO) – David Carlon (Massport CAC Chair) – FAA (TBD)
• Massport\FAA RNAV MOU Pilot, Overview – Flavio Leo (Massport) – John Hansman (MIT)
• Public Comment

Massport/FAA RNAV MOU Context

An outcome of RNAV is concentration of flights...
Example- Departures - Runway R33L
Pre RNAV
Post RNAV

FAA and Massport MOU on RNAV Pilot Study
• RNAV Procedures Nationwide Deployment by FAA • Overflight noise versus concentration • Discussions with communities and elected • Engagement with FAA
– National Issue – Specific solutions to test – National model to address RNAV related issues
• Near-term actionable ideas tested and, if successful, applied to other runways and nationwide (12 to 18 month process)
• Massport CAC as the conduit for review and input • Massport CAC opportunity to add ideas
– Narrow focus on RNAV, limited and prioritized by the Massport CAC

Boston Logan Context

Boston Logan International Airport
• Largest Commercial Airport in New England Region
• Over $13 Billion in Annual Economic Impact
• Over 17,000 Direct Jobs – About 80% Private Sector
• Over 100,000 Total Direct/Indirect Jobs • Origin and destination airport- over 90%
of passengers originate or end trips from Boston
• Served by all major airlines and not a major connecting hub
• Extensive domestic and international non-stop service. Varied aircraft fleet mix
• Demand is driven primarily by local socio-economic conditions

Boston Logan is an urban airport • The airport has been
operating for over 90 years • The FAA is responsible for
choosing which runways to use
• For safety, aircraft land and depart into the wind
• Current and forecasted weather is primary
• Other operational factors include runway closures, fleet mix, efficiency
Wind and weather patterns are the primary driver of the number of hours and flights a particular runway’s configuration is used by the FAA. Depending on the runways in use, different neighborhoods/communities are overflown.
About 8 miles

Based on wind/weather, the FAA uses Logan runways in combinations to safely and efficiently meet demand. Based on which configuration the FAA selects, different communities are impacted
Northeast Flow R 4R\L and 9
Southwest Flow R22R\L and 27
Northwest Flow R33L\32 and 27
Southeast Flow R15R\L and 9
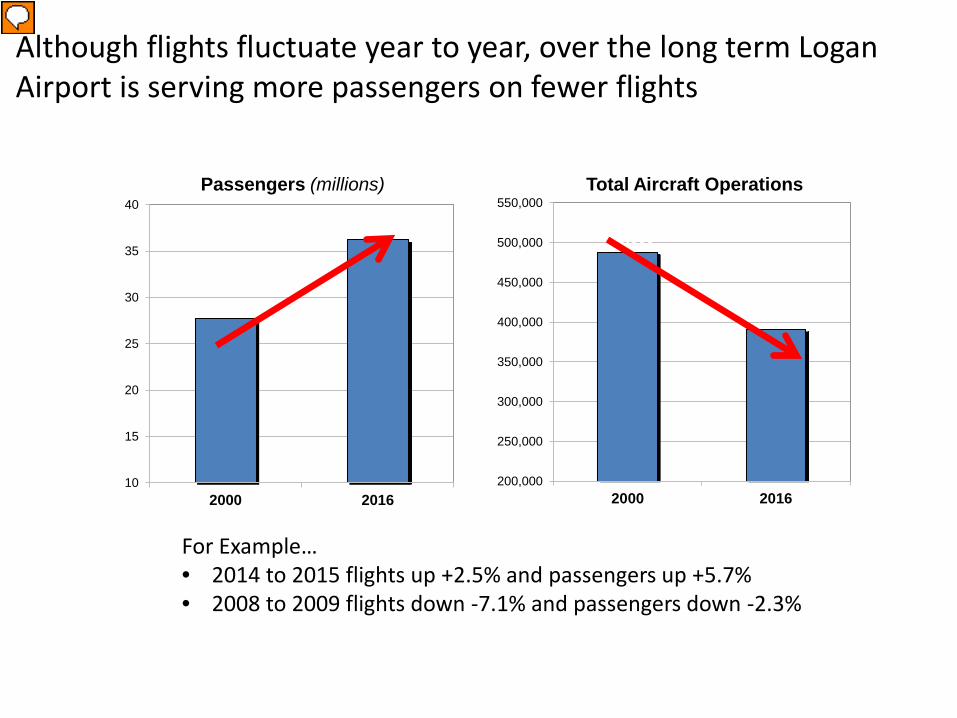
27.7
36.3
10
15
20
25
30
35
40
2000 2016
488,000
391,222
200,000
250,000
300,000
350,000
400,000
450,000
500,000
550,000
2000 2016
Passengers (millions) Total Aircraft Operations
Although flights fluctuate year to year, over the long term Logan Airport is serving more passengers on fewer flights
For Example… • 2014 to 2015 flights up +2.5% and passengers up +5.7% • 2008 to 2009 flights down -7.1% and passengers down -2.3%

New engine technology has reduced noise by greater than 95% since the 1980s. About 97% of Logan’s fleet meets engine stage 4 standards, the strictest noise and emissions designation
In the 1980s a typical aircraft at Logan was the B727-200. Today a typical aircraft is the A320 or B737-8. Point Shirley
is located in Winthrop.

Reflecting new engine technology and a reduction of total flights, Logan’s noise emissions contours have shrunk significantly over the last decades
Note: 65db DNL is FAA’s designation of significant noise exposure.
0
20,000
40,000
60,000
80,000
100,000
120,000
1980 1990 2000 2015
Pop
ulat
ion
Total Population W/n 65 dB DNL- Boston Logan

Because of Logan’s urban location, Massport has developed a comprehensive noise abatement program.
• Noise abatement departure procedures
• Late night opposite direction operations
• Decibel restriction on R4L departures and 22R arrivals
• Unidirectional/Wind restriction use R14/32
• Residential and School Soundproofing Program
• Engine run-up restrictions – Limited time – Specific locations
• Encourage use of single engine taxiing and reverse thrust
• 24/7 noise complaint line 617-561-3333
• State of the art Noise Monitoring System
• Near live flight tracking on website – http://www.massport.com/environment/environmental_re
porting/Noise%20Abatement/overview.aspx

Overflights - Principals
• Safety for passengers and people on the ground • Weather as factor • Data driven • Regional fairness across metropolitan region • Massport CAC as regional voice • Massport/FAA MOU to test five/plus experiments

Massport/FAA RNAV MOU Update

Overview of Technical Process and Pilot Tests- Ideas reflect input from communities close to Boston Logan
1. Persistence of RNAV departures
2. Increasing aircraft altitudes, Departures
3. Increase aircraft altitudes, Arrivals
4. RNAV separation requirements
5. Alternative RNAV Special designs
6. Other (?) – consistent with purpose of study and priority
Apply alternative metrics – Develop supplemental metric(s) to better identify the potential for community impacts associated with proposed procedural changes

Critical Steps • MOU with FAA Identifies roles and responsibilities
– Commitment of resources to effort
• Technical Team and Work Program – MIT – HMMH – Ex-FAA Manager – FAA Technical Support\Coordination
• Coordinate with Massport CAC (and public) at important milestones – October 7th Announcement with FAA and elected officials – Massport Press Release – Briefing to CAC Executive Committee 10/24 – Briefing to CAC Aviation Committee 11/2 – Massport briefing to Executive Committee 11/29 – Briefing to full Massport CAC 12/08 – Briefing to Massport Executive Committee (2/14/17) – Public Meeting (2/22/17) – Ongoing Coordination
18

End Massport


Performance-Based Navigation (PBN)
21

22
RNAV Track Concentration
Image Source: Massport Source: ASDE-X 8 days in 2015
Departures in blue Arrivals in green

• Population sensitive to changes at levels well below the 65 DB “significant” Day-Night Noise Level(DNL)
• Overflight frequency perceived to increase under tracks – Precise overflight tracks make visual identification easier
• Exposure less attributable to “random” processes – Track directly related to procedure
• Traditional Metrics not perceived to capture overflight frequency – At lower DNL levels the number or frequency of events may be more
important than DNL or Lmax • Concentration raises issues of Equity
– Popular to propose dispersion as a solution – Dispersion results in more noise impact
• Can PBN capability be used to reduce community noise impact
23
Impact of PBN Concentration

Noise Complaints at BOS: One Dot per Address
24
Departures Arrivals
Complaint Data: August 2015– July 2016 Track Data: ASDE-X from 12 days of operation, 2015-2016
Each dot represents an address that registered at least one complaint during period

Noise Complaints at BOS: Dots Weighted by Complaint Frequency
25
Departures Arrivals
Complaint Data: August 2015– July 2016 Track Data: ASDE-X from 12 days of operation, 2015-2016
Each dot represents an address that registered at least one complaint during period Marker size corresponds to number of complaints registered by address

• Spatial Management – Noise preferred arrival and departure routes
• Precise Lateral Trajectories • Low population density or background shielding • Critical point avoidance
– Flight track dispersion or concentration • Vertical Management
– Modified Departure Angles • Speed or Thrust Scheduling
– Modified Approach Angles • Continuous Descent Arrival (CDA) • 2 Segment or Steep Approaches
• Speed/Drag Management – Low power/low drag approach profiles (DDA)
• Others? 26
Potential Uses of PBN for Reducing Noise

• Collect Data and Evaluate Baseline Conditions – Pre and Post RNAV
• Identify current procedures which appear to have community noise benefit
• Determine Technical and Operational Limitations – Aircraft Performance – Navigation and Flight Management (FMS) – Flight Crew Workload – Safety – Procedure Design – Air Traffic Control Workload
• Identify Candidate Procedure Modifications • Block 1/Block 2
• Model Noise Impact – Standard and Supplemental Metrics
• Evaluate Implementation Barriers • Recommend Procedural Modifications to Massport and FAA • Repeat for Block 2
27
Technical Approach

28
Departures

29
Arrivals

Project Schedule Preliminary/Subject to Change
• FAA/ Massport Discussions Winter – Fall 2016 • Announcement Oct 2016 • Consultant Team Organization Fall 2016 • Historical Flight Comparison\Analysis Dec to Feb 2016 • Block 1 Procedure Opportunity Feb 2017
– lower complexity, benefits with minimal/no negative impacts – DNL and Alternative Metrics (single event above threshold)
• Block 1 Recommendations Apr 2017 • Block 2 Procedure Opportunity Jun 2017
– More complexity, benefits and potential negative impacts
– DNL and Alternative Metrics (single event above threshold) • Block 2 Recommendations Fall 2017 • FAA Review Process Ongoing/TBD • Implementation/Final Report TBD
Review\Input MPA CAC
At Key Milestones

31
Backup

Noise and DNL: A Primer
• Sound Pressure Level – Ratio to minimum audible
baseline – The dB is with reference to
sound power (intensity) – A Weighting is a correction to
reflect frequency range of human hearing
32

33
Examples of SPL from Overflights
Source Mathias Basner, Univ. of Penn. ASCENT 17 – Pilot Study on Aircraft Noise and Sleep
Maximum Sound Pressure Level Lmax

34
Effect of Background Level
Source Mathias Basner, Univ. of Penn. ASCENT 17 – Pilot Study on Aircraft Noise and Sleep

Sound Exposure Level
Figure: A. Trani, Virginia Tech
• Starting point: raw SPL recordings (or 1s equivalent noise) for a specific observer
• Need a measure of sound energy exposure at that point
– Solution: integrate the antilog of the raw dB trace
– Notionally represented in figure by red shaded area
• Referred to as Sound Exposure Level (SEL) for a single overflight and observer location
35

Day-Night Level
• DNL incorporates the multitude of single-flight SEL building blocks
• Represents equivalent (average) noise level over a full day (86,400 seconds)
• 10 dB penalty for night operations
Figure: A. Trani, Virginia Tech
36

Implications of DNL
37
10 Ops 0.46 dB
10 Ops 10.41 dB Change in DNL for a change in
number of operations depends on the baseline number of operations

Shrinking DNL65 Impact at Airports
Slide Source: Massport 38
Note: 65db DNL is FAA’s designation of significant noise exposure.
0
20,000
40,000
60,000
80,000
100,000
120,000
1980 1990 2000 2013 2014
Pop
ulat
ion
Total Population W/n 65 dB DNL- Boston Logan