massey paee review final report
DESCRIPTION
http://teu.ac.nz/wp-content/uploads/2009/02/Massey-PaEE-Review-Report-Final-Report.pdfTRANSCRIPT

Pay and Employment Equity Review Report and Action
Plan
Pay and Employment Equity Review Committee
March 2011
© Pay and Equity Employment Review Committee, Massey University, 2011 Printed in 2011 by the AVC (People and Organisational Development), Massey University, Private Bag 11-222, Palmerston North, New Zealand No part of this publication may be reproduced by any means, electronic, mechanical, electrostatic photocopying or otherwise, or stored in a retrieval system without the prior permission of the publisher.
i
Foreword from the Chair On behalf of the Pay and Employment Equity Review Committee, it is my pleasure to present this report. Considerable time and effort has gone into the preparation of this report. The survey, together with the internal data collection process, yielded a very large amount of data that has required a great deal of processing. The committee has invested considerable time in analysing the data and determining what Massey University does well and areas where there could be improvement. The committee first met in February of this year and its work has extended right through the year, longer than initially anticipated. I wish to thank the members for their commitment to this task, acknowledging that this work was in addition to their other duties. Of particular note is the work of Human Resources staff in providing data. I also wish to thank the project manager, Rae Torrie, for sharing with the committee her experience from previous reviews, which has been of great assistance to the work of the committee. I also wish to thank the many members of staff who responded to the survey. Without their involvement the findings would have been less robust. Addressing the issues that have been identified will assist Massey University in achieving the excellence to which it is committed. As a Professor Emeritus with 42 years of service to the University, I am very aware of the progress that has been made in terms of employment equity during the past few decades. That there are issues still remaining is not unexpected. I congratulate Massey University on undertaking this project and, in so doing, showing its willingness to continue to improve working conditions at the University. Sylvia Rumball CNZM (Professor Emeritus) Chair, PaEE Review Committee

ii
Foreword from the Assistant Vice-Chancellor, People and Organisational Development Massey University is proud to be the first New Zealand University to undertake a full Pay and Employment Equity Review. The University’s Road to 2020 asserts our role as a world centre of tertiary learning. This demands that we have the very best people and that we create an environment that enables our people to excel. We cannot afford to have blind spots when it comes to the attraction, development, and engagement of great people. This report gives us a platform of information and insights to take informed action. Over the last decade the rhetoric has been about a “global war for talent”. Well, guess what… “the talent” won. What this means is that great people have choices. Our challenge is to ensure we are well placed for them to choose us – whether they currently work for us or aspire to do so. Our challenge is to develop an undisputed reputation as a meritocracy where people’s only limits are their own talent, capability and motivation. The analysis in the PaEE review reveals a range of gaps. Many of these are small, at the level where jobs of a similar kind or size are compared. Sometimes the gap is in favour of men. Sometimes it’s in favour of women. Sometimes it’s not statistically significant, but in many cases it is. The PaEE review committee has been seeking to understand the factors that contribute to these gaps. They are many and varied. They don’t relate only to our own employment practices but to wider issues about how society appears to value work and how this reflects in the distribution of men and women across our many occupations within Massey University. The broader society we live and work in reflects different and emerging views about the nature and value of different kinds of work. Large numbers of jobs across Massey University are predominantly filled by women. Many of these are paid at our lower pay grades. So, while in some cases there may be relative equity among staff paid in these roles, the high distribution of women in these lower paid roles significantly contributes to the overall pay gap. This aspect will not be fixed simply by just addressing what these roles are paid, but may require greater clarity about the skill requirements, pay levels and other factors so that, over time, we see a shift to a greater gender balance – across all types and level, including our senior roles. We must keep developing a culture and work place practices that enable us to advance our talented staff to senior opportunities on the basis of merit, by challenging accepted assumptions about things like working patterns and the value of experiences gained outside the direct University environment while people raise children or (increasingly) care for aging parents. It will mean establishing new assumptions about the basis on which talented people progress and how we identify, nurture and support their career trajectory.
iii
It has been fabulous to watch the team of general and academic staff, and union and management working together on these important issues. The valuing of different perspectives among the team, and the contribution of specific skills and experience, has been an extraordinary display of collaboration. A special thank you is in order for the time and dedication committed by committee members, in committee, in small groups, and in individual research and documentation of analysis. The outcomes have taken the committee longer than we all would have liked. This is because the issues are not trivial. They are complex. They are multi-faceted. There is no single thing that will change things overnight. I will be surprised if this report does not generate debate. This is a good thing, because this is a conversation that we need to have. Alan Davis, AVC People and Organisational Development Sponsor, PaEE Review Project
iv
Foreword from the Tertiary Education Union The Tertiary Education Union, Te Hautū Kahurangi (TEU), is extremely pleased to have conducted, in cooperation with Massey University, this first Pay and Employment Equity review in a university in New Zealand. TEU and its predecessors (AUS and ASTE) have had a long history of ensuring women workers have equality of opportunity in all aspects of their working life – pay, rewards, professional development, promotion and participation at senior levels of the institutions. Women want their work valued fairly, respect, and access to the full range of opportunities in the workplace unaffected by their gender. This review identifies areas where improvements can and should be made and where specific gender training, monitoring of practice and a facilitative approach will help reduce gender differences at Massey University and achieve better outcomes for women and indeed all staff. We hope members of TEU and all staff will see how participating in the survey and the review has contributed to the report and action plan and we acknowledge the time and resources that Massey University have committed to this work to date. TEU will continue in partnership with Massey University to implement the recommendations in the Review Action Plan over the next three years. Suzanne McNabb, National Women’s Officer Tertiary Education Union, Te Hautū Kahurangi o Aotearoa

v
Pay and Employment Equity Review Committee Committee Members
Ee Kheng Ang, Senior Tutor, School of Management, Manawatu Campus Christine Alexander, Head of Section, Lending & Document Supply Services, Library, Wellington Campus Sharyn Bonham, Reserve Co-ordinator, Lending & Document Supply Services, Library, Albany Campus Barbara Crump, Senior Lecturer, School of Management, Wellington Campus Alan Davis, Assistant Vice-Chancellor (People and Organisational Development), Manawatu Campus Kayrn Kee, Policy Analyst, Office of the AVC (Māori & Pasifika), Manawatu Campus Suzanne McNabb, National Women’s Officer, Tertiary Education Union, Wellington Campus John Moremon, Lecturer, Centre for Defence and Security Studies, Manawatu Campus Judith Nathan, Senior Adviser, Planning and Projects, AVC (FISC), Wellington Campus Mary Paul, Senior Lecturer, School of English & Media Studies, Albany Campus Cat Pausé, Lecturer, School of Arts, Development & Health Education, Manawatu Campus Sylvia Rumball, Professor Emeritus, Manawatu Campus Alan Wheeler, Remuneration Manager, People & Organisational Development, Manawatu Campus Dean Whitehead, Senior Lecturer, School of Health & Social Services, Manawatu Campus Fran Wolber, Research Scientist, Institute of Nutrition Food & Human Health, Manawatu Campus
Project Team Members
Rae Torrie, PaEE Review Project Manager, Evaluation Works Ltd, Wellington Lesley Drury, Rehabilitation & ACC Administrator, HR – Health & Safety, Manawatu Campus
Recipient of Agenda and Papers
Lawrence O’Halloran, TEU Organiser, Tertiary Education Union, Manawatu Campus

vi
vii
Contents
Executive Summary .............................................................................................................................. 12
Background ....................................................................................................................................................... 12
The review process at Massey University ........................................................................................................ 13
Findings and conclusions .................................................................................................................................. 14
Key gender equity issues at Massey University................................................................................................ 14
1. An overall gender pay gap ........................................................................................................... 15
2. Gender pay gaps for specific groups of staff ............................................................................... 15
3. Occupational segregation – general staff women concentrated in female-dominated work .... 16
4. Women are under-represented in senior positions .................................................................... 16
5. Women’s starting salaries are lower than men’s in some occupations ...................................... 17
6. Women are over-represented in tutor and senior tutor academic positions ............................. 18
7. Academic women are over-represented on fixed-term agreements .......................................... 19
8. Part-time work options do not meet the needs of the range of women workers ...................... 19
9. Women do not progress through the academic promotions process as quickly as men ........... 20
10. There are bullying, harassment, discrimination and other inappropriate behaviour, and there is
dissatisfaction about how these are addressed .......................................................................... 20
Other issues ............................................................................................................................................ 21
The Action Plan – a strategy for progress towards gender equity at Massey University ................................ 21
Priorities for commencing the implementation of the Action Plan ....................................................... 22
Part A – Introduction ............................................................................................................................ 23
Background ....................................................................................................................................................... 24
Background to PaEE reviews in New Zealand ........................................................................................ 24
PaEE reviews in the tertiary education sector ....................................................................................... 25
The PaEE review at Massey University................................................................................................... 27
Key facts about Massey University ................................................................................................................... 28
Key staff data by gender ........................................................................................................................ 28
Managing the PaEE review process at Massey University ............................................................................... 29
The review people and infrastructure ................................................................................................... 29
Methodology .................................................................................................................................................... 31
Data sources ........................................................................................................................................... 34
Relevant institutional information ......................................................................................................... 34
HR and payroll data ................................................................................................................................ 34
PaEE review staff survey ........................................................................................................................ 36
Collation and analysis of the data .................................................................................................................... 38
Writing the report ............................................................................................................................................ 40
viii
Part B – Findings and conclusions ......................................................................................................... 41
Massey University staff profile by gender ........................................................................................................ 41
Background to the measures used ......................................................................................................... 41
Massey University staff profile ......................................................................................................................... 43
What Massey University is doing well in respect to gender equity ................................................................. 46
1. The first university in NZ to undertake an analysis of pay and employment equity ................... 47
2. Improved representation of women on the Senior Leadership Team since 2008 ...................... 47
3. Increased number of female Associate Professors in the last three years, and their overall
representation in this group ........................................................................................................ 48
4. The payment of women managers within the ICT area .............................................................. 48
5. Targeted support to women to promote research – the University Women’s Award ............... 49
6. Increased participation on, and support for, the Women and Leadership programme ............. 49
7. Provision of support to the Women@Massey group .................................................................. 49
8. The formation of the Gender Equity Advisory Group .................................................................. 49
9. Approval and resourcing of the Women’s Virtual Resource Centre............................................ 50
10. Enabling sick leave provisions ...................................................................................................... 50
Massey University’s gender equity issues ........................................................................................................ 51
1. An overall gender pay gap ........................................................................................................... 52
2. Pay gaps for specific groups of staff ............................................................................................ 54
3. Occupational segregation – general staff women concentrated in female-dominated work .... 63
4. Women under-represented in senior positions and over-represented in lower positions......... 71
5. Women’s starting salaries are lower than those of men ............................................................. 79
6. Women are over-represented in tutor and senior tutor academic positions ............................. 84
7. Academic women are over-represented on fixed term agreements .......................................... 88
8. Part-time work options do not meet the needs of the range of women workers ...................... 93
9. Women do not progress through the academic promotions process as quickly as men ........... 98
10. Bullying, harassment, discrimination and other inappropriate behaviour and dissatisfaction
about how these are addressed ................................................................................................ 104
Other issues .......................................................................................................................................... 113
Part C – The action plan ...................................................................................................................... 116
Implementation and monitoring of the action plan ...................................................................................... 116
The gender equity issues being addressed in the action plan ....................................................................... 117
Priorities for commencing implementation of the actions ............................................................................ 117
1. The gender pay gap .................................................................................................................... 118
2. The gender pay gap for specific groups of staff ......................................................................... 119
3. Occupational segregation – general staff women in female-dominated work ......................... 122
4. Women are under-represented in senior positions and over-represented in lower positions 125
5. Women’s starting salaries are lower than those of men ........................................................... 128
6. Women are over-represented in tutor and senior tutor academic positions ........................... 131
7. Academic women are over-represented on fixed term agreements ........................................ 133
ix
8. Part-time work options at Massey University do not meet the needs of the range of women
workers ...................................................................................................................................... 135
9. Women do not progress through the academic promotions process as quickly as men ......... 137
10. Dissatisfaction about bullying, harassment, discrimination and other inappropriate behaviour
and how these are addressed .................................................................................................... 139
Appendices ........................................................................................................................................ 142
Appendix 1: Pay and Employment Equity Review Survey ............................................................................. 141
Appendix 2: Relevant Institutional Information – Pay and Employment Equity Review Project Summary . 175
Appendix 3: PEEAT (Pay and Employment Equity Analysis Tool) – Summary list of gender differences ...... 141
Appendix 4: PaEE Review Survey – Summary of Respondent Population .................................................... 145
Appendix 5: Survey analysis .......................................................................................................................... 147
Appendix 6: Open-ended Survey Question 31 .............................................................................................. 157
Appendix 7: Massey University Salary Scales 2009 (from the Collective Employment Agreement) ............ 166
Appendix 8: Science technicians ................................................................................................................... 170
Appendix 9: Statistical analysis of general staff by letter-grade and of survey data: opportunities for
advancement and perceptions of equality ..................................................................................................... 172
Appendix 10: Gender Differences in Pay by Grade ....................................................................................... 184
Tables Table 1: Baseline numerical data for thirteen participating ITPs ..................................................................... 26
Table 2: Representation and distribution of men women at Massey University as at December 2009 ......... 28
Table 3: PaEE review committee meeting dates and focus of the meetings ................................................... 30
Table 4: PEEAT charts used to analyse the HR and payroll data ...................................................................... 35
Table 5: Factors contributing to the New Zealand gender pay gap (Dixon 2000) ............................................ 42
Table 6: The UK pay gap and productivity gap (Walby and Olsen 2002) ......................................................... 42
Table 7: Representation and distribution of men women at Massey University as at December 2009 ......... 44
Table 8: Gender differences in pay on base salary as at December 2009 ....................................................... 45
Table 9: Gender differences in pay (base salary), December 2009 .................................................................. 52
Table 10: Number of professors by college (excluding those who are managers such as PVC or HoD) .......... 54
Table 11: Number of science technician staff by grade and gender ................................................................ 59
Table 12: Average base salary for by grade and gender .................................................................................. 60
Table 13: Main science technician roles by average base salary by gender .................................................... 60
Table 14: Comparison by gender of general staff in jobs matched by title, category, and grade ................... 62
Table 15: Distribution of general staff by gender ............................................................................................ 64
Table 16: Male-dominated work (Level 4 ANZSCO, filtered data) ................................................................... 64
Table 17: Female-dominated work (Level 4 ANZSCO, filtered data) ................................................................ 65
Table 18: Average base salaries of males and females for employees in general grades A–I (gen A–I). ......... 67
Table 19: Women’s representation in academia ............................................................................................. 71
Table 20: Accelerated increment (AI) by grade ................................................................................................ 73
Table 21: Gender representation on the Senior Leadership Team .................................................................. 74
x
Table 22: Gender pay differences in starting salaries ...................................................................................... 80
Table 23: Gender variance in starting salaries of recently appointed tutors by campus ................................ 82
Table 24: Gender variance in starting salaries of recently appointed senior tutors by campus ...................... 83
Table 25: Number and percentage of tutors on fixed-term contracts by gender............................................ 84
Table 26: Gender representation in all fixed-term and permanent academic positions ................................. 88
Table 27: Number and % of academic staff on fixed-term agreements by position and gender .................... 89
Table 28: Number of academic staff in part-time work by gender .................................................................. 93
Table 29: Number of general staff in part-time work by gender ..................................................................... 94
Table 30: Number of general staff working part-time by grade ...................................................................... 95
Table 31: Massey rationale for determining whether positions are part-time ............................................... 95
Table 32: Promotion to Senior Lecturer Range One ........................................................................................ 98
Table 33: Promotion to Senior Lecturer Range Two ........................................................................................ 99
Table 34: Promotion to Associate Professor .................................................................................................... 99
Table 35: Promotion to Professor .................................................................................................................. 100
Table 36: Women’s applications for promotion 2009, 2010 ......................................................................... 101
Table 37: Enumeration of Massey-employee relationship problems occurring in 2009 ............................... 106
Table 38: Gender pay difference in starting salaries for Programme or Project Administrator .................... 115
Table 39: Gender pay difference in starting salaries for ICT Customer Support Officer ................................ 115
xi
Figures Figure 1: New Zealand gender pay gap 1996–2010 ......................................................................................... 25
Figure 2: Infrastructure for the PaEE review at Massey University ................................................................. 30
Figure 3: The three gender equity indicators and key questions ..................................................................... 32
Figure 4: The PaEE review five-step process .................................................................................................... 33
Figure 5: Pattern of wage band distribution by gender ................................................................................... 46
Figure 6: Gender representation in the Senior Leadership Team 2005–2011 ................................................. 48
Figure 7: Distribution of employees by gender within each academic position and general grade ................ 53
Figure 8: Distribution of science technicians within each gender among job grades ...................................... 59
Figure 9: Maximum grade within positions in major general-grade job categories by sex-dominance .......... 66
Figure 10: Maximum grade within positions in sex-balanced major general-staff job categories .................. 67
Figure 11: Distribution of employees by gender within each general grade ................................................... 72
Figure 12: Average base salary of male versus female general staff employees in each job grade ................ 72
Figure 13: Proportional distribution amongst job grades of all female vs all male general staff employee ... 72
Figure 14: Gender variance in starting salaries of recently-appointed tutors by campus ............................... 82
Figure 15: Gender variance in starting salaries of recently-appointed senior tutors by campus .................... 83
Pay and Employment Equity Review Report and Action Plan
Executive Summary
This Pay and Employment Equity (PaEE) Review Report and Action Plan provides the Vice-Chancellor, Senior Leadership Team, the Tertiary Education Union (TEU), and all staff with information on the status of gender equity in relation to pay and employment at Massey University and a strategy for steps to progress gender equity. The review, as an integral part of the University’s Road to 2020 strategy for women and leadership and equal employment opportunity, provides baseline gender data against which the effectiveness of future actions can be measured. The report is in four parts:
an introduction incorporating background information, key facts about Massey University, the review process and methodology
the findings and conclusions, including staff profile by gender, what the university is doing well, the gender equity issues that have been found (with supporting evidence)
an action plan and
appendices. Supplementary papers are also available on the University’s website.
Background
Nationally and internationally, strategies have been undertaken to address gender inequities and reduce the gender pay gap. In 2004, the Pay and Employment Taskforce Report noted a ‘persistent and troubling gender pay gap’ in New Zealand, despite legislative initiatives.1 The Government committed to a 5-year Plan of Action. Phase One included PaEE reviews being undertaken and response plans developed in all organisations in the core public service and in the public health and education sectors. Massey University’s commitment to undertake a PaEE review, the first in the university sector, followed 16 reviews in Institutes of Technology and Polytechnics (ITPs) and one Wānanga undertaken from 2007 to 2009. All the pay and employment equity reviews (approximately 100) were designed as a tripartite2 process to investigate systematically whether men and women have equitable outcomes and experiences in employment assessed against three equity indicators:
Women and men have an equitable share of rewards
Women and men participate equitably in all areas of the organisation
Women and men are treated with respect and fairness.
1 Department of Labour (2004). Report of the Taskforce on Pay and Employment Equity in the Public Service, and the Public Health
and Public Education Sectors, p. 1. 2 A partnership of employees, employers and relevant unions.

Part A – Introduction
13
The review design used at Massey was used in the ITP sector and in the wider public sector. It was an international first in that it focused on all the factors that influence the gender pay gap, including the representation and distribution of men and women in the workforce.
The review process at Massey University
The review was conducted between November 2009 and December 2010. It was sponsored by Alan Davis, AVC People and Organisational Development (POD), in partnership with the TEU, represented by Suzanne McNabb. A steering committee clarified the methodology, developed the survey, and selected a review committee. The PaEE review committee, comprising both general and academic staff from the three campuses, met throughout 2010. Significant contributions were made by specialist staff from the University. The review was managed by an independent external contractor, Rae Torrie. The review used a five-step process contained in a Pay and employment equity review workbook for the university sector that addressed the following research questions:
What are the gender differences at Massey University?
Why are there gender differences?
Are the differences explainable and justifiable?
What must be done to address gender inequities? How will agreed actions be managed and monitored?
Two main sources of data informed the review process: information from the payroll and human resource information system, and data gathered from a staff survey. The committee also considered other relevant internal and external information. In order to compare the work that men and women do, and associated remuneration, it was necessary to be able to establish work that is the same and work that is different but of equal value3. The committee used a classification of occupation tool known as ANZSCO (Australian and New Zealand Standard Classification of Occupations4) and a pay and employment equity analysis tool (PEEAT) developed by the Department of Labour which provided quantitative information A total of 1784 Massey University staff participated in a Human Ethics Approved, on-line survey conducted by an independent company. Of the 3545 staff invited, 50% responded and were broadly representative of the University’s workforce. The initial analysis enabled the committee to develop a preliminary list of issues. The next task was to determine whether the different outcomes for men and women were explainable and
3 At times within any organisation, job titles are not consistently defined and applied and the same work can have different job
titles, or different work can have the same job titles. Most often within organisations, there is a mixture of some clearly defined
work with titles that are consistently applied, and other areas of poorly defined work and/or inconsistent application. 4 ANZSCO is used by Statistics New Zealand as the framework for classifying census data, so provides a useful point of national
comparison should Massey want to do this.

14
justifiable. Significant differences that could be explained but not justified, or could not be explained became the key gender equity issues. From the beginning of the project, consideration was given to the integration of Māori and Pasifika perspectives, and one of the committee members was asked to pay attention to this brief throughout the review. While the project focus was on three gender equity indicators, in keeping with reviews undertaken across the public service, public education and public health sectors, data were also gathered by ethnicity where possible (such as the survey), to establish whether there were particular issues for women outside the dominant European/Pakeha group. In the analysis it was found that, because data by ethnicity could not be gathered for all areas and where it was gathered numbers were often very small, there was not enough information to develop key areas of focus. It is expected, however, that many of the proposed actions and gains for women will also provide benefits for Māori and Pasifika staff.
Findings and conclusions
In December 2009, there were 1495 men employed at Massey University and 1907 women (56%), excluding the Vice-Chancellor. There were 614 academic women, (45%) and 1288 general staff women (64%) plus 10 men and five women in senior management. Women are less well-represented in areas where the pay tends to be higher, and over-represented in the areas where the pay tends to be lower. The committee identified 10 areas in which Massey University is doing well in relation to gender equity: 1. The first university in NZ to undertake a full pay and employment equity review 2. Improved representation of women in the Senior Leadership Team 3. Increased number of women Associate Professors in the last three years, and an increase in
their overall representation in this group 4. The payment of women managers within the Information and Communication Technologies
(ICT) area 5. Targeted support to women to promote research – the University Women’s Award (UWA) 6. Increased participation on, and support for, the Women and Leadership programme 7. Provision of support to the Women@Massey group 8. The formation of the Gender Equity Advisory Group 9. Approval and resourcing of the Women’s Virtual Resource Centre 10. Enabling sick leave provisions.
Key gender equity issues at Massey University
The committee identified 10 areas in which Massey University could do better, and which are contributing to the gender pay gap and overall under-representation of women in more senior positions. The report outlines the facts, possible reasons and organisational factors that may be contributing to each.
Part A – Introduction
15
1. An overall gender pay gap
The gender pay gap, used nationally and internationally, is the difference between the average earnings of men and women. The New Zealand gender pay gap varies slightly but is around 12.5%. The gap in the ITP sector ranged from 6% to 32%, and similarly in the public sector. The overall gender pay gap based on the average base salary of all men and the average base salary of all women at Massey University is 21%. A partial explanation for the size of the gender pay gap at Massey University relates to the nature of the workforce, where there are a larger proportion of men in academic, higher paid positions and a larger proportion of women in general staff, lower paid positions. When comparing similar types of work, the pay gap is smaller. The jobs women do, and how these jobs are organised and valued, were identified as contributing to the pay gap. The expectation is that the result of addressing the full ‘set’ of ten gender equity issues will be a reduction in the gender pay gap at Massey University. The actions5 proposed to address the overall gender pay gap include a set of actions as set out in this report and in addition include:
Continuing to monitor the gender pay gap
Maintaining an HR and payroll database that is able to measure gender indices over time.
2. Gender pay gaps for specific groups of staff
The committee looked at specific groups of staff and found a significant pay gap among professors and science technicians. In addition to these specific groups, the committee found that, among general staff, women tend to be in higher grades in smaller proportions than men, and tend to be there on less pay. On average, male professors earned $136,800 and female professors earned $129,100, a difference of 6%. The gap occurs in all Colleges, although it is greater in some than others, ranging from 2% to 14%. Relevant factors include length of service/recency of appointment; starting salaries; discipline; market loadings for recruitment and retention; and rate of progress via salary reviews. Women science technicians as a group received $46,700 compared with males at $51,500, a difference of 9%. Factors seen as contributing to this include that female science technicians are over-represented in the lower grades and those in the higher grades are paid on average less than men. Starting salaries and accelerated progression were identified for further investigation. The actions proposed to address the gender pay gaps for specific groups of staff include:
Fix current gender inequity for female professors
Prevent future gender inequity for female professors
5 The executive summary identifies only the main actions proposed. The Action Plan section of the Report (Part C) contains all the detailed recommended actions and responsibilities.
16
Monitor professorial appointments and promotions by gender
Fix current gender inequity for science technicians
Prevent future gender inequity for science technicians
Monitor science technician appointments and progression
Maintain oversight of differences in average gender salary within occupations.
3. Occupational segregation – general staff women concentrated in female-dominated work
Occupational segregation (the significant concentration and domination of one gender in an occupation) is one of the reasons for the gender pay gap nationally. At Massey University the general staff workforce is highly sex-segregated, with nearly two-thirds of general staff women working in female-dominated work. Female-dominated jobs tend to pay less than male-dominated jobs or mixed gender jobs. At the university, most jobs that are over-represented by women are located in middle or lower grades. Of the female-dominated jobs, over 60% of the categories pay less than the average Massey University general-staff wage of $55,120; of the male-dominated jobs, over 60% of the categories pay more than the average Massey University general-staff wage of $55,120. In mixed-gender jobs that span more than one grade, females are on average located in lower grades than males. Undervaluing of jobs that are traditionally women’s work, and organisational rules, practice and behaviour are factors considered to be contributing to this. The actions proposed to address the issue of occupational segregation and the concentration of general staff women in female-dominated work include:
Ensure ‘women’s work’ is fairly sized and fairly paid
Eliminate gender stereotyping and gender bias in recruitment and selection practices
Address gendered workplace practices
Support women to move into different work/out of female-dominated work if they desire
Make part-time work legitimately available in a wide range of Massey University positions.
4. Women are under-represented in senior positions
Relative to men and women’s overall representation at Massey University, women are under-represented in senior positions, both academic and general. Women are over-represented in lower-paid, lower status academic and general positions. At the time of the data collection, women represented 33% of the Senior Leadership Team. The committee noted with satisfaction that staffing changes mean that in early 2011 this representation will increase to 50%.
Part A – Introduction
17
Women comprise 34% of Level 3 managers overall and 23% (7 women compared with 23 men) of heads of academic departments. As Level 3 could be considered a ‘feeder group’ for the senior leadership team, the committee considered this an important area to address. The possible factors relevant to senior management may include barriers within the management culture; consultants not putting women forward; an absence of deliberate preparation of women for senior roles; women not applying or not accessing appropriate training and development; and the position not accommodating family responsibilities. Although women are 54% of lecturers, they are 37% of senior lecturers, 32% of associate professors, and 14% of professors. Nearly half (46%) of all female academics are lecturers, while just a quarter (26%) of male academics are lecturers. Eighty-one per cent of general staff are located in Grades A to I (Grade I being the highest Grade) but just 13% of general staff women are located in the top three general staff grades; 30% of all general staff men are in these same grades. The progress of women through their academic career could be influenced by appointment issues; development (including mentoring and support); the promotions process; and over-representation of men in more senior and management positions, and the possible implications this may have for workplace culture. Factors related to general staff were seen as lack of career development and availability of part-time work, over-representation of men in higher graded job, job-sizing issues possibly undervaluing work in which women are over-represented, and appointment processes. Actions to address the under-representation of women in senior positions include:
Prepare and encourage women to apply for senior roles at Tier 2 and Tier 3
Create a women-friendly environment for Tier 3 and SLT positions
Monitor membership of SLT
Provide avenues to make senior women visible (role modelling)
Encourage and support women to prepare for senior positions
Review academic promotions criteria for gender equity
Check senior positions that are traditionally ‘women’s work’ are fairly sized and
fairly paid
Investigate reasons why few women are in jobs graded G, H and I.
5. Women’s starting salaries are lower than men’s in some occupations
Data available on average starting salaries for men and women for the last two years show a tendency for female appointees to be paid less for the same jobs. In seventeen categories of occupations considered by the committee, starting-salary pay differences of 5% to 16% favoured men in 8 occupations and pay differences of 9% favoured women in 2 occupations. The committee determined that gender inequity might be occurring at both the organisational level and the individual manager level. In particular, there is a need to moderate how the grade for the position is set; the autonomy of individual managers; appointment decisions; any tendency

18
to pay the lowest salary rather than paying fairly; and starting rates paid for the same jobs. Individual practices considered to be of concern include judgements behind initial starting salary offered; the degree of flexibility of starting salaries and accompanying negotiation; and the availability of information. There was also a gender pay gap in starting salaries for tutors of 13% or $6,500. Of the 32 tutors employed in the last two years, 9 were men and 23 were women. Men were paid on average $57,000, and women on average $50,300, a difference of 13%. A difference was evident across all campuses. While there was a difference of 5% ($3,000 on average) among senior tutors appointed in the last two years, this appeared to be a significant issue only at Albany, where there was a $10,000 difference between men and women. The committee was unable to find reasons for these gender pay gaps and, recommend that specific guidelines be developed for determining the starting salaries of tutors. Actions to address the issue of women’s starting salaries being lower than men’s in some occupations include:
Investigate ten occupations further
Moderate starting salaries
Provide training for managers
Monitor starting salaries
Eliminate gender bias from starting salaries for tutors
Capture key data.
6. Women are over-represented in tutor and senior tutor academic positions
There are 55 female tutors (72%) and 21 male tutors at Massey University, and 68 female senior tutors (55%) compared with 56 male senior tutors. These positions are “non-career” academic positions, meaning that there is no promotion or direct career path to more senior academic roles. In addition, 28% of all senior tutors and 53% of all tutors are on fixed-term contracts, meaning many face a double disadvantage. While the committee found the issue of women’s over-representation in tutor and senior tutor positions to be a complex and problematic area, with a considerable amount of contested information and perceptions about the role, it is a key area to be addressed. Managerial assumptions about ‘what women want in employment’ and the lack of opportunities to move into career academic positions are significant issues. Actions to address the over-representation of women in tutor and senior tutor academic positions include:
Clarify the tutor and senior tutor role
Establish a joint Massey University/TEU tutor working group
Provide training for managers in appropriate hiring of tutors and senior tutors.

Part A – Introduction
19
7. Academic women are over-represented on fixed-term agreements
Academic women are over-represented on fixed-term agreements that limit access to the range of benefits enjoyed by permanent staff such as staff development with payment of course fees, research leave and promotion opportunities, and in some instances maternity benefits and superannuation. Women comprised 57% of academic staff on fixed-term agreements (compared with 45% of all academic staff) and nearly a quarter of all female academics (24% or 150) are employed on fixed-term agreements compared with 15% (112) of men. While there are few people on fixed-term agreements at the more senior academic levels, at the lower levels women outnumber men in raw numbers for every academic position. As it is not immediately clear whether there is any gender bias in the use of fixed-term agreements at Massey University, the committee recommend further investigation into the use of fixed-term agreements and the over-representation of academic women, including whether there are organisational factors that channel women into fixed-term agreements. Actions to address the over-representation of women on fixed-term agreements include:
Review the use of academic fixed-term agreements for gender bias
Understand the factors contributing to large numbers of women being appointed on fixed-term agreements
Provide training for managers
Continue to monitor the use of fixed-term agreements.
8. Part-time work options do not meet the needs of the range of women workers
Women are over-represented in part-time work relative to their overall representation in the Massey University workforce. They comprise 56% of the University’s workforce and 68% of those who work part-time. Women are 45% of academic staff and 59% of part-time academic staff, and although 64% of general staff, women are 73% of general staff who work part-time. The fact that women still undertake the primary family caring roles (in most cases) makes part-time work of particular importance to women. The committee looked at how readily available part-time work was across all occupations. Among academic positions, most part-time work is concentrated at tutor, senior tutor, lecturer and senior lecturer level. It was not clear how readily available part-time work might be in other positions and how possible it might be to build one’s career while working part-time. Part-time work for general staff is concentrated in a few main groupings, for example, library assistants, and data for part-time positions across general staff grades suggest it may be more difficult to work part-time the more senior the role. The analysis raised the question of whether part-time work is offered more to suit operational requirements than to meet the needs or potential needs of staff. Low numbers of staff, both men (24%) and women (17%) considered it would be possible to hold a management position and work part-time.

20
Of those working part-time, 78% of women and 66% of men said they were happy working part-time, which suggests this is a choice for the majority, but there was no specific question in the PaEE review survey that gauged ‘satisfaction’ with the nature of their part-time work. Just 20% of women and 17% of men agreed that the opportunities were the same as for fulltime staff. The issues raised by part-time workers included less likelihood of having a performance appraisal and having professional development plans implemented. Actions to address the issue that part-time work options do not meet the needs of the range of women workers include:
Implement steps to facilitate part-time work
Increase the number and range of part-time positions available through the recruitment process
Provide assistance to support implementation of part-time work options
Ensure that part-time staff receive PRPs.
9. Women do not progress through the academic promotions process as quickly as men
Data from the promotions round show that women tend to be promoted in proportions lower than their representation in the group from which they are applying. That women do not apply, relative to their representation in the eligible pool, seems a particular feature. Men tend to put themselves forward more often and women perceive the promotions process to be less fair towards women, a view expressed strongly in survey responses. Taking time out of the workforce was disadvantageous for women in terms of progression. The committee noted a consistent improvement over the last three years in promotions for women from lecturer to senior lecturer and a spike in women’s promotions to professor for women in 2008 and 2009, although this was not maintained in 2010. Actions to address the issue that women do not progress through the academic promotions process as quickly as men include:
Encourage and support women to apply for promotion
Review promotions criteria for gender equity
Review the role of managers in promotions
Monitor and report promotion statistics by gender
Ensure gender equity is a focus of promotions process.
10. There is bullying, harassment, discrimination and other inappropriate behaviour, and there is dissatisfaction about how these are addressed
Given the university’s standard of zero tolerance for bullying, harassment, discrimination and other inappropriate behaviour, a concerning number of both women and men reported experiencing such unacceptable behaviour. Of those who had experienced bullying, approximately two-thirds were women.
Part A – Introduction
21
There is dissatisfaction with the experience of the complaints process. Of the men and women who took complaints of discrimination, fewer than 20% were satisfied; 50% of men and women were satisfied in relation to complaints of other inappropriate behaviour. Nearly 600 staff, including half of those who had been at Massey University less than three years, said they were unaware of the processes. One-fifth of all respondents, 20% of women and 18% of men, said they were not confident that the university would address and resolve any concerns or complaints of bullying, harassment, discrimination and other inappropriate behaviour. There were 1923 comments in response to the open ended question of ‘why’ staff were not confident, and the most frequently mentioned aspects were: failure by management to address such behaviour; lack of confidence/trust in management to address such behaviour; making a complaint is worse for the complainant; problems with the process/procedures; HR supports management not staff; a culture of tolerance that supports bullying, harassment, discrimination and other inappropriate behaviour; some staff are protected/there is a culture of supporting the perpetrator. Actions to address the level of bullying, harassment, discrimination and other inappropriate behaviour and dissatisfaction about how these are addressed include:
Set the standard
Better understand the issues
Review the complaints system
Review harassment contact network
Facilitate support for staff who may have been bullied or harassed
Monitor and review.
Other issues
As well as the key gender issues above, the report also notes issues that arose that were not specifically gender related but were of concern to the organisation, for example, career development and progression for general staff; gender issues that could not be fully substantiated, for example, gender pay differences for particular groups of staff; and some matters not pursued.
The Action Plan – a strategy for progress towards gender equity at Massey University
In addition to the summary actions included above, the Action Plan section of the Report sets out detailed actions to address each of the ten key gender equity issues that have been identified. Where appropriate, the review committee has identified who should be responsible for undertaking the actions. To support the implementation and monitoring of the action plan, the committee recommends the following:

22
Allocation of a portfolio of Equity to an SLT member.
Allocation of resources to the Equity portfolio.
Establishment of a position – Manager, Gender Equity.
Establishment of a PaEE Implementation Group.
Allocation of explicit responsibilities for the Gender Equity Advisory Group (GEAG), Tertiary Education Union (TEU), People and Organisational Development (POD) and Office of Strategy Management (OSM).
Establishment of appropriate KPIs for managers, to support a focus on key priorities in the PaEE Action Plan.
Priorities for commencing the implementation of the Action Plan
The review committee considered what should be the priorities for implementing the Action Plan for the next three years and proposed the following: 2011 Gender pay gap for specific groups of staff (Issue 2) Women’s starting salaries (Issue 5) Addressing bullying, harassment, discrimination and other inappropriate behaviour (Issue 10) Women’s over-representation as tutors, senior tutors (Issue 6) Women not progressing through academic promotion process as quickly as men (Issue 9) 2012 Occupational segregation by gender (Issue 3) Women’s under-representation in senior positions (Issue 4) 2013 Academic women’s over-representation on fixed term agreements (Issue 7) Part-time work options to better meet the needs of women (Issue 8)
Part A – Introduction
23
Part A – Introduction
This review report is the culmination of the pay and employment equity (PaEE) review conducted at Massey University, in partnership with the tertiary education sector unions, between November 2009 and December 2010. It provides information on the status of gender equity in relation to pay and employment at Massey University.6 The report is a snapshot of gender equity at a point in time. The review aimed to understand if and how gender affects pay and the employment experiences of staff at Massey University (specifically if and how gender contributes to lower pay for women, and lower levels of representation in some types of work and in more senior positions) and to find ways to remove barriers and achieve better outcomes for all staff. The review is an integral part of a range of initiatives signalled in the University's Road to 2020 strategy in relation to women and leadership and equal employment opportunity. The review has:
considered the work experiences of men and women according to three key equity factors (rewards, participation, and respect and fairness)
identified what is working well
identified what needs to be improved and how this will be achieved. Before the review little gender equity data were publicly available at Massey University. This report provides the first real baseline gender data against which future changes can be measured. Massey University now has an evidence base from which it can draw conclusions about the experiences and opportunities for women in their workforce. The report provides management and staff at Massey University with baseline data and an action framework to inform their equity programme. The report is in four parts. Part A provides the background information about the review process, as well as information about how this report has been developed. Part B presents the findings and conclusions of the review, both what Massey University is doing well, and the gender equity issues that have been found at the University and supporting evidence for these. This part also reports on issues of concern to all staff, covers possible gender equity issues initially considered but not substantiated, and notes other matters that the committee did not investigate further. Part C highlights those gender equity issues from Part B that appear to be most important across the University, and proposes an action plan to address those issues. Part D contains the appendices.
6 Other aspects of equity were beyond the scope of this review. However, data on ethnicity was captured as part of the PaEE review survey, and survey data could be made available to bona fide researchers following application to Massey’s Human Ethics committee.
24
Background
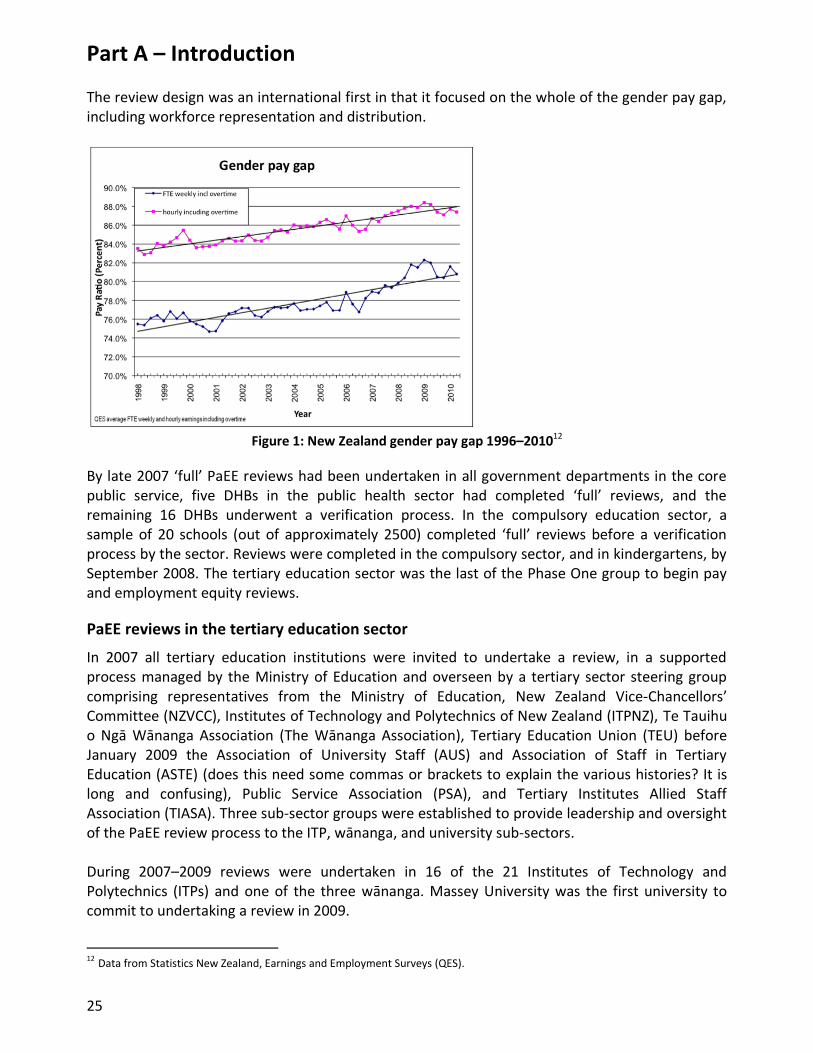
The undervaluing of women relative to men is not a new phenomenon. Since the 1950s, the international community has taken action to redress gender inequities in pay and employment conditions due to the differential valuing of men’s and women’s work.7 In New Zealand attempts at redress have been included in the Equal Pay Act 1972, Human Rights Act 1993 (HRA), and Employment Relations Act 2000 (ERA), all of which contain provisions relating to sex discrimination and provide complaints-based mechanisms for employees to seek redress for sex discrimination in employment. The Equal Pay Act applies to both private sector employees, and public sector employees. Education sector employees are also covered by the State Sector Act 1988 and the Education Act 1989.8 Despite these initiatives, the Government noted in 2004 that while women were in the workforce in record numbers, and achieving at the highest level, not much had changed in reducing the pay gap between men and women. In 2004 women’s average hourly earnings were 86.4% of men’s, and the gap had reduced by just 8.4% since 1978.9 (Table One shows the gender pay gap in average hourly earnings and average weekly earnings from 1996 to 2010. In 2010 women’s average hourly earnings were 87.5% of men’s.)
Background to PaEE reviews in New Zealand
The 2004 Pay and Employment Taskforce Report noted a ‘persistent and troubling gender pay gap’ and ‘employment equity issues that should not be part of a modern competitive economy’.10 Following the Report, the Government committed to a five-year Pay and Employment Equity Plan of Action, with a goal of ensuring that remuneration, job choice and job opportunities are not affected by gender. Phase one of the Plan of Action included PaEE reviews being undertaken and response plans developed in all organisations in the core public service and in the public health and education sectors. Massey University’s PaEE review was part of this Phase One activity. Pay and employment equity reviews were designed as a tripartite11 process to systematically investigate whether men and women have equitable outcomes and experiences in the employment arena, assessed against three equity indicators:
Women and men have an equitable share of rewards
Women and men participate equitably in all areas of the organisation
Women and men are treated with respect and fairness.
7 See, for example, ILO Equal Remuneration Convention, 1951 (No. 100), and ILO Discrimination (Employment and Occupation)
Convention, 1958 (No. 111), which were both ratified by New Zealand in 1983, and the United Nations Convention on the Elimination of All Forms of Discrimination against Women (CEDAW), ratified in 1985. 8 For further information, see the Massey Universities Equal Employment Opportunities Policy, November 2009.
9 Department of Labour (2005) – Working towards Pay and Employment Equity for Women, Minister’s Foreword, p. 7.
10 Department of Labour (2004). Report of the Taskforce on Pay and Employment Equity in the Public Service, and the Public Health
and Public Education Sectors, p. 1. 11
A partnership of employees, employers and relevant unions.
Part A – Introduction
25
The review design was an international first in that it focused on the whole of the gender pay gap, including workforce representation and distribution.
Figure 1: New Zealand gender pay gap 1996–201012
By late 2007 ‘full’ PaEE reviews had been undertaken in all government departments in the core public service, five DHBs in the public health sector had completed ‘full’ reviews, and the remaining 16 DHBs underwent a verification process. In the compulsory education sector, a sample of 20 schools (out of approximately 2500) completed ‘full’ reviews before a verification process by the sector. Reviews were completed in the compulsory sector, and in kindergartens, by September 2008. The tertiary education sector was the last of the Phase One group to begin pay and employment equity reviews.
PaEE reviews in the tertiary education sector
In 2007 all tertiary education institutions were invited to undertake a review, in a supported process managed by the Ministry of Education and overseen by a tertiary sector steering group comprising representatives from the Ministry of Education, New Zealand Vice-Chancellors’ Committee (NZVCC), Institutes of Technology and Polytechnics of New Zealand (ITPNZ), Te Tauihu o Ngā Wānanga Association (The Wānanga Association), Tertiary Education Union (TEU) before January 2009 the Association of University Staff (AUS) and Association of Staff in Tertiary Education (ASTE) (does this need some commas or brackets to explain the various histories? It is long and confusing), Public Service Association (PSA), and Tertiary Institutes Allied Staff Association (TIASA). Three sub-sector groups were established to provide leadership and oversight of the PaEE review process to the ITP, wānanga, and university sub-sectors. During 2007–2009 reviews were undertaken in 16 of the 21 Institutes of Technology and Polytechnics (ITPs) and one of the three wānanga. Massey University was the first university to commit to undertaking a review in 2009.
12 Data from Statistics New Zealand, Earnings and Employment Surveys (QES).

26
Findings from the ITP sector have informed the Massey University review, and also represent the closest point of comparison for the university sector. Summary information about the findings across the ITP sector13 is provided in Table 1. The table provides baseline data from the participating ITPs in relation to pay and the representation and distribution of women.
Table 1: Baseline numerical data for thirteen participating ITPs 14
Pay There is an overall gender pay gap of 6 to 32% The gender pay gap amongst senior management ranges from +7 to 23% The gender pay gap for academic staff ranges from +2 to 7% The gender pay gap for allied staff ranges from 0 to 23%.
Representation of women Overall representation of women ranges from 44 to 75% Representation of women in senior management ranges from 22 to 67%. (Nine ITPs range from 22 to 50%) Representation of women in academic roles ranges from 20 to 71%. (Nine ITPs range from 45 to 71%) Representation of women in allied roles ranges from 67 to 82% The % of women part-time staff ranges from 56 to 87%.
Distribution of women Two of the thirteen chief executives are women Representation of women in tier 2 ranges from 22 to 67% Representation of women in tier 3 ranges from 38 to 65%.
The key gender equity issues for the ITP sector as a whole were: Rewards
Gender differences in starting salaries
Gender pay gap in allied/general roles
Specific pay and employment practices that impact on how women’s work is valued and rewarded
Participation
Women over-represented in administrative and clerical roles
Part-time positions attract less favourable terms, conditions and opportunities
13 While individual institutions developed PaEE action plans to address the gender equity issues they had identified, the information reported by the ITPs was also synthesised to identify seven key gender equity issues for the ITP sub-sector as a whole. 14 Ministry of Education (2009). Pay and Employment Equity Reviews in the Public Tertiary Education Sector: Report on Reviews and Action Plan for the ITP sub-sector, p. 24.

Part A – Introduction
27
Respect and fairness
Lack of confidence that harassment, bullying, and other inappropriate behaviour will be dealt with by the organisation
Women can be disadvantaged by the way HR policies are implemented. The ITP sector PaEE Action Plan contained 7 main actions to address the issues considered to be the most critical to effect real change. A summary of the ITP Sub-Sector Findings and Action Plan is available on the Massey University website as a supplementary paper.
The PaEE review at Massey University
The decision to undertake a PaEE review was an integral part of a wider range of Massey University initiatives in relation to women and leadership and equal employment opportunity signalled in the University's Road to 2020 strategy. The review, undertaken in partnership with the tertiary education sector unions, aimed to determine the extent to which gender affects women's pay and employment experiences, and to find ways to remove barriers and achieve better outcomes for all staff. In announcing the review in late 2009 Alan Davis, AVC People and Organisational Development, noted that while 56% of the University’s staff were women and nearly half of academic staff were women, only 17% of professors and 33% of associate professors were women. “We are seeing some pleasing trends in the success rate of women in academic promotions rounds, but if we are to achieve our goals of excellence in everything we do we need to accelerate this, and we need to establish a reputation as an enabling workplace free of practices that might hold talented people back." Suzanne McNabb from the Tertiary Education Union (TEU) noted that Massey University was the first New Zealand university to undertake a comprehensive review of pay and employment issues for women and that “TEU is proud to be working in co-operation with management to conduct this review. Women workers care about pay and employment equity in the workplace – they want to be sure that they have the same opportunities to develop their skills, be promoted and participate at senior levels of the organisation. Above all women want equitable pay. They want the work they do fairly recognised, valued and paid accordingly". The extensive activity across the wider government sector in completing PaEE reviews meant that Massey University was able to draw on existing tools, resources, and experience. The Ministry of Education set up a university sector PaEE working group15 in mid-2009 to support the adaptation of key tools and documentation for use by any university that chose to undertake a review. Massey University was also able to access funding from the PaEE Contestable Fund (via the Ministry of Education), given its decision to undertake a review before the Government’s closure of the PaEE programme of action.
15
Members of the group were: Alan Davis (Massey University), Aaron Mills (Victoria University), Prue Toft (University of Auckland) Suzanne McNabb (Tertiary Education Union), Melinda Derbidge (PSA), and Rae Torrie (then Project manager for PaEE Reviews across the Tertiary Sector, contracted by the Ministry of Education).
28
Key facts about Massey University
Massey University’s purpose is to consolidate its position as New Zealand’s defining university and as a world leader of tertiary learning. The three campuses offer a wide range of academic programmes for both internal and distance students. The Albany campus has a focus on innovation, the Manawatu campus focuses on agri-food, and the Wellington campus on creativity. The University’s ability to make a distinct contribution to the local, national and global communities is enhanced by a range of commitments set out in The Road to 2020 strategy. Throughout the statements about leading research, exceptional teaching, sustainability, revenue generation, and providing the best possible environment for staff and students, an area has emerged as characteristic of Massey University: engagement. The six big goals for the University are:
Research and Scholarship
Teaching and Learning
Connections
Responsibility
Generating Income
Enabling Excellence The PaEE review contributes, in particular, to the goals of Responsibility and Enabling Excellence.
Key staff data by gender
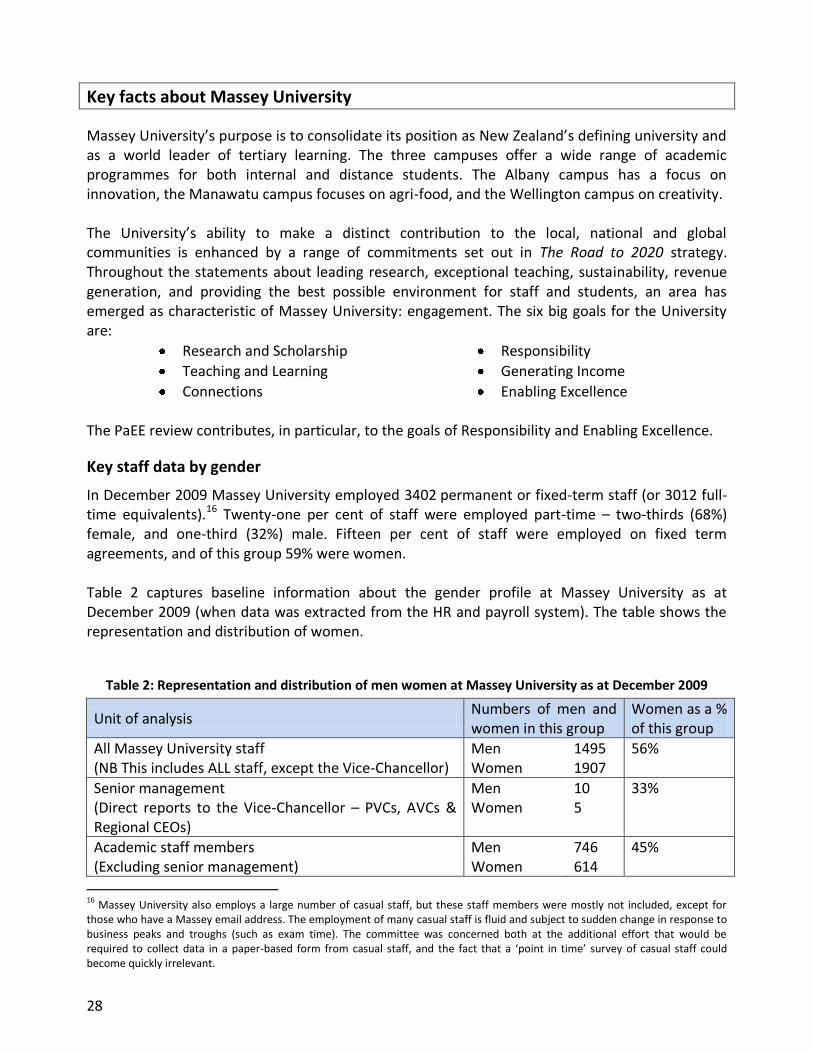
In December 2009 Massey University employed 3402 permanent or fixed-term staff (or 3012 full-time equivalents).16 Twenty-one per cent of staff were employed part-time – two-thirds (68%) female, and one-third (32%) male. Fifteen per cent of staff were employed on fixed term agreements, and of this group 59% were women. Table 2 captures baseline information about the gender profile at Massey University as at December 2009 (when data was extracted from the HR and payroll system). The table shows the representation and distribution of women.
Table 2: Representation and distribution of men women at Massey University as at December 2009
Unit of analysis Numbers of men and women in this group
Women as a % of this group
All Massey University staff (NB This includes ALL staff, except the Vice-Chancellor)
Men Women
1495 1907
56%
Senior management (Direct reports to the Vice-Chancellor – PVCs, AVCs & Regional CEOs)
Men Women
10 5
33%
Academic staff members (Excluding senior management)
Men Women
746 614
45%
16
Massey University also employs a large number of casual staff, but these staff members were mostly not included, except for those who have a Massey email address. The employment of many casual staff is fluid and subject to sudden change in response to business peaks and troughs (such as exam time). The committee was concerned both at the additional effort that would be required to collect data in a paper-based form from casual staff, and the fact that a ‘point in time’ survey of casual staff could become quickly irrelevant.

Part A – Introduction
29
Unit of analysis Numbers of men and women in this group
Women as a % of this group
General staff (Excluding senior management)
Men Women
739 1288
64%
Academic full-time staff Men Women
635 465
42%
General full-time staff Men Women
628 956
60%
Academic part-time staff Men Women
111 161
59%
General part-time staff Men Women
121 325
73%
Managing the PaEE review process at Massey University
The review was conducted between November 2009 and November 2010. The project was sponsored by Alan Davis, AVC People and Organisational Development, in partnership with the TEU, represented by Suzanne McNabb. A PaEE review steering committee was established at the outset to clarify the methodology for the review, work on developing the survey, and to manage the selection of committee members. The steering committee comprised Alan Davis, Suzanne McNabb, Professor Sylvia Rumball, and Rae Torrie.
The review people and infrastructure
In November 2009 the steering group invited expressions of interest from any staff member interested in participating in the PaEE review committee. The role of the committee was to investigate whether any differences in the pay and employment experiences of men and women at Massey University were explainable and justifiable. Specifically, the committee was responsible for making meaning of information by reviewing and interrogating information to understand the gender ‘picture’. Specific decision-making tasks for the committee were to:
identify significant gender differences and concerns
determine whether differences were explainable and justifiable
decide the key gender equity issues for Massey University
prioritise the key gender equity issues
agree an action plan to address gender inequities
agree the review report and action plan to present to the Senior Leadership Team. A PaEE review committee of 15 members was selected, including staff and union representation. The committee was chaired by Emeritus Professor Sylvia Rumball, and supported by the project manager and a minute taker. Committee members attended a half-day training session in December 2009, met for ten full-day meetings between February 2010 and January 2011, and sometimes undertook additional committee work between meetings. Members of the committee are listed in Appendix One.

30
The PaEE review was managed by an independent external contractor, Rae Torrie (who had overseen PaEE reviews in 15 ITPs and one Wānanga before taking up this role). Rae was responsible for managing the project, training the committee, for the collection of data, and for analysing and summarising the available data by gender in a series of papers for consideration by the committee at meetings. Rae also undertook much of the gender analysis and interpretation of findings herself, and drafted the review report and action plan. She was assisted by Lesley Drury and other HR and communications staff at Massey University, by Professor Philip Gendall (who assisted with advice and support in relation to the online survey), as well as by Lynn McDougall, an expert in data analysis who managed the technical side of analysing of the payroll and HR data, and the survey. The infrastructure for the PaEE review project is illustrated in diagrammatic form in Figure 2.
Figure 2: Infrastructure for the PaEE review at Massey University
The dates and focus for each of the PaEE review committee meetings are outlined in Table 3.
Table 3: PaEE review committee meeting dates and focus of the meetings
Meeting number & date Focus of meeting
Meeting 1 25 February 2010
Guidelines for how the committee works together Initial look at the HR & payroll data, PEEAT data Consideration of other relevant institutional information
Meeting 2 23 March 2010
Analysing and summarising the key areas of gender difference based on information provided in PEEAT Information received to date on survey Update on relevant institutional information
Meeting 3 28 April 2010
Additional PEEAT data A quantitative analysis of the information from the PaEE review survey A preliminary list of the main areas of gender difference suggested by the data
Meeting 4 2 June 2010
Determining factors that could be contributing to different gender outcomes Consideration of whether differences were explainable and

Part A – Introduction
31
Meeting number & date Focus of meeting
justifiable
Meeting 5 13 July 2010
Continuing to address whether areas of gender difference were explainable and justifiable. Agreeing on draft list of key gender equity issues for Massey University to take forward and address in an action plan
Meeting 6 15 September 2010
Finalising the gender equity issues Developing the action plan for Massey University
Meeting 7 4 November 2010
Planning deliverables Reviewing the draft action plan
Meeting 8 15 November 2010
Reviewing the draft action plan contd Peer review the draft review report
Meeting 9 13 December 2010
Review of revised draft of report Further review of action plan
Meeting 10 13 January 2011
Final review of draft review report Finalisation of action plan.
Following each meeting a communication was developed for all staff, advising what the committee was doing and, where possible, advising what had been found and initiatives that were being undertaken. All communications were circulated initially in the newsletter People@Massey and then available on the University’s website at the (public) PaEE review web address: http://www/massey.ac.nz/massey/staffroom/national-shared-services/people-organisational-development/pay-and-employment-equity-review/en/pay-and-employment-equity-review-home.cfm
Methodology
The methodology for the review draws on the gender analysis process developed initially by the Department of Labour for reviews conducted in the wider public sector, and then modified for the university sector. The key PaEE review resource was the Pay and employment equity review workbook for the university sector (the Workbook). As well as guidance on each of the steps, the workbook includes additional information to assist the committee in the task of gender analysis. The Workbook, and the entire PaEE review, was organised around the three equity indicators: Women and men have an equitable share of rewards Women and men participate equitably in all areas of the organisation Women and men are treated with respect and fairness. Each of the three equity indicators was supported by four key questions. These key questions provided alerts to the main areas of inquiry within each equity indicator.

32
Figure 3: The three gender equity indicators and key questions
The key research questions being asked by the review are:
What are the gender differences at Massey University? Where do men and women have different experiences in pay, representation and distribution, participation, respect and fairness?
Why are there gender differences? What factors are contributing to the existence of these gender differences?
Are the differences OK? Are the reasons for the differences fair, reasonable and valid?
What must be done to address gender inequities? What are the actions that Massey University can take, that are within its control, that will address these issues/inequities or identifies further investigation?
How will agreed actions be managed and monitored? The process of inquiry and investigation undertaken by the committee, and as outlined in the Workbook, has five steps:
Gather and organise data
Analyse data and identify key issues for the institution
Report back to staff
Develop and review report
Develop an action plan.
Rewards
•Are pay rates affected by gender?
•Do women and men have an equitable share of rewards other than base pay?
•Do women and men advance at same or similar rates to higher levels and pay?
•Are women and men appropriately represented at senior levels?
Participation
•Do women and men have equitable access to key training and development opportnities that will enable them to advance their careers?
•Are women and men appropriately represented across all occupations and work areas?
•Do women and men actively contribute influence and advice to all important areas in the institution?
•Is there support for work-life balance for women and men at all levels?
Respect and fairness
•Do women and men have equal confidence the institution:
• is taking active steps to minimise the risk of discrimination, all forms of harassment and other inappropriate behaviours, e.g., bullying
•will respond appropriately if it occurs?
•Is the performance management system fair for both women and men?
•Do women and men have equal confidence in the fairness of key HR policies and systems?
•Do women and men have equal confidence they are treated fairly and equitably by their managers?

Part A – Introduction
33
Figure 4: The PaEE review five-step process
STEP ONE – GATHER & ORGANISE DATA
Run staff survey
Run PEEAT to develop staff profile by gender
Use other relevant institutional information
Complete Gender Profile and ready information for committee
STEP TWO – ANALYSE DATA & IDENTIFY KEY ISSUES
Identify significant differences in:
pay representation & distribution areas of concern
Explore whether differences/concerns are explainable and justifiable
Gain more precise understanding of the differences/ concerns
Identify key issues
Explainable and justifiable
Explainable but not justifiable
Not explainable
Explainable
No further action
STEP FOUR – REPORT BACK TO STAFF
Report findings to staff
Gather ideas for addressing issues
STEP FIVE – DEVELOP ACTION PLAN
Identify desired
outcomes Identify actions to achieve
outcomes Add action plan and monitoring process into review report
Send report to senior management & sub-sector group
STEP THREE – DEVELOP REVIEW REPORT
Develop draft report
Summarise key issues clearly

34
Data sources
Step One of the PaEE review was data gathering. Two main types of data informed the review process: information from the payroll and human resource information system, and data gathered from staff via an online PaEE review survey. Alongside these primary data sources, the committee also considered a brief review of existing and available information and literature in a paper entitled Relevant institutional information.
Relevant institutional information
This paper covered relevant gender equity information that already existed, either internally or externally. The internal data specific to Massey University (such as promotions data and exit interview data) contributed directly to the findings of the review. The external data provided a context for the University’s findings, and tended to relate to the New Zealand tertiary sector as a whole, (for example, the collation of all published gender equity information available across the tertiary sector in 2008,17 and the 2009 Ministry of Education report on PaEE reviews in the ITP and Wānanga sectors18). Literature in relation to gender equity in the university sector internationally was referenced, although usually not reviewed. The paper includes data that were sought by the committee but not considered (and the reasons why). A summary of the Relevant institutional information paper is attached at Appendix Three, and a full copy is available as a supplementary paper.
HR and payroll data
One of the key tasks in the PaEE review process is to ascertain whether men and
women are being paid the same for doing the same work, or for doing work that is
different but of equal value. The ideal way of doing this is to use information from the
organisation’s job evaluation data, where all jobs have been assigned a points value
that relates to the size of the job, and have an associated salary. Where gender equity
exists, all jobs of the same or similar size would, on average, be remunerated the
same.
At Massey University there are different structures for academic staff and for general
staff. The academic positions are well-established and discrete, and for the PaEE
review, the committee used these positions as defined in the collective employment
agreement. For general staff, the committee would ideally have used job points.
However, the preferred level of detail on current job points was not available.
(The current general staff pay system operates on a grading structure that was built
following a job evaluation exercise in the 1990s. While Massey University believes the
structure is still operating coherently, there is recognition that it is time to review
whether current positions are sized appropriately and whether the relativities
established in the 1990s are still relevant, or may involve some changes in the pay
17
This document was commissioned by the Ministry of Education as part of the tertiary sector PaEE reviews. 18
Pay and Employment Equity Reviews in the Public Tertiary Education Sector: Report on Reviews and Action Plan for the ITP Sub-sector.

Part A – Introduction
35
structure. Many staff do not support the current system and actively lobbied for an
agreement to establish a new system. Implementation so far has included the
selection of a new job evaluation system (International Position Evaluation or IPE),
and the identification and sizing of benchmark positions. These results have revealed
a lack of correlation between the two systems and Massey University is currently
working with TEU to plan the next steps forward.)
In order to compare the work that men and women do, and associated remuneration,
it was necessary to be able to establish work that is the same, and work that is
different but of equal value.19
The committee used a classification of occupation tool
known as ANZSCO (Australian and New Zealand Standard Classification of
Occupations)20
as the basis for a preliminary analysis of the HR and payroll data by
gender,21
and then undertook further analysis by Massey University job titles as
required. It is important to note that comparisons using ANZSCO codings had
limitations. These limitations are primarily the grouping of jobs according to
occupational groups or types without much allowance for job grades of levels. In some
cases, different sized jobs were grouped into a single category, resulting in ANZSCO
comparing jobs of dissimilar rather than similar sizes.
The quantitative information used at Massey University was gathered using a pay and
employment equity analysis tool (PEEAT) developed by and available from, the
Department of Labour. PEEAT was designed to assist in providing a gender profile of
the organisation. The tables and charts included in PEEAT explore aspects of pay and
employment where gender equity concerns have emerged most often in other
organisations. The PEEAT charts are:
Table 4: PEEAT charts used to analyse the HR and payroll data
Chart 1 Percentage of Employees by ANZSCO Job Classification (Distribution of
employees by job classification by sex)
Chart 2 Participation by Grade (Distribution of employees by grade by sex)
Chart 3 Average Annual FTE Remuneration by ANZSCO Job Classification
(Average annual full time equivalent remuneration by job classification
and sex)
Chart 4 Average Annual FTE Remuneration by Job Grade (Average annual full
time remuneration by job grade by sex)
Chart 5 Proportion of Men and Women in Bands of Hours (Proportion of women
and men in bands of hours)
19 At times within any organisation, job titles are not consistently defined and applied and the same work can have different jobs titles, or different
work can have the same job titles. Most often within organisations, there is a mixture of some clearly defined work with titles that are consistently
applied, and other areas of poorly defined work and/or inconsistent application.
20 ANZSCO is used by Statistics New Zealand as the framework for classifying census data, so enables a useful point of national comparison should
Massey want to do this. 21 HR staff undertook a huge exercise coding all current jobs at Massey to ANZSCO, as preparation for the PaEE review.
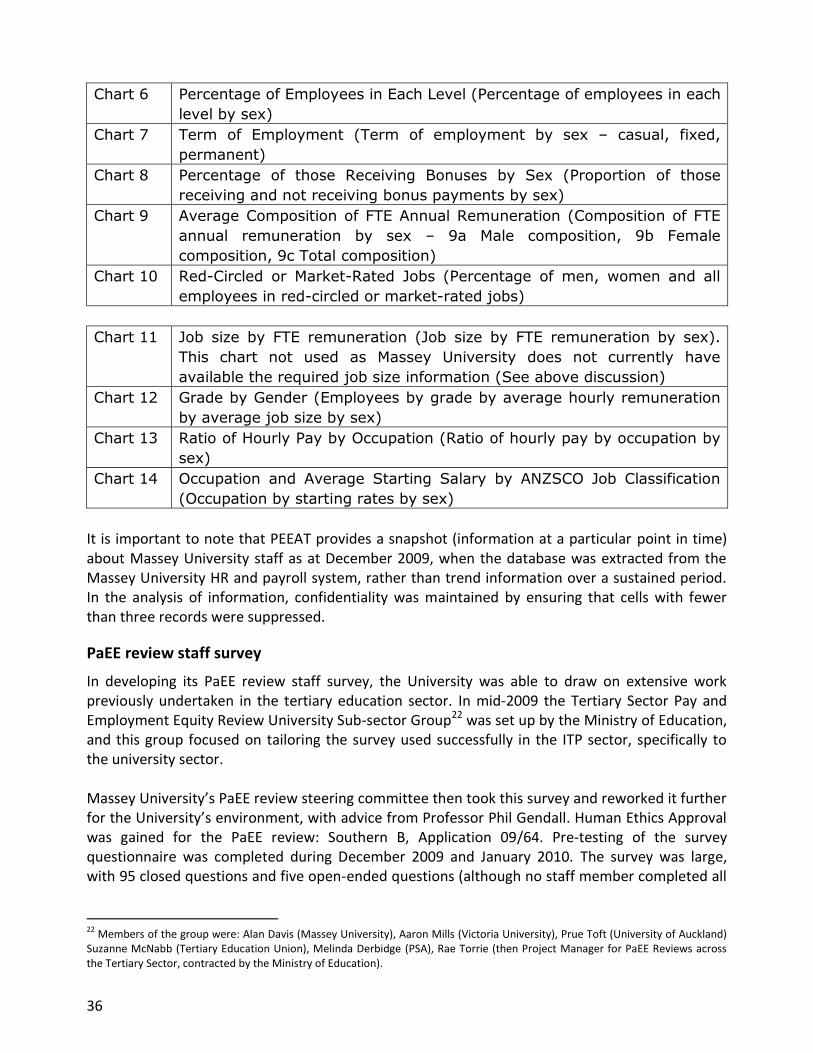
36
Chart 6 Percentage of Employees in Each Level (Percentage of employees in each
level by sex)
Chart 7 Term of Employment (Term of employment by sex – casual, fixed,
permanent)
Chart 8 Percentage of those Receiving Bonuses by Sex (Proportion of those
receiving and not receiving bonus payments by sex)
Chart 9 Average Composition of FTE Annual Remuneration (Composition of FTE
annual remuneration by sex – 9a Male composition, 9b Female
composition, 9c Total composition)
Chart 10 Red-Circled or Market-Rated Jobs (Percentage of men, women and all
employees in red-circled or market-rated jobs)
Chart 11 Job size by FTE remuneration (Job size by FTE remuneration by sex).
This chart not used as Massey University does not currently have
available the required job size information (See above discussion)
Chart 12 Grade by Gender (Employees by grade by average hourly remuneration
by average job size by sex)
Chart 13 Ratio of Hourly Pay by Occupation (Ratio of hourly pay by occupation by
sex)
Chart 14 Occupation and Average Starting Salary by ANZSCO Job Classification
(Occupation by starting rates by sex)
It is important to note that PEEAT provides a snapshot (information at a particular point in time) about Massey University staff as at December 2009, when the database was extracted from the Massey University HR and payroll system, rather than trend information over a sustained period. In the analysis of information, confidentiality was maintained by ensuring that cells with fewer than three records were suppressed.
PaEE review staff survey
In developing its PaEE review staff survey, the University was able to draw on extensive work previously undertaken in the tertiary education sector. In mid-2009 the Tertiary Sector Pay and Employment Equity Review University Sub-sector Group22 was set up by the Ministry of Education, and this group focused on tailoring the survey used successfully in the ITP sector, specifically to the university sector. Massey University’s PaEE review steering committee then took this survey and reworked it further for the University’s environment, with advice from Professor Phil Gendall. Human Ethics Approval was gained for the PaEE review: Southern B, Application 09/64. Pre-testing of the survey questionnaire was completed during December 2009 and January 2010. The survey was large, with 95 closed questions and five open-ended questions (although no staff member completed all
22
Members of the group were: Alan Davis (Massey University), Aaron Mills (Victoria University), Prue Toft (University of Auckland) Suzanne McNabb (Tertiary Education Union), Melinda Derbidge (PSA), Rae Torrie (then Project Manager for PaEE Reviews across the Tertiary Sector, contracted by the Ministry of Education).

Part A – Introduction
37
questions as there were a number that routed them to the parts of the survey relevant to them). The survey questionnaire is attached at Appendix One. An independent online research company called Buzz Channel was engaged to run the survey. In February Massey University staff were invited to participate in a voluntary, confidential on-line survey about their experiences around pay and employment equity. There were a number of staff (145) who did not have Massey University email addresses as they are not on the network, and a hard copy version of the survey was sent to these people. The survey was open for three weeks. A total of 1784 Massey University staff participated in the PaEE survey, 50% of the 3545 staff who were invited to participate in the survey (i.e. permanent staff, fixed term, staff, and those casual staff who have Massey University email addresses), and the survey respondents were broadly representative of the overall workforce at the University on most demographics. This high response rate (for a survey) and good representativeness means that the survey results have a high level of credibility. Each of the survey questions was analysed by gender. The closed-ended survey questions were analysed using measures of central tendency (means and medians), and comparing responses of men and women. Particular information highlighted and discussed by the committee included: Questions that had the greatest gender difference in the responses Issues without a big gender difference but that were of high concern to both women and men Questions in relation to bullying, harassment, discrimination and other inappropriate behaviour Questions with a high level of ‘don’t knows’. From this preliminary cut, the survey responses considered to be possible gender equity issues were then analysed by relevant demographic or employment data apart from gender. Some of the splits that were considered for different questions include academic and general staff, age, campus, college, part-time/full-time staff, permanent or fixed-term status. As noted above, there were five open-ended questions in the survey for staff comment. The focus of these five questions were: Question 31 – pay and rewards Question 64 – the academic promotions process (for academic staff only) Question 69 – progression for general staff (for general staff only) Question 92 – harassment, bullying, discrimination and other inappropriate behaviour Question 100 – final comment about
what Massey University does well
areas that should be looked into further. A separate paper has been completed for each of the five open-ended questions. Each paper has three parts. Part One contains and explains the code frame by which the responses to the question have been organised. Part Two provides a quantitative overview of the responses to the
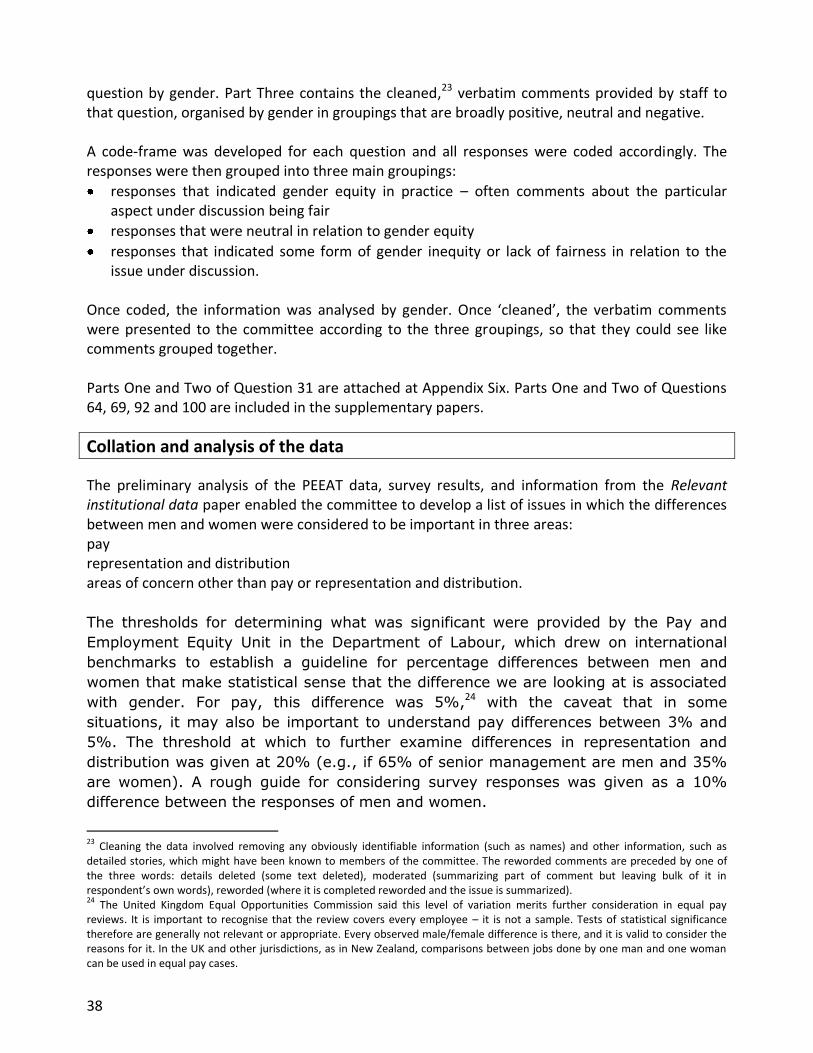
38
question by gender. Part Three contains the cleaned,23 verbatim comments provided by staff to that question, organised by gender in groupings that are broadly positive, neutral and negative. A code-frame was developed for each question and all responses were coded accordingly. The responses were then grouped into three main groupings:
responses that indicated gender equity in practice – often comments about the particular aspect under discussion being fair
responses that were neutral in relation to gender equity
responses that indicated some form of gender inequity or lack of fairness in relation to the issue under discussion.
Once coded, the information was analysed by gender. Once ‘cleaned’, the verbatim comments were presented to the committee according to the three groupings, so that they could see like comments grouped together. Parts One and Two of Question 31 are attached at Appendix Six. Parts One and Two of Questions 64, 69, 92 and 100 are included in the supplementary papers.
Collation and analysis of the data
The preliminary analysis of the PEEAT data, survey results, and information from the Relevant institutional data paper enabled the committee to develop a list of issues in which the differences between men and women were considered to be important in three areas: pay representation and distribution areas of concern other than pay or representation and distribution.
The thresholds for determining what was significant were provided by the Pay and
Employment Equity Unit in the Department of Labour, which drew on international
benchmarks to establish a guideline for percentage differences between men and
women that make statistical sense that the difference we are looking at is associated
with gender. For pay, this difference was 5%,24
with the caveat that in some
situations, it may also be important to understand pay differences between 3% and
5%. The threshold at which to further examine differences in representation and
distribution was given at 20% (e.g., if 65% of senior management are men and 35%
are women). A rough guide for considering survey responses was given as a 10%
difference between the responses of men and women.
23
Cleaning the data involved removing any obviously identifiable information (such as names) and other information, such as detailed stories, which might have been known to members of the committee. The reworded comments are preceded by one of the three words: details deleted (some text deleted), moderated (summarizing part of comment but leaving bulk of it in respondent’s own words), reworded (where it is completed reworded and the issue is summarized). 24
The United Kingdom Equal Opportunities Commission said this level of variation merits further consideration in equal pay reviews. It is important to recognise that the review covers every employee – it is not a sample. Tests of statistical significance therefore are generally not relevant or appropriate. Every observed male/female difference is there, and it is valid to consider the reasons for it. In the UK and other jurisdictions, as in New Zealand, comparisons between jobs done by one man and one woman can be used in equal pay cases.

Part A – Introduction
39
A summary list of the differences to emerge from the PEEAT analysis of the HR and payroll data is attached at Appendix Three. A summary of the key differences to emerge from the survey is attached at Appendix Five. An overview of the issues to emerge from the open-ended questions in the survey is attached at Appendix Nine. The review identified quite early that there were gender differences in the pay or employment experiences of men and women in some areas. The committee’s task was then to: better understand the scope of any differences (for example, across the University? Within just one grade or several? For all levels of promotion? Is it likely to be the result of a set of circumstances we know about, such as a restructuring?) explore the possible factors contributing to different outcomes for women and men.
40
This involved further analysis of both the HR and payroll data, and the survey data, and also the gathering of additional information, for example, about the number of academic men and women eligible to apply for promotions, or information about how the pay scales or the job evaluation system worked. The committee’s next task was to determine whether the different outcomes for men and women were explainable and justifiable. For example, men being paid more than women in a particular occupation could be (hypothetically) explainable and justifiable if this was a male-dominated area of the university which, until recently, employed no women, had a high number of skilled and experienced men in this occupation, and recently qualified women with less skills and experience. On the other hand, this could be (hypothetically) explainable but not justifiable if there are a high number of skilled and experienced men in this occupation who have been at Massey University a long time and, although women have recently joined the University and have less service, their skills and experience are equivalent to their male colleagues and there is no other justification for their being paid so much less than men. Where differences could be explained and justified the committee took no further action. These issues are discussed in Part B of this report. Where the differences could be explained but not justified, or could not be explained, the committee took these forward as gender equity issues for Massey University. Part B of this report discusses each of these issues, and Part C contains the action plan drafted by the committee to redress the gender inequities, which is being forwarded to the Senior Leadership Team for action. From the beginning of the project, consideration was given to the integration of Māori and Pasifika perspectives, and one of the committee members was asked to pay attention to this brief throughout the review. While the project focus was on three gender equity indicators, in keeping with reviews undertaken across the public service, public education and public health sectors, data were also gathered by ethnicity where possible (such as the survey) with the intention of establishing whether there were particular issues for women outside the dominant European/Pakeha group. In the analysis it was found that, because data by ethnicity could not be gathered for all areas and where such data were gathered numbers were often very small, there was not enough information to develop key areas of focus. It is expected, however, that many of the proposed actions and gains for women will also provide benefits for Māori and Pasifika staff.
Writing the report
The report is drafted from documents developed during the course of the PaEE review, Massey University’s gender equity issues as determined by the committee, and the action plan finalised over three meetings. The project manager drafted the report, which was peer reviewed by the PaEE review committee. Like the development of the action plan, this was an iterative process over the course of three PaEE review meetings.

Pay and Employment Equity Review Report and Action Plan
Part B – Findings and conclusions
Part B of the report focuses on the findings and conclusions of the review, both what Massey University is doing well, and the gender equity issues that have been found (including the supporting evidence for these conclusions). It also reports a number of ‘parallel issues’ (issues equally of concern to both men and women) that emerged during the course of the review for information and action by SLT. Part B also records the issues initially considered but not substantiated as gender equity issues and the reasons why not, and matters that remain potential gender equity issues that were not pursued by the committee, and the reasons why not. This section is structured as follows:
Massey University staff profile by gender
What the University is doing well in respect to gender equity
Massey University’s gender equity issues 1. An overall gender pay gap 2. Pay gaps for specific groups of staff: Professors, Science technicians 3. Occupational segregation – general staff women are concentrated in female-dominated work 4. Women are under-represented in senior positions and over-represented in lower positions 5. Women’s starting salaries are lower than men’s in some occupations 6. Women are over-represented in tutor and senior tutor (non-career) academic positions 7. Women are over-represented on fixed term contracts 8. Part-time work options at Massey University do not meet the needs of the range of women workers 9. Women do not progress through the academic promotions process as quickly as men 10. Bullying, harassment, discrimination and other inappropriate behaviour, and dissatisfaction about how these are addressed. Other issues.
Massey University staff profile by gender
Background to the measures used
The first step in the pay and employment equity review was to ascertain baseline information about male and female employees at Massey University. The committee began by identifying averages and medians in respect to male and female employees in relation to the representation and distribution of staff, and to pay. Both of these measures are commonly used to provide a preliminary indication, at a gross level, of whether or not women experience gender equity. Every two years the Human Rights Commission releases the New Zealand Census of Women’s Participation. This document begins with the premise that in order to be a highly skilled economy in the global marketplace, the talent pool of men and women at work must be maximised and both genders “well represented in public and political life”.25 The remainder of the report assesses New Zealand’s performance in this regard on the level
25
Human Rights Commission (2008). New Zealand Census of Women’s Participation, p. 2.
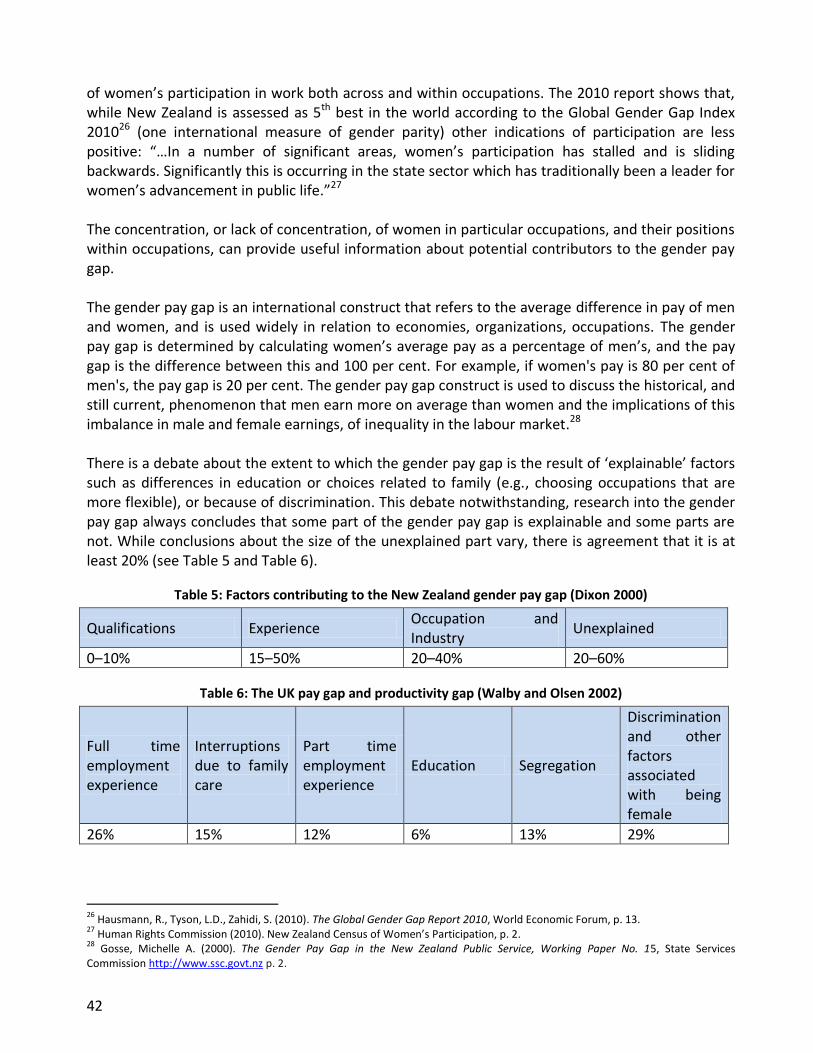
42
of women’s participation in work both across and within occupations. The 2010 report shows that, while New Zealand is assessed as 5th best in the world according to the Global Gender Gap Index 201026 (one international measure of gender parity) other indications of participation are less positive: “…In a number of significant areas, women’s participation has stalled and is sliding backwards. Significantly this is occurring in the state sector which has traditionally been a leader for women’s advancement in public life.”27 The concentration, or lack of concentration, of women in particular occupations, and their positions within occupations, can provide useful information about potential contributors to the gender pay gap. The gender pay gap is an international construct that refers to the average difference in pay of men and women, and is used widely in relation to economies, organizations, occupations. The gender pay gap is determined by calculating women’s average pay as a percentage of men’s, and the pay gap is the difference between this and 100 per cent. For example, if women's pay is 80 per cent of men's, the pay gap is 20 per cent. The gender pay gap construct is used to discuss the historical, and still current, phenomenon that men earn more on average than women and the implications of this imbalance in male and female earnings, of inequality in the labour market.28 There is a debate about the extent to which the gender pay gap is the result of ‘explainable’ factors such as differences in education or choices related to family (e.g., choosing occupations that are more flexible), or because of discrimination. This debate notwithstanding, research into the gender pay gap always concludes that some part of the gender pay gap is explainable and some parts are not. While conclusions about the size of the unexplained part vary, there is agreement that it is at least 20% (see Table 5 and Table 6).
Table 5: Factors contributing to the New Zealand gender pay gap (Dixon 2000)
Qualifications Experience Occupation and Industry
Unexplained
0–10% 15–50% 20–40% 20–60%
Table 6: The UK pay gap and productivity gap (Walby and Olsen 2002)
Full time employment experience
Interruptions due to family care
Part time employment experience
Education Segregation
Discrimination and other factors associated with being female
26% 15% 12% 6% 13% 29%
26
Hausmann, R., Tyson, L.D., Zahidi, S. (2010). The Global Gender Gap Report 2010, World Economic Forum, p. 13. 27
Human Rights Commission (2010). New Zealand Census of Women’s Participation, p. 2. 28
Gosse, Michelle A. (2000). The Gender Pay Gap in the New Zealand Public Service, Working Paper No. 15, State Services Commission http://www.ssc.govt.nz p. 2.

Part B – Findings and conclusion
43
Understanding the causes of the gender pay gap enables appropriate targeting of initiatives aimed at redress. The identification of the sources of inequality is important, as the policy responses (if any) used to address the imbalance will alter depending on the nature and degree of influence of the myriad of factors identified as influencing the gender pay gap. For example, differences in male and female earnings within the same occupation may suggest the use of anti-discrimination policies to reduce the imbalance. However, differences in the wages between similar occupations may suggest that policies around comparable worth would be more effective.29 In New Zealand there is a gender pay gap nationally of around 12.5%.30 Because of this, it would be a surprise to find a large organisation without a gender pay gap. In every tertiary institution that has so far undertaken a review31 there was a gender pay gap, ranging from 6% to 32%.
Massey University staff profile
Table Nine provides representation and distribution data in relation to men and women at Massey University. The representation data show the overall proportion of men and women at the University, as well as the proportion of men and women according to the two main types of work – academic and general. The distribution data provided are the proportion of men and women in senior positions. The table shows that women are well-represented overall at Massey University, comprising 56% of the workforce, compared with women’s labour market share of 47%.32 However, women comprise just a third of senior management33 and less than half of academic staff. Women are over-represented in general staff positions and in part-time work. In short, women are less well-represented in areas where the pay tends to be higher, and over-represented in the areas where the pay tends to be lower. The implications for gender equity are twofold: first, this is likely to have an impact on the gender pay gap; second questions why this is the case, and stresses the need to understand the organisational factors contributing to this situation.
29
Ibid, pp. 2,3. 30
Statistics New Zealand. From Earnings and Employment Survey (QES), 11 October 2010. 31
One Wānanga and 15 Polytechnics and Institutes of Technology. 32
Household Labour Force Survey December 2009, Department of Labour. 33
In December 2009 when the data for the review was uploaded, there were 10 men and 5 women in the Massey Senior Leadership Team (SLT). While changes to SLT as a result of restructuring at Massey in early 2010 reduced the overall number of members, the gender composition remained the same during 2010, with 4 women and 8 men on SLT, but by early 2011 the composition was 6 women and 6 men.
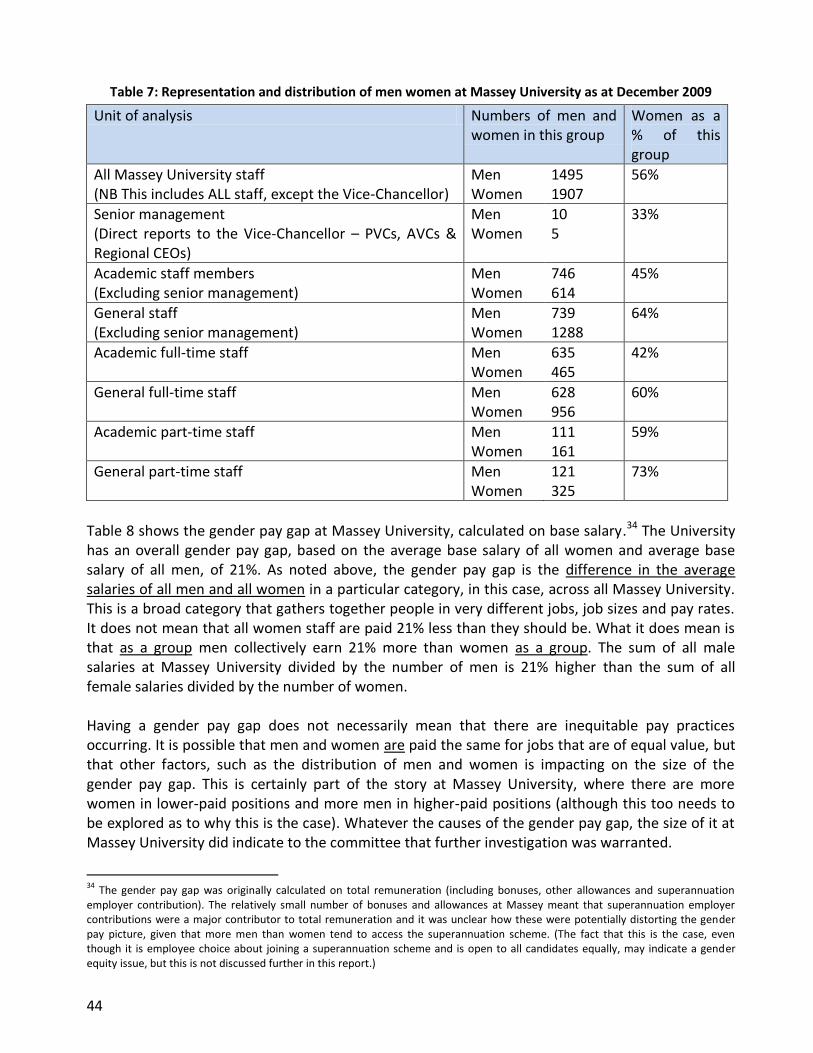
44
Table 7: Representation and distribution of men women at Massey University as at December 2009
Unit of analysis Numbers of men and women in this group
Women as a % of this group
All Massey University staff (NB This includes ALL staff, except the Vice-Chancellor)
Men Women
1495 1907
56%
Senior management (Direct reports to the Vice-Chancellor – PVCs, AVCs & Regional CEOs)
Men Women
10 5
33%
Academic staff members (Excluding senior management)
Men Women
746 614
45%
General staff (Excluding senior management)
Men Women
739 1288
64%
Academic full-time staff Men Women
635 465
42%
General full-time staff Men Women
628 956
60%
Academic part-time staff Men Women
111 161
59%
General part-time staff Men Women
121 325
73%
Table 8 shows the gender pay gap at Massey University, calculated on base salary.34 The University has an overall gender pay gap, based on the average base salary of all women and average base salary of all men, of 21%. As noted above, the gender pay gap is the difference in the average salaries of all men and all women in a particular category, in this case, across all Massey University. This is a broad category that gathers together people in very different jobs, job sizes and pay rates. It does not mean that all women staff are paid 21% less than they should be. What it does mean is that as a group men collectively earn 21% more than women as a group. The sum of all male salaries at Massey University divided by the number of men is 21% higher than the sum of all female salaries divided by the number of women. Having a gender pay gap does not necessarily mean that there are inequitable pay practices occurring. It is possible that men and women are paid the same for jobs that are of equal value, but that other factors, such as the distribution of men and women is impacting on the size of the gender pay gap. This is certainly part of the story at Massey University, where there are more women in lower-paid positions and more men in higher-paid positions (although this too needs to be explored as to why this is the case). Whatever the causes of the gender pay gap, the size of it at Massey University did indicate to the committee that further investigation was warranted.
34
The gender pay gap was originally calculated on total remuneration (including bonuses, other allowances and superannuation employer contribution). The relatively small number of bonuses and allowances at Massey meant that superannuation employer contributions were a major contributor to total remuneration and it was unclear how these were potentially distorting the gender pay picture, given that more men than women tend to access the superannuation scheme. (The fact that this is the case, even though it is employee choice about joining a superannuation scheme and is open to all candidates equally, may indicate a gender equity issue, but this is not discussed further in this report.)

Part B – Findings and conclusion
45
The table also shows the gender pay gap in other categories – within senior management, within academia, and within general staff, and of part-time staff and full-time staff (which is split between academic and general staff). What these data show is that the gender pay gap is less within these categories, where the jobs being considered are of a similar type (suggesting that the preponderance of women in lower paid jobs and of men in the higher paid jobs is influencing the size of the gender pay gap). Table 8 provides baseline data in relation to gender differences in pay. The grey shading shows gender differences in pay, and the gender pay gap, as it is commonly understood based on average salary. The information on the right-hand side of the table, shows gender differences in pay, and the gender pay gap, based on median pay.
Table 8: Gender differences in pay on base salary as at December 2009
Unit of analysis Average male and female pay
Average gender pay gap
Median male and female pay
Median gender pay gap
ALL Massey University staff (except the Vice-Chancellor)
Men Women
$79,069 $62,092
21% Men Women
$76,899 $57,470
25%
Senior management (Direct reports to the Vice-Chancellor - PVCs, AVCs & Regional CEOs)
Men Women
$214,225 $193,984
9% Men Women
$212,786 $198,250
7%
Academic staff members (Excluding senior management)
Men Women
$92,379 $79,711
14% Men Women
$90,889 $79,205
13%
General staff (Excluding senior management)
Men Women
$63,804 $53,290
16% Men Women
$55,378 $48,750
12%
Full-time staff (academic)
Men Women
$94,114 $83,454
11% Men Women
$93,641 $79,205
15%
Full-time staff (general)
Men Women
$68,634 $55,395
19% Men Women
$59,252 $50,039
16%
Part-time staff (academic)
Men Women
$86,275 $70,377
18% Men Women
$77,665 $66,349
15%
Part-time staff (general)
Men Women
$43,480 $48,954
–11% Men Women
$35,735 $44,204
–19%
Among both general and academic staff, the females are clustered in the lower-paying positions, and males are clustered in the higher-paying positions.

46
Academic staff Figure 5 (left) shows the spread of male and female academics. Only a small proportion of female and male academics earn less than $50,000 per annum. Over 20% of female academics earn $50,000 – $64,999, while less than 9% of male academics fall into this wage bracket. Females were most highly represented in the $65,000 – $79,999 wage bracket (35% of female academics), while males were most highly represented in the $80,000 – $99,999 bracket (35%). Less than 13% of females earned more than $100,000, while more than 24% of men did. General staff Similarly, among the general staff (Figure 5 (right)), males as a group earned more than females. Female general staff were most highly represented in the $30,000 – $44,999 wage band, while male general staff peaked in the $45,000 – $59,000 bracket.
Figure 5: Pattern of wage band distribution by gender
Most gender differences within specific academic jobs or general staff grades at the University are significantly less than the overall pay gap, with the difference in favour of men in most categories being between 0 and 4%. The full range is from a difference of 21% in favour of men to 4% in favour of women. (See Appendix Ten).
What Massey University is doing well in respect to gender equity
This section focuses on the gender equity areas in which the University is performing well, in relation to pay and rewards, participation, and respect and fairness:
In the general staff or academic staff workforce
Across Massey University as a whole
In the university sector, and/or
In the wider labour market. The areas in which Massey University is doing well are: 1. Being the first university in NZ to undertake a full pay and employment equity review 2. Improved representation of women in the Senior Leadership Team
0
5
10
15
20
25
30
35
40
< 50 50 - 65 65 - 80 80 - 100 100 - 130 130+
% in
th
is b
and
by
sex
Wage range (base salary) in $K,000
Proportional representation by sex in wage bands: Academic
Female
Male
0
5
10
15
20
25
30
35
40
< 30 30 - 45 45 - 60 60 - 75 75 - 100100 - 150 150+
% in
th
is b
and
by
sex
Wage range (base salary) in $K,000
Proportional representation by sex in wage bands: General
Female
Male

Part B – Findings and conclusion
47
3. Increased number of women Associate Professors in the last three years, and their overall representation in this group
4. The payment of women managers within the Information and Communication Technologies (ICT) area
5. Targeted support to women to promote research – the University Women’s Award (UWA) 6. Increased participation on, and support for, the Women and Leadership programme 7. Provision of support to the Women@Massey group 8. The formation of the Gender Equity Advisory Group 9. Approval and resourcing of the Women’s Virtual Resource Centre 10. Enabling sick leave provisions.
1. The first university in NZ to undertake an analysis of pay and employment equity
Massey University has often been at the forefront of higher education policy leadership, consultation and evaluation.35,36 In doing so, it is recognised as an institution that often supports and facilitates internal and external scrutiny of its practices for the betterment of its working processes and the working conditions of those whom it employs. The PaEE review is further testament to this, as is the University’s willingness to be the first tertiary education institution of recent times to commission, set-up and implement such an extensive review for internal and public scrutiny. The findings have uncovered a number of positives for those who work or collaborate with Massey University – although, as might be expected, it has also uncovered several anomalies for which this Committee has been charged with devising and suggesting certain actions. The findings of this review are highly anticipated by a number of important national sectors, both within and outside tertiary education. At the same time, Massey University is working closely alongside influential national organisations such as the Tertiary Education Union (TEU). Other university institutions in New Zealand are already adopting elements of this review process, knowing how Massey University has progressed with this review over the last 12 months.
2. Improved representation of women on the Senior Leadership Team since 2008
When the most recently appointed Assistant Vice-Chancellor takes up her position in May 2011, women will comprise 6 (or 50%) of the 12-strong Senior Leadership Team (excluding the Vice-Chancellor). This compares with two women and ten men when the present Vice-Chancellor took up the position in late 2008. Positions included in the senior team over the period have varied but have always included the five Pro Vice-Chancellors, the University Registrar, and the Assistant Vice-Chancellors Academic, Research, and Māori and Pasifika, sometimes with one individual holding more than one of these portfolios. One woman and four men have been on the team for the whole period. From 2003 to 2008, Massey University had New Zealand’s only women Vice-Chancellor, Professor Judith Kinnear.
35
Openshaw, R. (2009) Reforming New Zealand Secondary Education: The Picot Report and the Road to Radical Reform. Palgrave MacMillan. 36
Kane, R.G. (2005) Initial Teacher Education Policy and Practice. Wellington, New Zealand: Ministry of Education

48
Figure 6: Gender Representation in the Senior Leadership Team 2005–2011 Needs to be under the figure
3. Increased number of female Associate Professors in the last three years, and their overall representation in this group37
Between 2007 and 2010, the number of female Associate Professors at Massey University has increased in raw numbers from 28 to 39. Over the same period the number of male Associate Professors has increased by just 2. As a result, women’s representation in this group has increased from 24% to 31%. Much of this improvement appears to be coming from appointments to vacancies (as women are generally not applying for promotion in numbers and proportions consistent with such a large difference). In 2007 Massey University ranked fourth among universities, in terms of the proportion of its Associate Professors who are female. In 2010, Massey University has moved to third, just behind AUT on 32% and Waikato on 33%.
4. The payment of women managers within the ICT38 area
Massey University pays female ICT managers, on average, 4.12% ($3,892) more than male ICT managers.
Research39 suggests that lack of critical mass contributes to the male-dominated computing culture and to the lower salaries and poor retention of females in the industry. New Zealand census data for 2006 shows that for 28 ICT occupations (data for ICT managers is not available) female participation was below a critical mass of around 30%. When women and other minority groups achieve critical mass they are seen as a balanced and integral part of the workplace and achieve a level of influence and recognition that may otherwise be absent.40
37
Data drawn from Human Rights Commission – New Zealand Census of Women’s Participation 2010, p. 85, and Human Rights Commission – New Zealand Census of Women’s Participation 2008, p.71. Note that these figures may be slightly different from those used elsewhere in the report. For the PaEE review survey, Associate Professors who currently hold a Head of School or other primary management role have been categorized as a manager rather than an Associate Professor. The figures used by the Human Rights Commission will include all staff with the academic rank of Associate Professor, whatever their current primary role. 38
ICT stands for Information and Communication Technologies. 39
Byrne, E. (1993). Women and science: The snark syndrome. London: Falmer Press. 40
Ibid.
8 810 10 10 10
6
3 2
2 24 5
6
0
2
4
6
8
10
12
14
16
2005 2006 2007 2008 2009 2010 2011
#r o
f m
ale
s vs
fe
mal
es
on
SLT
Senior Leadership Team by Gender
Female
Male

Part B – Findings and conclusion
49
While Massey University female ICT managers form just 27% of the ICT manager group, thus failing to reach critical mass, their average salary is a positive indication that the University supports excellence in a male-dominated work area.
5. Targeted support to women to promote research – the University Women’s Award
The University Women's Award, begun in the early 1990s as the Academic Women's Award, enables women staff involved in teaching or administrative work to take time out to write up research results for publication, or to collect and analyse further data. The award recognises research excellence, and also that women may face particular challenges to their career paths in terms of teaching or administrative tasks. Each award is worth up to $10,000 but the annual budget, recently increased to $50,000, is sometimes distributed in smaller amounts where more suitable to the recipients.
6. Increased participation on, and support for, the Women and Leadership programme
In the last two years Massey University has obtained additional places on the Universities New Zealand Women in Leadership Programmes for Academic and General staff. In addition, to address the limited number of participants that any single University can get on the programme, Massey University has provided all nominated candidates for the programme with one-one-one career coaching by an external learning and development practitioner to craft individual development plans and facilitating development discussions with candidates own managers to support them in fostering their own staff member. The process for nomination and selection for participation on the programme has been revised to drive stronger ownership and sponsorship by senior management teams of candidates from their own area.
7. Provision of support to the Women@Massey group
Women@Massey (W@M) is a grassroots organization that strives to encourage and support women of the University. W@M achieves this by fostering awareness of the particular needs of women and their relationship with the University and providing a channel of communication between the University and W@M on relevant matters that relate to University and women’s development. W@M also works to foster and create a climate of support and for sharing the knowledge and skills for the benefit of all, to facilitate gatherings and events that support the growth of W@M, and to provide a reference point for women at Massey University and strengthen the role of women in the University community. In support of the objectives and work of the W@M group, the University provides meeting space and some financial support, for example, funding to support speakers to their monthly Lunchbox Series.
8. The formation of the Gender Equity Advisory Group
In 2009, Women@Massey submitted a proposal to the Vice-Chancellor, requesting the development of a Gender Equity Advisory Group. The Vice-Chancellor approved formation of this group, and the implementation team has been working in 2010 on the terms of reference. The
50
Gender Equity Advisory Group will advise the Senior Leadership Team on matters related to gender issues at Massey University and make recommendations to ensure an equitable and inclusive environment for all members of the university community. The Gender Equity Advisory Group should begin meeting in early 2011.
9. Approval and resourcing of the Women’s Virtual Resource Centre
In 2010, Women@Massey presented the Vice-Chancellor with a proposal for a Women’s Virtual Resource Centre at Massey University (WVRC@MU). The Vice-Chancellor approved the proposal, and W@M worked with Human Resources to resource and develop the website. The WVRC@MU enhances awareness and understanding at Massey University of the diversity of women’s lives and experience, and the role gender plays in everyone’s life. The aim of the centre is to protect and empower individuals as they pursue their goals without interference from discriminatory practices.
10. Enabling sick leave provisions
The Collective Employment Agreement at Massey University provides first, that employees are entitled to sick leave on an “as and when required” basis (subject to a number of provisions*) except in the first year of employment when 10 days are available. Second, and perhaps more important for the purposes of pay and employment equity, “The sick leave provisions apply equally where the employee is required to attend to their child, partner or family member who is a member of their household and who through illness or injury becomes dependent on the employee, or when a person who depends on the employee for care is sick or injured”. Together these provisions help in ensuring that those who typically assume greater responsibility for caring roles, usually women, are not disadvantaged by the necessity of using their own sick leave entitlement to care for others. The explicit nature of the provision also helps by establishing an understanding of and recognition of the importance of the need for employees at times to use their ‘sick leave’ to care for others. There are examples where this provision has significantly assisted employees, particularly women, in being able to care for others dependent on them and yet maintain their position in the workforce. The provision operates on the principle that it will be administered fairly by management and utilised responsibly by employees.
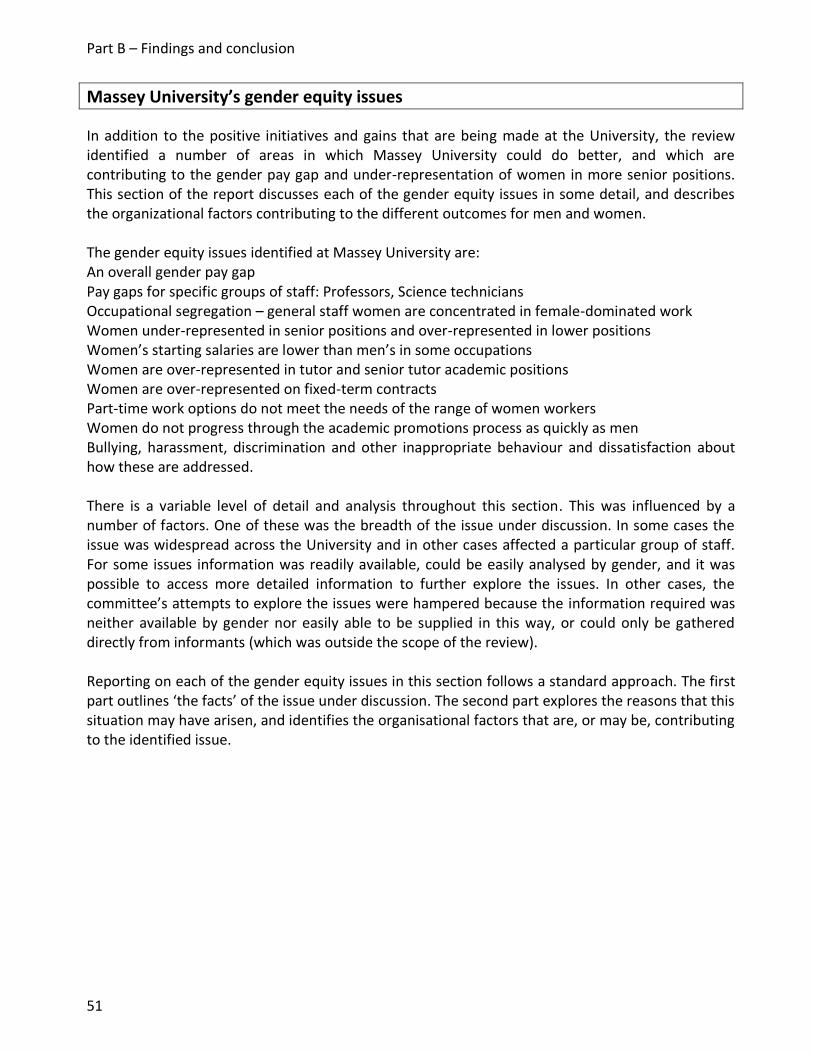
Part B – Findings and conclusion
51
Massey University’s gender equity issues
In addition to the positive initiatives and gains that are being made at the University, the review identified a number of areas in which Massey University could do better, and which are contributing to the gender pay gap and under-representation of women in more senior positions. This section of the report discusses each of the gender equity issues in some detail, and describes the organizational factors contributing to the different outcomes for men and women. The gender equity issues identified at Massey University are: An overall gender pay gap Pay gaps for specific groups of staff: Professors, Science technicians Occupational segregation – general staff women are concentrated in female-dominated work Women under-represented in senior positions and over-represented in lower positions Women’s starting salaries are lower than men’s in some occupations Women are over-represented in tutor and senior tutor academic positions Women are over-represented on fixed-term contracts Part-time work options do not meet the needs of the range of women workers Women do not progress through the academic promotions process as quickly as men Bullying, harassment, discrimination and other inappropriate behaviour and dissatisfaction about how these are addressed. There is a variable level of detail and analysis throughout this section. This was influenced by a number of factors. One of these was the breadth of the issue under discussion. In some cases the issue was widespread across the University and in other cases affected a particular group of staff. For some issues information was readily available, could be easily analysed by gender, and it was possible to access more detailed information to further explore the issues. In other cases, the committee’s attempts to explore the issues were hampered because the information required was neither available by gender nor easily able to be supplied in this way, or could only be gathered directly from informants (which was outside the scope of the review). Reporting on each of the gender equity issues in this section follows a standard approach. The first part outlines ‘the facts’ of the issue under discussion. The second part explores the reasons that this situation may have arisen, and identifies the organisational factors that are, or may be, contributing to the identified issue.

52
1. An overall gender pay gap41
The facts
The overall average gender pay gap42 at the University, based on the average base salary for all women and the average base salary for all men, is 21%. This compares with pay gaps in the ITP sector that range from 6% to 32%, in the Public Service from 3% to 35%, and with a national gender pay gap of 12.5%. Understanding the reasons for Massey University’s relatively wide gap was a key focus of the review. A partial explanation for the size of the gender pay gap at the University relates to the particular nature of the workforce, where there is a larger proportion of men in academic, higher paid positions and larger proportion of women in general staff, lower paid positions. While male employees are equally represented in general and academic positions, 66% of female employees are general staff, and only 33% academic staff. It is expected that other universities, operating in a similar labour market, would have a similar gender pay gap. Given that the average (FTE) academic wage is $87,350, and the average (FTE) general wage is $57,227, the overall effect is a wide gender pay gap for Massey University as a whole. The other data in the table consider the gender pay gap for similar types of work. What these data show is that when comparing like with like, the pay gap is smaller. In the senior management team, the gender pay gap is 9%, for academic staff it is 14% and, for general staff, 16%. These facts notwithstanding, the question remains as to why more women are located in lower paid jobs and more men in higher paid jobs. Also, the factors contributing to the gender pay gap are many and multi-faceted, and women’s over-representation in lower paid jobs is at best, a partial explanation.
Table 9: Gender differences in pay (base salary) – December 2009
Unit of analysis Average male and female pay Average gender pay gap
ALL Massey University staff (except the Vice-Chancellor)
Men Women
$79,069 $62,092
21%
Senior management (Direct reports to the Vice-Chancellor - PVCs, AVCs & Regional CEOs)
Men Women
$214,225 $193,984
9%
Academic staff members (Excluding senior management)
Men Women
$92,379 $79,711
14%
General staff (Excluding senior management)
Men Women
$63,804 $53,290
16%
A visual depiction of how women are over-represented in the lower general and academic grades and under-represented in the higher general and academic grades is shown in Figure 7.
41
Massey’s gender pay gap both provides baseline information as part of the Massey staff profile (see pp. 24–27), and is also a key gender equity issue that needs to be addressed. 42
This does not mean that all women staff are paid 21% less than they should be. What it does mean is that as a group men collectively earn 21% more than women as a group.
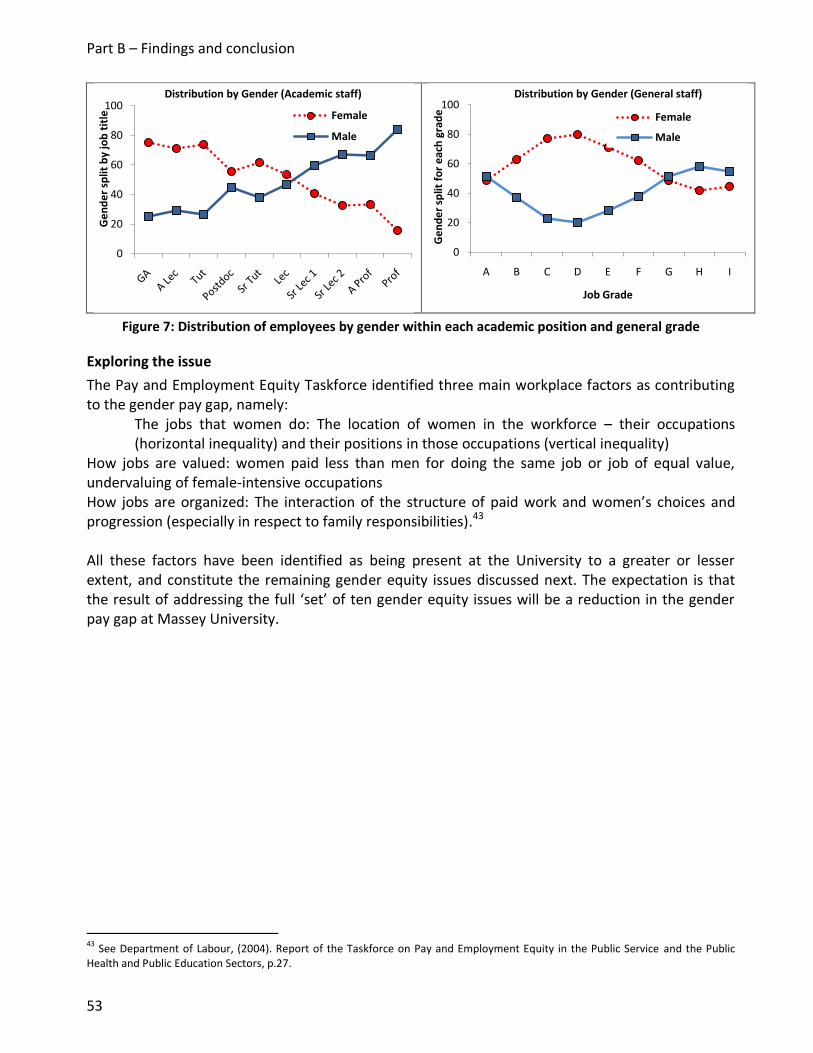
Part B – Findings and conclusion
53
Figure 7: Distribution of employees by gender within each academic position and general grade
Exploring the issue
The Pay and Employment Equity Taskforce identified three main workplace factors as contributing to the gender pay gap, namely:
The jobs that women do: The location of women in the workforce – their occupations (horizontal inequality) and their positions in those occupations (vertical inequality)
How jobs are valued: women paid less than men for doing the same job or job of equal value, undervaluing of female-intensive occupations How jobs are organized: The interaction of the structure of paid work and women’s choices and progression (especially in respect to family responsibilities).43 All these factors have been identified as being present at the University to a greater or lesser extent, and constitute the remaining gender equity issues discussed next. The expectation is that the result of addressing the full ‘set’ of ten gender equity issues will be a reduction in the gender pay gap at Massey University.
43
See Department of Labour, (2004). Report of the Taskforce on Pay and Employment Equity in the Public Service and the Public Health and Public Education Sectors, p.27.
0
20
40
60
80
100G
en
de
r sp
lit b
y jo
b t
itle
Distribution by Gender (Academic staff)
Female
Male
0
20
40
60
80
100
A B C D E F G H I
Ge
nd
er
split
fo
r e
ach
gra
de
Job Grade
Distribution by Gender (General staff)
Female
Male

54
2. Pay gaps for specific groups of staff
This section identifies those occupations where women are underpaid, on average, compared with males for equivalent work within the same job type. There is a gender pay gap of 6%44 or more, within occupations, for professors and science technicians. The gap is a combination of the distribution within the grade varying by sex for a number of positions with men at the top and women lower down, and those on the same step of a grade being paid differently. In addition to these specific groups, the committee found that, among general staff, women tend to get to higher grades in smaller proportions than men in identical jobs, and within the same grade they tend to be on less pay.
Professors45
The facts
In December 2009, there were 92 male and 15 female professors at Massey University. On average male professors earned $136,800 and female professors earned $129,100. This is a gender difference, or gender pay gap, of 6%. The gender pay gap is evident across colleges. Within all colleges, male professors on average consistently receive more pay than female professors. The gap between average male and average female professorial salaries across colleges ranges from 2% to 14% in favour of male professors. For female professors, the average salary by college ranges from $124,000, to $137,300. In contrast, the average salary for male professors ranges from $132,200 to $150,800. The pay difference ranges from 2% to 14% across the colleges. The spread of professors by college is outlined in Table 10.
Table 10: Number of professors by college (excluding those who are managers such as PVC or HOD)
College/Unit Male Female Total
AVC – Research 1 1
College of Business 16 3 19
College of Creative Arts - 2 2
College of Education 5 1 6
College of Humanities & Social Sciences 12 4 16
College of Sciences 57 5 62
New Zealand School of Music 1 1
Total 92 15 107
44 The threshold for determining what was significant was provided by the Pay and Employment Equity Unit in the Department of Labour, which drew on international benchmarks to establish a guideline for percentage differences between men and women that make statistical sense/explained statistically that the difference we are looking at is associated with gender. For pay, this difference was 5%, with the caveat that in some situations it may also be important to understand pay differences between 3% and 5%. 45 The category of professor under discussion in this section includes those professors who are teaching and researching in their particular discipline. This category excludes professors whose primary current role is that of manager. This means that professors who are Pro Vice-Chancellors or hold managerial positions such as Head of Department or Head of School are not included.

Part B – Findings and conclusion
55
Exploring the issue
The PaEE review committee identified a range of possible factors that may have contributed to this gender difference in pay, in an attempt to ascertain whether the difference could be a) explained, and b) justified. Those factors judged as not contributing to the gender pay gap were:
Gender differences in level of qualification Management loading.46
There were, however, a number of factors that do have a bearing on the gender pay gap, as discussed next. Some of the practices, on the face of it, do not appear to be gendered, but the resulting outcomes are gendered. 1. Length of service/recency of appointment The committee considered it a strong possibility that the following ‘explainable historical factors’ might be contributing to the gender pay gap for professors:
the low numbers of women employed, and their relatively recent appointments, the greater number of male professors, in their positions for a much greater period of time, who would be receiving larger salaries because of longer tenure.
It has not been possible to substantiate or reject these possibilities. An initial analysis of the HRIS data seemed to suggest that gender differences in salary increased in direct correlation to how recently an appointment was made. However, when personnel records were migrated to a new HRIS system in 2001, historical dates of appointment to the position were not transferred across. Consequently, it was not possible to test whether the higher salaries were attributable to significantly longer service. The actual date that a person was appointed to the academic rank of professor can only be ascertained by a detailed record-by-record look. This has not been undertaken over the period of the review. 2. Starting salaries In the three years previous to December 2009,47 23 ‘new’ professors were appointed at Massey University. Of these, some of whom were visiting professors, seven no longer worked at the University by December 2009. Of the 16 professors appointed in the last three years and still employed, 3 were women and 13 were men. The average salary for the female appointees was $129,686. The average salary for the male appointees was $137,701. The difference in starting salaries raises questions for further exploration about:
guidelines for setting starting rates
46
Professors (or other staff) who undertake the management role of Head of Department (HOD) receive an allowance for being HOD and also annual reviews of base salary in which they are awarded for management contributions. When they revert back to being a teaching and researching professor the allowance ceases but any increase in base salaries is retained. This arrangement is not gendered by nature, and women appear to be accessing this arrangement at least in proportion to their representation at professorial level. 47
This is the date the data was collected.

56
flexibility in negotiation – a process in which research has shown that men tend to be advantaged – and whether any guidelines exist for managing this
moderation of starting salaries by a body external to the college that is employing the professor.
3. Discipline An analysis of professors' pay shows that the discipline or College in which the professorship is held does have a bearing on the salary level. When comparing the average base salary levels for professors between each College, the broad sets of disciplines do appear to influence the level at which a professor is paid, for both men and women. There is a 14.1% gap between the average salary of male professors in the lowest-paying College and the average salary of male professors in the highest-paying College. Similarly, there is a 10.7% gap between the average salary of female professors in the lowest-paying College and the average salary of female professors in the highest-paying College. However, there is also a gender pay gap within each discipline. The gap between average male and average female professorial salaries within each College ranges from 2% to 14%, and is always in favour of male professors. In the highest-paying College, female professors earn on average $13,000 less than their male counterparts. 4. Market loadings for recruitment and retention
At Massey University recruitment and retention payments to professors, by way of an additional loading on base salary, are paid in response to skill shortages in specific disciplines. There is a formally approved market premium for a small number of sub-disciplines for which the University competes with the commercial sector. In these disciplines, the average salary for professors is $16,000 more than in most areas where such a premium does not operate. We were unable to determine if the market loadings for professors were gendered, as there were no female professors in these specific sub-disciplines at the time of the review. 5. Rewards for Performance-based research funding (PBRF) rank PBRF has also become a factor in recruitment and retention, as this nationally-administered system of ranking academic staff has given rise to increased competition among NZ universities for 'A' rated researchers. This in turn has resulted in higher salaries being paid to professors holding a PBRF ranking of ‘A’. The higher salary paid in these circumstances is not specifically recorded as including an additional market loading, as it is tied to the professor’s PBRF ranking and not the specific subdiscipline in which the professor works. Nevertheless there are similarities with market loadings because of the need to respond to pressures in the context of research funding and research capability/reputational issues and to provide salaries that reflect the value of highly esteemed individuals in the marketplace. At least six male professors have received these higher salaries.

Part B – Findings and conclusion
57
6. Rate of progress via salary reviews An exploration of the current salaries of the 16 professors appointed in the last three years (chosen as an indicative measure of professorial progress) reveals an increasing gender difference in pay. An analysis of the starting salaries and current salaries of these 16 professors shows that, on average, the position of the female professors has worsened over this period relative to that of male professors.48 At the end of this three-year period, fewer men are paid less than the lowest paid women compared with the beginning of the period, and more men are paid more than the highest paid woman. Data from the annual salary reviews49 for professors confirm that over the past three years the salary gap for female professors has widened relative to their male colleagues. Over the past three years female professors comprised approximately 12% of all professors receiving a salary review and 9% of professors receiving a salary increase. This gender difference in the progression of male and female professors suggests action needs to be taken in respect to:
reviewing the process by which annual salary reviews are undertaken
monitoring the progression of male and female professors.
Science Technicians
The facts
This is a mixed grade position covering around 200 staff where the jobs undertaken have a level of similarity for required academic qualifications, experience, responsibility, exposure to dangerous substances, and other criteria. On average, male science technicians as a whole receive a higher salary than female science technicians: $51,500 compared with $46,700 a gender difference of 9%. Key factors contributing to this gap are:
female science technicians are over-represented in the lower levels
within higher grades women are paid on average less than men. There is a gender pay gap in relation to science technicians within grades E, F, and G of 7%, 5% and 7% respectively.
in the main science technician roles (research assistant, research technician, technical officer, technician) there is a gender pay gap of 7% favouring men.
The committee explored gender differences in pay using:
ANZSCO codes and job titles
48
On an annual basis, professor salaries can be increased as a result of across the board pay adjustments or performance-related increase. Care was taken in analyzing this group to check that this gender difference was not caused by, for example, a larger proportion of men having been there for three years and therefore accessing more across-the-board pay adjustments because they had been there longer. In fact, the spread by gender was fairly even, with 1 woman and 4 men being appointed in 2007, 1 woman and 4 men appointed in 2008, and 1 woman and 8 men in 2009. If anything, the expectation would be that average salary movement of male professors would have been slightly less than the female professors. 49
Professors do not have a promotions process but are subject to an annual salary review process that is managed by the Pro Vice-Chancellor (PVC) of each college.
58
ANZSCO and Massey University job titles and grade
Specific science technician roles. ANZSCO codes and job titles An initial look at the general staff data showed 12 ANZSCO job titles50 covering science technicians, a total of 220 science technicians – 102 men and 118 women. Of the 12 ANZSCO job titles, only five were available for gender comparison (as five are single sex and two are single incumbent categories). This showed a gender pay difference favouring men in average base salaries in four of the five science technician groupings (which together accommodated 125 of the total 220 science technicians). The results show that, on average:
Male agricultural technicians earn 14% or $7,000 more than females (3 men and 6 women)
Male chemistry technicians earn 7% or $3,800 more than females (10 men, 9 women)
Male earth science technicians earn 14% or $7,000 more than females (11 men, 8 women)
‘Other’ science technicians who were male earn 10% or $5,000 more than females (41 men, 37 women).
There was no gender difference in average pay for the 19 male and 33 female life science technicians. The committee decided to undertake further analysis of these science technician jobs because the ANZSCO job titles do not make allowance for job grades (meaning that jobs are assigned an ANZSCO category regardless of the grade of the specific role), and because the category of ‘other’ science technicians grouped together positions that were not elsewhere classified. The hypothesis that these categories were not comparing like jobs with like was confirmed (with some of the categories covering up to 6 grades). Science technicians and job grades Because the ANZSCO job titles do not take account of the grade of the job-holder, an analysis was undertaken of the representation of men and women on particular grades and any gender pay differences within grades. This analysis was complicated by the 78 different job titles – some with only one or two incumbents. The population for this further analysis included all science technician roles that had a Massey University job title indicating the role was a science technician role AND had a correlating ANZSCO code AND had a general staff job grade (A–I).51
This group consisted of 107 females and 88 males. Their breakdown by general staff letter grades is shown in Table 11. This shows that female science technicians are over-represented in the lower general grades and under-represented at Grade F and above.
50
At level 6, the most specific level of ANZSCO coding. 51
For further details see Appendix 8.
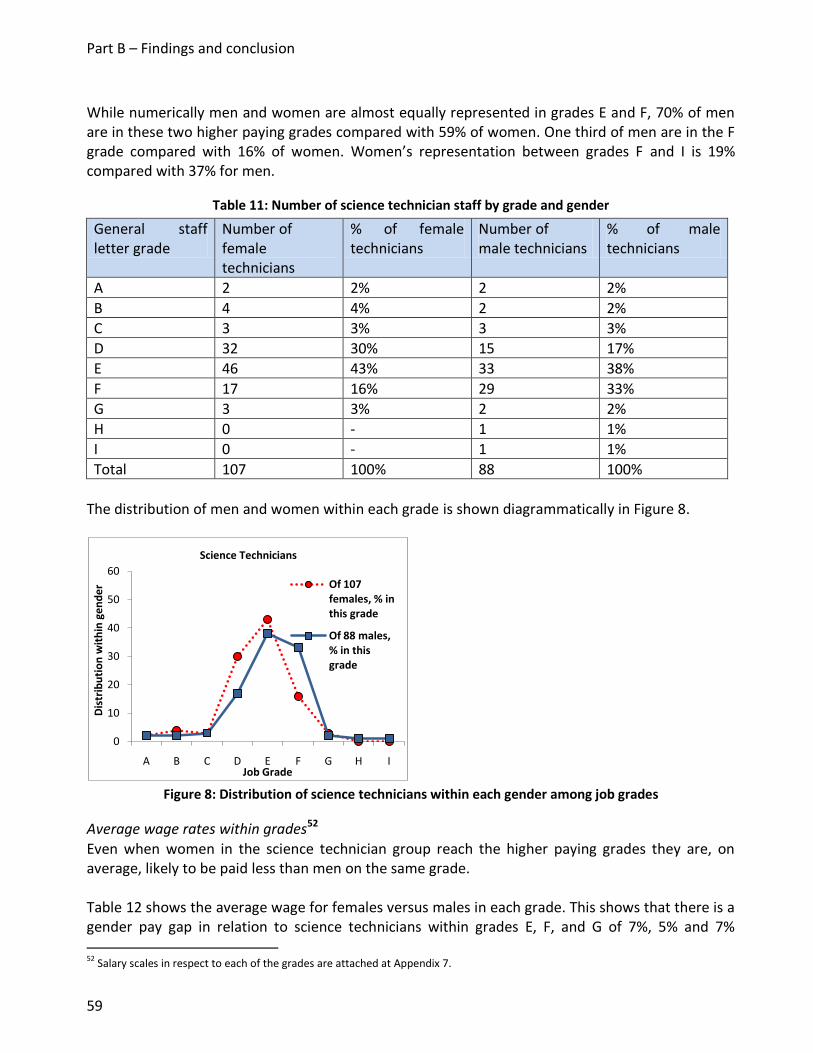
Part B – Findings and conclusion
59
While numerically men and women are almost equally represented in grades E and F, 70% of men are in these two higher paying grades compared with 59% of women. One third of men are in the F grade compared with 16% of women. Women’s representation between grades F and I is 19% compared with 37% for men.
Table 11: Number of science technician staff by grade and gender
General staff letter grade
Number of female technicians
% of female technicians
Number of male technicians
% of male technicians
A 2 2% 2 2%
B 4 4% 2 2%
C 3 3% 3 3%
D 32 30% 15 17%
E 46 43% 33 38%
F 17 16% 29 33%
G 3 3% 2 2%
H 0 - 1 1%
I 0 - 1 1%
Total 107 100% 88 100%
The distribution of men and women within each grade is shown diagrammatically in Figure 8.
Figure 8: Distribution of science technicians within each gender among job grades
Average wage rates within grades52 Even when women in the science technician group reach the higher paying grades they are, on average, likely to be paid less than men on the same grade. Table 12 shows the average wage for females versus males in each grade. This shows that there is a gender pay gap in relation to science technicians within grades E, F, and G of 7%, 5% and 7% 52
Salary scales in respect to each of the grades are attached at Appendix 7.
0
10
20
30
40
50
60
A B C D E F G H I
Dis
trib
uti
on
wit
hin
ge
nd
er
Job Grade
Science Technicians
Of 107 females, % in this grade
Of 88 males, % in this grade

60
respectively. (H and I grades are not shown individually for privacy reasons because there is only one person in each of those grades.)
Table 12: Average base salary for by grade and gender
General staff letter grade
Average salary (female)
Average salary (male)
Female salary as % of male
P value by Student’s t-test
A $31,126 $28,275 109% 0.55
B $31,997 $36,646 87% 0.36
C $40,346 $37,692 107% 0.54
D $42,981 $42,889 100% 0.94
E $48,041 $51,217 92% 0.005*
F $54,686 $57,529 95% 0.04*
G $62,910 $67,167 94% 0.05*
Total53 $46,795 $51,597 0.0002*
Data that are statistically significant are indicated by *, that is, it is unlikely to have occurred by chance. Specific science technician roles Given the profusion of Massey University job titles the committee then explored the four specific roles that have the largest numbers of occupants – 157 staff. These roles have fairly generic job titles: Research assistant (27 staff), Research Technician (18 staff), Technical Officer (23 staff) and Technician (89 staff). The gender breakdowns and salaries of the four Massey University categories are shown in Table 13.
Table 13: Main science technician roles by average base salary by gender
Job title Number of females
Number of males
Female average salary
Male average salary
Female salary as % of male
Research assistant 21 6 $41,711 $44,267 94%
Research technician
13 5 $46,134 $46,703 99%
Technical officer 10 13 $50,259 $56,011 90%
Technician 38 51 $48,415 $49,265 98%
All 82 75 $46,562 $49,864
In each of the four roles women earn less than men, and female research assistants and technical officers earn on average 6% and 11% less than their male colleagues.
53
The total average data includes the salaries for staff at grades H and I.

Part B – Findings and conclusion
61
Exploring the issue
Women make up 57% of the Massey University science technician group. The group includes a large number of different Massey University job titles and many of these roles are occupied by one or two staff members. Even though the job titles do not appear to be ‘gendered’ (i.e. female-dominated roles having a title that denotes a lower status role), the data show that on average female science technicians are paid less than men. The available information suggests that this is because women are:
In roles that pay less than roles that men are employed in
On lower pay grades than men
Paid at lower levels within the same grade. The data cannot tell us whether the reasons for the gender differences are because women science technicians are:
Appointed to lower grades than men
Appointed to lower starting salaries within the grade
Not able to progress to higher paying jobs at the same rate as men
Have jobs that are assigned to lower paying job titles
Are in jobs that would be ‘sized’ as smaller than those held by men, were a formal job sizing exercise to be undertaken.
However, the PaEE review committee identified a number of factors known to have a bearing on the gender pay gap. Using all the available information, the committee considered whether these were present at the University, in an attempt to ascertain whether the difference could be a) explained, and b) justified. Those factors judged as not contributing to the gender pay gap were:
Gender differences in level of qualification
Gender differences in level of experience
Length of service.
The areas considered by the committee to be most important for further investigation (based on committee members’ experience and comments in the open-ended survey question relating to general staff progression) are:
Starting salaries, in particular an exploration of the following issues:
Manager discretion in setting starting salary, both the initial offer and subsequent negotiations54
Moderation or not of starting salaries
Accelerated progression. In 2010, general staff women received accelerated increments in proportion to their 64% representation of the general staff workforce, although were under-represented in those receiving accelerated increments in the $70,000 to $99,999 band at 40%. It would be useful to track accelerated increments for science technicians by
54
Comments in response to question 64 in the PaEE review survey “Why do you believe the advancement process is or isn’t fair to women?” indicated a number of staff were concerned that gendered assumptions/attitudes/practices favoured men.

62
gender and over time in order to understand if men and women are progressing at the same rate.
Sizing of the science technician positions held by men and women (which would include a consideration of whether the particular discipline in which one is a technician has an impact).
Other General Staff
Table 14 shows a comparison between the 20 groups of general staff jobs (with at least 2 males and females in the group) determined as exactly the same This means that they have:
The exact same Massey University job title
The exact same ANZSCO job title
The exact same Massey University general letter grade. The table shows women not only tend to get to higher grades in lesser proportions than men, but once there they tend to be on less pay. This issue will be explored further in the rest of Part B.
Table 14: Comparison by gender of general staff in jobs matched by title, category, and grade
Job title Grade ANZSCO job title No. Female
No. Male
Salary Female
Salary Male
%
Job titles where men earn at least 3% more than women (7 of 9 categories pay more than $48,000)
Shelver GEN.B Shelf Filler 7 7 27,064 28,770 106
Groundsperson GEN.C Gardener (General) 3 6 39,481 40,779 103
Technician GEN.E Science Technicians nec55
7 2 109
Technician GEN.E Life Science Technician 7 6 49,236 52,668 106
Administrator GEN.E Clerical & Administrative Workers nec
15 2 104
Librarian GEN.F Librarian 17 4 55,605 59,001 106
Business Analyst GEN.G Management Consultant
3 3 63,354 65,486 103
Student Liaison Adviser
GEN.G Public Relations Professional
6 5 65,583 67,645 103
Business Manager
GEN.G Accountant (General) 2 4 107
Job titles where pay is equivalent
Computer Lab Supervisor
GEN.A ICT Customer Support Officer
7 6 27,191 26,406 97
Client Services Rep
GEN.B Inquiry Clerk 3 2 100
Technician GEN.D Science Technicians 9 4 43,955 43,596 99
55
Nec means ‘not elsewhere classified’.

Part B – Findings and conclusion
63
nec
Help Desk Operator
GEN.E ICT Customer Support Officer
3 2 97
Student Relations Consultant
GEN.E Call or Contact Centre Operator
13 5 41,637 41,148 98
Technical Officer
GEN.E Science Technicians nec
3 3 48,742 48,851 100
Team Leader GEN.F Office Manager 7 2 100
Technician GEN.F Science Technicians nec
2 5 59,922 60,082 100
Job titles where women earn at least 3% more than men (2 of 3 categories pay less than $48,000)
Library Assistant GEN.C Library Assistant 52 14 35,082 32,422 92
Technician GEN.D Life Science Technician 3 4 47,491 42,391 89
Communications Adviser
GEN.G Public Relations Professional
3 3 68,163 59,233 86
3. Occupational segregation – general staff women concentrated in female-dominated work
The facts
Occupational segregation is one of the key reasons for the gender pay gap nationally as well as at Massey University. Occupational segregation is described in two ways, as horizontal inequality or vertical inequality. Occupational segregation where women are clustered into a narrow range of low-paid, female-dominated occupations is a form of horizontal inequality. Occupational segregation that occurs as a result of men increasing their proportion of the workforce as pay and status rise is known as vertical inequality.56 The general staff workforce is highly sex-segregated with nearly two-thirds of general staff women working in female-dominated work. By this is meant that women comprise 70% or more in a particular occupation. The predominance of women in female-dominated jobs matters because female-dominated jobs tend to pay less than male-dominated jobs or mixed gender jobs. Most female jobs at Massey University are located in middle or lower grades. The total female workforce at Massey University is 1914 women. General staff women account for 1292 or 66%. Of the 1292 female general staff workforce, 65% (842) work in female-dominated jobs. There are just 8% (102) of general staff women who work in male-dominated occupations.57 Just 27% of women work in mixed occupations. In contrast, 56% of general staff men work in male-dominated jobs (420), 14% (103) in female-dominated jobs, and 30% in mixed occupations.
56
Department of Labour (2004). Report of the Taskforce on Pay and Employment Equity in the Public Service, and the Public Health and Public Education Sectors, pp. 27–31. 57
Male-dominated jobs are defined as those comprising 60% or more of men, while female-dominated jobs are those comprising 70% or more of women. The difference in the measures is due to the fact that women are located in a narrower range of occupations than men, so would reach the 60% threshold much too readily. The difference measures have been determined to be a fair way of determining gender dominance in occupations.

64
Table 15: Distribution of general staff by gender
Women Men
No. % No. %
Female-dominated occupations
842 65% 103 14%
Mixed occupations 102 27% 226 30%
Male-dominated occupations
348 8% 420 56%
Total 1292 747
The main groupings of female-dominated and male-dominated jobs (using ANZSCO categories) are listed in Table 16 and Table 17.
Table 16: Male-dominated work (Level 4 ANZSCO, filtered data)
ANZSCO Job Title Percentage Numbers
Male Female Male Female
Architectural, Building and Surveying Technicians 100.00% 0.00% 4
Caretakers 100.00% 0.00% 19
Chemists, and Food and Wine Scientists 100.00% 0.00% 5
Computer Network Professionals 100.00% 0.00% 8
Electricians 100.00% 0.00% 5
Electronic Engineering Draftspersons and Technicians 100.00% 0.00% 5
Electronics Trades Workers 100.00% 0.00% 8
Livestock Farm Workers 100.00% 0.00% 7
Mechanical Engineering Draftspersons and Technicians 100.00% 0.00% 6
Gardeners 78.95% 21.05% 15 4
Accountants 76.19% 23.81% 16 5
ICT Managers 75.00% 25.00% 12 4
Software and Applications Programmers 73.33% 26.67% 33 12
General Managers 71.43% 28.57% 10 4
ICT Support Technicians 69.83% 30.17% 81 35
Veterinarians 63.64% 36.36% 7 4
Grand Total 231 66

Part B – Findings and conclusion
65
Table 17: Female-dominated work (Level 4 ANZSCO, filtered data)
ANZSCO Job Title Percentage Numbers
Male Female Male Female
Animal Attendants and Trainers 0.00% 100.00% 5
Cafe Workers 0.00% 100.00% 4
Checkout Operators and Office Cashiers 0.00% 100.00% 4
Human Resource Clerks 0.00% 100.00% 11
Medical Technicians 0.00% 100.00% 6
Nurse Educators and Researchers 0.00% 100.00% 24
Personal Assistants 0.00% 100.00% 54
Registered Nurses 0.00% 100.00% 6
Speech Professionals and Audiologists 0.00% 100.00% 4
Switchboard Operators 0.00% 100.00% 6
Veterinary Nurses 0.00% 100.00% 13
Other Miscellaneous Clerical and Administrative Workers 5.62% 94.38% 5 84
Accounting Clerks 9.30% 90.70% 4 39
General Clerks 9.68% 90.32% 9 84
Librarians 16.36% 83.64% 9 46
Inquiry Clerks 19.05% 80.95% 4 17
Library Assistants 19.48% 80.52% 15 62
Education Advisers and Reviewers 20.37% 79.63% 11 43
Call or Contact Centre Workers 21.74% 78.26% 5 18
Office Managers 22.22% 77.78% 8 28
Private Tutors and Teachers 26.83% 73.17% 22 60
Grand Total 36.55% 63.45% 92 737
Identifying male- and female-dominated jobs at Massey University enables examination of whether these occupations are clustered in particular grades or levels and/or associated with lower levels of pay. Investigation of this shows that, at Massey University, the average pay difference in male- and female-dominated jobs is significant. The data in Figure 9 shows that female-dominated jobs tend to be located in the lower levels of the general grades and have lower salaries than male-dominated jobs. Of the female-dominated jobs, over 60% of the categories pay less than the average Massey University general-staff wage of $55,120; of the male-dominated jobs, over 60% of the categories pay more than the average Massey University general-staff wage of $55,120.

66
Employees in female-dominated jobs do appear to have less opportunity to gain a job in higher grades. In 59% of the female-dominated job categories, the highest graded job is an E or F. In 64% of the male-dominated categories, the highest graded job is a G, H or I; less than 12% of the female-dominated job categories reach G, H or I.58
Figure 9: Maximum grade within positions in major general-grade job categories by sex-dominance59
Another way of investigating gender fairness was by examining the gender representation by grade in job categories that were mixed-gender. Within the 12 mixed-gender categories that had 11 or more general grade A–I staff, male and female employees were equally likely to be in grade A, B, C, F, or I (Figure 9). This shows that the pattern for females within the mixed-gender job categories is also to be at a lower grade than the males.
58
For further details see Appendix Nine 59
Jobs for which there are >11 general staff grade A-I employees were categorized as female-dominated (F-dom) █, sex-balanced (mixed) , or male-dominated (M-dom) █. For each job category, the highest letter-graded employee was noted and this grade was assumed to be the highest general grade (A–I) to which employees in that job category could aspire; non-letter-graded employees, including contract workers and academics, were deleted from this data set. Data show the proportional representation of maximum job grades within jobs of each sex-dominance.
0
5
10
15
20
25
30
35
C D E F G H I
Pro
po
rtio
n o
f o
f jo
b c
ate
gori
es
Highest employee grade in job categories
Maximum grade available by profession/job type
F-dom
mixed
M-dom
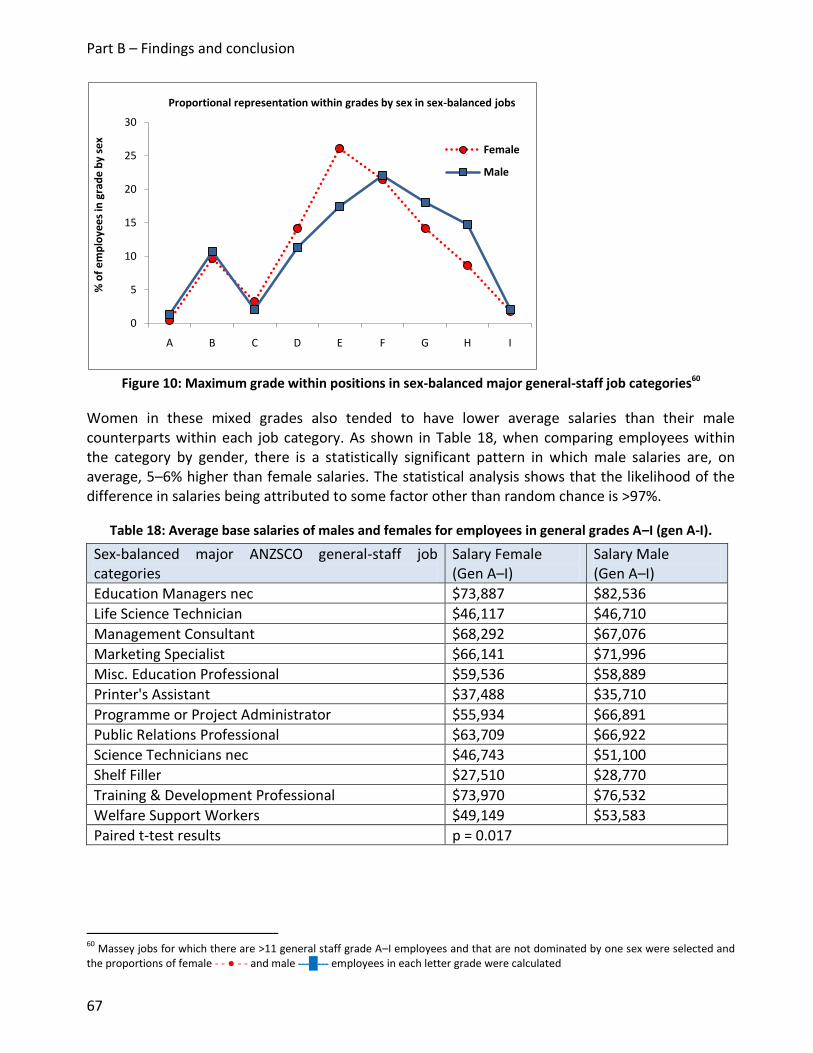
Part B – Findings and conclusion
67
Figure 10: Maximum grade within positions in sex-balanced major general-staff job categories60
Women in these mixed grades also tended to have lower average salaries than their male counterparts within each job category. As shown in Table 18, when comparing employees within the category by gender, there is a statistically significant pattern in which male salaries are, on average, 5–6% higher than female salaries. The statistical analysis shows that the likelihood of the difference in salaries being attributed to some factor other than random chance is >97%.
Table 18: Average base salaries of males and females for employees in general grades A–I (gen A-I).
Sex-balanced major ANZSCO general-staff job categories
Salary Female (Gen A–I)
Salary Male (Gen A–I)
Education Managers nec $73,887 $82,536
Life Science Technician $46,117 $46,710
Management Consultant $68,292 $67,076
Marketing Specialist $66,141 $71,996
Misc. Education Professional $59,536 $58,889
Printer's Assistant $37,488 $35,710
Programme or Project Administrator $55,934 $66,891
Public Relations Professional $63,709 $66,922
Science Technicians nec $46,743 $51,100
Shelf Filler $27,510 $28,770
Training & Development Professional $73,970 $76,532
Welfare Support Workers $49,149 $53,583
Paired t-test results p = 0.017
60
Massey jobs for which there are >11 general staff grade A–I employees and that are not dominated by one sex were selected and the proportions of female - - ● - - and male ---█--- employees in each letter grade were calculated
0
5
10
15
20
25
30
A B C D E F G H I
% o
f e
mp
loye
es
in g
rad
e b
y se
xProportional representation within grades by sex in sex-balanced jobs
Female
Male

68
In summary:
The majority of job categories at Massey University are male-dominated or female-dominated
Female-dominated positions have a lower average wage than male-dominated positions
There are fewer female-dominated occupations in the upper general staff grades than male-dominated jobs, resulting in fewer career opportunities in female-dominated jobs.
In mixed-gender jobs that span more than one grade, females are on average located in lower grades than males. Given that salaries are determined by grade, male salaries are higher than female salaries across job categories.
Exploring the issue
In relation to occupational segregation there were two issues that the committee needed to consider: the fact that women and men hold different types of jobs at Massey University, and that female-dominated work tends to pay less than male-dominated work. Forces outside the control of the University (for example, education choices, gender socialization) do contribute to men and women being dominant in different occupations. However, not all female-dominated/lower paid jobs are low skill, and many include skills that have not been adequately described, measured or rewarded to the same extent as similar male-dominated roles.61 The PaEE Taskforce in 2004 identified concerns about how jobs are valued, including where female intensive occupations are undervalued, as one of three key workplace factors contributing to the gender pay gap. A focus on the valuing of work was a core focus of the recent work of the PaEE Unit in the Department of Labour, resulting in the Equitable Job Evaluation system and the Gender-Neutral Job Evaluation Standard. The focus of the PaEE review committee was the exploration of factors within the University’s control that may be contributing to occupational segregation, and associated pay differences. An early consideration, for example, was the possibility that male salaries in a given job category are significantly higher than female salaries in the same category because the males are more highly qualified than the females. A difference in education or experience would both explain and justify the salary difference. Based on the results of the statistical analysis undertaken however, this was considered improbable62 (although whether the differences truly are explainable and justifiable can be determined only by examining and comparing the relevant qualifications of all employees within each job category, assessing the recruiting practices at Massey University, and evaluating the job evaluation and questionnaire forms – tasks that are beyond the limitations of the review committee). The committee drew on some of the known organisational factors that contribute to occupational segregation to see if these were present at the University. One factor that is sometimes present in
61
See, for example, State Services Commission and Department of Labour (1991). Equity at Work – An Approach to Gender Neutral Job Evaluation. The introduction notes that “...traditional [job evaluation] schemes do not include factors that adequately measure aspects of women’s work such as caring or other work with people, or the requirement to organize or coordinate activities or people. Secondly, a clear line management bias exists in many factors in traditional schemes, thereby undervaluing or ignoring the support and non-managerial work often performed by women.” 62
See Appendix Nine.

Part B – Findings and conclusion
69
organisations are differences in the number of steps within grades for male- and female-dominated occupations. This was not found to be an issue at Massey University. Organisational factors that the committee do consider to be contributing to occupational segregation are:
Specific practices that contribute to an undervaluing of jobs that are traditionally women’s work, or aspects of women’s work
Organizational rules, practice or behaviour that support or maintain occupational segregation.
These are discussed in more detail below. Undervaluing of women’s work or aspects of women’s work
Undervaluing of women’s work, or aspects of women’s work, relates specifically to the way in which jobs are sized, and therefore to the setting of the grade for that position and its associated pay range. Common ways in which undervaluing of women’s work can occur are: not rewarding similar pay for work of similar value (job size) or through using a job evaluation system that is not current enough and may not be adequately capturing the dimensions of female occupations (such as interpersonal skills, the number of people being provided services to, or emotional demands).
It is this latter dimension that the committee judged to be a particular issue at Massey University. As discussed earlier, the current general staff pay system operates around a grading structure that was built following a job evaluation exercise in the 1990s, and many general staff jobs have been graded through a process of whole job comparison rather than a points-factor evaluation. The committee was not confident that, given its age, the current system was capturing all aspects of women’s work, and that there have been many changes to jobs and job evaluation systems since the mid-1990s, some specifically to address the invisibility of women’s work in these schemes. Massey University has begun a new job evaluation exercise in conjunction with TEU to review whether current positions are sized appropriately and whether the relativities established in the
1990s are still relevant, or may involve some changes in the pay structure. The committee also felt that it did not have sufficient information about the ‘new’ evaluation scheme being implemented to feel fully confident that this job-sizing instrument is gender-neutral. In the last few years New Zealand has undertaken some ground-breaking work in this area and the committee was of the view that the new system should be tested against either the Gender-Neutral Job Evaluation Standard or the Equitable Job Evaluation system.
Survey results also provided additional cause to consider this issue carefully. Results indicated a level of staff dissatisfaction with job sizing and relativity. A third of women respondents and a quarter of male respondents disagreed or strongly disagreed to the survey statement “I believe I am paid fairly compared to others doing different work but using similar skills within Massey University”.

70
Organisational rules, practice or behaviour that support or maintain occupational segregation
The survey identified three issues as contributing to occupational segregation: lack of career paths within or between occupations; lack of flexible or part-time work in a range of occupations and at all levels; and a gendered workplace culture. These are discussed briefly below. Lack of career paths within and between occupations are considered a concern by both men and women at Massey University. A low 33% of general staff men, and 29% of general staff women agreed or strongly to the survey question “There is an obvious career path from my current position at Massey University.” This means that where staff are recruited into male- and female-dominated positions, there is little opportunity for movement. And the data reported earlier in this section suggest that female-dominated occupations are more limited than male-dominated occupations. Lack of flexible or part-time work in a range of occupations is one of the major findings of the PaEE review and is discussed in detail in the report. Evidence for the inclusion of a gendered workplace derives from the large number of comments to this effect in the open-ended PaEE review survey questions. The committee considered that gendered behaviour in the workplace has the effect of maintaining occupational segregation and keeping women ‘in their place’, as illustrated in the following comments. Individual managers …often view women as 'girls', may consider that they are not the main breadwinner, or just take men more seriously… Many of the positions that females have been appointed to have no career progression nor any thought about the need for it. Q31, Line 206 There is a somewhat old-fashioned male culture on campus, where an old boys club exists, senior male managers will not take women seriously (thinking their careers are second to their partners and perhaps just a hobby), and being very condescending, patronizing, patriarchal. Q31, Line 363 It appears to me that most general staff are women, so it is likely that pay and rewards may be used to encourage more men into the workplace…. In our workplace there are a small number of women, and a young man was employed who was paid much more than the current salary band limit. When that became apparent it created a demotivator for the women as it was perceived as inequitable. They are as qualified, did the same job and had more experience yet the pay was quite different. Q31, Line 603 Other factors considered by the committee as possibly contributing to occupational segregation at Massey University were:
gender-based assumptions in advertising and recruitment
failure by those recruiting to actively consider women for work that is, or has been, traditionally done by men , and vice versa
preferentially recruiting of women for low-paying/female-dominated work and men for high-paying male-dominated work
work of similar value (job size) not similarly rewarded.

Part B – Findings and conclusion
71
4. Women under-represented in senior positions and over-represented in lower positions
The facts/issue
Women are under-represented in senior positions in management, academia and general staff positions relative to men and to women’s overall representation at the University, and over-represented in academic and general staff areas in lower-paid, and lower status positions.
The Workbook63 suggests that representation and distribution differences of more than 20% may warrant further examination in order to understand why this is occurring. Under-representation of women in senior positions is discussed next in three parts.
Senior management
Women comprised 33% of the Senior Leadership Team as at December 2009 when the data for the review were uploaded. At that time, there were 10 men and 5 women in the Massey University Senior Leadership Team (SLT). In early 2010 restructuring resulted in changes to SLT in the form of disestablishment of the regional chief executive positions, although the gender composition remained the same, with 4 women and 8 men on SLT. Further staffing changes to SLT in early 2011 now bring the female representation to 50%
Women comprise 34% of Level 3 managers (39 women and 77 men). It is a relatively common phenomenon in a range of organisations that female representation drops off at Tier 3 level, the feeder pool for senior management positions. It was for this reason that this group was considered as important to address by the committee.
Academic Heads of Departments (who report to the Heads of Colleges, the Pro Vice-Chancellors) are a key sub-group of Level 3 managers as they are the main feeder group for SLT positions. At the beginning of 2010 women filled just 7 or 23% of these roles compared with 23 or 77% filled by men (with two vacancies).64 Academia
Women comprise 54% of lecturer positions, but there is an immediate drop-off in representation at senior lecturer level, with women comprising just 37% of this group. Women’s representation continues to reduce the further one moves up the academic hierarchy, with women comprising 32% of associate professors and a low 14% of professors.
Table 19: Women’s representation in academia
Women Men
No. % No. %
Lecturer 193 54% 165 46%
Senior lecturer 176 37% 295 63%
Associate professor 36 32% 77 68%
Professor 15 14% 92 86%
63
The guidelines used by the committee in undertaking the review. See p. 16 for more information. 64
Massey University Calendar 2010.
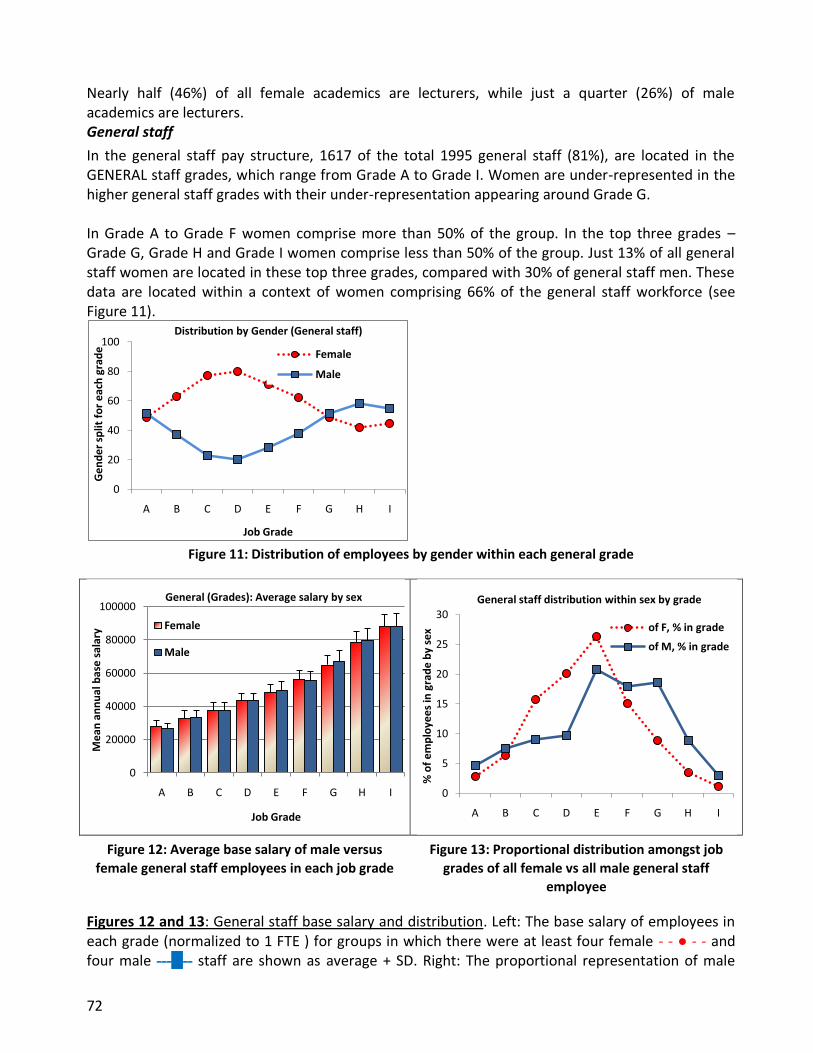
72
Nearly half (46%) of all female academics are lecturers, while just a quarter (26%) of male academics are lecturers. General staff
In the general staff pay structure, 1617 of the total 1995 general staff (81%), are located in the GENERAL staff grades, which range from Grade A to Grade I. Women are under-represented in the higher general staff grades with their under-representation appearing around Grade G. In Grade A to Grade F women comprise more than 50% of the group. In the top three grades – Grade G, Grade H and Grade I women comprise less than 50% of the group. Just 13% of all general staff women are located in these top three grades, compared with 30% of general staff men. These data are located within a context of women comprising 66% of the general staff workforce (see Figure 11).
Figure 11: Distribution of employees by gender within each general grade
Figure 12: Average base salary of male versus
female general staff employees in each job grade
Figure 13: Proportional distribution amongst job
grades of all female vs all male general staff
employee
Figures 12 and 13: General staff base salary and distribution. Left: The base salary of employees in each grade (normalized to 1 FTE ) for groups in which there were at least four female - - ● - - and four male ---█-- staff are shown as average + SD. Right: The proportional representation of male
0
20
40
60
80
100
A B C D E F G H I
Ge
nd
er
split
fo
r e
ach
gra
de
Job Grade
Distribution by Gender (General staff)
Female
Male
0
20000
40000
60000
80000
100000
A B C D E F G H I
Me
an a
nn
ual
bas
e s
alar
y
Job Grade
General (Grades): Average salary by sex
Female
Male
0
5
10
15
20
25
30
A B C D E F G H I
% o
f e
mp
loye
es
in g
rad
e b
y se
x
General staff distribution within sex by grade
of F, % in grade
of M, % in grade

Part B – Findings and conclusion
73
versus female general staff by grade (total male = 549; total female = 1057). 65 The committee also investigated the data for accelerated increments in the past year as shown in Table 20.
Table 20: Accelerated increment (AI) by grade
Grade
% Men in grade (No. in grade)
% Women in grade (No. in grade)
% Men in grade receiving AI (No.)
% Women in grade receiving AI (No.)
Of those in grade receiving AI, % who are men
Of those in grade receiving AI, % who are women
GEN C 23% (50) 77% (170) 6.0% (3) 2.9% (5) 37.5% 62.5%
GEN D 20% (55) 80% (217) 3.6% (2) 7. %8 (17) 10.5% 89.5%
GEN E 29% (114) 71% (284) 2.6% (3) 8.5% (24) 11.1% 88.9%
GEN F 38% (99) 62% (162) 8.1% (8) 6.8% (11) 42.1% 57.9%
GEN G 52% (101) 48% (95) 12.9% (13) 9.5% (9) 59.1% 40.9%
GEN H 58% (50) 42% (36) 6.0% (3) 16.7% (6) 33.3% 66.7%
GEN I 55% (16) 45% (13) 25.0% (4) 15.4% (2) 66.7% 33.3%
Total 34% (549) 66% (1068) 6.6% (36) 6.9% (74) 32.7% 67.3%
Women are over-represented in the lower grades and under-represented in the higher grades; the opposite is true for men. However, general staff women received accelerated progression in proportions equivalent to their representation (66%). This was also true within each grade and within the low-paying and high-paying jobs. Women represented 72% of the employees in grades C, D, E, and F, and received 78% of the accelerated increments awarded to employees in grades C, D, E, and F. Likewise, women represented 46% of the employees in grades G, H, and I and received 46% of the accelerated increments awarded to employees in grades G, H, and I. These data suggest that access to accelerated increments for general staff is not gender biased. However, the Committee recognised that where men and women are at different points on the grade, the current combination of lower starting salaries for female appointees and the operation of accelerated increments will not close the gap. Exploring the issue
Senior management
In small populations such as the Senior Leadership Team, a change of one person can radically affect the percentage representation of women and men, so evidence and judgments about gender equity or inequity generally need to be captured over time. This is perhaps particularly the case for senior management positions in academia where turnover is generally low, especially in PVC positions, where appointments are for a fixed-term with provision to renew. The combination of past appointments of men to these positions, and a low rate of turnover, can mean that change is slow.
65
For more information see Appendix Nine.

74
The representation of men and women in the Senior Leadership Team in the last four years is captured in Table 21.66 In this time there have been only 6 vacancies. The sole PVC vacancy was filled by a woman, and by early 2011 four of the five AVC vacancies were filled by women candidates.
Table 21: Gender representation on the Senior Leadership Team67
Women Men
No. % No. %
January 2007 3 23% 10 77%
January 2008 3 23% 10 77%
January 2009 3 23% 10 77%
January 2010 5 33% 10 67%
August 2010 (1 vacancy) 4 36% 7 67%
It is clear from the information provided above that the previous male over-representation on SLT is in part a function of historical appointments and low turnover of this group, given that in the past four years, women have been appointed to five of the six vacancies that have arisen and that by 2011 the gender balance at that level is 50% women and 50% men.
This change in gender representation on SLT in a relatively short time is extremely positive. Nevertheless, because progress for women has often found elsewhere to be followed by a decline (for example, because changes have been the result of a particular individual rather than been built into the way the organisation operates as a whole), the committee compiled and explored a list of other possible contributing factors to women’s under-representation in SLT.
The fact that there are just 34% of Level 3 managers are women, suggests there are factors contributing to women’s under-representation at this level. Given the change in gender composition that has occurred at SLT level in the past three years, the committee determined that the focus of intervention for the PaEE review should be on women managers at Level 3. The committee identified the following factors as possibly at play for this group:
Barriers within the management culture
Recruitment consultants not putting women forward for senior roles
Women not applying
Women not accessing appropriate training and development
Massey University not deliberately preparing women for senior roles
The position does not accommodate family responsibilities. Academia
The PaEE review committee identified a range of possible factors that may be contributing to the over-representation of women in the lower levels of academia and under-representation in the more senior levels, in an attempt to ascertain whether the difference could be a) explained, and b)
66
This information excludes the Vice-Chancellor. (Massey had a female Vice-Chancellor 2003–2008, and a male since then). 67
Information provided by HR.
Part B – Findings and conclusion
75
justified. Those factors judged as not contributing to the over-representation of women at lower levels and under-representation at senior levels were:
Gender differences in level of qualification
Recruitment consultants not putting women forward for academic positions Those factors judged as contributing to this gendered pattern of participation in academia are discussed next. Appointment issues An issue that came through strongly in the survey was concern about gendered appointment processes. This has two aspects – starting pay rates; and gendered processes that impact on the particular position, and the step or placement within the range. Starting pay rates for the previous two years are discussed in relation to professors in Part B.2 and in detail in the next section B.6. These sections show that there are differences in average starting salaries for professors, tutors and senior tutors, but not for lecturers and senior lecturers. The second aspect is more difficult to track. This aspect is concerned with whether women are appointed to the correct level in the first place, and how this compares with appointment levels of ‘equivalent’ male academics. There were a number of responses to the open-ended survey questions that explicitly raised this issue, such as the following examples: It appears to me that men with similar skills and abilities are employed, starting on higher steps up the salary scale, and not expected to carry as high a teaching workload as female peers in the same college. Q31, Line 942 For academic staff, I believe the most discrepancy in gendered pay stems from the level of the original appointment for women. More women are appointed at lower pay to begins with than are men. This original appointment then has detrimental effects that last the entire career. Q31, Line 404 I think women staff members are ill-advised about their worth when they set their first contract with the university and will consequently, unlike men, agree to start on a lower salary level than men, which makes it very difficult for them to ever catch up. I also consider that there is little or no guidance for women staff members within their school setting, that encourages them to seek promotion. That has certainly been my experience. Q31, Line 1414 One section of the survey asked staff appointed in the last 24 months whether they considered they were appointed on the appropriate level on appointment. A slightly higher proportion of women than men (35% compared with 32%) felt this was not the case. In raw numbers this is 370 women compared with 226 men, and for academic staff, 101 women and 112 men. However, of this group of 113 academic staff, slightly more women than men believed that their appointment had left them with a long-standing anomaly that disadvantaged them (61 compared with 58). The committee considered that further exploration of appointment process was justified.

76
Development issues Another issue expressed strongly in the survey was the fact that women do not have access to appropriate mentoring and support. In some cases there is no mentoring for any staff, male or female; in some cases, there appears to be active discrimination in favour of men; and in some cases the relatively fewer numbers of senior women results in a form of indirect discrimination against women, as illustrated in the following comments. Personal experience – there is no mentoring or encouragement in this school, it appears that the person who is supposed to advocate for me in the promotion round does not have a good idea what I do or contribute and therefore cannot argue for me effectively. Q64, Line 719 One of the most disheartening experiences is to see young men being actively mentored by senior managers – and then promoted on the basis of that mentoring! There are few, if any, opportunities for mentoring of women. Q31, Line 462 In my experience, informal mentoring is available, but that only helps academic staff who already have good networks in place and who feel they can ask senior staff (apart from their own manager) for advice. It has taken some time for me to develop good relationships with senior staff in my school, and that is largely helped by all of the little things that encourage collegial relationships: school seminars on research and teaching, co-supervision and working together on committees, social events, chats in the lunch room, and so on. It's important to feel that there is at least one senior staff member who is keen to see you succeed. Q64, Line 632 Issues in relation to the promotions process Issues in relation to the promotions process include concerns that the promotions process is less fair to women (including criteria for promotions, the operation of the academic promotion committees, any inhibitions on promotion, e.g., budgets), and women not applying for promotion in proportion to their representation in the eligible pool. (This issue is not pursued further here but is discussed in detail in the section on academic promotions.) A gendered workplace and management culture Question 64 of the PaEE review survey asked respondents “Why do you believe the promotions process at Massey University is or isn’t fair to women?” As well as specific comments in relation to the promotions process, many respondents described a gendered workplace culture that was disadvantageous to women. These responses were grouped into the following categories:68
promotion blocked by male manager
experience of male colleague being promoted with nothing to support it
personal experience of discrimination
male norm or anti-female prejudice
male manager actively working against/not supporting the advancement of women
68
These categories were developed as part of the code-frame for the open-ended question in the survey, as described on p. 22. A summary of responses for each of these questions is available as a supplementary paper.

Part B – Findings and conclusion
77
discriminatory /gendered practices by men towards women. The comment below is provided as an example. Other comments in this area have not been included here as many contain personal experiences that may be identifiable. In my experience women, particularly middle-aged women, are given fewer opportunities for advancement beyond senior lecturer, are not recognised for their achievements and are exposed to quite blatant sexism. I see this not only in my own direct experiences but also in other women. Q31, Line 462 The committee considered that another possible factor was the discipline area(s) in which women are, and are not, located, and that the type of work that women do is undervalued. I think the criteria most greatly valued favour people who spend less time with students and more time on research. I think some disciplines are regarded as 'soft' and not valued and this is a gendered perspective. Q64, Line 150 General staff
The particular issue that needed exploring by the committee in relation to general staff women, was why women are generally not progressing into jobs at and beyond Grade G. This discussion has considerable overlap with the issues raised in the previous section, Part B.3, in relation to occupational segregation, and these sections should be read together. Those factors judged by the committee as not contributing to the over-representation of general staff women at lower levels and under-representation at senior levels were differences in pay structures for men and women. Factors considered as contributing are listed next. Undervaluing of women’s work/job sizing issues
Survey comments from women suggest that some of the jobs they currently do are undervalued (as in the quotation below), and it is conceivable that the re-sizing of jobs using the new job evaluation system could in itself, create a revision in the current relativities in different jobs that are traditionally men’s work and women’s work. Personally, I don't believe that I am on an appropriate grade for the responsibilities of my position. Certainly, the salary does not reflect my experience, knowledge, and skills for the particular position I am employed. I also take on new tasks, and additional responsibilities as the workload increases and the additional services our section provides increases. Whether this is because I am female, I am unsure. ….I know of males within the organisation who are on much higher salaries than me, but do not have, in my opinion, higher responsibilities than me. Q31, Line 844

78
Appointment issues As discussed above in relation to academic women, there were a number of comments in the survey about the influence of gender in recruitment practices. Many of the issues raised relate to the discretion of individual managers in recruiting and setting starting salaries; this issue is discussed in detail in the next section, B.6. I think that women are scrutinised more when it comes to qualifications or experience. Whereas a male would start at a higher pay rate, women would start at the base or even a lower grade. Q31, Line 1167 Lack of career development
While lack of a career path is an issue experienced by both male and female general staff, women expressed an inability to access appropriate career development, and a view that Massey University is not deliberately preparing enough women for more senior roles. Lack of availability of part-time work The representation of women in general staff positions falls off in more highly-paid management positions, presumably large jobs. While some staff, male and female, will always chose not to pursue a career to this level, women’s options to do so can be limited (if they have family responsibilities) by the inability to undertake these positions part-time. Section B.8 of this report, discusses the way in which part-time work options at Massey University do not meet the needs of the range of women workers. A gendered workplace As discussed in the previous section, B.3, a gendered workplace was considered by survey respondents to contribute to women’s lack of progression. This is discussed further in section B.10.

Part B – Findings and conclusion
79
5. Women’s starting salaries are lower than those of men
Exploration of gender differences in starting salaries has been an area of focus for PaEE reviews since early reviews in the Public Service first identified this issue. At that time, this was a surprise finding, as until then the assumption and expectation had been that men and women appointed to the same job with the same skills were starting on the same pay. The need to pay attention to this issue was reinforced in 2010 with the release of a study69 showing income differences in male and female graduates from the point that they enter employment, and which increase over time. Key findings70 from this paper were that, while women are graduating in increasing numbers with 62 per cent of all bachelors’ graduates in 2006 being women:
there is an average income gap of around 6% between men and women with a bachelor’s qualification or above just one year after entering employment
there is an increase in this gap to 17% after five years (2002–2006). The facts
This aspect of the review focuses on starting pay rates for the same jobs. Data available71 for the last two years in relation to average starting salaries for men and women show a tendency for female appointees to be paid less than men. To investigate this issue at Massey University the committee considered all occupations in which more than one staff member had been employed between December 2007 and December 2009. The general staff positions in Table 22 are the ANZSCO categories (each of which may include multiple Massey University job categories and/or multiple general staff Grades), and the academic staff positions are those used in the collective agreement. There were 28 occupations listed. Of these 11 occupations were removed from analysis:
eight were single sex categories
three were categories which included both men and women but data were suppressed because of fewer than three men or women in any cell.
This left 17 categories populated by both men and women that were considered by the committee. Using the threshold of 5% difference as the point at which gender differences in pay must be explored (see discussion earlier in this report), the committee found the following:
gender pay differences favouring men, ranging from 5% to 16%, in 8 occupations
a gender pay difference of 9% favouring women in 2 occupations.
These differences are detailed in Table 22, beginning with the largest variance favouring men and ending with the largest variance favouring women.
69
Ministry of Women’s Affairs (2010). Analysis of Graduate Income Data 2002-2007 by Broad Field of Study. 70
Ibid, p. 6. 71
The number of appointees of both genders to any particular occupation over such a short period is small – just 17 occupations – so these data need to be treated with some caution. There were, however, more than four men and women in 16 of the 17 occupational groups.

80
Table 22: Gender pay differences in starting salaries
Job Titles Average Variance F to M Number of Staff
M F Amount Variance
% Variance
M F Total
Program or Project Administrator
$55,623 $47,878 $7,745 16% 8 20 28
Tutor $56,961 $50,292 $6,669 13% 9 23 32
ICT Customer Support Officer $34,010 $29,820 $4,189 12% 18 11 29
Postdoctoral Fellow $62,530 $58,867 $3,663 6% 17 20 37
Education Advisers and Reviewers
$72,879 $68,719 $4,160 6% 3 11 14
Senior Tutor $72,441 $69,316 $3,124 5% 15 15 30
General Clerk $39,445 $37,530 $1,915 5% 4 32 36
Science Technicians nec $42,925 $41,032 $1,893 5% 7 7 14
Life Science Technician $40,402 $39,205 $1,196 3% 9 9 18
Junior Research Officer $52,123 $50,869 $1,253 2% 4 8 12
Teacher of English to Speakers of Other Languages
$54,134 $53,683 $451 1% 6 11 17
Shelf Filler $26,251 $26,214 $37 0% 4 8 12
Senior Lecturer $84,446 $84,800 $354 0% 22 12 34
Lecturer $69,355 $69,111 $245 0% 23 21 44
Library Assistant $28,102 $29,059 $957 3% 10 23 33
Research Officer $60,292 $65,612 $5,320 9% 8 8 16
Welfare Support Workers $26,379 $28,897 $2,518 9% 16 24 40
Total 183 263 446
Exploring the issue
All positions at the University are assigned to a grade prior to recruitment, and the step and starting salary for an appointee are theoretically determined by an assessment of the appointee’s skills, knowledge and experience. Anyone at a lower step in a grade, and consequently receiving less money, should have a lower skill or experience base than others paid more. Some of the gender-based reasons for why this may not occur include: women being offered less than men, women being younger than men and salary levels being formally or informally associated with age, women accepting what they are offered, men coming from higher paying jobs and being unwilling to take the ‘rate for the job, men negotiating harder/exerting greater bargaining power. The focus of concern in relation to this issue is therefore the appointment process. The PaEE review committee determined that gender inequity might be occurring at the organisational level and at the individual manager level. Evidence for this concern came from staff experience both within the committee and through open-ended questions in the PaEE review survey.
Part B – Findings and conclusion
81
The organisational factors of most concern to the committee related to the lack of a moderation role (e.g., by peers or by HR), given the devolution for the appointment of staff to individual managers. In particular, the committee was concerned with the need to moderate:
How the grade for the position is set
Whether individual managers can make appointment decisions without reference to anyone else
Whether appointment decisions are moderated
Whether there is a tendency to pay the lowest salary rather than paying fairly
The starting rates paid for the same jobs. Individual manager practices considered by the committee to be potentially of concern include:
The initial starting salary offered, and whether it relates solely to the person’s skill and experience and relativity with other staff, or whether judgments about the possibility of getting someone ‘more cheaply’ are employed (e.g., offering less because women are coming to Massey University from lower pay rates in their current job or returning to work from no pay or low pay)
The extent to which individual managers are or are not flexible about setting starting salaries (and therefore the extent to which those who negotiate harder – typically men – may be advantaged, or women feel forced into trade-offs such as lower pay for more flexible hours)
The availability of information so candidates can make an informed judgement about what they are being offered. For example, academic candidates need to be given information about the promotions process in order to understand the implications of accepting a low salary.
I believe that where men and women are first appointed at the cusp on lecturer/senior lecturer scales, that men are more likely to be appointed to senior lecturer and women to lecturer. Even if their appointment salaries are similar, this appointment scale anomaly means that men will progress more quickly within the senior lecturer scale, and women stagnate for several years trying to even get on the senior lecturer scale. Female academic, PaEE review survey The three occupations with a starting salary gender pay gap of more than 10% – programme or project administrators, ICT customer support officers, and tutors – were investigated further by the committee, as well as the two favouring women (as exceptions to the pattern). This investigation confirmed the size of the gender pay gap for tutors and the need for this to be addressed specifically in the action plan and this is discussed in greater detail. For programme or project administrators and ICT customer support officers, it was found that these categories comprised a mixture of levels of jobs, and when like jobs were compared with like, the gender pay differences were lower (between 3% and 6%) (for further details see p. 74). The average starting salary in two positions favoured women by 9%. Research officer positions tend to be fixed-term positions relating to specific research projects of limited duration, with available

82
salaries related to levels of funding for the project. As a result it is expected that starting salary data over time would be quite volatile/changeable. The Welfare Support Worker category is an ANZSCO classification that is dominated by residential supervisors/halls supervisors. These are part-time, low-paid positions, typically filled by mature students fitting their part-time duties in the hostels around their study.
Tutors
Further investigation confirmed the gender pay gap in starting salaries for tutors of 13% or $6,500. The tutor category is the same for both ANZSCO and Massey University job titles. In the last two years there were 32 new tutors employed at Massey University. Of the 32 tutors, 9 were men and 23 were women. The average pay for men however, was substantially higher, with men paid on average, $57,000 and women paid on average $50,300. This is a salary difference of $6,700, a pay difference of 13%.
The starting salary data were analysed by campus. This showed that the gender difference in starting salaries for tutors occurred at all campuses though higher in Manawatu, with a pay gap of $4,000 in Albany, $9,000 in Manawatu, and $4,000 in Wellington.
Table 23: Gender variance in starting salaries of recently-appointed tutors by campus
Location / Job Title Average Starting Salary - Tutors Staff Numbers
M F Amount Variance
% Variance
M F Total
Albany $54,627 $51,063 $3,564 7% 2 6 8
Manawatu $59,091 $49,614 $9,477 16% 4 13 17
Wellington $55,677 $51,338 $4,339 8% 3 4 7
Figure 14: Gender variance in starting salaries of recently-appointed tutors by campus
30000
35000
40000
45000
50000
55000
60000
TutorAlbany
TutorManawatu
TutorWellington
Sala
ry
Average starting salary
Male
Female
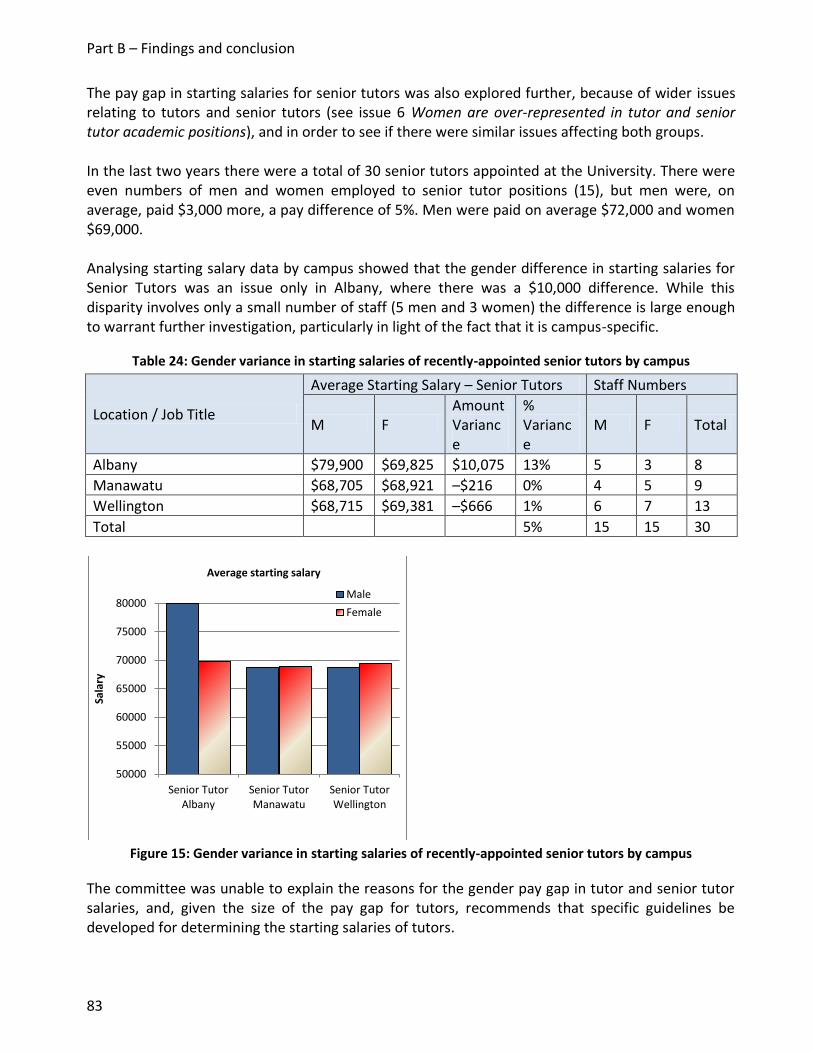
Part B – Findings and conclusion
83
The pay gap in starting salaries for senior tutors was also explored further, because of wider issues relating to tutors and senior tutors (see issue 6 Women are over-represented in tutor and senior tutor academic positions), and in order to see if there were similar issues affecting both groups. In the last two years there were a total of 30 senior tutors appointed at the University. There were even numbers of men and women employed to senior tutor positions (15), but men were, on average, paid $3,000 more, a pay difference of 5%. Men were paid on average $72,000 and women $69,000. Analysing starting salary data by campus showed that the gender difference in starting salaries for Senior Tutors was an issue only in Albany, where there was a $10,000 difference. While this disparity involves only a small number of staff (5 men and 3 women) the difference is large enough to warrant further investigation, particularly in light of the fact that it is campus-specific.
Table 24: Gender variance in starting salaries of recently-appointed senior tutors by campus
Location / Job Title
Average Starting Salary – Senior Tutors Staff Numbers
M F Amount Variance
% Variance
M F Total
Albany $79,900 $69,825 $10,075 13% 5 3 8
Manawatu $68,705 $68,921 –$216 0% 4 5 9
Wellington $68,715 $69,381 –$666 1% 6 7 13
Total 5% 15 15 30
Figure 15: Gender variance in starting salaries of recently-appointed senior tutors by campus
The committee was unable to explain the reasons for the gender pay gap in tutor and senior tutor salaries, and, given the size of the pay gap for tutors, recommends that specific guidelines be developed for determining the starting salaries of tutors.
50000
55000
60000
65000
70000
75000
80000
Senior TutorAlbany
Senior TutorManawatu
Senior TutorWellington
Sala
ry
Average starting salary
Male
Female

84
6. Women are over-represented in tutor and senior tutor academic positions
The facts
Women are over-represented in both tutor and senior tutor positions. There are 55 female tutors and 21 male tutors at the University, and 68 female senior tutors compared with 56 male senior tutors. Women comprise 72% of tutor positions and 55% of senior tutor positions.
Women’s over-representation in these positions matters because these positions are “non-career” academic positions. Because there is no direct promotion from a senior tutor position to a lecturer position, there is also no promotion or direct career path to more senior academic roles. In addition, 28% of all senior tutors and 53% of all tutors are on fixed term contracts, as detailed in Table 25, which mean that many tutors and senior tutors face a double disadvantage. (See the section on fixed-term agreements for discussion about the disadvantages of this form of employment.)
Table 25: Number and percentage of tutors on fixed-term contracts by gender
Male Female Total
Number Number and % on fixed-term agreement
Number Number and % on fixed-term agreement
Number Number and % on fixed-term agreement
Senior Tutor 56 14 (25%)
68 21 (31%)
124 35 (28%)
Tutor 21 13 (62%)
55 27 (49%)
76 40 (53%)
All Tutors and Senior Tutors
77 27 (35%)
123 48 (39%)
200 85 (43%)
Half (31)72 of all female tutors and a quarter of male tutors (7) are on the top step of the pay scale, and an even higher numbers of both male and female senior tutors (36 men and 37 women) are at the top step of the scale. The tutor and senior tutor scales then, appear to operate as a structural barrier to those who wish to pursue full academic careers. Exploring the issue
The PaEE review committee found the issue of women’s over-representation in tutor and senior tutor positions to be a complex and problematic area, with a considerable amount of contested information and perceptions about the role. The committee looked at this issue both generally and specifically. By generally we mean there are a number of issues that are particular to the tutor and senior tutor positions per se, that are problems for both male and female incumbents in this role. Central to this was the contested view about the role of tutors. While there is a clear organisational view that tutor positions are intended to be teaching positions, there seems to be equally clear evidence that, in practice, tutors are undertaking a number of functions, at times including research, and can be carrying out other
72
There are a slightly larger number of people on the tutor grade, than there are whose job title is ‘tutor’. This accounts for the total number of women tutors who have the job title of tutor (55), and the number of women who are paid in the tutor grade (62). Despite this slight variation, the issue under discussion remains valid.

Part B – Findings and conclusion
85
components of a lecturer role. This means that the difference between a tutor and a lecturer role is clouded, and raises a question about whether staff in these roles are being remunerated fairly. … I am regularly told by senior managers within the College that I contribute to the university's strategic achievements (through university duties and my collegiality within the Institute) at a level far beyond what I am remunerated for… I consider that I deliver far more to the university than what I am currently remunerated for, and for the senior tutor designation. Male, academic staff member Certainly there seems to be a common perception among those holding the positions, that tutor and senior tutor roles are stepping-stones to becoming a career academic, and some tutors commented that they had been ‘sold’ the position, by employing managers, in this way. I joined Massey as a Senior Tutor with (at interview) the promise of eventually becoming a Lecturer (PBRF active) upon completion of a degree. I have since [completed the degree], but have recently been advised that I cannot (full stop) be promoted without my role being made redundant and a new Lecturer role advertised and competed for thus gambling my career, should I choose for that to happen. I am stuck at the top of the Senior Tutor pay scale and denied the opportunity to research and develop, which was a cornerstone of my decision to join the Massey community. Please look into this bridge from Senior Tutor to PBRF activity and verbal agreements made at interview not honoured. Male, academic staff member In her paper Trapped in the ivory basement: effort – reward imbalances among non-career academics, Celia Briar notes that most tutors and senior tutors in New Zealand universities are doing the same range of work in teaching as lecturers, and are often also involved in research (whether or not this is recorded in PBRF) but have no ability to apply for promotion to a lecturer or senior lecturer position. She identified feeling stuck and experiencing a lack of career advancement opportunities as being a key issue for tutors and senior tutors.73 This issue also emerged in the Massey University survey. My main issue relates to the fact that, as a senior tutor, my only opportunity for advancement lies in applying for the academic role above that which I currently occupy. In order to apply for a lecturer role I am told I need a Masters degree. However I see others appointed to that role from outside the university without that qualification. Advancement to higher positions the university for me is based ONLY on my research status, a situation which ignores other areas of responsibility and achievement which do not qualify me for progression to a higher position and pay scale. Male, academic staff member In considering the general issue of tutors and senior tutor roles per se, which relates to these being non-career academic positions, there appear to be a number of ways Massey University in which may be contributing to incumbents being stuck in these positions, such as:
A lack of clarity about the difference between what tutors do and what other academics, such as lecturers, do – and which may vary between colleges and schools, or campuses
In recruitment practices, failing to provide adequate information about the limitations of a career path associated with these positions.
73
In Briar, C. (ed.) (2009). Hidden Health Hazards in Women’s Work. Palmerston North: Dunmore Publishing, pp. 125–130.

86
If these generic issues in relation to tutor and senior tutor positions can be addressed, it is anticipated that this will make a positive difference for both male and female position-holders. Specifically, the committee considered the preponderance of women in both tutor and senior tutor roles, and what might be contributing to this situation. While the problem of being trapped in a “non-career” position does not apply only to women, Briar argues that women are more likely than men to have been recruited into academic jobs that have no career ladders74 and are often fixed-term. Many women attracted to an academic career take one of these positions and it appears it is rarely explained that they do not offer any opportunity for promotion into senior academic positions. Women at Massey University also appear to have a greater sense of barriers that prevent them moving on from these positions than do men, as illustrated by these tutor and senior tutor responses to the PaEE review survey question “There is an obvious career path from my current position at Massey University.” Fifty-four per cent of male tutors and 50% of male senior tutors agreed or strongly agreed to this proposition, compared with 24% of female tutors and 26% of female senior tutors. I am now at the top of the scale for senior tutor and have, at the suggestion of a male colleague, sought through the PRP process to suggest that as I cannot apply for promotion then some other form of remuneration and professional development would be appropriate. This has been ignored in general and a specific request for [career development] turned down as too expensive. To me such a process/reward would affirm my continued commitment to the students and my work. Otherwise I just stagnate at this level. Female, academic staff member Issues of career paths for certain staff such as tutors/senior tutors need to be highlighted and a way forward to establishing a career path developed as soon as possible. Female, academic staff member The committee identified a range of possible organisational factors that may have contributed/be contributing to the over-representation of women tutors and senior tutors, in order to ascertain whether the difference could be a) explained, and b) justifiable. Those factors judged as unlikely to be contributing to women’s over-representation in this area were:
Level of qualification
Level of experience.
An organisational factor that the committee considered likely to be operating in a gendered way at the University, and to be contributing to the preponderance of women in tutor and senior positions is:
Gendered organizational or managerial views and assumptions, for example, that women may actively want and choose these positions or that non-career jobs suit women with family responsibilities.
74 Ibid, p. 120.
Part B – Findings and conclusion
87
Briar’s research directly counters the possible explanation that these positions may have been actively chosen, and finds staff in these positions work hard to gain experience and prove themselves, with demoralising lack of progress.75 Managerial assumptions about ‘what women want in employment’ and the lack of opportunities to move into career academic positions are key issues that need to be addressed if women’s over-representation in both tutor and senior tutor positions is to be addressed.
75 Ibid, p. 120.
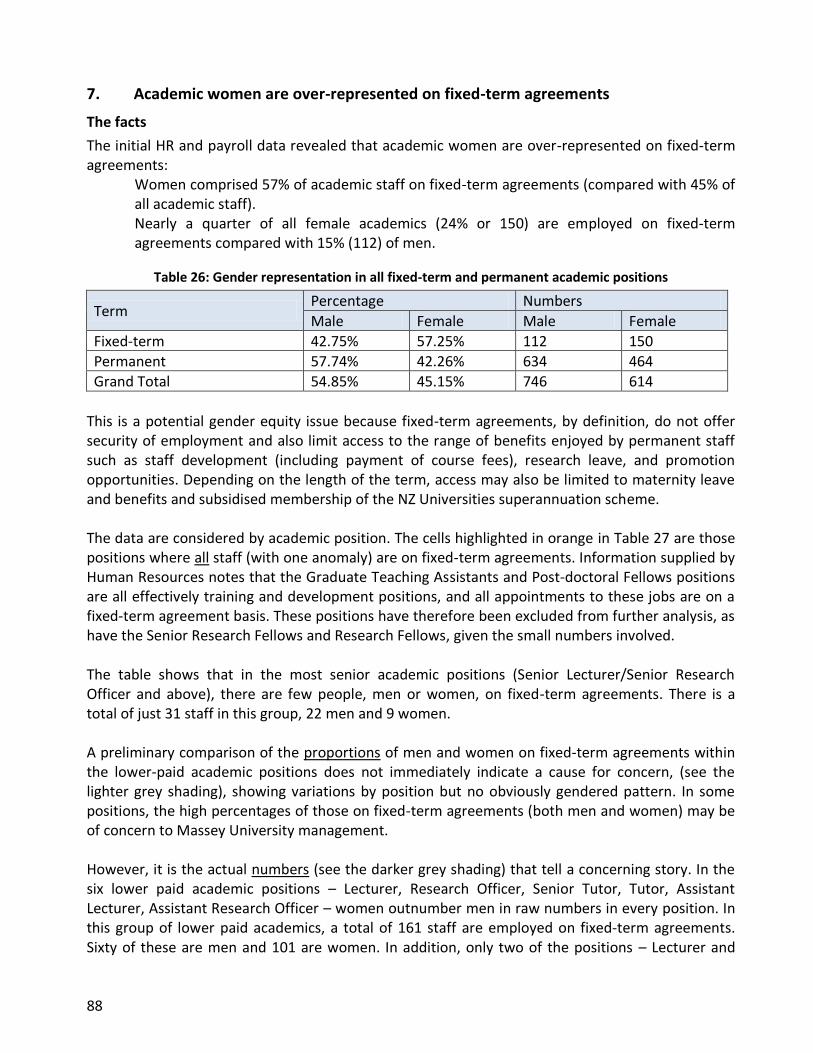
88
7. Academic women are over-represented on fixed-term agreements
The facts
The initial HR and payroll data revealed that academic women are over-represented on fixed-term agreements:
Women comprised 57% of academic staff on fixed-term agreements (compared with 45% of all academic staff). Nearly a quarter of all female academics (24% or 150) are employed on fixed-term agreements compared with 15% (112) of men.
Table 26: Gender representation in all fixed-term and permanent academic positions
Term Percentage Numbers
Male Female Male Female
Fixed-term 42.75% 57.25% 112 150
Permanent 57.74% 42.26% 634 464
Grand Total 54.85% 45.15% 746 614
This is a potential gender equity issue because fixed-term agreements, by definition, do not offer security of employment and also limit access to the range of benefits enjoyed by permanent staff such as staff development (including payment of course fees), research leave, and promotion opportunities. Depending on the length of the term, access may also be limited to maternity leave and benefits and subsidised membership of the NZ Universities superannuation scheme. The data are considered by academic position. The cells highlighted in orange in Table 27 are those positions where all staff (with one anomaly) are on fixed-term agreements. Information supplied by Human Resources notes that the Graduate Teaching Assistants and Post-doctoral Fellows positions are all effectively training and development positions, and all appointments to these jobs are on a fixed-term agreement basis. These positions have therefore been excluded from further analysis, as have the Senior Research Fellows and Research Fellows, given the small numbers involved. The table shows that in the most senior academic positions (Senior Lecturer/Senior Research Officer and above), there are few people, men or women, on fixed-term agreements. There is a total of just 31 staff in this group, 22 men and 9 women. A preliminary comparison of the proportions of men and women on fixed-term agreements within the lower-paid academic positions does not immediately indicate a cause for concern, (see the lighter grey shading), showing variations by position but no obviously gendered pattern. In some positions, the high percentages of those on fixed-term agreements (both men and women) may be of concern to Massey University management. However, it is the actual numbers (see the darker grey shading) that tell a concerning story. In the six lower paid academic positions – Lecturer, Research Officer, Senior Tutor, Tutor, Assistant Lecturer, Assistant Research Officer – women outnumber men in raw numbers in every position. In this group of lower paid academics, a total of 161 staff are employed on fixed-term agreements. Sixty of these are men and 101 are women. In addition, only two of the positions – Lecturer and

Part B – Findings and conclusion
89
Research Officer – can progress through the full academic scale. The University recruits more women than men into fixed-term, often ‘non-career’, academic positions. It is unclear why.
Table 27: Number and % of academic staff on fixed-term agreements by position and gender
Total no. staff at each level
No. staff on fixed-term agreements at each level
% staff on fixed-term agreements at each level
Male Female Male Female Male Female
Professor 92 15 9 2 10% 13%
Associate Professor 77 36 4 1 5% 3%
Senior Lecturer 282 169 5 4 2% 2%
Senior Research Officer 12 6 4 2 31% 29%
Clinician 0 1 - - - -
Lecturer 134 154 11 15 8% 10%
Research Officer 31 39 15 19 48% 49%
Senior Tutor 56 68 14 21 25% 31%
Tutor 21 55 13 27 62% 49%
Assistant Lecturer 3 13 2 10 64% 77%
Assistant Research Officer
8 19 5 976 63% 47%
Post-doctoral Fellow 24 30 24 29 100% 97%
Graduate Teaching Assistant
4
9
4 9 100% 100%
Senior Research Fellow 1 1 1 1 100% 100%
Research Fellow 1 1 1 1 100% 100%
Total 746 614 112 150 15% 25%
Exploring the issue
Some of the reasons that Massey University uses fixed-term agreements in the six positions identified above are:
at the lecturer level most fixed-term agreements are related to providing cover for staff on parental leave or for temporary assistance with peaks of work
at the research officer/assistant research officer level most fixed-term agreements are related to a specific research project of limited duration
the assistant lecturer level is effectively a training and development position
at the tutor and senior tutor level fixed-term agreements are used to assist with peaks of work, to cover for a career academic working on a specific research project, or for other absences.
76
The data show two more female Assistant Research Officers but for some reason these have not been classified as ‘Academic’ in the database, and
so are excluded here.

90
These data, then, would seem to indicate that the over-representation of women on fixed-term agreements is due to the intersection of:
Fixed-term agreements being used more frequently in lower paid academic positions
More women being recruited into fixed-term positions (usually lower paid academic positions and often ‘non-career’ positions).
In order to understand whether or not there is any gender bias in the use of fixed-term agreements, and the recruitment of women to these positions, it would be useful to undertake further investigation in the following two areas. 1. The use of fixed-term agreements
HR staff have provided the following information on fixed-term agreements at Massey University: The area of fixed-term agreements is governed by Section 66 of the Employment Relations Act 2000 which requires that a fixed-term employment agreement must be for "genuine reasons based on reasonable grounds", that the employee must agree to those reasons, and that those reasons and the way the employment agreement will end be recorded in writing as part of every fixed-term employment agreement. Genuine reasons based on reasonable grounds can be broadly defined as:
Projects of a specific and limited duration
Additional labour for specified peak workload periods including seasonal work
Covering for absences (for example parental leave, sick leave)
Development opportunity positions (Assistant Lecturers, Supernumerary positions, etc.) At Massey we also have contractual definitions for "Casual" and "Fixed-term" which use a period of 4 weeks employment as the dividing line between the two categories so that a fixed-term employee is defined as an employee who will work for a fixed period of more than four weeks with a specified end date. This work is not "as and when required" or casual work. It is work that provides employment for a specified period or reason and is of more than four weeks duration. Given the ‘rules’ governing fixed-term employment, it would be useful to explore what actually happens in practice. Possible avenues for exploration of the use of fixed-term agreements include:
Taking a sample of current fixed-term agreements and checking that they meet the test of ‘genuine reasons based on reasonable grounds’
Reviewing all fixed-term agreements over the past two years to identify how many fixed-term agreements have been used to cover parental leave/sickness/specific projects, etc.
Investigating the extent to which the practice of ‘rolling agreements’ has been satisfactorily addressed by recent action by Massey University particularly with respect to tutors and senior tutors77
Investigating how this relatively high use of fixed-term agreements compares with other universities
77 This would mean investigating the number of staff currently on a fixed-term agreement who have previously been employed on a fixed-term agreement.

Part B – Findings and conclusion
91
Monitoring the issue of supply and demand for these positions, by collating data in relation to the numbers of women and men who apply, are interviewed, and appointed to specific fixed-term positions, for example, tutors and senior tutors.
2. Over-representation of academic women in fixed-term positions (usually lower-paid positions and often ‘non-career’ positions) It is likely that there is a complex set of factors contributing to the over-representation of academic women in fixed-term, lower paid ‘non-career’ positions. Choice by women who are the primary caregivers is widely considered to be a factor here (on the assumption that such work fits with their family responsibilities) but the extent of this is uncertain, and logically it makes more sense that part-time work is the main attraction for women with family responsibilities rather than a job that is time-limited. Celia Briar’s research into non-career academics,78 demonstrated that many of the common assumptions about why women accepted non-career jobs and why they stayed in them were inaccurate. (Such assumptions included that they knowingly accepted a job without career prospects, that such jobs suited them because of care-giving responsibilities, that they did not have career aspirations, that they were not qualified for career jobs in academia, and that they were happy with their work, pay and prospects.) In relation to fixed-term agreement positions, there seem to be a similar number of explanations about why these may suit women, and it would be useful to explore what is actually the case. Often these issues are very inter-related, as demonstrated in the following comment. I am a non-permanent (contracted) part-time academic….I do believe that mothers of young children, like me, are often committed to staying part-time and are less flexible as to where they work, and that these factors keep them in non-permanent positions. Furthermore, it is no secret that in most universities the contracted Lecturers and Tutors do a bulk of the undergraduate teaching so as to free up time for permanent staff to conduct research. Many of those who stay in these impermanent teaching positions are mothers, for the reasons of inflexibility given above. Because as a non-permanent Lecturer one has no access to research funding, it is almost impossible to publish in this situation, which in turn keeps one in a non-permanent position. Even if a permanent job is advertised, it is unlikely a woman who has taught part-time over a long period of time, with little opportunity to research and publish, would get the job... I think this is the real issue for working mothers. It is not that one is discriminated against as such, it is simply that the way the system operates keeps part-time non-permanent academics part-time and non-permanent. I am pretty certain that research will show that most of these long-term part-time contract Lecturers are women and mothers, and I know from experience that these working mothers pretty soon feel as though they will never be able to get on with their work, while burning out as teachers of big undergraduate courses. What a waste of talent and passion! Q100, Line 1266
78
Briar, C, (2009)‘Trapped in the ivory basement: Effort-reward imbalances amongst non-career academics’, in Briar, Celia (ed.) Hidden Health Hazards in Women’s Work, pp. 134, 135.
92
It seems clear that the University needs to understand more clearly:
the factors that are contributing to large numbers of women being appointed on fixed-term agreements, specifically whether there are organisational factors that are channelling academic women into fixed-term agreements
whether the ‘training’ assistant lecturer positions result in women progressing into full academic careers.
Processes for exploring this issue further could include:
Discussing with managers who employ staff on fixed-term agreements, their understanding of the appropriate use of fixed-term agreements, and their views on whether this is the most effective way of structuring work and roles
Running a series of focus groups with women on fixed-term agreements, exploring this issue.

Part B – Findings and conclusion
93
8. Part-time work options do not meet the needs of the range of women workers
The facts
A total of 718 staff work part-time at Massey University. Women are over-represented in part-time work in the workforce relative to their representation in the overall population:
Women comprise 56% of the workforce and 68% of those who work part-time. A total of 486 women and 232 men work part-time.
Women comprise 45% of academic staff overall, and 59% of academic staff who work part-time. A total of 161 female academics work part-time compared with 111 male academics.
Women comprise 64% of general staff overall, and 73% of general staff who work part-time. A total of 325 female general staff work part-time compared with 121 male academics.
Exploring the issue
Part-time work is a workplace flexibility option accessible by both male and female workers. However the fact that women still undertake the primary family caring roles in most cases,79 and use part-time work as a way of being able to manage both this responsibility and the need to bring in an income, makes this an issue of particular importance for women. The questions the committee explored in considering whether there were gender equity issues that Massey University might need to address in the provision of part-time work included:
How readily available part-time work is across all occupations
Whether it is possible to develop and build one’s career using part-time work
How satisfied women are in part-time work. 1. How readily available is part-time work across all occupations The following two tables provide a breakdown of where the majority of part-time positions are located. Table 28 shows part-time work for academic staff is concentrated at tutor, senior tutor, lecturer and senior lecturer levels. These positions account for 212 staff or 81% of all those who work part-time. While there are a number of staff working part-time in other academic positions it is not clear how readily available part-time work is in these other positions.
Table 28: Number of academic staff in part-time work by gender
Female Male All staff
Academic staff total 157 105 263
Professor 2 15 17
Associate Professor/Reader 5 8 13
Senior Research Fellow/Post-Doctoral Fellow 4 2 6
Senior Lecturer/Senior Research Officer 19 23 42
Lecturer/Research Officer 43 19 62
79
See Statistics NZ (2001). Gender and unpaid work: findings from the Time Use Survey http://www.stats.govt.nz/browse_for_stats/people_and_communities/time_use/gender-and-unpaid-work.aspx Forty-three per cent of Massey female survey respondents and 41% of male survey respondents said that they spent time caring for others. However, 56% of women said that this caring role took 30 hours a week or more compared with 31% of men.

94
Senior Tutor 29 24 53
Tutor 45 10 55
Assistant Lecturer/Assistant Research Officer 7 4 11
Graduate Teaching Assistant 3 1 4
Table 29 shows that part-time work for general staff is concentrated in a few main (ANZSCO) groupings (in descending order). The remaining 163 part-time work positions are spread over 50 (ANZSCO) occupational groupings, with often just very small numbers (between 1 and 3 part-time positions) in these areas.
Table 29: Number of general staff in part-time work by gender
Female Male All staff
General staff total 325 121 446
Library Assistant 39 11 50
Welfare Support Workers (mostly Residential Advisors) 23 17 40
ICT Customer Support Officer 15 21 36
Teacher of English to Speakers of Other Languages 17 3 20
Programme or Project Administrator 17 2 19
Shelf Filler 9 7 16
Nurse Educator 16 16
Clerical and Office Support Workers nec 13 2 15
Miscellaneous Education Professional 8 5 13
Secretary (General) 13 13
Chemistry Technician 11 1 12
General Clerk 10 2 12
Inquiry Clerk 8 3 11
Education Advisers and Reviewers 10 10
Other general staff collectively 116 47 163
It is not clear from these data, how readily available these part-time positions may be across all occupations. However, HR staff, consulted in respect to this issue, commented that part-time jobs are like gold nuggets in general staff positions, that people can stay in those part-time positions for quite long periods of time, and the number of applicants for part-time jobs is usually huge. 2. How possible is it to build one’s career using part-time work? This question is essentially asking how possible it is to hold more senior positions while working part-time. The data above show there are academic staff in senior positions working part-time, and part-time jobs may be created and changed more readily in the academic area (because of managers’ beliefs that academic jobs can be broken down more readily than general staff jobs, e.g., teach one paper rather than two). That said, HR input suggests many of the professors are using part-time work to ease into retirement rather than build careers.

Part B – Findings and conclusion
95
For general staff, the Table 30 shows the breakdown of part-time positions for general staff across the general grades. These data suggest it is increasingly difficult to work part-time in general staff positions, the more senior the role.
Table 30: Number of general staff working part-time by grade
Grade Female Male All staff
Grade A 22 22 44
Grade B 35 17 52
Grade C 62 12 74
Grade D 35 13 48
Grade E 38 14 52
Grade F 26 10 36
Grade G 11 6 17
Grade H 4 1 5
Grade I 1 1 2
This analysis about the availability or not of part-time work at the University begs the question of whether part-time jobs are offered to meet the needs of (potential) staff, or tend to be offered for operational reasons. The comments provided by HR staff in Table 31 suggest part-time work is offered mostly for operational reasons. Continuing to build a career at Massey University while working part-time is therefore not a very common scenario, at least as a general staff member. The following comments, provided by People and Organisational Development, identify the most common positions in which Massey University offers part-time work and the reasons for this.
Table 31: Massey rationale for determining whether positions are part-time
Library assistants These part-time positions are very much dictated by the needs of the operation and not to accommodate the wishes of individuals. Having part-timers provides greater flexibility with meeting after-hours staffing needs and also covering staff absences. (In contrast, the part-time arrangements for professional librarians80 tend to be more commonly linked to accommodating individual needs in order to retain highly qualified and experienced staff.)
Welfare support officers
This group is dominated by "Residential Advisers". They are typically mature students fitting their part-time duties around their study.
ICT customer support officers
The majority of part-timers in this category are Student Computing Laboratory Supervisors. Each year the shifts needed to staff computing labs are determined, and existing staff are then offered first choice of shifts, which can include full-time employment if they want it. Recruitment then occurs for whatever remains unfilled, which more often than not suits those interested in part-time work. Many part-time Lab Supervisors are
80
Nine librarians work part-time.

96
students fitting the work around their studies, but there are also people with family commitments. The managers of this area take a very flexible approach over full-time vs part-time and will try to meet an individual's wishes.
Teachers of English Language to speakers of other languages
In this category there is a combination of the Centre wanting some flexibility in staffing its programmes as well as meeting the wishes of individuals who have the requisite skills. They have become particularly flexible in their approach to the extent that they have advertised several vacancies at once using an overall total FTE and then accommodated a variety of part-time/full-time engagements depending on the wishes of those selected for appointment.
Project or Programme Administrators
Over 60% of this group appear to be employed on a specific project that is of insufficient size and scope to require a full-time commitment.
Nurse educators Virtually all these people are Clinical Teaching Associates in the nursing area and they are people employed to supervise nursing and/or midwifery students during their practicums, which involve work placements with DHBs and similar. The work comes in blocks rather than being continuous and does not require a full-time commitment.
Chemistry technicians
About half these are supporting specific research projects or trials where the available funding from external research grants would be a key determinant as to the level of employment that is available.
Education advisers and reviewers
Most of these staff are in the Centre for Educational Development and are Advisors to Schools. Their employment is very much dictated by funding from the Ministry of Education with contracts that specify the number of hours for supporting specific subject areas.”
Question 72 of the PaEE review survey asked whether it would be possible to hold a management position and work part-time and just 17% of women agreed or strongly agreed with this proposition (as did 24% of men). 3. Are women happy in part-time work? Question 73 of the PaEE review survey asked part-time workers if they were happy working part-time or would prefer to work full-time, and 78% of women and 66% of men said they were happy working part-time. This suggests that for the majority of workers at Massey University who work part-time, this is a choice.
Part B – Findings and conclusion
97
However, there was no specific question in the PaEE review survey that gauged ‘satisfaction’ with the nature of their part-time work. What we know81 is that part-time work is often synonymous with poorer quality work for which women may be over-qualified, and has the effect of limiting opportunities. An Equal Opportunities Commission study in the UK concluded that about one-third to a half of part-time workers were working in jobs below their potential. The longer people were in part-time work, the lower their wages were likely to be, even if they return to full-time work.82 While women are ‘happy’ to have part-time work (because they need it to meet their other family responsibilities), they may well be ‘happier’ with better work. This is an area in which further investigation could be beneficial to the University. There were some indications of concern in relation to part-time work, however, in other survey questions. Question 70 asked whether opportunities for part-time staff were the same as for full-time staff at Massey University and only 20% of women and 17% of men agreed or strongly agreed. Responses to questions 93 and 96 showed part-time workers were less likely to have had a performance appraisal, and less likely to have their professional development plans implemented. Responses to all five open-ended survey questions also indicated a number of issues for part-time workers.
81 Francesconi, M and Gosling, A (2005) Career pathways of part-time workers Equal Opportunities Commission Working Paper No. 19
www.eoc.org.uk <http://www.eoc.org.uk/> 82 Ibid.

98
9. Women do not progress through the academic promotions process as quickly as men
In 2005 the New Zealand Council for Educational Research investigated gender and academic promotion at Massey University.83 The survey of 619 academics found that:
women are less likely to apply for promotion than men
women who do apply are just as likely to succeed as men
women are more dissatisfied with the promotion process
women are more likely to see high teaching loads and a lack of time for research. The PaEE review considered academic promotions in the context of these previous findings. The facts
Data from the promotions round show that women tend to be promoted in proportions lower than their representation in the group from which they are applying. Women not applying, relative to their representation in the eligible pool, seem a particular feature of this issue. A time series of the number and proportions of women who applied and were promoted in the last six years is provided in Table 32. Table 32 relates to promotions to senior lecturer range 1 (SLR1). Lecturers make up the applicant pool for this promotion. There is evidence of consistent improvement over the past three years in promotions from lecturer to SLR1, and for the first time in 2010 women applied almost in proportion to their 53% representation in the applicant pool, and improved this representation upon promotion, comprising 58% of those promoted.
Table 32: Promotion to Senior Lecturer Range One
Female Male
No. applicants
% of total applied
No. promoted
% of total promoted
No. applicants
% of total applied
No. promoted
% of total promoted
2010 24 52% 15 58% 22 48% 11 42%
2009 24 49% 14 47% 25 51% 16 53%
2008 23 46% 12 50% 27 54% 12 50%
2007 14 32% 7 26% 30 68% 20 74%
2006 14 32% 9 35% 30 68% 19 65%
2005 12 27% 7 23% 33 73% 23 77%
* It is lecturers who apply for promotion to SLR1. In 2010 53% of lecturers were women. In 2010 women comprised 52% of applicant pool for promotion to SLR1 and 58% of those promoted. Table 33 relates to promotions to SLR2, usually from SLR1. In 2008 and 2009 women applied and were promoted in higher proportions than their representation in the eligible pool. In 2010
83 Doyle, S., Wylie, C., Hodgen, E. with Else, A. (2005). Gender and academic promotion: a case study of Massey University, NZCER.
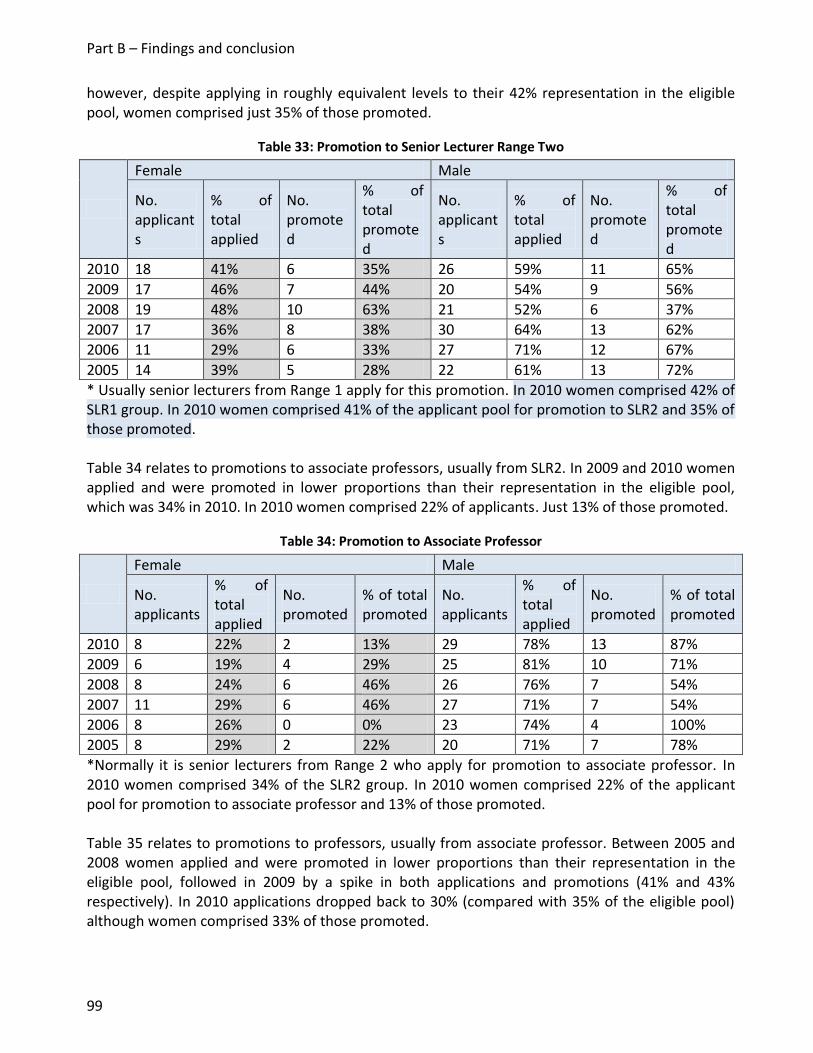
Part B – Findings and conclusion
99
however, despite applying in roughly equivalent levels to their 42% representation in the eligible pool, women comprised just 35% of those promoted.
Table 33: Promotion to Senior Lecturer Range Two
Female Male
No. applicants
% of total applied
No. promoted
% of total promoted
No. applicants
% of total applied
No. promoted
% of total promoted
2010 18 41% 6 35% 26 59% 11 65%
2009 17 46% 7 44% 20 54% 9 56%
2008 19 48% 10 63% 21 52% 6 37%
2007 17 36% 8 38% 30 64% 13 62%
2006 11 29% 6 33% 27 71% 12 67%
2005 14 39% 5 28% 22 61% 13 72%
* Usually senior lecturers from Range 1 apply for this promotion. In 2010 women comprised 42% of SLR1 group. In 2010 women comprised 41% of the applicant pool for promotion to SLR2 and 35% of those promoted. Table 34 relates to promotions to associate professors, usually from SLR2. In 2009 and 2010 women applied and were promoted in lower proportions than their representation in the eligible pool, which was 34% in 2010. In 2010 women comprised 22% of applicants. Just 13% of those promoted.
Table 34: Promotion to Associate Professor
Female Male
No. applicants
% of total applied
No. promoted
% of total promoted
No. applicants
% of total applied
No. promoted
% of total promoted
2010 8 22% 2 13% 29 78% 13 87%
2009 6 19% 4 29% 25 81% 10 71%
2008 8 24% 6 46% 26 76% 7 54%
2007 11 29% 6 46% 27 71% 7 54%
2006 8 26% 0 0% 23 74% 4 100%
2005 8 29% 2 22% 20 71% 7 78%
*Normally it is senior lecturers from Range 2 who apply for promotion to associate professor. In 2010 women comprised 34% of the SLR2 group. In 2010 women comprised 22% of the applicant pool for promotion to associate professor and 13% of those promoted. Table 35 relates to promotions to professors, usually from associate professor. Between 2005 and 2008 women applied and were promoted in lower proportions than their representation in the eligible pool, followed in 2009 by a spike in both applications and promotions (41% and 43% respectively). In 2010 applications dropped back to 30% (compared with 35% of the eligible pool) although women comprised 33% of those promoted.
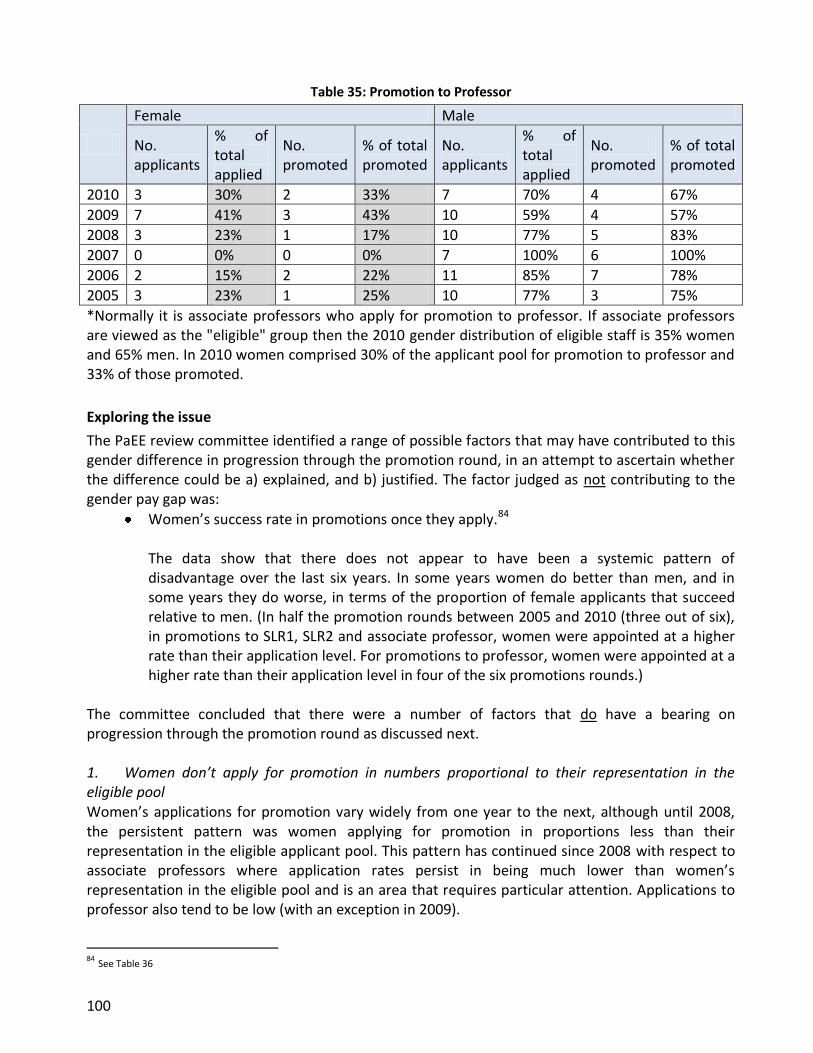
100
Table 35: Promotion to Professor
Female Male
No. applicants
% of total applied
No. promoted
% of total promoted
No. applicants
% of total applied
No. promoted
% of total promoted
2010 3 30% 2 33% 7 70% 4 67%
2009 7 41% 3 43% 10 59% 4 57%
2008 3 23% 1 17% 10 77% 5 83%
2007 0 0% 0 0% 7 100% 6 100%
2006 2 15% 2 22% 11 85% 7 78%
2005 3 23% 1 25% 10 77% 3 75%
*Normally it is associate professors who apply for promotion to professor. If associate professors are viewed as the "eligible" group then the 2010 gender distribution of eligible staff is 35% women and 65% men. In 2010 women comprised 30% of the applicant pool for promotion to professor and 33% of those promoted.
Exploring the issue
The PaEE review committee identified a range of possible factors that may have contributed to this gender difference in progression through the promotion round, in an attempt to ascertain whether the difference could be a) explained, and b) justified. The factor judged as not contributing to the gender pay gap was:
Women’s success rate in promotions once they apply.84 The data show that there does not appear to have been a systemic pattern of disadvantage over the last six years. In some years women do better than men, and in some years they do worse, in terms of the proportion of female applicants that succeed relative to men. (In half the promotion rounds between 2005 and 2010 (three out of six), in promotions to SLR1, SLR2 and associate professor, women were appointed at a higher rate than their application level. For promotions to professor, women were appointed at a higher rate than their application level in four of the six promotions rounds.)
The committee concluded that there were a number of factors that do have a bearing on progression through the promotion round as discussed next. 1. Women don’t apply for promotion in numbers proportional to their representation in the eligible pool Women’s applications for promotion vary widely from one year to the next, although until 2008, the persistent pattern was women applying for promotion in proportions less than their representation in the eligible applicant pool. This pattern has continued since 2008 with respect to associate professors where application rates persist in being much lower than women’s representation in the eligible pool and is an area that requires particular attention. Applications to professor also tend to be low (with an exception in 2009).
84 See Table 36
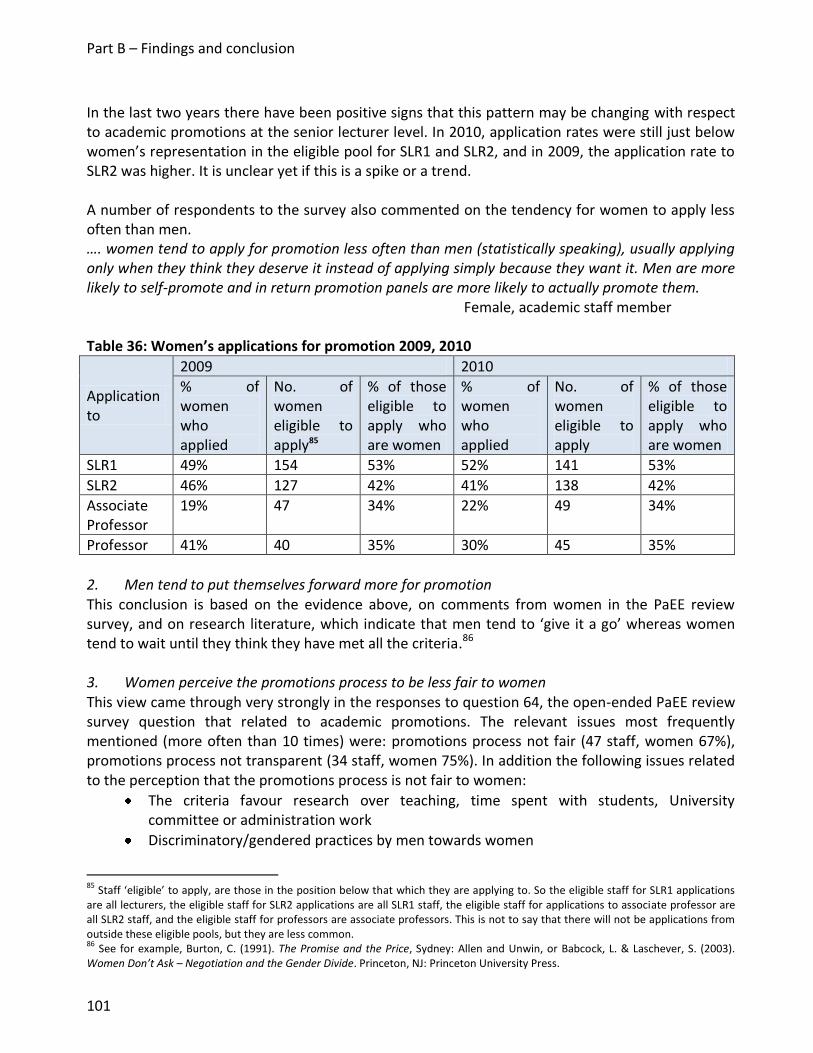
Part B – Findings and conclusion
101
In the last two years there have been positive signs that this pattern may be changing with respect to academic promotions at the senior lecturer level. In 2010, application rates were still just below women’s representation in the eligible pool for SLR1 and SLR2, and in 2009, the application rate to SLR2 was higher. It is unclear yet if this is a spike or a trend. A number of respondents to the survey also commented on the tendency for women to apply less often than men. …. women tend to apply for promotion less often than men (statistically speaking), usually applying only when they think they deserve it instead of applying simply because they want it. Men are more likely to self-promote and in return promotion panels are more likely to actually promote them. Female, academic staff member Table 36: Women’s applications for promotion 2009, 2010
Application to
2009 2010
% of women who applied
No. of women eligible to apply85
% of those eligible to apply who are women
% of women who applied
No. of women eligible to apply
% of those eligible to apply who are women
SLR1 49% 154 53% 52% 141 53%
SLR2 46% 127 42% 41% 138 42%
Associate Professor
19% 47 34% 22% 49 34%
Professor 41% 40 35% 30% 45 35%
2. Men tend to put themselves forward more for promotion This conclusion is based on the evidence above, on comments from women in the PaEE review survey, and on research literature, which indicate that men tend to ‘give it a go’ whereas women tend to wait until they think they have met all the criteria.86 3. Women perceive the promotions process to be less fair to women This view came through very strongly in the responses to question 64, the open-ended PaEE review survey question that related to academic promotions. The relevant issues most frequently mentioned (more often than 10 times) were: promotions process not fair (47 staff, women 67%), promotions process not transparent (34 staff, women 75%). In addition the following issues related to the perception that the promotions process is not fair to women:
The criteria favour research over teaching, time spent with students, University committee or administration work
Discriminatory/gendered practices by men towards women
85
Staff ‘eligible’ to apply, are those in the position below that which they are applying to. So the eligible staff for SLR1 applications are all lecturers, the eligible staff for SLR2 applications are all SLR1 staff, the eligible staff for applications to associate professor are all SLR2 staff, and the eligible staff for professors are associate professors. This is not to say that there will not be applications from outside these eligible pools, but they are less common. 86
See for example, Burton, C. (1991). The Promise and the Price, Sydney: Allen and Unwin, or Babcock, L. & Laschever, S. (2003). Women Don’t Ask – Negotiation and the Gender Divide. Princeton, NJ: Princeton University Press.

102
The type of work women do is undervalued ('softer' disciplines often undertaken by women, the type of research women do)
… the process does not or cannot give sufficient weight to aspects of excellent service to the university (through teaching, and admin – often informal admin/support tasks) and concentrates very heavily on publishing. Women for a variety of often gender-related reasons are often less successful in the publishing area and the networking that surrounds it and leads to more success. Female, academic staff member A number of women expressed the view that women pick up most of the work that does not appear to contribute to career advancement (pastoral care, administration, committee work), and that the promotions criteria focus on research and don’t recognize the work women do. These concerns are reflected in wider literature about women in academia, as illustrated by the following quote. “Nonetheless, the findings, based on a large national sample, do suggest that women are spending more time than men doing the types of scholarly work that are less rewarded by the academy.”87 It was considered by the committee that the promotions criteria, and/or the way these are applied, may disadvantage women. An analysis of the reports of the Independent Observers to the promotion committees between 2007 and 2009 showed that some observers consider the process to be fair and balanced, while others highlighted a number of structural and process issues. Of relevance to this review were comments about the complexity of the process, ranking issues, and the predominance of research over teaching and service.88 4. Women take more time out of the workforce and this disadvantages them in terms of progression This view was expressed by a sizable number of women and smaller group of men in the open-ended PaEE review survey question that related to academic promotions. Of the gender equity issues expressed by staff in relation to academic promotion, this issue was the third most frequently mentioned. One of the PaEE review survey questions asked staff (both general and academic) who had taken parental leave to comment on whether taking parental leave had disadvantaged their promotion and/or progression prospects. Twenty-seven men and 45 women responded to this question. No men felt they had been disadvantaged and 11 women did, 7 of whom were academic women. Most of the men were on parental leave for 6 weeks, and 1 for 14 weeks. Ten of the 11 women who felt disadvantaged had taken parental leave of between 6 months and 1 year. 5. Other factors Other factors possibly contributing to women’s slower progress through the promotions process were:
87 Cooper, J., Eddy, P., et al. (2007). ‘Improving gender equity in postsecondary education’ in Klein, Susan, S. Handbook for Achieving Gender Equity through Education. New York: Routledge. 88
For further discussion see PaEE review committee paper ‘Relevant Institutional Information – Pay and Employment Equity Review Project’, p. 9.

Part B – Findings and conclusion
103
Men tend to have more work opportunities than women of a type that will assist them in promotion
Women have less support than men to apply/men more likely to be formally or informally mentored
… most women are in lower level teaching positions – tutor, senior tutor, lecturer which places large demands on their time as they often get placed in large classes. There is no mentoring available to them until they reach lecturer level and only spasmodically if other staff are available. The time and opportunity to collate information and apply is limited for women in lower academic positions. There are too few in senior positions to provide mentors to less senior staff so there is no perceivable pathway that doesn't involve work above and beyond the heavy workload they currently bear. Female, general staff member .

104
10. There is bullying, harassment, discrimination and other inappropriate behaviour and dissatisfaction about how these are addressed
The facts
The survey results highlighted three particular concerns in relation to bullying, harassment, discrimination or other inappropriate behaviour at Massey University:
Incidence. A number of both women and men reported having experienced bullying, harassment, discrimination or other inappropriate behaviour. In addition, the proportion of women experiencing this unacceptable behaviour, relative to men, is much higher.
Dissatisfaction with the complaint process and procedures. There is dissatisfaction with the complaints process based on the experience of staff who took complaints, ranging from less than 20% satisfaction for both men and women in complaints of discrimination to 50% for both men and women in relation to other inappropriate behaviour.
Lack of confidence that Massey University would address and resolve any concerns or complaints of bullying, harassment, discrimination and other inappropriate behaviour. A fifth of respondents said they were not confident.
These issues are discussed in more detail below. Concerns in relation to bullying, harassment, discrimination and other inappropriate behaviour were also raised in reviews in the Public Service and in the ITP sector.89 Incidence
The PaEE review survey asked separate questions about the employee’s experience of four types of behaviour: bullying, harassment, discrimination, and other inappropriate behaviour; 258 staff responded saying they had experienced at least one of these types of behaviour.90 A summary of the findings for each of these areas is discussed next. Bullying
One hundred and eighty-nine female respondents (18%) and 83 male respondents (12%) reported that they had been subjected to bullying at work.
Of those bullied, women comprised about two-thirds (64% at Albany and 71% at Manawatu and Wellington).
Of those who have experienced bullying, half were academic staff and half were general staff. Of academic staff, 40% were men and 60% women. Of general staff, 23% were men and 77% women
In all colleges, women represent a higher proportion of those bullied than men.
Women comprised the greatest proportion of those bullied at every level – staff member, manager or team leader, and tier-3 manager.
89 Data are available from participating ITPs in relation to the levels of confidence that their institution would address and resolve concerns or complaints. The range of those who weren’t confident was from 14% to 50% for women and from 9% to 47% for men. 90
The committee explored whether the same people were responding to all questions. It was found that only 39 people responded to all four questions, 152 people responded to three questions, 214 people responded to two questions, and 258 people responded to one question. On the basis of this information the committee concluded that the questions were not all answered by the same people.

Part B – Findings and conclusion
105
Sexual or other forms of harassment
Fifty-seven female respondents (5%) and 30 male respondents (4%) reported that they had been subjected to sexual or other form of harassment at work.
Of academic staff, 54% were men and 46% women. Of general staff, 19% were men and 81% women.
At Albany, women comprised 59% of those harassed, at Manawatu 70%, at Wellington campuses 62%.
In all colleges except the College of Business, women represent a higher proportion of those harassed than men.
Women comprised the greatest proportion of those harassed at staff-member level, but men comprised 60% of those harassed at manager or team leader below tier 3, and at tier 3.
Discrimination
One hundred and twenty-seven female respondents (12%) and 54 male respondents (8%) reported that they had been subjected to discrimination at work in the past 24 months.
Of those who have experienced discrimination, 51% were academic staff and 49% were general staff. Of academic staff, 41% were men and 59% women. Of general staff, 21% were men and 79% women.
At Albany, women comprised 65% of those who experienced discrimination, at Manawatu 70%, and at Wellington 78%.
In all colleges women represent a higher proportion than men of those who have experienced discrimination.
Women comprised the greatest proportion of those discriminated against at all levels of seniority.
Other inappropriate behaviour
Two hundred and seventy-three female respondents (26%) and 134 male respondents (19%) reported that they had been subjected to other inappropriate behaviour at work in the past 24 months.
Of those who have experienced other inappropriate behaviour, 48% were academic staff and 52% were general staff. Of academic staff, 46% were men and 54% women. Of general staff, 22% were men and 78% women.
At Albany, women comprised 59% of those who experienced inappropriate behaviour, at Manawatu 68%, and at Wellington 74%.
In all colleges except Science, women represent a higher proportion than men of those who have experienced inappropriate behaviour.
Women comprised the greatest proportion of those experiencing other inappropriate behaviour at staff member level and as manager/team leader, but a lower proportion than men at 2nd and 3rd tier manager levels.
The committee also looked at formal complaints data. Complaints data falls into two categories: ‘employment relationship problems’ and personal grievances. Information in relation to confidential settlements of formal personal grievances were not available to the committee.

106
In 2009 the University received 25 complaints in the form of ‘employment relationship problems’ from staff. Of these complaints, one was specified as racial harassment so has been removed from the data in Table 37. The other complaints are either identified as gendered in nature, or are potentially so. Seventy-one per cent of these complaints were from women.
Table 37: Enumeration of Massey-employee relationship problems occurring in 2009
Employment relationship problem recorded by HR in 2009
Male Female Total Female %
Harassment – type undefined Harassment – sexual Discrimination – family status Sick leave Inappropriate conduct – colleague to colleague Unjustified action on behalf of the employer
1 1 - - 1 4
2 3 2 1 6 3
3 4 2 1 7 7
67% 75% 100% 100% 86% 43%
Total 7 17 24 71%
Level of satisfaction with complaints process
Dissatisfaction was expressed, from both women and men who used the complaints process, in relation to how complaints of bullying, harassment, discrimination and other inappropriate behaviour were handled. Sixty-two staff reported making a complaint in respect to bullying, 47 women and 15 men. Forty-three per cent of women and 25% of men reported that their complaint was handled satisfactorily.
Thirty staff reported making a complaint in relation to sexual or other forms of harassment, 21 women and 9 men. Twenty-five per cent of women and 36% of men reported that their complaint was handled satisfactorily.
Twenty-four staff reported making a complaint in relation to discrimination at work, 16 women and 8 men. Seventeen per cent of women and 13% of men reported that their complaint was handled satisfactorily.
Eighty-one staff reported making a complaint in relation to other inappropriate behaviour, 57 women and 24 men. Fifty per cent of women and 50% of men reported that their complaint was handled satisfactorily.
Confidence in whether the University would address and resolve concerns and complaints
In addition to asking respondents for their experience with the complaints process, the survey also asked all respondents whether they were confident that Massey University would address and resolve any concerns or complaints of bullying, harassment, discrimination and other inappropriate behaviour. Of the 1706 who responded to this question, 54% of women and 62% men agreed or strongly agreed that they were confident. Twenty per cent of women and 18% of men disagreed or strongly disagreed,91 a total of 320 staff.
91
About 25% of both men and women didn’t know.

Part B – Findings and conclusion
107
Women have less confidence than men that Massey University will address and resolve any concerns or complaints of bullying, harassment, discrimination and other inappropriate behaviour. Women represent 200 of the 320 staff who indicated a lack of confidence. One factor likely affecting confidence in the complaints process is low awareness of the process. A third of all male and female survey respondents, nearly 600 staff, said that they were not aware of the processes and procedures for raising concerns and making a complaint about bullying, sexual and other forms of harassment, discrimination or other inappropriate behaviour. Of the respondents who had been at the University less than three years, over half were not aware of the processes and procedures for making a complaint. Exploring the issue
In exploring this issue, the committee drew heavily on responses to the open-ended survey question 92 that asked “Why are you confident or not confident that Massey University would address and resolve any concerns or complaints of bullying, harassment discrimination or other inappropriate behaviour?” A total of 1130 valid responses were coded and analysed in relation to this question, 470 (42%) from men and 660 (58%) from women. Each response contained one or more discrete comments, which generated at least one, and sometimes several codes. This means that there are a total of 1923 comments in response to this question, 735 from men and 1188 from women. Just 37% of all comments reflected confidence that Massey University would address and resolve concerns or complaints of bullying, sexual or other forms of harassment, discrimination, or other inappropriate behaviour. In contrast 42% were not confident.92 Men were considerably more confident than women. A third of the comments from men (34%) and nearly half of the comments from women (47%) indicated a lack of confidence in the University’s handling of concerns and complaints (795 comments in total). Given that 42% of comments reflected a lack of confidence in Massey University addressing or resolving concerns or complaints, the remainder of this section focuses on the factors that staff identified as being problematic. The committee is not suggesting that this is the experience of all staff; on the contrary, a number of staff reported positive handling of concerns or complaints they had had. However, these positive experiences were outnumbered by the negative comments. A summary of the negative comments are reported in some detail here, in order to identify clearly the different aspects of the problem that the University both needs and wants to address. The seven most frequently mentioned aspects are discussed next, with each aspect raised by at least 30 staff. The discussion is ordered according to the frequency with which survey respondents raised the particular aspect. Most frequently raised was the failure by management to address such behaviour (133 comments) so this aspect is discussed first, with other aspects discussed in descending order of frequency, with the final aspect being the protection of some perpetrators (30 comments). Each issue is supported by a selection of quotations from the survey. The most detailed cases, based on personal experience, are not included here for privacy reasons.
92 The remaining 21% of comments were classified as neutral.

108
1. Failure by management to address such behaviour This issue was raised by over 130 staff (75% of them women), in relation to their personal experience or observation of management handling of a concern or complaint. Comments focused on managers being unresponsive, not dealing with the issue and ‘sweeping issues under the carpet’, managers not knowing what to do, and in some cases, managers actively refusing to listen to staff and/or supporting the perpetrator. Concern about management failure to address such behaviour was expressed both in terms of the impact on the individual subjected to the behaviour, but also the cost to the University as a business in terms of workplace productivity and reputation. Bullying behaviour that I have seen occur in my area … haven't resulted in any disciplinary action…. Perhaps managers could be better supported and be required to take some sort of training in how to be an effective manager, and what constitutes bullying and harassment. Female, general staff member … bullying/inappropriate personality and behaviour/rude leadership/the undermining of other peoples work – will remain with [a work area] as long as Massey holds on to that particular person (and does not deal to that person), often at the detriment of [the area], the progress of work made to date, the staff morale, and the work they do and the reputation of Massey. Male, academic staff member A few years ago I was subjected, along with a number of colleagues, to the bullying behaviour of a now former senior staff member and our manager chose to ignore all communication about this behaviour, and in fact, openly supported this behaviour by ignoring even staff who sought 'exit interviews' to explain their reasons for leaving. When those in your own line of 'command' do not listen, there seems nowhere to go that will not result in intimidation or personal retribution in some way. This is the case currently where as a result of certain decisions being questioned, a staff member is having holes picked in their work. Female, academic staff member Haydn Olsen, Director of Workplaces Against Violence in Employment (WAVE) in New Zealand notes that many employers minimize or ignore complaints, treating them as a personality clash or a communication problem. When this occurs however, the complaint does not get resolved, and it may be compounded.93 A State Services Commission publication on bullying and dealing with other inappropriate workplace behaviour is explicit that managers need a comprehensive programme of training to enable them to implement an organisation’s policies effectively. This should include: “…what harassment and bullying are, what they not, and why they are an issue; the options open to complainants; managers’ responsibilities towards all parties involved; handling interviews with complainants and respondents; why it is difficult for people to complain; and what managers can do to prevent harassment.”94.
93 See http://www.wave.org.nz/docs/information.html 94 State Services Commission (2003). Creating a Positive Work Environment – Respect and Safety in the Public Service Workplace, p. 24.
Part B – Findings and conclusion
109
2. Lack of confidence/trust in management to address such behaviour Staff comments in relation to confidence and trust in management were in some cases related directly to experience or observation of bullying, sexual or other forms of harassment, discrimination, or other inappropriate behaviour; in other cases confidence and trust were based on the respondent’s wider experience of how individual managers, Massey University management as a group, or the University as an organisation tended to operate. Not confident because Massey has always steered clear of taking a strong approach to sorting issues. They would rather brush it under the carpet than a) follow through on a complaint, b) transfer someone internally rather than fire them. I understand the legal aspects around these sorts of things however the person who is the 'victim' feels less supported. Female, general staff member My supervisor holds a close relationship with the person that had been harassing me. Male, general staff member As any employee I feel that management look after themselves therefore wanting to rock the boat and make a complaint is put off in the hope that it will improve and you won't be labelled with 'you don't want that person they're a trouble maker'. I know of an instance where a manager said they weren't getting involved and the staff could sort it out themselves. Female, general staff member 3. Making a complaint is worse for the complainant Over 70 staff (67% women) expressed concerns that taking a complaint could lead to the situation worsening rather than improving, and in some cases, that there would be active retribution. These views were based on experience or observation where this had occurred or a fear that this might occur. I have been told of other instances where reported issues were not satisfactorily resolved and/or where the process of investigation and resolution was more damaging to the complainant than simply staying quiet would have been. Female, general staff member Those in senior positions hold sufficient power that it would only damage my reputation to bring a complaint against a person who is popular at management level. Sometimes it is easier to back off, give up and just get on with doing what I can do in my small sphere of influence with professionals outside of the university. Female, academic staff member I have experienced a counterpart who was bullied and harassed by a another staff member and took the whole process up to no avail and their health suffered and so left the job with broken self-confidence and ill health. Female, general staff member

110
Those experienced in the field of bullying and harassment at work acknowledge that staff concerns that taking a complaint can be worse for the complainant are legitimate. “It is easy to take the perpetrator’s side and see the complainant as the problem (especially when the perpetrator seems so reasonable, or gets results). This may happen especially when the perpetrator is a manager or supervisor.”95 4. Problems with the process/procedures Over 60 staff described a lack of confidence in the process or procedures available to address concerns or complaints. This was based on observation or experience of staff using the available processes, or wider experience of bullying, harassment or other forms of inappropriate that occur and continue to occur. Bullying is common, especially verbal at Massey and the existing practices put too much pressure on the person making the complaint so most goes unreported. No confidence of support by POD and management by rank and file academic and general staff exists. Male, academic staff member I know that there are harassment committees etc however I still think that it's a difficult process for staff members if they were to have an issue with their manager… Laying a complaint can be a very brave thing to do and I'm not sure if staff would be overly confident that they would get the support required. Cases like this usually end up with the staff member leaving because the relationship/atmosphere becomes unbearable. Aside from the Union (which not everyone belongs to) there does not seem to be anyone working on our behalf. Who do staff talk to on campus if there is no HR representative? Female, general staff member Complaints are usually directed to the unit manager as the first port of call. This is unsatisfactory as the unit manager is usually the perpetrator of the problem. I am not confident if the process offers genuine confidentiality or protection. Male, academic staff member 5. HR supports management rather than staff
50 survey respondents (72% women) commented that HR supported management rather than staff when it came to dealing with concerns or complaints of bullying, harassment, discrimination or other inappropriate behaviour. I think Massey has the processes but do not have full confidence in the HR department to be fair and equitable in their dealing with staff. Often interests of management are clearly reflected in HR behaviour... Not my personal experience [as I am senior I get help and respect], but that of colleagues. Female, academic staff member I have seen others go through the process with an unsatisfactory outcome. The major problem that I see is that Human Resources seems to support management without question, leaving the employee in a vulnerable position should any situations of bullying or harassment arise. I can speak with some
95 See information by Hadyn Olsen from Workplaces Against Violence in Employment (WAVE) http://www.wave.org.nz/docs/information.html

Part B – Findings and conclusion
111
authority on this matter because of my position *+ so it is not just hearsay…. I strongly believe that HR should take more of a neutral role, rather than supporting management. Female, general staff member Any approaches to HR result in staff being advised that the role of HR is to manage the resource that is staff and to report to management on their dealings with staff, along with a limitation to the advice they can render in the circumstances. Staff not involved in a union do not have a source of independent/confidential advice that they can be sure is not immediately passed to managers in their department. This makes many staff reluctant to become involved in any such process and therefore do nothing including reporting concerns. Female, academic staff member Staff experience of being told “HR is there for the manager”, seems to have arisen from a change sought by Massey to the Massey collective agreement in 2007. This removed reference to staff being able to refer issues to HR for support in resolving employment relationship problems. The philosophy underpinning that change has since been superseded by an approach that considers that HR’s role is to support the employment relationship not just the management side of that relationship. 6. Massey University has a culture of tolerance that supports bullying, harassment, discrimination and other inappropriate behaviour
The perception that Massey University has a culture of tolerance for bullying and other inappropriate behaviour was raised explicitly by 35 survey respondents, 70% of whom were women. Upper management appears to support its managers and anyone raising concerns/questioning their manager is seen as a trouble-maker, resulting in wide-ranging, covert, negative repercussions. Female, academic staff member … aggressive behaviour seems to be accepted between senior staff… I have been the object of aggressive and bullying behaviour from one or two senior staff and the behaviour was considered acceptable and ordinary by other staff who witnessed it. Female, general staff member I think Massey buries its head in the sand a bit where 'difficult' issues are concerned, and hopes they will blow over or people will move on. There are cases around Massey where staff feel bullied but won’t do anything about it as they feel this will impact negatively on their working life. Female, general staff member Instead of addressing and resolving such problems [Massey] has too often rewarded the bully and penalized the one complaining. I have seen this with students and staff. The power structures at Massey seem to be set up to protect the status quo, a safe work environment is secondary. When the two are in direct tension, status quo wins. Addressing and resolving these problems requires a change in culture. Not spin doctoring. I fear that the bullies have learned that their behaviour is not just accepted but is actually rewarded here. I.e., Prove you're a man, one of us. Too much of that here. And everyone else puts their heads in the sand afraid to look up.
112
Female, academic staff member 7. Some staff are protected/there is a culture of supporting the perpetrator Thirty survey respondents expressed concerns about management ‘protection’ of staff who were bullying, harassing or otherwise behaving inappropriately towards other staff members. Seems to be a curtain of silence around particular individuals, usually where they attract a lot of research funding, or around certain senior individuals whose behaviour never seems to be subject to scrutiny. Male, academic staff member I have seen a colleague being harassed. When I offered assistance this person told me that they had been told they were not discuss this matter with anyone else – if they did then it would be held against them. Female, general staff member I have suffered from sexual harassment from a former line manager and was told when I complained that everyone knew he was like that, it was just treated with a shrug. Female, academic staff member I have absolutely no faith whatsoever in the people and processes put in place by Massey University to deal with matters of sexual harassment [Based on my own experience+…. the perpetrator received one-on-one support from the [old boys network in senior management] Female, academic staff member .
Part B – Findings and conclusion
113
Other issues
This section records information that emerged in the course of the review that needs to be captured and made known to senior management, but is not a gender equity issue being addressed in this report. That information is captured under three headings:
Parallel issues
Gender equity issues not substantiated
Matters not pursued. Parallel issues
Parallel issues are issues that arose during the course of the review that were not directly gender related, but are important for the organisation to know about and to address. Generally, these were issues raised equally and strongly by both men and women. The two issues recorded next are those that came to the committee’s notice in the course of the review. 1. Career development for general staff Career development and progression issues are generally considered to be poor for many general staff (both male and female). This is a generic issue as described below. For general staff there is little opportunity to progress beyond a certain point (the level I have been at for a number of years). While workload during this time has increased significantly there is no recognition of this from senior management and the only significant improvement to our working conditions has been the Union negotiating the removal of the highly unpopular and detrimental 'Merit Process'. Female, general staff member. 2. Bullying and discrimination As noted in the previous section, the incidence of bullying, harassment, discrimination and other inappropriate behaviour at Massey University, and concerns about the processes and procedures for addressing associated concerns and complaints, were issues for both men and women at Massey University. A third of all male respondents to the survey expressed a lack of confidence that the University would address and resolve concerns and complaints, as well as a half of the female respondents. Gender equity issues not substantiated
1. Gender pay gaps for particular groups Preliminary analysis of the pay data suggested there was a gender pay gap for accountants, academic Heads of Department, and for IT/ICT staff. Further analysis for each of these groups was undertaken and based on those findings, summarised next, these issues were not taken further by the committee. Accountants Initial analysis of the pay data, using ANZSCO codes, revealed that there were 4 female and 15 male accountants at Massey University, with an average pay difference of $12,000 in favour of men, or a 15% pay gap. Further analysis of the ANZSCO job code for accountants, however, revealed that
114
there were 8 Massey University job titles, and 5 different grades included within this ANZSCO category. Just one of the job titles – business manager – was a sufficiently large group to undertake some further gender analysis, with 5 men and 3 women. The average salary for women was $73,700 and for men was $72,900 meaning that there is no pay gap issue here. In terms of distribution, women were spread throughout the salary levels, with one each paid in the lower, mid- and high range of this group. The fact that there is only 1 woman in the remaining accountant group of 11 staff, means that no robust gender analysis in relation to pay is possible, and also begs the question about why there are not more women in this group, particularly in the AVC area Finance, IT, Strategy and Commercial where just one of the nine accountant staff is a woman. Academic Heads of Department As identified earlier academic Heads of Department represent a key sub-group of Level 3 managers as they are the main feeder group for SLT positions. An initial analysis of average salaries by gender showed an 18% gender pay difference in these positions. Further analysis, however, showed that the majority (65%) of the male Heads of Department are professors and paid salaries appropriate to this academic role, as are the relatively fewer 29% of female professors who are Heads of Department. The remaining Heads of Department are either associate professors (5 men and 2 women) or senior lecturers (3 men and 2 women). Analyst Programmer Massey University salary data revealed a pay difference of 7% for the ANZSCO category of Analyst Programmer, comprising 8 women and 18 men. Further analysis showed that these positions were spread over four grades, Gen E to Gen H. By far the majority of staff, however, 21, were located in grade G. Six of the eight women were spread evenly throughout this grade. 2. Gender differences in starting salaries Programme or project administrator and ICT customer support officer Initial analysis showed a gender pay gap of 16% in average starting salaries for the ANZSCO category of Programme or Project Administrators. However jobs grouped into this ANZSCO category covered more than one type of Massey University position. Most of the 28 positions could be grouped into two main types of similar jobs, which showed that:
in the ‘coordinator’ positions, there was a gender difference in pay of 6% or $3,378, with the average salary for men being $55,500 and for women $52,000
there were only women (9) located in the lower paid ‘administrator’ positions in this occupational group, paid an average of $43,000. Further exploration may usefully investigate why it is that only women are being recruited into these lower paid positions.

Part B – Findings and conclusion
115
Table 38: Gender pay difference in starting salaries for Programme or Project Administrator
Job Titles
Average Salary Variance Female to Male
Number of Staff
M F Amount Variance
% Variance
Male Female
Total
Administrator $43,072 9 9
Coordinator $ 55,623 $52,245 $ 3,378 6% 8 9 17
Project Manager $49,856 2 2
Total $ 55,623 $47,878 $ 7,745 14% 8 20 28
ICT Customer Support Officer Similarly, initial analysis of the ANZSCO category ICT Customer Support Officer showed a gender pay gap of 12%. Further investigation revealed that the jobs grouped into this ANZSCO category covered more than one type of Massey University position. The gender pay gap of 12% is explained by:
A gender pay gap of 4% favouring men in the laboratories supervisor jobs where there are almost equal numbers of men (8) and women (7)
A gender pay gap of 3% in the higher paying help desk support roles, with just 4 women and 10 men being located in this more highly paid position within this occupation. Further exploration may usefully investigate why it is that women are not being recruited equally into the higher paid positions.
Table 39: Gender pay difference in starting salaries for ICT Customer Support Officer
Job Titles
Average Salary Variance Female to Male
Number of Staff
Male Female Amount Variance
% Variance
Male Female
Total
Help Desk Support $ 40,960 $39,686 $ 1,274 3% 10 4 14
Laboratories Supervisor
$ 25,322 $24,183 $ 1,139 4% 8 7 15
Total $ 34,010 $29,820 $ 4,189 12% 18 11 29
Matters not pursued
Some matters considered by the committee as being possible gender equity issues were unable to be explored in the time available, but are noted here for possible future follow-up. These issues included:
Take up of superannuation scheme by male and female staff
Some issues in the open-ended questions from the survey
Whether there are still barriers to the appointment of female accountants within FISC.

Part C – The action plan
The following pages provide a summary of the gender equity issues found at Massey University (discussed in detail in Part B) and the actions, recommended by the PaEE review committee, to provide redress.
Implementation and monitoring of the action plan
To support the implementation and monitoring of the action plan, the committee recommends the following: Allocation of the portfolio of Equity to an SLT member. This portfolio of P/AVC Equity would include leadership in gender equity initiatives generally, and specifically, responsibility and accountability for the implementation of the PaEE Action Plan. It is anticipated that the same SLT member will chair the Gender Equity Advisory Group. Allocation of resources to the Equity portfolio. The establishment of a position Manager, Gender Equity. It is anticipated that the SLT member will need the support of a dedicated EEO Officer to support the implementation and monitoring of the Plan of Action. Establishment of a PaEE Implementation Group. This group would support the P/AVC Equity. It would meet quarterly to check the actions that are being addressed, to sign off on actions when completed, and to identify the next areas of focus. Membership of the group would be P/AVC Equity (Chair), the Manager Gender Equity, and a representative from each of the Gender Equity Advisory Group (GEAG), Tertiary Education Union (TEU), People and Organisational Development (POD), and Office of Strategy Management (OSM). Allocation of explicit responsibilities for the following groups: GEAG – oversight of the implementation of the PaEE Action Plan TEU – oversight of the implementation of the PaEE Action Plan and consultation and negotiation regarding changes to the collective agreement POD – collation, analysis and monitoring of HR data by gender as requested by the P/AVC Equity and consultation and negotiation regarding changes to the collective agreement OSM – performance monitoring and reporting on specific actions in the Action Plan. Establishment of appropriate KPIs for managers, to support a focus on key priorities in the PaEE Action Plan. In the action plan that follows, the above infrastructure for implementation and monitoring is assumed in the allocation of responsibilities.
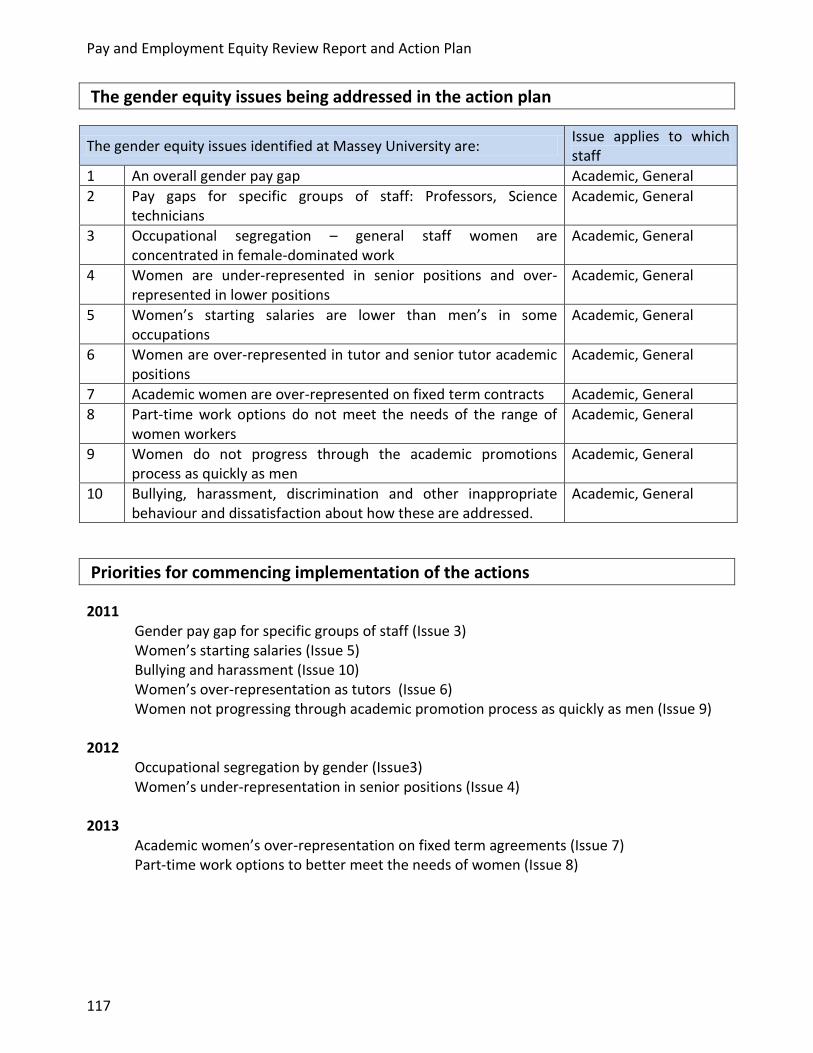
Pay and Employment Equity Review Report and Action Plan
117
The gender equity issues being addressed in the action plan
The gender equity issues identified at Massey University are: Issue applies to which staff
1 An overall gender pay gap Academic, General
2 Pay gaps for specific groups of staff: Professors, Science technicians
Academic, General
3 Occupational segregation – general staff women are concentrated in female-dominated work
Academic, General
4 Women are under-represented in senior positions and over-represented in lower positions
Academic, General
5 Women’s starting salaries are lower than men’s in some occupations
Academic, General
6 Women are over-represented in tutor and senior tutor academic positions
Academic, General
7 Academic women are over-represented on fixed term contracts Academic, General
8 Part-time work options do not meet the needs of the range of women workers
Academic, General
9 Women do not progress through the academic promotions process as quickly as men
Academic, General
10 Bullying, harassment, discrimination and other inappropriate behaviour and dissatisfaction about how these are addressed.
Academic, General
Priorities for commencing implementation of the actions
2011 Gender pay gap for specific groups of staff (Issue 3) Women’s starting salaries (Issue 5) Bullying and harassment (Issue 10) Women’s over-representation as tutors (Issue 6) Women not progressing through academic promotion process as quickly as men (Issue 9)
2012 Occupational segregation by gender (Issue3) Women’s under-representation in senior positions (Issue 4)
2013 Academic women’s over-representation on fixed term agreements (Issue 7) Part-time work options to better meet the needs of women (Issue 8)
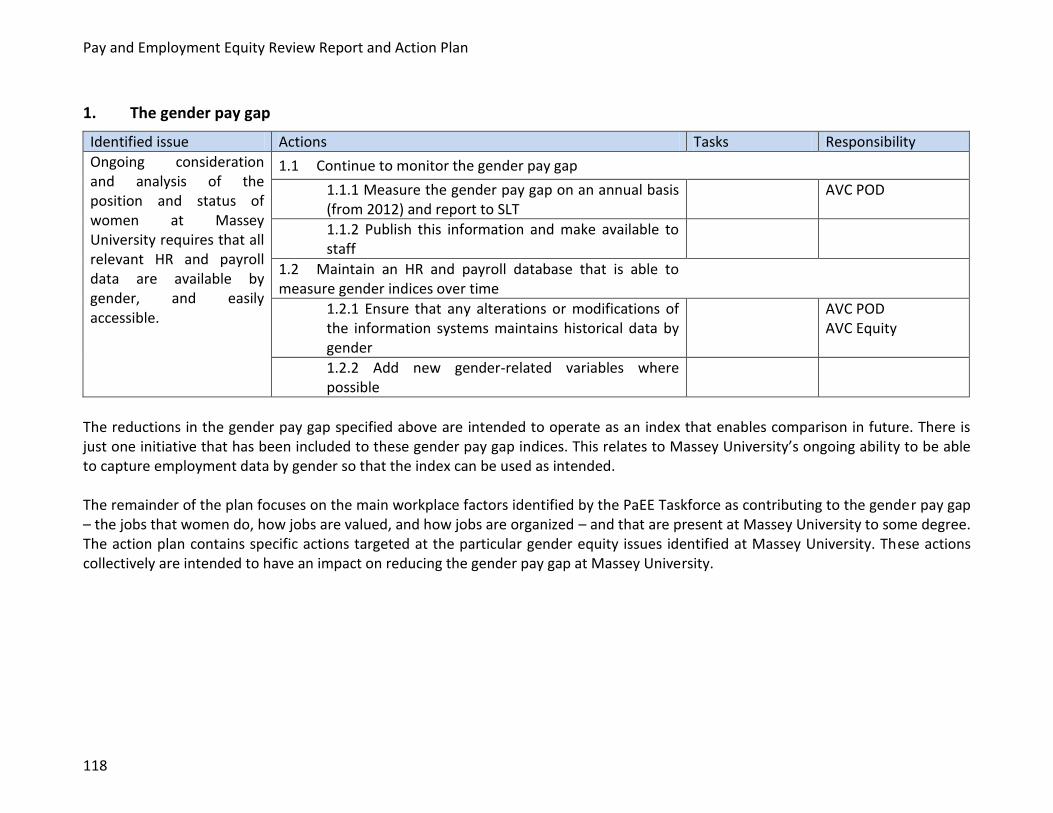
Pay and Employment Equity Review Report and Action Plan
118
1. The gender pay gap
Identified issue Actions Tasks Responsibility
Ongoing consideration and analysis of the position and status of women at Massey University requires that all relevant HR and payroll data are available by gender, and easily accessible.
1.1 Continue to monitor the gender pay gap
1.1.1 Measure the gender pay gap on an annual basis (from 2012) and report to SLT
AVC POD
1.1.2 Publish this information and make available to staff
1.2 Maintain an HR and payroll database that is able to measure gender indices over time
1.2.1 Ensure that any alterations or modifications of the information systems maintains historical data by gender
AVC POD AVC Equity
1.2.2 Add new gender-related variables where possible
The reductions in the gender pay gap specified above are intended to operate as an index that enables comparison in future. There is just one initiative that has been included to these gender pay gap indices. This relates to Massey University’s ongoing ability to be able to capture employment data by gender so that the index can be used as intended. The remainder of the plan focuses on the main workplace factors identified by the PaEE Taskforce as contributing to the gender pay gap – the jobs that women do, how jobs are valued, and how jobs are organized – and that are present at Massey University to some degree. The action plan contains specific actions targeted at the particular gender equity issues identified at Massey University. These actions collectively are intended to have an impact on reducing the gender pay gap at Massey University.

Part C – The action plan
119
2. The gender pay gap for specific groups of staff
Initiatives in relation to these groups of staff are targeted around possible strategic intervention points. For professors, the opportunities for influencing pay are at appointments, at promotions, and during the annual salary review.
Identified issue Actions Tasks Responsibility
Professors There are 15 female and 92 male professors at Massey University, with an average pay difference of $7,500 in favour of men, or a pay gap of 6%. Specifically: in the last three years male professors have on average been appointed to higher starting salaries than female professors of those professors appointed in the last three years, the pay gap has widened since appointment.
2.1 Fix current gender inequity for female professors
2.1.1 Establish a salary review process able to explore possible gender factors in professors’ pay
AVC POD
2.1.2 At the next salary review: Carefully examine every female professor’s salary for relativity to check whether gender has (even unintentionally) impacted negatively on their current position in the salary scale Report findings to AVC POD, and through to SLT
Relevant PVC and SLT
2.1.3 Develop recommendations to make adjustments AVC POD
2.1.4 Where discrepancies are revealed, take immediate steps to address, e.g. via, a targeted salary adjustment.
SLT & AVC POD
2.2 Prevent future gender inequity for female professors
2.2.1 Establish a robust and transparent system (including moderation) for setting starting salaries free of gender bias for all professors, particularly in relation to external appointments
AVC POD & SLT
2.2.2 Establish guidelines, training and support to PVCs in: setting equitable starting salaries (considering both gender equity and other relativities) managing the negotiation process (so that this is not a source of gender inequity)
AVC POD
2.3 Monitor professorial appointments and promotions by gender
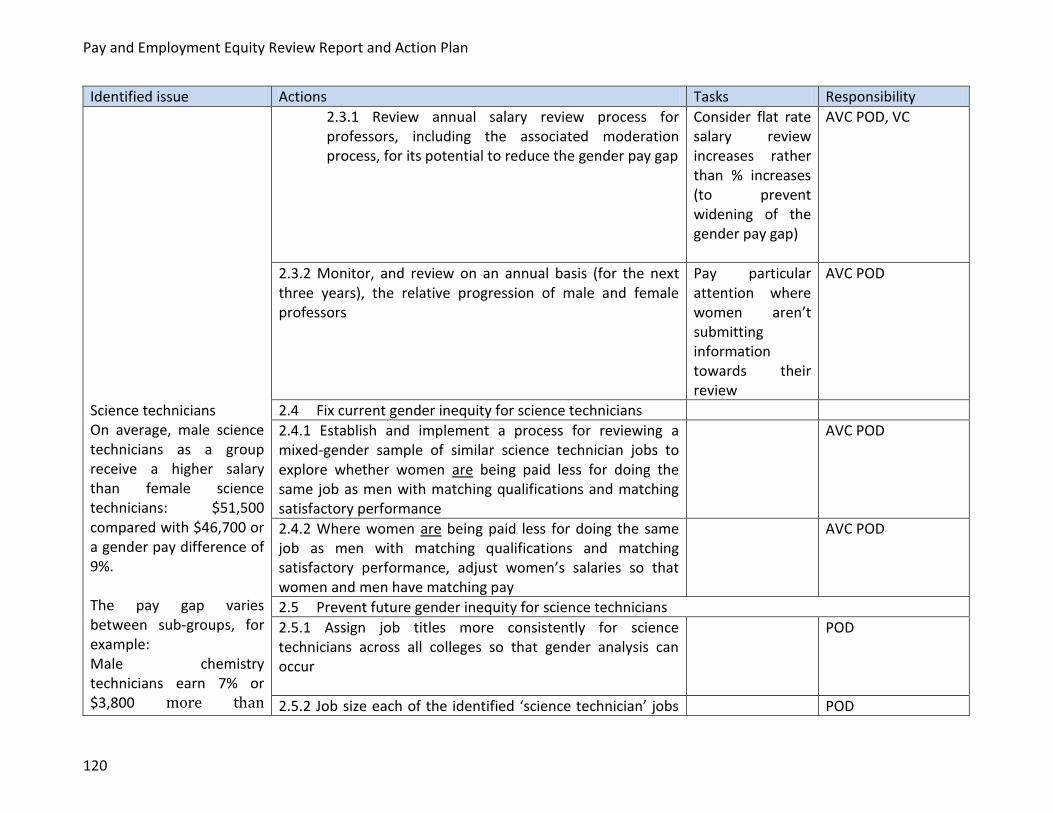
Pay and Employment Equity Review Report and Action Plan
120
Identified issue Actions Tasks Responsibility
2.3.1 Review annual salary review process for professors, including the associated moderation process, for its potential to reduce the gender pay gap
Consider flat rate salary review increases rather than % increases (to prevent widening of the gender pay gap)
AVC POD, VC
2.3.2 Monitor, and review on an annual basis (for the next three years), the relative progression of male and female professors
Pay particular attention where women aren’t submitting information towards their review
AVC POD
Science technicians On average, male science technicians as a group receive a higher salary than female science technicians: $51,500 compared with $46,700 or a gender pay difference of 9%. The pay gap varies between sub-groups, for example: Male chemistry technicians earn 7% or $3,800 more than
2.4 Fix current gender inequity for science technicians
2.4.1 Establish and implement a process for reviewing a mixed-gender sample of similar science technician jobs to explore whether women are being paid less for doing the same job as men with matching qualifications and matching satisfactory performance
AVC POD
2.4.2 Where women are being paid less for doing the same job as men with matching qualifications and matching satisfactory performance, adjust women’s salaries so that women and men have matching pay
AVC POD
2.5 Prevent future gender inequity for science technicians
2.5.1 Assign job titles more consistently for science technicians across all colleges so that gender analysis can occur
POD
2.5.2 Job size each of the identified ‘science technician’ jobs POD

Part C – The action plan
121
Identified issue Actions Tasks Responsibility
females Males earth science technicians earn 14% or $7,000 more than females ‘Other’ science technicians who were male earn 10% or $5,000 more than females.
using the new job evaluation system
2.5.3 Identify the contributing factors that allowed this discrepancy to occur, and plan to redress these issues
POD
2.5.4 Establish and implement a system to provide oversight and moderation of how steps within grades, and starting salary levels, are decided (with a view to uniformity at college (and university) level
POD
2.6 Monitor science technician appointments and progression
2.6.1 Monitor, and review on an annual basis, the average pay for women and men in these occupations
Relevant PVCs and AVC POD
2.7 Maintain oversight of differences in average gender salary within occupations
2.7.1 Identify a small number of benchmark academic and general staff positions for ongoing monitoring of annual salaries by gender
PaEE review steering committee and POD
2.7.2 On an annual basis, report to staff the average salaries for men and women in these benchmark positions
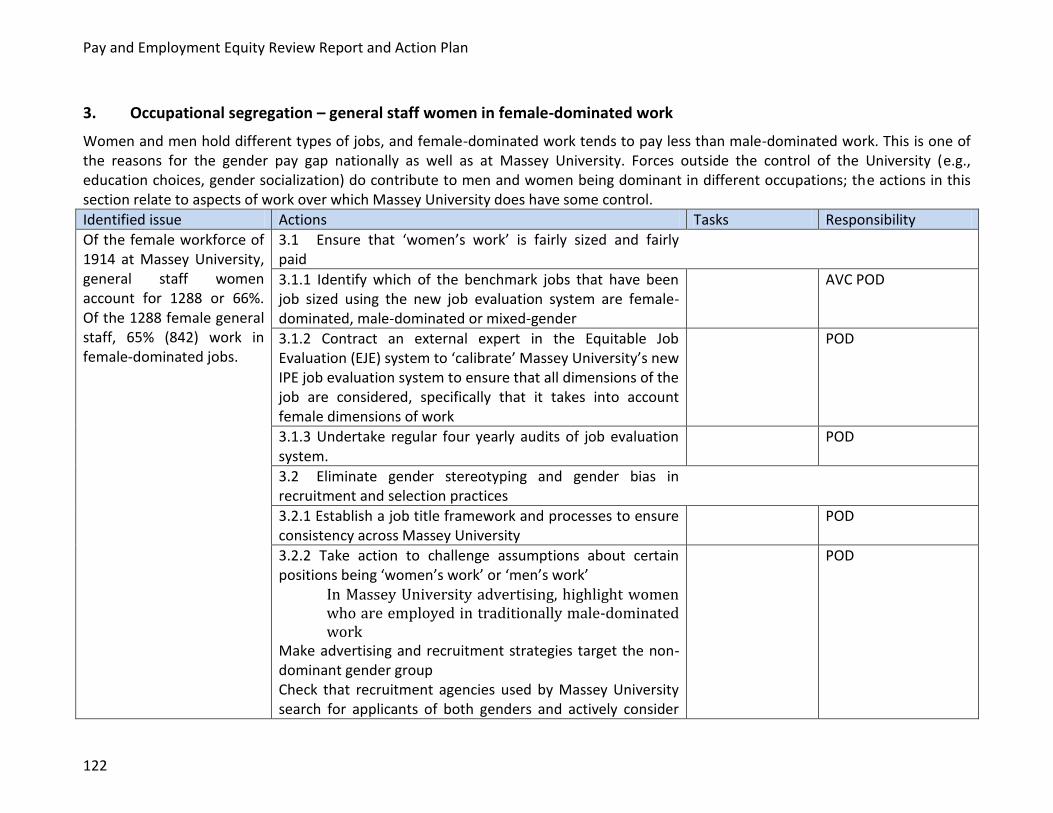
Pay and Employment Equity Review Report and Action Plan
122
3. Occupational segregation – general staff women in female-dominated work
Women and men hold different types of jobs, and female-dominated work tends to pay less than male-dominated work. This is one of the reasons for the gender pay gap nationally as well as at Massey University. Forces outside the control of the University (e.g., education choices, gender socialization) do contribute to men and women being dominant in different occupations; the actions in this section relate to aspects of work over which Massey University does have some control.
Identified issue Actions Tasks Responsibility
Of the female workforce of 1914 at Massey University, general staff women account for 1288 or 66%. Of the 1288 female general staff, 65% (842) work in female-dominated jobs.
3.1 Ensure that ‘women’s work’ is fairly sized and fairly paid
3.1.1 Identify which of the benchmark jobs that have been job sized using the new job evaluation system are female-dominated, male-dominated or mixed-gender
AVC POD
3.1.2 Contract an external expert in the Equitable Job Evaluation (EJE) system to ‘calibrate’ Massey University’s new IPE job evaluation system to ensure that all dimensions of the job are considered, specifically that it takes into account female dimensions of work
POD
3.1.3 Undertake regular four yearly audits of job evaluation system.
POD
3.2 Eliminate gender stereotyping and gender bias in recruitment and selection practices
3.2.1 Establish a job title framework and processes to ensure consistency across Massey University
POD
3.2.2 Take action to challenge assumptions about certain positions being ‘women’s work’ or ‘men’s work’
In Massey University advertising, highlight women who are employed in traditionally male-dominated work
Make advertising and recruitment strategies target the non-dominant gender group Check that recruitment agencies used by Massey University search for applicants of both genders and actively consider
POD
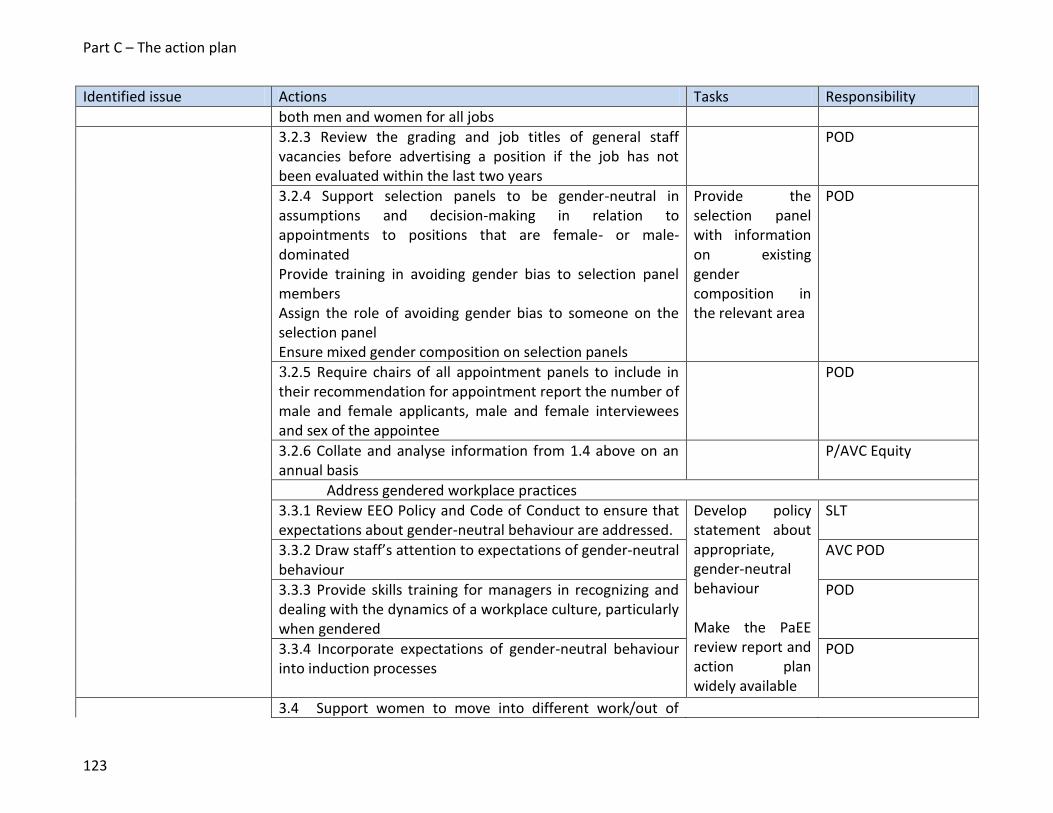
Part C – The action plan
123
Identified issue Actions Tasks Responsibility
both men and women for all jobs
3.2.3 Review the grading and job titles of general staff vacancies before advertising a position if the job has not been evaluated within the last two years
POD
3.2.4 Support selection panels to be gender-neutral in assumptions and decision-making in relation to appointments to positions that are female- or male-dominated Provide training in avoiding gender bias to selection panel members Assign the role of avoiding gender bias to someone on the selection panel Ensure mixed gender composition on selection panels
Provide the selection panel with information on existing gender composition in the relevant area
POD
3.2.5 Require chairs of all appointment panels to include in their recommendation for appointment report the number of male and female applicants, male and female interviewees and sex of the appointee
POD
3.2.6 Collate and analyse information from 1.4 above on an annual basis
P/AVC Equity
Address gendered workplace practices
3.3.1 Review EEO Policy and Code of Conduct to ensure that expectations about gender-neutral behaviour are addressed.
Develop policy statement about appropriate, gender-neutral behaviour
Make the PaEE review report and action plan widely available
SLT
3.3.2 Draw staff’s attention to expectations of gender-neutral behaviour
AVC POD
3.3.3 Provide skills training for managers in recognizing and dealing with the dynamics of a workplace culture, particularly when gendered
POD
3.3.4 Incorporate expectations of gender-neutral behaviour into induction processes
POD
3.4 Support women to move into different work/out of

Pay and Employment Equity Review Report and Action Plan
124
Identified issue Actions Tasks Responsibility
female-dominated work if they desire
3.4.1 Hold career-planning workshops specifically for general staff to: Build skills in submitting applications for vacancies Build skills for achieving higher-graded positions Undertake targeted professional development towards the next career move Identify career pathways for general staff
POD
3.4.2 Provide skill training for managers in working with staff on career development and use of PRPs
POD
3.5 Make part-time work legitimately available in a wide range of positions (see detail later in Action Plan)

Part C – The action plan
125
4. Women are under-represented in senior positions and over-represented in lower positions
The issue Women are under-represented in senior positions in management, academia and general staff positions at Massey University (relative to men and to women’s overall representation), and over-represented in academic and general staff areas in lower paid and lower status positions. Desired outcome Women comprise 50% of the Senior Leadership Team and all Tier 3 management positions (e.g., Heads of Department, Directors) by 2015. The representation of women in senior academic and general staff positions increases annually up to 2015.
Identified issue Actions Tasks Responsibility
Senior management Women comprise 33% of the Senior Leadership Team. Women comprise 34% of Level 3 managers (39 women and 77 men).
4.1 Prepare and encourage women to apply for senior roles at Tier 2 and Tier 3
4.1.1 Actively encourage women into Head of Department and other Tier 3 roles
Reinforce the use of the Women in Leadership Programme
VC, PVCs and AVCs
4.1.2 Actively encourage suitable female candidates in Tier 3 roles to apply for SLT vacancies
VC, PVCs and AVCs
4.1.3 Develop and implement a succession plan for SLT SLT
4.2 Create a women-friendly environment for Tier 3 and SLT positions (See also 8.2.1, 8.2.2, 8.2.3)
4.2.1 Consider whether vacancies could accommodate part-time, job sharing or other flexible alternatives
AVC POD
4.2.2 Investigate the experience of women in Tier 3 positions in relation to the management culture and gender inclusion/exclusion
P/AVC Equity
4.2.3 Critically review, and report on, the operation and culture of SLT in terms of gender inclusion
VC and P/AVC Equity
4.3 Monitor membership of SLT
4.3.1 Review Tier 3 management and SLT in terms of gender composition, recent appointments, and succession planning activities focused on women
P/AVC Equity
Academia 4.4 Provide avenues to make senior academic women visible

Pay and Employment Equity Review Report and Action Plan
126
Identified issue Actions Tasks Responsibility
Women comprise 54% of lecturers, but a glass ceiling operates beyond this level. Women’s representation decreases significantly to 37% at senior lecturer level, to 32% at associate professor level, and just 14% at professor level.
(role modelling)
4.4.1 Raise profile of senior women, e.g., articles in Massey News
AVC External Relations
4.4.2 Ensure that the obligations of women selected for the Women in Leadership programme, to transfer knowledge gained through the programme, are fulfilled
Massey University manager of Women in Leadership applications
4.4.3 Appoint women to positions on Massey University boards or external boards on which Massey University has a representative
SLT
4.5 Encourage and support women to prepare for senior positions
4.5.1 Direct colleges and AVC areas to budget, and use their budget, for training and development to prepare women for senior roles
SLT
4.5.2 Provide resources to fund mentoring options for academic women at Massey University
(See other actions related to encouraging women to apply for promotion at 9.1)
POD
General staff In the general staff pay structure, 1617 of the total 1995 general staff (81%), are located in the GENERAL staff grades, which range from Grade A to Grade I. Women are under-represented in the higher general staff grades with a glass ceiling appearing around Grade G.
4.6 Review academic promotions criteria for gender equity (for details see 9.2.of this plan)
4.7 Check that senior positions that are traditionally ‘women’s work’ are fairly sized and fairly paid
4.7.1 Identify key benchmark jobs from within female-dominated occupations in senior positions
POD/TEU
4.7.2 Subject these jobs to job sizing under the new IPE job evaluation system.
POD
4.7.3 Contract an external expert in the Equitable Job Evaluation (EJE) system to ‘calibrate’ Massey University’s new IPE job evaluation system to ensure that to ensure that all dimensions of the job are considered, specifically that it takes
POD

Part C – The action plan
127
Identified issue Actions Tasks Responsibility
In Grades A to Grade F women comprise more than 50% of the group. In the top three grades Grade G, Grade H and Grade I, women comprise less than 50% of the group. Just 13% of all general staff women are located in these top three grades, compared with 30% of general staff men.
into account female dimensions of work
4.8 Investigate reasons why few women are in jobs graded G, H and I
4.8.1 Investigate why few women are in senior general positions, specifically:
the number and nature of positions in Grades G, H and I
the application and appointment rate of women and men to these positions in the last two years
starting salaries of male and female appointees to Grades G, H and I in the last two years
barriers to women taking these positions
Consider manager flexibility in setting grade, step in grade, flexibility in negotiation, any moderation
AVC POD,P/AVC Equity & TEU
4.9 Provide avenues to make senior women visible (role modelling
4.9.1 Raise profile of senior women, e.g., articles in Massey News
Run focus groups to investigate, if women are not applying, the reasons this is so and how this can be addressed
AVC External Relations
4.9.2 Ensure that the obligations of women selected for the Women in Leadership programme, to transfer knowledge gained through the programme, are fulfilled
Massey University manager of Women in Leadership applications
4.9.3 Appoint women to positions on Massey University boards or external boards on which Massey University has a representative
SLT
4.10 Encourage and support women to apply for senior positions
4.10.1 Provide resources to fund mentoring options for general staff women at Massey University, aimed at preparing interested women, especially but not only, in the specific departments where women are under-represented
POD
4.10.2 Direct schools and AVC areas to budget, & use their budget, for training & development to prepare women for
SLT

Pay and Employment Equity Review Report and Action Plan
128
Identified issue Actions Tasks Responsibility
senior roles
4.10.3 Encourage applications from women for more senior vacancies.
Managers, Women @ Massey University Managers
5. Women’s starting salaries are lower than those of men
Data available for the last two years in relation to average starting salaries for men and women show a tendency for female appointees to be paid less than men. There are ten occupations being considered for further analysis. Data were collected for a further 18 occupations, but of these eight had single-sex incumbents, three had numbers which were too small to consider for privacy reasons, and in seven occupations the pay difference was 3% or less (which is considered to be too small to warrant further investigation). Of the remaining ten occupations, men were appointed on higher starting salaries than women in eight occupations, and in 2 (Research Officer, and Welfare Support Workers), women were on average appointed on higher salaries than men. As a specific example, in the past two years, female tutors were appointed on lower starting salaries than male tutors, with a pay gap of 13%. There is also a pay gap of 5% for senior tutors. The issue Women’s starting salaries are lower than those of men in some occupations Desired outcome(s) Starting salaries are equitable by gender by 2012.
Identified issue Actions Tasks Responsibility
Preliminary data shows that, where there is a gender difference in starting salaries greater than 3% for the same position, female appointees tend to be paid less than male appointees.
5.1 Investigate the ten occupations further
5.1.1. Undertake further analysis of the starting salary differences for these 10 occupations: Tutors, particularly in Manawatu (see 5.5) Senior Tutors in Albany (see 5.5) Post-doctoral fellow Education Advisers and Reviewers General Clerks ICT Customer Support Officers Programme or Project Administrators
POD & PaEE implementation committee

Part C – The action plan
129
Identified issue Actions Tasks Responsibility
Science Technicians not elsewhere classified (see 2.4, 2.5 and 2.6) Research Officer Welfare Support Officers especially Residential Advisers
5.1.2 Recommend, where differences are not justified, appropriate action to remedy anomaly(ies)
POD & PaEE implementation committee
5.1.3 Analyse the process of how these starting salaries are set in practice, and where gender bias can occur, for example: The setting of the grade for position The setting of the salary level – the step or placement within the grade The exercise of management discretion, both in making the initial offer and subsequent negotiations Factors affecting salary negotiations including relativity with others in team Moderation or lack of in relation to starting rate
POD& PaEE implementation committee
5.1.4 Develop and make available a paper, especially but not only for managers, outlining how and where gender bias is most likely to occur (e.g., different offers to male and female appointees, dealing with appointee’s attempts to negotiate, account taken of other factors such as current salary, dealing with inequities that may arise between new and current staff), and steps for preventing it from occurring
POD & PaEE implementation committee
5.2 Moderate starting salaries
5.2.1 For a limited period of time, set up a moderation process of starting salaries for all appointments, which includes checking titles of positions to ensure the same or similar positions are not being paid differently
POD
5.2.2 Establish moderated process for approval for exceptions above the top step
POD

Pay and Employment Equity Review Report and Action Plan
130
Identified issue Actions Tasks Responsibility
5.3 Provide training for managers
5.3.1 Draw manager’s attention to pattern of women being appointed at slightly lower salary levels than men
POD
5.3.2 Provide skills training and guidelines for managers in the dynamics of setting starting salaries, including the places in which gender bias is more likely to occur, and how to manage it
POD & Manager, Equity and Diversity
5.4 Monitor starting salaries
5.4.1 Monitor, and review on an annual basis, all average starting salaries for women and men appointed to the same position
POD
5.4.2 Where appropriate, take action to address identified anomalies.
POD & AVC Equity
In the last two years nine male tutors and 23 female tutors have been appointed to Massey University, with the average starting salary for female tutors being $50,300 and for male tutors $57,000. This is a pay gap of 13%. While there is some variation, a pay gap for female tutors persisted across all campuses. (There is also a pay difference of 4% in favour of men for senior tutors.)
5.5 Eliminate gender bias from starting salaries for tutors
5.5.1 Establish Massey University guidelines for determining starting salary steps for tutors and senior tutors
POD
5.5.2 Establish moderated process for approval for exceptions above the top step of the range
PVCs and POD
5.6 Capture key data
5.6.1 Establish comprehensive monitoring processes within Massey University to track and report data on tutors such as recruitment, interviewing, hiring, salaries, accelerated increments / steps etc.
AVC POD
5.6.2 Review what has changed in terms of pay for women tutors after two years
POD
5.6.3 At the next salary review Carefully examine the salary level of every female tutor and senior tutor for relativity to check whether gender has (even unintentionally) impacted negatively on their current position in the salary scale Report findings to AVC POD through SLT
Relevant PVC & SLT

Part C – The action plan
131
6. Women are over-represented in tutor and senior tutor academic positions
Women are over-represented in tutor and senior tutor positions at Massey University. This matters because these positions are “non-career” academic positions, meaning there is no promotion or direct career path to more senior academic roles from these positions. The issue Women are over-represented in tutor and senior tutor academic positions. Desired outcome(s) Women are not over-represented in tutor and senior tutor academic positions.
Identified issue Actions Tasks Responsibility
There are 55 female tutors and 21 male tutors at Massey University, and 68 female senior tutors compared with 56 male senior tutors. Women comprise 72% of tutor positions and 55% of senior tutor positions. In short:
Women are over-represented in both tutor and senior tutor positions There is no direct career path from these positions to more senior academic roles.
6.1 Clarify the tutor and senior tutor role
6.1.1 Review the purpose and need of tutor and senior tutor roles
AVC Academic, AVC POD
6.1.2 Review the core work currently undertaken by tutors and senior tutors
AVC Academic, AVC POD
6.1.3 Develop a clear generic role description for tutors and senior tutors specifying clearly the career path
AVC POD
6.2 Establish a joint TEU/Massey University working group on tutors
6.2.1. Review individual cases where tutors or senior tutors believe they are performing in a lecturer role
TEU/Massey University working group, AVC POD
6.2.2 Establish a process to enable senior tutors with PhDs, who are currently lecturing and coordinating courses, and who want to be research active and progress to a lecturer position, to do so
TEU/Massey University working group
6.2.3 Review the current career path and/or career options for senior tutors, tutors and assistant lecturers
6.2.4 Provide a career path, support and guidance to tutors and senior tutors wanting to move into a career academic
TEU/Massey University working
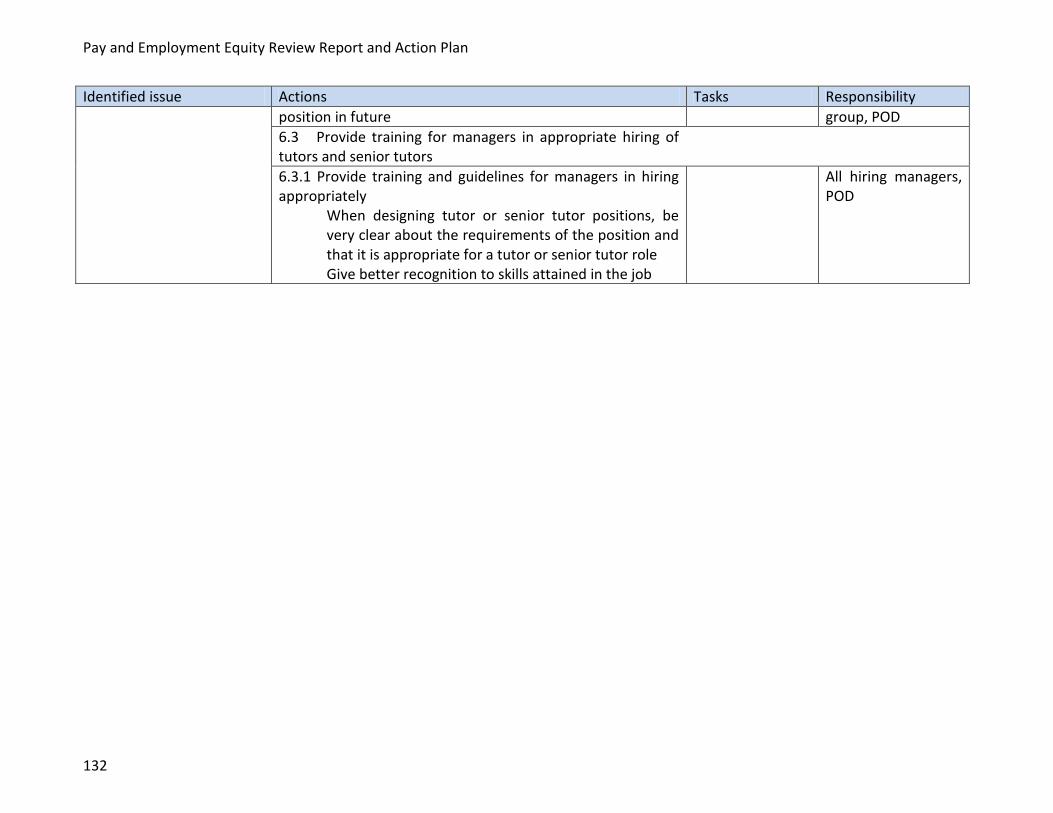
Pay and Employment Equity Review Report and Action Plan
132
Identified issue Actions Tasks Responsibility
position in future group, POD
6.3 Provide training for managers in appropriate hiring of tutors and senior tutors
6.3.1 Provide training and guidelines for managers in hiring appropriately
When designing tutor or senior tutor positions, be very clear about the requirements of the position and that it is appropriate for a tutor or senior tutor role Give better recognition to skills attained in the job
All hiring managers, POD

Part C – The action plan
133
7. Academic women are over-represented on fixed term agreements
Nearly a quarter of all female academics (24% or 151) are employed on fixed-term contracts compared with 15% (115) of men. This is a potential gender equity issue because fixed-term contracts, by definition, do not offer security of employment, and also limit access to the range of benefits enjoyed by permanent staff such as staff development, research leave, and promotion opportunities. There is a need to understand whether or not there is any gender bias in the use of fixed term agreements, and the recruitment of women to these positions. The issue Academic women are over-represented on fixed term agreements. Desired outcome There is no gender bias in the use of fixed-term agreements at Massey University.
Identified issue Actions Tasks Responsibility
Among lower-paid academics, there is a total of 161 staff employed on fixed-term agreements. Sixty of these are men and 101 are women. Massey University recruits more women than men into fixed-term, often ‘non-career’ academic positions. It is unclear why.
7.1 Review the use of academic fixed-term agreements for gender bias
7.1.1 Investigate the continued existence of ‘rolling contracts’
PaEE implementation committee
7.1.2 Review academic fixed-term agreements over the past two years to identify why more women are on fixed term agreements than men, including:
What kind and level of positions are being offered on a fixed-term basis How many have been used to cover parental leave/sickness/specific projects, etc. How many meet the test of ‘genuine reasons based on reasonable grounds’ Which positions women are being recruited into
PaEE implementation committee
7.2 Understand the factors contributing to large numbers of women being appointed on fixed-term agreements
7.2.1 Analyse the gender breakdown of the applicant pool for advertised fixed term positions
POD
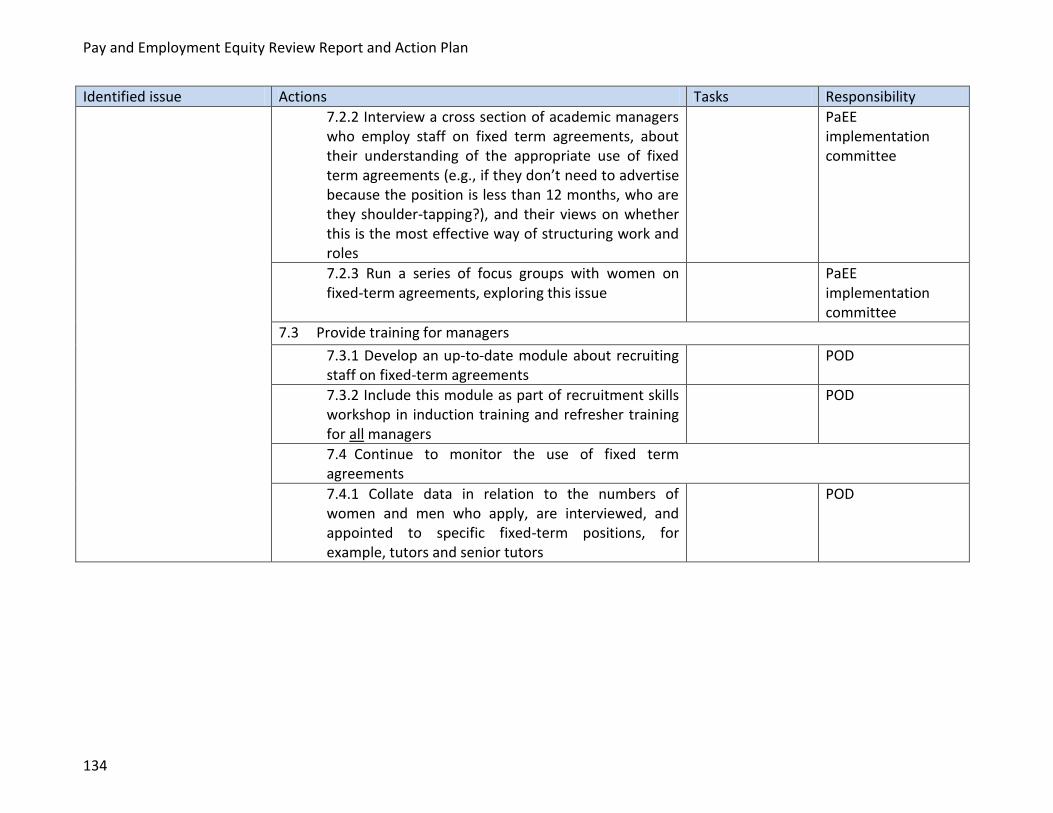
Pay and Employment Equity Review Report and Action Plan
134
Identified issue Actions Tasks Responsibility
7.2.2 Interview a cross section of academic managers who employ staff on fixed term agreements, about their understanding of the appropriate use of fixed term agreements (e.g., if they don’t need to advertise because the position is less than 12 months, who are they shoulder-tapping?), and their views on whether this is the most effective way of structuring work and roles
PaEE implementation committee
7.2.3 Run a series of focus groups with women on fixed-term agreements, exploring this issue
PaEE implementation committee
7.3 Provide training for managers
7.3.1 Develop an up-to-date module about recruiting staff on fixed-term agreements
POD
7.3.2 Include this module as part of recruitment skills workshop in induction training and refresher training for all managers
POD
7.4 Continue to monitor the use of fixed term agreements
7.4.1 Collate data in relation to the numbers of women and men who apply, are interviewed, and appointed to specific fixed-term positions, for example, tutors and senior tutors
POD
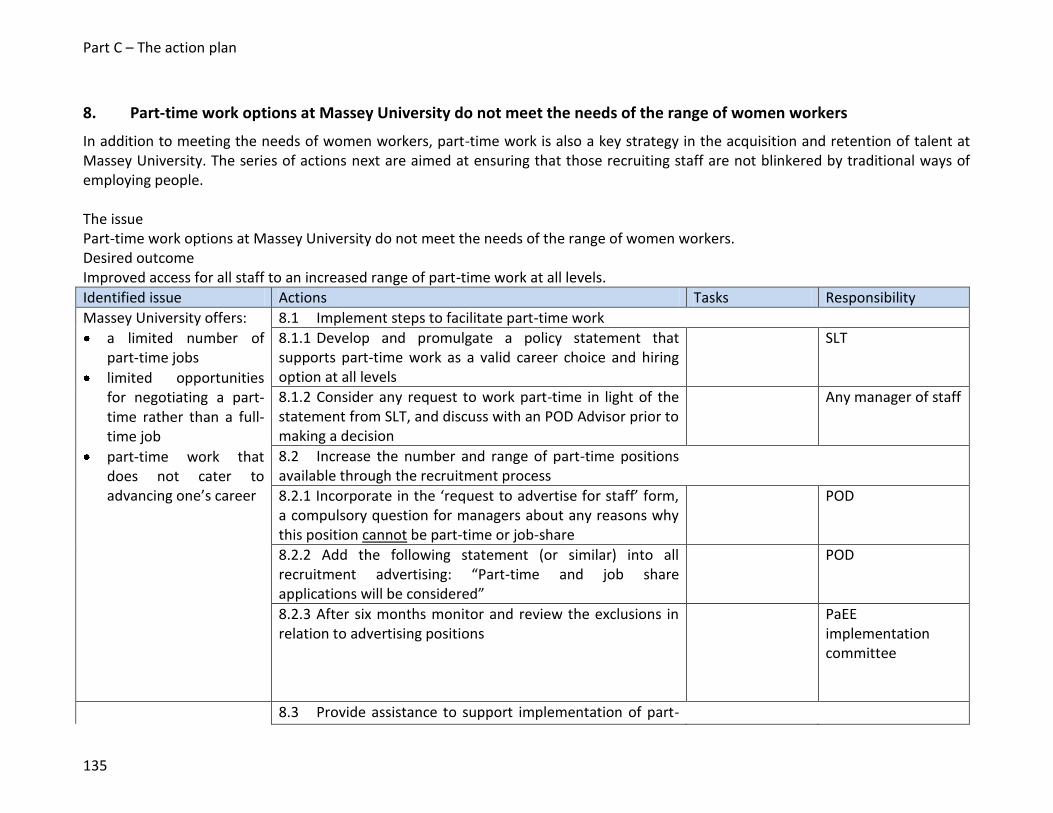
Part C – The action plan
135
8. Part-time work options at Massey University do not meet the needs of the range of women workers
In addition to meeting the needs of women workers, part-time work is also a key strategy in the acquisition and retention of talent at Massey University. The series of actions next are aimed at ensuring that those recruiting staff are not blinkered by traditional ways of employing people. The issue Part-time work options at Massey University do not meet the needs of the range of women workers. Desired outcome Improved access for all staff to an increased range of part-time work at all levels.
Identified issue Actions Tasks Responsibility
Massey University offers:
a limited number of part-time jobs
limited opportunities for negotiating a part-time rather than a full-time job
part-time work that does not cater to advancing one’s career
8.1 Implement steps to facilitate part-time work
8.1.1 Develop and promulgate a policy statement that supports part-time work as a valid career choice and hiring option at all levels
SLT
8.1.2 Consider any request to work part-time in light of the statement from SLT, and discuss with an POD Advisor prior to making a decision
Any manager of staff
8.2 Increase the number and range of part-time positions available through the recruitment process
8.2.1 Incorporate in the ‘request to advertise for staff’ form, a compulsory question for managers about any reasons why this position cannot be part-time or job-share
POD
8.2.2 Add the following statement (or similar) into all recruitment advertising: “Part-time and job share applications will be considered”
POD
8.2.3 After six months monitor and review the exclusions in relation to advertising positions
PaEE implementation committee
8.3 Provide assistance to support implementation of part-

Pay and Employment Equity Review Report and Action Plan
136
Identified issue Actions Tasks Responsibility
time work options
8.3.1 Develop guidelines and resources for assisting all managers (academic and general) to explore and create ways of making full-time positions part-time
Tool kit (see DOL quality flexible work policy) Checklist of questions to ask/issues to consider Training for managers
POD
8.3.2 Provide support for staff wanting to negotiate part-time arrangements
Info/resource pack
POD
8.3.3 Consider the development of specialist expertise within POD to support part-time options.
POD
8.4 Ensure that part-time staff receive PRPs
8.4.1 Ensure that part-time staff receive the same access to PRPs as full- time staff
POD
8.4.2 Monitor implementation of PRPs Managers POD
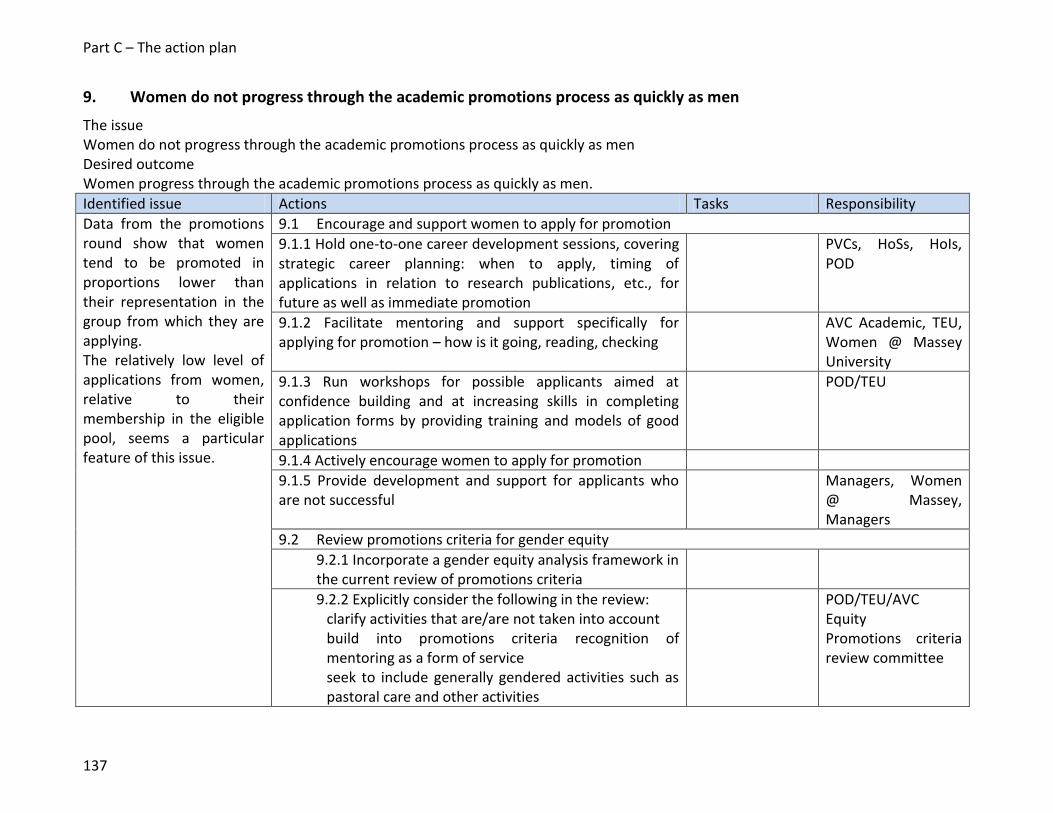
Part C – The action plan
137
9. Women do not progress through the academic promotions process as quickly as men
The issue Women do not progress through the academic promotions process as quickly as men Desired outcome Women progress through the academic promotions process as quickly as men.
Identified issue Actions Tasks Responsibility
Data from the promotions round show that women tend to be promoted in proportions lower than their representation in the group from which they are applying. The relatively low level of applications from women, relative to their membership in the eligible pool, seems a particular feature of this issue.
9.1 Encourage and support women to apply for promotion
9.1.1 Hold one-to-one career development sessions, covering strategic career planning: when to apply, timing of applications in relation to research publications, etc., for future as well as immediate promotion
PVCs, HoSs, HoIs, POD
9.1.2 Facilitate mentoring and support specifically for applying for promotion – how is it going, reading, checking
AVC Academic, TEU, Women @ Massey University
9.1.3 Run workshops for possible applicants aimed at confidence building and at increasing skills in completing application forms by providing training and models of good applications
POD/TEU
9.1.4 Actively encourage women to apply for promotion
9.1.5 Provide development and support for applicants who are not successful
Managers, Women @ Massey, Managers
9.2 Review promotions criteria for gender equity
9.2.1 Incorporate a gender equity analysis framework in the current review of promotions criteria
9.2.2 Explicitly consider the following in the review: clarify activities that are/are not taken into account build into promotions criteria recognition of mentoring as a form of service seek to include generally gendered activities such as pastoral care and other activities
POD/TEU/AVC Equity Promotions criteria review committee

Pay and Employment Equity Review Report and Action Plan
138
Identified issue Actions Tasks Responsibility
9.2.3 Make public the result of deliberations and whether and how such activities are considered in the promotions process
Promotions criteria review committee
9.3 Review the role of managers in promotions
9.3.1 Review guidelines provided to managers for how to support/encourage applications especially from women
POD
9.3.2 Review provisions for dealing with ‘personality’ or other conflicts between managers and applicants
POD
9.3.3 Review options for how managers ensure applications which are outside their field of expertise are “spoken to” at promotion committee meetings
POD
9.4 Ensure gender equity is a focus of promotions process
9.4.1 Provide gender equity training at commencement of each promotional round for committees
POD
9.4.2 Ensure that union observers are trained to take gender equity into account
TEU
9.4.3 Require all college promotion committees to comprise at least 40% of each gender
SLT
9.5 Monitor and report promotion statistics by gender
9.5.1 On an annual basis, ensure information about the number of applications received and promotions awarded is collected by gender for all levels of academic promotion
POD
9.5.2 Establish annual reporting to SLT and staff about this promotions information, noting trends and changes
POD

Part C – The action plan
139
10. Dissatisfaction about bullying, harassment, discrimination and other inappropriate behaviour and how these are addressed
The issue A concerning number of men and women have experienced bullying, harassment, discrimination and other inappropriate behaviour, and there is a high level of dissatisfaction about how complaints are handled. Desired outcome Massey University facilitates and provides a safe working environment for all staff, free from bullying, harassment, discrimination and other inappropriate behaviour, and that any complaints are satisfactorily resolved.
Identified issue Actions Tasks Responsibility
A concerning number of both women and men have experienced bullying harassment, discrimination or other inappropriate behaviour. In addition the proportions of women experiencing this unacceptable behaviour are much higher. Dissatisfaction, from both women and men who used them, in relation to how complaints of bullying, harassment, discrimination and other inappropriate behaviour were handled.
10.1 Set the standard
10.1.1 Develop and communicate a clear statement that: bullying, harassment, discrimination and other inappropriate behaviour are completely unacceptable the workplace culture that tolerates these behaviour needs to change
SLT
10.1.2 Develop a communication strategy around the messages in the statement that articulates the desired workplace culture
AVC POD
10.2 Better understand the issues
10.2.1 Run focus groups and/or individual interviews to: clarify the issues that need to be addressed for women and for men better understand the problems with the current complaints processes discover what would restore women’s confidence that Massey University would address concerns/complaints
AVC POD & TEU

Pay and Employment Equity Review Report and Action Plan
140
Identified issue Actions Tasks Responsibility
Women have less confidence than men that Massey University would address and resolve any concerns or complaints of bullying, harassment, discrimination and other inappropriate behaviour.
10.3 Review the complaints system
10.3.1 Review current processes for handling concerns or complaints of bullying, harassment, discrimination or other inappropriate behaviour.
AVC POD & TEU
10.3.2 Revise or rebuild the current system to improve processes for having concerns or complaints addressed
Make information about how to address concerns or complaints widely available to staff
Consider whether a statement or specific reference to dealing with bullying and harassment could be added to the Collective Agreement.
Develop an Evaluation Form (voluntary) to be provided to all participants in any formal complaint process and use the information to improve processes
AVC POD & TEU AVC POD TEU with AVC POD POD
10.3.3 Develop training for managers in dealing with concerns or complaints of bullying, harassment, discrimination or other inappropriate behaviour
AVC POD
10.3.4 Undertake training and regular refreshers in how to handle concerns and complaints of bullying, harassment, discrimination or other inappropriate behaviour
All managers with staff responsibilities
10.3.5 Explore the addition of a 360 degree survey of managers to the PRP system
AVC POD
10.4 Review harassment contact network
10.4.1 Consult the current harassment coordinators and contact people to review the ‘health’ of the contact network.
AVC POD & TEU
10.4.2 For any issues identified, provide additional resources and training.
AVC POD & TEU
10.5 Facilitate support for staff who may have been bullied or harassed

Part C – The action plan
141
Identified issue Actions Tasks Responsibility
10.5.1 Explore the options for establishing an advocacy service, funded by, but independent from, Massey University (e.g., like an employee ombudsman role) for staff who may have been bullied or harassed
AVC POD, P/AVC Equity
10.5.2 Establish highly visible information for staff about options they have in the event of being bullied, harassed, discriminated against or being subject to inappropriate behaviour
Intranet – clear definitions, FAQs, resources Posters and notices Information about people to contact
POD, P/AVC Equity
10.6 Monitor and review
10.6.1 Establish and implement a process for recording and monitoring formal complaints, ensuring data on gender as well as college/department, etc., are recorded and report on these as part of regular HR information to SLT
AVC POD
10.6.2 Establish six-monthly review sessions with TEU to progress all actions
AVC POD
10.6.3 In two years, seek staff feedback again on changes that have occurred in relation to bullying, harassment, discrimination or other inappropriate behaviour (using these findings from the PaEE review as a baseline)
AVC POD
Appendices
Appendix 1: The Pay and Employment Equity Review Survey Appendix 2: Relevant Institutional Information (Summary) Appendix 3: PEEAT - Summary List of Gender Differences Appendix 4: PaEE Review Survey – Summary of Respondent Population Appendix 5: Summary of Survey Questions Cut by Gender Appendix 6: Open-ended Survey Question 31 Appendix 7: Massey University Salary Scales Appendix 8: Science Technicians Appendix 9: Statistical Analysis of General Staff by Letter Grade. Appendix 10: Gender Differences in Pay by Grade

Appendices
141
Appendix 1: Pay and Employment Equity Review Survey
Pay and employment equity aims to ensure that pay, conditions of work, access to the full range of jobs at all levels of the workplace, and experiences at work, are not affected by gender.
A Massey University project team is currently undertaking an internal review of pay and employment equity (PaEE). The review will:
consider the work experiences of men and women according to three key equity factors (rewards, participation, and respect and fairness)
identify what is working well
identify what needs to be improved and how this will be achieved.
The purpose of this survey is to assist the committee in understanding whether gender affects employment at Massey University; specifically if and how gender contributes to lower pay for women and lower levels of representation in some types of work and in more senior positions. We are seeking the views of both men and women in response to these issues. The information sought is a combination of your own experience and your views and opinions.
There are two parts to the survey:
Part A About you
This part asks for information about you, which will be used only in aggregated form, to understand the responses from different groups of people
Part B Equity indicators
The survey is structured around three equity indicators – rewards, participation, and respect and fairness.
Rewards: concerned with pay, advancement and seniority.
Participation: issues that affect people’s ability to participate fully, such as training and development, the ability to influence, promotions and flexible work.

Pay and Employment Equity Review Report and Action Plan
142
Respect and fairness: being treated fairly, in relation to issues such as discrimination and harassment, performance management, and the actions of managers.
CONFIDENTIALITY. Your responses to the survey are completely confidential. No individual will
be identified by their responses. The external research company managing the survey will de-link any identifying information from the survey data set before it is returned to the PaEE review project manager. The emphasis in this review is on patterns, not individuals. Comments provided in the survey will be grouped into themes and those themes summarised in the final report. For further information please refer to the information sheet approved by the Massey University Human Ethics committee: http://www.massey.ac.nz/?a8afa5525w. Completion of the survey is voluntary, and you have the right to decline to answer any particular question, by simply moving to the next question or, in some cases, clicking the button ‘prefer not to say’. The exception to this is the first question which asks you to state your gender. This is compulsory, given the subject of the survey. Completion and return of the survey implies consent.
INSTRUCTIONS:
The survey should take no more than 20 minutes to complete.
You will be asked to click in the relevant circle or checkbox, or where comment has been invited, click in the box and type.
Using the 'back' button on your browser you can go back to the previous page and make changes to your responses. If you are not able to complete the survey in one go, you can use the ‘come back later’ button. Please note however, that when you return to the survey, you will no longer be able to browse the data submitted in your previous sitting. Once you have completed the survey, you will be invited to submit the survey with a reminder that doing so implies consent.
If you have any questions about this survey, please contact Rae Torrie via email at [email protected]
Please enter the code provided in your letter in the box below.

Appendices
143
PART A – ABOUT YOU
First, we would like some information about you. Note: this information is for statistical purposes only and will be kept entirely confidential.
Are you:
Male
Female
Which age group do you belong to?
Which ethnic group(s) do you identify with? (Click all those that apply)
Māori Tongan
New Zealand European/ Pakeha
Niuean
Non-New Zealand European
Chinese
Samoan Indian
Cook Island Maori Other (please specify)
Under 25
25-29
30-34
35-39
40-44
45-49
50-54
55-59
60-64
65 years and over

Pay and Employment Equity Review Report and Action Plan
144
What is your current employment status?
Full-time (30 hours or more) permanent
Full-time (30 hours or more) fixed term agreement
Part-time (less than 30 hours a week) permanent
Part-time (less than 30 hours a week) fixed term agreement
Casual
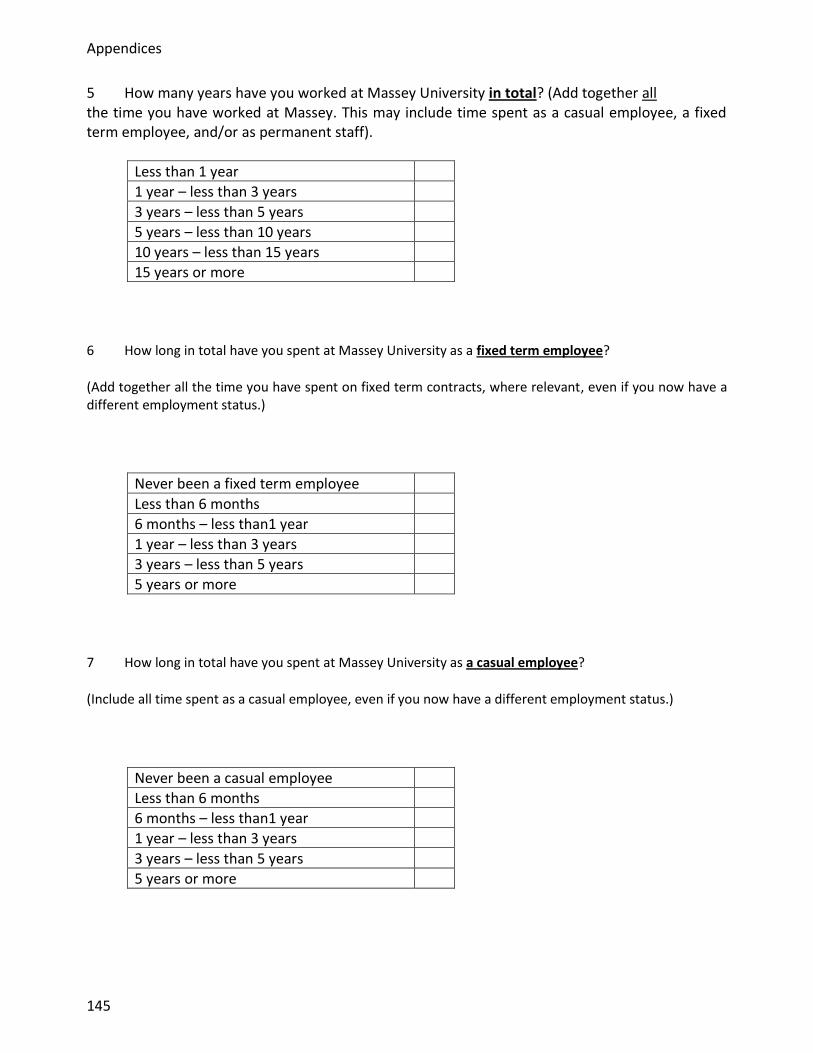
Appendices
145
5 How many years have you worked at Massey University in total? (Add together all the time you have worked at Massey. This may include time spent as a casual employee, a fixed term employee, and/or as permanent staff).
Less than 1 year
1 year – less than 3 years
3 years – less than 5 years
5 years – less than 10 years
10 years – less than 15 years
15 years or more
6 How long in total have you spent at Massey University as a fixed term employee?
(Add together all the time you have spent on fixed term contracts, where relevant, even if you now have a different employment status.)
Never been a fixed term employee
Less than 6 months
6 months – less than1 year
1 year – less than 3 years
3 years – less than 5 years
5 years or more
7 How long in total have you spent at Massey University as a casual employee?
(Include all time spent as a casual employee, even if you now have a different employment status.)
Never been a casual employee
Less than 6 months
6 months – less than1 year
1 year – less than 3 years
3 years – less than 5 years
5 years or more

Pay and Employment Equity Review Report and Action Plan
146
8 How long have you been in your current position, for example, library assistant, librarian, head of section librarian, lecturer, senior lecturer, associate professor?
(If you: - are an academic currently holding a management position, choose the management position. - hold two part-time positions; choose the position that is the larger - hold two part-time positions of equal size, select one.) NB: The next two questions will ask you other information about your position. If you have had to choose a position at this question, please use the same one for the next two questions.
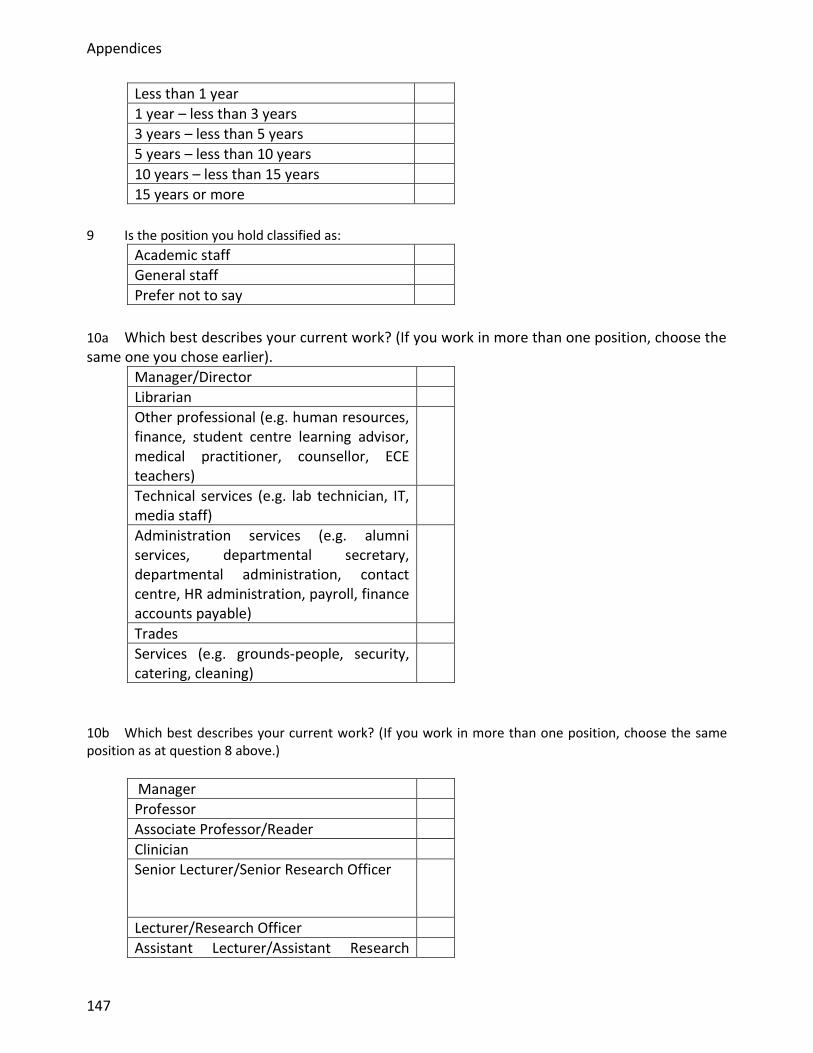
Appendices
147
Less than 1 year
1 year – less than 3 years
3 years – less than 5 years
5 years – less than 10 years
10 years – less than 15 years
15 years or more
9 Is the position you hold classified as:
Academic staff
General staff
Prefer not to say
10a Which best describes your current work? (If you work in more than one position, choose the same one you chose earlier).
Manager/Director
Librarian
Other professional (e.g. human resources, finance, student centre learning advisor, medical practitioner, counsellor, ECE teachers)
Technical services (e.g. lab technician, IT, media staff)
Administration services (e.g. alumni services, departmental secretary, departmental administration, contact centre, HR administration, payroll, finance accounts payable)
Trades
Services (e.g. grounds-people, security, catering, cleaning)
10b Which best describes your current work? (If you work in more than one position, choose the same position as at question 8 above.)
Manager
Professor
Associate Professor/Reader
Clinician Senior Lecturer/Senior Research Officer
Lecturer/Research Officer
Assistant Lecturer/Assistant Research

Pay and Employment Equity Review Report and Action Plan
148
Officer
Senior Research Fellow/Post-Doctoral Fellow
Research Fellow
Graduate Teaching Assistant
Senior Tutor
Tutor 11 Which best describes your level of seniority in the university?
Second tier manager (member of Senior Leadership Team – for example, PVC, AVC, RCE)
Third tier manager (manager who reports directly to member of Senior Leadership team – for example, Head of School, Head of Department, Director)
Manager or Team Leader below tier 3
Staff member/Not a manager
12 Which campus do you mostly work at?
Albany
Manawatu
Wellington
Other
13 Which school/institute/department do you belong to? (If you work across different schools/institutes/ departments please select the one where you spend most of your time; if you work 50/50 in two different locations, choose one.)
In using the drop down menu: If you are not sure which college, service division, or region you are part of, select the one that seems closest. If you cannot find your school/department/institute/section within that group, you will be able to go back and reselect a different group.)
Academic and open learning Education - Administration
AVC – Academic and open learning Education – Multimedia & Design
Ako Aotearoa Graduate School of Education
Centre for Academic Development & eLearning
MU School Administration by Computer
Library New Zealand Principal & Leadership Centre

Appendices
149
External Relations School of Arts, Development & Health Education
AVC – External Relations School of Curriculum & Pedagogy
Alumni School of Education – Albany
Communications School of Educational Studies
Marketing School of Teacher Education & Undergraduate Studies
Media & Publications Te Uru Maraurau/Dept of Maori & Multicultural Education
Finance, IT, Strategy, Commercial COLLEGE OF HUMANITIES & SOCIAL SCIENCE
AVC - Finance, IT, Strategy, Commercial
Academic Directors Office
Finance & Asset Management Centre for Defence Studies
Finance Operations Centre for Public Health Research
Information Technology Services College of Humanities & Social Sciences
Office of Strategy Management College Office - Albany
University Foundation Unit College Office - Wellington
MAORI & PACIFIC New Zealand Centre for Ecological Economics
AVC – Maori & Pacific Research Centre for Maori Health & Development
PEOPLE & ORGANISATIONAL DEVELOPMENT
Research School of Public Health
AVC – People & Organisational Development
School of English & Media Studies
HR – Administration – Wellington School of Health & Social Services
HR - Advisory School of History, Philosophy & Classics
HR – Employment Relations School of Language Studies
HR – Health & Safety School of Maori Studies
HR – Information & Systems School of People, Environment & Planning
HR – Services School of Psychology
RESEARCH School of Social & Cultural Studies
AVC – Research SHORE Research Centre
Centre for Academic Development & eLearning
Sleep/Wake Research Centre
Ethics COLLEGE OF SCIENCES
Graduate Research School College of Sciences
Library Institute of Food, Nutrition & Human Health
Research Management Services Institute of Fundamental Sciences

Pay and Employment Equity Review Report and Action Plan
150
Riddet Institute Institute of Information & Maths Sciences
The Allan Wilson Ctr for Molecular Ecology and Evolution
Institute of Molecular Bio Sciences
UNIVERSITY REGISTRAR Institute of Natural Resources
AVC – University Registrar Institute of Natural Sciences
National Student Administration and Teaching Support
Institute of Vet, Animal & Biomedical Sciences
National Student Relations New Zealand Institute of Advanced Study
Printery School of Engineering & Advanced Technology
Project Management Office Sciences PVC Office - Administration & Management
Risk Management The Allan Wilson Ctr for Molecular Ecology & Evol
COLLEGE OF BUSINESS REGIONAL OFFICE - ALBANY
Academic Programmes Administration
International Office
Dept of Communication, Journalism & Marketing
Kaiwhakahaere
Dept of Communication, Journalism & Marketing (AKL)
Regional Facilities Management - Albany
Dept of Economics & Finance Regional Office - Albany
Dept of Management Regional Registrar - Albany
Dept of Management & International Business
REGIONAL OFFICE - MANAWATU
Executive Education Agricultural Services
School of Accountancy Centre for University Prep & English Lang Studies
School of Aviation Commercial Operations
COLLEGE OF CREATIVE ARTS Regional Facilities Management - Manawatu
College of Creative Arts Regional Office - Manawatu
College of Creative Arts – Academic Office
Space & Timetabling
College of Creative Arts – Business & Operations
Student Life
College of Creative Arts – Research Office
REGIONAL OFFICE - WELLINGTON
Institute of Communication Design Buildings & Facilities - Wellington
Institute of Design for Industry & Environment
Client Services - Wellington
School of Design – Albany Corporate and Student Services

Appendices
151
School of Fine Arts Office of Te Kaiwawao
School of visual & Material Culture Regional Office - Wellington
COLLEGE OF EDUCATION VICE-CHANCELLORS OFFICE & ADMINISTRATION
Centre for Educational Development Vice-Chancellors Office & Administration
College of Education NZ School of Music
Education – Academic Services
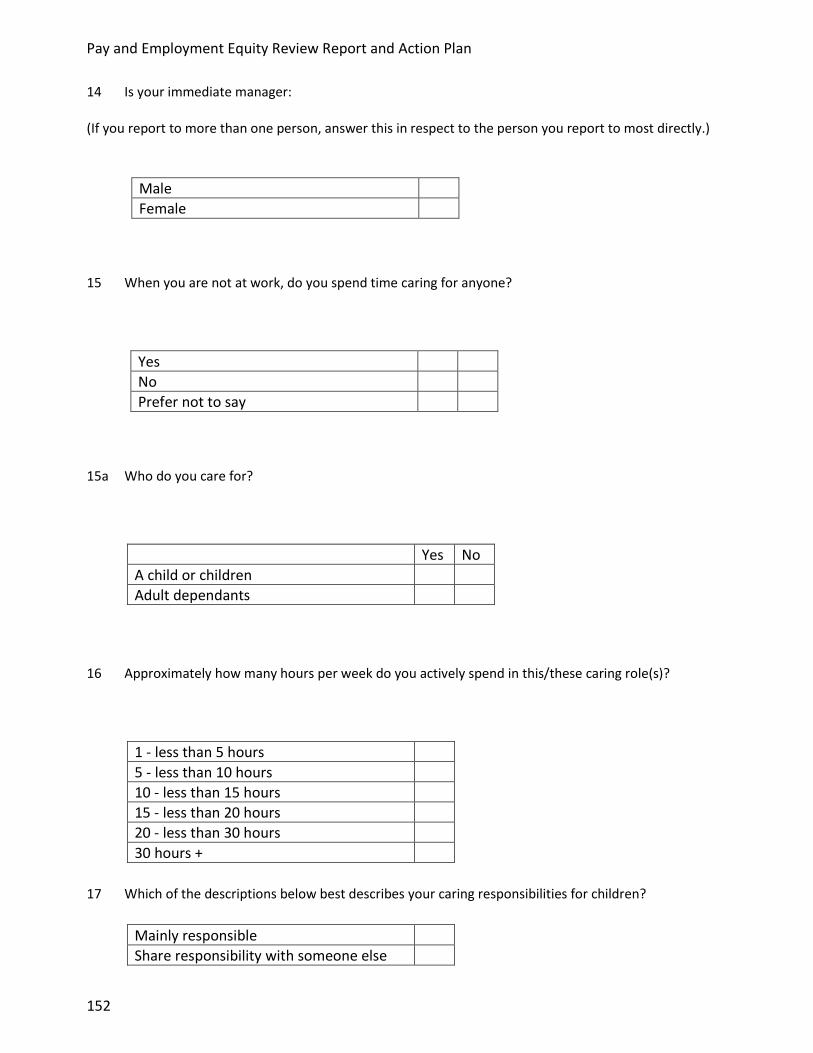
Pay and Employment Equity Review Report and Action Plan
152
14 Is your immediate manager:
(If you report to more than one person, answer this in respect to the person you report to most directly.)
Male
Female
15 When you are not at work, do you spend time caring for anyone?
Yes
No
Prefer not to say
15a Who do you care for?
Yes No
A child or children
Adult dependants
16 Approximately how many hours per week do you actively spend in this/these caring role(s)?
1 - less than 5 hours
5 - less than 10 hours
10 - less than 15 hours
15 - less than 20 hours
20 - less than 30 hours
30 hours +
17 Which of the descriptions below best describes your caring responsibilities for children?
Mainly responsible
Share responsibility with someone else

Appendices
153
Am not the main carer
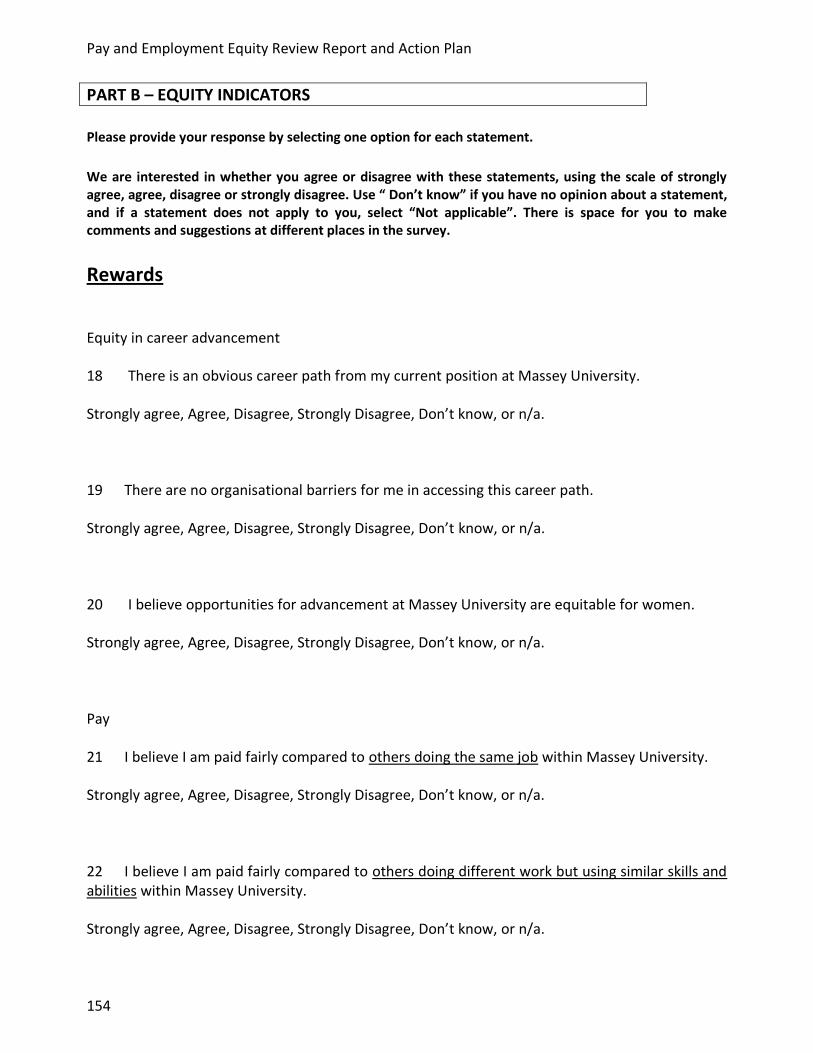
Pay and Employment Equity Review Report and Action Plan
154
PART B – EQUITY INDICATORS Please provide your response by selecting one option for each statement.
We are interested in whether you agree or disagree with these statements, using the scale of strongly agree, agree, disagree or strongly disagree. Use “ Don’t know” if you have no opinion about a statement, and if a statement does not apply to you, select “Not applicable”. There is space for you to make comments and suggestions at different places in the survey.
Rewards
Equity in career advancement
18 There is an obvious career path from my current position at Massey University.
Strongly agree, Agree, Disagree, Strongly Disagree, Don’t know, or n/a.
19 There are no organisational barriers for me in accessing this career path.
Strongly agree, Agree, Disagree, Strongly Disagree, Don’t know, or n/a.
20 I believe opportunities for advancement at Massey University are equitable for women.
Strongly agree, Agree, Disagree, Strongly Disagree, Don’t know, or n/a.
Pay
21 I believe I am paid fairly compared to others doing the same job within Massey University.
Strongly agree, Agree, Disagree, Strongly Disagree, Don’t know, or n/a.
22 I believe I am paid fairly compared to others doing different work but using similar skills and abilities within Massey University.
Strongly agree, Agree, Disagree, Strongly Disagree, Don’t know, or n/a.

Appendices
155
23 In the past 12 months have you had opportunities to do the work of a more senior position for 15 consecutive days or more, for example acting in your manager’s role in their absence?
Yes Yes, but I declined the
opportunity
No Prefer not
to say
24 In doing the work of a more senior position: (Multi select question.)
I received extra pay in the form of a higher duties allowance
I received extra pay in the form of a special administrative responsibilities allowance
I didn’t receive any extra pay
I didn’t know these allowances existed
I received some form of non-monetary compensation e.g. time in lieu
Prefer not to say
25 I believe the amount I received was fair compensation for the higher duties or special administrative responsibilities I took on.
Strongly agree, Agree, Disagree, Strongly Disagree, Don’t know, or n/a.
26 I believe I was remunerated fairly for those higher duties or special administrative responsibilities, relative to others doing similar work.
Strongly agree, Agree, Disagree, Strongly Disagree, Don’t know, or n/a.
27 In the past 12 months have you received any of these additional payments: (Multi select question).

Pay and Employment Equity Review Report and Action Plan
156
Higher duties allowance
Bonus payment
Retention allowance
Other (please specify)
No additional payments.
28 I believe that women receive an equitable share of all additional payments made at Massey.
Strongly agree, Agree, Disagree, Strongly Disagree, Don’t know, or n/a.
Salary progression
29 I believe the processes for salary progression (advancing through the salary scale or by annual salary review) are fairly applied at my level.
Strongly agree, Agree, Disagree, Strongly Disagree, Don’t know, or n/a.
30 I believe the payment of accelerated salary increments at my level is applied equitably to women.
Strongly agree, Agree, Disagree, Strongly Disagree, Don’t know, or n/a.
31 What are your views on the way in which gender equity is or isn’t demonstrated in relation to pay and rewards at Massey University? (type answer)
Participation Training and development 32 Which of the following training and development opportunities (as distinct from informal networking) have been made available to you? (Click all those that have been available whether you have taken them up or not.) Mentoring/coaching Project work Secondment Higher duties Functional/technical training course(s)

Appendices
157
Management or leadership training course(s) Further tertiary education Research and study leave Conference(s) within NZ Overseas conference(s) Representing Massey University externally If other opportunities – please specify here: None 33 What, if anything, has hindered your ability to access training and development opportunities (as described in the previous question)? (Multi select question.)
Nothing has affected my ability to access these opportunities
I didn’t know what was available
I didn't ask /apply for any opportunities
I wasn't offered any opportunities
I have never had a discussion with my manager regarding the opportunities suitable for my position
My work hours restrict my ability to participate
Caring responsibilities
I didn’t know how to register for/request opportunities
There was insufficient budget available
I could not be released from my role to participate
Workload
Other (please specify).
34 I believe existing training and development opportunities are allocated fairly to women at Massey University.
Strongly agree, Agree, Disagree, Strongly Disagree, Don’t know, or n/a.
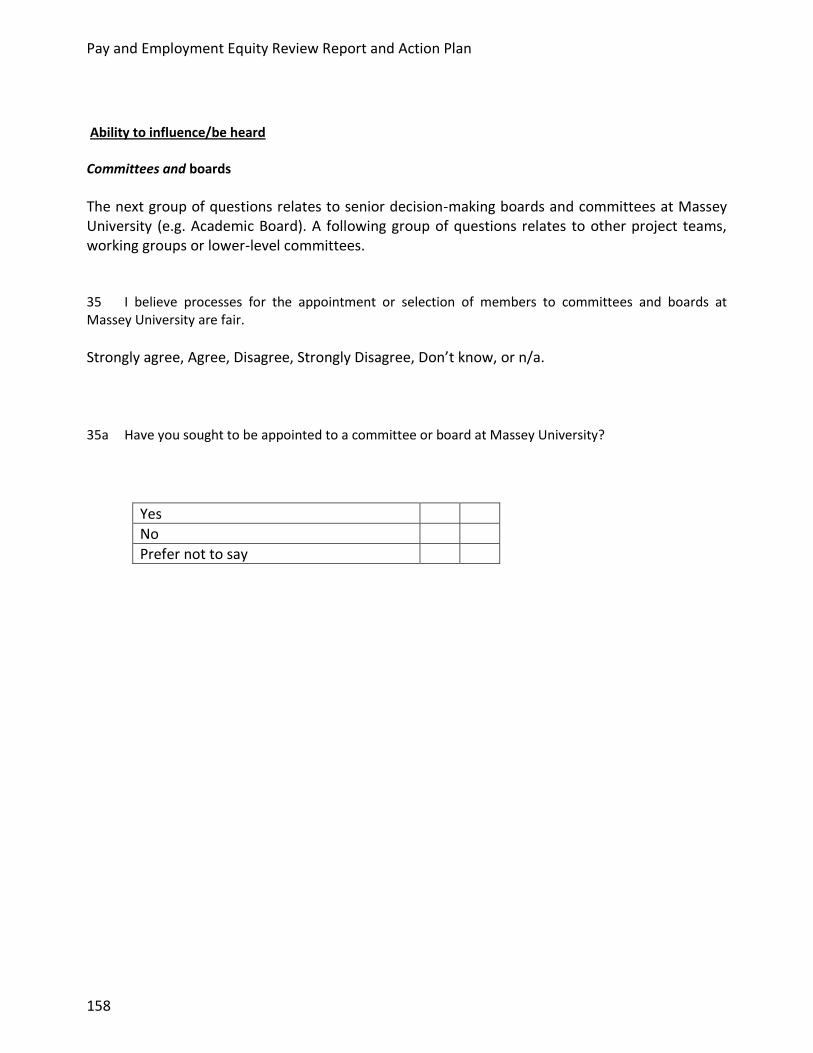
Pay and Employment Equity Review Report and Action Plan
158
Ability to influence/be heard
Committees and boards
The next group of questions relates to senior decision-making boards and committees at Massey University (e.g. Academic Board). A following group of questions relates to other project teams, working groups or lower-level committees.
35 I believe processes for the appointment or selection of members to committees and boards at Massey University are fair.
Strongly agree, Agree, Disagree, Strongly Disagree, Don’t know, or n/a.
35a Have you sought to be appointed to a committee or board at Massey University?
Yes
No
Prefer not to say
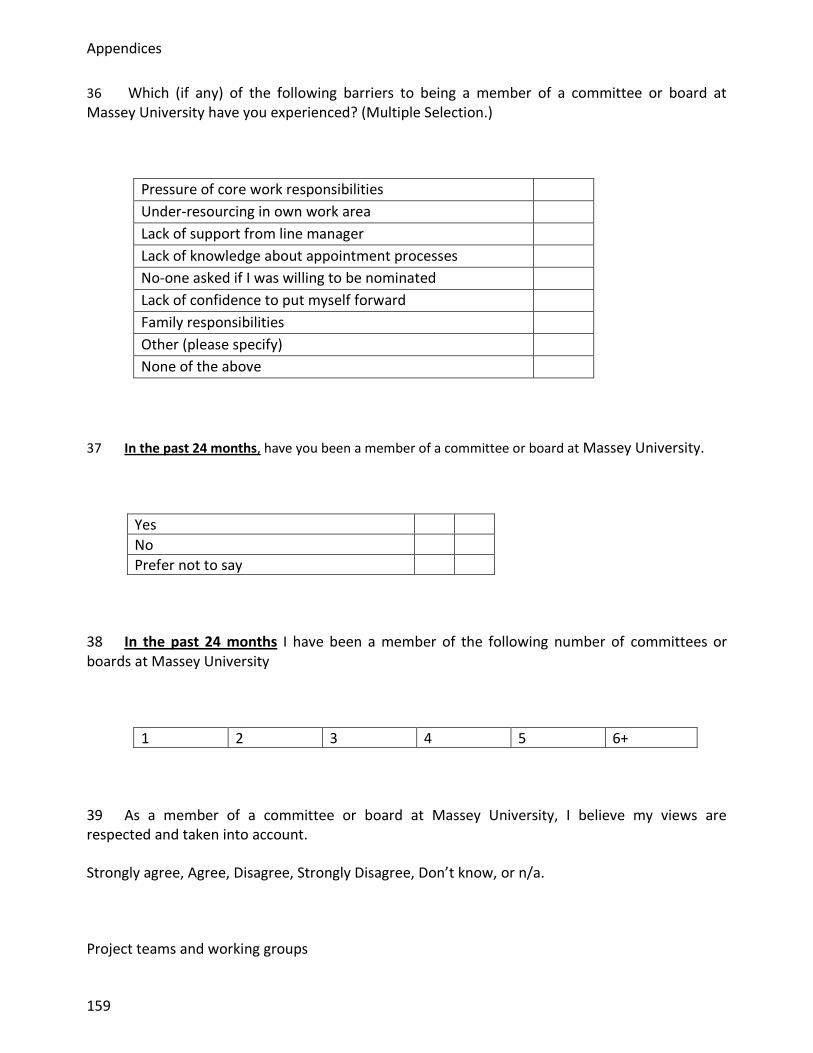
Appendices
159
36 Which (if any) of the following barriers to being a member of a committee or board at Massey University have you experienced? (Multiple Selection.)
Pressure of core work responsibilities
Under-resourcing in own work area
Lack of support from line manager
Lack of knowledge about appointment processes
No-one asked if I was willing to be nominated
Lack of confidence to put myself forward
Family responsibilities
Other (please specify)
None of the above
37 In the past 24 months, have you been a member of a committee or board at Massey University.
Yes
No
Prefer not to say
38 In the past 24 months I have been a member of the following number of committees or boards at Massey University
1 2 3 4 5 6+
39 As a member of a committee or board at Massey University, I believe my views are respected and taken into account.
Strongly agree, Agree, Disagree, Strongly Disagree, Don’t know, or n/a.
Project teams and working groups

Pay and Employment Equity Review Report and Action Plan
160
40 I believe opportunities to participate in project teams and working groups at Massey University are provided fairly.
Strongly agree, Agree, Disagree, Strongly Disagree, Don’t know, or n/a.
41 In the past 24 months have you participated in project teams and working groups at Massey University.
Yes
No
Prefer not to say
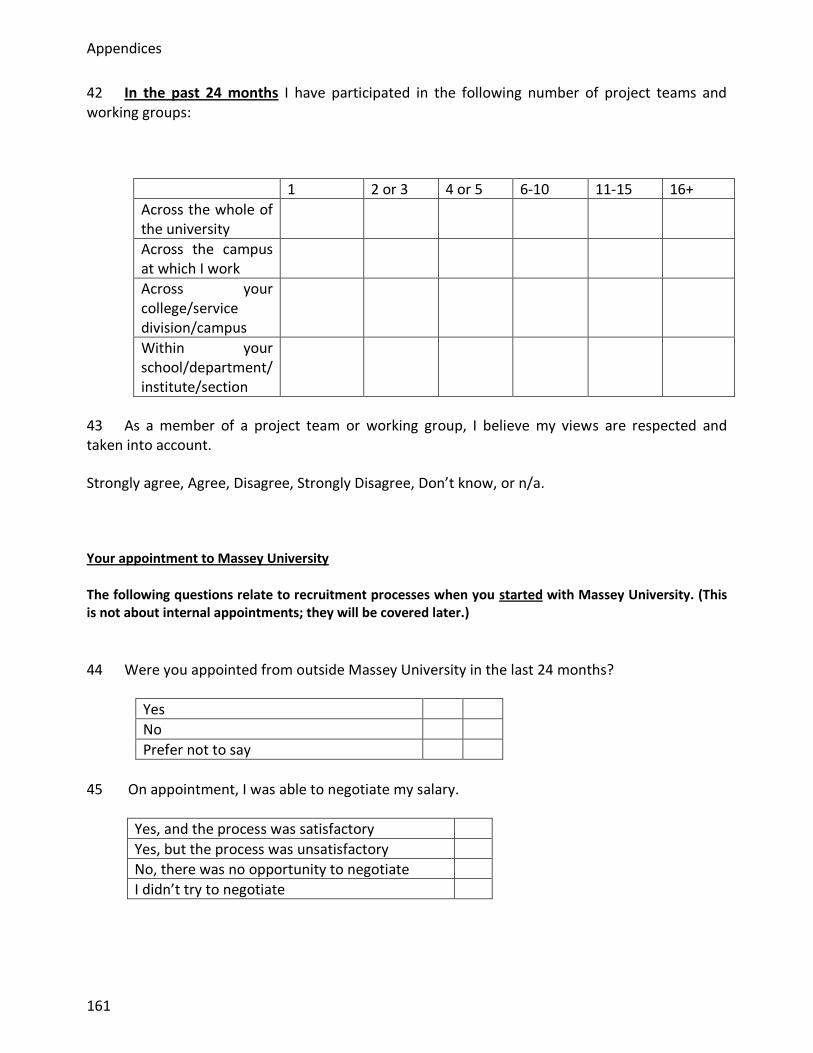
Appendices
161
42 In the past 24 months I have participated in the following number of project teams and working groups:
1 2 or 3 4 or 5 6-10 11-15 16+
Across the whole of the university
Across the campus at which I work
Across your college/service division/campus
Within your school/department/ institute/section
43 As a member of a project team or working group, I believe my views are respected and taken into account.
Strongly agree, Agree, Disagree, Strongly Disagree, Don’t know, or n/a.
Your appointment to Massey University
The following questions relate to recruitment processes when you started with Massey University. (This is not about internal appointments; they will be covered later.)
44 Were you appointed from outside Massey University in the last 24 months?
Yes
No
Prefer not to say
45 On appointment, I was able to negotiate my salary.
Yes, and the process was satisfactory
Yes, but the process was unsatisfactory
No, there was no opportunity to negotiate
I didn’t try to negotiate
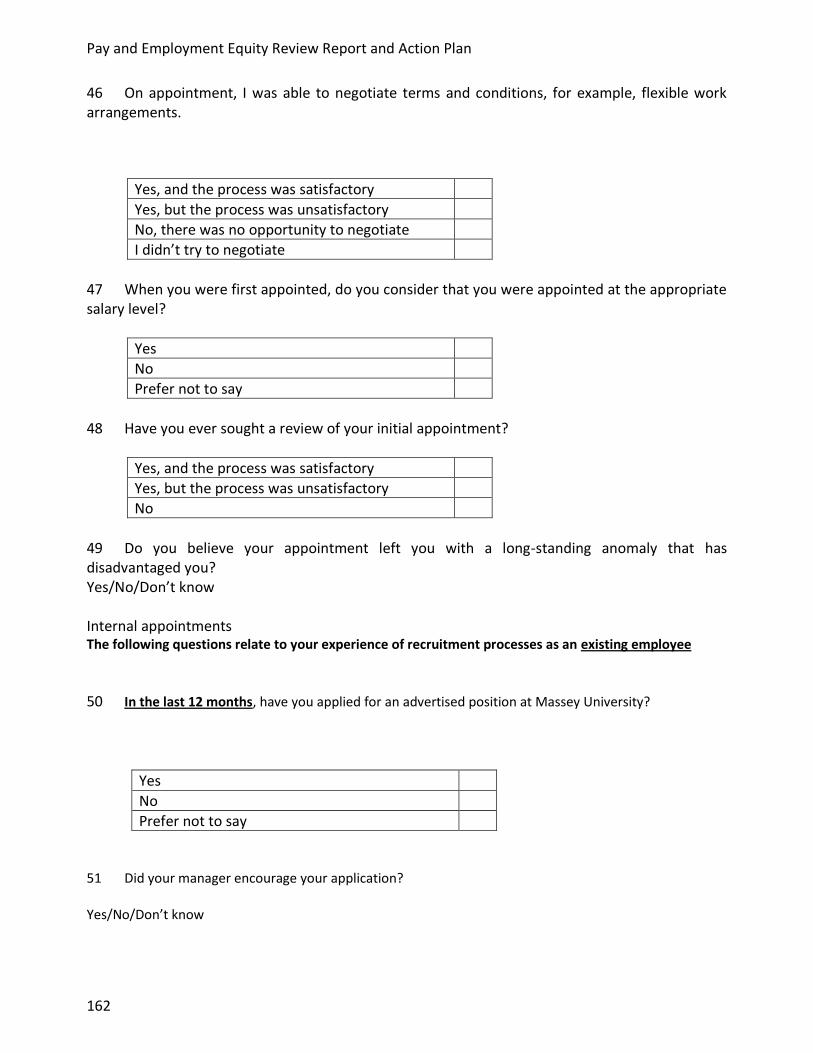
Pay and Employment Equity Review Report and Action Plan
162
46 On appointment, I was able to negotiate terms and conditions, for example, flexible work arrangements.
Yes, and the process was satisfactory
Yes, but the process was unsatisfactory
No, there was no opportunity to negotiate
I didn’t try to negotiate
47 When you were first appointed, do you consider that you were appointed at the appropriate salary level?
Yes
No
Prefer not to say
48 Have you ever sought a review of your initial appointment?
Yes, and the process was satisfactory
Yes, but the process was unsatisfactory
No
49 Do you believe your appointment left you with a long-standing anomaly that has disadvantaged you? Yes/No/Don’t know Internal appointments The following questions relate to your experience of recruitment processes as an existing employee
50 In the last 12 months, have you applied for an advertised position at Massey University?
Yes
No
Prefer not to say
51 Did your manager encourage your application?
Yes/No/Don’t know

Appendices
163
52 Were you shortlisted and interviewed?
Yes
No
Prefer not to say
53 Was your application successful?
Yes
No
Prefer not to say
54 On appointment, I was able to negotiate my salary.
Yes, and the process was satisfactory
Yes, but the process was unsatisfactory
No, there was no opportunity to negotiate
I didn’t try to negotiate my salary
55 On appointment, I was able to negotiate terms and conditions, for example, flexible work arrangements.
Yes, and the process was satisfactory
Yes, but the process was unsatisfactory
No, there was no opportunity to negotiate
I didn’t try to negotiate my terms and conditions
56 In the last 12 months what, if anything, influenced your decision NOT to apply for an advertised position at Massey University? (Click all those that apply.)
I had only just been appointed to my current position

Pay and Employment Equity Review Report and Action Plan
164
I am happy in my current position
I don’t wish to apply for another position
I didn’t feel sufficiently skilled
I didn’t hold the necessary qualifications
I was not encouraged by my manager
The required hours of work were different from what I wanted to do
The terms and conditions were not acceptable to me
The position is full-time and I only want to work part-time
The position required greater responsibility than I would like
I wouldn't have the flexibility to accommodate other non-work commitments
Family commitments
No positions in my field of expertise have been advertised.
Now we going ask you a few questions about promotions (academic staff) or accelerated progression (general staff).
57 In the last 24 months, have you applied for promotion at Massey University?
Yes
No
Prefer not to say
58 Did your manager encourage your application for promotion?
Yes/No/Don’t know
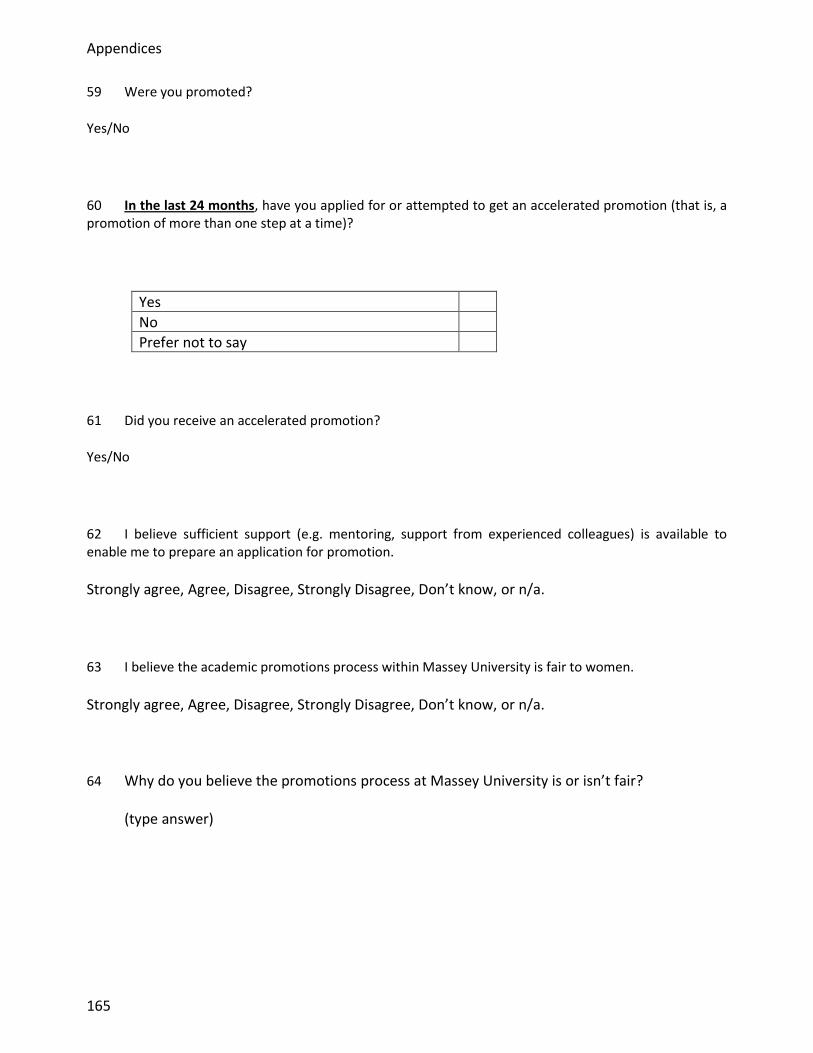
Appendices
165
59 Were you promoted?
Yes/No
60 In the last 24 months, have you applied for or attempted to get an accelerated promotion (that is, a promotion of more than one step at a time)?
Yes
No
Prefer not to say
61 Did you receive an accelerated promotion?
Yes/No
62 I believe sufficient support (e.g. mentoring, support from experienced colleagues) is available to enable me to prepare an application for promotion.
Strongly agree, Agree, Disagree, Strongly Disagree, Don’t know, or n/a.
63 I believe the academic promotions process within Massey University is fair to women.
Strongly agree, Agree, Disagree, Strongly Disagree, Don’t know, or n/a.
64 Why do you believe the promotions process at Massey University is or isn’t fair?
(type answer)

Pay and Employment Equity Review Report and Action Plan
166
Accelerated progression
65 In the last 24 months, have you, or your manager on your behalf, sought a salary increase other than an automatic increment through satisfactory performance (e.g. in the range of rates, accelerated progression, bonus)?
Yes
No
Prefer not to say
66 Were you successful in getting a salary increase other than an automatic increment through satisfactory performance?
Yes/No
67 I believe sufficient support (e.g. mentoring, support from experienced colleagues) is available to enable me to make the case for accelerated progression, should I choose to do so.
Strongly agree, Agree, Disagree, Strongly Disagree, Don’t know, or n/a.
68 I believe the advancement process within Massey University is fair to women.
Strongly agree, Agree, Disagree, Strongly Disagree, Don’t know, or n/a.
69 Why do you believe the advancement process is or isn’t fair?
(Type answer)
Part-time work
70 Opportunities for part-time staff are the same as for full-time staff at Massey University.
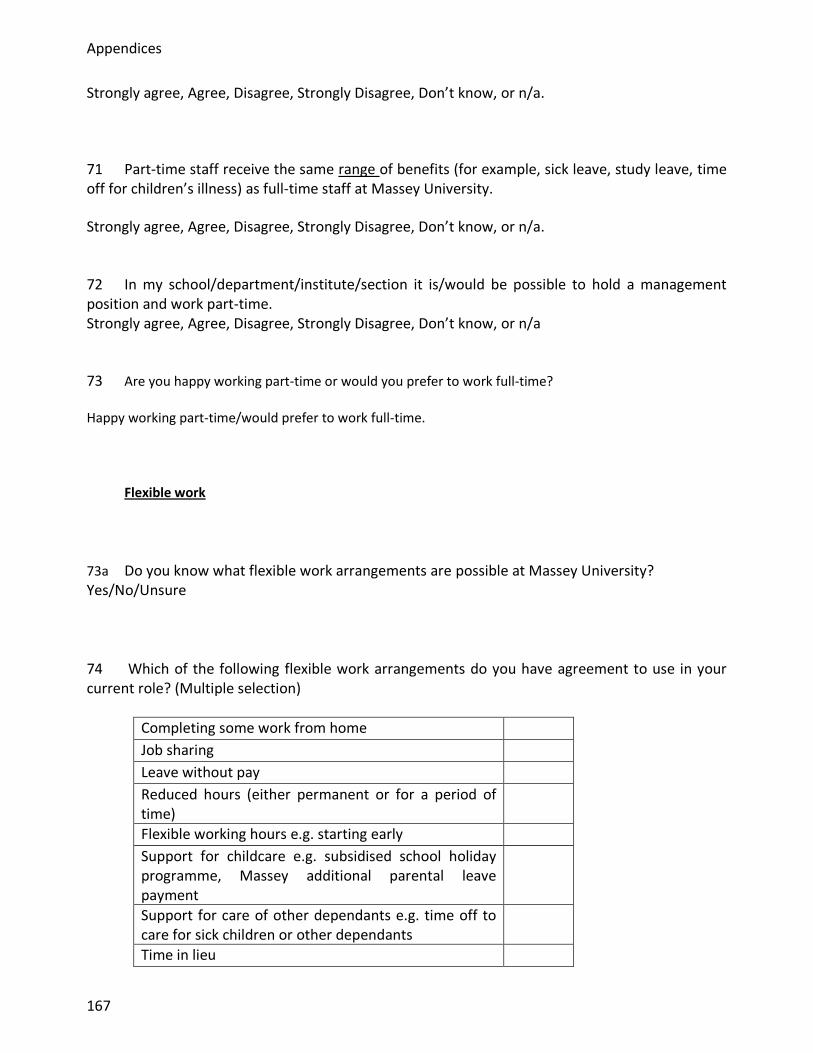
Appendices
167
Strongly agree, Agree, Disagree, Strongly Disagree, Don’t know, or n/a.
71 Part-time staff receive the same range of benefits (for example, sick leave, study leave, time off for children’s illness) as full-time staff at Massey University.
Strongly agree, Agree, Disagree, Strongly Disagree, Don’t know, or n/a.
72 In my school/department/institute/section it is/would be possible to hold a management position and work part-time. Strongly agree, Agree, Disagree, Strongly Disagree, Don’t know, or n/a
73 Are you happy working part-time or would you prefer to work full-time?
Happy working part-time/would prefer to work full-time.
Flexible work
73a Do you know what flexible work arrangements are possible at Massey University? Yes/No/Unsure
74 Which of the following flexible work arrangements do you have agreement to use in your current role? (Multiple selection)
Completing some work from home
Job sharing
Leave without pay
Reduced hours (either permanent or for a period of time)
Flexible working hours e.g. starting early
Support for childcare e.g. subsidised school holiday programme, Massey additional parental leave payment
Support for care of other dependants e.g. time off to care for sick children or other dependants
Time in lieu
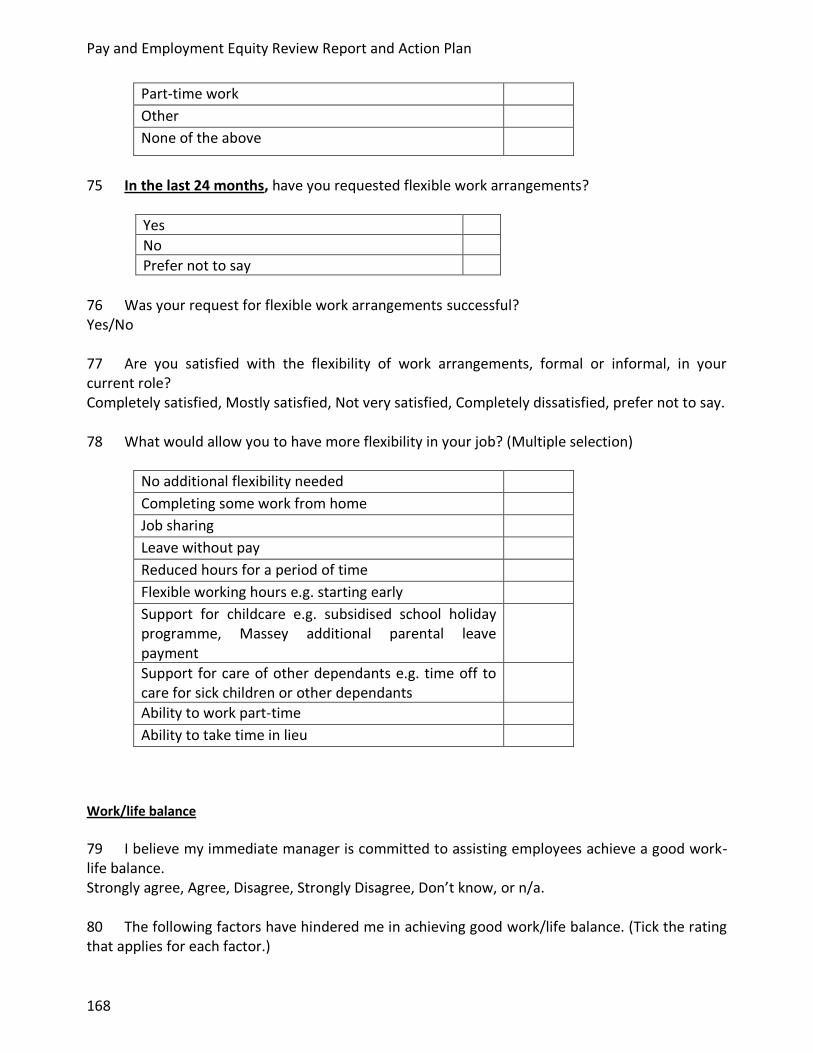
Pay and Employment Equity Review Report and Action Plan
168
Part-time work
Other
None of the above
75 In the last 24 months, have you requested flexible work arrangements?
Yes
No
Prefer not to say
76 Was your request for flexible work arrangements successful? Yes/No 77 Are you satisfied with the flexibility of work arrangements, formal or informal, in your current role? Completely satisfied, Mostly satisfied, Not very satisfied, Completely dissatisfied, prefer not to say. 78 What would allow you to have more flexibility in your job? (Multiple selection)
No additional flexibility needed
Completing some work from home
Job sharing
Leave without pay
Reduced hours for a period of time
Flexible working hours e.g. starting early
Support for childcare e.g. subsidised school holiday programme, Massey additional parental leave payment
Support for care of other dependants e.g. time off to care for sick children or other dependants
Ability to work part-time
Ability to take time in lieu
Work/life balance
79 I believe my immediate manager is committed to assisting employees achieve a good work-life balance. Strongly agree, Agree, Disagree, Strongly Disagree, Don’t know, or n/a. 80 The following factors have hindered me in achieving good work/life balance. (Tick the rating that applies for each factor.)
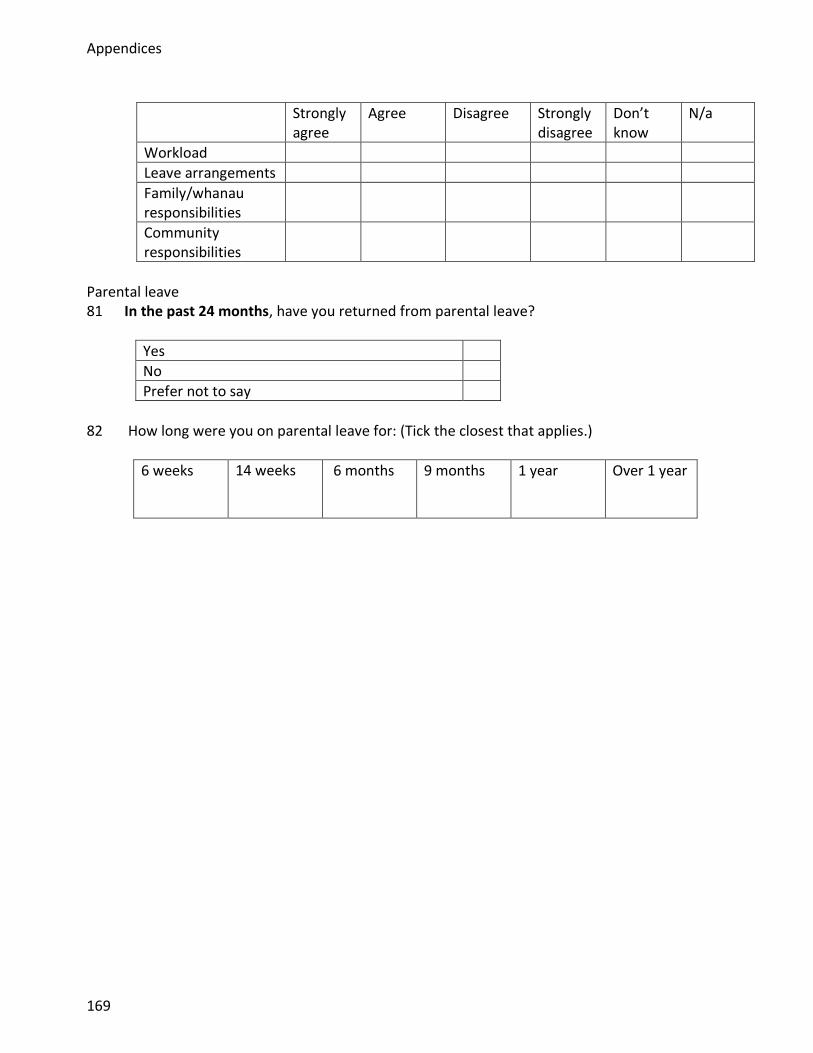
Appendices
169
Strongly agree
Agree Disagree Strongly disagree
Don’t know
N/a
Workload
Leave arrangements
Family/whanau responsibilities
Community responsibilities
Parental leave 81 In the past 24 months, have you returned from parental leave?
Yes
No
Prefer not to say
82 How long were you on parental leave for: (Tick the closest that applies.)
6 weeks 14 weeks
6 months 9 months 1 year Over 1 year

Pay and Employment Equity Review Report and Action Plan
170
83 Did you take up your previous position on your return from parental leave, or did you return to a lower or higher position? Returned to higher position/returned to same position/returned to lower position 84 When you were returning did you seek to negotiate an interim flexible arrangement?
Yes
No
Prefer not to say
85 Were you successful in negotiating an interim flexible arrangement that suited you? Completely successful/Partially successful/No 86 I believe taking parental leave has disadvantaged my promotion and/or progression prospects. Strongly agree, Agree, Disagree, Strongly Disagree, Don’t know, or n/a.
Respect and fairness
Inappropriate behaviour
87 Are you aware of the processes and procedures for raising concerns and making a complaint about bullying, sexual and other forms of harassment, discrimination, and other inappropriate behaviour?
Yes/No
88a In the past 24 months, have you been subjected to any bullying at work?
Yes
No
Prefer not to say
89a Did you seek to have this bullying addressed through University processes?
Yes/No
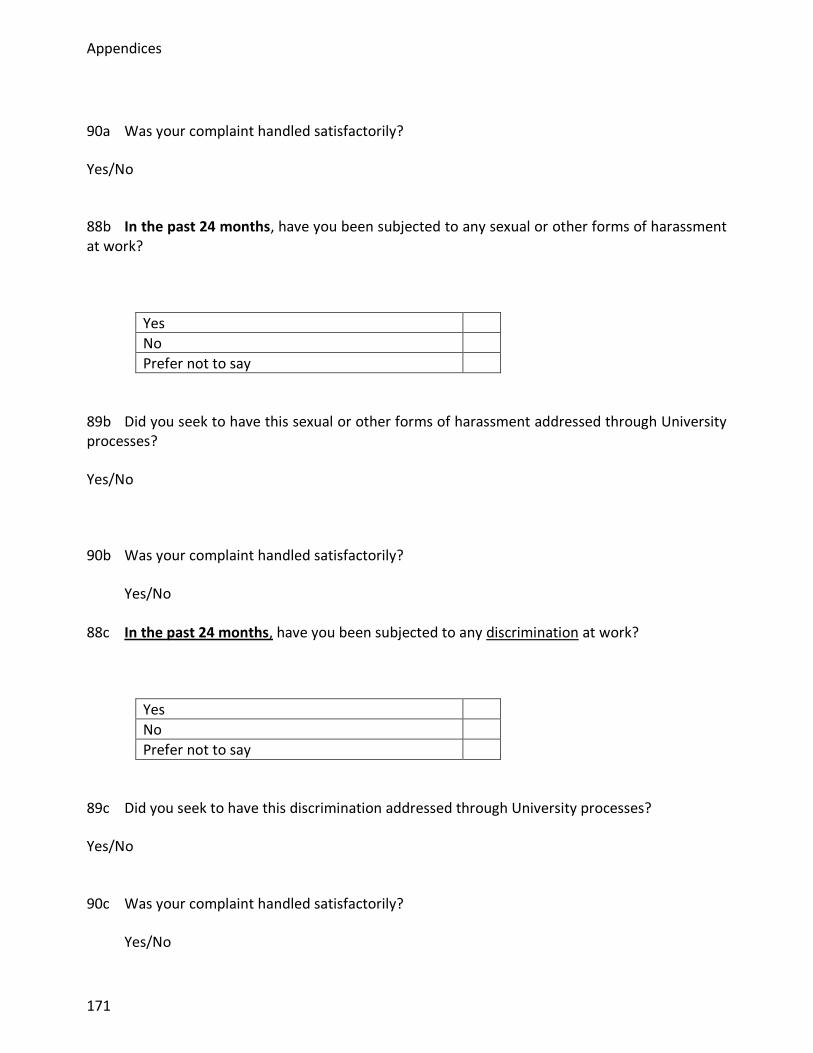
Appendices
171
90a Was your complaint handled satisfactorily?
Yes/No
88b In the past 24 months, have you been subjected to any sexual or other forms of harassment at work?
Yes
No
Prefer not to say
89b Did you seek to have this sexual or other forms of harassment addressed through University processes?
Yes/No
90b Was your complaint handled satisfactorily?
Yes/No 88c In the past 24 months, have you been subjected to any discrimination at work?
Yes
No
Prefer not to say
89c Did you seek to have this discrimination addressed through University processes?
Yes/No
90c Was your complaint handled satisfactorily?
Yes/No

Pay and Employment Equity Review Report and Action Plan
172
88d In the past 24 months, have you been subjected to any other inappropriate behaviour e.g. aggressive communication at work?
Yes
No
Prefer not to say
89d Did you seek to have this other inappropriate behaviour e.g. aggressive communication addressed through University processes?
Yes/No
90d Was your complaint handled satisfactorily?
Yes/No 91 I am confident that Massey University would address and resolve any concerns or complaints of bullying, sexual and other forms of harassment, discrimination, or other inappropriate behaviour.
Strongly agree, Agree, Disagree, Strongly Disagree, Don’t know, or n/a.
92 Why are you confident or not confident that Massey University would address and resolve any concerns or complaints of bullying, sexual and other forms of harassment, discrimination, or other inappropriate behaviour?
(type answer)
Performance appraisal and professional development
93 In the past 12 months, have you had a performance appraisal?
Yes/No
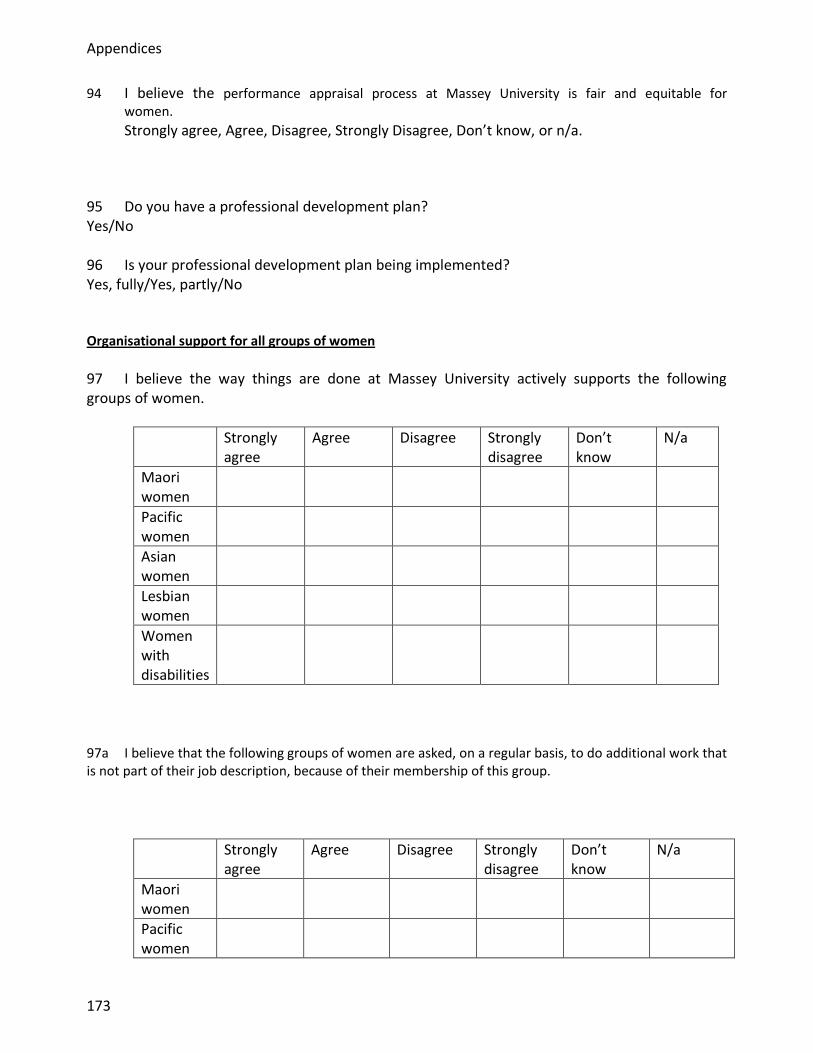
Appendices
173
94 I believe the performance appraisal process at Massey University is fair and equitable for women.
Strongly agree, Agree, Disagree, Strongly Disagree, Don’t know, or n/a.
95 Do you have a professional development plan? Yes/No 96 Is your professional development plan being implemented? Yes, fully/Yes, partly/No
Organisational support for all groups of women
97 I believe the way things are done at Massey University actively supports the following groups of women.
Strongly agree
Agree Disagree Strongly disagree
Don’t know
N/a
Maori women
Pacific women
Asian women
Lesbian women
Women with disabilities
97a I believe that the following groups of women are asked, on a regular basis, to do additional work that is not part of their job description, because of their membership of this group.
Strongly agree
Agree Disagree Strongly disagree
Don’t know
N/a
Maori women
Pacific women

Pay and Employment Equity Review Report and Action Plan
174
Asian women
Lesbian women
Women with disabilities
Other women – please specify
97b Are there any other groups of women that you think are asked on a regular basis to do additional work that is not part of their job description? If yes – please specify the group/s.
(Type answer)
Your manager
98 I am treated with respect by my manager.
Strongly agree, Agree, Disagree, Strongly Disagree, Don’t know, or n/a.
99 I believe that my manager treats women: More advantageously than men, No differently from men, Less advantageously than men, Don’t know, or n/a 100 This is the final question in the survey! In summary, is there anything else you want to tell us in relation to pay and employment equity for women, for example: What you believe the University does well Areas that you believe should be looked into further? This is the end of the survey. When you click below you will submit your survey. Remember that completion and return of the survey implies consent.
THANK YOU FOR TAKING THE TIME TO COMPLETE THIS SURVEY
SUBMIT

Appendices
175
Appendix 2: Relevant Institutional Information – Pay and Employment Equity Review Project Summary
INTRODUCTION This paper reports on information that is already available in relation to pay and/or the employment experiences of women relative to men at Massey University, and summarises the key findings from this information. Some of the data sourced is specific to Massey University while other data relates to the tertiary sector as a whole or provides other contextual information. The paper is structured in three parts. The first section (which is available in this summary) lists the information sought and avenues explored, and where information is available and still relevant, the source is referenced. The second part of the report summarises the key findings/conclusions from the Massey University-specific information. The third part of the report summarises the key contextual information with which the PaEE review committee may need to be familiar in the course of the review. SUMMARY OF DATA SOURCES Table 1: Gender equity information from existing data sources
Gender equity information considered by the committee from existing data sources
Massey University-specific information
1 Exit interviews analysed by gender (from the HRIS data base)
2 Complaints data (HR)
3 Promotions data over time – summary of promotions data 2005–2010 independent observer reports State of the Nation report
4 Gender and academic promotions study Stephanie Doyle, Cathy Wylie, Edith Hogden with Anne Else. Gender and academic promotion. A case study of Massey University. NZ Council for Educational Research, Wellington, 2004
5 Research being conducted by Nicola Murray. Research project by Nicola Murray, Massey University, entitled Reaching the Top – Women in Academia. (Copy of the survey provided to the committee.)
Other relevant contextual information
6 Overview of gender equity issues in the tertiary sector by Robyn Bailey. Gender-based pay and employment equity issues in the tertiary education workforce: Analysis of the issues from a review of published sector information. Unpublished report prepared for the Ministry of Education on behalf of the Tertiary Sector Tripartite Steering Group for

Pay and Employment Equity Review Report and Action Plan
176
Gender equity information considered by the committee from existing data sources
PaEE Reviews, Wellington, 2008.
7 LIANZA Remuneration Survey MMResearch. LIANZA Remuneration Survey. Report prepared LIANZA, September 2009.
8 Academics in non-career positions Celia Briar. (2009). ‘Trapped in the ivory basement: Effort-reward imbalances among non-career academics’, in Celia Briar (ed) Hidden Health Hazards in Women’s Work, Dunmore Publishing.
9 Other PBRF information: Warren Smith. (2005). What determines the research performance of staff in New Zealand’s tertiary education sector? An analysis of the Performance-Based Research Fund Quality Evaluation, Ministry of Education. Bruce Curtis & Suzanne Phibbs. (2006). ‘Body politics within the Academy: Gender and the performance-based research fund’, in Leon Bakker, Jonathan Boston, Lesley Campbell and Roger Smyth (eds) Evaluating the Performance-Based Research Fund: Framing the Debate, Institute of Policy Studies, Victoria University of Wellington. Suzanne Phibbs & Bruce Curtis. (2006). Gender, nursing and the PBRF. Nursing Praxis in New Zealand, 22(2), 2–5. Nuran Çinlar and Jason Dowse. (2008). Human Resource Trends in the Tertiary Academic Workforce–- A working paper contributing to the independent strategic review of the Performance-Based Research Fund. Tertiary Education Commission, Wellington.
10 Human Rights’ Commission. (2008, 2010). New Zealand Census of Women’s Participation.
11 Jenny Neale & Kate White.(2004). Almost there: a comparative case study of senior academic women in Australia and New Zealand. Paper for New Zealand Pay and Employment Equity for Women conference, Wellington. Jenny Neale. (2007). Becoming a Professor – or Not. Paper presented at 5th European Conference on Gender Equity in Higher Education, Berlin.
12 Ricardo Hausmann, Laura D. Tyson, and Saadia Zahidi. (2009). The Global Gender Gap Report. World Economic Forum.
13 Ministry of Women’s Affairs. (2010). Analysis of Graduate Income Data 2002–2007 by Broad Field of Study. Working Paper, Wellington.
14 American Association of University Women (AAUW). (2010). Why So Few? Women in Science, Technology, Engineering and Mathematics. Washington.

Appendices
141
Appendix 3: PEEAT (Pay and Employment Equity Analysis Tool) – Summary list of gender differences
This document is the preliminary analysis of HR and payroll data undertaken by the committee, referred to on p.43 of the report, under the heading Collation and Analysis of the Data. All staff – representation and distribution 1 Women are well-represented at Massey University, comprising 56% of the workforce compared with women’s labour market share of 47%96. 2 Women are under-represented in academic staff positions and over-represented in general staff positions. 3 Men are more highly represented than their workforce share in senior, higher-paying positions at Massey University (levels 2 & 3) and women are over-represented in all of the lower levels and lower-paid positions (tiers 4–7). 4 Women are over-represented in all part-time bands of hours (0–9 hours 61%, 10–19 hours 67%, and 20–29 hours 72%) relative to their workforce share of 56%. 5 There is a high level of sex segregation in the Massey University workforce. Approximately three-quarters of all general staff jobs are male- or female-dominated. All staff – pay 6 There is an overall gender pay gap at Massey University of 22%. On average women earn $64,000 compared with men on $82,500. 7 Women are paid significantly less than males across all components of annual remuneration. Payments for allowances are significantly (700+%) higher for men than women. 8 Women are underpaid compared to males for equivalent work in the same job categories. 9 Workers in female-dominated occupations are disadvantaged. Female-dominated occupations average $48,000 and male-dominated occupations $55,500. 10 Within job categories women are underpaid relative to men. 11 In the past year there was a gender difference in excess of 13% (favouring men) in the average starting salaries of four job titles: tutor, earth science technician, ICT customer support officer, and programme or project administrators. Academic staff – representation and distribution
96 Household Labour Force Survey December 2009, Department of Labour.

Pay and Employment Equity Review Report and Action Plan
142
12 Women are under-represented in academic staff relative to their overall representation at Massey University, comprising 45% of academic staff compared with 56% of all staff
13 Women are under-represented in senior academic positions and over-represented in junior and ‘non-career’ academic positions. In terms of ‘career’ academic staff, nearly half (46%) of all female academics are lecturers, while just a quarter (26%) of male academics are lecturers.
There is a gender difference > 20%, with women under-represented in the following senior academic positions:
Professor (14% women, 86% men) Associate professor (32% women, 68% men) Senior lecturer/senior research officer (37% women, 63% men) Education managers nec (37% women, 63% men).
There is a gender difference > 20%, with women over-represented in the following junior academic positions:
Assistant lecturer/assistant research officer (73% women, 27% men) Tutor 72% women, 28% men) Graduate teaching assistant (69% women, 31% men).
14 Academic women are over-represented on fixed-term contracts (57%) relative to their proportion of the academic workforce. One in four female academics is on a fixed-term contract, compared with one in six male academics. Academic staff – pay 15 There is a gender pay gap of 15% for academic staff. On average women earn $83,000 compared with $97,500 for men. 16 In three of the 10 academic positions there is a gender pay gap favouring men, and two favouring women. Two of the three positions where the pay difference favours men are senior academic positions. Both of the positions where the pay gap favours women are junior positions, and the pay gaps are smaller than those favouring men. There is a gender pay difference advantaging men in the following positions:
Professor – 7% gap
Women on average earn $134,000 and men $144,000
Education managers nec – 14% gap
Women on average earn $114,500 and men $133,000
Graduate teaching assistants – 19% gap
Women on average earn $26,500 and men $32,500. There is a pay gap advantaging women in the following positions:
Assistant lecturer/assistant research officer – 5% gap

Appendices
143
Women on average earn $57,000 and men $54,000.
Tutor – 3% gap
Women on average earn $58,500 and men $56,500. 17 Women are over-represented in all part-time bands of hours (0–9 hours 56%, 10–19 hours 62%, and 20–29 hours 59%) relative to their workforce share of 45%. 18 Men are more highly represented than their workforce share in Levels 3 & 5 and equivalent to women at level 4. Women are greatly over-represented at level 6. General staff – representation and distribution 19 Women are over-represented in general staff relative to their overall representation at Massey University, comprising 64% of general staff compared with 56% of all staff. 20 There is a high level of sex segregation in the general staff workforce.97 Of the 51 occupations listed at ANZSCO level 4 (and filtered to suppress cells of less than 3), over a third are single sex occupations (11 are female only and 9 male only) and nearly three-quarters are either female- or male-dominated. 21 Women are over-represented in two of the part-time bands of hours (10–19 hours 70%, and 20–29 hours 80%) relative to their workforce share of 64%. 22 Men are more highly represented than their workforce share in senior, high-paying positions (levels 2 and 3), and women over-represented in the lower levels (levels 4–7). Women’s representation falls dramatically between levels 3 and 4. General staff – pay 23 There is a gender pay gap of 18% for general staff. On average women earn $54,500 compared with $66,500 for men. 24 In 16 of the 51 general staff occupations at ANZSCO level 4 there is a gender pay gap favouring men. In four of the 51 positions, there is a gender pay gap favouring women.
97
An ANZSCO level 6 data, of the 162 occupations, half are single sex occupations (30 are female only and 53 male only) and over three quarters are either female- or male-dominated occupations. Less than a quarter of these occupations are mixed gender.
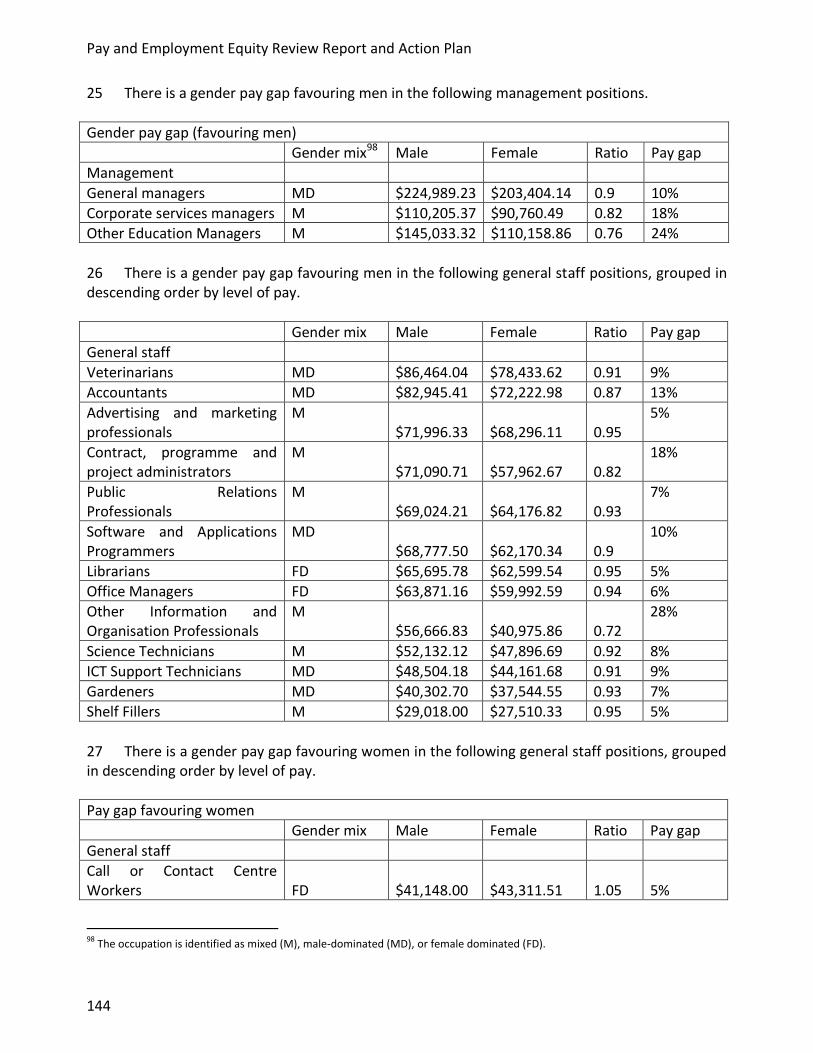
Pay and Employment Equity Review Report and Action Plan
144
25 There is a gender pay gap favouring men in the following management positions.
Gender pay gap (favouring men)
Gender mix98 Male Female Ratio Pay gap
Management
General managers MD $224,989.23 $203,404.14 0.9 10%
Corporate services managers M $110,205.37 $90,760.49 0.82 18%
Other Education Managers M $145,033.32 $110,158.86 0.76 24%
26 There is a gender pay gap favouring men in the following general staff positions, grouped in descending order by level of pay.
Gender mix Male Female Ratio Pay gap
General staff
Veterinarians MD $86,464.04 $78,433.62 0.91 9%
Accountants MD $82,945.41 $72,222.98 0.87 13%
Advertising and marketing professionals
M $71,996.33 $68,296.11 0.95
5%
Contract, programme and project administrators
M $71,090.71 $57,962.67 0.82
18%
Public Relations Professionals
M $69,024.21 $64,176.82 0.93
7%
Software and Applications Programmers
MD $68,777.50 $62,170.34 0.9
10%
Librarians FD $65,695.78 $62,599.54 0.95 5%
Office Managers FD $63,871.16 $59,992.59 0.94 6%
Other Information and Organisation Professionals
M $56,666.83 $40,975.86 0.72
28%
Science Technicians M $52,132.12 $47,896.69 0.92 8%
ICT Support Technicians MD $48,504.18 $44,161.68 0.91 9%
Gardeners MD $40,302.70 $37,544.55 0.93 7%
Shelf Fillers M $29,018.00 $27,510.33 0.95 5%
27 There is a gender pay gap favouring women in the following general staff positions, grouped in descending order by level of pay.
Pay gap favouring women
Gender mix Male Female Ratio Pay gap
General staff
Call or Contact Centre Workers FD $41,148.00 $43,311.51 1.05 5%
98
The occupation is identified as mixed (M), male-dominated (MD), or female dominated (FD).

Appendices
145
Printing assistants and table workers
M $35,814.20 $37,968.28 1.06
6%
Library assistants FD $32,379.91 $34,672.65 1.07 7%
Inquiry clerks FD $29,708.66 $38,793.63 1.31 31%
Appendix 4: PaEE Review Survey – Summary of Respondent Population
A total of 1784 Massey University staff participated in the PaEE survey. This represents 50% of the 3545 staff who were invited to participate in the survey (i.e. permanent staff, fixed-term staff, and those casual staff who have Massey University email addresses). The survey respondents were broadly representative of the overall workforce at the University on most demographics. There was a slightly higher proportion of female respondents and slightly lower proportion of male respondents than their representation in the Massey University population. Some key demographics of the survey respondent population, compared with the Massey University population (where possible), are outlined below:
Sixty percent of respondents were women and 40% men (compared with 56% female and 44% male staff across Massey University as a whole).
Forty-four percent of respondents were academic and 55% general staff (compared with 40% academic staff and 60% general staff at Massey University).
Thirty-six per cent of female respondents were academic and 63% were general staff (compared with Massey University female staff, which are 33% academic and 67% general staff). Fifty-seven percent of male respondents were academic and 43% were general staff (compared with the Massey University male staff, which are 49% academic and 51% general staff).
The Manawatu and Albany campuses responded in higher proportions than their workforce share and Wellington slightly lower. There were few respondents from ‘other’ Massey University centres, representing just 2% of the survey population and 12% of the Massey University population.
The greatest number of respondents were from the College of Sciences (26%), followed by the College of Humanities and Social Sciences (15%) and College of Business (12%). This broadly mirrors the representation of total staff in these Colleges, at 26%, 14% and 10% of all Massey University staff respectively.
Sixty-five percent of survey respondents identified as NZ European/Pakeha, 16% as Non-NZ European, 11% as Other, 6% as Māori, 5% as Chinese, 2% as Indian, and 1% with a Pacific Island group.99 Ethnicity data for total Massey University staff are not available for comparison.
Women respondents comprised 75% of all part-time staff and men 25%. Women comprise 68% and men 32% of all part-time staff across Massey University as a whole.
Forty-two percent of respondents cared for someone outside of work. Of this group, 85% cared for children and 26% cared for adult dependents (with some of these caring for both).
99 Respondents were able to identify with more than one ethnicity so the percentage total is more than 100%.
Pay and Employment Equity Review Report and Action Plan
146
Of those respondents caring for children, 24% or 153 staff were the main caregiver and 68% or 434 staff shared this responsibility with someone else. Of those who are the main caregiver, 91% are women and 9% of men.
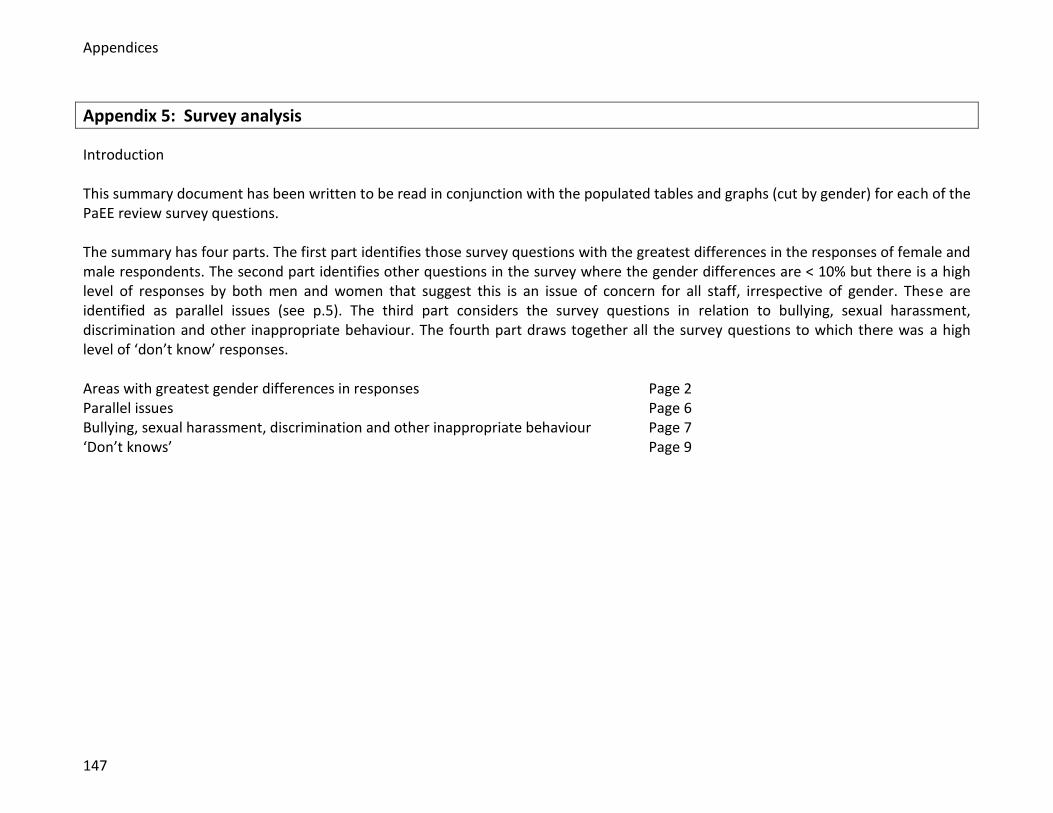
Appendices
147
Appendix 5: Survey analysis
Introduction This summary document has been written to be read in conjunction with the populated tables and graphs (cut by gender) for each of the PaEE review survey questions. The summary has four parts. The first part identifies those survey questions with the greatest differences in the responses of female and male respondents. The second part identifies other questions in the survey where the gender differences are < 10% but there is a high level of responses by both men and women that suggest this is an issue of concern for all staff, irrespective of gender. These are identified as parallel issues (see p.5). The third part considers the survey questions in relation to bullying, sexual harassment, discrimination and other inappropriate behaviour. The fourth part draws together all the survey questions to which there was a high level of ‘don’t know’ responses. Areas with greatest gender differences in responses Page 2 Parallel issues Page 6 Bullying, sexual harassment, discrimination and other inappropriate behaviour Page 7 ‘Don’t knows’ Page 9
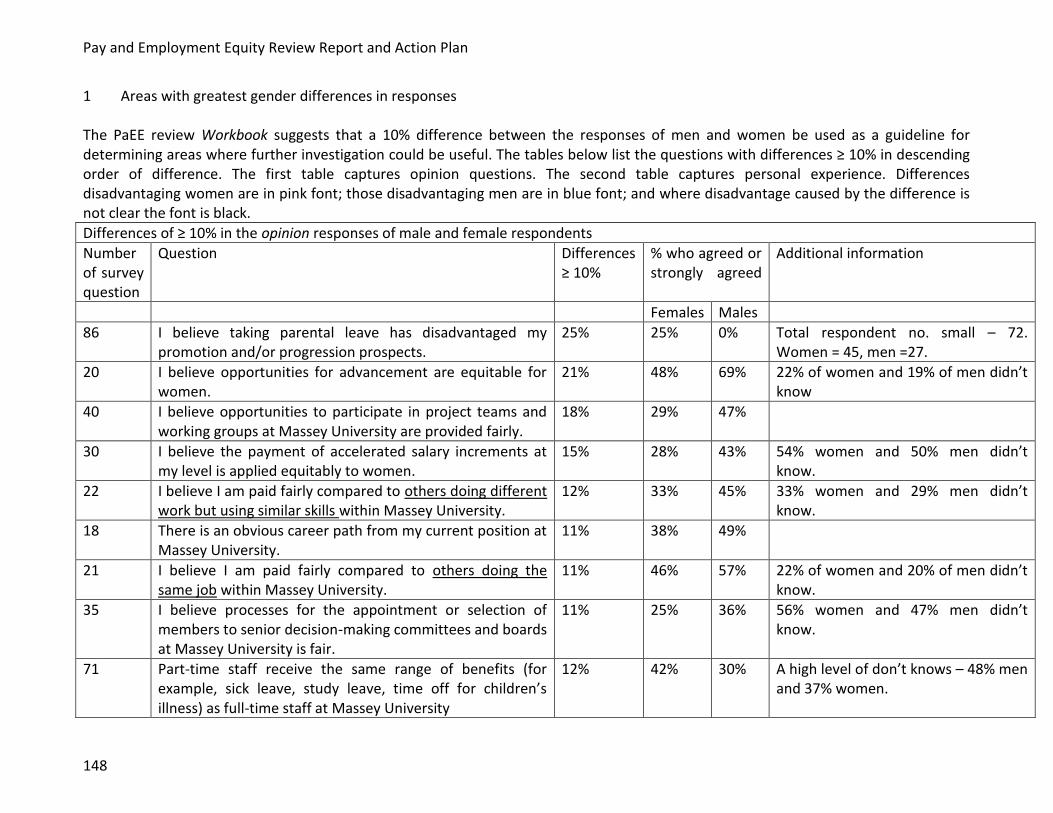
Pay and Employment Equity Review Report and Action Plan
148
1 Areas with greatest gender differences in responses The PaEE review Workbook suggests that a 10% difference between the responses of men and women be used as a guideline for determining areas where further investigation could be useful. The tables below list the questions with differences ≥ 10% in descending order of difference. The first table captures opinion questions. The second table captures personal experience. Differences disadvantaging women are in pink font; those disadvantaging men are in blue font; and where disadvantage caused by the difference is not clear the font is black.
Differences of ≥ 10% in the opinion responses of male and female respondents
Number of survey question
Question Differences ≥ 10%
% who agreed or strongly agreed
Additional information
Females Males
86 I believe taking parental leave has disadvantaged my promotion and/or progression prospects.
25% 25% 0% Total respondent no. small – 72. Women = 45, men =27.
20 I believe opportunities for advancement are equitable for women.
21% 48% 69% 22% of women and 19% of men didn’t know
40 I believe opportunities to participate in project teams and working groups at Massey University are provided fairly.
18% 29% 47%
30 I believe the payment of accelerated salary increments at my level is applied equitably to women.
15% 28% 43% 54% women and 50% men didn’t know.
22 I believe I am paid fairly compared to others doing different work but using similar skills within Massey University.
12% 33% 45% 33% women and 29% men didn’t know.
18 There is an obvious career path from my current position at Massey University.
11% 38% 49%
21 I believe I am paid fairly compared to others doing the same job within Massey University.
11% 46% 57% 22% of women and 20% of men didn’t know.
35 I believe processes for the appointment or selection of members to senior decision-making committees and boards at Massey University is fair.
11% 25% 36% 56% women and 47% men didn’t know.
71 Part-time staff receive the same range of benefits (for example, sick leave, study leave, time off for children’s illness) as full-time staff at Massey University
12% 42% 30% A high level of don’t knows – 48% men and 37% women.

Appendices
149
Differences of ≥ 10% in the experience responses of men and women
Number of survey question
Question Differences ≥ 10%
% who had experience
Additional information
Females Males
84 When you were returning [from parental leave] did you seek to negotiate an interim flexible work arrangement?
45% 49% 4% Total respondent no. small – 72. Women = 45, men =27.
75 In the last 24 months have you requested flexible work arrangements?
13% 35% 22% Population here = 526. Women = 378, men = 158.
41 In the past 24 months, have you participated in project teams and working groups at Massey University?
13% 26% 39% Population here = 550. 275 women and 275 men.
37 In the past 24 months, have you been a member of a committee or board at Massey University?
11% 28% 39% Population here = 574. 297 women and 277 men. Query validity of responses and how respondents defined boards and committees. Refer qu 38?
93 In the past 12 months have you had a performance appraisal?
12% 64% 76%
78 I have need of no additional flexibility at work. 11% 14% 25%
96 Is your professional development plan being fully implemented?
10% 30% 40% Respondent no. = 711. Women = 402, men 309. If add partly implemented plans, no gender difference.
73 Are you happy working part-time (or would you prefer to work full-time)?
12% 78% 66% Total respondent no. small = 220. Women = 164, men = 56.
55 On appointment, I was able to negotiate terms and conditions satisfactorily, for example, flexible work arrangements.
12% 44% 32% Total respondent no. small – 126. Women = 95, men =31.
53 In the last 12 months, having applied for an advertised position at Massey University, was your application successful?
15% 68% 53% Total respondent no. small – 126. Women = 95, men =31.
90A Was your complaint about bullying handled satisfactorily? 18% 43% 25% Total respondent no. small. Women = 49, men 16.

Pay and Employment Equity Review Report and Action Plan
150
90B Was your complaint about sexual or other forms of harassment handled satisfactorily?
25% 36% 11% Total respondent no. small. Women = 22, men 9.
In summary: The survey responses suggest that the following differences to the disadvantage of women should be explored further: Rewards Career paths (18)
Advancement opportunities (20) Pay/valuing of work Relative to others doing the same job (21) Relative to others doing different work but using similar skills (22) Accelerated salary increments (30)
Participation Senior decision-making committees and boards Processes for the appointment or selection of members (35) Membership of (37) Opportunities to participate in project teams and working groups (40, 41) Flexibility at work (78) Parental leave (86)
Respect and fairness Performance appraisal (93) Professional development plans (96).

Appendices
151
The survey responses suggest that the following differences may be to the disadvantage of men: Participation Success in applying for advertised position (53)
Options to negotiate terms and conditions at internal appointment (55) Part-time staff Receiving the same range of benefits as full-time staff (71) Options for part-time staff to work full-time (73).
Respect and fairness Handling of complaints in relation to bullying, and sexual and other forms of harassment. The survey responses where there are differences in respondent experiences but possible disadvantage is not clear: Participation A far higher proportion of women than men seeking to negotiate an interim flexible work arrangement when
returning from parental leave (84) A higher proportion of women than men seeking flexible work arrangements (75).

Pay and Employment Equity Review Report and Action Plan
152
2 Parallel issues This section identifies questions where there was little gender difference in responses but both men and women expressed a high level of concern in relation to the issue. In most cases, questions are included where 40% or more of total respondents expressed this concern. Depending on the nature of the questions that fall into this category, the committee may decide that some of the issues are of a gendered nature and should be added to the list identified at Part 1.
Number of survey question
Question % who had view/experience
Additional information
Females Males
18 There is not an obvious career path from my current position at Massey University.
48% 41%
24 In doing the work of a more senior position for 15 consecutive days I did not receive any extra pay.
52% 58% Total respondent no. = 220
25 I do not believe that the amount of extra pay I received was fair compensation for the higher duties or special administrative responsibilities I took on.
50% 56%
73A I do not know what flexible work arrangements are possible at Massey University.
41% 44%
80 Workload has hindered me in achieving work/life balance. 58% 62%
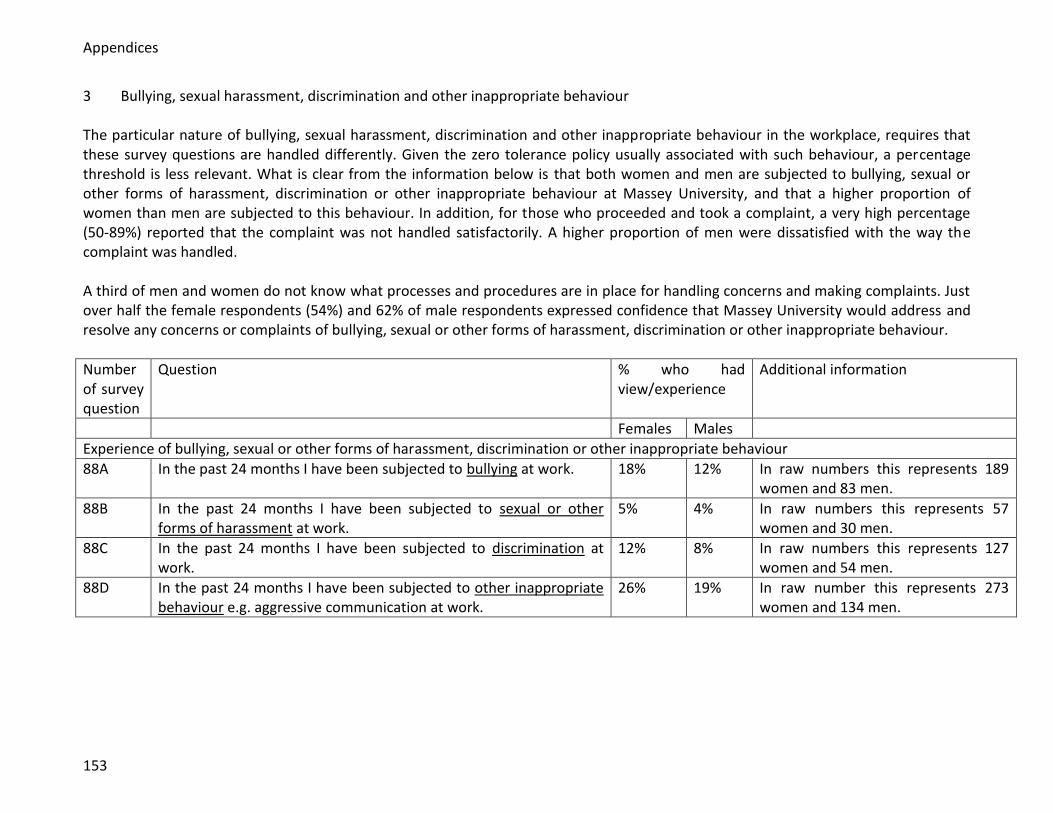
Appendices
153
3 Bullying, sexual harassment, discrimination and other inappropriate behaviour The particular nature of bullying, sexual harassment, discrimination and other inappropriate behaviour in the workplace, requires that these survey questions are handled differently. Given the zero tolerance policy usually associated with such behaviour, a percentage threshold is less relevant. What is clear from the information below is that both women and men are subjected to bullying, sexual or other forms of harassment, discrimination or other inappropriate behaviour at Massey University, and that a higher proportion of women than men are subjected to this behaviour. In addition, for those who proceeded and took a complaint, a very high percentage (50-89%) reported that the complaint was not handled satisfactorily. A higher proportion of men were dissatisfied with the way the complaint was handled. A third of men and women do not know what processes and procedures are in place for handling concerns and making complaints. Just over half the female respondents (54%) and 62% of male respondents expressed confidence that Massey University would address and resolve any concerns or complaints of bullying, sexual or other forms of harassment, discrimination or other inappropriate behaviour.
Number of survey question
Question % who had view/experience
Additional information
Females Males
Experience of bullying, sexual or other forms of harassment, discrimination or other inappropriate behaviour
88A In the past 24 months I have been subjected to bullying at work. 18% 12% In raw numbers this represents 189 women and 83 men.
88B In the past 24 months I have been subjected to sexual or other forms of harassment at work.
5% 4% In raw numbers this represents 57 women and 30 men.
88C In the past 24 months I have been subjected to discrimination at work.
12% 8% In raw numbers this represents 127 women and 54 men.
88D In the past 24 months I have been subjected to other inappropriate behaviour e.g. aggressive communication at work.
26% 19% In raw number this represents 273 women and 134 men.

Pay and Employment Equity Review Report and Action Plan
154
Result of taking complaint re bullying, sexual or other forms of harassment, discrimination or other inappropriate behaviour
90A My complaint re bullying was not handled satisfactorily. 57% 75% Total respondent no. = 65. Women = 49, men =16.
90B My complaint re sexual or other forms of harassment was not handled satisfactorily.
64% 89% Total respondent no. = 31. Women = 22, men = 9.
90C My complaint re discrimination at work was not handled satisfactorily.
83% 88% Total respondent no. = 26. Women = 18, men = 8.
90D My complaint re other inappropriate behaviour was not handled satisfactorily.
50% 50% Total respondent no. = 82. Women = 58, men = 24.
Awareness of processes for raising concerns and making complaints
87 I am not aware of the processes and procedures for raising concerns and making a complaint about bullying, sexual and other forms of harassment, discrimination and other inappropriate behaviour.
32% 32%
Confidence that Massey University would address and resolve complaints
91 I am confident that Massey University would address and resolve any concerns or complaints of bullying, sexual or other forms of harassment, discrimination or other inappropriate behaviour.
54% 62%
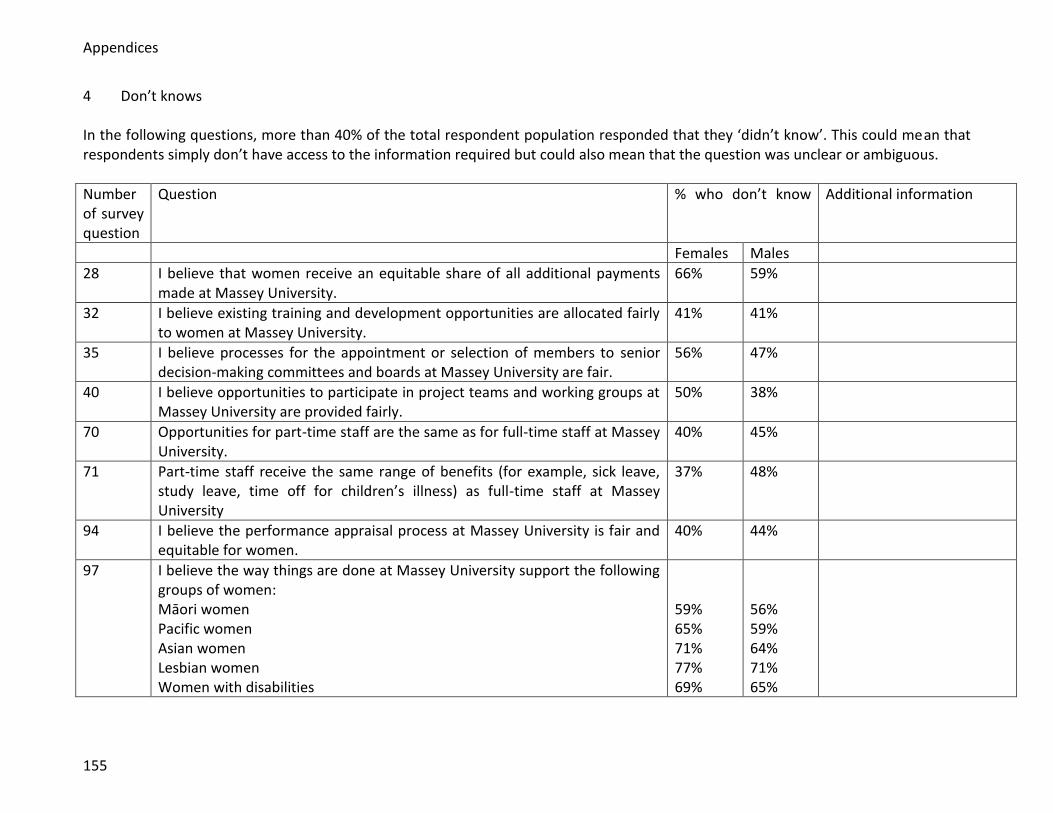
Appendices
155
4 Don’t knows In the following questions, more than 40% of the total respondent population responded that they ‘didn’t know’. This could mean that respondents simply don’t have access to the information required but could also mean that the question was unclear or ambiguous.
Number of survey question
Question % who don’t know
Additional information
Females Males
28 I believe that women receive an equitable share of all additional payments made at Massey University.
66% 59%
32 I believe existing training and development opportunities are allocated fairly to women at Massey University.
41% 41%
35 I believe processes for the appointment or selection of members to senior decision-making committees and boards at Massey University are fair.
56% 47%
40 I believe opportunities to participate in project teams and working groups at Massey University are provided fairly.
50% 38%
70 Opportunities for part-time staff are the same as for full-time staff at Massey University.
40% 45%
71 Part-time staff receive the same range of benefits (for example, sick leave, study leave, time off for children’s illness) as full-time staff at Massey University
37% 48%
94 I believe the performance appraisal process at Massey University is fair and equitable for women.
40% 44%
97 I believe the way things are done at Massey University support the following groups of women: Māori women Pacific women Asian women Lesbian women Women with disabilities
59% 65% 71% 77% 69%
56% 59% 64% 71% 65%

Pay and Employment Equity Review Report and Action Plan
156
97A I believe that some women are asked to do work beyond their job descriptions which creates and additional workload because they belong to that group Māori women Pacific women Asian women Lesbian women Women with disabilities
62% 67% 73% 76% 75%
61% 65% 68% 70% 70%
Appendices
157
Appendix 6: Open-ended Survey Question 31
Introduction In the PaEE review survey undertaken by Massey University staff during February and March 2010, there were five open-ended questions for staff comment. The focus of these five questions were: Question 31 - pay and rewards Question 64 - the academic promotions process (for academic staff only) Question 69 – progression for general staff (for general staff only) Question 92 – harassment, bullying, discrimination and other inappropriate behaviour Question 100 – final comment about what Massey University does well areas that should be looked into further. This document reports on the comments provided by staff in relation to Question 31: What are your views on the way in which gender equity is or isn’t demonstrated in relation to pay and rewards at Massey University? This document has three parts. Part One contains and explains the code frame by which the responses to this question have been organised. Part Two provides a quantitative overview of the responses to this question by gender. Part Three contains the comments provided by staff to question 31, organised by gender in groupings that are broadly positive, neutral and negative. Part One – The code frame The code-frame below groups the responses to question 31 into three main groupings: 100-level codes indicate a comment about pay and rewards at Massey University being fair (in relation to gender equity) 200-level codes indicate that the comment is neutral – there is no definite view expressed either positively or negatively directly in response to the question OR includes concerns about the pay and rewards system that are not necessarily gender-specific 300-level codes indicate a comment about the pay and rewards process being unfair. The majority of these are focused on gender concerns but some are system issues that are likely to impact on both men and women. In addition, there is a fourth code – 999 – used for all ‘don’t knows’ which had no other qualifying comment. (A more detailed code-frame in relation to question 31 was initially established. Once this coding work was completed, the code frame was revised (to address codes with few responses, and to aggregate similar codes into larger groupings or a single generic code for analysis) in order to

Pay and Employment Equity Review Report and Action Plan
158
undertake an initial high-level analysis that would be meaningful. Some categories were found to be redundant, and some were integrated/merged/collapsed with others. In some cases this code conversion process resulted in a double-up of the same code. Any such double-ups have been removed. The conversion process has been captured so that it will be possible to disaggregate the current codes (see below) for further analysis if required.
Code frame for Question 31 What are your views on the way in which gender equity is or isn’t demonstrated in relation to pay and rewards at Massey University.
100
101 - Things are fair
105 - There is an historical lag - men advantaged in the past
106 - Own area OK - no gender difference in pay and rewards
108 - Pay scales don't differentiate between women and men/are fair
200
200 - Comment not entirely relevant (Neutral comment that does not apply to the question)
201 - Don't know - don't have enough information
205 - Assume/think/hope/want to believe/have faith it's OK
208 - Equity issues not necessarily gender based
212 - Equity issues around general staff wage settlements
213 - Equity issues between general and academic staff
214 - Issues with the advancement/ promotions process
217 - Comment on the survey itself
218 - Possible solutions
222 - Reference to people working in female or male- dominated areas frames comment and judgment about whether gender equity exists
300
300 - There is inequity at Massey University - assertion
301 - Men in senior positions, women in junior positions
304 - Lots women in admin; no men in admin; many lower salary grade positions occupied by higher percentage of women
305 - Query fair implementation of the pay and rewards system
306 - The pay and rewards system isn't transparent
310 - Men better negotiators at recruitment
311 - Women expect to be paid for what they have accomplished
312 - Women employed on lower starting salaries and lesser terms
314 - Women are employed at lower levels and kept there

Appendices
159
316 - Women are treated differently from men (less positively) (incl women not receiving support from senior males)
318 - Only research is valued not teaching
319 - Women take longer to be promoted; are given fewer opportunities for advancement
320 - When people coopted into higher positions, they tend to be men
321 - Men are advantaged under PBRF
325 - Women end up with tasks for which there is no reward eg admin tasks, extra teaching, pastoral care - which men won't or don't do
326 - Extra duties women take on reduces time for research and contributes to their being passed over for promotions/rewards
328 - Part-time work disadvantages women
331 - People with caring responsibilities outside work are disadvantaged
334 - General staff disadvantaged as not able to work from home as academics (sometimes) can
335 - More frequent absences for parental leave reduce opportunities for demonstrating sustained performance
337 - There is inequity in the promotions OR rewards system for general staff
338 - Gender inequity in favour of women/women better served than men
341 - Massey University operates a positive discrimination policy which advantages women
342 - Pay and rewards - other
344 - Men are more assertive/put themselves forward for promotions (or women the opposite)
345 - Promotions - other
346 - Men receive a higher salary/more rewards than women
348 - Personal grievance
349 - No reward system (extra pay or bonuses) for general staff taking on extra duties on temp basis, or in recognition of experience when on top of grade
350 - How work is valued disadvantages women
999
999 - Don't know
Part Two – Overview by gender of responses to Question 31 A total of 1127 valid responses have been coded and analysed in relation to this question about whether gender equity is or isn’t demonstrated in relation to pay and rewards at Massey University, 489 (43%) from men and 637 (57%) from women. This represents a slightly higher response rate from men for this question, than for the whole survey (60%). (There were 591 blank responses, 3 invalid character responses and 15 non-applicable responses.)
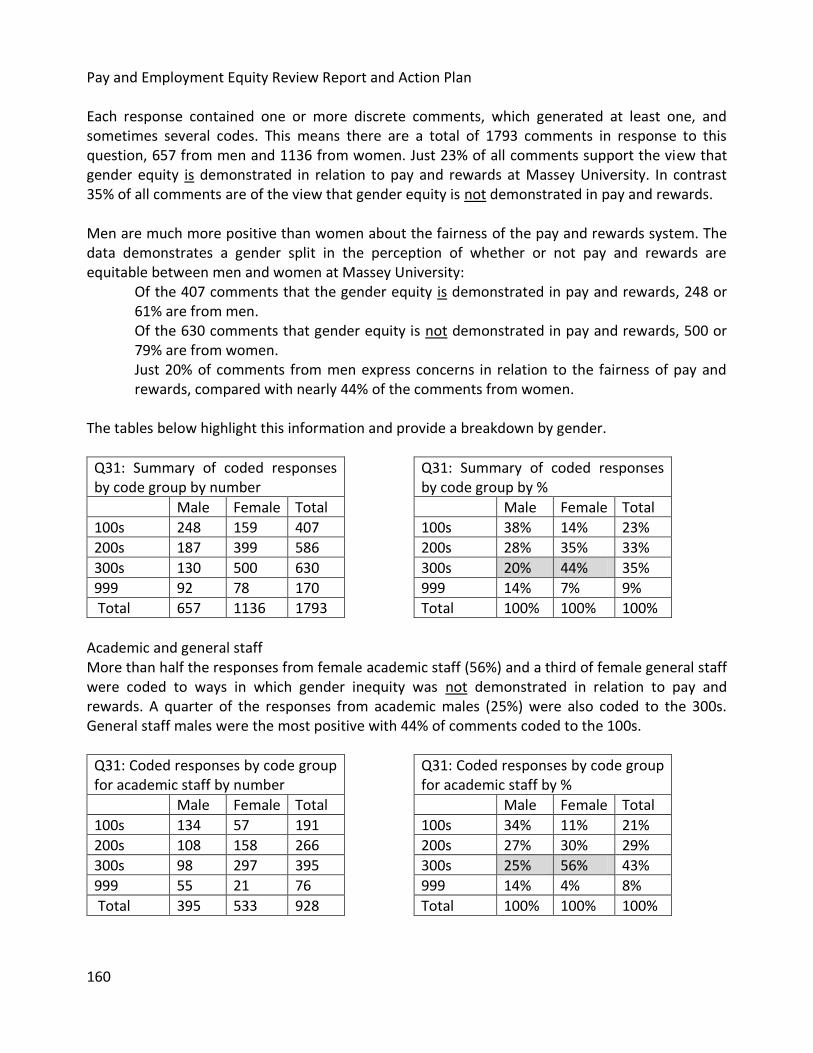
Pay and Employment Equity Review Report and Action Plan
160
Each response contained one or more discrete comments, which generated at least one, and sometimes several codes. This means there are a total of 1793 comments in response to this question, 657 from men and 1136 from women. Just 23% of all comments support the view that gender equity is demonstrated in relation to pay and rewards at Massey University. In contrast 35% of all comments are of the view that gender equity is not demonstrated in pay and rewards. Men are much more positive than women about the fairness of the pay and rewards system. The data demonstrates a gender split in the perception of whether or not pay and rewards are equitable between men and women at Massey University:
Of the 407 comments that the gender equity is demonstrated in pay and rewards, 248 or 61% are from men. Of the 630 comments that gender equity is not demonstrated in pay and rewards, 500 or 79% are from women. Just 20% of comments from men express concerns in relation to the fairness of pay and rewards, compared with nearly 44% of the comments from women.
The tables below highlight this information and provide a breakdown by gender.
Q31: Summary of coded responses by code group by number
Male Female Total
100s 248 159 407
200s 187 399 586
300s 130 500 630
999 92 78 170
Total 657 1136 1793
Q31: Summary of coded responses by code group by %
Male Female Total
100s 38% 14% 23%
200s 28% 35% 33%
300s 20% 44% 35%
999 14% 7% 9%
Total 100% 100% 100%
Academic and general staff More than half the responses from female academic staff (56%) and a third of female general staff were coded to ways in which gender inequity was not demonstrated in relation to pay and rewards. A quarter of the responses from academic males (25%) were also coded to the 300s. General staff males were the most positive with 44% of comments coded to the 100s.
Q31: Coded responses by code group for academic staff by number
Male Female Total
100s 134 57 191
200s 108 158 266
300s 98 297 395
999 55 21 76
Total 395 533 928
Q31: Coded responses by code group for academic staff by %
Male Female Total
100s 34% 11% 21%
200s 27% 30% 29%
300s 25% 56% 43%
999 14% 4% 8%
Total 100% 100% 100%

Appendices
161
Q31: Coded responses by code group for general staff by number
Male Female Total
100s 114 101 215
200s 78 236 314
300s 32 196 228
999 35 57 92
Total 259 590 849
Q31: Coded responses by code group for general staff by %
Male Female Total
100s 44% 17% 25%
200s 30% 40% 37%
300s 12% 33% 27%
999 14% 10% 11%
Total 100% 100% 100%
Colleges There were a total of 1793 coded comments to question 31, 1200 of which emerged from the colleges. Perceptions of gender equity in relation to pay and rewards varied between the colleges. The table below shows the percentage of comments in each college which were coded to the 300 code category. The college where perceptions are strongest that gender equity is not demonstrated in relation to pay and rewards is the College of Creative Arts at 49%, followed by the College of Humanities and Social Science, the College of Business, the College of Education, and the College of Sciences at 29%. The percentage of comments by women in all colleges about how gender equity is not demonstrated in pay and rewards was far greater that the percentage of comments by men. The percentage of 300-level comments by men ranged from 11% to 38%. The percentage of 300-level comments by women ranged from 40% to 65%. Of particular interest is the wide gap between the perceptions of men and women. Within two colleges in particular there was a sizable gap. In the College of Creative Arts just 14% of the male comments reflected a view that gender equity is not demonstrated in pay and rewards, compared with 65% of the female comments. In the College of Education the figures were 14% of male comments and 47% of female comments. The greatest similarity in male and female comments was in the College of Humanities and Social Science when 38% of male comments and 49% of female comments felt that gender equity was not demonstrated in pay and rewards.
Q31: Responses by college by gender – 300 codes by number & %
Number of 300 comments by college (cf. all comments)
% of comments coded to 300s as a % of all comments
Male Female Total Male Female Total
Business 25 (91) 67 (126) 92 (217) 27% 53% 42%
Creative Arts 5 (36) 53 (82) 58 (118) 14% 65% 49%
Education 2 (18) 49 (105) 51 (123) 11% 47% 41%
Humanities & SS 34 (89) 109 (224) 143 (313) 38% 49% 46%
Sciences 41 (219) 83 (210) 124 (429) 19% 40% 29%
Total 107 (453) 361 (747) 468 (1200) 24% 48% 39%

Pay and Employment Equity Review Report and Action Plan
162
Academic jobs With the exception of tutor positions, a high proportion of the comments from academics at all levels were in the 300 category; that is that gender equity is not demonstrated in pay and rewards at Massey University (ranging from 36% - 49%). Of the 790 comments from these academics, 347 or 44% were coded to this level. Clearly the weight of responses from academics is a lack of confidence in the pay and rewards system at Massey University. The table below shows a higher proportion of comments from male professors than female professors about how gender equity is not demonstrated in pay and rewards at Massey University (37% and 30% respectively). At all other levels, this view was expressed by a higher proportion of female than male comments. At associate professor level, senior lecturer level, and senior tutor level the difference between men and women was marked (19% male and 65% female at associate professor level, and 22% male and 68% female at senior lecturer level), and 13% male and 49% female at senior tutor level).
Q31: Responses by job title by gender - all comments and 300 comments by number & %
Number of 300 comments by job (cf. all comments)
% of comments coded to 300s as a % of all comments
Male Female Total Male Female Total
Professor 24 (65) 3 (10) 27 (75) 37% 30% 36%
Associate Professor/Reader 7 (37) 33 (51) 40 (88)
19%
65%
45%
Senior Lecturer/Senior Research Officer 31 (140) 135 (200) 166 (340)
22%
68%
49%
Lecturer/Research Officer 19 (66) 71 (134) 90 (200)
29%
53%
45%
Senior Tutor 2 (16) 18 (37) 20 (53) 13% 49% 38%
Tutor 1 (14) 3 (20) 4 (34) 7% 15% 12%
Total 84 (338) 263 (452) 347 (790) 25% 58% 44%
General staff positions Around a third of all comments from general staff were coded to the 300 level category, that is that gender equity is not demonstrated in pay and rewards at Massey University. Consistent with academic staff, this view was expressed by a higher proportion of female than male comments for both librarian and administration services positions.

Appendices
163
Q31: Responses by job title by gender - all comments and 300 comments by number & %
Number of 300 comments by job (cf. all comments)
% of comments coded to 300s as a % of all comments
Male Female Total Male Female Total
Administration services 6 (26) 89 (285) 95 (311)
23%
31%
31%
Librarian 3 (15) 27 (64) 30 (79) 20% 42% 38%
Total 9 (41) 116 (349) 125 (390) 22% 33% 32%
Code frame categories by count The table below provides a breakdown of the number of comments coded in each code-frame category. By focusing on the 300 codes, it is possible to identify the areas which were discussed most frequently by survey respondents, and to gain a sense of the ‘weighting’ of the various issues. Some of the comments, like those in code 301, are facts about the numbers of women in senior and management positions relative to men. In other cases, particular processes and other issues that are deemed to be contributing to gender inequity in pay and rewards are identified. The 300-level issues most frequently mentioned (more often than 20 times) were: 301 Men in senior positions; women in junior positions 75 346 Men receive a higher salary/more rewards than women 60 331 People with caring responsibilities outside work are disadvantaged 44 325 Women end up with tasks for which there is no reward (admin tasks, extra teaching, pastoral care) which men won’t or don’t do 40 316 Women are treated differently (less positively) than men 37 319 Women take longer to be promoted/are given fewer opportunities for advancement 36 326 Part-time work disadvantages women 26 320 When people co-opted into higher positions they tend to be men 24 304 Gender segregation – lots of women in admin 22 344 Men are more assertive/put themselves forward for promotions (or women the opposite) 20
Code frame for Question 31 - What are your views on the way in which gender equity is or isn’t demonstrated in relation to pay and rewards at Massey University.
Male Female Total
100 248 159 407
101 - Things are fair 178 118 296
105 - There is an historical lag - men advantaged in the past 6 6 12
106 - Own area OK - no gender difference in pay and 49 27 76

Pay and Employment Equity Review Report and Action Plan
164
rewards
108 - Pay scales don't differentiate between women and men/are fair 15 8 23
200 187 399 586
200 - Comment not entirely relevant (Neutral comment that does not apply to the question) 15 39 54
201 - Don't know - don't have enough information 82 172 254
205 - Assume/think/hope/want to believe/have faith it's OK 32 29 61
208 - Equity issues not necessarily gender based 18 53 71
212 - Equity issues around general staff wage settlements 1 7 8
213 - Equity issues between general and academic staff 1 11 12
214 - Issues with the advancement/ promotions process 10 16 26
217 - Comment on the survey itself 5 3 8
218 - Possible solutions 9 26 35
222 - Reference to people working in female- or male- dominated areas frames comment and judgment about whether gender equity exists 14 43 57
300 130 500 630
300 - There is inequity at Massey University - assertion 14 35 49
301 - Men in senior positions, women in junior positions 18 57 75
304 - Lots women in admin; no men in admin; many lower salary grade positions occupied by higher percentage of women 2 20 22
305 - Query fair implementation of the pay and rewards system 2 14 16
306 - The pay and rewards system isn't transparent 3 16 19
310 - Men better negotiators at recruitment 5 5
311 - Women expect to be paid for what they have accomplished 7 7
312 - Women employed on lower starting salaries and lesser terms 1 12 13
314 - Women are employed at lower levels and kept there 1 10 11
316 - Women are treated differently from men (less positively) (incl women not receiving support from senior males) 5 32 37
318 - Only research is valued not teaching 1 3 4
319 - Women take longer to be promoted; are given fewer opportunities for advancement 4 32 36
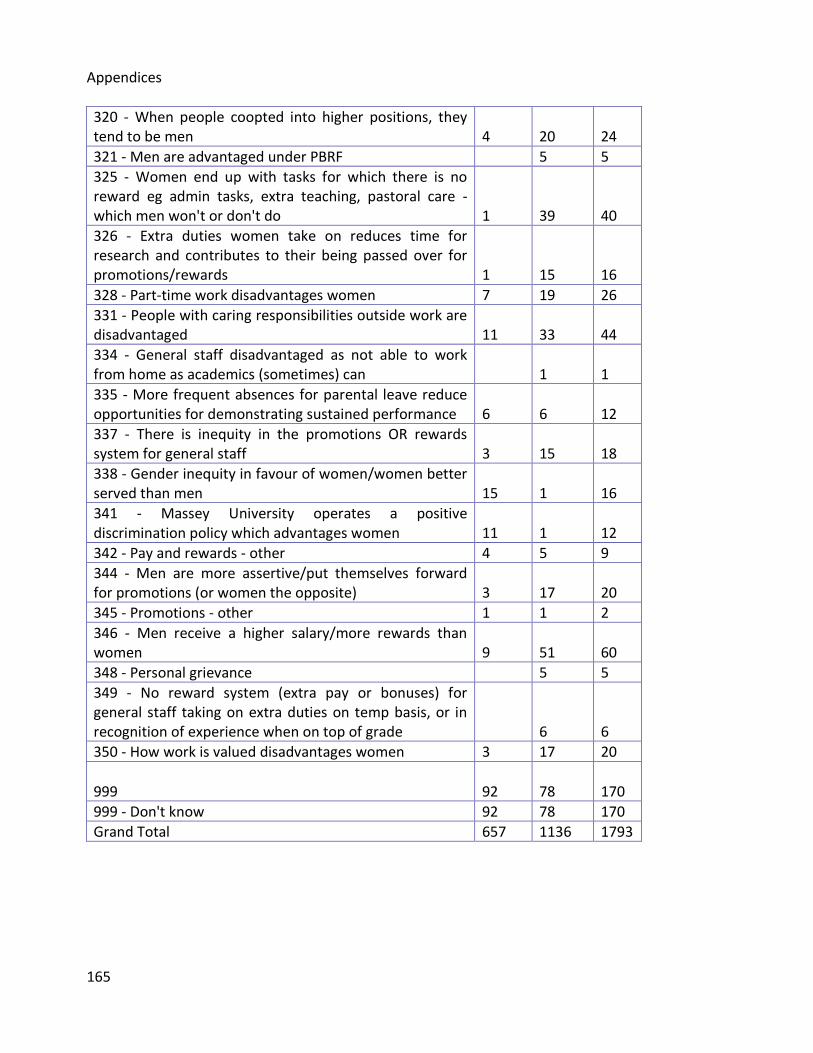
Appendices
165
320 - When people coopted into higher positions, they tend to be men 4 20 24
321 - Men are advantaged under PBRF 5 5
325 - Women end up with tasks for which there is no reward eg admin tasks, extra teaching, pastoral care - which men won't or don't do 1 39 40
326 - Extra duties women take on reduces time for research and contributes to their being passed over for promotions/rewards 1 15 16
328 - Part-time work disadvantages women 7 19 26
331 - People with caring responsibilities outside work are disadvantaged 11 33 44
334 - General staff disadvantaged as not able to work from home as academics (sometimes) can 1 1
335 - More frequent absences for parental leave reduce opportunities for demonstrating sustained performance 6 6 12
337 - There is inequity in the promotions OR rewards system for general staff 3 15 18
338 - Gender inequity in favour of women/women better served than men 15 1 16
341 - Massey University operates a positive discrimination policy which advantages women 11 1 12
342 - Pay and rewards - other 4 5 9
344 - Men are more assertive/put themselves forward for promotions (or women the opposite) 3 17 20
345 - Promotions - other 1 1 2
346 - Men receive a higher salary/more rewards than women 9 51 60
348 - Personal grievance 5 5
349 - No reward system (extra pay or bonuses) for general staff taking on extra duties on temp basis, or in recognition of experience when on top of grade 6 6
350 - How work is valued disadvantages women 3 17 20
999 92 78 170
999 - Don't know 92 78 170
Grand Total 657 1136 1793

Pay and Employment Equity Review Report and Action Plan
166
Appendix 7: Massey University Salary Scales 2009 (from the Collective Employment Agreement)
General Employee Salary Scales (2009)
Grade Minimum Maximum Standard Increment*
Job Evaluation Points
Grade A $24,280 $34,952 $1,105 Up to 100
Grade B $26,491 $38,698 $1,221 101-120
Grade C $29,073 $43,068 $1,272 121-140
Grade D $32,955 $48,685 $1,430 141-160
Grade E $36,825 $54,303 $1,457 161-190
Grade F $43,292 $61,169 $1,490 191-230
Grade G $51,367 $73,027 $1,666 231-270
Grade H $60,407 $84,887 $1,883 271 - 310
Grade I $72,029 $96,745 $1,901 Over 311
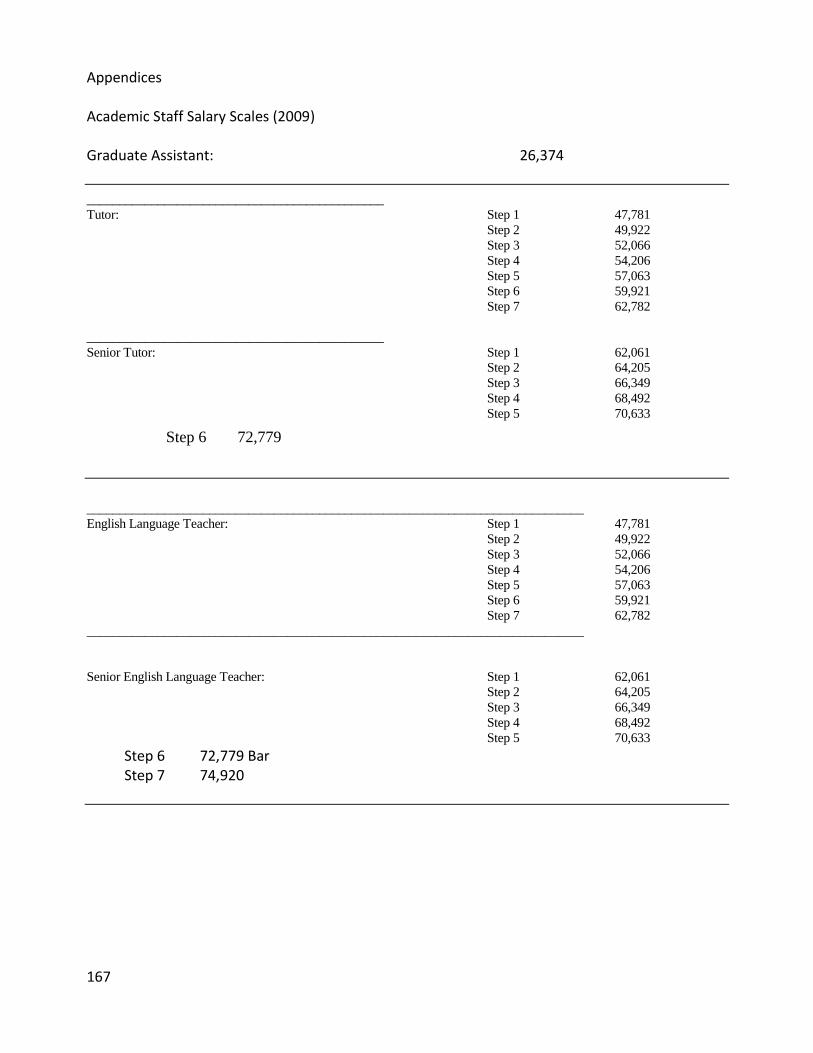
Appendices
167
Academic Staff Salary Scales (2009) Graduate Assistant: 26,374
______________________________________________
Tutor: Step 1 47,781
Step 2 49,922
Step 3 52,066
Step 4 54,206
Step 5 57,063
Step 6 59,921
Step 7 62,782
______________________________________________
Senior Tutor: Step 1 62,061
Step 2 64,205
Step 3 66,349
Step 4 68,492
Step 5 70,633
Step 6 72,779
_____________________________________________________________________________
English Language Teacher: Step 1 47,781
Step 2 49,922
Step 3 52,066
Step 4 54,206
Step 5 57,063
Step 6 59,921
Step 7 62,782
_____________________________________________________________________________
Senior English Language Teacher: Step 1 62,061
Step 2 64,205
Step 3 66,349
Step 4 68,492
Step 5 70,633
Step 6 72,779 Bar Step 7 74,920

Pay and Employment Equity Review Report and Action Plan
168
Assistant Lecturer/Junior Research Officer: Step 1 49,922
Step 2 52,066
Step 3 54,206
_____________________________________________________________________________
_____________________________________________________________________________
Lecturer/Research Officer: Step 1 62,061
Step 2 64,205
Step 3 66,349
Step 4 68,492
Step 5 70,633
Step 6 72,775
Step 7 74,918
Step 8 77,063
Step 9 79,205 Bar
_____________________________________________________________________________
Senior Lecturer/Senior Research Officer: Range 1 77,774
To
95,774 Bar
Range 2 92,776
To
110,058 Bar
_____________________________________________________________________________
Associate Professor: Range 102,775
To
120,056 Bar
_____________________________________________________________________________
Professor: Range 119,915
To
No Limit
___________________________________________________________________________

Appendices
169
Practicing Veterinarian/Professional Clinician: Step 1 62,061
Step 2 64,205
Step 3 66,349
Step 4 68,492
Step 5 70,633
Step 6 72,775
Step 7 74,918
Step 8 77,063
Step 9 79,205 Bar
_____________________________________________________________________________
Senior Practicing Veterinarian/ Range 1 77,774
Professional Clinician: To
95,774
Range 2 92,776
To
110,058 Bar
_____________________________________________________________________________
Postdoctoral Fellow: Step 1 62,061
Step 2 64,205
Step 3 66,349
Step 4 68,492
Step 5 70,633
Step 6 72,775
Step 7 74,918

Pay and Employment Equity Review Report and Action Plan
170
Appendix 8: Science technicians
This page describes the category of ‘science technicians’ used in the body of the report, and identifies the Massey University job titles included in this generic title. The category includes all staff who have a general staff letter grade (A–I) AND have one of the Massey University job titles AND have one of the correlating ANZCO job titles shown in the table below. Staff who, for example, had the Massey University job title of “technician” but the ANZCO job title of “technicians and trade workers nec”, or who had the Massey job title of “research assistant” but the ANZCO job title of “information and organisation professionals nec” were excluded from this data group. Animal trainers and vet nurses have been excluded as one could argue they are not research or teaching technicians. Also excluded are the few individuals who have the right Massey University and ANZSCO job title but are a contract or academic employee.
Massey University Job Title ANZSCO Job Title Anaesthetic Technician Agricultural Technician Anatomy and Physiology Technician Anaesthetic Technician Assistant Laborary Technician Chemistry Technician Assistant Technician Earth Science Technician Assistant Technologist Electronic Engineering Technician Bioinformatics Technician Food Technologist Biology Technician Hardware Technician Chemistry Technician Life Science Technician Ecology Technician Mechanical Engineering Technician Electron Microscope Technician Medical Laboratory Technician Engineering Services Technician Science Technicians Environmental Engineering Laboratory Technician Science Technicians nec EpiCentre Technician Field Technician Food Technologist Food Technology Technician Head Technician Histology Technician Laboratory Technician Laboratory/Research Technician Large Animal Hospital Technician Mechanical Workshop Technician Medical Radiation Technologist Medical Radiation Technologist (Radiographer) Microbiology Technician Process Engineering Laboratory Technician Production Specialist/Technician Research Assistant Research Technician Research Technician in Yeast Nutrition & Ageing Research/Teaching Technician Science Technician Senior Technical Advisor Senior Technician Technical Manager
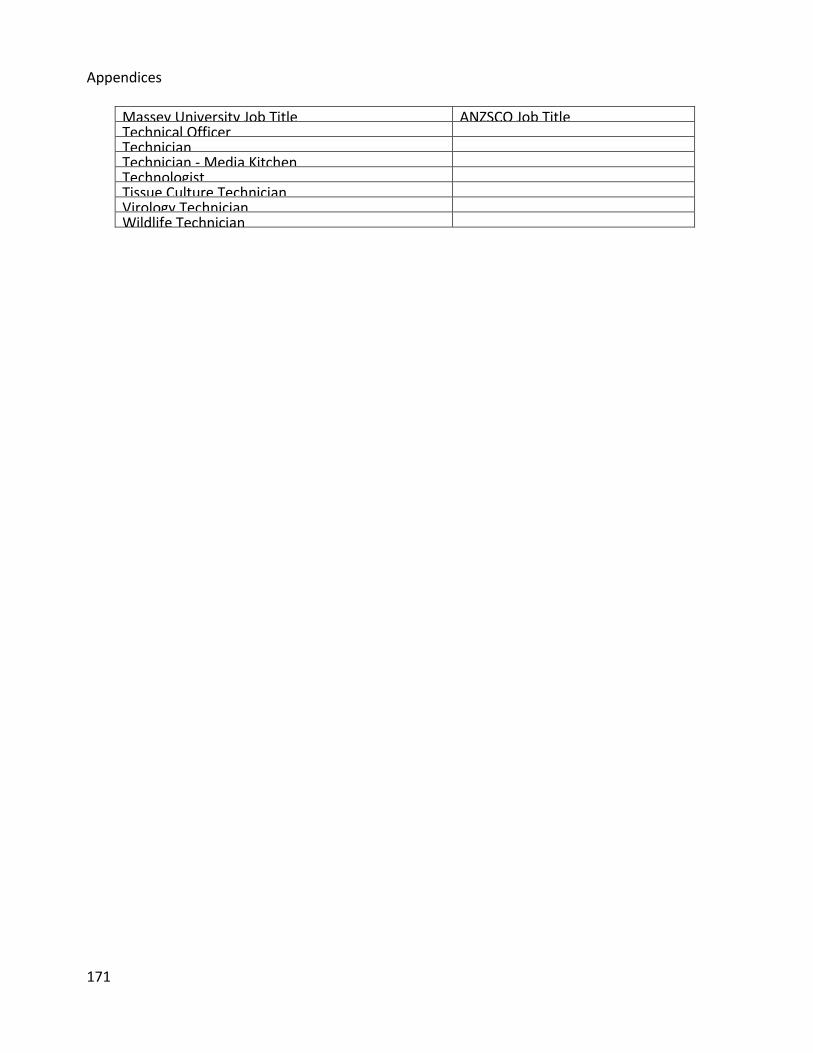
Appendices
171
Massey University Job Title ANZSCO Job Title Technical Officer Technician Technician - Media Kitchen Technologist Tissue Culture Technician Virology Technician Wildlife Technician

Pay and Employment Equity Review Report and Action Plan
172
Appendix 9: Statistical analysis of general staff by letter-grade and of survey data: opportunities for advancement and perceptions of equality
Report to the PAEE review committee F Wolber, 10 June, 2010 OPPORTUNITIES FOR ADVANCEMENT It was noted at the June meeting that “tutor” and “senior tutor” positions are usually held by females and present no opportunity for advancement. A follow-up question raised was whether female general-staff employees at Massey, or employees in female-dominated general-staff job categories at Massey, also have less opportunity for advancement. The majority of general-staff jobs are sex-dominated one way or another at Massey. Of 151 general-staff ANZCO job categories, 30% are female dominated (>70% females), 49% are male dominated (>60% males), and only 21% are sex-balanced. However, of the female-dominated jobs, over 60% of the categories pay less than the mean Massey general-staff wage of $52,227; of the male-dominated jobs, over 60% of the categories pay more the mean Massey general-staff wage of $52,227. Many ANZSCO general job categories are so narrow that they only contain one or two employees, and quite a few are comprised of employees who are not general grade A - I but rather are clinical, contract, or senior leadership (aka otherwise-academic) personnel. Jobs for which there are least 11 general grade A – I employees were identified and considered as “major general-staff job categories”. There are a total of 37 such job categories, containing over 1300 general grade A - I employees. Of these 37 categories, there are 15 female-dominated (>70% female), 10 male-dominated (>60% male), and 12 sex-balanced categories (Table 1). Thus, of what were deemed “major general” job categories, fewer than one-third are not dominated by a single sex. Employees in the female-dominated jobs identified in Table 1 earn less than employees in the male-dominated jobs, with the average salary in female-dominated jobs being $45,759 and the average salary in the male-dominated jobs being $52,424. Thus, an employee changing from a female-dominated to a male-dominated profession is likely to enjoy an average pay rise of nearly 15%.

Appendices
173
Table 1: “Major general job categories” with >11 grade A–F employees
FEMALE DOMINATED SEX BALANCED MALE DOMINATED
Accounts Clerk Education Managers nec * Accountant (General)
Call or Contact Centre Operator Life Science Technician Analyst Programmer
Chemistry Technician Management Consultant Caretaker
Clerical & Administrative Workers Marketing Specialist Developer Programmer
Clerical & Office Support Workers Misc. Education Professional Earth Science Technician
General Clerk Printer's Assistant Gardener (General)
Human Resource Clerk Programme or Project Administrator
ICT Customer Support Officer
Inquiry Clerk Public Relations Professional ICT Managers nec
Librarian Science Technicians nec ICT Support Technicians
Library Assistant Shelf Filler Technicians & Trades Workers
Office Manager Training & Development Professional
Personal Assistant Welfare Support Workers
Receptionist (General)
Secretary (General)
Veterinary Nurse
Total grade A-I employees: 698
Total grade A-I employees: 367
Total grade A-I employees: 255
* NB: this does not include 01 - Education Managers nec, which appears to be a different category (?). Employees in female-dominated jobs do appear to have less opportunity for advancement. For the purposes of this analysis, it was assumed that the employee with the highest letter grade in a job category represented the highest letter grade any employee in that job category could aspire to. In 59% of the female-dominated job categories, the highest letter-graded employee is an E or F; only 18% of the male-dominated job categories stall at D or E (Figure 1). In 64% of the male-dominated categories, the highest graded employee is a G, H or I; less than 12% of the female-dominated job categories reach G, H or I.
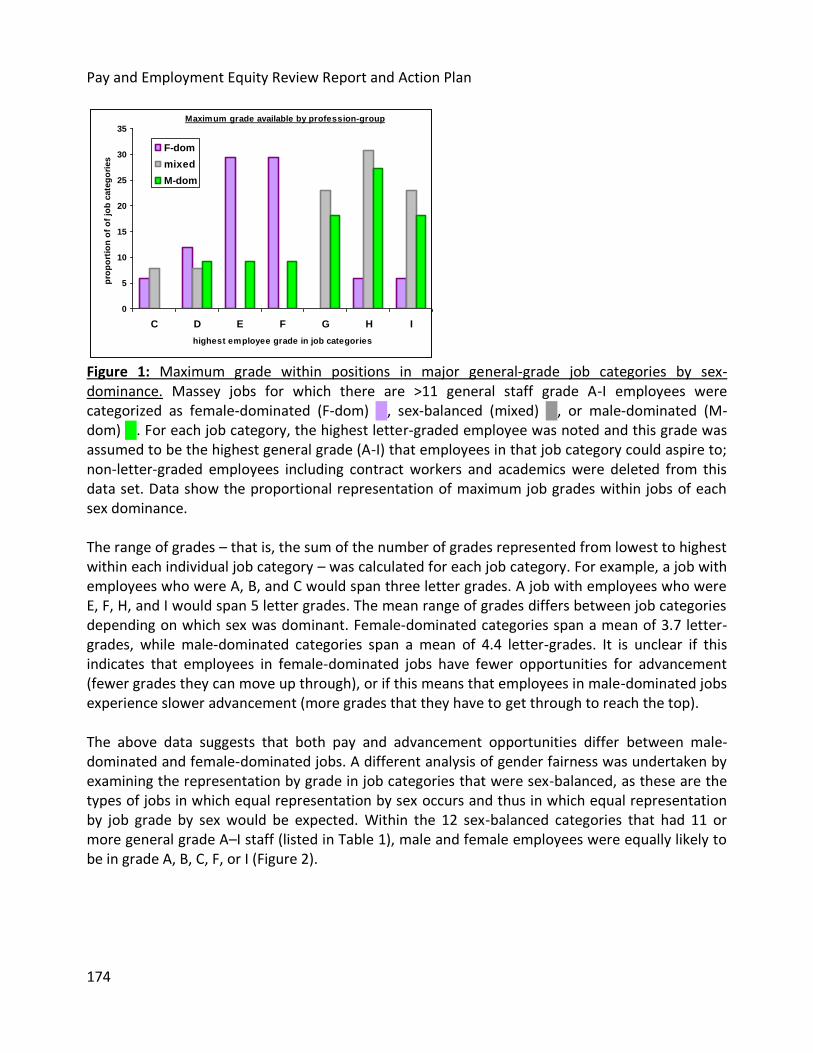
Pay and Employment Equity Review Report and Action Plan
174
Figure 1: Maximum grade within positions in major general-grade job categories by sex-dominance. Massey jobs for which there are >11 general staff grade A-I employees were categorized as female-dominated (F-dom) █, sex-balanced (mixed) █, or male-dominated (M-dom) █. For each job category, the highest letter-graded employee was noted and this grade was assumed to be the highest general grade (A-I) that employees in that job category could aspire to; non-letter-graded employees including contract workers and academics were deleted from this data set. Data show the proportional representation of maximum job grades within jobs of each sex dominance. The range of grades – that is, the sum of the number of grades represented from lowest to highest within each individual job category – was calculated for each job category. For example, a job with employees who were A, B, and C would span three letter grades. A job with employees who were E, F, H, and I would span 5 letter grades. The mean range of grades differs between job categories depending on which sex was dominant. Female-dominated categories span a mean of 3.7 letter-grades, while male-dominated categories span a mean of 4.4 letter-grades. It is unclear if this indicates that employees in female-dominated jobs have fewer opportunities for advancement (fewer grades they can move up through), or if this means that employees in male-dominated jobs experience slower advancement (more grades that they have to get through to reach the top). The above data suggests that both pay and advancement opportunities differ between male-dominated and female-dominated jobs. A different analysis of gender fairness was undertaken by examining the representation by grade in job categories that were sex-balanced, as these are the types of jobs in which equal representation by sex occurs and thus in which equal representation by job grade by sex would be expected. Within the 12 sex-balanced categories that had 11 or more general grade A–I staff (listed in Table 1), male and female employees were equally likely to be in grade A, B, C, F, or I (Figure 2).
Maximum grade available by profession-group
0
5
10
15
20
25
30
35
C D E F G H I
highest employee grade in job categories
pro
po
rtio
n o
f o
f jo
b c
ate
go
ries
F-dom
mixed
M-dom

Appendices
175
Figure 2: Maximum grade within positions in sex-balanced major general-staff job categories. Left: Massey jobs for which there are >11 general staff grade A - I employees and which are not dominated by one sex were selected and the proportions of female █ and male █ employees in each letter grade were calculated. Right: the numbers of female █ and male █ employees in each letter grade in the single job category of “science technicians nec” are shown. However, the female employees were somewhat overrepresented in the lower grades, with 40% of the females being D or E, compared with 28% of males. In contrast, 33% of the males were in G or H, compared with 23% of females. The same pattern was borne out when the single largest job category (science technicians nec) was examined. This suggests that within job categories that are not dominated by one sex, females are appointed at a lower grade and/or are advanced more slowly than males. In the most prominent example of this job category (science technicians nec), it is clear that males tend to be in a higher grade than females. The general trend for females within the sex-balanced job categories to be of a lower letter-grade than the males was borne out by the observation that females tended to have lower mean salaries than their male counterparts within each job category. As shown in Table 2, when comparing by sex either all employees within the category, or only general staff with a letter grade (i.e. excluding contract, academic, and other graded staff), there is a statistically significant pattern in which male salaries are, on average, 5–6% higher than female salaries. The statistical analysis shows that the likelihood of the difference in salaries being attributed to some factor other than random chance is >97%. Thus, explanations should be sought for these differences. Table 2: Mean salaries of males and females for all employees (all), or only employees with letter grades of A–I (gen A- I).
Sex-balanced major general-staff job categories
F sal (all)
M sal (all)
F sal (gen A–I)
M sal (gen A–I)
Education Managers nec $97,915 $115,742 $73,887 $82,536
Life Science Technician $46,572 $46,710 $46,117 $46,710
Proportional representation within grades
by sex
0
5
10
15
20
25
30
A B C D E F G H I
% o
f em
plo
yees in
gra
de b
y s
ex
F
M
number of employees by grade: Science
Technicians nec
0
2
4
6
8
10
12
14
16
18
A B C D E F G
# e
mp
loyees
Female
Male
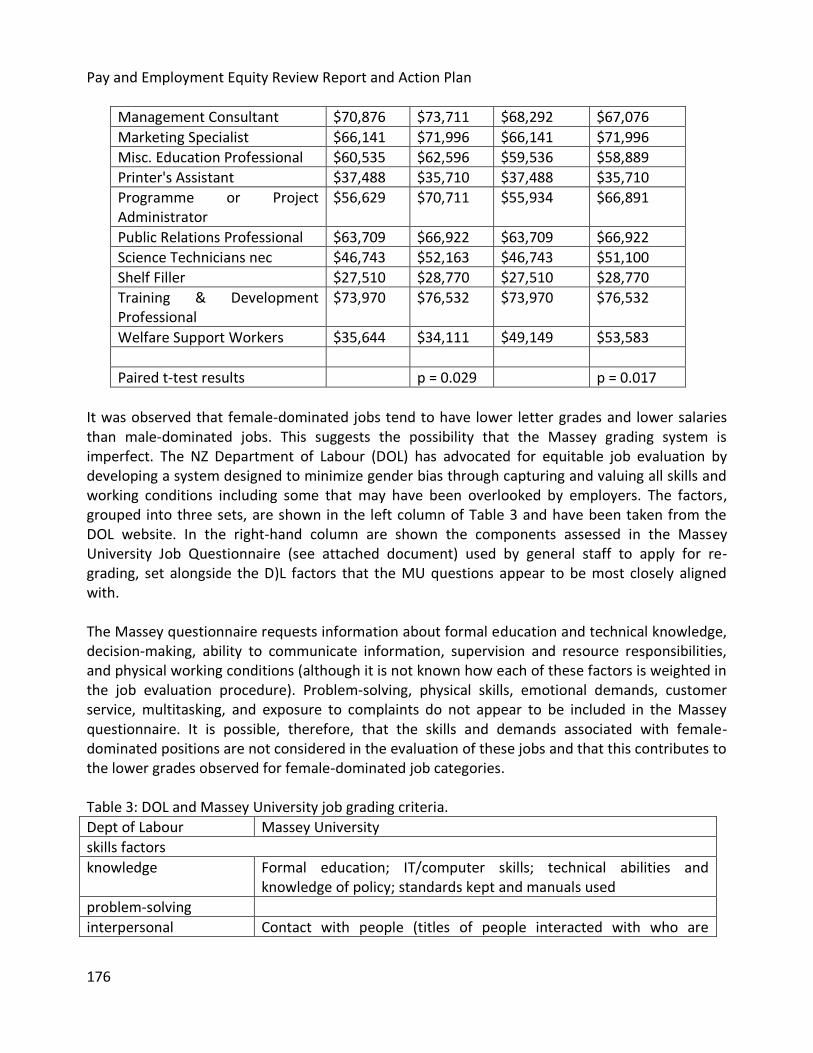
Pay and Employment Equity Review Report and Action Plan
176
Management Consultant $70,876 $73,711 $68,292 $67,076
Marketing Specialist $66,141 $71,996 $66,141 $71,996
Misc. Education Professional $60,535 $62,596 $59,536 $58,889
Printer's Assistant $37,488 $35,710 $37,488 $35,710
Programme or Project Administrator
$56,629 $70,711 $55,934 $66,891
Public Relations Professional $63,709 $66,922 $63,709 $66,922
Science Technicians nec $46,743 $52,163 $46,743 $51,100
Shelf Filler $27,510 $28,770 $27,510 $28,770
Training & Development Professional
$73,970 $76,532 $73,970 $76,532
Welfare Support Workers $35,644 $34,111 $49,149 $53,583
Paired t-test results p = 0.029 p = 0.017
It was observed that female-dominated jobs tend to have lower letter grades and lower salaries than male-dominated jobs. This suggests the possibility that the Massey grading system is imperfect. The NZ Department of Labour (DOL) has advocated for equitable job evaluation by developing a system designed to minimize gender bias through capturing and valuing all skills and working conditions including some that may have been overlooked by employers. The factors, grouped into three sets, are shown in the left column of Table 3 and have been taken from the DOL website. In the right-hand column are shown the components assessed in the Massey University Job Questionnaire (see attached document) used by general staff to apply for re-grading, set alongside the D)L factors that the MU questions appear to be most closely aligned with. The Massey questionnaire requests information about formal education and technical knowledge, decision-making, ability to communicate information, supervision and resource responsibilities, and physical working conditions (although it is not known how each of these factors is weighted in the job evaluation procedure). Problem-solving, physical skills, emotional demands, customer service, multitasking, and exposure to complaints do not appear to be included in the Massey questionnaire. It is possible, therefore, that the skills and demands associated with female-dominated positions are not considered in the evaluation of these jobs and that this contributes to the lower grades observed for female-dominated job categories. Table 3: DOL and Massey University job grading criteria.
Dept of Labour Massey University
skills factors
knowledge Formal education; IT/computer skills; technical abilities and knowledge of policy; standards kept and manuals used
problem-solving
interpersonal Contact with people (titles of people interacted with who are
Appendices
177
essential for carrying out job purpose, and frequency); types of communication required (reports, letters, teaching)
physical skills
responsibilities factors
responsibilities for leadership
Organization chart (your position in relation to managers, peers & subordinates); decision making & problem resolution; number of people supervised
resources Equipment responsibilities; operational and capital budgets
organisational outcomes Purpose of job (summary); key results/important aspects of job; level of responsibility and impact of mistakes
services to people Number of students dealt with
demands factors
emotional
sensory & physical demands
Physical efforts; concentrated visual and aural effort
working conditions Temperature, noise, lighting, air quality, odours, toxins, travel
The findings in this report are put into context with the PAEE workbook, which instructs users to identify significant differences and to then determine whether those differences are explainable and justifiable: Significant difference #1: The majority of job categories at Massey are sex-dominated, and female-dominated positions have a lower mean wage than male-dominated positions. Significant difference #2: In general-staff jobs that are sex-dominated, female-dominated jobs have a lower top letter grade and a lower grade span than male-dominated jobs, resulting in fewer opportunities for advancement in female-dominated jobs. Females dominate female-dominated jobs and are thus more likely to be affected by the lack of opportunity for advancement. Significant difference #3: In general-staff jobs that are not sex-dominated, females have a lower mean letter-grade than males, and wages are determined by letter grade. Therefore, male salaries are higher than female salaries across job categories. Possible explanation #1 (Justifiable): The skills required to carry out female-dominated jobs require fewer academic qualifications than the skills required to carry out male-dominated jobs, and thus female-dominated jobs tend to top out at grades E and F while male-dominated jobs tend to top out at G, H, and I. Possible explanation #2 (Justifiable): The years of experience required to become skilled at female-dominated jobs are fewer than the years of experience required to become skilled at male-dominated jobs, and thus female-dominated jobs span fewer grades than male-dominated jobs; Possible explanation #3 (Justifiable): Male employees at Massey tend overall to be more highly qualified than female employees.

Pay and Employment Equity Review Report and Action Plan
178
Possible explanation #4 (Not Justifiable): The job skills and demands associated with female-dominated jobs (such as interpersonal skills, number of people being provided services to, and emotional demands) are undervalued or not included in the evaluation process, resulting in a falsely low grade for these positions. Possible explanation #5 (Not Justifiable): Women are preferentially hired for low-paying/female-dominated jobs, while men are preferentially hired for high-paying/male-dominated jobs, causing the job categories at Massey to become or remain gender-skewed. Possible explanation #6 (Probably Justifiable): Most applicants for low-paying jobs are female, and most applicants for high-paying jobs are male, despite HR practices to recruit and obtain males and females equally for all job types. Possible explanations #7, 8, 9, 10…. It is possible, as noted above in #3, that male salaries in a given job category are significantly higher than female salaries in the same category because the males are more highly qualified than the females. A difference in education or experience would both explain and justify the salary difference. However, as indicated by the results of the statistical analysis, it is improbable that males would be more qualified than females in job category A and job category B and job category C and job category D and….. Whether the differences truly are explainable and justifiable can be determined only by examining and comparing the relevant qualifications of all employees within each job category, assessing the recruiting and hiring practices at Massey, and evaluating the Massey job evaluation and questionnaire forms -- tasks which are beyond the limitations of the review committee. PERCEPTIONS OF EQUALITY It was also noted by Rae Torrie at the June meeting that there was a noticeable trend in the survey in which females tended to be more pessimistic about equality at Massey compared to males. This offered the opportunity for more statistical analysis, thus making it of more interest (arguably) than the survey finding which showed that nearly one-third of Massey employees are unaware of the procedure for making a complaint about bullying/harassment (committee moved to encourage Massey to act on this directly by putting information sheets in tearooms and toilets), or the finding which showed that 26% of permanent employees had not had a performance appraisal in the last year (something which probably needs enforcing). Questions about job experiences in general, and questions about Massey’s treatment of women specifically, were separated out. For the purposes of this analysis, most questions have had a negative (e.g. not) word inserted for uniformity’s sake to indicate the proportions of males and females believing they have had a negative experience (e.g., I am not satisfied, I am not fairly paid, I have been bullied). As shown in Table 4, females had a significantly more negative perception of their treatment than males in terms of x, y, and z. In every case, females were more likely to report that they did not believe they were treated fairly, that they were not satisfied, that they had been bullied, that they had not received an annual PRP, etc, compared to males. A paired t-test comparing female versus male responses demonstrated that the difference was statistically significant (99% likelihood that the difference was not due to random chance).

Appendices
179
Likewise, females were more likely than males to believe that women are disadvantaged at Massey with regards to pay, advancement, and opportunities. This is unsurprising, as those experiencing disadvantages are more likely to be aware of the phenomenon than those who do not share the disadvantages. However, nearly 10% of males also agreed that women do not receive equal opportunities for advancement.

Pay and Employment Equity Review Report and Action Plan
180
Table 4: Survey data.
Survey Q #
Question % females
% males
77 I am not satisfied with the flexibility of work arrangements in my job 10.1 8.55
79 My boss is not committed to helping us have a good work-life balance 16.29 15.72
86 Taking parental leave disadvantaged my promotion/progression prospects 24.45 0
39 My views as a committee/board member are not respected or taken into account 7.38 5.44
43 My views as a project team/work group member are not respected or taken into account 4.77 2.91
21 I am not fairly paid compared to others doing the same job 30.06 20.82
22 I am not fairly paid compared to others doing different but equivalent work 33.24 25.11
88a I have been bullied at work in the last 24 months. 17.68 11.64
18 There is not an obvious career path for my current academic position 34.6 29.63
93 I have not had a performance appraisal in the last year (permanent employees) 31 21
Paired t-test: p = 0.01
20 Opportunities for advancement are not equitable for women. 28.81 9.23
32 Training and development opportunities are not allocated fairly to women 8.63 1.55
99 My manager treats women less advantageously than men 8.56 1.84
28 Women do not receive an equitable share of additional payments 16.6 4.23
Paired t-test: p = 0.03
The observations that that 12–18% of survey respondents report having been bullied, and nearly one-third of academic survey respondents state that they do not have a career path and/or have not had annual performance appraisals, suggest that there is likely to be a high degree of job dissatisfaction at Massey, which if correct may lead to a difficulty in retaining employees. As nearly a third of survey respondents felt they were not fairly compensated, and a large number of survey respondents responded “don’t know” to a number of questions about Massey practices, the survey findings also imply that there may be a lack of transparency at Massey.

Appendices
181
Stats explanation
Example 1: Individual data points plotted (20 male versus 12 female) for the ANSZCO job category of education managers nec They look fairly similar, except for one male (the green box above the $250,000 mark) that appears to be an “extreme outlier” because of his abnormally high salary. However, there aren’t a lot of individuals in this group. There is no way to tell whether, if there were another ten or twenty people, that outlier would in fact just be at the upper end of a continuous range that stretched from ~$75,000 to ~$275,000.
Same data, shown as the means of 20 males and 12 females + standard deviation bars The y-axis only goes to 200K instead of 300K because averaging the salaries of all the individuals within each sex “hides” the extreme outlier. However, because of that outlier, the standard deviation bar for the males is bigger than for the females, reflecting that there is more variability in the males’ salaries.
A Student’s t-test compares male versus female wages within the single category, taking into consideration how much variability there is and how many individuals there are in each group. It asks, how much difference is there in the male education managers nec salaries and the female education managers nec salaries, and what are the odds that this difference (if any) is due to random chance – how likely is it that this is just the normal variation between two sexes in the same job, given the amount of variation within males and the amount of variation within females? The Student’s t-test produces a p-value. A p-value of less than 0.05 (5%) is considered statistically significant. In this case, the difference is not statistically significant. There is a 22.8% (22 in 100) chance it’s just random that the average male wage is 15% higher than the average female wage – mostly because of that one male outlier. Example 2: Individual data points plotted (27 male versus 53 female) for the ANSZCO job category of programme or project administrator The male and female data here look less similar to each other compared with the first example. There is one high male who is a bit of an “outlier”, and a couple of females who are slight outliers
education managers nec:
raw data
0
50,000
100,000
150,000
200,000
250,000
300,000
0 . 5 1 1. 5 2 2 . 5
base s
ala
ry (
p.a
.)
male female
education managers nec:
means
0
50,000
100,000
150,000
200,000
male female
base s
ala
ry (
p.a
.)
education managers nec:
means
0
50,000
100,000
150,000
200,000
male female
base s
ala
ry (
p.a
.)
p = 0.228
program or project
administrator: raw data
0
25,000
50,000
75,000
100,000
125,000
150,000
0 . 5 1 1. 5 2 2 . 5
base s
ala
ry (
p.a
.)
male female
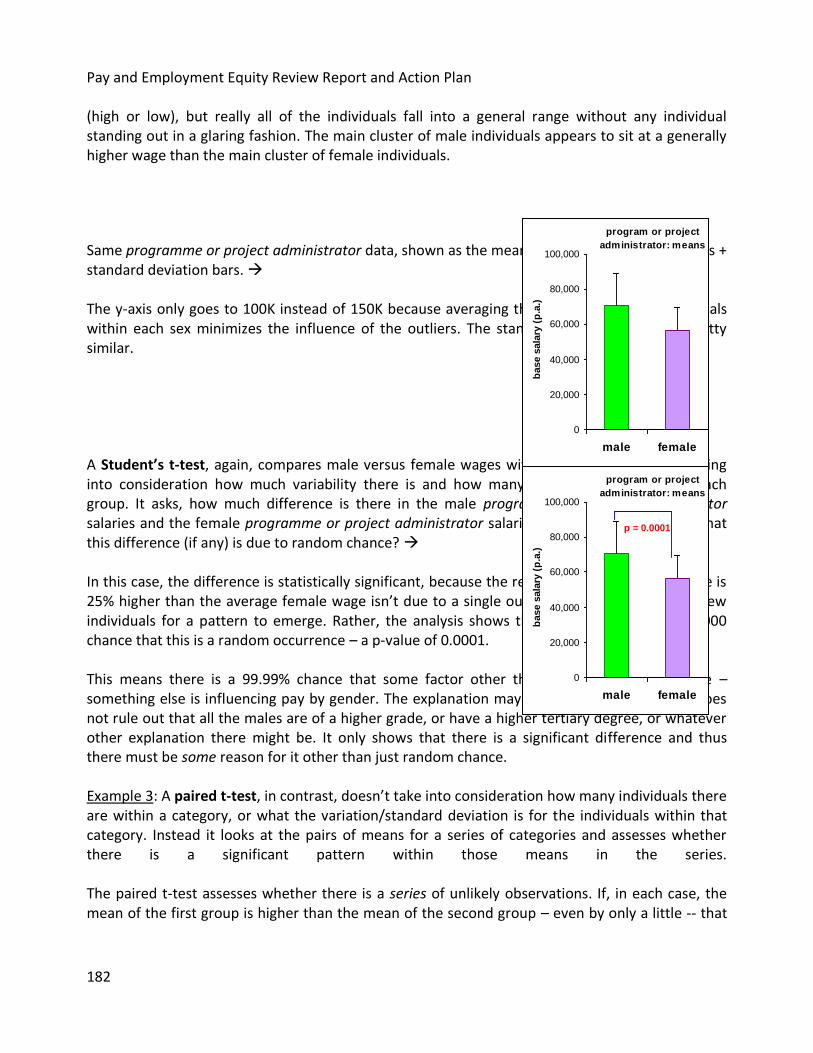
Pay and Employment Equity Review Report and Action Plan
182
(high or low), but really all of the individuals fall into a general range without any individual standing out in a glaring fashion. The main cluster of male individuals appears to sit at a generally higher wage than the main cluster of female individuals.
Same programme or project administrator data, shown as the means of 27 males and 53 females + standard deviation bars. The y-axis only goes to 100K instead of 150K because averaging the salaries of all the individuals within each sex minimizes the influence of the outliers. The standard deviation bars are pretty similar. A Student’s t-test, again, compares male versus female wages within the single category, taking into consideration how much variability there is and how many individuals there are in each group. It asks, how much difference is there in the male programme or project administrator salaries and the female programme or project administrator salaries, and what are the odds that this difference (if any) is due to random chance? In this case, the difference is statistically significant, because the reason the average male wage is 25% higher than the average female wage isn’t due to a single outlier, or to there being too few individuals for a pattern to emerge. Rather, the analysis shows that there is only a 1 in 10,000 chance that this is a random occurrence – a p-value of 0.0001. This means there is a 99.99% chance that some factor other than chance is playing a role – something else is influencing pay by gender. The explanation may be perfectly justifiable. It does not rule out that all the males are of a higher grade, or have a higher tertiary degree, or whatever other explanation there might be. It only shows that there is a significant difference and thus there must be some reason for it other than just random chance. Example 3: A paired t-test, in contrast, doesn’t take into consideration how many individuals there are within a category, or what the variation/standard deviation is for the individuals within that category. Instead it looks at the pairs of means for a series of categories and assesses whether there is a significant pattern within those means in the series. The paired t-test assesses whether there is a series of unlikely observations. If, in each case, the mean of the first group is higher than the mean of the second group – even by only a little -- that
program or project
administrator: means
0
20,000
40,000
60,000
80,000
100,000
male female
base s
ala
ry (
p.a
.)
program or project
administrator: means
0
20,000
40,000
60,000
80,000
100,000
male female
base s
ala
ry (
p.a
.)p = 0.0001
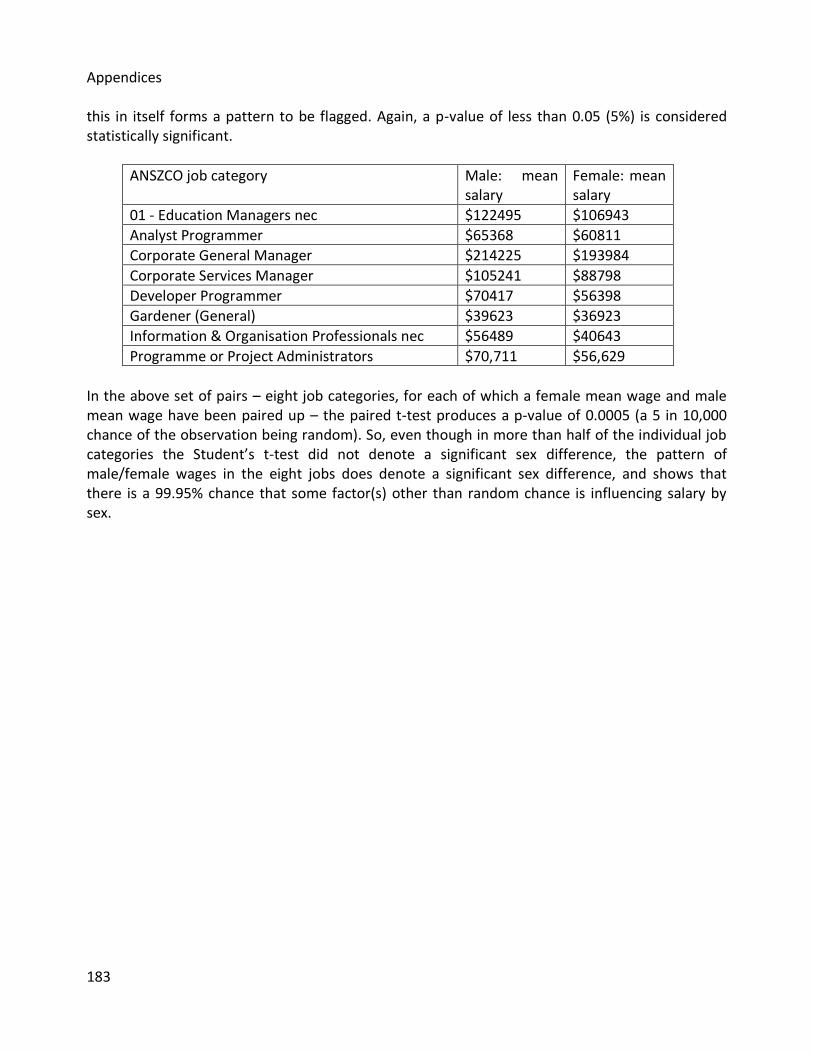
Appendices
183
this in itself forms a pattern to be flagged. Again, a p-value of less than 0.05 (5%) is considered statistically significant.
ANSZCO job category Male: mean salary
Female: mean salary
01 - Education Managers nec $122495 $106943
Analyst Programmer $65368 $60811
Corporate General Manager $214225 $193984
Corporate Services Manager $105241 $88798
Developer Programmer $70417 $56398
Gardener (General) $39623 $36923
Information & Organisation Professionals nec $56489 $40643
Programme or Project Administrators $70,711 $56,629
In the above set of pairs – eight job categories, for each of which a female mean wage and male mean wage have been paired up – the paired t-test produces a p-value of 0.0005 (a 5 in 10,000 chance of the observation being random). So, even though in more than half of the individual job categories the Student’s t-test did not denote a significant sex difference, the pattern of male/female wages in the eight jobs does denote a significant sex difference, and shows that there is a 99.95% chance that some factor(s) other than random chance is influencing salary by sex.

Pay and Employment Equity Review Report and Action Plan
184
Appendix 10: Gender Differences in Pay by Grade
Grades with fewer than 3 men or 3 women are not included
Grade Code
Grade Description Male Average
Female Average
Female average as % of Male average
A.PROF ASSOCIATE PROFESSOR $118,190.49 $117,686.64 100
AL.2 ASSISTANT LECTURER/JUNIOR RESEARCH OFFICER Step 2
$52,779.33 $54,008.04 102
AL.3 ASSISTANT LECTURER/JUNIOR RESEARCH OFFICER Step 3
$56,852.09 $57,851.24 102
CED ADVISERS TO SCHOOLS $78,403.67 $79,269.24 101
CONTRACT SPECIFIC TO EMP CONTRACT $66,754.96 $58,805.22 88
GA GRADUATE ASSISTANT $26,374.00 $26,505.25 100
GEN A GENERAL STAFF GRADE.A $27,105.16 $28,125.20 104
GEN B GENERAL STAFF GRADE B $34,051.84 $33,282.53 98
GEN C GENERAL STAFF GRADE C $38,303.20 $38,088.40 99
GEN D GENERAL STAFF GRADE D $43,591.02 $44,289.50 102
GEN E GENERAL STAFF GRADE E $51,123.32 $50,141.26 98
GEN F GENERAL STAFF GRADE F $57,641.46 $58,112.76 101
GEN G GENERAL STAFF GRADE G $69,055.01 $66,527.02 96
GEN H GENERAL STAFF GRADE H $83,091.23 $81,630.65 98
GEN I GENERAL STAFF GRADE I $90,482.45 $90,859.49 100
L.1 LECTURER/RESEARCH OFFICER Step 1 $65,022.93 $62,740.05 96
L.2 LECTURER/RESEARCH OFFICER Step 2 $65,666.20 $64,558.41 98
L.3 LECTURER/RESEARCH OFFICER Step 3 $67,902.39 $67,204.01 99
L.4 LECTURER/RESEARCH OFFICER Step 4 $72,235.94 $69,883.32 97
L.5 LECTURER/RESEARCH OFFICER Step 5 $71,832.50 $72,031.60 100
L.6 LECTURER/RESEARCH OFFICER Step 6 $73,325.80 $74,367.81 101
L.7 LECTURER/RESEARCH OFFICER Step 7 $77,930.09 $77,899.83 100
L.8 LECTURER/RESEARCH OFFICER Step 8 $80,114.91 $78,620.58 98
L.9 LECTURER/RESEARCH OFFICER Step 9 $83,527.48 $81,835.12 98
PDOC.1 POSTDOCTORAL FELLOW Step 1 $62,561.78 $62,414.47 100
PDOC.2 POSTDOCTORAL FELLOW Step 2 $64,727.39 $64,719.64 100
PRAC Practicing Veterinarian/Professional Clinician
$78,550.62 $80,171.10 102
PROF PROFESSOR $149,299.38 $139,643.05 94
S.TUT.2 SENIOR TUTOR Step 2 $64,924.68 $64,760.49 100
S.TUT.3 SENIOR.TUTOR Step 3 $68,082.93 $67,211.11 99

Appendices
185
S.TUT.4 SENIOR.TUTOR Step 4 $68,737.58 $68,695.08 100
S.TUT.6 SENIOR.TUTOR Step 6 $75,880.98 $73,953.37 97
SLET.6 SENIOR ENGLISH LANGUAGE TEACHER Step 6
$75,352.15 $74,940.20 99
SL(O) SENIOR LECTURER (Over Scale) $136,646.28 $107,925.39 79
SL.R1 SENIOR LECTURER/SENIOR RESEARCH OFFICER RANGE 1
$96,322.57 $97,715.26 101
SL.R2 SENIOR LECTURER/SENIOR RESEARCH OFFICER RANGE 2
$106,367.75 $106,621.65 100
SNR STAFF SENIOR MANAGEMENT STAFF $161,371.12 $140,870.30 87
TUT.3 TUTOR Step3 $52,066.00 $52,430.56 101
TUT.4 TUTOR Step4 $55,736.29 $55,822.18 1
TUT.7 TUTOR Step7 $61,710.08 $62,916.05 102
WC.L WELLINGTON LECTURER CONTRACT $74,954.57 $73,480.28 98