massey hall energy and water audit - artsbuild ontario
TRANSCRIPT

Massey Hall Energy and
Water Audit
Prepared for: The Corporation of Massey
Hall and Roy Thomson Hall
April 2014 | 8914003-001


i ENERGY AUDIT REPORT
MMM Group Limited | A
CONTENTS
APPENDICES ......................................................................................................................... I
1.0 EXECUTIVE SUMMARY ................................................................................................. 1
2.0 INTRODUCTION ............................................................................................................. 3
2.1 METHODOLOGY ............................................................................................................. 4
2.2 GENERAL APPROACH ................................................................................................... 4
3.0 GENERAL BUILDING CHARACTRISITICS ................................................................... 6
3.1 BUILDING ENVELOPE .................................................................................................... 7
3.2 MECHANICAL SYSTEMS ................................................................................................ 7
3.3 LIGHTING SYSTEMS .................................................................................................... 10
3.4 DOMESTIC WATER SYSTEMS .................................................................................... 11
4.0 UTILITY USAGE ANALYSIS ........................................................................................ 14
4.1 ENERGY INTENSITY ..................................................................................................... 14
4.2 ANNUAL ENERGY ALLOCATION ................................................................................. 15
4.3 UTILITY CONSUMPTION AND COST SUMMARY ....................................................... 16
4.4 ELECTRICAL USAGE ANALYSIS ................................................................................. 16
4.5 STEAM USAGE ANALYSIS ........................................................................................... 17
4.6 WATER USAGE ANALYSIS .......................................................................................... 18
5.0 ENERGY CONSERVATION MEASURES .................................................................... 19
5.1 SUMMARY OF ENERGY CONSERVATION MEASURES ........................................... 19
5.2 RETRO-COMMISSIONING ............................................................................................ 21
5.3 CATEGORY 1 – ENERGY CONSERVATION MEASURES ......................................... 22
5.3 CATEGORY 2 – ENERGY CONSERVATION MEASURES ......................................... 27
5.4 CATEGORY 3 – ENERGY CONSERVATION MEASURES ......................................... 29
5.5 WATER CONSERVATION MEASURES ....................................................................... 29
5.6 ADDITIONAL ENERGY CONSERVATION MEASURES .............................................. 29
6. CONCLUSION .............................................................................................................. 30
APPENDICES A Glossary of Terms
B Equipment Schedule
C Lighting Schedule
D Utility Data

ii
COPYRIGHT NOTICE
Copyright © 2014 by MMM Group Limited
The information contained in this document is the intellectual property of MMM Group Limited. It is
intended solely for use by the client named herein. Reproduction of portions of this document for
use by the Client is permitted. Reproduction of any portion of this document or use of the
intellectual ideas contained within it for any other purpose is prohibited.

iii ENERGY AUDIT REPORT
MMM Group Limited | A
MMM Group Limited
100 Commerce Valley Drive West, Thornhill, Ontario, L3T 0A1 t: 905.882.1100 I f: 905.882.0055 www.mmm.ca
April 22, 2014 Stephen Clarkin
Building Operations Manager
60 Simcoe St. Toronto, ON M5J 2H5
Dear Mr. Clarkin,
Please find enclosed the MMM Energy Audit for the building at 178 Victoria Street, Toronto.
The audit evaluates and recommends energy saving opportunities and available rebates from
various incentive programs. The audit also provides estimated projects cost, savings and
expected payback periods. The details in this report are based on a comprehensive
evaluation of historic energy consumption trends and a complete review of the existing
building systems and their operation.
MMM Group has developed a holistic approach to identifying and recommending energy
conservation measures which allows short payback measures to offset longer payback
measures and this approach best positions the building against future increases in energy
prices.
This audit was performed and reviewed by a Certified Professional Engineer in accordance
with ASHRAE Level II Energy Audit requirements and upgraded to meet the OPA
saveONenergy audit incentive requirements.
I trust our Energy Audit meets with your approval and acceptance.
Sincerely yours,
Maurice Safatly, P.Eng.
Manager
MMM Group Limited


1 ENERGY AUDIT REPORT
MMM Group Limited | A
1.0 EXECUTIVE SUMMARY
MMM Group was retained by The Corporation of Massey Hall and Roy Thomson Hall to perform
an energy audit and to provide recommendations for energy saving opportunities within the facility
located at 178 Victoria Street, Toronto.
The energy audit conducted was an ASHRAE Level II audit and included a walk-through of the
facility, interviews with the facility operating personnel, review of utility bills, energy analysis for
each Energy Conservation Measure (ECM), and a financial analysis including implementation
cost estimates, cost savings, and simple payback. A summary of the findings are shown below:
Table 1.1: Energy and Cost Intensity Summary
Consumption
% Total Cost
Unit Cost Total Cost
($)
Current Projected all
measures
ekWh/ft2 $/ft
2 ekWh/ft
2 $/ft
2
Electricity 627,952 kWh 0.65 0.1633 $/kWh $102,574 10.3 1.71 8.9 $1.48
Steam 1,888,322 lbs 0.21 0.0176 $/lbs. $33,152 10.4 0.55 10.8 $0.57
Water 7,808 m3 0.14 2.7557 $/m3 $21,516 N/A 0.36 N/A $0.31
Total $157,242 20.7 2.62 19.8 2.37
Total (2012-2013): 21 ekWh/ft2-year
Ontario Average: 45 ekWh/ft2-year
-118% Compared to
45
Best Worst
21
20
NRCAN Average for Art, Entertainment, and
Recreation Facilities Current
Projected (All Measures)
Total Energy Consumption
(ekWh/ft2-year)
2
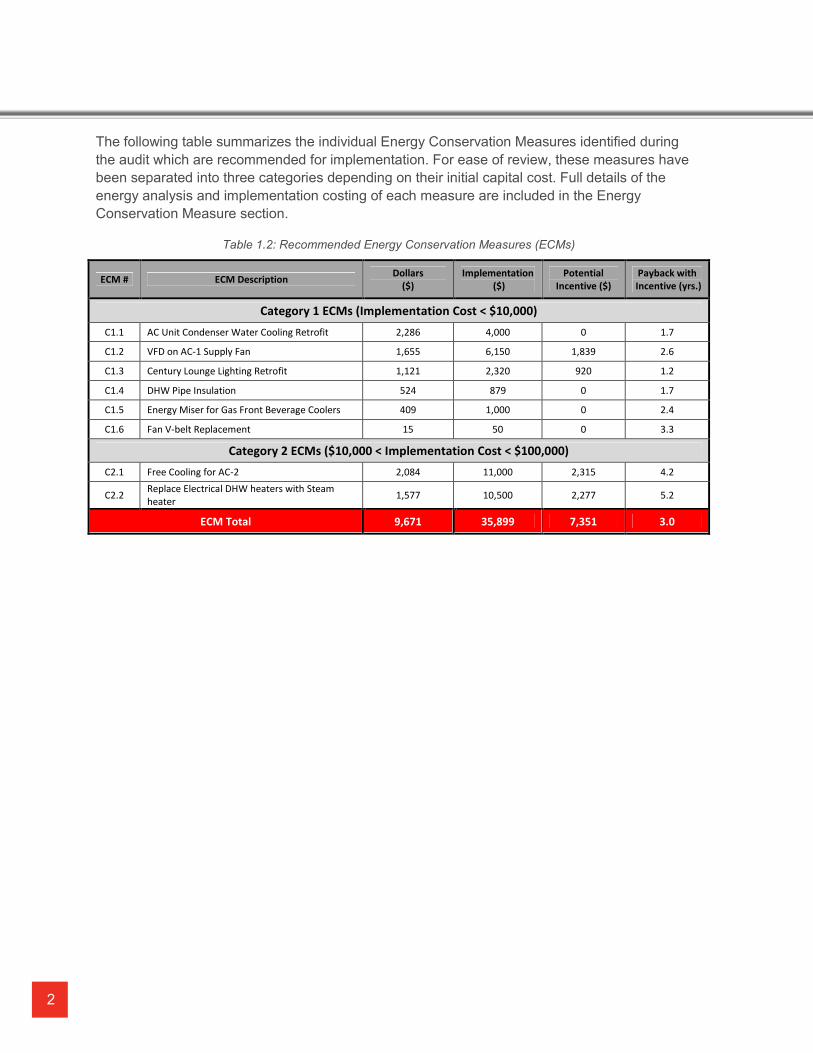
The following table summarizes the individual Energy Conservation Measures identified during
the audit which are recommended for implementation. For ease of review, these measures have
been separated into three categories depending on their initial capital cost. Full details of the
energy analysis and implementation costing of each measure are included in the Energy
Conservation Measure section.
Table 1.2: Recommended Energy Conservation Measures (ECMs)
ECM # ECM Description Dollars
($)
Implementation
($)
Potential
Incentive ($)
Payback with
Incentive (yrs.)
Category 1 ECMs (Implementation Cost < $10,000)
C1.1 AC Unit Condenser Water Cooling Retrofit 2,286 4,000 0 1.7
C1.2 VFD on AC-1 Supply Fan 1,655 6,150 1,839 2.6
C1.3 Century Lounge Lighting Retrofit 1,121 2,320 920 1.2
C1.4 DHW Pipe Insulation 524 879 0 1.7
C1.5 Energy Miser for Gas Front Beverage Coolers 409 1,000 0 2.4
C1.6 Fan V-belt Replacement 15 50 0 3.3
Category 2 ECMs ($10,000 < Implementation Cost < $100,000)
C2.1 Free Cooling for AC-2 2,084 11,000 2,315 4.2
C2.2 Replace Electrical DHW heaters with Steam
heater 1,577 10,500 2,277 5.2
ECM Total 9,671 35,899 7,351 3.0

3 ENERGY AUDIT REPORT
MMM Group Limited | A
2.0 INTRODUCTION
MMM Group Limited (MMM Group) performed an ASHRAE Level II energy audit. The intent of this
study was to evaluate the existing mechanical and electrical building systems and elements to
determine possible energy management and conservation measures for the facility, and to qualify
them in terms of efficiency, operation, cost effectiveness and environmental impact. We have
referred to ASHRAE Procedures for Commercial Building Energy Audits and compiled a
comparison matrix outlining the process and report tasks for all audit levels:
Table 2.1: ASHRAE - PROCEDURES FOR COMMERCIAL BUILDING ENERGY AUDITS, SECOND EDITION
PROCESS AUDIT LEVEL
I II III
Conduct Preliminary Energy-Use Analysis (PEA) ● ● ●
Conduct walk-through survey ● ● ●
Identify low-cost/no-cost recommendations ● ● ●
Identify Capital improvements ● ● ●
Review mechanical and electrical (M&E) design and conditions and O&M practices
● ●
Analyze capital measures (savings and cost, including interactions) ● ●
Meet with owner/operators to review recommendations ● ●
Conduct additional testing/monitoring ●
Perform detailed system modeling ●
Provide schematic layouts for recommendations ●
REPORT AUDIT LEVEL
I II III
Estimate savings from utility rate change ● ● ●
Compare EUI to EUI of similar sites ● ● ●
Summarize utility data ● ● ●
Estimate savings if EUI were to meet target ● ● ●
Calculate detailed end-use breakdown ● ●
Estimate Capital Project costs and savings ● ●
Complete building description and equipment inventory ● ●
Document general description of considered measures ● ●
Recommend measurement and verification (M&V) method ● ●
Perform financial analysis of recommended EEMs ● ●
Write detailed description of recommended measures ●
Compile detailed EEM cost estimates ●

4
2.1 METHODOLOGY
The analyses of the energy conservation opportunities consisted of the following general
evaluations stages:
• Determine the energy requirements of the facility with regards to weather relative
components, occupancy and operation.
• Evaluate the existing system components, and their respective energy consumption, in
order to generate feasible energy conservation measures.
• Determine implementation costs associated with the prescribed energy conservation
measures.
• Provide cost/benefit analyses, including payback calculations for the proposed energy
conservation opportunities.
Equipment and system costing values are estimates, based on industry standards and RS Means
costing database publications. Costs will need to be confirmed prior to implementation through a
standard contractor tender process.
The energy analysis is based on the weather bin data analysis to determine the energy savings
associated with proposed measures. In addition, proprietary energy modeling software was
utilized.
The following utility bills were reviewed:
• Electrical Utility Bills January 2012 to December 2013
• Steam Utility Bills January 2012 to December 2013
• Water Utility Bills June 2012 to November 2013
The utility rate structure which will be used for the purpose of this report is the average value
obtained from 24 months of utility bills, January 2012 through December 2013. The values are as
follows:
Electricity Consumption $0.091 per KWh
Electricity Demand $10.18 per kW
Steam $0.018 per lbs.
Water $2.74 per m3
2.2 GENERAL APPROACH
Site reviews were carried out on February 11, 2014 and February 20, 2014 to determine the
physical and operational condition of the building systems. Interviews with maintenance personnel
were conducted during the site reviews to understand the facility operation, details of any recent

5 ENERGY AUDIT REPORT
MMM Group Limited | A
upgrades and/or modifications to the systems, plans for upcoming capital upgrades, and to
identify current operational concerns.
The mechanical systems including heating system, cooling system, domestic cold water system,
domestic hot water system, and plumbing fixtures were examined during the site visit. The
mechanical systems are in general maintained in good condition.
Building lighting intensity was visually checked and is in the appropriate range.
During the site visit it was noticed that there is a comfort issue in the management office and in
the corridors in the basement area.
The general approach taken to this energy audit project is presented below.

6
3.0 GENERAL BUILDING CHARACTRISITICS
Building Location
178 Victoria street,
Toronto, Ontario
M5B 1T7
Year Constructed
1894
Building Gross Area
60,000 ft2
Building Use
Performance Art Theater
Performance Summary
2013: 80
2012: 90
Capacity
2,752 seats
$102,574
$33,152$21,516
Electricity
Steam
Water1.71
0.55
0.36
0
0.5
1
1.5
2
2.5
$/ft2

7 ENERGY AUDIT REPORT
MMM Group Limited | A
3.1 BUILDING ENVELOPE
3.1.1 Envelope
The building structure is steel frame construction. The exterior walls of the building consist of red
brick masonry walls and stone block masonry. There are areas of stone detailing with classical
elements on the façade.
The exterior doors and frames are a combination of hollow metal and wood doors. The windows
are original to the building and they are single-layer stained glass windows.
3.2.1 Roofing
The roof of the building consists of a hipped roof with a gable along the north end as well as east
and west slopes.
3.2 MECHANICAL SYSTEMS
A detailed list of all major mechanical equipment can be found in Appendix B - Equipment
Schedule. The building mechanical equipment is mainly located in the basement. The following
narrative outlines the operation of the major mechanical systems.
3.2.1 Cooling Plant
There is no central cooling plant in the building. The main source of cooling in the building is
provided by two (2) air cooled air conditioning units (AC-1 and AC-2).
Cooling to the basement electrical room is provided by one (1) air conditioning unit with a water-
cooled condenser. DCW is used to cool down the refrigerant. This unit is located in the ceiling
space next to the temporary management office.
3.2.2 Heating Plant
There is no central heating plant in the building. The main source of the heat in the building is high
pressure steam supplied by Enwave. The main steam supply and pressure reducing valves are
located in the basement mechanical room. It provides low pressure steam to the perimeter
radiators, AC-1 heating coil and lobby supply air handling unit.
Figure 3.1: Main Steam Pipe Figure 3.2: Perimeter Steam Radiator

8
3.2.3 HVAC System
Heating, cooling and ventilation to the basement areas and auditorium is provided by AC-1. AC-1
is located in the basement and comes equipped with steam heating coils, a DX-cooling unit, a
return fan and a supply fan. This unit can be running at either 100% fresh air or 100% return air.
The air cooled condenser which serves AC-1 is located on the lower roof. Based on the staff
interview the existing cooling (DX coils) will be replaced with chilled water supplied by a new air
cooled chiller.
The new dressing rooms which were recently added to the building are equipped with VAV boxes
and electric reheat coils; however they are not working efficiently as there is no VFD installed on
the AC-1 supply fan.
The supply air to the century lounge is manually controlled by opening and closing the volume
damper. Usually the damper is open only during the intermission and a few hours before the
show.
Figure 3.3: Century Lounge Supply Duct Figure 3.4: Century Lounge Supply Damper
Control
Cooling to the Galleria and Balcony level as well as back stage area is provided by AC-2. AC-2 is
located on the lower roof and is equipped with a DX cooling unit and supply fan.
AC-1 and AC-2 are only on when there is a show or maintenance crews are working.

9 ENERGY AUDIT REPORT
MMM Group Limited | A
Figure 3.5: BAS Screenshot: AC-1 and AC-2
Heating to the Entrance lobby and foyer is provided by one AHU which is equipped with steam
coils and a supply fan. The AHU is located in the small mechanical room near the foyer. The box
office is conditioned via one Carrier water cooled heat pump.
Figure 3.6: Entrance Lobby and Foyer Supply Fan Figure 3.7: Heat Pump
The general exhaust for the building is accomplished by one 7.5hp fan located on the higher roof.
The washroom exhaust fan is located in the box office room.

10
Figure 3.8: General Exhaust Fan Figure 3.9: Washroom Exhaust Fan
3.2.4 HVAC Controls
All HVAC equipment is controlled by a Honeywell building automation system (BAS), with head-
end equipment located in the management office in the basement level.
The lights in the building are also controlled by BAS; most of the lights in the basement area are
on one circuit and are ON approximately 15 hours/day. The Auditorium and chair lights are ON
when there is an event.
Figure 3.10: BAS: Main Screen Figure 3.11: BAS: Lighting Control
3.3 LIGHTING SYSTEMS
Please refer to Appendix C - Lighting Schedule for a detailed list of the lighting fixtures and
wattages.
The majority of the lights in the building are incandescent, which is the least efficient lighting type.
The chair lights are a combination of 40W incandescent and tubular incandescent.

11 ENERGY AUDIT REPORT
MMM Group Limited | A
The recently renovated dressing rooms are equipped with T5 and CFL lamps which are controlled
with occupancy sensors.
Most of the washrooms are illuminated via MR16 lamps which are on all the time.
Corridors and stairways are equipped with surface mounted fixtures and T8 lamps.
3.4 DOMESTIC WATER SYSTEMS
3.4.1 Domestic Cold Water System
The main domestic cold water pipe enters the building at the basement level. The main water
meter is located in the mechanical room next to the foyer. There is no booster pump in the
building.
Figure 3.12: Water meters
3.4.2 Domestic Hot Water
There are three (3) electrical domestic hot water heaters located in the basement which serve
washrooms, showers, dressing rooms and century bar. The DHW heater 1 was installed in 2009
and has 4.5 kW input. DHW heater 2 and 3 have 2 kW input each. There is a small recirculating
pump for DHW in the building.

12
Figure 3.13: Electrical DHW heaters Figure 3.14: DHW recirculation pump
There is one (1) 3 kW DHW heater located in the balcony level left closet which serves the men’s
washroom and bar on the balcony level. The women’s washroom on the balcony level is served
by one (1) 1.5 kW DHW heater located in the balcony level right closet.
Figure 3.15: Electrical DHW heater in left balcony
closet
Figure 3.16: Electrical DHW heater in right balcony
closet

13 ENERGY AUDIT REPORT
MMM Group Limited | A
3.4.3 Plumbing Fixtures
The majority of the plumbing fixtures at the building are low flow type fixtures with automatic
proximity sensors. This includes sinks, water closets, and urinals.
Figure 3.17: Typical Sink Figure 3.18: Typical Toilet

14
4.0 UTILITY USAGE ANALYSIS
4.1 ENERGY INTENSITY
The calculation of energy performance and energy cost indices is based on building floor area,
which allows for an immediate assessment of the facility in several ways. The assessments
available from the energy performance and energy cost indices include the following:
• Evaluation of the building’s energy performance against similar facilities;
• Comparison against past facility energy use;
• Means of evaluating the effectiveness of building retrofit energy saving measures.
Table 4.1 – Utility Summary and Building Energy Use Index
Utility Consumption and Green House Gas Emission (2 Year Summary)
Building Area (ft2) 60,000 2012 2013 Average
Energy
Steam
Massey Hall Consumption (lbs) 1,890,946 1,712,007 1,801,476
Massey Hall Consumption (MJ) 2,358,010 2,134,872 2,246,441
Massey Hall Heating EUI (ekWh/ft2-yr) 11 10 10
NRCAN Average (1)
EUI (ekWh/ft2-year) (2010) 20 20 20
Massey Hall GHG (Tonne CO2e) (2)
195 177 186
Electricity
Massey Hall St Consumption (kWh) 683,627 557,216 620,421
Massey Hall Consumption (MJ) 2,461,057 2,005,976 2,233,517
Massey Hall EUI (ekWh/ft2-yr) 11 9 10
NRCAN Average (1)
EUI (ekWh/ft2-year) (2010) 25 25 25
Massey Hall GHG (Tonne CO2e) (3)
68 56 62
Total Site Energy
Massey Hall Consumption (MJ) 4,819,067 4,140,849 4,479,958
Massey Hall EUI (ekWh/ft2-yr) 22 19 21
NRCAN Average (1)
EUI (ekWh/ft2-year) (2010) 45 45 45
Water
Water Consumption (m3) N/A N/A 7,808
Usage/ft2 Building N/A N/A 0.13
Average Utility Cost
Steam Massey Hall - ($/lb) 0.02 0.02 0.02
Electricity Massey Hall. - ($/kWh)
NRCan Energy Rates ($/kWh)(2010)4
0.17 0.16 0.16
0.12 0.12 0.12
Note: (1) 2011 NRCAN EUI taken from "Arts, Entertainment and Recreation Secondary Energy Use by End-Use" (2) 2010 DOE Voluntary Reporting of GHG, Appendix N (3) Environment Canada: Greenhouse gas Intensity- Ontario (4) 2010 NRCan Energy Rates taken from "Commercial/ Institutional Energy Prices and Background Indicators (500 kW/100,000kWh)"

15 ENERGY AUDIT REPORT
MMM Group Limited | A
As presented in the Utility Summary and building Energy Use Index table above we can see that
when compared to Ontario averages provided by Natural Resources Canada, the building Energy
Use Index (EUI) of Massey Hall is much lower than the average. However the energy
consumption in the performance theatres are very much dependent on the number and type of
the performances, therefore lower EUI than the Ontario Average doesn’t necessarily indicate that
the building is performing in a more efficient manner.
The energy use index for a similar building in London, Ontario is 13 ekWh/ft2, which is much lower
than Massey hall. Also the UK standards suggest 23 ekWh/ft2 and the average energy
consumption for performance halls in San Francisco is 23 ekWh/ft2.
The water consumption in Massey Hall is higher than other comparable buildings. The reason is
that almost 40% of the domestic cold water is used in the electrical room AC unit condenser loop.
Please refer to Section 5 for related water saving measures.
4.2 ANNUAL ENERGY ALLOCATION
The annual energy allocation for the facility has been performed using equipment specifications,
schedules, and set-points. Table 4.2 outlines the approximate annual energy consumption
associated with the primary energy consumers at the facility.
Please note that Plug Load and Misc. includes all the beverage coolers, stage lights, computers,
and lightings in the Albert building. Window shakers (A/C units) that used to serve Albert building
are included in HVAC Fans load.
Table 4.2 – Annual Energy Allocation
Electricity Steam Total % of Total
Use
Cost
kWh Lbs. MJ $ %
Space Heating 1,888,322 2,354,738 51.3% $33,152 24.6%
DHW 23,760 85,536 1.9% $3,881 2.9%
Lighting 139,577 502,478 11.0% $22,800 17.0%
HVAC Fans 362,280 1,304,207 28.4% $59,177 44.0%
Plug Load and Misc. 94,804 341,296 7.4% $15,486 11.5%
TOTAL 620,421 1,888,322 4,588,254 100.0% $134,496 100.0%

16
Figure 4.1 – Annual Energy Allocation
4.3 UTILITY CONSUMPTION AND COST SUMMARY
The information obtained from the utility bill analyses for the building assists in identifying areas of
significant utility cost savings. Detailed summaries of energy usage at the facility are outlined
below. The analysis includes graphical representation of energy use relating to patterns and
anomalies observed in the monthly utility trends.
Weather data is represented as Heating and Cooling Degree Days in order to analyze energy use
against daily mean temperatures for specific billing periods. Heating Degree Days (or Cooling
Degree Days) are defined relative to a balance temperature. The balance temperature is the
outside temperature, where for temperatures higher than it, cooling is required in the building, and
at temperatures lower than it, the building requires heating. Environment Canada uses the
traditional 18°C balance temperature (change-point temperature) in order to compute monthly
Heating and Cooling Degree Days. However, the most appropriate building balance temperature
depends on several characteristics of the building such as internal and external heat gain/loss.
4.4 ELECTRICAL USAGE ANALYSIS
Electricity is consumed by lighting, auxiliary equipment, auxiliary motors, DHW heating, and space
cooling. Monthly electrical utility data at the building can be found in the appendices.
For the twenty-four (24) month period between January 2011 and December 2012 the building
had an electricity consumption of approximately 1,255,903 kWh. The average blended electricity
cost during the period between January 2011 and December 2012 was $0.163/kWh.
51%
2%
11%
28%
8%
Building Energy Allocation
Space Heating
DHW
Lighting
HVAC Fans
Plug Load and Misc.

17 ENERGY AUDIT REPORT
MMM Group Limited | A
Figure 4.2 represents the electricity usage during the period of January 2011 to December 2012.
Electricity consumption is relatively constant during the year and is not highly dependent on the
weather. Electricity consumption is mainly impacted by the number and type of the shows. As
shown in figure 4.2, electricity consumption is very high in early 2012. Based on the interview with
the building operator, prior to July 2012, building had been operated with different lighting and
HVAC equipment schedules which caused higher usage during the period.
Figure 4.2 – Electrical Consumption
4.5 STEAM USAGE ANALYSIS
Steam at the building is consumed by space heating. Table D.2 (Appendix D) outlines the steam
utility data at the building from January 2012 to December 2012, adjusted according to monthly
periods.
Figure 4.3 represents the steam usage profile, from which we can infer that the steam
consumption at Massey Hall follows a classic “bell-shaped” pattern, with peak consumption during
the winter months and zero consumption during the summer months.
To examine the interactions between the building’s natural gas consumption and heating degree
days, a linear regression analysis was performed. The linear regression analysis of steam
indicates a very strong relationship between heating degree days and the steam consumption.
The balance temperature is 10°C gives the highest R2 value. Considering the function of the
building and high heat generation from the occupants, the lower balance temperature appears to
be reasonable.
0
10,000
20,000
30,000
40,000
50,000
60,000
70,000
80,000
Jan Mar May Jul Sep Nov Jan Mar May Jul Sep Nov
kW
h
Electricity Consumption for Jan 2012 - Dec 2012 (kWh)

18
Figure 4.3 – Natural gas consumption
4.6 WATER USAGE ANALYSIS
The water consumption at the facility is to support space cooling and domestic activities. Table
D.3 (Appendix D) outlines the water consumption at the building from June of 2012 November of
2013. The water consumption was relatively constant throughout a year. The water consumption
appears to be mainly affected by number of performances but hardly on the weather factor.
Figure 4.4 represents the water usage during the time period from June 2012 to November 2013.
Figure 4.4 – Water Consumption
0
50
100
150
200
250
300
350
400
450
500
0
100,000
200,000
300,000
400,000
500,000
600,000
Jan Mar May Jul Sep Nov Jan Mar May Jul Sep Nov
lbs.
Steam Consumption for Jan 2012 - Dec 2014 (lbs.)
Utility Invoice Data Weather Normalized Data HDD
0
500
1,000
1,500
2,000
2,500
3,000
m3
Water Consumption for Jun 2012 - Nov 2013 (m3)

19 ENERGY AUDIT REPORT
MMM Group Limited | A
5.0 ENERGY CONSERVATION MEASURES
5.1 SUMMARY OF ENERGY CONSERVATION MEASURES
Table 5.1 summarizes all of the energy conservation measures identified through the audit
process.
Table 5.1: Recommended Energy Conservation Measures (ECMs)
All ECMs Projected Utility Saving
Implementation
($)
Potential
Incentive
($)
Payback
with
Incentive
(yrs.) ECM # ECM Description Steam
(lbs)
Water
(m3)
Electricity
(kW)
Electricity
(kWh)
Dollars
($)
Category 1 ECMs (Implementation Cost < $10,000)
C1.1 AC Unit Condenser Water
Cooling Retrofit 0 993 0 -5,000 2,286 4,000 0 1.7
C1.2 VFD on AC-1 Supply Fan 0 0 0 18,389 1,655 6,150 1,839 2.6
C1.3 Century Lounge Lighting
Retrofit 0 0 2 9,161 1,121 2,320 920 1.2
C1.4 DHW Pipe Insulation 0 0 0 5,821 524 879 0 1.7
C1.5 Energy Miser for Gas
Front Beverage Coolers 0 0 0 4,544 409 1,000 0 2.4
C1.6 Fan V-belt Replacement 0 0 0 168 15 50 0 3.3
Category 2 ECMs ($10,000 < Implementation Cost < $100,000)
C2.1 Free Cooling for AC-2 0 0 0 23,152 2,084 11,000 2,315 4.2
C2.2
Replace Electrical DHW
heaters with Steam
heater
-73,050 0 7 22,773 1,577 10,500 2,277 5.2
ECM Total -73,050 993 9 79,008 9,671 35,899 7,351 3.0

20
Figure 5.1 shows the total cost reductions for the energy conservation measures (ECMs) in Table
5.1.
Figure 5.1: Total ECM and REO Reduction (Dollars)
The current GHG emission in Figure 5.2 below is calculated using the buildings utility
consumption only. The savings are based on the proposed ECMs in Table 5.1.
Figure 5.2: Projected Green House Gas Emission (GHG) CO2 Equivalent
$144,101
$134,430
$6,011
$3,660
$0
1.E+05
1.E+05
1.E+05
1.E+05
1.E+05
1.E+05
1.E+05
1.E+05
1.E+05
Current Utility Cost ($) ASHRAE I ($) ASHRAE II ($) ASHRAE III ($) Resultant Utility Cost
($)
Uti
lity
Co
st (
$)
Total Utility Cost Reduction from ECMs ($)
Utility Cost Utility Cost Saving
265 2653
-30
-5
45
95
145
195
245
295
Current GHG
Emissions
ASHRAE I - Reduction ASHRAE II - Reduction ASHRAE III -
Reduction
Projected GHG
Emissions
CO
2E
qu
iva
len
t (T
on
ne
)
Projected Greenhouse Gas Emission (Tonne)
Greenhouse Gas Emission Greenhouse Gas Reduction

21 ENERGY AUDIT REPORT
MMM Group Limited | A
5.2 RETRO-COMMISSIONING
Re-commissioning, Retro-commissioning (RCx), or existing building commissioning is an event in
the life of a building that applies a systematic investigation process for improving and optimizing
the building’s operation and maintenance. It is typically an independent process that focuses on
the building’s energy using equipment such as the HVAC and other mechanical equipment,
lighting equipment, and related controls. It may or may not emphasize bringing the building back
to its original intended design specifications. In fact, during the process, the retro-commissioning
team may find that the original specifications no longer apply.
The process may result in recommendations for capital improvements, but its primary focus is to
optimize the building systems via tune-up activities, improved operation and maintenance (O&M),
and diagnostic testing.
Many building operational issues can only be uncovered through the retro-commissioning
process: a thorough investigation of the HVAC systems and equipment through a series of
functional testing, diagnostic monitoring and trending.
The retro-commissioning process involves a coordinated effort between the retro-commissioning
provider and building owner staff. The process includes reviewing building documentation,
conducting interviews and field investigations, monitoring and analyzing building systems,
developing a findings list with supporting energy saving calculations, and assisting the client with
selecting measures for implementation.
Many building operational issues can only be uncovered by subjecting the facility to a retro-
commissioning process; a thorough investigation of the HVAC systems and equipment through a
series of functional testing, diagnostic monitoring and trending.
Our past retro-commissioning project experiences have yielded a utility consumption savings
ranging from a minimum of 8% to a maximum of 30%. The following table outlines the typical
costs, savings, and paybacks associated with retro-commissioning projects.i
i Mills, Evan, “Building Commissioning: A Golden Opportunity for Reducing Energy Costs and Greenhouse-gas Emissions”, Lawrence-Berkley National Library, 2009.

22
5.3 CATEGORY 1 – ENERGY CONSERVATION MEASURES
The Energy Conservation Measures (ECMs) described below are classified as Category 1 ECMs.
Category 1 ECMs are low cost measures which range in cost from $0 to $10,000.
Table 5.3 – Proposed Energy Conservation Opportunities (Category 1)
Category 1 - ECMs Projected Savings
Implementation
($)
Potential
Incentive
($)
Simple
Payback
with
Incentive
(yrs.)
ECM
# ECM Description
Water
(m3)
Natural
Gas
(m3)
Electricity
(kW)
Electricity
(kWh)
Dollar
($)
C1.1 AC Unit Condenser
Water Cooling Retrofit 993 0 0 -5,000 2,286 4,000 0 1.7
C1.2 VFD on AC-1 Supply
Fan 0 0 0 18,389 1,655 6,150 1,839 2.6
C1.3 Century Lounge
Lighting Retrofit 0 0 2 9,161 1,121 2,320 920 1.2
C1.4 DHW Pipe Insulation 0 0 0 5,821 524 879 0 1.7
C1.5
Energy Miser for Gas
Front Beverage
Coolers
0 0 0 4,544 409 1,000 0 2.4
C1.6 Fan V-belt
Replacement 0 0 0 168 15 50 0 3.3
ECM Total 993 0 2 33,083 6,011 14,399 2,759 1.9
Table 5.4 – Proposed Energy Conservation Opportunities (Category 1)
Category 1 - ASHRAE Level I: Low Cost/No Cost Measures
All ECM ECM (Payback with Incentive < 5yrs.)
Savings Amount Savings ($) Savings Amount Savings ($)
Sa
vin
gs
Steam (lbs.) 0 $0 0 $0
Water (m3) 993 $2,736 993 $2,736
Electricity Peak (kW) 2 $297 2 $297
Electricity (kWh) 33,083 $2,977 33,083 $2,977
Total Savings ($) $6,011 $6,011
Implementation Cost $14,399 $14,399
Potential Incentive $2,759 $2,759
Total GHG Reduction (CO2 Tonne Equivalent) 3.3 3.3
Simple Payback Period Without Incentive With Incentive Without Incentive With Incentive
2.4 1.9 2.4 1.9

23 ENERGY AUDIT REPORT
MMM Group Limited | A
ECM #C1.1 – AC Unit Condenser Water Cooling Retrofit
Summary and Recommendation
Currently the cooling to the basement electrical room is provided by one water-cooled AC unit. This unit comes equipped with an open condenser loop which uses city water to cool down the refrigerant. During the site visit the auditor was informed that a new air cooled chiller will be installed to provide chilled water to AC-1 cooling coil.
It is recommended that Massey Hall utilizes the chilled water which is already available for use in the AC-1 cooling coil to the electrical room AC condenser loop during the summer. This retrofit requires adding a 3-way control valve to switch between city water and chilled water during winter and summer, respectively, and in addition some piping modifications will be required.
This retrofit will have a significant effect on water savings but will slightly increase the chiller load. The following table outlines the approximate implementation cost, savings, available incentive, and payback period associated with the retrofit. The cost includes control devices, additional piping, and labour.
ECM # C1.1 AC Unit Condenser Water Cooling Retrofit
Saving Amount Savings ($)
Sa
vin
gs
Steam (lbs.) 0 $0
Water (m3) 993 $2,736
Electricity Peak (kW) 0 $0
Electricity (kWh) -5,000 -$450
Total Savings ($) $2,286
Implementation Cost $4,000
Potential Incentive $0
Total GHG Reduction (CO2 Tonne Equivalent) -0.5
Simple Payback Period Without Incentive With Incentive
1.7 1.7
ECM #C1.2 – VFD on AC-1 Supply Fan
Summary and Recommendation
Through the recent renovation for the air distribution system, AC-1 was converted from a constant
air volume (CAV) system to variable air volume (VAV) by adding VAV boxes to the new dressing
rooms in the basement. This VAV system will vary the supply air volume based on the space
temperature resulting in fan and cooling energy savings; however during the site visit it was
noticed that the AC-1 supply fan was not equipped with variable frequency drive (VFD).
The VFD will adjust the fan speed based on the required static pressure in the duct; therefore,
whenever less air flow is required by VAV boxes, the fan speed will decrease which will result in
electricity savings.
The savings resulting from installing a VFD on the AC-1 supply fan was calculated by comparing
the fan energy consumption for a system in which airflow is controlled by outlet dampers and a

24
system controlled by VFD. The cost includes adding a VFD, installing a pressure sensor, control
and labour.
The following table outlines the approximate implementation cost, savings, available incentive,
and payback period associated with this retrofit.
ECM # C1.2 VFD on AC-1 Supply Fan
Saving Amount Savings ($)
Sa
vin
gs
Steam (lbs.) 0 $0
Water (m3) 0 $0
Electricity Peak (kW) 0 $0
Electricity (kWh) 18,389 $1,655
Total Savings ($) $1,655
Implementation Cost $6,150
Potential Incentive $1,839
Total GHG Reduction (CO2 Tonne Equivalent) 1.8
Simple Payback Period Without Incentive With Incentive
3.7 2.6
ECM #C1.3 – Century Lounge Lighting Retrofit
Summary and Recommendation
Currently, century lounge is illuminated with dimmable 100W incandescent lights. The lights are controlled by BAS and are ON for approximately 15hours/day. It is highly recommended that these lights be replaced with 19W dimmable LEDs. This will result in demand and electricity consumption as well.
Please note that the cost includes lamp replacement only and it was assumed that existing fixtures can be used with the LED lamps.
The following table outlines the approximate implementation cost, savings, available incentive,
and payback period associated with the lighting retrofit.
ECM # C1.3 Century Lounge Lighting Retrofit
Saving Amount Savings ($)
Sa
vin
gs
Steam (lbs.) 0 $0
Water (m3) 0 $0
Electricity Peak (kW) 2 $297
Electricity (kWh) 9,161 $824
Total Savings ($) $1,121
Implementation Cost $2,320
Potential Incentive $920
Total GHG Reduction (CO2 Tonne Equivalent) 0.9
Simple Payback Period Without Incentive With Incentive
2.1 1.2

25 ENERGY AUDIT REPORT
MMM Group Limited | A
ECM #C1.4 – Domestic Hot Water Pipe Insulation
Summary and Recommendation
While on site it was noticed that there was no insulation provided on most of the domestic hot
water piping. Typically the domestic hot water piping is insulated within the building to minimize
the heat loss to the surrounding spaces. It was estimated that approximately 66 feet of domestic
hot water piping were not insulated in the basement mechanical room. By providing proper
insulation to the exposed piping the pipe heat loss could be reduced, resulting in energy savings.
The following table outlines the approximate implementation cost, savings, available incentive,
and payback period associated with this retrofit.
ECM # C1.4 DHW Pipe Insulation
Saving Amount Savings ($)
Sa
vin
gs
Steam (lbs.) 0 $0
Water (m3) 0 $0
Electricity Peak (kW) 0 $0
Electricity (kWh) 5,821 $524
Total Savings ($) $524
Implementation Cost $879
Potential Incentive $0
Total GHG Reduction (CO2 Tonne Equivalent) 0.6
Simple Payback Period Without Incentive With Incentive
1.7 1.7
ECM #C1.5 – Energy Miser for Gas Front Beverage Coolers
Summary and Recommendation
Typically beverage coolers operate 24/7 to maintain the contents at serving temperature. This is
not necessary since the building is not occupied during night time and maintaining beverages at
serving temperature during unoccupied times wastes energy. An energy miser connects the
machine to an infrared sensor that detects when no one is around and turns the off the power.
During unoccupied periods the miser unit will periodically allow for brief cooling cycles to meet the
minimum requirements set by the beverage manufacturers for their drinks’ sale.
This energy conservation measure makes a lot of sense in art performing buildings since no one
is around during long stretches of time at night.
The following table outlines the approximate installation costs, savings, available incentive, and
payback period associated with the installation of energy misers on 5 beverage coolers. A similar
payback period is expected for additional coolers or vending machines that are fitted with an
energy miser.

26
ECM # C1.5 Energy Miser for Gas Front Beverage Coolers
Saving Amount Savings ($)
Sa
vin
gs
Steam (lbs.) 0 $0
Water (m3) 0 $0
Electricity Peak (kW) 0 $0
Electricity (kWh) 4,544 $409
Total Savings ($) $409
Implementation Cost $1,000
Potential Incentive $0
Total GHG Reduction (CO2 Tonne Equivalent) 0.5
Simple Payback Period Without Incentive With Incentive
2.4 2.4
ECM #C1.6 – Replace V-Belt with Cog-Belts
Summary and Recommendation
All motor drive systems have inherent inefficiencies due to friction losses. Standard V-belts tend
to stretch, slip, bend and compress, which leads to a loss of efficiency. Under well-maintained
conditions, a V-belt will run at approximately 92% efficiency. Replacing these belts with cog-style
belts can result in savings of approximately 2%, and upgrading to high-torque belts can result in
up to 6% additional savings over the base case. Cog-style belts also require less maintenance
and have a substantially longer life expectancy over V-belts. As per NRCan, a typical payback
period for cog-belt replacement ranges from six months to three years.
During the site visit it was noticed a lobby unit supply fan is equipped with V-belts. The savings
calculation is only for replacing the V-belts for the lobby unit fan; however, it is highly
recommended that all of the V-belts be replaced with cog-belts. The savings are based on a 2%
increase of efficiency. Due to the longer life of the belts, there will also be some inherent labor
savings.
The following table outlines the approximate implementation cost, savings, available incentive,
and payback period associated with the V-belt replacement.
ECM # C1.6 Fan V-belt Replacement
Saving Amount Savings ($)
Sa
vin
gs
Steam (lbs.) 0 $0
Water (m3) 0 $0
Electricity Peak (kW) 0 $0
Electricity (kWh) 168 $15
Total Savings ($) $15
Implementation Cost $50
Potential Incentive $0
Total GHG Reduction (CO2 Tonne Equivalent) 0.0
Simple Payback Period Without Incentive With Incentive
3.3 3.3

27 ENERGY AUDIT REPORT
MMM Group Limited | A
5.3 CATEGORY 2 – ENERGY CONSERVATION MEASURES
The Energy Conservation Measures (ECMs) described below are classified as Category 2 ECMs.
Category 2 ECMs are medium cost measures which range in cost from $10,001 to $100,000.
Table 5.5 – Proposed Energy Conservation Opportunities (Category 2)
Category 2 - ECMs Utility and GHG Reduction
Implementation
($)
Potential
Incentive
($)
Simple
Payback
with
Incentive
(yrs.)
ECM
# ECM Description
Water
(m3)
Natural
Gas
(m3)
Electricity
(kW)
Electricity
(kWh)
Dollar
($)
C2.1 Free Cooling for AC-2 0 0 0 23,152 2,084 11,000 2,315 4.2
C2.2 Replace Electrical DHW
heaters with Steam heater 0 0 7 22,773 1,577 10,500 2,277 5.2
ECM Total 0 0 7 45,925 3,660 21,500 4,593 4.6
Table 5.6 – Proposed Energy Conservation Opportunities (Category 2)
Category 2 - ASHRAE Level II
All ECM ECM (Payback with Incentive < 5yrs.)
Savings Amount Savings ($) Savings Amount Savings ($)
Sa
vin
gs
Water (m3) 0 $0 0 $0
Natural Gas (m3) 0 $0 0 $0
Electricity Peak (kW) 7 $872 0 $0
Electricity (kWh) 45,925 $4,133 23,152 $2,084
Total Savings ($) $3,660 $2,084
Implementation Cost $21,500 $11,000
Potential Incentive $4,593 $2,315
Total GHG Reduction (CO2 Tonne Equivalent) 2.3 2.3
Simple Payback Period Without Incentive With Incentive Without Incentive With Incentive
5.9 4.6 5.3 4.2
ECM #C2.1 – Free Cooling for AC-2
Summary and Recommendation
AC-2 provides cooling to the auditorium and is only ON when there is a performance. During the
site visit it could not be confirmed whether AC-2 is capable of running in the free cooling mode
during the winter. For analysis of this measure, it is assumed that AC-2 has a fixed outdoor air
damper position, bringing in a fixed amount of outdoor air regardless of the outdoor temperature.
Free cooling is a method of using outdoor air instead of mechanical cooling when ambient air is
below a set temperature. This can be achieved by modulating the outdoor air damper, allowing
cool outdoor air into the space and exhausting an equal amount of warm inside air out to the
atmosphere. The building with a constant cooling load throughout the year can get the most
benefit from the free cooling strategy since free cool air is readily available instead of mechanical
cooling which requires energy.
28
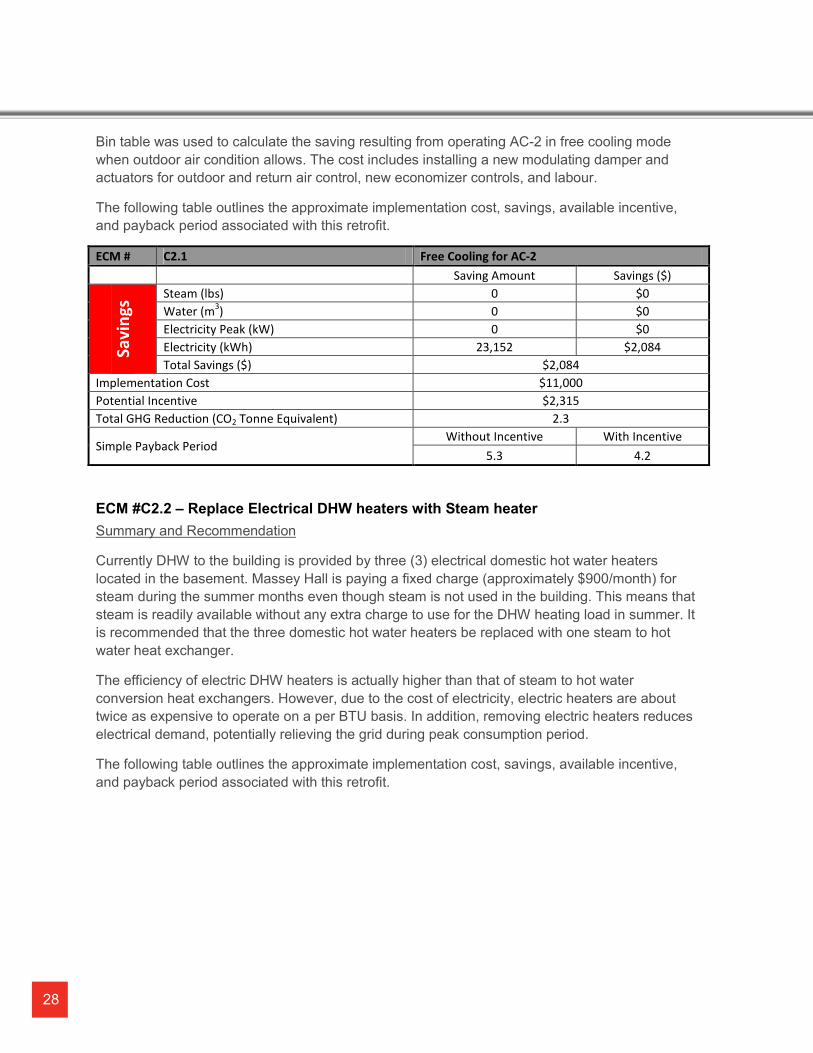
Bin table was used to calculate the saving resulting from operating AC-2 in free cooling mode
when outdoor air condition allows. The cost includes installing a new modulating damper and
actuators for outdoor and return air control, new economizer controls, and labour.
The following table outlines the approximate implementation cost, savings, available incentive,
and payback period associated with this retrofit.
ECM # C2.1 Free Cooling for AC-2
Saving Amount Savings ($)
Sa
vin
gs
Steam (lbs) 0 $0
Water (m3) 0 $0
Electricity Peak (kW) 0 $0
Electricity (kWh) 23,152 $2,084
Total Savings ($) $2,084
Implementation Cost $11,000
Potential Incentive $2,315
Total GHG Reduction (CO2 Tonne Equivalent) 2.3
Simple Payback Period Without Incentive With Incentive
5.3 4.2
ECM #C2.2 – Replace Electrical DHW heaters with Steam heater
Summary and Recommendation
Currently DHW to the building is provided by three (3) electrical domestic hot water heaters
located in the basement. Massey Hall is paying a fixed charge (approximately $900/month) for
steam during the summer months even though steam is not used in the building. This means that
steam is readily available without any extra charge to use for the DHW heating load in summer. It
is recommended that the three domestic hot water heaters be replaced with one steam to hot
water heat exchanger.
The efficiency of electric DHW heaters is actually higher than that of steam to hot water
conversion heat exchangers. However, due to the cost of electricity, electric heaters are about
twice as expensive to operate on a per BTU basis. In addition, removing electric heaters reduces
electrical demand, potentially relieving the grid during peak consumption period.
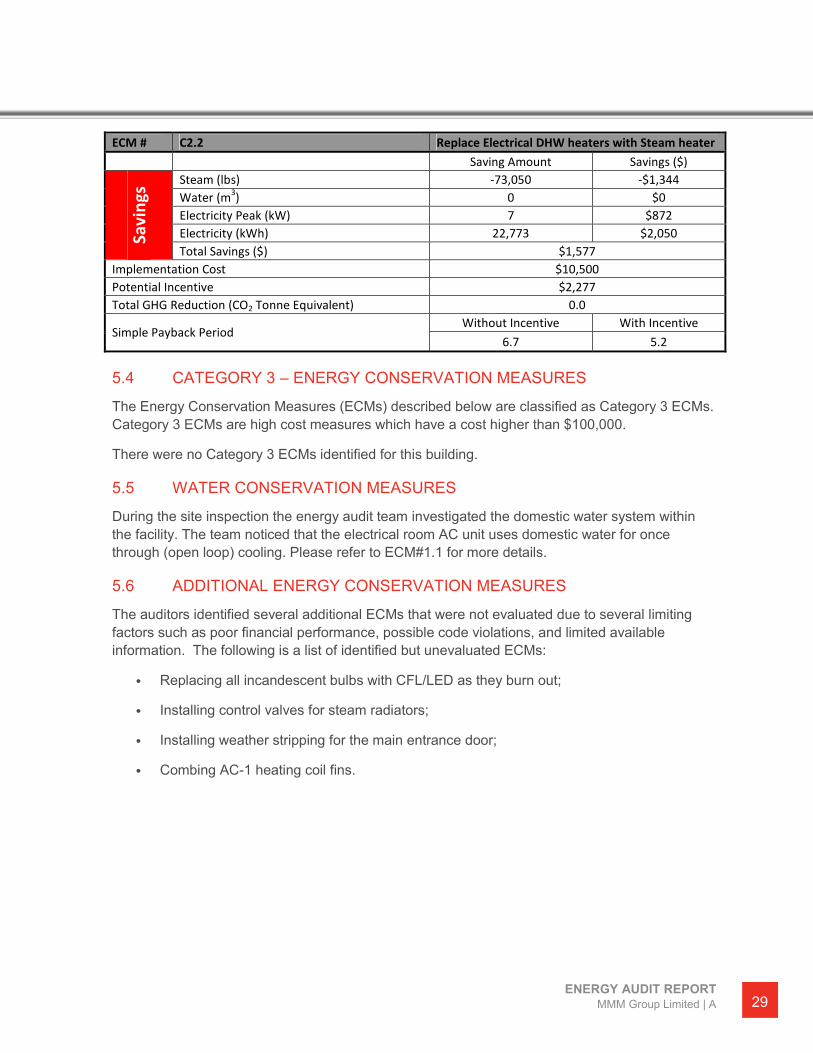
The following table outlines the approximate implementation cost, savings, available incentive,
and payback period associated with this retrofit.
29 ENERGY AUDIT REPORT
MMM Group Limited | A
ECM # C2.2 Replace Electrical DHW heaters with Steam heater
Saving Amount Savings ($)
Sa
vin
gs
Steam (lbs) -73,050 -$1,344
Water (m3) 0 $0
Electricity Peak (kW) 7 $872
Electricity (kWh) 22,773 $2,050
Total Savings ($) $1,577
Implementation Cost $10,500
Potential Incentive $2,277
Total GHG Reduction (CO2 Tonne Equivalent) 0.0
Simple Payback Period Without Incentive With Incentive
6.7 5.2
5.4 CATEGORY 3 – ENERGY CONSERVATION MEASURES
The Energy Conservation Measures (ECMs) described below are classified as Category 3 ECMs.
Category 3 ECMs are high cost measures which have a cost higher than $100,000.
There were no Category 3 ECMs identified for this building.
5.5 WATER CONSERVATION MEASURES
During the site inspection the energy audit team investigated the domestic water system within
the facility. The team noticed that the electrical room AC unit uses domestic water for once
through (open loop) cooling. Please refer to ECM#1.1 for more details.
5.6 ADDITIONAL ENERGY CONSERVATION MEASURES
The auditors identified several additional ECMs that were not evaluated due to several limiting
factors such as poor financial performance, possible code violations, and limited available
information. The following is a list of identified but unevaluated ECMs:
• Replacing all incandescent bulbs with CFL/LED as they burn out;
• Installing control valves for steam radiators;
• Installing weather stripping for the main entrance door;
• Combing AC-1 heating coil fins.

30
6. CONCLUSION
Through our investigations at Massey Hall, we have identified eight (8) energy conservation
measures (ECMs). The measures have been classified under three (3) different categories.
Category one (1) ECMs cost at most $10,000 to implement. Category two (2) measures cost up
to $100,000 to implement. Category three (3) measures cost over $100,000 to implement.
Six (6) Category (I) One ECMs have been identified;
• Approximate total projected annual savings of $5,961;
• Total implementation cost for these ECMs is $14,399;
• Expected payback period of 2 years with incentives.
Two (2) Category (II) Two ECMs have been identified;
• Approximate total projected annual savings of $3,660;
• Total implementation cost for these ECMs is $21,500;
• Expected payback period of 4.6 years with incentives.
No Category (III) Three ECMs have been identified.

31 ENERGY AUDIT REPORT
MMM Group Limited | A
Appendix-A – Glossary of Terms
ASHRAE
• American Society of Heating, Refrigeration, and Air Conditioning Engineers
British Thermal Units (BTU)
• The unit of heat in the imperial system can be defined in two ways:
• The amount of heat required to raise the temperature of one pound of water through 1oF
(58.5oF - 59.5
oF) at sea level (30 inches of mercury).
• 1 BTU = 1055.06 J = 107.6 kpm = 2.931 10-4
kWh = 0.252
Kilowatt hour (kWh)
• Is the amount of power consumed/generated over a period of one hour
Kilowatt (kW)
• Is a measure of electric power
DDC
• Direct Digital Controls
ECM
• Energy Conservation Measure
Gigajoule
• The unit of heat in the SI-system the Joule is:
• The mechanical energy which must be expended to raise the temperature of a unit weight
(2 kg) of water from 0oC to 1
oC, or from 32
oF to 33
oF.
• 1 J (Joule) = 0.1020 kpm = 2.778 10-7
kWh = 2.389 10-4
kcal = 0.7376 ft.lbf = 1 kg.m2/s2 =
1 watt second = 1 Nm = 1 ft.lb = 9.478 10-4 Btu
RS Means
• RS Means is a division of Reed Business Information that provides cost Information to the
construction industry so contractors in the industry can provide accurate estimates and
projections for their project costs
Simple Payback
• It is the number of years for a payback on an investment to occur ignoring any inflation
pressures. This does not take into account engineering costs. The calculation is as
follows:
• Simple Payback = Construction Cost / Yearly energy savings in dollars
HVAC
• Heating Ventilation and Air-conditioning
LED
• Light Emitting Diode

32
Appendix-B – Equipment List
System Location Equipment Manufacturer Model Number Serial Number Performance Year installed Physical Condition
HVAC Basement AC-1 Engineered Air
Supply fan 15 HP,
Motor insulation F
Steam heating coil/
DX cooling coil
1989 DX coil is going to be replaced
HVAC Lower Roof AC-1 Air Condenser N/A N/A N/A N/A 1989 Going to be replaced
HVAC Lower Roof AC-2 Engineered Air FW-30-903 14726
30,000 CFM,
Supply Fan 20 HP
9 x condenser fan, 1HP
compressor 36 FLA, 575 V
1989 Good
Exhaust Upper Roof General Exhaust Engineered Air LM-8 14726 - 1 12,000 CFM
Blower Motor 7.5 HP 1989 Fair
DHW Basement Electrical Heater Giant 172ETE-3F8M-E8 A 5599935 73.7 US Gal, 4.5 kW 2009 Good
DHW Basement Electrical Heater John Wood JWE1202A 0103 333207 454 L, 6 kW N/A Good
DHW Basement Electrical Heater Giant 1122B-1-3 A8539369 120 US Gal, 3 kW 2011 Good
HVAC Mechanical Room Lobby Supply Fan LOREN COOK Company 24. CpS Supply Fan 7.7 HP,
Motor Insulation B N/A Good
HVAC Mechanical Room Heat Pump Carrier 50RHR012ZCC30130 0901V6872 Refrigerant R22
Compressor RLA 5.3 N/A Good
Exhaust Basement Box Office Room Exhaust Fan Fan: Twin City
Motor: Century AC Motor Motor: C426 Motor: BW3-23 3/4 HP N/A Fair
DHW Left Balcony Closet Electrical Heater Rheem RR41OT 0199J22413 175 L, 3 kW N/A Good
DHW right Balcony Closet Electrical Heater Rheem RE10 1983001887 38 L, 1.5 kW N/A Good

33 ENERGY AUDIT REPORT
MMM Group Limited | A
Appendix-C – Lighting Schedule
Floor Area # of
fixture Type of fixture Lamp type
Lamp Wattage
Lamp/Fixture
Basement AC-1 Room 3 Surface Mounted
Incandescent 150 W 1
Basement AC-1 Room 1 Surface Mounted
T8 32 W 1
Basement Management Office 4 Pole/ Surface
Mounted Incandescent 40 W 1
Basement Century Lounge 29 Suspended Incandescent 100 W 1
Basement Century Lounge 30 Pot Light MR16 50 W 1
Basement Steam Room 1 Surface Mounted
Incandescent 40 W 1
Basement South Corridor 9 Surface Mounted
T8 32 W 1
Basement DHW Heater Room 1 Surface Mounted
Incandescent 40 W 1
Basement Dressing Room 4 Pot Light CFL 14 W 3
Basement Dressing Room 20 Surface Mounted
Incandescent 40 W 1
Basement Dressing Room- WC 2 Pot Light CFL 14 W 3
Basement Dressing Room- WC 1 Surface Mounted
T5 28 W 1
Basement Production A 2 Suspended T5 28 W 1
Basement Dressing Room 1 4 Suspended T5 28 W 1
Basement Dressing Room 1 20 Surface Mounted
Incandescent 40 W 1
Basement Dressing Room 1- WC 1 Pot Light CFL 14 W 3
Basement Dressing Room 1- WC 1 Suspended T5 28 W 1
Basement Dressing Room 2 4 Suspended T5 28 W 1
Basement Dressing Room 2 20 Surface Mounted
Incandescent 40 W 1

34
Floor Area # of
fixture Type of fixture Lamp type
Lamp Wattage
Lamp/Fixture
Basement Dressing Room 2- WC 1 Pot Light CFL 14 W 3
Basement Dressing Room 2- WC 1 Suspended T5 28 W 1
Basement Catering 5 Surface Mounted
Incandescent 150 W 1
Basement Catering 1 Suspended T5 28 W 1
Basement West Corridor 3 Surface Mounted
T8 32 W 2
Basement Production B 1 Suspended T5 28 W 1
Basement Woman WC 14 Pot Light MR16 35 W 1
Basement Men WC 6 Surface Mounted
T8 32 W 1
Basement Men WC 10 Pot Light MR16 35 W 1
Basement Family WC 3 Pot Light MR16 35 W 1
Basement North Corridor 24 Pot Light MR16 50 W 1
Basement Foyer 36 Pot Light MR16 50 W 1
Basement Mechanical Room 1 Surface Mounted
T8 32 W 1
Ground Auditorium 30 Globe Incandescent 150 W 1
Ground Auditorium 64 Surface Mounted
Incandescent 100 W 1
Ground Auditorium 16 Surface Mounted
Incandescent 40 W 1
Ground Main Lobby 6 Surface Mounted
Halogen 90 W 1
Ground Main Lobby 2 decorative Halogen 90 W 1
Ground Main Lobby 2 Surface Mounted
Incandescent 150 W 1
Ground Corridor 4 Surface Mounted
T8 32 W 1

35 ENERGY AUDIT REPORT
MMM Group Limited | A
Floor Area # of
fixture Type of fixture Lamp type
Lamp Wattage
Lamp/Fixture
Ground Chair light 160 N/A Incandescent 1.5 W 1
Balcony Lounge 2 Surface Mounted
CFL 14 W 3
Balcony Lounge 16 Surface Mounted
T8 32 W 1
Balcony Chair light 140 N/A Incandescent 8 W 1
Gallery West lobby 1 Surface Mounted
CFL 42 W 6
Gallery East lobby 1 Surface Mounted
CFL 42 W 6
Gallery Woman WC 7 Pot Light MR16 35 W 1
Gallery Stair tube light 55 N/A Incandescent 2 W 1
N/A NW Stairway to Balcony Level
4 Surface Mounted
T8 32 W 1
N/A SW Stairway to Balcony Level
4 Surface Mounted
T8 32 W 1
N/A NE Stairway to Balcony Level
4 Surface Mounted
T8 32 W 1
N/A SE Stairway to Balcony Level
4 Surface Mounted
T8 32 W 1
N/A NW Stairway to
gallery Level 6
Surface Mounted
T8 32 W 1
N/A SW Stairway to
gallery Level 6
Surface Mounted
T8 32 W 1
N/A NE Stairway to gallery
Level 6
Surface Mounted
T8 32 W 1
N/A SE Stairway to gallery
Level 6
Surface Mounted
T8 32 W 1
N/A N/A 8 Exit Sign LED 3 W 1
N/A Auditorium 25 Exit Sign N/A N/A N/A
Ground Main Lobby 4 Exit Sign CFL 9 W 2

36
Appendix-D – Utility Data
Table D.1 – Electrical Consumption
Utility Invoice Data
Month Period Period No. of Meter Reading Demand Demand Period Adjusted Charge
Start End Days Usage (kWh) (kW) (kVA) Usage (kWh) (Tax Excluded)
Jan-12 12/23/11 23/01/12 31 58,360 214 245 59,559 8,659
Feb-12 1/23/12 23/02/12 31 63,006 218 263 59,961 9,413
Mar-12 2/23/12 23/03/12 29 63,868 216 292 67,860 9,413
Apr-12 3/23/12 23/04/12 31 66,676 265 352 63,817 11,494
May-12 4/23/12 23/05/12 30 61,491 191 242 69,442 9,908
Jun-12 5/23/12 23/06/12 31 86,410 345 410 74,798 13,573
Jul-12 6/23/12 23/07/12
30 45,802
320 399 47,882 9,615
Aug-12 7/23/12 23/08/12 31 49,471 289 371 50,079 9,121
Sep-12 8/23/12 23/09/12 31 51,826 320 416 48,320 9,629
Oct-12 9/23/12 23/10/12 30 42,294 238 295 45,501 8,072
Nov-12 10/23/12 23/11/12 31 50,668 210 269 48,911 8,720
Dec-12 11/23/12 23/12/12 30 48,508 188 236 47,498 8,214
Total 2012
Jan-13 12/23/12 23/01/13 31 39,945 171 200 40,542 4,908
Feb-13 1/23/13 23/02/13 31 42,259 165 195 39,299 5,791
Mar-13 2/23/13 23/03/13 28 44,496 205 255 47,953 6,045
Apr-13 3/23/13 23/04/13 31 44,183 216 266 41,536 6,577
May-13 4/23/13 23/05/13 30 37,519 287 371 40,329 6,352
Jun-13 5/23/13 23/06/13 31 44,812 326 414 44,499 7,866
Jul-13 6/23/13 23/07/13
30 48,223
315 383 45,316 9,279
Aug-13 7/23/13 23/08/13 31 32,339 305 379 40,964 6,106
Sep-13 8/23/13 23/09/13 31 65,762 352 433 63,007 11,601
Oct-13 9/23/13 23/10/13 30 60,926 280 356 61,601 9,298
Nov-13 10/23/13 23/11/13 31 57,704 224 285 54,329 7,775
Dec-13 11/23/13 12/23/13 30 49,357 188 228 37,840 7,718
Total 2013
Total Year 1 Jan-12 Dec-12 366 688,379 251 316 683,627 115,831
Total Year 2 Jan-13 Dec-13 366 567,524 253 314 557,216 89,317
Average 627,952 252 315 620,421 102,574

37 ENERGY AUDIT REPORT
MMM Group Limited | A
Table D.2 – Steam Consumption
Steam Utility Invoice Data Weather Normalized Usage
Month Meter Reading Period Adjusted Usage Charge [$] (GST Exc)
HDD HDD Relative
Usage (lbs) Usage (lbs) (MJ) [°C] (lbs)
Jan-12 602,783 566,251 706,115 8,670 357 388,787
Feb-12 496,440 479,892 598,425 7,286 298 323,946
Mar-12 258,580 252,503 314,871 4,189 138 150,633
Apr-12 72,452 67,924 84,701 1,765 96 104,549
May-12 2,646 2,563 3,196 856 0 0
Jun-12 0 0 0 822 0 0
Jul-12 0 0 0 822 0 0
Aug-12 0 0 0 822 0 0
Oct-12 0 0 0 822 0 499
Oct-12 75,673 73,232 91,320 1,807 44 48,179
Nov-12 239,230 231,513 288,697 3,643 199 216,604
Dec-12 224,071 217,069 270,685 3,466 278 302,210
Total 2012
Jan-13 317,123 307,213 383,094 $4,554 378 411,929
Feb-13 285,298 275,460 343,499 $4,182 397 432,454
Mar-13 214,806 208,093 259,492 $3,358 305 332,381
Apr-13 115,009 111,299 138,790 $2,191 134 146,198
May-13 10,503 10,175 12,688 $969 16 17,138
Jun-13 0 0 0 $847 0 0
Jul-13 0 0 0 $847 0 0
Aug-13 0 0 0 $847 0 0
Sep-13 5,340 5,168 6,444 $909 0 0
Oct-13 29,906 28,971 36,127 $350 51 55,172
Nov-13 210,708 203,911 254,277 $3,558 227 247,401
Dec-13 616,076 561,716 700,460 $8,722 432 470,317
Total 2013
Total (2 Years) (m3) 3,648,398
Total Year 1 1,971,875 1,890,946 2,358,010 34,971 Average (2 Years) (m3) 1,824,199
Total Year 2 1,804,769 1,712,007 2,134,872 31,332 Average cost (2 years) ($) 32,026
Average 1,888,322 1,801,476 2,246,441 33,152 MJ/Year 2,274,776
% 100.00%

38
Table D.3 – Water Consumption
From To Meter # Days m3
Charge [$] (GST Exc.)
18/06/12 16/07/12 70258150.00 28 415 1,087
16/07/12 12/11/12 70258150.00 119 2,144 5,619
12/11/12 11/03/13 70258150.00 119 2,916 8,046
11/03/13 15/07/13 70258150.00 126 2,748 7,851
15/07/13 11/11/13 70258150.00 119 2,788 7,965

39 ENERGY AUDIT REPORT
MMM Group Limited | A
End of Report