mass spectrometry ppt by kusum
TRANSCRIPT

8/3/2019 Mass Spectrometry Ppt by Kusum
http://slidepdf.com/reader/full/mass-spectrometry-ppt-by-kusum 1/23
Mass Spectrometry
Dr. Kusum ahlawatProfessor and Head
Chemistry DepartmentMMU
8/3/2019 Mass Spectrometry Ppt by Kusum
http://slidepdf.com/reader/full/mass-spectrometry-ppt-by-kusum 2/23
Mass Spectrometry • Mass spectrometry is a powerful analytical technique that is
used to identify unknown compounds, to quantify knowncompounds, and to elucidate the structure and chemicalproperties of molecules. Detection of compounds can be
accomplished with very minute quantities (as little as 10-12g,10-15 moles for a compound of mass 1000 Daltons). Thismeans that compounds can be identified at very lowconcentrations (one part in 1012) in chemically complexmixtures. Mass spectrometry provides valuable information to
a wide range of professionals: physicians, astonomers, andbiologists, to name a few.
8/3/2019 Mass Spectrometry Ppt by Kusum
http://slidepdf.com/reader/full/mass-spectrometry-ppt-by-kusum 3/23
Did you know that mass spectrometry is used to...
•
Detect and identify the use of steroids in athletes• Monitor the breath of patients by anesthesiologists during
surgery• Determine the composition of molecular species found in space• Determine whether honey is adulterated with corn syrup• Locate oil deposits by measuring petroleum precursors in rock • Monitor fermentation processes for the biotechnology industry• Detect dioxins in contaminated fish• Determine gene damage from environmental causes• Establish the elemental composition of semiconductor materials
8/3/2019 Mass Spectrometry Ppt by Kusum
http://slidepdf.com/reader/full/mass-spectrometry-ppt-by-kusum 4/23
What can mass spectrometry do for you? • Identify structures of biomolecules, such as
carbohydrates, nucleic acids and steriods• Sequence biopolymers such as proteins and
oligosaccharides• Determine how drugs are used by the body• Perform forensic analyses such as conformation and
quantitation of drugs of abuse• Analyze for environmental pollutants• Determine the age and origins of specimens in
geochemistry and archaeology• Identify and quantitate compounds of complex organic
mixtures• Perform ultrasensitive multielement inorganic analyses
8/3/2019 Mass Spectrometry Ppt by Kusum
http://slidepdf.com/reader/full/mass-spectrometry-ppt-by-kusum 5/23
How did mass spectrometry originate ? • The technique of mass spectrometry had its beginnings in J.J. Thomson's vacuum
tube where in the early part of the century the existence of electrons and "positive
rays" was demonstrated. Thomson, the physicist, observed in his book "Rays of Positive Electricity and Their Application to Chemical Analysis" that the newtechnique could be a used profitably by chemists to analyze chemicals. Despite thisfar-sighted observation, the primary application of mass spectrometry remain in therealm of physics for nearly thirty years. It was used to discover a number of isotopes, to determine the relative abundance of the isotopes, and to measure their"exact masses", i.e., atomic masses to within a precision of 1 part in 106 or better.These important fundamental measurements laid the foundation for laterdevelopments in diverse feilds ranging from geochronology to biochemicalresearch.
• On these Web pages we discuss the basic principles of mass spectrometry and someimportant applications. We also provide a brief explanation of how a massspectrometer works, a description of its various component parts, and a discussionof mass spectra and the kind of information they contain. In later sections we willdiscuss ionization techniques, data presentation as it relates to chromatography, andsome highlights of recent breakthroughs.
• Because mass spectrometry is most often used to analyze organic molecules, theexamples on these pages are drawn from this group of substances. The principles of mass spectrometry are, however , broadly applicable and our discussion will alsoinclude analyses of inorganic substances
8/3/2019 Mass Spectrometry Ppt by Kusum
http://slidepdf.com/reader/full/mass-spectrometry-ppt-by-kusum 6/23
What is a Mass Spectrometer? • A mass spectrometer is an instrument that measures the masses of individual
molecules that have been converted into ions, i.e., molecules that have beenelectrically charged. Since molecules are so small, it is not convenient to measuretheir masses is kilograms, or grams, or pounds. In fact, the mass of a singlehydrogen atom is approximately 1.66 X 10⁻²⁴ grams. We therefore need a moreconvenient unit for the mass of individual molecules. This unit of mass is oftenreferred to by chemists and biochemists as the dalton (Da for short), and is definedas follows: 1 Da=(1/12) of the mass of a single atom of the isotope of carbon-12(12C). This follows the accepted convention of defining the 12C isotope ashaving exactly 12 mass units.
• As will become clear in what follows, a mass spectrometer does not actuallymeasure the molecular mass directly, but rather the mass-to-charge ratio of the ionsformed from the molecules. For reasons similar to those discussed in the context of mass, it is inconvenient to measure the charge on an individual ion in unitsappropriate to the macroscopic everyday world. A useful unit for this purpose is thefundamental unit of charge, the magnitude of the charge on an electron. It followsthat the charge on an ion is denoted by the integer number z of the fundamental unit
of charge, and the mass-to-charge ratio m/z therefore represents daltons perfundamental unit of charge. In many cases, the ions encountered in massspectrometry have just one charge (z=1) so the m/z value is numerically equal tothe molecular (ionic) mass in Da. Mass spectrometrists often speak loosely of the"mass of an ion" when they really mean the m/z ratio, but this convenient way of speaking is useful only for the case of singly-charged ions.
• An actual mass spectrometer ranges in size from about the size of a home
microwave oven to large research instruments that dominate entire rooms. Thedifferent functional units of a mass spectrometer are represented conceptually in the
8/3/2019 Mass Spectrometry Ppt by Kusum
http://slidepdf.com/reader/full/mass-spectrometry-ppt-by-kusum 7/23
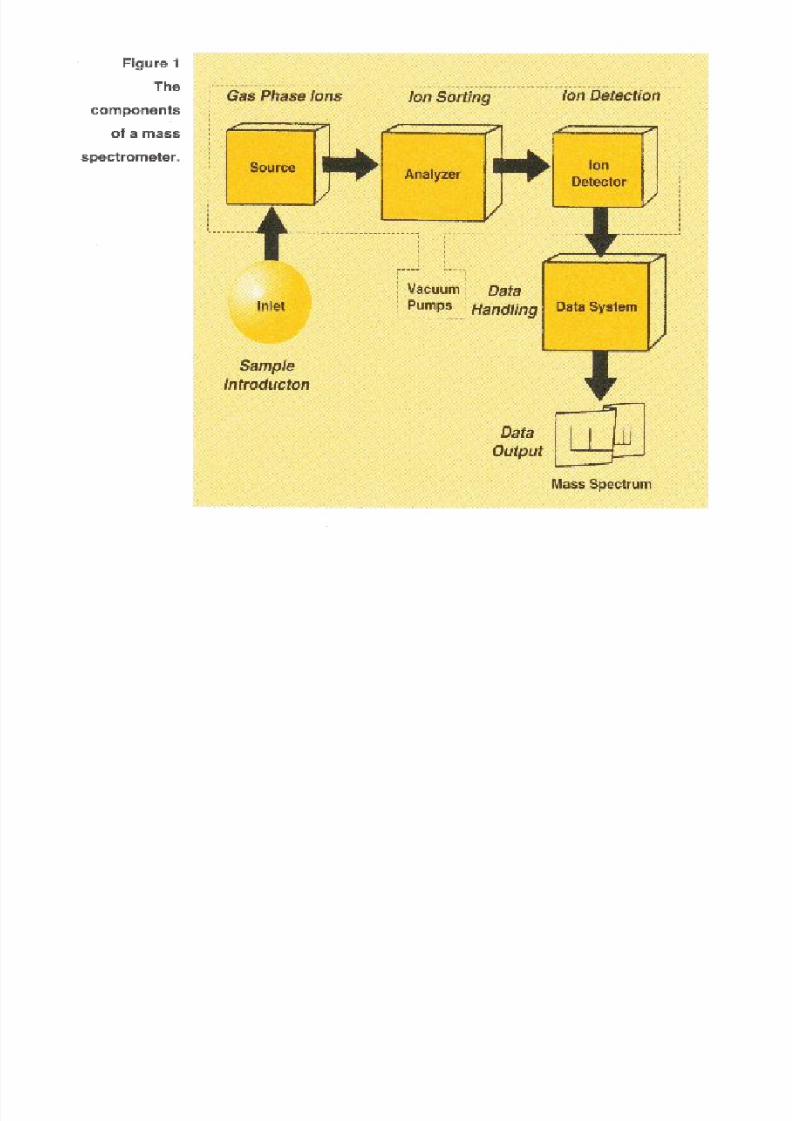
• Formation of gas phase samples ions is an essential prerequisiteto the mass sorting and detection processes that occur in a massspectrometer. Early mass spectrometers required a sample to bea gas, but due to modern developments decribed below, theapplicability of mass spectrometry has been extended toinclude samples in liquid solutions or embedded in a solidmatrix. The sample, which may be a solid, liquid, or vapor,enters the vacuum chamber through an inlet. Depending on thetype of inlet and ionization techniques used, the sample mayalready exist as ions in solution, or it may be ionized inconjunction with its volatilization or by other methods in theion source.
The gas phase ions are sorted in the mass analyzer according totheir mass-to-charge (m/z) ratios and then collected by adetector. In the detector the ion flux is coverted to aproportional electrical current. The data system records themagnitude of these electrical signals as a function of m/z andconverts this information into a mass spectrum.
8/3/2019 Mass Spectrometry Ppt by Kusum
http://slidepdf.com/reader/full/mass-spectrometry-ppt-by-kusum 8/23
8/3/2019 Mass Spectrometry Ppt by Kusum
http://slidepdf.com/reader/full/mass-spectrometry-ppt-by-kusum 9/23
What are the characteristics of amass spectrum?
• A mass spectrum is a graph of ion intensity as a function of mass-to-charge ratio. Mass spectra are often depicted as simple histograms asshown in Figure 2. This record of ions and their intensities serve toestablish the molecular weight and structure of the compound being massanalyzed. For example, Figure 2 shows a mass spectrum of the simplemolecule carbon dioxide, CO2.
•
In this example, all the ions are positively charged. (It is possible togenerate and detect negative ions as well.) The ionized CO2 molecule (ormolecular ion) appears at m/z 441. Since the ionization process breaks upor fragments some of the CO2 molecules, a fraction of the ions appear inthe spectrum at m/z values less than the m/z value that corresponds to themolecular mass of CO2. Cleavage of a carbon-oxygen bond in themolecular ion to produce ionized carbon monoxide or ionized atomicoxygen result in the fragment ions at m/z 28 and 16; loss of two neutraloxygen atoms results in an additional fragment at m/z 12 for carbon. Themolecular ion is designated as M+ or CO2+ and the fragment ions aredesignated as CO+, O+ and C+.
• 1 The ion is singly charged and the "nominal ion mass" is 44 Da: carbon=12 and oxygen=16 (in calculating nominal ion mass, atomic masses are rounded to the nearest integer).

8/3/2019 Mass Spectrometry Ppt by Kusum
http://slidepdf.com/reader/full/mass-spectrometry-ppt-by-kusum 10/23
1 The ion is singly charged and the "nominal ion mass" is 44 Da: carbon=12 and oxygen=16 (in calculatingnominal ion mass, atomic masses are rounded to the nearest integer).
8/3/2019 Mass Spectrometry Ppt by Kusum
http://slidepdf.com/reader/full/mass-spectrometry-ppt-by-kusum 11/23
How is the sample introduced intothe mass spectrometer?
• For reasonably pure solids the sample can be placed on the tip of a rod thatis inserted into the evacuated source region through a vacuum-tight seal.The sample is then evaporated or sublimed into the gas phase, usually byheating. Gases and liquids can be introduced through specially designedinlets with controlled flow.The gaseous molecules are then ionized (oftenwith accompanying fragmentation) and the ions are mass analyzed. Insome special techniques, volatilization and ionization occur at the sametime.
• To obtain the mass spectrum of a single compound in a mixture, theindividual components must be separated prior to analysis by massspectrometry. Separation is necessary for unambiguous identificationbecause two compounds present in the source region simultaneously createan overlapping or mixed spectrum and even simple compounds cangenerate many fragment ions. Since the 1960's gas chromatography (GC)has been coupled to mass spectrometry. This connection allowscompounds already in the vapor phase to enter the mass spectrometerseparated in time so that the components of mixtures can be detected andanalyzed sequentially. More recently, liquid chromatographs, supercriticalfluid chromatographs, and capillary electrophoresis devices connected tomass spectrometers have been used to separate components of complexmixtures prior to mass analysis.
8/3/2019 Mass Spectrometry Ppt by Kusum
http://slidepdf.com/reader/full/mass-spectrometry-ppt-by-kusum 12/23
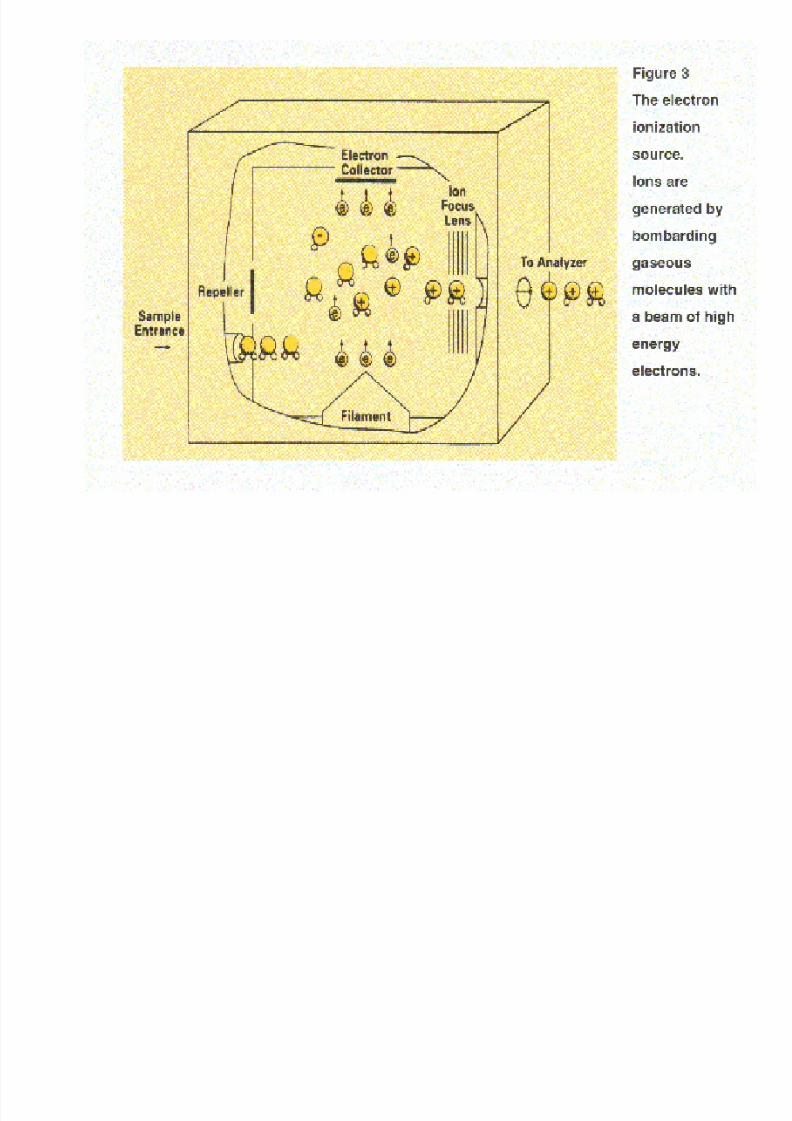
How are the molecular and fragment ions produced in the
ion source? • In the commonly used electron ionization (EI) source, (sometimes referred
to as "electron impact" in older literature), ions are generated bybombarding the gaseous sample molecules with a beam of energeticelectrons as illustrated in Figure 3. (Other methods of ionization will bediscussed in a later section.) In the EI technique, a mixture of positive andnegative ions, as well as neutral species, is generated. The energy of thebombarding electrons is generally much greater than that of the bondswhich hold the molecule together. Thus when high energy electronsinteract with the molecule not only does ionization occurs , but bonds are
broken and fragments are formed , giving rise to the ions other than theintact molecular ion that appear in a mass spectrum.• Although both positive and negative ions are generated in the ion source at
the same time, only one polarity is recorded at a time; hence any givenmass spectrum consists of either positve or negative ions. Molecules thatare not ionized and neutral fragments are pumped away.
• Positive-ion EI mass spectra are most commonly recorded, because manyfewer negative ions are formed by this particular ionization technique thanpositive ions. Positive ions are propelled into the analyzer by maintainingthe ion source at an electrical potential positive relative to the analyzer andby focusing with voltages applied to a lens system located between thesource and the analyzer. The repeller electrode assists in focusing the ionsinto the analyzer. Negative ions and electrons are attracted to the positivelycharged electron trap.
8/3/2019 Mass Spectrometry Ppt by Kusum
http://slidepdf.com/reader/full/mass-spectrometry-ppt-by-kusum 13/23

8/3/2019 Mass Spectrometry Ppt by Kusum
http://slidepdf.com/reader/full/mass-spectrometry-ppt-by-kusum 14/23
HOW DOES THE ANALYZERWORK?
• The analyzer uses dispersion or filtering to sort ions accordingto their mass-to-charge ratios or a related property. The mostwidely used analyzers are magnetic sectors, quadrupole massfilters, quadrupole ion traps, Fourier transform ion cyclotron
resonance spectrometers, and time-of-flight mass analyzers.• Magnetic sectors bend the trajectories of ions into circular
paths of radii that depend on the momentum-to-charge ratiosof the ions. Ions of larger m/z follow larger radius paths thanions of smaller m/z values so ions of differing m/z values aredispersed in space. By changing the ion trajectories throughvariations of the magnetic field strength, ions of differentnominal mass-to-charge ratios can be focused on a detector.
8/3/2019 Mass Spectrometry Ppt by Kusum
http://slidepdf.com/reader/full/mass-spectrometry-ppt-by-kusum 15/23
8/3/2019 Mass Spectrometry Ppt by Kusum
http://slidepdf.com/reader/full/mass-spectrometry-ppt-by-kusum 16/23
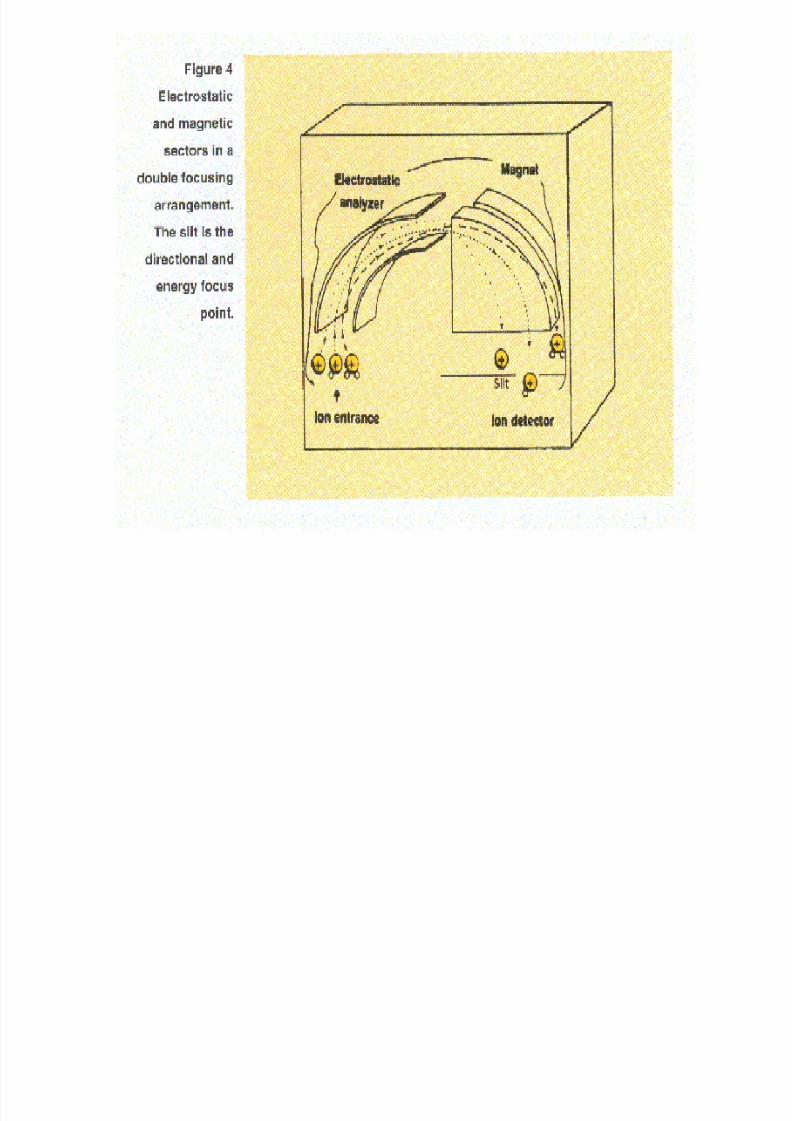
• Double focusing mass spectrometers use a combination of magnetic and electrical fields to focus and sort ions. Acommon configuration for a sector instrument is the geometryshown in Figure 4, in which a magnetic "sector" follows anelectric "sector". The slit acts as a filter to select for a specificm/z value. The electric sector focuses the ions with respect todifferences in kinetic energy that they may have as they exitthe source region. "Double focusing," this combination of "angular" or "directional" focusing and energy focusing,provide mass resolution high enough to separate ions of the
same nominal mass but different chemical formulae, such asC2H4, N2 and CO at m/z 28. The so called "exact masses",more properly "high precision masses", of C2H4, N2 and COare 28.0313, 28.0061, and 27.9949 Daltons, respectively2.
Double focusing mass spectrometers

8/3/2019 Mass Spectrometry Ppt by Kusum
http://slidepdf.com/reader/full/mass-spectrometry-ppt-by-kusum 17/23
8/3/2019 Mass Spectrometry Ppt by Kusum
http://slidepdf.com/reader/full/mass-spectrometry-ppt-by-kusum 18/23
Quadrupole mass filter
Another type of mass analyzer, called a quadrupole mass filter, consists of four
parallel poles or rods. In this device (Figure 5), mass sorting depends on ionmotion resulting from simultaneously applied constant (dc) and radio frequencyelectric (rf) electric fields. Scanning is accomplished by systematically changingthe field strengths, thereby changing the m/z value that is transmitted throughthe analyzer. Quadrupole mass spectrometers provide lower resolution thandouble focusing instruments but tend to be more easily interfaced to various
inlet systems and to be less costly.The quadrupole ion trap mass spectrometer (Figure 6) operates on a principlesimilar to a quadrupole mass filter. However, it does not operate as a filter.Rather, the ion trap stores ions for subsequent experiments and analysis. It
uses fields generated by rf (and sometimes dc) voltages applied to electrodesarranged in a sandwich geometry: a ring electrode in the middle with cap
electrodes on each end. Within a selected range of mass-to-charge ratiosdetermined by the applied voltages, the device traps ions in the space bounded
by the electrodes. Typically, a mass spectrum is produced by scanning theapplied rf voltages to eject ions sequentially of increasing mass-to-charge ratio
through an end cap opening for detection.

8/3/2019 Mass Spectrometry Ppt by Kusum
http://slidepdf.com/reader/full/mass-spectrometry-ppt-by-kusum 19/23
detection.
8/3/2019 Mass Spectrometry Ppt by Kusum
http://slidepdf.com/reader/full/mass-spectrometry-ppt-by-kusum 20/23
• Two other analyzers now being used frequently are the Fouriertransform ion cyclotron resonance (FT-ICR) spectrometer and thetime-of-flight (TOF) mass spectrometer. The unique capabilities ofeach of these mass analyzers make them especially useful as massspectrometry moves into new areas of application.
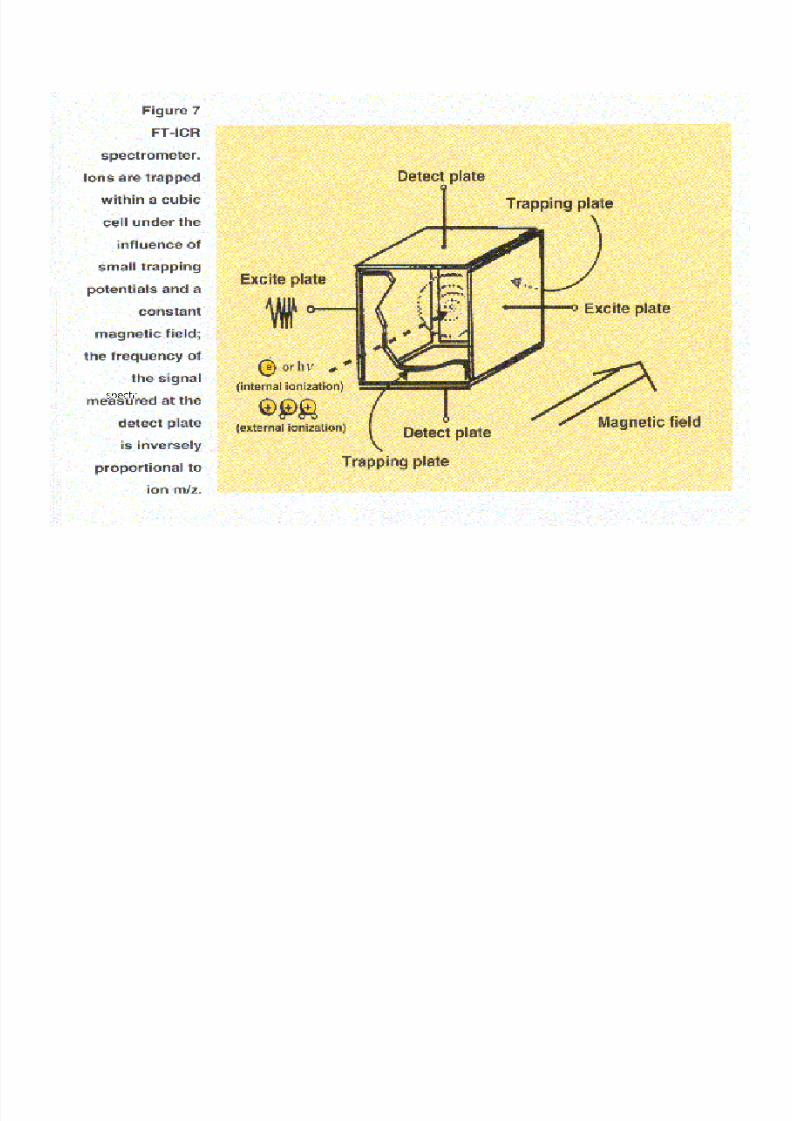
• In an FT-ICR spectrometer (Figure 7) ions are trappedelectrostatically within a cubic cell in a constant magnetic field. Acovalent orbital ("cyclotron") motion is induced by the application of aradio-frequency pulse between the excite plates. The orbiting ionsgenerate a faint signal in the detect plates of the cell. The frequencyof the signal from each ion is equal to its orbital frequency, which inturn is inversely related to its m/z value. The signal intensity of eachfrequency is proportional to the number of ions having that m/z value.The signal is amplified and all the frequency components aredetermined, yielding the mass spectrum. If the pressure in the cell isvery low, the ion orbital motion can be maintained over many cyclesand the frequency can be measured with very high precision. The FT-ICR instrument can therefore be used to generate very high resolutionspectra.
8/3/2019 Mass Spectrometry Ppt by Kusum
http://slidepdf.com/reader/full/mass-spectrometry-ppt-by-kusum 21/23
spectr
8/3/2019 Mass Spectrometry Ppt by Kusum
http://slidepdf.com/reader/full/mass-spectrometry-ppt-by-kusum 22/23
• Time-of-flight mass analyzers (Figure 8) seperate ions byvirtue of their different flight times over a known distance. Abrief burst of ions is emitted from a source. These ions areaccelerated so that ions of like charge have equal kineticenergy and then are directed into a flight tube. Since kineticenergy is equal to 1/2 mv2, where m is the mass of the ion andv is the ion velocity, the lower the ion's mass, the greater thevelocity and shorter its flight time. The travel time from theion source through the flight tube to the detector, measured inmicroseconds, can be transformed to the m/z value through therelationships described above. Because all ion masses aremeasured for each ion burst, TOF mass spectrometers offerhigh sensitivity as well as rapid scanning. They can providemass data for very high-mass biomolecules

8/3/2019 Mass Spectrometry Ppt by Kusum
http://slidepdf.com/reader/full/mass-spectrometry-ppt-by-kusum 23/23