mass culturing of granules for use in … hub documents/research reports/1022-1-02.pdfupflow...
TRANSCRIPT

MASS CULTURING OF GRANULES FOR USE IN UPFLOW ANAEROBIC SLUDGE BLANKET (UASB)
BIOREACTORS BY PROCESS INDUCTION AND MICROBIAL STIMULATION
Report to the Water Research Commission
by
TJ Britz, C. van Schalkwyk, L-C Ronquest, RC Witthuhn, M Cameron, A van Eeden and OD O’Kennedy
Department of Food Science
University of Stellenbosch Stellenbosch
WRC REPORT No. : 1022/1/02 ISBN : 1 86845 908 X August 2002

Disclaimer This report emanates from a project financed by the Water Research Commission (WRC) and is approved for publication. Approval does not signify that the contents necessarily reflect the views and policies of the WRC or the members of the project steering committee, nor does mention of trade names or commercial products constitute endorsement or recommendation for use.

ii
EXECUTIVE SUMMARY BACKGROUND AND MOTIVATION The treatment of wastewaters was greatly stimulated by the development of the upflow anaerobic sludge blanket (UASB) process and its successful full-scale application. The UASB design permits high space loading rates (5 - 30 kgCOD.m-3d-1) at low hydraulic retention times (24 h). The characteristics of the granular sludge is the striking feature of the UASB system as the bacteria somehow aggregate to form the granules. Since the operational efficiency and performance of these systems are dictated by the formation and activity of the granules, the potential use of the UASB is limited by the extended start-up periods.
The promising results obtained in a previous WRC study (WRC 667/1/99) showed that the separate culturing of granules holds a lot of promise for application of the UASB technology in South Africa as a stable high-rate biological treatment option. The successful cultivation of granules on larger scale has important economic implications for the optimisation of biological treatment processes in terms of faster start-up, independence of our industries from importation of granules from overseas, improved granule settlability, biomass retention and higher loading rates. OBJECTIVES The main objective of this research programme was to mass culture granules for use in UASB digesters to promote a more rapid UASB start-up procedure. This was done by:
1. Constructing and operating a granule mass culture system; 2. Applying the granule enhancement biological model on a 15 l scale; 3. Characterising the mass cultured granules in terms of granule formation
(gVSS/gCOD), biomass accumulated (Ygran), total biomass (Ytot), size (Ysize), degrading (Dtot) and methanogenic activity (Dmeth);
4. Evaluating the economics of different media and effluents as carbon sources; 5. Storage ability and activity of the mass grown granules; 6. Selecting microbial populations and evaluating granule growth on different
effluents; and 7. Testing the stability of mass grown granules in lab-scale UASB bioreactors.
RESULTS AND CONCLUSIONS The research in this study focussed on the granulation process in larger batch simulated UASB systems. The following conclusions were reached from the results obtained: 1. Larger scale batch culturing The use of UASB bioreactors in the treatment of wastewaters depends on the development of an effective granular sludge bed. In previous studies a biological model was developed

iii
for the simulation of the granulation process in very small batch systems. In this study the impact of larger scale batch systems in the scaling up of the granulation model from a small batch system (250 ml) to a larger batch system (5-L), were evaluated. The data clearly indicated that the roller-table (granule increase 460%) had the best potential for handling larger volumes. It was also found that the addition of Fe2+ was found to positively contribute to aggregation. 2. Inoculum seeding source It was found that the source and composition of the anaerobic granular sludge used as inoculum for the batch cultivation process could have a significant influence on the efficacy of granulation enhancement. From the studies it was found that a variety of factors influence granulation in UASB reactors and include factors like the presence of divalent cations, the presence of inert matter, the accumulation of extracellular polymers (ECP) and the presence of essential microbial populations, which may serve as essential nuclei for granulation. It is recommended that a sludge inoculum for the batch cultivation process, which is active and well balanced in all respects, with all the necessary elements and populations present, and in the right quantities and numbers be used. 3. Development of a reliable activity test A new activity test was developed and while evaluating 7 different sources of anaerobic granules the method was found to be more accurate, reliable and the impact of the different test substrates on activity was more evident. Calibration scales constructed from the data led to an improvement in the ease with which the activity of different granules and granular sludges can be compared. 4. Impact of carbon and nitrogen sources on granule batch production A batch granulation method was developed to enhance granule production but there are many system environmental parameters that influence the production method. In this study the impact using different carbon and nitrogen sources, concentrations and combinations, was evaluated to find a more economically viable combination to be used for granulation enhancement. Nitrogen sources were found to be less critical for the enhancement of granules. For the carbon sources, glucose was found to give the best enhancement of granule numbers for single carbon additions, followed by lactate. A combination of lactate + glucose resulted in the best enhancement of granule numbers when carbon combinations were used. The fruit canning effluent, the cheapest carbon source, in combination with glucose gave the best increase in granule numbers. 5. Impact of preservation methods on storage potential and activity When granules become freely available as seeding inoculum for UASB bioreactors, a reliable preservation method will be required. The level of activity of the methanogenic population in the granules is especially important when determining the efficiency of the bioreactor, as methane is the main metabolic end-product of an anaerobic digestion system. Six different preservation techniques (room temperature storage; vacuum-drying; freeze-drying; vacuum freeze-drying; freeze storage and cold storage) were evaluated. The new activity test was used to evaluate the efficiency of the different preservation techniques in terms of the tempo of biogas and methane production. Freeze-drying showed the best activity followed by vacuum freeze-drying, vacuum drying and room temperature preservation.

iv
6. ECP composition and granule activity It is believed that extracellular polymers (ECP) play a major role in the granulation process. In this study an ECP extraction method was evaluated that optimised extraction time and included a control for cell lyses. Subsequently, this method was used to determine granule ECP composition from various full and laboratory-scale UASB reactors. The activity of different granules was also evaluated and correlated with the ECP composition of the various UASB granules. The optimal extraction time for the granules was determined at 4 h and it was found that the dominant component consisted of protein and the protein:carbohydrate ratio was always >1. The results showed that the ECP composition and protein:carbohydrate ratio was impacted by the composition of the wastewater fed to a UASB. Moreover, it was found that granules with higher ECP yields exhibited greater biogas (SB) and methane (SM) activities. 7. Impact of sludge sources, substrates and cultivation techniques on granule
activity and ECP composition During the batch cultivation of granular sludge there are many system parameters that impact the production method. In this study, the impact of two sludge sources (Paarl and Kraaifontein), carbon substrates (lactate, glucose and fruit effluent) and batch cultivation techniques (roller-table and shake-waterbath) on enhanced batch granule cultivation, metabolic activity and ECP composition of granular sludge, was investigated. It was again found that the roller-table cultivation technique resulted in the best increase in granule numbers. The use of glucose as carbon substrate not only enhanced the activity of the acidogenic populations, but also led to the establishment of a greater variety of trophic groups. It was also found that the fruit effluent cultivated batch systems led to an enhancement of ECP production. One important observation was that granulation did not proceed optimally in all the different batch system combinations studied. Data from the acetate activity profiles showed that the major nuclei formers (acetoclastic methanogenic populations, Methanosarcina and Methanosaeta) appeared to be absent or inactive in all the different batch systems and control samples. CAPACITY BUILDING As part of the research programme five female researchers were awarded the MSc degree, one disadvantaged female researcher the BTech. degree, and one disadvantaged male the BSc (Biochemistry). One female Masters programme was upgraded to a PhD-level. MSc and BTech degrees awarded as part of this programme included: L.C. Ronquest. 1999. MSc. UASB efficiency enhancement during treatment of cellar
effluents. O.D. O'Kennedy, 2000. MSc. Application of biogranules in the anaerobic treatment of
distillery effluents. M. Cameron, 2001. MSc. Stabilisation of metabolite production after the application of
carbon stress during the granulation process. H. Joubert, 2001. MSc. Optimisation of ECP production and the influence of
propionibacteria on the UASB granulation process. E. Van Eeden, 2002. MSc. Extracellular polymer detection and control in UASB granules.

v
S.L. Hector, 2000. BTech (Peninsula Technikon). Optimisation of the UAGB treatment of cellar effluents.
TECHNOLOGY TRANSFERS Publications TRNOVEC, W. and T.J. BRITZ. 1998. Influence of organic loading rate and hydraulic
retention time on the efficiency of a UASB bioreactor treating a canning factory effluent. Water SA 24: 147-152.
RONQUEST, L.C. and T.J. BRITZ. 1999. Influence of lower substrate pH and retention time on the efficiency of a UASB bioreactor treating winery wastewater. South African Journal of Enology and Viticulture 20: 35-41.
BRITZ, T.J., W. TRNOVEC & P.C. FOURIE. 2000. Influence of retention times and influent pH on the performance of an upflow anaerobic sludge bioreactor treating cannery wastewaters. International Journal of Food Science and Technology 35: 1-8.
SIGGE, G.O., BRITZ, T.J., FOURIE, P.C., BARNARDT, N. and STRYDOM, R. 2001. Use of ozone and hydrogen peroxide in the post-treatment of UASB treated alkaline fruit cannery effluent. Water Science and Technology, 44: 69-74.
BRITZ, T.J., C. VAN SCHALKWYK & P. ROOS. 2002 Method for the enhancement of granule formation in batch systems. Water SA 28 (1): 16-24.
Congresses, Symposiums and Workshops BRITZ, T.J. & ROOS, P. 1999. Enhancement of granule growth in batch systems during
carbon source variations. Workshop on granulation. African International Environmental Protection Symposium and 4th Southern African Anaerobic Digestion Symposium, Pietermaritzburg, July.
BRITZ, T.J., TRNOVEC, W. & FOURIE, P.C. 1999. Influence of shorter hydraulic times and different reactor effluent pH values on the performance of a 50-L UASB bioreactor while treating canning wastewaters. Workshop on granulation. African International Environmental Protection Symposium and 4th Southern African Anaerobic Digestion Symposium, Pietermaritzburg, July.
BRITZ, T.J. & RONQUEST, L-C. 1999. Influence of different granule seeding on the start-up efficiency of a lab-scale UASB bioreactor treating winery wastewater. Workshop on granulation. African International Environmental Protection Symposium and 4th Southern African Anaerobic Digestion Symposium, Pietermaritzburg, July.
BRITZ, T.J. & RONQUEST, L-C. 1999. Treatment of low pH cellar effluents at shorter retention times using an UASB bioreactor. 23rd South African Society for Enology and Viticulture, Somerset West, November.
RONQUEST, L-C. & BRITZ, T.J. 1999. Granule seeding scenarios for optimal start-up of UASB-systems treating winery wastewaters. 23rd South African Society for Enology and Viticulture, Somerset West, November.
O’KENNEDY, O.D. & BRITZ, T.J. 1999. Organic loading rate optimisation of UASB bioreactor operated on distillery effluent. 15th Biennial International Food Science and Technology Congress, Cape Town, September.
BRITZ, T.J., VAN SCHALKWYK, C., JOUBERT, H. & ROOS. P. 2000. Development of a method to produce anaerobic granules in a laboratory batch system. International Symposium for Environmental Biotechnology. Noorwijkhout, Netherlands, April.

vi
BRITZ, T.J. & RONQUEST, L-C. 2000. Batch production of tailor-made UAGB-granules for the treatment of winery effluent. Biennial Conference of The Water Institute of Southern Africa, Sun City, South Africa, May/June.
VAN SCHALKWYK, C., H. JOUBERT & T.J. BRITZ. 2001. Aggregate forming ability of
ECP-producing propionibacteria for future application in anaerobic granulation enhancement studies. Third International Symposium on Propionibacteria, Swiss Federal Institute of Technology, Zurich, Switzerland, July.
T.J. BRITZ, L-C. RONQUEST, M. KEYSER & WITTHUHN, C. 2001. Tailor-made UASB granules used for the treatment of winery effluent. Cape Biotech 2001 Symposium, Cape Town, November.
RECOMMENDATIONS FOR FUTURE RESEARCH The main objective of this research programme was focussed on the granulation process in larger batch systems, and in particular, the enhancement of the process, characterisation and activity of the granular sludge and selection of suitable seeding inoculum. The successful cultivation of granules on larger scale has important economic implications in terms of a faster start-up, independence from importation of granules, improved settlability, biomass retention and higher loading rates. 1. The data obtained in the study clearly indicated that the roller-table design showed the best potential for handling larger volumes. To reach the best flow dynamics, container size, mixing attributes and rotation speed will have to be optimised before the maximum granule enhancement can be obtained. 2. There is an urgent need for a simplistic method to standardise the sludge inoculum and to evaluate the enhancement level. 3. The source and microbial consortium composition of the granular sludge used as inoculum for the batch cultivation process was found to have a significant influence on the efficacy of granulation enhancement.
3a. Thus the precise requirements that an anaerobic sludge should fulfil for it to be successfully used as an inoculum for the batch cultivation process has to be defined. 3b. The presence of essential microbial populations which serve as nuclei for granulation must be evaluated and their role defined. 3c. A list of parameters to which a seeding inoculum must conform to be used in the batch cultivation process must thus be compiled. 3d. It is essential to identify a sludge inoculum, which is active and well balanced, with all the necessary elements and populations present, and in the right quantities and numbers.

vii
ACKNOWLEDGEMENTS The research in this report emanated from a project funded by the Water Research Commission an entitled:
"Mass culturing of granules for use in upflow anaerobic sludge blanket (UASB) bioreactors by process induction and microbial stimulation”
The Steering Committee responsible for this project consisted of the following persons: Dr. N.P. Mjoli Water Research Commission (Chairman) Mr. O.C.E. Hempel Water Research Commission (Secretary) Prof. E. Senior University of Natal Dr. W.R. Ross Ross CC Prof. M.C. Wentzel University of Cape Town Mr. A. Laubscher Distell Mr. G.H. Du Plessis Sasol Technology Dr. E.P. Jacobs University of Stellenbosch Prof. L. Lorenzen University of Stellenbosch Mr S. Dill Metajo Environmental Engineers Mr. L. Van Der Merwe Ashton Canning Co. The financing of the project by the Water Research Commission and the contribution of the members of the Steering Committee is gratefully acknowledged. This project was only possible with the co-operation of many individuals and institutions. The Authors therefore wish to record their sincere thanks to the following: Dr. Nozi Mjoli for her continuous support and advice during the course of this project; Prof. Eric Senior, Dr Bill Ross and Prof. Mark Wentzel for their professional
anaerobic support and advice; Mr. G.O. Sigge and Mrs. L. Maas for technical assistance;
Miss. Corne Van Schalkwyk for assistance with the cultures and growth studies; University of Stellenbosch for the infrastructure;
Dr. C. Barnard, Dr. Andrew Wood, Mr. Johan Visser, Dr. Marlene Van Der Merwe, Mr Anton Laubscher and Mrs. Ronel Augustyn for supplying granules and/or specific effluents; Mr. Frik Kruger and Mrs. Marianne Reeves, Stellenbosch University for administrative help; Mr. Herman Rus and Mr. Danie Klopper, Athlone Wastewater Treatment Works, Cape Metropolitan Council, City of Cape Town, for providing anaerobic sludge samples; Mr. Izak Burger, Kraaifontein Wastewater Treatment Works, Cape Metropolitan Council, City of Cape Town, for providing anaerobic sludge samples; and Mr. Cedric Morkel, Paarl Wastewater Treatment Works, Paarl Municipality, Paarl, for providing anaerobic sludge samples.

viii
CONTENTS EXECUTIVE SUMMARY ii ACKNOWLEDGEMENTS vii CONTENTS viii GLOSSARY AND ABBREVIATIONS x CHAPTER 1. INTRODUCTION 1 1.1 Background 1 1.2. Motivation 3
1.3. Research Aims 3 CHAPTER 2. COMPARISON OF DIFFERENT MIXING SYSTEMS FOR 4
MASS CULTURING OF GRANULAR SLUDGE 2.1 Summary 4
2.2 Introduction 4 2.3 Materials and methods 5 2.4 Results and discussion 6 2.5 Conclusions 8
CHAPTER 3. DEVELOPMENT OF AN INEXPENSIVE AND RELIABLE METHOD 10
FOR DETERMINING ACTIVITY OF GRANULAR BIOMASS 3.1 Summary 10 3.2 Introduction 10
3.3 Materials and methods 11 3.4 Results and discussion 12 3.5 Conclusions 20
CHAPTER 4. INFLUENCE OF DIFFERENT CARBON AND NITROGEN 24
SOURCES ON GRANULE PRODUCTION IN BATCH SYSTEMS 4.1 Summary 24
4.2 Introduction 24 4.3 Materials and methods 25 4.4 Results and discussion 26 4.5 Conclusions 36
CHAPTER 5. IMPACT OF DIFFERENT PRESERVATION TECHNIQUES 38
ON THE STORAGE POTENTIAL AND METHANOGENIC ACTIVITY OF GRANULAR SLUDGE
5.1 Summary 38 5.2 Introduction 38 5.3 Materials and methods 39 5.4 Results and discussion 39 5.5 Conclusions 46

ix
CHAPTER 6. EVALUATION OF EXTRACTION AND ANALYSIS METHODS 48
OF ECP FROM UASB GRANULES AND THE IMPACT OF ECP COMPOSITION ON GRANULE ACTIVITY
6.1 Summary 48 6.2 Introduction 48 6.3 Materials and methods 49 6.4 Results and discussion 51 6.5 Conclusions 59
CHAPTER 7. IMPACT OF SLUDGE SOURCES, CARBON SUBSTRATES 61
AND BATCH CULTIVATION TECHNIQUES ON GRANULE ACTIVITY, ECP COMPOSITION AND GRANULE FORMATION IN BATCH SYSTEMS
7.1 Summary 61 7.2 Introduction 61 7.3 Materials and methods 61 7.4 Results and discussion 63 7.5 Conclusions 72
CHAPTER 8. GENERAL COMMENTS 73 CHAPTER 9. REFERENCES 78

x
GLOSSARY AND ABBREVIATIONS GLOSSARY Acidogens – bacteria that depolymerise organic polymers, carbohydrates, proteins and lipids and ferment these to organic acids, alcohols, hydrogen and carbon dioxide. Aerobes – microorganisms whose growth requires the presence of air or free oxygen. Anaerobes – microorganisms that grow in the absence of air or oxygen; organisms that do not use molecular oxygen in respiration. Anaerobic digestion – a microbial fermentation of organic matter to methane and carbon dioxide that occurs in the near absence of air. Anaerobic sludge - accumulated solids separated from wastewater under conditions in which no free oxygen or nitrates are present. Assimilation – the incorporation of nutrients into biomass of a microorganism. Batch fermentation – a fermentation process that can run for a period, in which raw materials are supplied and products and microorganisms are removed in batch. Biodegradable – a substance that can be broken down into smaller molecules by microorganisms or their enzymes. Catabolic pathway – a degradative metabolic pathway in which molecules are broken down into smaller ones. Chemical oxygen demand – the amount of oxygen required to completely oxidize the organic matter in a sample. Consortium – an interactive association between microorganisms that generally results in a combined metabolic activity. Culture – to encourage the growth of particular microorganisms under controlled conditions; the growth of particular types of microbes on or within a medium as result of inoculation and incubation. Domestic sewage – household liquid wastes. Ecosystem – a functional self-supporting system that includes the organisms in a natural community and their environment. Effluent – the liquid discharge from industrial sites or from digesters. Fruit effluent – wastewater obtained from the fruit canning industry. Granules – a mass of microbes cemented together in a slime or extracellular matrix produced by certain bacteria, robust not diffused with good settling properties, usually found in waste treatment plants or specifically in upflow sludge blanket bioreactors.

xi
Granule formation - in this study it refers only to the increase in granule numbers and was not determined as a mass increase. Growth rate – increase in the number of microorganisms per unit time. Metabolite – product of a microbial biochemical activity, e.g. propionic or acetic acids. Metabolic productivity – refers to the production of volatile fatty acids by microbes after growth for a period in a specific carbon source. Methanogens – methane-producing prokaryotes; a group of archaebacteria capable of reducing carbon dioxide or low-molecular-weight fatty acids to produce methane. ABBREVIATIONS ADP Adenosine Diphosphate
ATA Anaerobic Toxicity Assay ATP Adenosine Triphosphate
BMP Biological Methane Potential assay BTM Basic Test Medium CGP Cumulative Gas Production
CH4 Methane CO2 Carbon dioxide
COD Chemical Oxygen Demand ECP Extracellular Polymers
GC Gas Chromatography H2 Dimolecular Hydrogen Gas HRT Hydraulic Retention Time
LAC Lactate Medium OLR Organic loading rate SB Tempo biogas production (ml.h-1 ) SM Tempo methane production (ml.h-1 )
TKN Total Kjeldahl Nitrogen TNVS Total Non-Volatile Solids TS Total Solids
TSS Total Suspended Solids TVS Total Volatile Solids
UAGB Upflow Anaerobic Granular Bed Bioreactor UASB Upflow Anaerobic Sludge Bed Bioreactor
VFA Volatile Fatty Acids VSS Volatile Suspended Solids YEL Yeast Extract Lactate Medium Athlone Waterworks Athlone Wastewater Treatment Works, Cape
Metropolitan Council, City of Cape Town Kraaifontein Waterworks Kraaifontein Wastewater Treatment Works, Cape
Metropolitan Council, City of Cape Town Paarl Waterworks Paarl Wastewater Treatment Works, Paarl Municipality,
Paarl

1
CHAPTER 1
INTRODUCTION 1.1 Background An ever-increasing population and subsequent industrial activities causes many of the developing countries to suffer from severe environmental pollution. Pollution control is, therefore of great concern but many of these countries are unable to utilise the presently available conventional wastewater treatment systems because of the high capital outlay and operational costs involved, the high land requirements of some of these conventional systems and the lack of skilled manpower for their operation. It is therefore, extremely important to develop low cost wastewater treatment systems, which combine a high efficiency with a simple construction and an easy operational profile, as well as some form of valorisation of pollutants. Apart from the environmental pollution problems, most developing countries also suffer from a severe lack in energy and other basic needs. This, together with other factors, forces the development of these countries in a continuing downward spiral (Lettinga et al., 1987). For the development to be turned in an upward direction, the environment should be secured from pollution by applying methods which at the same time diminish existing severe constraints in the area of energy needs and which benefit agricultural productivity (Lettinga et al., 1987). Aerobic processes have always dominated wastewater treatment in industrial countries where the organic compounds are metabolised to carbon dioxide and settleable solids. In the past, energy costs associated with aerobic digestion were low and sludge disposal was simple. However, in recent years, energy costs have risen drastically and sludge disposal has become costly so that industries are forced to re-evaluate other treatment technologies. One such treatment option is the anaerobic digestion process. Anaerobic digestion is a complex series of reactions, catalysed by an assortment of bacteria, which convert the complex organic material to methane and carbon dioxide in the absence of oxygen (Hawkes et al., 1978). According to Housley & Zoutberg (1994), the main advantages of anaerobic digestion compared to the aerobic processes, include low sludge production, the production of methane, reduction of the chemical oxygen demand, lower cost and more limited land requirements. The upflow anaerobic sludge blanket (UASB) bioreactor, originally reported by Ross and developed by Lettinga and co-workers, is one of the most widely applied anaerobic waste water treatment systems (Alphenaar et al., 1993), and is the most popular reactor type for the anaerobic treatment of industrial effluents (Schmidt & Ahring, 1995). The key to the success of the UASB reactor is the ability of bacterial cells to aggregate into dense granules (Guiot et al., 1992). A great deal of research has been done on the performance of the UASB design. However, the main drawback still remains the time-consuming granulation start-up process. Four main factors: the composition; operational temperature; pH; and volatile fatty acid (VFA) content of the wastewater, directly influences the granulation process. Hawkes et al. (1978) noted that the growth of methanogens is generally rather slow when compared to aerobic bacteria. Thus, from a financial point of view, the impact of the slow growth of the methanogens and the subsequent long start-up times can be quite costly for any industry, and for this reason anaerobic digestion is not always considered an option when selecting a system for waste treatment. By seeding the reactor with granules instead of sludge, the start-up period can be reduced significantly. The availability of preserved, but active granules will thus lead to a dramatic cut in the initial implementation costs involved. The whole process will thus be more economically viable. The most important factor during the start-up of UASB bioreactors is, without doubt, the formation of granules. This formation involves bacteria, which somehow clump together to form granules with a diameter of up to 5 mm (Britz et al., 1999). Although the granulation

2
process is still not fully understood, granular sludge has been observed while treating various waste waters and extensive studies on the morphological as well as physio-chemical characteristics have been reported (Alibhai & Forster, 1986; Colleran, 1988; Fang et al., 1994). The formation of granular sludge occurs only within a limited range of waste waters (Fukuzaki et al., 1995). Thus, for the expansion of the UASB technology, it is necessary to study the granulation mechanism on various wastewaters and to evaluate the quality of granules formed from the viewpoint of high-rate performance of the UASB process. The granulation process is a unique type of bioflocculation, which is similar to an agglutination reaction as induced by polymers. Moosbrugger et al. (1992) concluded that the granules are formed by the generation of an extra-cellular polypeptide produced by a hydrogenotrophic methanogen of the genus Methanobacterium. In contrast, Vanderhaegen et al. (1992) found the granules rather to contain equal amounts of extracellular proteins and carbohydrates. The results of Dignac et al. (1998) showed that extracellular polymers (ECP) are predominantly composed of proteins (70 - 80%). This high organic carbon content of ECP led them to conclude that these compounds influence the structure of the granules. Schmidt & Ahring (1994) reported that the production of polysaccharides is limited when granules are grown on methanogenic and acetogenic substrates. This indicates that protein may play an important role in ECP during the formation and stability of granules. According to Riedel & Britz (1993) and Slobodkin & Verstraete (1993), these compounds can be produced by propionate forming acidogens that are effective slime and aggregate formers. According to a hypothesis described by Riedel & Britz (1993) and Britz et al. (1999), during stable state operational conditions, the anaerobic digestion process requires the concerted action of various microbial metabolic groups. Under these balanced operational conditions no lactate and very little propionate can be detected in a UASB bioreactor. When “stress” conditions are applied to a digester treating carbohydrate rich waste waters, the first metabolite that appears is propionate (Myburg & Britz, 1993), while simultaneously, hydrogen can be detected in the gas phase and lactate starts to accumulate (Eng et al., 1986). These metabolic changes result in a shift of the population dynamics of the anaerobic community, and this was confirmed by Riedel & Britz (1993). Subsequently, slime producing and aggregate forming Propionibacterium strains can be isolated under these organic “stress” conditions. Thus, the production of the ECP by the acidogenic bacteria under “stress” conditions (Riedel & Britz, 1993; Slobodkin & Verstraete, 1993) could contribute directly to the initial formation of the highly settleable granules found in efficiently operating UASB reactors. In order to shorten the start-up period of the UASB process, the need exists to stimulate the aggregation of microbes into granules and it is possible that the induction of “stress” conditions may be the key to granule enhancement. Britz et al. (1999) and Britz et al. (2000) argued that an abundance of ECP would lead to the clumping of bacteria, thus resulting in the enhancement of granule formation. High concentrations of VFA, especially propionic acid, could contribute to ECP, the formation as a hydrogen sink mechanism. Furthermore, due to the increasing popularity of the UASB reactor, more granular material will be needed as inoculum during start-up, and thus, the cultivation and successful storage of granules are of key importance (Wu et al., 1995). Quantitative research on the preservation characteristics of granules in terms of storing temperature and period is also necessary if the UASB reactor is to be considered for use in industries operating seasonally or intermittently (Shin et al., 1993; Yükselen, 1997). 1.2. Motivation The treatment of wastewaters was greatly stimulated by the development of the UASB process and its successful full-scale application (Lettinga et al., 1997). The UASB design permits high space loading rates (5 - 30 kgCOD.m-3.d-1) at low hydraulic retention times (24 h) (Ahring & Schimdt, 1992). However, one of the main problems in the application is the extensively long start-up periods.

3
The characteristics of the granular sludge is the striking feature of the UASB system as the bacteria aggregate to form the granules (Slobodkin & Verstraete, 1993). Furthermore, even after seeding the systems with granules it has been found that in time these may disintegrated or wash out (Sorensen et al., 1993). Since the operational efficiency and performance of these systems are mainly dictated by the formation and specific activity of the granules, the potential use of the UASB is limited by the extended start-up periods. To address this problem a Water Research Commission project (WRC 667) was started in 1995 to investigate the granulation process. This study was based on the hypothesis that when sudden stress conditions are applied to UASB systems under controlled environmental conditions, an enhancement of the granulation process takes place. The hypothesis was successfully used to develop a biological model for the simulation of the process and to compare results from both batch and lab-scale anaerobic systems. From the biological model, the operational parameters that must be applied to enhance the granulation process were identified and application to UASB systems showed that the conditions could be changed to lead to granulation enhancement of 100 – 1 200% (Britz et al., 2002). The system was also tested by using batch grown granules as inoculum for 2-L and 50-L UASB units and this led to stable systems at HRTs of 10 - 20 h, COD removal of 85 - 93% at organic loading rates of 4.0 - 9.2 kgCOD.m-3.d-1 within 20 - 30 d (Trnovec & Britz, 1998). However, granule production is still only on small batch-scale and before the system can be of industrial value it will have to be evaluated on larger scale.
The promising results obtained in the first study (WRC 667) showed that the separate culturing of granules holds considerable promise for application of the UASB technology in South Africa as a stable high-rate biological treatment option. The successful cultivation of granules on larger scale has important economic implications for the optimisation of biological treatment processes in terms of faster start-up, independence of our industries from importation of granules from overseas, improved granule settlability, biomass retention and higher loading rates. 1.3. Research Aims The main objective of this research programme was to mass culture granules for use in UASB digesters and promote a more rapid start-up procedure. This was done by:
2. Constructing and operating a granule mass culture system; 2. Applying the granule enhancement biological model on larger scale; 3. Characterising the mass cultured granules in terms of granule formation
(gVSS/gCOD), biomass accumulated as granules, total biomass harvested during a test period, size, degrading activity and methanogenic activity;
4. Evaluating the economics of different synthetic media and waste waters as carbon sources;
5. Evaluating the storage ability of the mass grown granules; 6. Selecting and culturing specific microbial populations and evaluating granule
growth on different effluents; 7. Monitoring changes and stability in the microbial diversity in the granules
produced to degrade specific effluents; and 8. Testing the stability of mass grown granules in lab-scale UASB bioreactors.

4
CHAPTER 2
COMPARISON OF DIFFERENT MIXING SYSTEMS FOR MASS CULTURING OF
GRANULAR SLUDGE
2.1 Summary The use of UASB bioreactors in the treatment of wastewaters depends on the development of an effective granular sludge bed. In previous studies a model was developed for the simulation of the granulation process in small batch systems. The aim of this study was to evaluate the effect of larger scale batch systems (shaking waterbath, shaking platform and roller-table) in the scaling up of the biological model from a small batch system (500 ml) to a larger batch system volume (5 L). Based on granule counts, the 1 L and 500 ml shaking platforms (increase = 968% and 506%, respectively) showed a higher increase in granular content by day 30 (D30) than the larger 5 L roller-table (460%) although all three systems were within the range of granulation increase of the 400 - 1 000% reported by Britz et al. (1999). The 5 L shaking platform and 1 L roller-table did not perform well and showed a net granulation increase of only 177% and 198%, respectively by D30. It was also found that it is difficult to compare different volumes on the same mixing system using the same mixing speed without also taking into consideration the effect of the additional flow dynamics, which might occur within a larger container. The data clearly indicated that of the three mixing systems, the roller-table had the best potential for handling larger volumes, and since the granulation increase of the 5 L roller-table is within the range reported by Britz et al. (1999), it could be a valuable tool for future granulation on larger scale. In this study the impact of the addition of Fe2+ (450 mg.l-1), Ca2+ (100 mg.l-1) and powdered activated carbon (1.5 g.l-1) on D0 on aggregation during batch granule cultivation was also evaluated. The addition of Fe2+ on D0 was found to positively contribute to aggregation of samples incubated using the roller-table technique. 2.2 Introduction The potential use of anaerobic systems such as UASB bioreactors in the treatment of agricultural and food industry wastewaters depend on the development of an effective granular sludge bed. The granulation process is still poorly understood and it would appear as if the granules could only be formed in certain types of food industry effluents. Due to the lack of suitable inoculum granular sludge, this reactor type can only be implemented after an extended start-up period in countries where operational UASB bioreactors are not present. This clearly restricts the general application of UASB technology unless the granulation can be induced.
To address this problem a South African Water Research Commission project (Britz et al., 1999) was started in 1995 to investigate the granulation process. An hypothesis was successfully used to develop a model for the simulation of the process in 500 ml batch systems, which resulted in a granulation enhancement of between 400 – 1 000%. By changing the environmental conditions on batch scale, the propionic acid producers were given a competitive advantage that lead to enhanced granulation. The granular sludge was cultured in batch systems using different carbon sources (Britz et al., 1999). According to Vanderhaegen et al. (1992) shear forces are instrumental in providing cells growing in granules with a selective advantage over free suspended cells. In the study conducted by (Britz et al., 1999), these shear forces were simulated by incubating the 500 ml batch systems in linear shaking waterbaths at 35°C. Before this model could be of industrial value, however, it will have to be evaluated on larger scale. One of the limiting factors is the manner in which larger volume batch systems can be agitated to provide the same type of mixing as was provided by the linear-

5
shake waterbath used by Britz et al. (1999). The aim of this study was to evaluate the effect of three mixing systems (a linear shaking waterbath, a linear shaking platform and a roller-table) in the scaling up of the model of Britz et al. (1999) from a batch system volume of 500 ml to a batch system volume of 5 litre. 2.3 Materials and methods Experimental set-up Three mixing systems were used: (a) a linear-shake waterbath (manufactured by Scientific Manufacturing, Paarden Eiland, Cape Town) with a shake speed between 100 - 130 rpm, (b) a linear-shake platform (Labotec) with a shaking speed between 100 - 130 rpm; and (c) a roller-table (manufactured by the workshop of the Dept. Chemical Engineering, University of Stellenbosch) with a “roller-speed” of 70 rpm. The operational temperatures of all three systems were 35°C. Containers of three different volumes (500 ml, 1 L, and 5 L), containing total operational volumes of 400 ml, 800 ml and 3.5 L respectively, were each inoculated with 20% sludge in 80% sterile YEL-medium. Primary anaerobic sludge was obtained from the Athlone Waterworks. Triplicates of the 500 ml units were incubated in the linear shaking waterbath (Wa500-samples) and on the linear shaking platform (Ta500-samples). Triplicates of the 1 L units were incubated in the shaking waterbath (Wa1lt-samples), on the shaking platform (Ta1lt-samples) and on the roller-table (Ro1lt-samples), and triplicates of the 5 L units were incubated on the shaking platform (Ta5lt-samples) and on the roller-table (Ro5lt-samples). Each day, for a period of 30 d, 80 ml, 160 ml and 800 ml were respectively removed from each of the different batch units (500 ml, 1 L, and 5 L) and replaced with sterile substrate to simulate UASB operational parameters under sudden increases in the loading rate. Substrate The YEL-medium (Riedel & Britz, 1993) consisted of (g.l-1): lactate 20.0, yeast extract 5.0, peptone 2.0, Tween 80 1 ml.l-1 and trace element solution 10 ml.l-1 (Nel et al., 1985). The pH was adjusted to 7.0 and the medium sterilized. Granule counts The amount of granules present in the sludge was counted using the Scion Image program (Scion Corporation, Maryland USA). Ten ml sludge samples were withdrawn from each of the batch units on days: 0, 5, 10, 15, 20, 27 and 30. From each of these samples 1 ml sludge as well as 20 ml of gelatine (30 g.l-1) was poured into the base of a round glass container and left to set at 4°C. A graded grid was placed underneath the container and 10 fields, each with a diameter of 10 X 6 mm, were scanned into the computer using the Matrox Intellicam Interactive (version 2.0) frame-grabber program (Matrox Electronic Systems Ltd.) and a Nikon SMZ800 Stereoscopic Microscope with an on-line Panasonic CP410 video camera. Influence of Fe2+, Ca2+ and powdered activated carbon
The test containers had an operational volume of 400 ml (100 ml sludge and 300 ml YEL-medium). Either Fe2+ (450 mg.l-1), Ca2+ (100 mg.l-1) or powdered activated carbon (ActC) (1.5 g.l-1) were added on day 0 (D0) to the linear shaking waterbath (Wa) and the roller-table containers (Ro). Control containers (Con-samples) were also included.
Parameters were monitored on days D0, D5, D10 and D20, as well as the physical examination at a 10X enlargement of the best test samples compared to the controls. Analytical procedures The following parameters were monitored: pH, Total Solids (TS); Total Non-Volatile Solids (TNVS) and Total Volatile Solids (TVS) (Standard Methods, 1995). Volatile Fatty

6
Acids (VFA’s) were determined using a Varian (model 3700) gas chromatograph equipped with a flame ionisation detector and a Nukol silica capillary column. 2.4 Results and Discussion Granule counts
The average granule counts of the different batch units, as determined using the Scion Image program, can be seen in Figure 2.1. Sampling of the sludge was problematic and difficult to standardize which might explain the “zig-zag” effect found for the Ta1lt and Ro5lt units. As can be seen in Figure 2.1, the four units that had the highest increase in granule counts over a period of 30 d were, in decreasing order, Ta1lt (net increase from day 0 (D0) to day 30 (D30): 968%), Ta500 (506%), Ro5lt (460%) and Wa500 (419%). All four were within the range of granulation increase of 400 – 1 000% reported by Britz et al. (1999) for 500 ml units incubated in a shaking waterbath. Ta1lt and Ta500 units had a more gradual granular increase than Ro5lt, which reached its maximum count on D10 after which decreasing till D30. This basic difference between the Ta (500 ml and 1 L) and the Ro5lt samples was also noted in the pH profiles (Figure 2.2) and the VFA production profiles.
From different scanned images, it was seen that there was an increase in granule size over the 30-day period, but not to the same extent (granule size: pinpoint to 3 mm) as was reported by Britz et al (1999). One of the major differences between this study and that of Britz et al. (1999) was the source and texture of the sludge used. Britz et al. (1999) used a secondary anaerobic sludge from the Kraaifontein Waterworks. At the start of this study, however, anaerobic sludge from Kraaifontein was not available due to mechanical problems, and Athlone Waterworks primary anaerobic sludge was used. This anaerobic sludge was more watery, although it was much more active and produced more gas. Volatile Fatty Acid profiles The two major VFA’s accumulated in the 500 ml, the 1 L and the 5 L samples were acetic and propionic acids (>2500 mg.l-1) with butyric and valeric acids present in lower concentrations (<2000 mg.l-1). Iso-valeric and iso-butyric acids were also present in all the samples but the concentrations were less than <250 mg.l-1. From the VFA profiles it was clear that there is a difference after 30 d between the activity of the microbial communities in the Ro (1 L and 5 L) and Ta5lt samples, and the communities in the Ta and Wa (500 ml and 1 L) samples. In the first group, the typical profile of a lactate-utilizing population (propionic acid (PA) > acetic acid (AA)) can only be seen during the first 3 days, after which the PA concentration drops to levels below a 1 000 mg.l-1 for the Ro samples, and to below 1 500 mg.l-1 for Ta5lt. There was also an increase in butyric acid (BA) to levels above 2 000 mg.l-1. Acetic acid remained the most abundant VFA in this group. In the second group, PA and AA generally remained at levels above 2 500 mg.l-1, while the BA remained below 1 500 mg.l-1. In no samples a simultaneous drop in PA and AA concentrations was found. The difference between the two community types could be the result of the different mixing actions (the “rolling” motion vs. the linear-shaking motion), although it appears more likely to be the result of the positive gas pressure, leading to a more reduced environment, in the Ro and Ta5lt samples. As a result of the excessive gas production, the caps of the containers used for the Ta (500 ml and 1 L) and Wa (500 ml and 1 L) samples were

7
Figure 2.1. Average of granule counts from different volumes incubated on a shaking platform (Ta), in a shaking waterbath (Wa) and on a roller-table (Ro) at 35°C. The volumes were: (a) 500 ml (Ta and Wa); (b) 1 litre (Ta, Wa and Ro); and (c) 5 litre (Ta and Ro).
Incubation time (d)
5 10 15 20 25 30
Gra
nu
les
per
10
ml
0
200000
400000
600000
800000
1000000
1200000
1400000 Ta500 Wa500 Ta1t Wa1lt Ro1lt Ta5lt Ro5lt
Figure 2.2. Average of pH values from different volumes incubated on a shaking platform (Ta), in a shaking waterbath (Wa) and on a roller-table (Ro) at 35°C. The volumes were: (a) 500 ml (Ta and Wa); (b) 1 litre (Ta, Wa and Ro); and (c) 5 litre (Ta and Ro).
Incubation time (d)
0 5 10 15 20 25 30
pH
6.3
6.4
6.5
6.6
6.7
6.8
6.9
7.0
7.1
Wa1lt pH Rolt pH Ta1lt pH Wa500 pH Ta500 pH Ro5lt pH Ta5lt pH

8
loosened to allow gas release. Since the Ro-container caps had to be tightened to prevent leakage on the roller-table, gas release was impossible and plastic containers were then rather used for safety purposes. The 5 L plastic containers were also used for the Ta5lt samples. The caps of these specific containers could not be loosened, which resulted in a positive gas pressure in the Ta5lt samples. Total solids
The total solids (%TS), total volatile solids (%TVS) and total non-volatile solids (%TNVS) of the different samples after 30 d, are summarised in Table 1. In all the samples there was a decrease in %TS over 30 d, although there was a visible increase in granules as well as sludge settlability. What must also be taken into consideration is that sludge is lost daily due to washout during substrate replacement. The amount of sludge lost due to washout may be minimised if sludge with a good settlability is used instead of a more watery sludge. Of all the samples, the Ro samples gave the highest %TS, which indicated that a better sludge retainment was found in this system. What was interesting is that the samples with the higher %TS retention did not necessarily correspond with the higher granule counts. This emphasises the need for a definite distinction to be drawn in future studies between an increase in granules and an increase in anaerobic sludge biomass. Influence of Fe2+, Ca2+ and powdered activated carbon
Of all the samples, the Fe-Ro-sample gave the highest net increase in aggregate counts (818%) over 20 d. This was also confirmed during the physical examination at a 10X magnification where small aggregates were present in both the Fe-Ro and Fe-Wa (net increase: 169%) samples.
The image analysis (IA) counts were also high for the powdered activated carbon samples, but it was clear after the physical examination that this was probably due to the additional presence activated carbon particles. There was, however, a slight net increase in aggregate numbers over the 20 days (205% and 149%, respectively for ActC-Ro and ActC-Wa). This demonstrates one of the shortcomings of the IA method and makes it difficult to distinguish between aggregates and inorganic particles. In future it might be valuable to combine the IA aggregate number counts with aggregate size distribution determinations (Jeison & Chamy, 1998) in order to obtain a more reliable indication of aggregate formation.
No quantitative difference could be determined between the control-Ro-sample (179%) and the Ca-Ro-sample (183%), while both the Con-Wa and the Ca-Wa-samples showed a net decrease in numbers over 20 d.
Overall, the Ro-samples performed better than the corresponding Wa-samples, indicating that the gentle "rolling" motion might be more advantageous for aggregate formation than the more “vigorous” shaking action. Most of the samples, with the exception of the ActC-samples, showed the highest counts on D10, where after the counts decreased slightly by D20. Whether this is the result of the aggregates clumping together and forming bigger aggregates, or an indication of aggregate disintegration, is not clear. Once again it might be valuable to study the size distributions of the aggregates over the 20 d period to clarify this phenomenon. 2.5 Conclusions Based on the granule counts, Ta1lt (net increase from D0 to D30 = 968%) and Ta500 (506%) showed a higher increase in granular numbers than Ro5lt (460%), although all three were within the range of granulation increase of 400 - 1 000% reported by Britz et al. (1999). The Ta5lt samples did not perform well when compared to the Ta500 and Ta1lt samples, and showed a net granulation increase of only 177% by D30. The same was observed for Ro1lt, which showed a net increase of only 198%. This difference indicates the difficulty in comparing different volumes on the same mixing system, using the same mixing speed,

9
without also taking into consideration the effect of the additional flow dynamics, which occurs within a larger container.
As was shown earlier, although an increase in the granular content of the sludge was observed, it was not to the same level as was reported by Britz et al. (1999). From the VFA profiles it was also noted that the acetic acid concentrations in particular did not drop to the lower levels as was observed by Britz et al. (1999), which may indicate that specific acetic acid utilizing populations, such as acetoclastic methanogens, may not be present in the Athlone sludge. These observations emphasize the importance of an active, effective and balanced anaerobic community to be present in any anaerobic sludge that is to be used as "seeding inoculum" for batch cultivation studies.
Of the three mixing systems the roller-table (Ro) showed the best potential for handling larger volumes, and since the granulation increase of Ro5lt was within the range reported by Britz et al. (1999), it might be a valuable for future granulation on larger scale. The addition of Fe2+ on D0 to the sample incubated on the roller-table was found to contributed to sludge aggregation during the batch cultivation process.
Table 2.1. Total solids (%TS), total volatile solids (%TVS) and total non-volatile solids
(%TNVS) of the different samples after 30 d.
Sample
%TS
%TVS
%TNVS
D0
47.00
63.36
36.65
D30 Ta500 36.20 51.51 48.49
D30 Wa500 37.16 53.23 46.76
D30 Ta1lt 40.12 53.07 46.93
D30 Wa1lt 37.42 51.14 48.86
D30 Ro1lt 42.60 60.39 39.61
D30 Ta5lt 35.11 51.99 48.02
D30 Ro5lt
45.90 61.10 38.91

10
Chapter 3
DEVELOPMENT OF AN INEXPENSIVE AND RELIABLE METHOD FOR DETERMINING ACTIVITY OF GRANULAR BIOMASS
3.1 Summary The activity method of Owen et al. (1979), as adapted by Lamb (1995) was evaluated in terms of efficiency and applicability in determining the activity of granular samples. The method was found to be inaccurate as well as time consuming and it was thus modified to shorten the incubation time from 72 to 25 h and the assay volume reduced from 250 to 20 ml as well as securing the vial from possible gas leaks. Results obtained were more accurate, and the impact of the different test substrates (glucose, lactate, acetate and formate) on activity was more evident. The activity of seven different anaerobic granules was evaluated. In this study activity was not measured in volume of gas produced per unit COD converted or volatile suspended solids (VSS) but as rate of gas production (ml.h-1) in a standardised growth medium. The activity data obtained were displayed as bar charts giving valuable information about population dynamics as well as possible substrate inhibition. Calibration scales constructed from the data also improved the ease with which the activity of different granule types could be compared with each other. 3.2 Introduction The success of the upflow anaerobic sludge bed (UASB) process is mainly due to the capability of retaining the active biomass in the reactor. Over the years, several methods were developed to characterise and quantify sludge activity but each has advantages and disadvantages. There is thus an increasing need for a rapid method to specifically evaluate the activity of the granular biomass.
Typical activity investigations have included the determination of sludge biomass activity, assessment of inhibition levels and the measuring of kinetic constants. Most of these were performed in large closed vessels incubated under varying conditions and the methane production was used to indicate the activity. Measuring the amount of biogas produced has been the most popular method to characterise methanogenic activity (James et al., 1990; Angelidaki et al., 1998; Verstraete & Vandevivere, 1999). Early methods relied on the liquid displacement of external gas collectors (Chernicharo & Campos, 1991; Angelidaki et al., 1998; Verstraete & Vandevivere, 1999) or by displacement of a piston in gas lock syringes (Owen et al., 1979; Dolfing & Bloemen, 1985; James et al., 1990). More recent modifications included the introduction of a pressure transducer method (Angelidaki et al., 1998). This system permitted continuous or discontinuous measurement of the pressure increase in a series of linked vials by means of multiplexer chips and a BBC microcomputer. The method opened the field of sequential automated methanometry (SMA) and, with the most recent method being the computerised automatic biogas activity monitoring (BAM) system (Angelidaki et al., 1998).
Many researchers have observed that the data from the different activity tests varied depending on the methodology used. The most important variables that influenced microbial community growth were identified as initial activity, inoculum size, age and decline in metabolic activity and death of members of the consortium resulting from unsuitable storage conditions. Although recent developments in methanogenic activity testing have lessened the difficulties previously associated with method execution, there is still a lack of a simple method to show the activity of the different trophic groups in their specific environment within the anaerobic granule. In most methods, sludge or mashed granules are used, which is not a true reflection of the granule activity. In many cases, the tests are performed over several days and it was concluded by Angelidaki et al. (1998) and Moreno et al. (1999) that true

11
activity was not being measured but rather metabolic activity resulting from the growth of members of the microbial consortium.
The aim of this study was to evaluate the applicability of a known activity test and to develop a method that will give a fast indication of direct granular activity. As part of the study, the activity levels of different types of granules will be calibrated so as to develop a scale of reference for future use. 3.3 Materials and methods Study I. Evaluating the applicability of a known activity test using anaerobic granules
In the first study the method of Lamb (1995), was used to determine the applicability in accessing the activity of anaerobic granules from a laboratory-scale UASB bioreactor treating distillery effluent. The Lamb (1995) method is a modification and combination of the anaerobic toxicity assay (ATA) and the biological methane potential assay (BMP) (Owen et al., 1979).
A Basic Test Medium (BTM) consisting of a Nutrient-solution (Valke & Verstraete, 1993), glucose (2.0 g.l-1) and distillery effluent was used with one of three different COD concentrations: 250, 500 and 1 000 mg.l-1. In each case a granular inoculum of 3.0 g of water drained anaerobic granules, was used. The inoculum and 200 ml Basic-medium were dispensed into 250 ml glass containers with a final headspace of 50 ml. The headspace was limited to improve the accuracy of the gas production determinations (Owen et al., 1979).
The addition of different carbon sources and carbon concentrations to the Basic-medium were evaluated and included (g.l-1): 2.0 glucose; 0.1, 0.5 and 1.0 acetate; and a combination of 2.0 glucose with either 0.1 or 0.5 acetate. These test substrates were added to the test containers and the pH set at 7.0. The final pH of each test was also determined at the end of the assay. The assays were prepared in triplicate, sealed and incubated at 35°C. For each test combination, a control was prepared (Basic-medium with granule inoculum) but with no additional carbon source was added. The control was used as a point of reference to compare the relative influence of the specific carbon source on the granule microbial community relative to those with no additionally added carbon source.
The biogas samples were taken every 24 h for three days and analysed gas chromatographically (GC). This was sufficient time for all the carbon sources to be depleted. The biogas samples were taken with a gas-tight syringe with a 12-gauge needle (Owen et al., 1979) and corrected for standard temperature and pressure. Biogas volumes were expressed as cumulative volumes. Study II. Evaluation of the effect of different design criteria (substrate changes,
inoculum size and assay volume variations) on method used in Study I. In the second study, the method used in Study I was modified to increase the reliability
of testing the methanogenic activity of a granular sample. Smaller containers (20 ml sealable vials) were used and the duration of the assay was shortened to 25 h to limit gas production. It is believed that the initial rate of biogas accumulation is the optimal estimate of the performance of the biomass as bacterial growth and adaptation of biomass changes the biomass metabolite characteristics. Adaptional changes included changes in concentrations of substrate and nutrients in the assay bottles as the degradation process takes place (Sørensen & Ahring, 1993). An incubation period of 25 h was thus considered to be adequate as negligible additional biogas was produced thereafter (James et al., 1990; Ince et al., 1995; Angelidaki et al., 1998). The inoculum size was also varied (1, 2 and 3 g water drained granules) and the test substrates used as carbon sources included: 1 and 2 g.l-1 glucose; 2 and 4 g.l-1 lactate; 0.1 and 0.5 g.l-1 acetate; and 0.1 and 0.5 g.l-1 formate.
The different inoculum sizes, BTM (with 2 g glucose) with the different test substrates were placed in the vials leaving a headspace of 7 ml and the vials sealed and incubated at 35C. A smaller headspace has been reported to decrease the accuracy in determining

12
biogas production as part of the biogas produced could be dissolved in the assay media by a reverse osmosis mechanism (Angelidaki et al., 1998). Biogas readings were taken at time 5, 10 and 25 h, to ensure that sufficient pressure had developed to measure by means of a gas-tight syringe. A control was prepared for each test substrate (Basic-medium with granule inoculum but no additional carbon source). All tests were prepared in triplicate. Biogas, carbon dioxide and methane determinations were done gas chromatographically.
Study III. Methanogenic activity of different types of anaerobic granules.
In this study, the method described in Study II was applied to determine the activity of seven different types of anaerobic granules (Table 3.1). This was done to establish an activity calibration-set to be used as a reference for future granule activity estimates.
The assay was as follows: 20 ml vials were inoculated with 3 g of anaerobic granules and 12 ml of the BTM (2 g.l-1 glucose and nutrient medium). The different test substrates (1 and 2 g.l-1 of glucose, 2 and 4 g.l-1 lactate, 0.1, 0.5 and 1.0 g.l-1 acetate and 0.1, 0.5 and 1.0 g.l-1 formate) were then added to each specific assay set. The assay vials were prepared in triplicate and biogas samples were taken at time 5, 10 and 25 h. 3.4 Results and discussion Study I. Evaluating the applicability of a known activity test using anaerobic granules
In the first study the applicability of an established method for testing the activity of anaerobic granules, was evaluated. In this study anaerobic granules obtained from a lab-scale UASB bioreactor treating distillery effluent, were used as inoculum.
The data in this study represent the cumulative production of biogas with 250 (A), 500 (B) and 1000 (C) mg.l-1 COD distillery effluent added to the Basic Test Medium. Each control data point represents the cumulative biogas production of triplicate assay samples that do not contain any additional test substrate and thereby represent the activity of the microbial community in the absence of any stimulatory or inhibitory compounds. It was, therefore, not necessary to represent the net difference in production between the test assay and the control. The tests were performed over a period of 120 h but the data clearly showed that the major biogas production took place within the first 25 h for all three COD concentrations. It was thus concluded that an incubation period of 120 h was unnecessary because most of the usable carbon sources were probably metabolised by that time. For the subsequent studies the incubation time was thus shortened to 25 h.
From the results it was found that the best cumulative gas production was obtained when using 250 and 500 mg.l-1 COD distillery effluent in the Basic Test Medium. When 250 mg.l-1 COD distillery effluent was used in a combination of 0.1 g.l-1 acetate plus 4 g.l-1 glucose as test substrates, the most biogas was produced. However, the 0.1 g.l-1 acetate assay produced more biogas than all the other assays for the same COD concentration after 20 h. Thus, when evaluating the effect of different test substrates on biogas production, the specific biogas profile of each test substrate must be considered. When 500 mg.l-1 COD distillery effluent was added to the Basic-medium, the most biogas produced at the completion of the assay was with 0.5 g.l-1 acetate. Although no general activity profile for the different carbon sources used could be found with the different concentration distillery effluent, it would appear that the samples containing acetate generally produced more biogas. The higher biogas production activity associated with the acetate containing assay sets can possibly be ascribed to the activity of the methanogens, which can directly convert acetate to methane.
For all three the COD concentrations of distillery effluent used in the BTM, the largest pH drop was where the 2 g.l-1 glucose was added as test substrate, and a pH drop from 7.0 to 6.5 was found.

13
Study II. Evaluation of impact of different design criteria (substrate changes, inoculum size and assay volume variations) on the activity method.
In Study II, the set-up was modified to use smaller test vials (20 ml) that could be sealed resulting in a greater biogas measuring accuracy. The optimum inoculum size was also determined (Figure 3.1) in triplicate by using 1.0, 2.0 and 3.0 g of granules in combination with either (g.l-1): 1.0 and 2.0 glucose; 2.0 and 4.0 lactate; 0.1 and 0.5 acetate; or 0.1 and 0.5 formate, as different carbon sources. The assay duration was shortened to 25 h and the biogas, methane and carbon dioxide determined after 5, 10 and 25 h. The dotted line in Figure 3.1 (A – C) represents the cumulative volume of biogas produced at time 25 h for the control containing a 3 g inoculum. In all the studies, the use of the 3 g granular inoculum resulted in the production of the best biogas volume. It was, therefore, concluded that 3 g granular inoculums would be the most suitable to ensure the production of biogas and to enhance the visual evaluation of the data.
In Figure 3.1 (A - E) it can be seen that all the test substrates used enhanced the biogas production. The highest value amount of biogas was produced with glucose as test substrate, which was an indication that the acidogenic community of the granules used in this study were well adapted and able to effectively degrade the carbon source. The 2 g.l-1 glucose assay produced more biogas than when only 1 g.l-1 of glucose was used and was ascribed to the availability of more degradable carbon. The final pH of the 2 g.l-1 glucose assays were also the lowest for all three inoculum sizes, which could be due to the accumulation of the volatile fatty acids that could not be utilised by the methanogenic bacteria within the test period.
Lactate was used as a test substrate to investigate the possible presence of lactate-utilising bacteria and it was found that the 4 g.l-1 lactate vials produced more biogas than the 2 g.l-1 lactate vials. It was also found that the lactate containing assays produced less biogas than the glucose samples but more than those containing acetate and formate as carbon sources.
The 0.5 g.l-1 acetate assays produced more biogas than the 0.1 g.l-1 acetate assays for all the inoculum sizes. The final pH values of the acetate vials were between 7.0 and 7.1. The elevated pH's obtained with the acetate vials are probably due to the release of sodium ions as the acetate was metabolised (Morgan et al., 1990). The lower volume of biogas obtained for acetate in comparison with lactate and glucose can possibly be attributed to the fact that the absorption of carbon dioxide is increased at a higher pH (Morgan et al., 1990). Thus, although the total gas yield was lower, the methane content was significantly higher: 82% as compared with 68% in the biogas produced with glucose and lactate.
The data showed that the modified set-up led to a faster and more accurate indication of granule activity. This study, using three different granule inoculum sizes and each test in triplicate, was repeated three separate times and in total gave a biogas variation of less than 10%. The shorter assay period was also more convenient in terms of laboratory handling. One aspect that was found to help stabilise and make the modified method more accurate was the addition of glucose to the Basic Test Medium.
Study III. Methanogenic activity of different types of anaerobic granules
In this study the modified assay with the addition of 2.0 g.l-1 glucose to the BTM was used to determine the activity of seven different granule types. These granules were obtained from industrial scale and lab-scale UASB bioreactors treating the following effluents: winery, distillery, brewery, cannery and fruit juice effluent (Table 3.1).

14
Incubation time (h)
0 2 4 6 8 10 12 14 16 18 20 22 24 26
Bio
gas
(m
l)
0123456789
1011121314151617
1 g of granules 2 g of granules3 g of granules
Incubation time (h)
0 2 4 6 8 10 12 14 16 18 20 22 24 26
Bio
gas
(m
l)
0123456789
1011121314151617
1g, g.l-1 Glu
2g, 1 g.l-1 Glu
3g, 1 g.l-1 Glu
1g, 2 g.l-1 Glu
2 g, 4 g.l-1 Glu
3 g, 4 g.l-1 Glu
Incubation time (h)
0 2 4 6 8 10 12 14 16 18 20 22 24 26
Bio
gas
(m
l)
0123456789
1011121314151617
1 g, 2 g.l Lac2 g, 2 g.l Lac3 g, 2 g.l Lac1 g. 4 g.l Lac2 g. 4 g.l Lac3 g.4 g.l Lac
Incubation time (h)
0 2 4 6 8 10 12 14 16 18 20 22 24 26
Bio
gas
(m
l)
0123456789
1011121314151617
1 g, 0.1 g.l Ac2 g, 0.1 g.l Ac3 g, 0.1 g.l Ac1 g, 0.5 g.l Ac2 g, 0.5 g.l Ac3 g,0.5 g.l Ac
Incubation time (h)
0 2 4 6 8 10 12 14 16 18 20 22 24 26
Bio
gas
(m
l)
0123456789
1011121314151617
1 g. 0.1 g.l Fo2 g, 0.1 g.l Fo3 g, 0.1 g.l Fo1 g. 0.5 g.l Fo2 g. 0.5 g.l Fo3 g. 0.5 g.l Fo
Control Glucose as carbon source
Lactate as carbon source Acetate as carbon source
Formate as carbon source
A B
C D
E
Figure 3.1. The cumulative biogas production of anaerobic granules with different carbon sources and different inoculum sizes (1, 2 and 3 g). (Glu = glucose, Lac = lactate, Ac = acetate, Fo = formate) (dashed line = cumulative biogas for the 3 g inoculum control after 25 h).

15
After the cumulative biogas and CH4 production of each type of granules was determined, the data were converted to represent the activity of each type of granule relative to the others. In this study the activity of each type of granule is given in terms of the rate of biogas and CH4 production. The rate of gas production was determined by the slope or gradient (the cumulative gas production (CGP) over time for each of the time intervals (T = 5, 10 and 25 h). The gradient was determined as follows: for 10 h: (CGP10h - CGP5h)/(T10h - T5h). The rate of biogas production (SB for biogas and SM for methane) was thus given in ml.h-1 and was taken as representative of the activity of the granules. These values were then plotted against time for all the granules and for the other carbon sources evaluated to give a visual representation of the activity of the different granule types.
Table 3.1. Different anaerobic biogranules used. Code Origin effluent type S-type industrial UASB distillery effluent1
O-type lab-scale UASB distillery effluent2
C-type industrial UASB fruit juice production effluent3
M- type lab-scale UASB winery effluent4
G-type lab-scale UASB cannery effluent5
W-type industrial UASB brewery effluent6
V-type industrial gelatine effluent7
conventional bioreactor
Received from: 1. Mr. A. Laubscher, SFW, Wellington 2. Prof. T.J. Britz, University of Stellenbosch, SA 3. Dr. N. Barnard, Ceres Fruit Juices Pty. Ltd, Ceres
4. Ms. M. Cameron, University of Stellenbosch, SA 5. Mr. G.O. Sigge, University of Stellenbosch, SA 6. Dr. A. Wood, SA Breweries, Amanzimtoti 7. Dr. M. van de Merwe, Pietersburg
The biogas and methanogenic activities of the seven granule types are shown in
Figures 3.2 and 3.3, respectively. From the data it is clear that the different granule types could be divided into two main group in terms of the rate of biogas production after 5 h. The groups were the 0-, M-, G- and C- type granules (first group), which exhibited more activity (± 0.3 ml.h-1) than the S-, V-, and W-type granules (second group) for the different carbon sources.

16
Incubation time (h)
0 2 4 6 8 10
SB (
ml.h
-1)
0.0
0.1
0.2
0.3
0.4
0.5
0.6
0.7
0.8
0.9
1.0
1.1
1.2
1.3
1.4
1.5
1.6
1.7
O-typeV-typeW-typeG-typeM-typeC-typeS-type
Incubation time (h)
0 2 4 6 8 10
SB (
ml.h
-1)
-0.1
0.0
0.1
0.2
0.3
0.4
0.5
0.6
0.7
0.8
0.9
1.0
1.1
1.2
1.3
1.4
1.5
1.6
1.7
Incubation time (h)
0 2 4 6 8 10
SB (
ml.h
-1)
0.0
0.1
0.2
0.3
0.4
0.5
0.6
0.7
0.8
0.9
1.0
1.1
1.2
1.3
1.4
1.5
1.6
1.7
Incubation time (h)
0 2 4 6 8 10
SB (
ml.h
-1)
0.0
0.1
0.2
0.3
0.4
0.5
0.6
0.7
0.8
0.9
1.0
1.1
1.2
1.3
1.4
1.5
1.6
1.7
Incubation time (h)
0 2 4 6 8 10
SB (
ml.h
-1)
0.0
0.1
0.2
0.3
0.4
0.5
0.6
0.7
0.8
0.9
1.0
1.1
1.2
1.3
1.4
1.5
1.6
1.7
Incubation time (h)
0 2 4 6 8 10
SB (
ml.h
-1)
0.0
0.1
0.2
0.3
0.4
0.5
0.6
0.7
0.8
0.9
1.0
1.1
1.2
1.3
1.4
1.5
1.6
1.7
control 1 g.l-1 glucose
2 g.l-1 glucose 2 g.l-1 lactate
4 g.l-1 lactate 0.1 g.l-1 acetate
25 25
2525
25 25
Figure 3.2. Comparison of the activity of different types of anaerobic granules with different carbon sources added to the Basic-medium. The data are averages of triplicates. (SB = tempo of biogas production (ml.h-1)
O-typeV-typeW-typeG-typeM-typeC-typeS-type
O-typeV-typeW-typeG-typeM-typeC-typeS-type
O-typeV-typeW-typeG-typeM-typeC-typeS-type
O-typeV-typeW-typeG-typeM-typeC-typeS-type
O-typeV-typeW-typeG-typeM-typeC-typeS-type
A B
C D
E F

17
Incubation time (h)
0 2 4 6 8 10
SB (
ml.h
-1)
0.0
0.1
0.2
0.3
0.4
0.5
0.6
0.7
0.8
0.9
1.0
1.1
1.2
1.3
1.4
1.5
1.6
1.7
O-typeV-typeW-typeG-typeM-typeC-typeS-type
Incubation time (h)
0 2 4 6 8 10
SB (
ml.h
-1)
0.0
0.1
0.2
0.3
0.4
0.5
0.6
0.7
0.8
0.9
1.0
1.1
1.2
1.3
1.4
1.5
1.6
1.7
0.5 g.l-1 acetate 1 g.l-1 acetate
Incubation time (h)
0 2 4 6 8 10
SB (
ml.h
-1)
0.0
0.1
0.2
0.3
0.4
0.5
0.6
0.7
0.8
0.9
1.0
1.1
1.2
1.3
1.4
1.5
1.6
1.7
0.1 g.l-1 formate
Incubation time (h)
0 2 4 6 8 10
SB (
ml.h
-1)
0.0
0.1
0.2
0.3
0.4
0.5
0.6
0.7
0.8
0.9
1.0
1.1
1.2
1.3
1.4
1.5
1.6
1.7
Incubation time (h)
0 2 4 6 8 10
SB (
ml.h
-1)
0.0
0.1
0.2
0.3
0.4
0.5
0.6
0.7
0.8
0.9
1.0
1.1
1.2
1.3
1.4
1.5
1.6
1.7
1 g.l-1 fomate
2525
25 25
25
0.5 g.l-1 formate
Figure 3.2. continued
O-typeV-typeW-typeG-typeM-typeC-typeS-type
O-typeV-typeW-typeG-typeM-typeC-typeS-type
O-typeV-typeW-typeG-typeM-typeC-typeS-type
O-typeV-typeW-typeG-typeM-typeC-typeS-type
G H
I J
K
25 25
2525
25

18
Incubation time (h)
0 2 4 6 8 10
SM (
ml.h
-1 )
0.000.050.100.150.200.250.300.350.400.450.500.550.600.650.700.750.800.850.900.951.00
Incubation time (h)
0 2 4 6 8 10
SM (
ml.h
-1)
0.000.050.100.150.200.250.300.350.400.450.500.550.600.650.700.750.800.850.900.951.00
Incubation time (h)
0 2 4 6 8 10
SM (
ml.h
-1)
0.000.050.100.150.200.250.300.350.400.450.500.550.600.650.700.750.800.850.900.951.00
Incubation time (h)
0 2 4 6 8 10
SM (
ml.h
-1)
0.000.050.100.150.200.250.300.350.400.450.500.550.600.650.700.750.800.850.900.951.00
O-typeV-typeW-typeG-typeM-typeC-typeS-type
25 25
2 g.l-1 glucose
Control 1 g.l-1 glucose
2 g.l-1 lactate
Incubation time (h)
0 2 4 6 8 10
SM (
ml.h
-1)
0.000.050.100.150.200.250.300.350.400.450.500.550.600.650.700.750.800.850.900.951.00
Incubation time (h)
0 2 4 6 8 10
SM
(ml.h
-1)
0.000.050.100.150.200.250.300.350.400.450.500.550.600.650.700.750.800.850.900.951.00
4 g.l-1 lactate
25 25
0.1 g.l-1 acetate
25 25
Figure 3.3. Comparison of methane activity of different anaerobic granules with different carbon sources added to the Basic-medium. The data are averages of triplicates. (SM = tempo of methane production (ml.h-1)
O-typeV-typeW-typeG-typeM-typeC-typeS-type
O-typeV-typeW-typeG-typeM-typeC-typeS-type
O-typeV-typeW-typeG-typeM-typeC-typeS-type
O-typeV-typeW-typeG-typeM-typeC-typeS-type
O-typeV-typeW-typeG-typeM-typeC-typeS-type
A B
C D
E F

19
Incubation time (h)
0 2 4 6 8 10
SM (
ml.h
-1)
0.000.050.100.150.200.250.300.350.400.450.500.550.600.650.700.750.800.850.900.951.00
O-typeV-typeW-typeG-typeM-typeC-typeS-type
Incubation time (h)0 2 4 6 8 10
SM (
ml.h
-1)
0.000.050.100.150.200.250.300.350.400.450.500.550.600.650.700.750.800.850.900.951.00
Incubation time (h)
0 2 4 6 8 10
SM (
ml.h
-1)
0.000.050.100.150.200.250.300.350.400.450.500.550.600.650.700.750.800.850.900.951.00
Incubation time (h)
0 2 4 6 8 10
SM (
ml.h
-1)
0.000.050.100.150.200.250.300.350.400.450.500.550.600.650.700.750.800.850.900.951.00
0.5 g.l-1 acetate
25
1 g.l-1 acetate
25
0.1 g.l-1 formate
25
0.5 g.l-1 formate
25
Incubation time (h)
0 2 4 6 8 10
SM (
ml.h
-1)
0.000.050.100.150.200.250.300.350.400.450.500.550.600.650.700.750.800.850.900.951.00
1 g.l-1 formate
25
Figure 3.3. continued
O-typeV-typeW-typeG-typeM-typeC-typeS-type
O-typeV-typeW-typeG-typeM-typeC-typeS-type
O-typeV-typeW-typeG-typeM-typeC-typeS-type
O-typeV-typeW-typeG-typeM-typeC-typeS-type
G H
I J
K

20
In Figure 3.3 the methanogenic activity (SM) (rate of CH4 production) of the granules relative to one another and with the different carbon sources, is illustrated. The methanogenic activity of all the granule types for all the carbon sources used was very low or even absent after 5 h of incubation (0.05 ml.h-1). At 10 h of incubation, a larger variability in methanogenic activity was found and subsequently the influence of the different carbon sources was more apparent. No specific groups were evident as was found for the biogas and each test substrate was evaluated separately by means of bar charts. The rate at which biogas and CH4 were produced decreased after the 10 to the 25 h incubation time for most of the granules, indicating that this further incubation period of up to 25 h was found not to be of value in indicating activity.
Calibration scales - Both the activity scales for biogas and methane are presented as calibration scales in Figures 3.4 and 3.5. The activity values for biogas (SB) and methane (SM) of all the granule types were plotted on a scale ranging from the poorest activities (at the bottom) to the most active (at the top). This was done for all four carbon sources ((g.I-1): 2 glucose, 4 lactate, 1.0 acetate and 1.0 formate) and at 5 and 10 h of incubation since the activity profiles change for some substrates as the period of incubation increases. These calibration scales can now be used to classify the general biogas (Figure 3.4) and methanogenic activities (Figure 3.5) of any biogranule relative to active (O-type) and inactive (W-type) anaerobic granules, provided that the same method of activity testing is used. For example, in Figure 3.4, it is clear that for most of the granules used the biogas activity (SB) was between 0.15 and 0.30 ml.h-1 for all the carbon sources. It is also clear that the O-type granules have an activity value above those of the other granules after 5 h of incubation and when acetate was used as carbon source.
The segregation of granules into different activity ranges widens from 5 to 10 h incubation (three activity ranges at 5 h and five activity ranges at 10 h). There are also less activity ranges present in the calibration scales for methanogenic activity, with most granules types having a methanogenic activity (SM) value below 0.10 ml.h-1 and only a few in the second range from 0.10 to 0.25 ml.h-1 (Figure 3.5). It should be noted that these activity ranges are only for the quick assessment of granule activity. An estimated activity value can thus be obtained to determine if an inoculum is suitable for bioreactor start-up or if the maximum space-loading rate of an operational system must be estimated. 3.5 Conclusions In the past, much research was done on the development of different efficient tests for determining the activities of the bacteria involved in anaerobic digestion (Colleran et al., 1992; Coates et al., 1996; Garcia-Morales et al., 1996; Codina et al., 1998). Many of these methods are either time consuming and unreliable or require expensive monitoring equipment, which could put further strain on an already tight budget (Angelidaki et al., 1998) and this type of research does not really provide an easy, reliable and fast method of indicating direct granular activity. Once the activity level of the sample has been determined using these methods, it is still not entirely clear how the level of activity compares to a good or a poor level of activity.
The modified method was applied to granules treating different effluents, and the subsequent general and methanogenic activities determined. The different activities were expressed in terms of the rate of biogas (SB) and methane production (SM) (ml.h-1), and also displayed as calibration scales. According to the acquired data, the O-type granules were found to be the most active in terms of both general biogas (SB) and methanogenic (SM) activity in contrast to the V-type granules, which displayed the lowest SB and SM.
These illustrative forms of calibration scales of SB and SM values to evaluate biogas and methanogenic activity do, therefore, not only provide useful activity data, but can also give valuable information regarding the status of the different tropic groups (acidogens and methanogens) within the different types of granules. Future work must include expanding

21
the type of granules evaluated with this specific activity method by which the calibration scales could be adjusted to accommodate a wider variety of anaerobic granules.

22
S
B (
ml.
h-1
)
0.00
0.05
0.10
0.15
0.20
0.25
0.30
0.35
0.40
0.45
0.50
0.55
0.60
0.65
0.70
0.75
0.80
0.85
0.90
0.95
1.00
1.05
1.10
1.15
1.20
1.25
1.30
1.35
1.40
1.45
1.50
1.55
1.60
1.65
1.70
Co
ntr
ol
Glu
cose
Lac
tate
Ac
etat
e
Fo
rmat
e
Co
ntr
ol
Glu
cos
e
Lac
tate
Ace
tate
Fo
rmat
e
Incubation time = 5 h Incubation time = 10 h
Figure 3.4. Calibration sheet for different anaerobic granules and different carbon sources in terms of biogranule activity. SB = tempo of biogas production (ml.h-1)
( = O-type; = V-type; = W-type; = G-type; = M-type; = C-type; = S-type)

23
SM
(m
l.h
-1)
0.00
0.05
0.10
0.15
0.20
0.25
0.30
0.35
0.40
0.45
0.50
0.55
0.60
0.65
0.70
0.75
0.80
0.85
0.90
0.95Incubation time = 5 h Incubation time = 10 h
Figure 3.5. Calibration sheet for different anaerobic granules and different carbon sources in terms of methanogenic activity. SM = tempo of methane production (ml.h-1)
Co
ntr
ol
Glu
cos
e
Lac
tate
Ace
tate
Fo
rmat
e
Co
ntr
ol
Glu
cose
Lac
tate
Ac
etat
e
Fo
rmat
e
( = O-type; = V-type; = W-type; = G-type; = M-type; = C-type; = S-type)

24
CHAPTER 4
INFLUENCE OF DIFFERENT CARBON AND NITROGEN SOURCES ON GRANULE PRODUCTION IN BATCH SYSTEMS
4.1 Summary The need for granular seed sludge for start-up of UASB reactors is crucial. A method has been developed to enhance batch granule production from raw anaerobic sludge. However, there are many system parameters that influence this production method. In this study the impact on the enhancement of batch granule production using different carbon (lactate, glucose and sucrose) and nitrogen (peptone, urea and ammonium sulphate) sources and concentrations, was evaluated. Different combinations of carbon sources (lactate and glucose, lactate and fruit cocktail effluent, and glucose and fruit cocktail effluent) were also evaluated to determine a more economically viable combination to be used for granulation enhancement from sludge. Glucose, at a concentration of 2 g.l-1 was found to give the best enhancement of granule numbers after 10 days for the single carbon additions, followed by 10 g.l-1 lactate and 2 and 5 g.l-1 sucrose. Different nitrogen sources at various concentrations were found to be less critical for the enhancement of granules. A combination of 5 g.l-1 lactate + 1 g.l-1 glucose resulted in the best enhancement of granule numbers after 10 days when different carbon combinations were used. A concentration of 2 g.l-1 COD fruit cocktail effluent (FC), in combination with 2 g.l-1 glucose gave the best increase in granule numbers by day 10. The data showed that glucose could be used in combination with lactate for batch granule cultivation with the advantage of facilitating the stabilisation of the system. 4.2 Introduction The UASB reactor (Lettinga et al., 1980) has attracted the most research and commercial interests, and is the most extensively applied anaerobic treatment system (Weiland & Rozzi, 1991; Lettinga et al., 1997). This process depends on the upward movement of wastewater through a blanket of granules (Chynoweth, 1987). For the process to be able to operate at high loading rates and short retention times, the formation of compact sludge granules, are essential (Alphenaar et al., 1994; Schmidt & Ahring, 1995).
It has been reported (Marchaim & Krause, 1993) that when a digester is put under “stress” conditions, the first metabolites to appear after lactate (Eng et al., 1986) are propionic and acetic acid. Hydrogen (Hickey & Switzenbaum, 1991) can be detected simultaneously in the gas phase (Myburg & Britz, 1993). Based on the above characteristics, Britz et al. (1999) showed that granules can be produced outside the bioreactor in batch systems and, that by applying "stress", conditions can be induced that enhances the granulation process. The “environmental stress” conditions can include differences in carbon sources and concentrations, organic overloading, increases in the operational hydrogen pressure, changes in the C:N:P ratio’s, or the addition of cysteine (Moosbrugger et al., 1992; Myburg & Britz, 1993; Riedel & Britz, 1993).
The aims of this study were, firstly, to investigate the influence of different carbon and nitrogen sources on granule enhancement in a batch system and, secondly, to determine which growth medium would be the most economical in terms of granule count increase.

25
4.3 Materials and methods Batch granule production A linear-shake waterbath was used, at 120 rpm, to cultivate the granules in a batch system at 35C. Each 500 ml container was filled with 100 ml raw anaerobic sludge (Athlone Waterworks) and 350 ml growth medium. For a period of 14 d, a 100 ml of the top volume of each container was replaced daily with a 100 ml sterile growth medium so as to simulate UASB operational parameters and organic overloading (Britz et al., 1999; Britz et al., 2000). The pH values were determined daily and granule numbers were counted on days 0, 5, 10 and 14.
A basic growth medium (g.l-1)(Lactic acid, 20; Yeast extract, 5; Peptone, 2; KH2PO4,
10; Tween 80, 1 ml; Trace elements (Nel et al., 1985), 10 ml; pH = 7.0) was used for the first phase of this study, with the carbon or nitrogen (Table 4.1) component being varied, as well as the concentration of the component. In the second phase of the study, the basic growth medium was again used, but combinations of the different carbon sources (Table 4.2) were used as carbon source. The fruit cocktail effluent that was added to the sludge was a mixture of peach and pear wash water obtained as a specific effluent stream from Ashton Canning Company (Pty) Ltd, and diluted to the required COD (Table 4.2). All studies were done in triplicate. Analytical procedures
The following parameters were monitored: pH; COD; Total Solids (TS); Volatile Solids (VS) and Total Non-Volatile Solids (TNVS) (APHA, 1992). Table 4.1. Concentrations of different carbon and nitrogen sources used for batch
granule cultivation. Carbon Source Concentrations (g.l-1) Lactic Acid [Saarchem] 5; 10; 20; 30 Glucose [BDH] 2; 5; 10 Sucrose [Merck] 2; 5; 10 Nitrogen Source Concentrations (g.l-1) Peptone [Biolab] 1; 2; 5 Urea [Labchem] 1; 2; 5 Ammonium Sulphate [BDH] 1; 2; 5

26
Table 4.2. Different combinations of carbon sources used in the study. Carbon Sources Combinations (g.l-1) Single: Lactate 10 Glucose 2 Fruit cocktail effluent 2 g.l-1 COD Fruit cocktail effluent 3 g.l-1 COD Combinations: Lactate + Glucose 10 + 2
5 + 1 5 + 2 5 + 5
Lactate + Fruit cocktail effluent 10 + 2 g.l-1 COD 5 + 2 g.l-1 COD Glucose + Fruit cocktail effluent 5 + 2 g.l-1 COD 2 + 2 g.l-1 COD Granule counts
Each granule sample (500 l for day 0, and 250 l for days 5, 10 and 14) was fixed in a petridish using gelatine (2 g.100 ml-1) (Jeison & Chamy, 1998). Ten images (6 mm by 10 mm) of each sample were scanned into a desktop computer using the Matrox Intellicam Interactive (ver. 2.0) frame-grabber software (Matrox Electronic Systems Ltd) and a Nikon Microscope fitted with a Panasonic CP410 Digital Video Camera. The images were analysed using the Scion Image software (release Beta 3b) (Scion Corporation, Maryland, USA). 4.4 Results and discussion pH profiles during the batch granule culturing using different carbon sources The pH of each batch system was monitored as an indicator of metabolic productivity at the start and during the incubation period. It was found that the pH of each carbon source unit dropped drastically during the first day of incubation at 35C. This was expected due to the high VFA formation from the carbon sources in spite of the high buffering capacity (10 g.l-1 KH2PO4). After the initial 24 to 48 h period, the pH slightly increased for the different lactate concentrations, as well as for the 5 g glucose and the 2 and 5 g sucrose units.
The 2 and 5 g glucose units stabilised at pH values between 6.0 and 6.6, and for the 2 and 5 g sucrose units, the pH slowly dropped to between 5.9 and 6.5. The 2 g.l-1 glucose and 2 g.l-1 sucrose units showed stabilisation at a higher pH when compared with the units where either 5 g.l-1 glucose or 5 g.l-1 sucrose had been added. Less organic acids were probably produced at the lower concentrations, resulting in the pH stabilising at a higher level.

27
For the units where either 10 g.l-1 glucose or 10 g.l-1 sucrose had been added, the pH dropped to 5.0 or lower. A recovery in pH was only observed after 4 to 5 and 4 to 6 days, respectively for the 10 g.l-1 glucose and 10 g.l-1 sucrose units. The pH of these units showed a short period of stabilisation after which they acidified, and the whole system failed. In anaerobic bioreactors it is well known that the acidogens and the methanogens are pH sensitive with the optimum pH range around 6.5 to 7.3 (Zeikus, 1977; Forday & Greenfield, 1983).
The data obtained in this study on pH changes with different carbon sources confirms the data of Britz et al. (1999) that a sudden increase in readily degradable substrate leads to a rapid pH drop, and subsequent pH recovery and stabilisation. This, in turn, leads to a shift in population dynamics which probably gives the acid tolerant species a competitive advantage for a while, which could then lead to the formation of ECP as an alternative hydrogen sink mechanism. The ECP may probably contribute to bacterial aggregation and the eventual formation of granules (Forster, 1991; Slobodkin & Verstraete, 1993).
Granule formation with different carbon sources
The granule count data (Figure 4.1) from this study corresponds to the hypothesis of Britz et al. (2000). In this study it was found that over the first 5 to 10 days, the number of granules increased for all three-carbon sources (lactate, glucose and sucrose, at the different concentrations) with a decrease in number of granules in all cases by day 14. The clumping phenomenon probably led to the aggregation of essential bacteria to form larger nuclei and, thereafter, a drop in granule numbers was observed. The nuclei will then continue to grow in size as bacteria proliferate and aggregate (Fang, 1997) resulting in larger, but lower numbers of granules. The data obtained when different concentrations of carbon sources were used all showed the characteristic increase in granule counts during the first 10 days. However, it was found that a concentration of 2 g.l-1 glucose as main carbon source, resulted in the highest increase in granule numbers by day 10, followed by 10 g.l-1 lactate and 2 and 5 g.l-1 sucrose. During this study, a large variation in granule count increase was observed between the lactate units and the units where either glucose or sucrose was added. This was ascribed to the fact that a different sludge batch had to be used for the different units and it was found that the characteristics of the sludge differed with every batch, making it very difficult to compare different batches and to couple a kinetic value to granule increases. pH profiles during the batch granule culturing using different nitrogen sources
Sam-Soon et al. (1990) reported that a suitable nitrogen source is a prerequisite for granule formation. They recommended nitrogen in the free and saline ammonia (NH3-N) form, and stated that the concentration must be well in excess of metabolite requirements of the anaerobic organisms. The pH changes in this study, with different nitrogen sources were not as distinctive as the pH changes when the three different carbon sources, with 2 g peptone in the growth medium, were evaluated. Where 1 g and 5 g peptone had been added to the basic medium (Table 4.1), the pH showed a similar fast drop, to 6.7 and 6.5 respectively, but no subsequent stabilisation. In fact, after an extended incubation time for the 5 g peptone batch system, it was found that the system totally acidified. The higher organic nitrogen loading could possibly have stimulated the growth of the acidogenic bacteria and thus more VFA’s could have been produced, causing the system to acidify.
In the units where urea was used in the basic growth medium the pH gradually decreased until day 14. In the batch system where the nitrogen source had been replaced with ammonium sulphate showed an increase in pH during the first two days where after the pH stabilised in the range of 6.9 to 7.0.

28
Lactate
Incubation Time (d)
0 1 2 3 4 5 6 7 8 9 10 11 12 13 14
Nu
mb
er o
f G
ran
ule
s (p
er 1
0 m
l)
0
20000
40000
60000
80000
100000
120000
140000
160000
180000
5 g10 g20 g30 g
Glucose
Incubation Time (d)
0 1 2 3 4 5 6 7 8 9 10 11 12 13 14
Nu
mb
er o
f G
ran
ule
s (p
er 1
0 m
l)
0
20000
40000
60000
80000
100000
120000
140000
160000
180000
2 g5 g10 g
Sucrose
Incubation Time (d)
0 1 2 3 4 5 6 7 8 9 10 11 12 13 14
Nu
mb
er o
f G
ran
ule
s (p
er 1
0 m
l)
0
20000
40000
60000
80000
100000
120000
140000
160000
180000
2 g5 g10 g
A
C
B
Figure 4.1. Granule counts using various carbon sources at different concentrations (2, 5 and 10 g) in the basic growth medium during the batch cultivation (triplicate values). The standard deviation was used as the error-bar length.

29
Granule formation with different nitrogen sources A different batch of sludge, obtained from the same local sewage works, was used for the studies with the different nitrogen sources. All the units where urea (Figure 4.2) was used as sole nitrogen source resulted, on average, in the highest granule count increases after 10 days, with little variation between the three different concentrations. However, the error-bars show variation between the triplicates of each concentration. The data also showed that urea, at a concentration of 5 g.l-1, gave the highest increase in granule counts by day 10.
Peptone at the lower concentrations (1 and 2 g.l-1) showed little difference in granule counts after 10 days. As for ammonium sulphate, a concentration of 1 g.l-1 resulted in the highest granule count increase over the first 10 days.
The growth medium used for the 20 g.l-1 lactate units (Figure 4.1) in the study where different carbon sources were evaluated, and the 2 g.l-1 peptone (Figure 4.2) batch units evaluated in this study, are of the same composition. It was, therefore, expected that both the pH profiles and the granule counts would be similar. Even though the pH profiles were very similar, there was a distinct difference between the granule numbers obtained in the two units. The only variable was the raw anaerobic sludge obtained from Athlone Waterworks. The higher granule counts with the different nitrogen sources was thus attributed to the different batches of sludge used. pH profiles during the batch granule culturing using different combinations of carbon sources Data from the first study showed that a carbon concentration of either 10 g.l-1 lactate or 2 g.l-1 glucose in the basic growth medium resulted in the best granule enhancement by day 10. These two concentrations were again evaluated during the second phase of the study. In addition, different combinations of these two carbon sources (10 g lactate + 2 g glucose; 5 g lactate + 1 g glucose; 5 g lactate + 2 g glucose and 5 g lactate + 5 g glucose) (Table 4.2) were also evaluated. When lactate is used in combination with glucose, less lactate will be required. This should lower the final costs of the carbon source, as glucose is cheaper than lactate. The use of fruit cocktail effluent (FC) as major carbon source, and in combination with either lactate or glucose, was also examined. The fruit cocktail effluent can be collected free of charge from a local canning factory, and meets all the requirements for a cheap and easily fermentable carbon source.
In terms of pH, the characteristic drop in pH during the first 24 h period was observed, where after the pH stabilised. The pH range where stabilisation was reached for both the 10 g lactate unit and the 2 g glucose unit are similar to the results obtained in the first study. The stabilisation pH was in the range of 6.6 and 6.4 respectively, and was reached after 48 h of incubation. The pH profile for the units with only FC showed stabilisation after 3 days. At a concentration of 3 g.l-1 COD FC, the pH stabilised in the range of 6.2 - 6.3, whereas stabilisation was reached in the range of 6.3 to 6.4 for the 2 g.l-1 COD FC unit. Fruit cocktail effluent is a waste product produced by the fruit canning industry (Trnovec & Britz, 1998). Except for transportation costs during the collection of the effluent, this easily fermentable carbon source can be collected free of charge during the canning season. The economics involved in the batch cultivation process was, therefore, the reason for investigating the usefulness of this carbon source.
Both combinations of lactate and fruit cocktail effluent (10 g lactate + 2 g.l-1 COD FC and 5 g lactate + 2 g.l-1 COD FC) were found to stabilise in a pH range of 6.4 and 6.5. As was the case with lactate as major carbon source, it was concluded that any concentration of lactate, in combination with 2 g.l-1 COD FC, would lead to a stable system.

30
Peptone
Incubation Time (d)
0 1 2 3 4 5 6 7 8 9 10 11 12 13 14
Nu
mb
er o
f G
ran
ule
s (p
er 1
0 m
l)
0
50000
100000
150000
200000
250000
300000
350000
400000
450000
500000
550000
600000
650000
1 g 2 g 5 g
Urea
Incubation Time (d)
0 1 2 3 4 5 6 7 8 9 10 11 12 13 14
Nu
mb
er o
f G
ran
ule
s (p
er 1
0 m
l)
0
50000
100000
150000
200000
250000
300000
350000
400000
450000
500000
550000
600000
650000
1 g 2 g 5 g
Ammonium Sulphate
Incubation Time (d)
0 1 2 3 4 5 6 7 8 9 10 11 12 13 14
Nu
mb
er o
f G
ran
ule
s (p
er 1
0 m
l)
0
50000
100000
150000
200000
250000
300000
350000
400000
450000
500000
550000
600000
650000
1 g 2 g 5 g
A
B
C
Figure 4.2 Granule counts using various nitrogen sources at different concentrations (1, 2 and 5 g) during the batch cultivation of granules (triplicate values). The standard deviation was used as the error-bar length.

31
Granule formation with different combinations of carbon sources The raw anaerobic sludge used for this phase was also a new batch obtained from the Athlone Waterworks. The sludge used for the lactate and glucose-combinations differed from the sludge used when FC was combined with another carbon source and this variation in sludge makes granule enhancement comparisons very difficult. The 10 g lactate units (Figure 4.3) as well as the 2 g glucose units gave higher granule counts after 10 days when compared to the units of the first phase of this study (Figure 4.1). The reason for this was probably the different sludge batches used during the different phases.
Both the 10 g lactate + 2 g glucose units and the 5 g lactate + 1 g glucose units resulted in similar increases in granule numbers. The granule count results for the 5 g lactate + 2 g glucose units showed an increase in granule counts, however, some variation occurred between the triplicate units. Even though a combination of 5 g lactate + 5 g glucose gave the highest granule counts at day 10, the pH of this unit dropped to pH <4.5, much lower than the survival range for the methanogens and propionic acid producing bacteria (Zeikus, 1977).
The use of FC as the only carbon source was not as successful as when used in combination with either lactate or glucose in terms of granule counts. A higher concentration of 3 g.l-1 COD FC resulted in higher granule counts after 10 days of incubation (Figure 4.4) when compared with the 2 g.l-1 COD FC. Where lactate was used in combination with FC, the results of the 10 g lactate + 2 g.l-1 COD FC and the 5 g lactate + 2 g.l-1 COD FC were very similar. In contrast to the units where 5 g glucose had been added to the 2 g.l-1 COD FC, the granule counts were disappointingly low. However, low counts were always found with the units that ended in acidification as in this case. The data showed that the best carbon source to use in combination with the fruit cocktail effluent proved to be glucose at a concentration of 2 g.l-1 (Figure 4.4). It must be noted that the pH drop of this combination might be slightly too low to prevent the loss or inhibition of at least some of the very important methanogens and acidogens.
Chang et al. (1995) reported that granules could not be formed at an acidic pH of 6.0 and concluded that a pH of 7.0 may still be too low for granule formation. In this study, however, it was found that granule formation at pH levels well below 7.0 was still achievable. A higher buffer concentration may possibly be enough to prevent the pH from dropping too low. A combination of 2 g glucose + 2 g.l-1 COD FC gave the highest granule counts after 10 days of incubation at 35C for the carbon combination. From an economic point of view, the lower glucose concentration in combination with the FC, which can be collected free of charge, is also acceptable. Granule enhancement with standardised raw sludge inoculum A major problem encountered in this study was the large variation in the raw sludge inoculum characteristics making a direct comparison between the granule enhancements obtained with the different carbon and nitrogen sources extremely difficult. These characteristics are given in Table 4.3. From the data it is thus clear that there were major variations between the different sludge batches, and this was the major cause of the varying granule counts at day 0 obtained for the different phases of this study. It was concluded in the previous sections that the varying nitrogen sources play a minor role in batch granule enhancement. It was, therefore, decided that the influence of only the best carbon source, and carbon source combinations in terms of granule enhancement, must be evaluated in an effort to standardise the raw sludge used as inoculum.
As part of the standardisation, a sieve (Endecotts Ltd) with 1 mm pore size was used to remove non-degradable material. The ‘uniform’ sludge was then centrifuged and the supernatant removed. The sludge, at a TS concentration of 0.159 g.10 g-1, was used as inoculum for the standardise action.

32
10 g Lactate
Incubation Time (d)
0 1 2 3 4 5 6 7 8 9 10 11 12 13 14
Nu
mb
er o
f G
ran
ule
s (p
er 1
0 m
l)
0
50000
100000
150000
200000
250000
300000
350000
400000
450000
123
2 g Glucose
Incubation Time (d)
0 1 2 3 4 5 6 7 8 9 10 11 12 13 14
Nu
mb
er o
f G
ran
uel
s (p
er 1
0 m
l)
0
50000
100000
150000
200000
250000
300000
350000
400000
450000
123
10 g Lac + 2 g Glu
Incubation Time (d)
0 1 2 3 4 5 6 7 8 9 10 11 12 13 14
Nu
mb
er o
f G
ran
ule
s (p
er 1
0 m
l)
0
50000
100000
150000
200000
250000
300000
350000
400000
450000
123
5 g Lac + 1 g Glu
Incubation Time (d)
0 1 2 3 4 5 6 7 8 9 10 11 12 13 14
Nu
mb
er o
f G
ran
ule
s (p
er 1
0 m
l)
0
50000
100000
150000
200000
250000
300000
350000
400000
450000
123
5 g Lac + 2 g Glu
Incubation Time (d)
0 1 2 3 4 5 6 7 8 9 10 11 12 13 14
Nu
mb
er o
f G
ran
ule
s (p
er 1
0 m
l)
0
50000
100000
150000
200000
250000
300000
350000
400000
450000
123
5 g Lac + 5 g Glu
Incubation Time (d)
0 1 2 3 4 5 6 7 8 9 10 11 12 13 14
Nu
mb
er o
f G
ran
ule
s (p
er 1
0 m
l)
0
50000
100000
150000
200000
250000
300000
350000
400000
450000
123
A B
C D
E F
Figure 4.3. Granule counts using different combinations of lactate (Lac) and glucose (Glu) as carbon sources in the basic growth medium, during the batch cultivation (triplicate samples). The standard deviation was used as the error-bar length.

33
3 g FC
Incubation Time (d)
0 1 2 3 4 5 6 7 8 9 10 11 12 13 14
Nu
mb
er o
f G
ran
ule
s (p
er 1
0 m
l)
0
10000
20000
30000
40000
50000
60000
70000
80000
90000
100000
123
2 g FC
Incubation Time (d)
0 1 2 3 4 5 6 7 8 9 10 11 12 13 14
Nu
mb
er o
f G
ran
ule
s (p
er 1
0 m
l)
0
10000
20000
30000
40000
50000
60000
70000
80000
90000
100000
123
10 g Lac + 2 g FC
Incubation Time (d)
0 1 2 3 4 5 6 7 8 9 10 11 12 13 14
Nu
mb
er o
f G
ran
ule
s (p
er 1
0 m
l)
0
10000
20000
30000
40000
50000
60000
70000
80000
90000
100000
123
5 g Lac + 2 g FC
Incubation Time (d)
0 1 2 3 4 5 6 7 8 9 10 11 12 13 14
Nu
mb
er o
f G
ran
ule
s (p
er 1
0 m
l)
0
10000
20000
30000
40000
50000
60000
70000
80000
90000
100000
123
5 g Glu + 2 g FC
Incubation Time (d)
0 1 2 3 4 5 6 7 8 9 10 11 12 13 14
Nu
mb
er o
f G
ran
ule
s (p
er 1
0 m
l)
0
10000
20000
30000
40000
50000
60000
70000
80000
90000
100000
123
2 g Glu + 2 g FC
Incubation Time (d)
0 1 2 3 4 5 6 7 8 9 10 11 12 13 14
Nu
mb
er o
f G
ran
ule
s (p
er 1
0 m
l)
0
10000
20000
30000
40000
50000
60000
70000
80000
90000
100000
123
A B
C D
E F
Figure 4.4. Granule counts with different combinations of lactate (Lac), glucose (Glu) and fruit cocktail effluent (FC) as carbon sources in the basic growth medium, during the batch cultivation (triplicate samples). The standard deviation was used as the error-bar length.

34
The data summarised in Figure 4.5 represent the pH profiles obtained with the standardised sludge inoculum and the different carbon sources (10 g lactate; 2 g glucose; 5 g lactate + 2 g glucose; 5 g lactate + 2 g.l-1 COD FC and 2 g glucose + 2 g.l-1 COD FC). All the units showed the characteristic pH drop with the subsequent recovery. The units that included lactate as carbon source were again found to stabilise at a higher pH than the system with glucose. The 10 g.l-1 lactate unit stabilised at a pH of 6.8, the 5 g lactate + 2 g glucose combination stabilised between 6.6 and 6.7, and the units with 5 g lactate + 2 g.l-1
COD FC, stabilised at a pH of 6.8. The 2 g.l-1 glucose unit stabilised at a pH of 6.5, whereas stabilisation was reached at a pH of 6.3 for the 2 g glucose + 2 g.l-1 COD FC combinations. The results compare well with the results obtained in the first phase of this study (Figure 4.3) where unstandardised sludge was used as inoculum. The unit with 2 g.l-1 glucose (Figure 4.5) generated the highest increase in granule counts by day 10. A carbon source concentration of 10 g lactate resulted in just a slightly lower increase in granule counts. A combination of 5 g lactate + 2 g glucose was found to give the best carbon combination, followed by 5 g lactate + 2 g.l-1 COD FC and lastly, 2 g glucose + 2 g.l-1 COD FC. As mentioned in the previous section, lactate, as a carbon source, is much more expensive than glucose. It would therefore be advisable, in economical terms, to use 2 g.l-1 glucose for the batch cultivation of granules. If the lower pH is found to be a problem, a low concentration of lactate (5 g.l-1) can be added to the growth medium so as to stabilise the system. Efficiency of granule formation using different carbon sources As the process of batch granule cultivation is scaled up, the economics involved will become more critical. Even though lactate leads to stable units, this carbon source is very expensive, and therefore, other, cheaper carbon sources are needed to ensure the viability of the process. Each sucrose molecule (C12H22O11) contains 12 carbons (C), glucose (C6H12O6) has 6 C and lactate (C3H5O3Na) only 3 C per molecule (Zubay, 1993). It is thus clear that for the same concentration (in g.l-1), sucrose has four times more C than an equivalent concentration of lactate, and glucose has twice the amount of C per gram compared to lactate. It can, therefore, be assumed that high concentrations of sucrose and Table 4.3 The characteristics (g.10 g-1) (average of triplicates) of the different batches of
raw sludge used as inoculum in the different experimental studies. Study pH TS VS TNVS Lactate 7.20 0.069 0.178 0.124 Glucose; Sucrose 7.09 0.058 0.196 0.066 Peptone; Urea 7.30 0.031 0.023 0.008 Ammonium sulphate 7.09 0.064 0.044 0.020 Lactate and Glucose 6.95 0.075 0.057 0.018 Lactate/Glucose + FC 7.05 0.075 0.057 0.018 Standardised inoculum 6.93 0.159 0.133 0.026

35
Incubation Time (d)
-1 0 1 2 3 4 5 6 7 8 9 10 11 12 13 14
pH
5.9
6.0
6.1
6.2
6.3
6.4
6.5
6.6
6.7
6.8
6.9
7.0
7.1
10 g Lactate2 g Glucose
Incubation Time (d)
-1 0 1 2 3 4 5 6 7 8 9 10 11 12 13 14
pH
5.9
6.0
6.1
6.2
6.3
6.4
6.5
6.6
6.7
6.8
6.9
7.0
7.1
5 g Lac + 2 g Glu5 g Lac + 2 g FC2 g Glu + 2 g FC
A
Incubation Time (d)
0 1 2 3 4 5 6 7 8 9 10 11 12 13 14
Nu
mb
er o
f G
ran
ule
s (p
er 1
0 m
l)
0
100000
200000
300000
400000
500000
600000
700000
10 g Lactate2 g Glucose
Incubation Time (d)
0 1 2 3 4 5 6 7 8 9 10 11 12 13 14
Nu
mb
er o
f G
ran
ule
s (p
er 1
0 m
l)
0
100000
200000
300000
400000
500000
600000
700000
5 g Lac : 2 g Glu5 g Lac : 2 g FC2 g Glu : 2 g FC
B
C D
Figure. 4.5. pH profiles and granule counts (triplicate samples) with different carbon sources using a standardised inoculum. (Lac = Lactate; Glu = Glucose; FC = Fruit cocktail effluent).

36
glucose would lead to the acidification of a batch culturing system due to the abundance of easily degradable carbon sources in the growth medium. It can be argued that the higher C concentration of glucose and sucrose would result in lower concentrations required to obtain the same impact on granule enhancement. In terms of the economics of setting up a batch cultivation system, glucose would probably be the cheapest carbon source.
In the case of the economics of using glucose, 1 g of C amounts to 17c, sucrose 19c per 1 g C, while lactate, very expensively, amounts to 138c per 1 g C (prices as quoted by Merck in South African currency, October 2000). In contrast, fruit cocktail effluent can be obtained free of charge during the canning season. Transportation costs would, therefore, be the only expense involved in obtaining the effluent. Fruit cocktail effluent, as major carbon source, or in combination with a low concentration of glucose will, therefore, be the cheapest carbon source available for the batch production of UASB-granules. Furthermore, by using fruit cocktail effluent as a carbon source for the production of granules, wastewater from a cannery is being utilised, thereby creating another option for the ‘treatment’ of such waste products. It was also evident from the data that a standardised sludge gives more comparable results, making use of standardised inoculum a necessary precaution for evaluating different granule enhancement parameters. A sludge inoculum with higher TS should also give a better enhancement as the inoculum contains less water and more biomass. 4.5 Conclusions The method most commonly used for the cultivation of granules is UASB culturing (Lettinga & Hulshoff Pol, 1991) where sludge is used as the sludge blanket and the strong upward movement eventually leads to the formation of granules. This process when starting from raw sludge inoculum, even though very efficient, can take from several months to up to a year before an efficient granule bed is formed.
Mass culturing of granules according to the method used in this study drastically shortens the ‘culturing-time’. The advantages of mass culturing are therefore self-explanatory if the time factor is considered. Rapid cultivation of granules will result in shortened start-up times for UASB bioreactors, and will lead to the installation of more reactors.
In this study, it was evident that different growth media does influence the enhancement of granulation in a batch system. It was, however, evident that the carbon source had a more pronounced impact on granule enhancement than changes in the nitrogen source.
The data from this study also showed that 2 g.l-1 glucose gave the best granule enhancement, followed by 10 g.l-1 lactate, and 2 and 5 g.l-1 sucrose. With the exception of lactate, it was found that too high concentrations of fermentable carbons would, in a short time, lead to the acidification of the system. Similarly, it was found that when fruit cocktail effluent was used, care must be taken not to overload the growth medium with a too high concentration of fermentable compounds.
The results on granule enhancement obtained in the study with the three different nitrogen sources were not as clear-cut as those obtained with the carbon sources. Urea, at all three concentrations did, however, lead to the best granule enhancement. This was followed by 1 g.l-1 ammonium sulphate and 2 g.l-1 peptone, which resulted in the third best granule enhancement. A drawback in the use of ammonium sulphate as major nitrogen source is the production of H2S-gas. However, if the wastewater to be treated contains large amounts of sulphate, it might be advisable to use ammonium sulphate as the nitrogen source during batch granule cultivation of an inoculum for the UASB. This should give the sulphate-utilising bacteria an advantage of being incorporated within the batch-cultivated granules.

37
A major problem encountered during the study was sludge standardisation. The sludge inoculums used for these studies were obtained from a local sewage works at different times over a period of a year. The sludge used for the different carbon sources differed from the sludge used for the nitrogen sources, which in turn differed form the sludge used for the different combinations of carbon sources. It was, therefore, inevitable that final products of the batch granule enhancement were of varying quality. Sewage sludge is a biological system, and the composition will, therefore, differ from day to day. It is clear that a need exists for a method to standardise the raw anaerobic sludge that is to be used as inoculum for batch granule cultivation.
If this problem could be overcome, the comparison between different batch granule cultivating units would be more feasible, and granule number increases would be more meaningful. Some researchers have used volatile solids (VS) and total solids (TS) of the inoculum as a means of standardisation (Ahring & Schmidt, 1992). The problem with these determinations is that the number of granules cannot be determined in this way, but rather the solids content of the total biomass of the inoculum. Total and volatile solid determinations at the end of the incubation time still do not give an indication of granule enhancement in terms of numbers of granules. By determining the TS and VS of each unit after the 14 day incubation period, the TS and VS of the total biomass of the unit is being determined, be it granules, some unutilised carbons in the growth medium or even loose microbial cells.

38
CHAPTER 5
IMPACT OF DIFFERENT PRESERVATION TECHNIQUES ON THE STORAGE POTENTIAL AND METHANOGENIC ACTIVITY OF GRANULAR SLUDGE
5.1 Summary The level of activity of the methanogenic population in granules is especially important when determining the efficiency of a bioreactor, as methane is the main metabolic end-product of an anaerobic digestion system. The methanogens are perhaps the most important group in the microbial consortium found in an UASB. Their availability and activity after preservation are, therefore, of crucial importance for the optimal efficiency of a bioreactor. Thus, six different preservation techniques (room temperature storage; vacuum-drying; freeze-drying; vacuum freeze-drying; freeze storage and cold storage) were evaluated in terms of storage potential and the retainment of biogas and methanogenic activity. The activity data is given as cumulative gas production values (CGP), and as the gradient over time [(CGP10 h - CGP5
h)/(t10 h - t5 h)]. Freeze-drying showed the highest activity for the first 90 days of storage, followed by vacuum freeze-drying and vacuum-drying. Room temperature preservation only showed an increase in activity by day 120. There can only be speculated regarding the reason for the sudden increase in activity at this time. It was found that the most activity was shown by 10 h of incubation, and it is, therefore, suggested that when activity testing are performed for evaluation purposes, the incubation time should be reduced to only 10 h. Further suggestions when performing activity tests include that the basic test medium (BTM) be only enriched with an additional 2 g.l-1 glucose, as lactate and acetic acid play no decisive role in determining the level of activity of the granules. 5.2 Introduction The UASB process has become a reliable technology for the treatment of various wastewaters. The success of this process relies heavily on the formation of granules with high settleability and bioactivity abilities (Fang et al., 1995; Yükselen, 1997). Quantitative research on the preservation characteristics of granular sludge in terms of storage temperature and storage period is necessary when the UASB reactor is to be considered for use in industries operating seasonally or intermittently (Shin et al., 1993; Yükselen, 1997).
Optimum storage conditions of methanogenic granules must be established in order to maintain the anaerobic metabolic activity and the stability of the granular sludge as long a possible. According to Wu et al. (1995), the granule configuration of the granular sludge can be maintained for a long time (over 3 years) without feed under suitable environmental conditions. Factors that are known to influence the anaerobic metabolic activity of stored granules are (Hungate, 1969; Jain et al., 1991) exposure to air, storage period and storage temperature. Oxygen is inhibitory to anaerobic bacteria, especially the methanogens and acetogens (Jain et al., 1991). However, Kato et al. (1993a, b) found that methanogenic granules had a much higher tolerance to oxygen inhibition than pure anaerobic microbial cultures due to the great number of facultative and aerobic bacteria present in the granules (Wu et al., 1995). These aerobic and facultative bacteria rapidly consume the oxygen, reduce the redox potential and protect the anaerobic bacteria from oxygen inhibition. Yükselen (1997) found that UASB sludge has good microbial and physiochemical preservation characteristics, but some researchers have reported sudden disintegration of granules without any obvious reason (Schmidt & Ahring, 1996).
The measurement of the methanogenic activity of anaerobic sludge is important as a means of calibrating the potential of converting soluble substrates to CH4 and CO2. This activity parameter makes it possible to determine the optimum organic loading rate for a faster and more reliable start-up. Activity testing can also be used as routine analysis for

39
quantifying the granular sludge methanogenic activity and to detect any kind of inhibition after a long period of reactor operation (James et al., 1990; Switzenbaum et al., 1990). Activity tests can also be used for the characterisation of biomass prior to use as inoculum for the start-up of a new bioreactor, and thereby determining it’s potential as an inoculum for a specific process (De Zeeuw, 1984). The aim of this study was to determine the impact of six different preservation techniques on the methanogenic activity and storage potential of batch cultivated granular sludge. 5.3 Materials and methods Batch granule cultivation
A roller-table at 70 rpm was used to cultivate the granules on a larger scale with a 25-litre cultivation container rotating at a speed of 8.5 rpm at 35C. The container was filled with 3-litre raw secondary anaerobic sludge obtained form the Athlone Waterworks, and 15-litre growth medium. The growth medium consisted of a combination of apricot canning effluent (RFF Foods (Pty) Ltd) at a COD of 2 g.l-1, and 0.5 g.l-1 each of urea and KH2PO4. Daily, for a period of 30 days, 3-litre liquid was removed and replaced with 3-litre fresh, sterile growth medium at a pH of 7.0. pH values were determined daily. Granule preservation
Glass vials with a volume of 20 ml were used for the storage of the granular sludge and each vial was filled with a 3 g sample of the batch produced granular sludge. Six different preservation techniques were used and included:
I room temperature storage at 25C (R); II vacuum-drying (Heraeus vacuum oven) at room temperature and room
temperature storage at 25C (VD); III freeze-drying (Heto CT 60e Freeze Dryer) with storage at 4C (FD); IV freeze-drying (Edwards lyophilizer) and sealing under vacuum and storage at
25C (VFD); V freeze storage at -18C (F); and VI cold storage at 4C (C).
All the vials were sealed with butyl stoppers and aluminium caps. Activity testing
The activity of the preserved granular sludge was determined at days 0, 30, 60, 90 and 120. The samples were activated at 35C with a sterile medium (pH 7.0) containing 1 g.l-1 glucose and 0.5 g.l-1 each of urea and KH2PO4. The basic test medium (BTM) (Valcke & Verstraete, 1993) as well as one of the different test media (Table 5.1) was added to the vials and incubated at 35C in triplicate. Biogas-production readings were taken after 5, 10 and 25 hours of incubation using a gas-tight syringe equipped with a 26 gauge needle (Owen et al., 1979). 5.4 Results and discussion Batch granule cultivation Granular sludge was cultivated as previously described. During the batch cultivation the pH profile showed the characteristic drop in pH, with the subsequent stabilisation. As in the previous study, stabilisation was reached at a pH range between 6.3 and 6.4.

40
Table 5.1. Different test media and the specific microbial group enhanced. Test media* Bacterial group Control (only BTM) 1 g.l-1 Glucose [BDH] Acidogens 2 g.l-1 Glucose [BDH] Acidogens 4 g.l-1 Lactic acid [Saarchem] Lactate utilisers 1 g.l-1 Acetic acid [B&M Scientific] Methanogens *The basic test medium (BTM) was used as basis for the different media. Activity testing Prior to the use of granules as inoculum in UASB reactors, it is important to determine the activity, and more specifically, the methanogenic activity of the granules. In this study six different preservation techniques (Table 5.2) were evaluated using the batch cultivated granular sludge as biomass source for activity test determinations. All tests were done in triplicate. The variables (storage time; test medium; preservation techniques; total biogas and methane produced) were evaluated in this study The cumulative biogas production was determined for each preservation technique with the different test media. The cumulative biogas and methane (CH4) data were then converted to represent the activity of the different techniques relative to each other. The activity of each preservation technique is, therefore, described in terms of the ‘rate of biogas and CH4 production’. The rate of gas production was determined using the gradient or slope [the cumulative gas production (CGP) over time for each of the time intervals (t = 5, 10 and 25 h)]. The gradient, for example, of 10 h was determined as follows:
(CGP10 h - CGP5 h)/(t10 h - t5 h).
The tempo of gas production (SB for biogas and SM for CH4) was thus given in ml.h-1 and was taken as representative of the activity of the granules. These values were then plotted against time for each preservation technique and carbon source evaluated to give a more visual representation of the activity of the stored granules. The basic plotted data (not shown) clearly showed that the most variation between the different storage periods, in terms of activity, occurred after 10 and 25 h of incubation. Only the data of these two incubation times were, therefore, used in the summary of the SB and SM. To simplify the comparisons and discussion, the large volume of data generated during the study are summarised in Figures 5.1 to 5.4.

41
Table 5.2. Preservation techniques and storage temperatures evaluated. Preservation technique Storage temperature Room temperature (R) 25C Vacuum-drying (VD) 25C Freeze-drying (FD) 4C Vacuum freeze-drying (VFD) 25C Frozen (F) -18C Cold storage (C) 4C Activity evaluation of the different preservation techniques In most cases it was found that when 2 g.l-1 glucose was added to the BTM, the data showed more measurable activity when the results are compared to those obtained where only 1 g.l-1 glucose was added to the BTM. Control – The BTM was used as the control medium to enable comparisons at a general level. From the data in Figure 5.1A, it is clear that the freeze-dried (FD) samples were more active in terms of SB, after both 10 and 25 h of incubation. When the methanogenic activity data (Figure 5.1B) is examined, the FD samples again showed the most activity after both 10 h and 25 h. It is, therefore, evident from the data obtained that the FD samples retained the best activity over the 120-day storage period at a general level where no specific microbial group was enhanced.
Vacuum freeze-drying (VFD), where the samples were freeze-dried and sealed under vacuum with storage at 25C, gave the next best results for both the SB and SM. The samples that were either cold stored (C) or stored at room temperature (R) showed no SB and SM activity after 10 h. The samples stored at room temperature (R) did, however, regain activity after 25 h of incubation, but only after a storage period of 90 days, and were then found to be the most active after 120 days of storage.
Samples frozen (F) at -18C showed very little activity in terms of SB (Figure 5.1A) and SM (Figure 5.1B). The vacuum-dried (VD) samples showed no activity in terms of SB and SM for the first 90 days of storage, but by day 120 a little biogas, as well as methane was, however, observed.
The order of SB activity for the control samples after 10 and 25 h and 120 days of storage were: R > VD > FD > VFD > F > C, and for SM activity, the ratings were: R > FD > VD > VFD > F = C.
The data indicates that the FD method leads to the best activity retainment when the granules are stored for relatively short periods of up to 60 to 90 days, whereas room temperature preservation (R) showed activity but only after 120 days of storage. In practice when granules are to be preserved from one season to the next, room temperature preservation after 120 days appears to be the best technique but the lack of activity up to 90 days when evaluating this technique is worrying. From the data it was clear that FD and VFD would result in the best microbial preservation for at least 90 days.

42
Storage Period (d)
0 30 60 90 120
SB (
ml.h
-1)
0.0
0.1
0.2
0.3
0.4
0.5
0.6
0.7
0.8
0.9
0 30 60 90 120
10 h 25 h
Storage Period (d)
0 30 60 90 120
SM (
ml.h
-1)
0.00
0.02
0.04
0.06
0.08
0.10
0.12
0.14
0.16
0.18
0 30 60 90 120
Room temperatureVacuum-dryingFreeze-dryingVacuum freeze-dryingFrozenCold storage
10 h 25 h B
A
Figure 5.1. Biogas (SB) (A) and methanogenic activity (SM) (B) after 10 and 25 h of
differently preserved granules over a 120 d storage period in the BTM (control).

43
Glucose as carbon source – Most acidogens are known to prefer carbon in the form of glucose and the addition of extra glucose (2 g.l-1) to the BTM should, therefore, lead to an enhancement of the activity of especially the acidogens. The use of this specific medium was thus to primarily test the activity of the acidogens, but if the methanogenic population is active, an increase in their activity should also be found. Freeze-drying (FD) as preservation technique again gave the highest biogas activity (SB) (0.86 ml.h-1) by day 60 (Figure 5.2A), as well as the highest methanogenic activity (0.17 ml.h-1) after 10 h (Figure 5.2B). After 25 h of incubation the FD technique still gave the highest methane activity for all the preservation techniques after 60 days of storage. It appears as if the room temperature (R) preservation technique led to an inhibition of the acidogens as it was found that biogas and CH4 were again only produced after 120 days of storage. An incubation time of 25 h did, however, lead to some biogas and CH4 activity. The order of biogas activity (SB) for the glucose samples after 10 and 25 h and 120 days of storage using the different preservation techniques and storage temperatures (Table 5.2) were: VFD > VD > FD > R > F > C and for the methanogenic activity (SM) after 10 h and 120 days of storage, the order was: VFD > FD > VD > R > F > C, with the SM after 25 h being VFD > VD > FD > R > F > C.
Overall, the data indicates that more activity was shown when 2 g.l-1 glucose was added to the BTM. It is thus evident that the added carbon does enhance the activity of the acidogens and that the acidogenic population in the preserved granules can be successfully re-activated after storage of up to 120 days.
Lactate as carbon source – The activity measured when 4 g.l-1 lactate as main carbon source was added to the BTM (Figure 5.3) was generally found to be much lower than the activity measured with the added 2 g.l-1 glucose (Figure 5.2). The reason for the lower activity is probably due to the fact that lactate is a very specific carbon source, which can only be metabolised by specific microbial groups. The FD samples again showed the most biogas and methane activity after 10 and 25 h of incubation but only up to day 90. After 120 days of storage and 25 h of incubation, however, the samples that were kept at room temperature (R) showed the most activity. The frozen (F) and cold stored (C) samples did not show activity after 10 h, and only the frozen (F) samples showed a slight sign of biogas and CH4 activity after the 25 h incubation period. The biogas and CH4 activity ratings for the lactate samples after 10 h and 120 days of storage were: FD > R > VD > VFD = F = C, and after 25 h the SB ratings were: R > FD > F > VD = VFD > C. The CH4 activity ratings measured after 25 h incubation were: R > FD > F > VFD = VD = C.
From the data in Figure 5.3 it is clear that freeze-drying and room temperature preservation are the best techniques for the activity retainment of the lactate-utilising bacteria. If the economics involved with the freeze-drying process are considered, room temperature storage of granules appears to be a more viable and practical preservation option.
The overall results obtained with just the BTM and the BTM with the added 4 g.l-1 lactate are very similar. This was to be expected seeing that the lactate enhances the activity of only a small portion of the microbial consortium present in the granules.
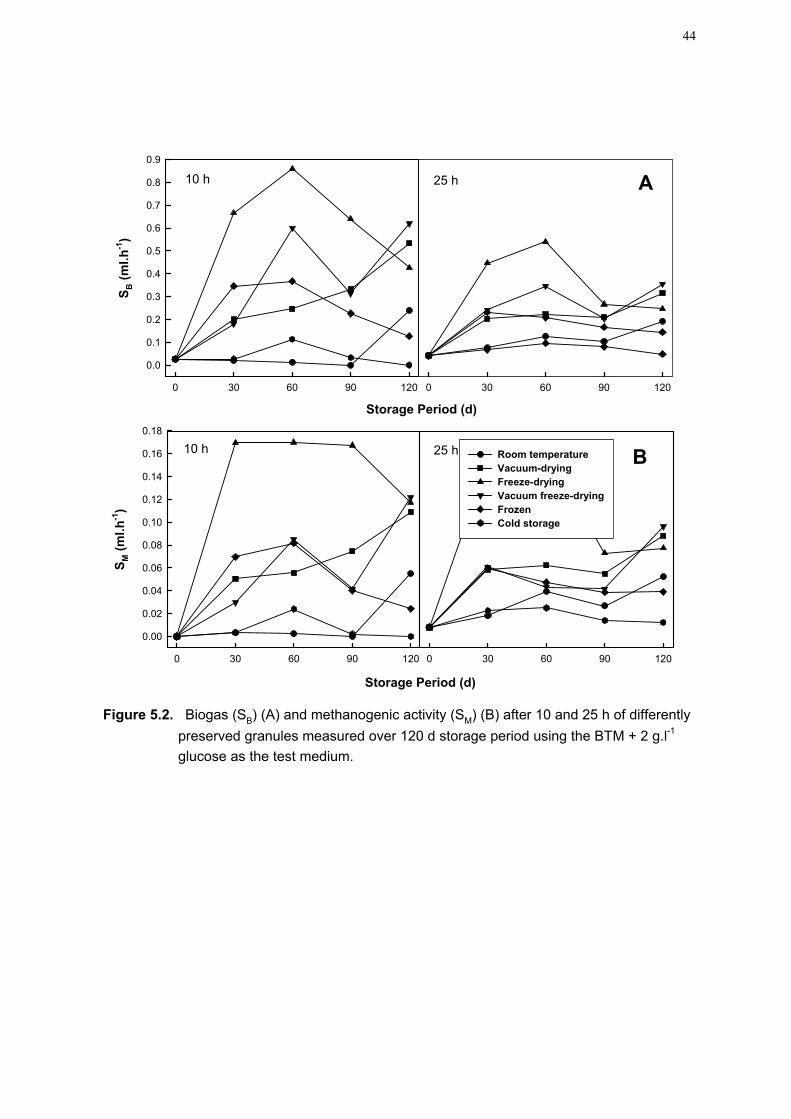
44
Storage Period (d)
0 30 60 90 120
SM (
ml.
h-1
)
0.00
0.02
0.04
0.06
0.08
0.10
0.12
0.14
0.16
0.18
0 30 60 90 120
Room temperatureVacuum-dryingFreeze-dryingVacuum freeze-dryingFrozenCold storage
10 h 25 h
Storage Period (d)
0 30 60 90 120
SB (
ml.
h-1
)
0.0
0.1
0.2
0.3
0.4
0.5
0.6
0.7
0.8
0.9
0 30 60 90 120
25 h10 h A
B
Figure 5.2. Biogas (SB) (A) and methanogenic activity (SM) (B) after 10 and 25 h of differently
preserved granules measured over 120 d storage period using the BTM + 2 g.l-1
glucose as the test medium.

45
Storage Period (d)
0 30 60 90 120
SB (
ml.
h-1
)
0.0
0.1
0.2
0.3
0.4
0.5
0.6
0.7
0.8
0.9
0 30 60 90 120
10 h 25 h
Storage Period (d)
0 30 60 90 120
SM (
ml.
h-1
)
0.00
0.02
0.04
0.06
0.08
0.10
0.12
0.14
0.16
0.18
0 30 60 90 120
Room temperatureVacuum-dryingFreeze-dryingVacuum freeze-dryingFrozenCold storage
10 h 25 h
A
B
Figure 5.3. Biogas (SB) (A) and methanogenic activity (SM) (B) after 10 and 25 h of differently
preserved granules measured over a 120 day storage period using the BTM + 4 g.l-1
lactate as the test medium.

46
Acetic acid as carbon source – Methane is one of the main microbial end-products of any UASB system. It is, therefore, clear that an indication or measurability of the activity of the methanogens is very important in this biological cycle. Acetic acid is one of the few carbon sources that can be utilised directly by specific methanogens. The addition of this carbon source to the BTM was, therefore, to enhance the activity of the acetate-utilising methanogen population. The activity shown with the BTM with added acetic acid (Figure 5.4) was on average the lowest when compared with the results obtained with the other test media used. It is possible that the acetate-utilising methanogen population might have been either small or inhibited, or totally eliminated in some cases by the use of certain preservation techniques and storage combinations. The freeze-dried samples (FD) did, nevertheless, again show the most activity after 10 h and 60 days of storage (SB = 0.393 ml.h-1; SM = 0.046 ml.h-1) (Figure 5.4A and 5.4B). By day 120 hardly any SB or SM activity was, however, observed for any of the six preservation techniques. The activity ratings for the acetic acid samples after 25 h and 120 days of storage for the biogas activity were: R > VD = FD > VFD = F = C, and for the CH4 activity: R > VD > FD = VFD = F = C. 5.5 Conclusions A successful batch granule enhancement system requires an equally successful preservation technique that will maintain the activity of the mass-produced granules over an extended storage period. In this study, six different preservation techniques were evaluated in terms of biogas production and methanogenic activity over a period of 120 days.
The data showed that the freeze-dried samples (FD) followed by the vacuum freeze-dried samples (VFD) gave the best activity but only for 90 days. Activity of samples preserved by freezing at -18C (F), cold storage (C) and room temperature (R) methods were found to be very low. In the case of room temperature preservation (R), after 90 days of no activity it suddenly showed increased activity. It is difficult to explain this phenomenon as nothing was altered either in the storage conditions or the composition of the BTM. It is possible that prolonged storage at room temperature may have led to cell hydrolysis, and metabolites set free from these cells could then have provided energy sources needed by the rest of the population which then led to signs of methanogenic activity.
From the data obtained in this study it is clear that the method that was used to test for activity is a fairly simple and reliable method. It was, however, found that the most activity was found after 10 h of incubation with a decrease in activity up to 25 h. It was, therefore, concluded that the incubation time could be shortened to 10 h when the measurement of the tempo of biogas and methane production is to be an indication of activity for this type of test. The test results also showed that the activity when 2 g.l-1 glucose were added to the BTM was almost double that obtained with just the BTM. It is suggested, based on the results obtained during this study, that only the enrichment of the BTM with 2 g.l-1 glucose can be used as the test media for determinations or future research concerning activity testing for evaluation purposes.
It can be argued that the method of batch granule production, on a glucose-rich canning effluent, as used in this study, could probably result in the glucose-utilisers being the dominant group of the acidogenic population. They could then have provided the necessary metabolites for the methanogens. However, the low activity measured with the acetic acid enriched BTM with samples from all the preservation techniques suggests that acetate-utilising methanogens were not the dominant methane-producing group.

47
Storage Period (d)
0 30 60 90 120
SM (
ml.
h-1
)
0.00
0.02
0.04
0.06
0.08
0.10
0.12
0.14
0.16
0.18
0 30 60 90 120
Room temperatureVacuum-dryingFreeze-dryingVacuum freeze-dryingFrozenCold storage
10 h 25 h
Storage Period (d)
0 30 60 90 120
SB (
ml.
h-1
)
0.0
0.1
0.2
0.3
0.4
0.5
0.6
0.7
0.8
0.9
0 30 60 90 120
25 h10 hA
B
Figure 5.4. Biogas (SB) (A) and methanogenic activity (SM) (B) after 10 and 25 h of differently
preserved granules measured over a 120 day storage period using the BTM + 1 g.l-1
acetic acid as the test medium.

48
CHAPTER 6
EVALUATION OF EXTRACTION AND ANALYSIS METHODS OF ECP FROM UASB GRANULES AND THE IMPACT OF ECP COMPOSITION ON GRANULE
ACTIVITY 6.1 Summary The precise mechanism for the formation of UASB granules is not well known, however it is believed that extracellular polymers (ECP) play a major role in the granulation process. Unfortunately, no standardised method for ECP extraction is used at present and therefore comparison of results from different researchers has to be made with caution. In this study an ECP extraction method was evaluated that optimised extraction time and included a control for cell lyses. Subsequently, this method was used to determine the ECP composition of granules from various full-scale and laboratory-scale UASB reactors. The activity of the different UASB granules was also evaluated and correlated with the ECP composition. The optimal extraction time for the granules was determined at 4 h, with the exception of the Fruit-type granules, which was at 3 h. In general, the major component of the ECP consisted of protein and thus the protein:carbohydrate ratio was greater than 1 for all the granules, except for the Fruit-type granules. Activity testing was done to determine the activity of the different microbial groups present in the respective granules. It was found that that the Food-, Brew- and Comp-type granules exhibited higher SB and SM activities and the data showed that granules with higher ECP yields exhibited higher SB and SM activities. It was also concluded that the protein:carbohydrate ratio of granules would affect the activity. 6.2 Introduction Successful operation of an UASB reactor depends on a spontaneous agglutination of the biomass into a granular sludge which are formed by the natural self-immobilisation of bacteria and have high settling velocities and high methanogenic activity (Fukuzaki et al., 1995). The mechanisms for the formation of granules in UASB reactors are not well known, but it is believed that extracellular polymers (ECP) play a major role in the granulation process. Information on the precise role of the ECP in the granulation process is still limited even though Ross already reported in 1984 that agglutination of bacteria is generally due to the interaction between a protein and a polysaccharide. ECP is generally defined as polysaccharide-containing structures of bacterial origin, lying outside the outer membrane of gram-negative cells and the peptidoglycan of gram-positive cells (Costerton et al., 1981). It is believed that microbial cells produce ECP from organic debris, phages, lysed cells and other material that is excreted by the microbial cells. ECP consists mainly of protein and polysaccharides, and minor amounts of lipids, lipopolysaccharides, DNA and RNA (Schmidt & Ahring, 1996). Many factors may influence the production and composition of ECP in anaerobic granules. Microbial populations present within the granular sludge also influence production of ECP; with acidogens having higher ECP yields than acetogens and methanogens (Jia et al., 1996b). Harada et al. also reported in 1988 that carbohydrate-degrading granules were bigger and had higher mechanical strength than granules that degraded short chain fatty acids containing effluents. Many researchers have used various extraction methods to quantify the ECP content of granules from UASB reactors (Ross, 1984; Morgan et al., 1990; Schmidt & Ahring, 1994; Quarmby & Forster, 1994; Jia et al., 1996b). Thus, considerable variations on the reported ECP content of granules is found and it is clear that the variation depends on the extraction methods used, methods of analyses employed and types of granules examined. In many of the reported studies researchers did not include any control for cell lyses during ECP

49
extraction (Ross, 1984; Dolfing et al., 1985; Morgan et al., 1990; Shen et al., 1993), while other researchers used changes in the DNA content during extraction as an indication of the extent of cell lyses (Brown & Lester, 1980; Gehr & Henry, 1983; Grotenhuis et al., 1991; Guiot et al., 1991). Nucleic acids have also been found to be bound in the extracellular matrix of bacterial flocs, therefore, an increase in the supernatant DNA may be due to either cell disruption or to the release of DNA from the extracellular matrix of the granules (Schmidt & Ahring, 1994). No standardised ECP extraction method is used at present and, therefore, comparison of results from different researchers has to be made with great caution. Schmidt & Ahring proposed a new method in 1994, in order to determine the optimal extraction time. This was the first time an attempt has been made to determine the optimal extraction time of ECP extraction from UASB granules. It was found that the amount of DNA extracted per hour decreased with time in an exponential fashion for a certain period, where after an increase in the amount extracted per hour was observed. The increase was ascribed to cell lyses, and it was concluded that the optimal extraction time was at the point where an increase in extracted amount of DNA was induced (Schmidt & Ahring, 1994). In this investigation, an ECP extraction method based on the principles of the method of Schmidt & Ahring (1994) was evaluated. With the use of this method the ECP composition of granules from various full-scale and laboratory-scale UASB reactors, will be examined. The activity of different UASB granules will also be evaluated and correlated with the ECP composition of the various granules. 6.3 Materials and methods Granule samples UASB granule samples were obtained from various industrial and laboratory-scale UASB reactors in South Africa. The granule sources and composition of the wastewater they were treating, are shown in Table 6.1. Extraction of water-soluble extracellular polymers A thermal extraction method was used to extract the ECP content of the UASB granules. The granules were washed and then manually mashed. Vials (6 ml) with 0.5 g sample and 3 ml phosphate-buffered saline (PBS) (Smibert & Krieg, 1994) were placed in a shake-waterbath at 70°C. A vial was removed every hour for six hours for each granule sample from the waterbath. The contents were centrifuged and the supernatant removed and stored at -18°C. Analyses of extracellular polymers
Carbohydrates in the extracted ECP were determined using the phenol/sulphuric acid method of Dubois et al. (1956). Firstly, 50 ml of phenol (80% m/m) was added to 2 ml of the ECP-extract, then 5 ml of concentrated sulphuric acid (98% reagent grade) was added rapidly. A blank was used by replacing the ECP-extract with PBS-solution. The tubes were allowed to stand for 10 min, then mixed on a Vortex and placed in a waterbath for 10 min at 30°C. Absorption was measured against the blank at 492 nm. Glucose was used as a standard in the range 0 to 100 mg.l-1.

50
Table 6.1 Sources of UASB granules used. Granule Origin UASB-type Wastewater composition
Brew1 Amanzimtoti Industrial-scale UASB Brewery effluent Dist2 Wellington Industrial-scale UASB Distillery effluent Fruit3 Ceres Industrial-scale UASB Fruit juice + fruit pulp effluent Lye4 Stellenbosch Laboratory-scale Peach-lye canning effluent Comp5 Stellenbosch Laboratory-scale Anaerobic composting effluent Food6 Krugersdorp Industrial-scale Gelatine and food effluents Granule source: 1 = Dr A. Wood, SA Breweries, Amanzimtoti 2 = Mr. A. Loubscher, Distell, Wellington 3 = Ceres Fruit Growers, Ceres 4 = Mr. G. Sigge, Univ. Stellenbosch 5 = Ms. W. Griessel, Univ. Stellenbosch 6 = Dr. M. Van Der Merwe, Krugersdorp
The protein content in the ECP-extract was measured according the bicinchoninic acid (BCA) method (Smith et al., 1985; BCA-200 Protein Assay Kit, Separations). Absorbency was measured at 620 nm with a microtiter plate reader.
Lipids were extracted and quantified using the method of Bligh & Dyer (1959). The DNA in the ECP-extract was extracted (Smalla et al., 1993), and quantified by using a fluorometric method (DyNA Quant 200 Fluorometer, Pharmacia Biotech; Johnson, 1994). All studies were done in duplicate. Calf thymus DNA Fluoroscence standard [Separation Scientific] was used as standard in the range of 10 to 500 ng.ml-1 final DNA concentration. Other analytical procedures The total suspended solid (TSS) and volatile suspended solid (VSS) content of the various UASB granules was determined, respectively using the methods recommended by Standard Methods (APHA, 1992; Shen et al., 1993). All studies were done in triplicate. Statistical methods The ECP extraction method was repeated five times to test whether the ECP extraction and analyses techniques were reproducible. The ECP-extracts obtained were respectively analysed for protein, carbohydrate, lipid and DNA composition and determined as a fraction of the VSS content of respective granules. Protein, carbohydrate and DNA analyses were performed on each of the ECP-extracts obtained from each extraction time. All analyses were done in duplicate. To test whether significant differences existed between the protein, carbohydrate and DNA analyses results, a one-way analyses of variance (ANOVA) was performed (Keller & Warrack, 1997). The lipid content of the ECP-extracts was determined for the optimal extraction time estimated for the respective UASB granules.

51
All analyses were done in duplicate. To evaluate the reproducibility of the lipid analyses, VSS and TSS determinations, the coefficient of variation (CV) was determined (Smith, 1994). Activity testing
The activity of the granules obtained from the laboratory-scale and full-scale UASB reactors was determined. The granules were re-activated at 35°C in sterile medium (pH 7.0) containing 1 g.l-1 glucose and 0.5 g.l-1 each of urea and KH2PO4. Then 20 ml glass vials were inoculated with 3 g granules and 13 ml of the basic test medium (BTM) (Valcke & Verstraete, 1993) and each vial was sealed and incubated at 35°C for 25 h. The activity tests were done in triplicate. Biogas samples were taken at time 5, 10 and 25 h of incubation using a gas-tight syringe and analysed gas chromatographically. The biogas samples were expressed as cumulative gas volumes. 6.4 Results and discussion Extraction of extracellular polymers (ECP) The ECP content of UASB granules has been shown to be mainly dependent on the specific granules examined, the extraction method employed and the analytical method used to quantify the ECP. Physical extraction methods are reported to be more successful than chemical extraction methods (Brown & Lester, 1980; Gehr & Henry, 1983). Zhang et al. (1999) also reported that chemical extraction of ECP with formaldehyde cross-links the protein, and thus makes it difficult to detect accurately. Thus, in this study a physical thermal extraction method was rather used to extract the ECP from different UASB granules (Brown & Lester, 1980; Morgan et al., 1990; Schmidt & Ahring, 1994). The optimal extraction time was determined by using the method proposed by Schmidt & Ahring (1994). The amount of DNA extracted from the different UASB granules as a function of the extraction time is illustrated in Figure 6.1. The data clearly shows that the DNA content increased as a function of the extraction time. However, the data shows no clear indication of the optimal extraction time for the various granules. In order to determine the optimal extraction time, the changes in amount of DNA extracted per hour was plotted against the extraction time (Figure 6.2). From the data it was found that the increase in the amount of DNA extracted per hour decreased with time for a certain period, where after a smaller increase in the amount of extracted ECP was observed. It was thus concluded that the optimal extraction time was at the lowest point just before an increase in the extracted amount of DNA occurred. The detection of the optimal extraction time as found in this study correlates well with findings reported by Schmidt & Ahring (1994). The optimal extraction time was detected at 4 h for all the granule samples, with the exception of the extraction time for the Fruit-type granules, which was found to be at 3 h. After the point of optimal extraction time, an increase occurred in the amount of DNA extracted per hour. This increase was probably due to cell lyses, thus the intracellular material started contributing to the DNA content of the ECP. The results from the extraction profiles also indicated that the increase in DNA content decreased again after the 5 h extraction time.
Data from the ANOVA results on the reproducibility of the ECP extraction and analyses (Table 6.2) show that no significant difference (p > = 0.05) existed between the analyses for protein, carbohydrate and DNA. Thus, it was concluded with 95% confidence at a 5% significance level that non-significant differences existed between the extraction and analysis methods for protein, carbohydrate and DNA, thus the ECP extraction and analysis methods used in this study were reproducible (Keller & Warrack, 1997).

52
Extraction time (h)0 1 2 3 4 5 6 7
DN
A (
mg
.g-1
VS
S)
0.00
0.01
0.02
0.03
0.04
0.05
0.06
0.07
0.08
0.09
0.10
0.11
0.12
Brew-granulesDist-granulesFruit-granulesLye-granulesComp-granulesFood-granules
Extraction time (h)0 1 2 3 4 5 6 7
DN
A i
ncr
ease
(u
g.g
-1 V
SS
)
-5
0
5
10
15
20
25
30
35
40
45Brew-granulesDist-granulesFruit-granulesLye-granulesComp-granulesFood-granules
Figure 6.1. DNA (mg.g-1 VSS) extracted from the different granules in terms of the extraction time (h). The standard deviation was used as the error-bar length.
Figure 6.2. Increase in DNA (mg.g-1 VSS) extracted from the different granules in terms of extraction time (h). The standard deviation was used as error-bar length.

53
The coefficient of variation (CV) determined for the lipid analysis, TSS and VSS
content was respectively 4.78, 3.57 and 3.47%. These values were below 5% and, therefore, indicated a high level of reproducibility of the replicates for lipid analysis, TSS and VSS determinations (Smith, 1994). ECP composition of the different UASB granules The data of the composition of the extracted ECP from the different UASB granules is shown in Table 6.3. The values for total ECP content of the different granules varied from 28.71 to 53.76 mg.g-1 VSS. It was found that protein was the dominant component of the quantified ECP from all the granules with the exception of the Fruit-type granules. Morgan et al. (1990) also found that protein was the dominant component of ECP from UASB granules and anaerobic granular sludge. Ehlinger et al. (1987) however reported that the dominant component of ECP from acidogenic flocs was mainly carbohydrates and reported a protein:carbohydrate ratio of less than 1 (0.61) for glucose fed anaerobic sludge. El-Mamouni et al. (1995) also confirmed that the ECP of anaerobic granules enriched with acidogens was essentially composed of carbohydrates. In this study similar results were found for the Fruit-type granules. The Fruit-type granules were obtained from a full-scale UASB plant that treated mainly fruit juice and fruit pulp wastewater and had a very low protein:carbohydrate ratio of 0.79. It was highly likely, as the data showed that the ECP of the Fruit-type granules was essentially composed of carbohydrates, and that the trophic groups of these granules were probably dominated by acidogens.
The protein:carbohydrate ratio for the different granules varied from 0.79 in the case of the Fruit-type granules to 5.18 for the Food-type granules (Table 6.3). The ECP composition, and thus protein:carbohydrate ratio of the ECP has been shown to be affected by the composition of the wastewater fed to the reactor (Shen et al., 1993; Schmidt & Ahring, 1994; Veiga et al., 1997). In this study the highest protein:carbohydrate ratio was observed in the Brew-type and Food-type granules. The yeast present in the brewery effluent fed to the Brew-type granules probably contributed to the higher protein:carbohydrate ratio of 4.02. The wastewater fed to the Food-type granules consisted of a protein-rich gelatine type effluent that probably also contributed to the higher protein:carbohydrate ratio of 5.18. The wastewater fed to the Dist-, Lye- and Comp-type granules were more carbohydrate-rich and this factor thus probably contributed to a lower protein:carbohydrate ratio of around 3. Table 6.2 ANOVA results for the protein, carbohydrate and DNA analysis of the
ECP extracted from the Brew-type granules.
ECP p-value* + n
Protein content 0.622 0.05 5 Carbohydrate content 0.616 0.05 5 DNA content 0.194 0.05 5
*p > : Non-significant differences exist for reproducibility of protein, carbohydrate and DNA analyses +: Significance level of 5%

54
Table 6.3 Composition of the ECP (mg.g-1 VSS) extracted from the different UASB
granules. Type T-ECP Pro Ca Lipid DNA Pro:Ca Opt1
Brew 53.76 36.31*2.803 9.04*0.118 8.37*1.625 0.037*0.0023 4.02 4 Dist 37.32 27.27*0.508 7.01*0.135 3.01*0.778 0.026*0.0041 3.89 4 Fruit 35.54 14.64*0.295 18.63*0.066 2.26*0.564 0.002*0.0001 0.79 3 Lye 28.71 20.24*0.329 5.33*0.122 3.12*0.415 0.013*0.0013 3.79 4 Comp 38.47 28.33*1.899 8.60*0.029 1.52*0.462 0.007*0.0021 3.29 4 Food 49.32 39.48*2.813 7.62*0.311 2.16*0.287 0.064*0.0016 5.18 4 T-ECP = Total ECP Ca = Carbohydrate Pro:Ca = Protein:Carbohydrate ratio Pro = Protein *Standard deviation (SD) values 1 = Optimum extraction time The lipid concentrations (Table 6.3) in the quantified ECP from the different granules was in all cases lower than the carbohydrate content. The ECP from the Brew-type granules had the highest lipid concentration. Schmidt & Ahring (1994) also reported that the amount of lipids in the quantified ECP of their granules was significantly lower than the amount of protein and carbohydrate. They concluded that granules grown on simple substrates had higher amount of lipids in their ECP than granules grown on more complex substrates. However, no discernible trend was observed in the concentration of the lipids present in the ECP composition from the different UASB granules. Activity testing Activity testing of UASB granules can be used to obtain an indirect indication of the activity of the different microbial trophic groups present in granules and granular sludge (Switzenbaum, 1990). Activity testing of granules depends on the energy and carbon source that the granules are grown on and it has been reported that maximum activity values are obtained when the test substrate is identical to the growth substrate or if the test substrate is an important intermediate (Schmidt & Ahring, 1996).
In this study, the activity of six different UASB granules (Table 6.1) was determined and the data compared. Furthermore, the activity of the granules was also correlated with the ECP content (Table 6.3) of the different UASB granules. The cumulative biogas was determined for each type of granule, and the methane (CH4) fraction calculated. The cumulative biogas and CH4 data was then converted to represent the activity of each type of granule relative to the other granules. It must be taken into consideration that the activity of each type of granule is described in terms of the rate of biogas (SB) and rate of CH4

55
production (SM). The rate of gas production (SB and SM) was determined using the slope or gradient (cumulative gas production (CGP) over time for each of the time intervals (t = 5, 10 and 25 h). The gradient, for example for the 10 h time interval, was determined as follows: (CGP10h – CGP5h)/(t10h – t5h). The rate of gas production was thus given in ml.h-1 and was taken as representative of the activity of the granules. The values were then plotted against time for the different UASB granules to give a visual representation of the activity of the results obtained). The SB and SM activities as found in this study are illustrated in Figures 6.3 and 6.4, respectively. Activity evaluation of the different UASB granules In general it was found that the maximum SB and SM activity for all the different granules occurred within the 10 h period. Moreover, a larger variability in SB and SM activity was found at the 10 h incubation period and the differences when different test substrates were used was more apparent than at the 5 or 25 h period. Thus, in this study the SB and SM activity values obtained at 10 h were used to indicate the activity of the different granules.
Control: The BTM was used as the control to enable comparisons at a general and basic level. From the results in Figures 6.3A and 6.4A, it is clear that all the granules, except for the Fruit-type granules, showed SB and SM activity at this basic control level. The maximum SB and SM activities were observed at 10 h for all the granules. The order of SB activity after 10 h of incubation was Food = Comp > Brew = Lye > Dist-type granules (Fruit-type granules = 0), and the order of the SM activity after 10 h was Food > Comp > Brew > Dist = Lye-type granules (Fruit-type granules = 0). The Food- and Comp-type granules showed the highest SB activity and SM activities, whilst the Fruit-type granules did not show any activity. Thus, it appeared that even when no specific microbial group was specifically enhanced, the activity of the microbial groups present in the Fruit-type granules were inactive and did not respond to the BTM as test method. It can also be concluded that in the case of the Fruit-type granules, microbial populations that utilised the test substrate were very small, inhibited or even absent. Glucose as test substrate: It is well known that most acidogens prefer carbon in the form of glucose as growth substrate, thus the addition of additional glucose (2 g.l-1) to the BTM has been shown to enhance the activity of especially the acidogens. The use of glucose as carbon source was used to primarily test for the activity of the acidogens, but would also indirectly, through metabolite formation, increase the activity of the methanogenic population if methanogens were active.
From the results of this study (Figures 6.3 and 6.4) it was clear that the addition of glucose enhanced the SB and SM activity of all the granules including the Fruit-type granules. The order for SB activity after 10 h of incubation was Food > Comp > Brew > Lye > Dist > Fruit-type granules. The order for SM activity after 10 h was Comp > Brew > Food > Lye > Dist > Fruit-type granules. Under these conditions the F-type granules showed some activity suggesting that both the acidogenic and methanogenic populations in all the granules were more active after the addition of additional 2 g.l-1 glucose to the BTM.
Glucose is also known to serve as precursor for the synthesis of many other compounds like monosaccharides, disaccharides and polysaccharides (Stanley & Zubay, 1993). Therefore, glucose, as a component of different compounds, is almost always present in larger concentrations in wastewaters used as substrates for different UASB reactors. Moreover, acidogens (hydrolytic and fermentative bacteria) are by far the largest of the trophic groups involved in anaerobic digestion and additionally have faster growth rates than other trophic groups (Zeikus, 1980). Thus, it is therefore likely that the activity of the acidogenic populations in all the different granules used in this study was enhanced by the addition of additional glucose as test carbon substrate.

56
Control
Incubation time (h)0 5 10 15 20 25 30
SB (
ml.h
-1)
0.0
0.2
0.4
0.6
0.8
Brew-granulesDist-granulesFruit-granulesLye-granulesComp-granulesFood-granules
2 g.l-1 Glucose
Incubation time (h)0 5 10 15 20 25 30
SB (
ml.h
-1)
0.0
0.2
0.4
0.6
0.8
4 g.l-1 Lactic Acid
Incubation time (h)0 5 10 15 20 25 30
SB (
ml.h
-1)
0.0
0.2
0.4
0.6
0.8
1 g.l-1 Acetic Acid
Incubation time (h)0 5 10 15 20 25 30
SB (
ml.h
-1)
0.0
0.2
0.4
0.6
0.8
Figure 6.3. Biogas activity (ml.h-1) (SB) of the different granules with different carbon
sources added to the BTM as test substrate. The standard deviation was used as the error-bar length.
CB
A
D

57
Control
Incubation time (h)0 5 10 15 20 25 30
SM (
ml.h
-1)
0.00
0.05
0.10
0.15
0.20
0.25
Brew-granulesDist-granulesFruit-granulesLye-granulesComp-granulesFood-granules
2 g.l-1 Glucose
Incubation time (h)0 5 10 15 20 25 30
SM (
ml.h
-1)
0.00
0.05
0.10
0.15
0.20
0.25
4 g.l-1 Lactic Acid
Incubation time (h)0 5 10 15 20 25 30
SM (
ml.h
-1)
0.00
0.05
0.10
0.15
0.20
0.25
1 g.l-1 Acetic Acid
Incubation time (h)0 5 10 15 20 25 30
SM (
ml.h
-1)
0.00
0.05
0.10
0.15
0.20
0.25
Figure 6.4. Methanogenic activity (ml.h-1) (SM) of the different granules with different
carbon sources added to the BTM as test substrate. The standard deviation was used as the error-bar length.
A
B C
D

58
Lactic acid as test substrate: Lactate under certain conditions may be a major end-
product of acidogenesis during anaerobic digestion (Pipyn & Verstraete, 1981) and several pathways are known for the degradation of this compound. When the lactate concentration is low, the syntrophic degradation by the Desulfovibrio/hydrogenotrophic-methanogen couple is favoured (Zellner et al., 1994). Under more unfavourable conditions, a high lactate concentration leads to the formation of propionate as an intermediate or end-product and an additional lactate-utiliser, like the more acid tolerant Propionibacterium strains, are needed for lactate degradation. These Propionibacterium strains can gain a competitive advantage during situations where ‘stress’ conditions are applied to UASB bioreactors as they obtain a maximum ATP per mol of lactate fermented (Britz et al., 1999). Thus, even under ‘stress’ conditions (Britz et al., 1999) the lactate-utilising populations can be re-activated through the formation of propionate as an intermediate or end-product.
It is well known (Aguilar et al., 1995) that the degradation of glucose, in comparison with lactic acid, leads to the formation of a greater variety of intermediate products. Lower SB and SM activities of the different granules were found when lactic acid was used as test substrate (Figures 6.3C and 6.4C), compared to the tests where glucose was used as test substrate. Moreover, the degradation of glucose as a 6-carbon compound was the more energetically favourable reaction, compared to the degradation of lactic acid as a 3-carbon compound. Thus, the lower SB and SM activities of the different granules for the less favourable energetically degradation of lactic acid were probably due to the limited number of trophic groups involved in the degradation of lactic acid.
The order of SB activity at 10 h incubation time was Food > Comp > Brew > Lye > Dist-type granules (Fruit-type granules = 0). The order of SM activity at 10 h was Food > Comp > Brew > Dist > Lye-type granules (Fruit-type granules = 0). The results showed that the biogas and methanogenic activities of the Food-type granules were the highest when lactic acid was used as test substrate, compared to glucose as test substrate. It was thus concluded that a lactate-utilising population was present in higher numbers in the Food-type granules than in the other granules. Maximum SB and SM activity for the Lye-type granules was observed only after 25 h of incubation. It is possible that a smaller lactate-utilising population present in the Lye-type granules caused a shift in rate of maximum activity from 10 to 25 h. Once again, the Fruit-type granules did not show any SB and SM activity when lactic acid was used as test substrate. It was thus concluded that the lactate-utilising population was either very small, absent or even inhibited probably due to long-term lactate insufficiency of the Fruit-type granules and therefore could not be re-activated in the incubation period of 25 h.
Acetic acid as test substrate: Acetic acid is one of the limited carbon sources that can directly be utilised by the acetoclastic (acetate-utilising) methanogens, Methanosaeta and Methanosarcina (Garrity & Holt, 2001). The growth and substrate degradation rates of acetoclastic methanogens are also quite slow with td values of between 1.5 and 7 days (Wu et al., 1990). The addition of 1 g.l-1 acetic acid to the BTM was therefore specifically to enhance the activity of these acetoclastic methanogens.
In this study, the use of acetic acid as test substrate resulted in lower SB and SM activities (Figures 6.3 and 6.4) for the different granules, compared to when glucose or lactic acid were used as test substrate. It is known that the degradation of glucose or lactic acid leads to the formation of a variety of intermediate products that may energetically favour the activity of different members of the microbial communities present in different granules (Aguilar et al., 1995). Thus in this case, the lower SB and SM activities were probably due to the limited number of trophic groups involved in the degradation of acetic acid. However, the SB and SM activities were still higher than the values obtained for the control samples when only the BTM was used as test substrate. It was therefore concluded that the acetoclastic populations present in all the granules, except the Fruit-type granules, were very much active.

59
The order of SB activity at the 10 h period of incubation was Food > Comp > Brew > Dist > Lye-type granules (Fruit-type granules = 0). The order of methanogenic activity (SM) at the 10 h incubation period was Food > Brew > Comp > Dist > Lye-type granules (Fruit-type granules = 0). Once again maximum the SM activity for the Lye-type granules was observed after 25 h of incubation. This can possibly be ascribed to the slow growth rate (Wu et al., 1990) of a smaller population of acetoclastic methanogens present in the Lye-type granules. The Lye-type granules also showed at the 10 h period a lower SB and SM activity than found for the control samples. This suggests that a measure of inhibition of the acetoclastic methanogens may have occurred in the presence of 1 g.l-1 acetic acid at 10 h of incubation. Since the source of these granules were from a high pH sodium lye treating UASB system, the high pH values (± 8.0 - 9.0) of the source lye effluent probably inhibited methanogenesis. In addition to the high pH values of the lye effluent, the high Na+ and pectin concentrations in the effluent were probably also responsible for a measure of inhibition of the acetoclastic methanogens in the Lye-type granules. Overall, from the SB and SM activity profiles (Figures 6.3 and 6.4) it was possible to divide the different granules into two major groups where the Food-, Brew- and Comp-type granules exhibited higher SB and SM activity than the Dist-, Lye- and Fruit-type granules for the different test substrates. Thus, it was concluded that the higher SB and SM activities of the Food-, Brew- and Comp-type granules were related to higher numbers and metabolic potential of the trophic groups, such as acidogens, lactate-utilisers and methanogens, that were present in the granules. Activity testing versus ECP composition of different UASB granules
The total ECP content extracted from the different UASB granules (Table 6.3) varied widely depending on the nature of the granules. The Brew-type granules yielded the highest total ECP content followed, in descending order, by the Food-, Comp-, Dist-, Fruit- and Lye-type granules. Similarly, with the use of the SB and SM activity data, the different granules could again be divided into two major groups where the Food-, Brew- and Comp-type granules exhibited more SB and SM activity than the Dist-, Lye- and Fruit-type granules for the different test substrates. It was thus evident from the activity results and ECP values that those granules with the higher ECP yield, exhibited greater SB and SM activities.
Although the Fruit-type granules did not have the lowest ECP content (35.59 mg.g-1 VSS), these granules exhibited the lowest SB and SM activity. However, the Fruit-type granules had a very low protein:carbohydrate ratio of only 0.79. This low protein:carbohydrate ratio was due to the high concentration of carbohydrates present in the ECP of the Fruit-type granules. Carbohydrates contain an anionic uronic acid group (Jia et al., 1996a) that can cause repulsion between bacterial cells when high concentrations of carbohydrates are present in the ECP of UASB granules (Morgan et al., 1990). It can be speculated that this repulsion between the bacterial cells of the Fruit-type granules probably also affected the activity of these granules. 6.5 Conclusions Various mechanisms for granulation have been proposed (Ross, 1984; Costerton, 1987; Chen & Lun, 1993; Schmidt & Ahring, 1996; Britz et al., 2000). As basis for some of these proposals it is believed that ECP plays a major role in the granulation process (Costerton et al., 1981; Ross, 1984; Sam-Soon et al., 1987; Harada et al., 1988; Morgan et al., 1990; Quarmby & Forster, 1994; Schmidt & Ahring, 1994). In this present study an ECP extraction method based on the principles of the method of Schmidt & Ahring (1994) was evaluated in order to determine the optimal extraction time. In this study the optimal extraction time was found to be at 4 h for all the granules, except the Fruit-type granules, which was at 3 h. It was concluded from the data that after the optimal extraction time, the further increase in DNA content was due to cell
60
lyses where the intracellular material contributed to the DNA content of the ECP. Furthermore, a physical thermal extraction method was used to extract the ECP (Brown & Lester, 1980; Morgan et al., 1990; Schmidt & Ahring, 1994) as physical extraction methods have been reported to be more successful in extracting ECP than chemical extraction methods (Brown & Lester, 1980; Gehr & Henry, 1983). The total ECP content of the different UASB granules was found to be in the range of 28.71 to 53.76 mg.g-1 VSS. In general, the dominant component of the ECP extracted from the different UASB granules was protein. Thus, the protein:carbohydrate ratio was greater than 1 for all the granules, except for the Fruit-type granules. The Fruit-type granules were obtained from a full-scale UASB plant that treated carbohydrate-rich wastewaters that were mainly composed of fruit juice effluent and fruit pulp. As the dominant component of the ECP from the Fruit-type granules was carbohydrates, it was concluded that these granules consisted mainly of acidogens.
It was also found in this study that results from the SB and SM activity tests could be used to predict the activity of the different microbial groups present in the granules. It was found that the acidogenic population was the most active group in terms of both SB and SM activity for all the granules, except the Food-type granules, which showed higher SM activity for the lactate-utilising populations. In general, it was evident that the Food-, Brew- and Comp-type granules exhibited more SB and SM activity and it was thus concluded that these granules contained higher numbers of acidogens, lactate-utilisers and acetoclastic methanogens. Moreover, according to the acquired data of the ECP composition of the different UASB granules it was found that granules with higher ECP yields exhibited greater SB and SM activities. Moreover, it was concluded that the protein:carbohydrate ratio of the different UASB granules could impact the activity of the respective granules.

61
CHAPTER 7
IMPACT OF SLUDGE SOURCES, CARBON SUBSTRATES AND BATCH CULTIVATION TECHNIQUES ON GRANULE ACTIVITY, ECP COMPOSITION AND GRANULE
FORMATION IN BATCH SYSTEMS 7.1 Summary The start-up period of UASB reactors can be reduced by seeding the reactor with batch-cultivated sludge instead of raw anaerobic sludge. However, there are many system parameters that impact this process. In this study, the impact of two sludge sources, Paarl (P0) and Kraaifontein (K0) sludges, three carbon substrates lactate (YEL), glucose (G) and fruit cocktail effluent (Fc) and two batch cultivation techniques (roller-table and shake-waterbath) on the enhancement of the batch granule cultivation and metabolic activity of anaerobic granular sludge, was investigated. Granulation did not proceed optimally in all the systems as the acetate activity profiles showed that the major nuclei formers appeared to be inactive in some of the systems. The roller-tables gave higher increases in granule numbers. The addition of glucose to the substrate did not only enhance the activity of the acidogenic populations, but also led to the establishment of a greater variety of trophic groups, such as the lactate-utilisers and hydrogenotrophic methanogens. In the FC systems, it was found that the addition of FC as substrate enhanced ECP production. However, the addition of carbon substrates showed no discernible trend on ECP composition and granule formation itself. Large variations in ECP composition of the different batch systems were found, and were ascribed to the heterogeneity within the different sludge sources that were used for the batch cultivation studies. 7.2 Introduction The UASB design is widely used to treat high-strength industrial wastewaters (Hulshoff Pol et al., 1997) but the successful operation depends on the high settling velocities and methanogenic activity of the granules for the degradation of organic substances (Fukuzaki et al., 1995). Granulation does not always proceed optimally because the composition of effluents is typically time-variable with nutritional imbalances often found (Verstraete & Vandevivere, 1999). High methanogenic activity is one of the characteristics of granular sludge (Schmidt & Ahring, 1996), and depends on the presence of methanogenic bacteria and suitable substrates for these bacteria (Mah, 1982). It is thus essential to monitor the activity of biomass to prevent digester failure (Van Lier et al., 2001). Activity tests can be used to characterise the suitability of the biomass prior to its use as an inoculum for start-up of a new reactor (De Zeeuw, 1984). The aims of this study were to investigate the impact of the type of sludge used as inoculum, type of carbon substrates and batch cultivation techniques on enhancement of batch granule cultivation and activity of anaerobic granular sludge. The ECP composition was also determined and correlated with the batch cultivation studies and resulting activity of granular sludge. 7.3 Materials and methods Source of sludge Two sources of anaerobic sludge from the Kraaifontein Waterworks (K0-sludge) and Paarl Waterworks (P0-sludge) were used for the batch cultivation of UASB granules. The

62
raw anaerobic sludge was sieved through a 1 mm sieve to remove larger non-degradable material and the sludge then centrifuged and the supernatant removed to concentrate the sludge sample by 50%. The P0- and K0-sludges were used as inoculum for the batch cultivation studies at a TSS concentration of 0.141 and 0.148 g-1 TSS, respectively. Batch granule cultivation Two batch cultivation techniques were compared during batch granule cultivation. Firstly, a roller-table was used to cultivate the granules at 35C with 500 ml containers rotating at 30 rpm. In the second case, a linear-shake waterbath was used at 120 rpm to cultivate the granules in a batch system at 35C.
Each batch system consisted of 100 ml sieved sludge and 350 ml sterile growth medium. For a period of 14 days, 100 ml of the clear top volume of each container was replaced with 100 ml sterile growth substrate (Britz et al., 2002). The batch cultivation studies were done in triplicate. The carbon substrates used, as growth media for the study were yeast extract lactate (YEL)-medium, glucose medium and fruit cocktail effluent. The glucose substrate was prepared by replacing 10 g.l-1 lactic acid with 2 g.l-1 glucose in the YEL-medium formulation. The fruit cocktail was obtained as an effluent stream from Ashton Canning Company (Pty) Ltd., sieved to remove excess fruit fibres and diluted to 2 g.l-1 COD. The different combinations of batch cultivation techniques, sources of sludge and carbon substrates used as growth medium for the batch systems are summarised in Table 7.1. Activity testing The activity of the granular sludge from the different batch systems (Table 7.1) was determined after 14 days of batch cultivation at 35C. The P0 and K0-sludges served as control samples for the respective batch systems. The biomass from the batch systems was “standardised” by centrifugation and the sludge pellets were re-suspended in sterile medium (pH 7.0) containing 1 g.l-1 glucose and 0.5 g.l-1 each of urea and KH2PO4. Then 20 ml glass vials were inoculated with 3 g of the sludge pellet and 13 ml of the basic test medium (BTM) (Valcke & Verstraete, 1993) or other test media. Each vial was sealed and incubated at 35C for 25 h. The activity tests were done in triplicate. Granule counts
Granule counts were done on day 0 on the P0 and K0-sludges that served as control samples for the respective batch systems. On day 14 after batch cultivation, granule counts were done on the different batch systems. Each sludge sample (1 ml) was fixed in a glass petridish using gelatine (3 g.100 ml-1) (Jeison & Charmy, 1998). Ten images (6 mm by 10 mm) of each sample were scanned into a desktop computer using the Matrox Intellicam Interactive (version 2.0) frame-grabber software (Matrox Electronic Systems Ltd.) and a Nikon SMZ800 Microscope fitted with a Panasonic Video Camera. The images were analysed using the Scion Image Software (release Beta 3b) (Scion Corporation, Maryland, USA). Extraction of water-soluble extracellular polymers (ECP)
The thermal extraction method was used, as previously described, to extract the ECP content of the anaerobic granular sludge. The biomass from each batch system was “standardised” by centrifugation at 978 X g for 20 min. Identical serum vials (6 ml) were then filled with 0.5 g of the sludge pellet and 3 ml phosphate-buffered saline (PBS) (Smibert & Krieg, 1994) (Table 5) and placed in a shake-waterbath (150 rpm) at 70C for 2 h. The contents were centrifuged at 9 600 X g for 10 min, and the supernatant was removed and kept at -18C for further ECP analyses.

63
Analyses of extracellular polymers The carbohydrate, protein, lipid and DNA content of the ECP-extract were determined according to the methods previously described. All the analytical methods were done in duplicate. Table 7.1. Combinations of batch cultivation techniques, sources of sludge and carbon
substrates used for the batch cultivation of granular sludge. Batch system Cultivation technique Sludge source Carbon substrate P0 (Control) - Paarl - K0 (Control) - Kraaifontein - SPY Shake-waterbath Paarl Lactate SPG Shake-waterbath Paarl Glucose SPFc Shake-waterbath Paarl Fruit cocktail effluent RPY Roller-table Paarl Lactate RPG Roller-table Paarl Glucose RPFc Roller-table Paarl Fruit cocktail effluent RKY Roller-table Kraaifontein Lactate RKG Roller-table Kraaifontein Glucose RKFc Roller-table Kraaifontein Fruit cocktail effluent P0-sludge (= P): Anaerobic sludge from Paarl Waterworks used as control K0-sludge (= K): Anaerobic sludge from Kraaifontein Waterworks used as control S = Shake-waterbath used for batch cultivation R = Roller-table used for batch cultivation Y = Yeast Extract Lactate medium used as carbon substrate G = Glucose medium used as carbon substrate
: Fc = Fruit cocktail effluent used as carbon substrate Other analytical procedures The pH values obtained from the different batch systems (Table 7.1) were monitored from day 0 until day 14. The total suspended solid (TSS) and volatile suspended solid (VSS) content of the sieved anaerobic sludge samples were determined at day 0 and day 14 respectively. Prior to the determination of TSS and VSS, the biomass of the different batch systems was “standardised” by centrifugation. The TSS and VSS content of the sludge pellet were then determined in triplicate by using the methods recommended by Standard Methods (APHA, 1992; Shen et al., 1993). 7.4 Results and discussion Availability of sludge
Due to a mechanical limitation at the Kraaifontein Waterworks, a SK-type batch system was not included in this study (Table 7.1). The RK-type batch system was only included in

64
this study to investigate the impact of the type of sludge source when the same batch cultivation technique (roller-table technique) was used. Activity testing
The aim of the study was to evaluate (i) the impact of the sludge source used as inoculum, (ii) carbon substrates used as growth substrate and (iii) different cultivation techniques used for batch cultivation of granular sludge on the activity of the different batch systems (Table 7.1). The P0- and K0-sludge served as control samples for the respective batch systems, and the activity of these control samples was also determined prior to their use as inoculum for the respective batch systems. The cumulative biogas and methane (CH4) fractions were determined for each type of batch system. The cumulative biogas and CH4 data were then converted to represent the activity of each type of batch system. It must be taken into consideration that the activity of each type of batch system is thus described in terms of rate of biogas (SB) and CH4 (SM) production. The rate of gas production (SB and SM) was determined using the slope or gradient (cumulative gas production (CGP)) over time for each of the time intervals (t = 5, 10 and 25 h). The rate of gas production was thus given in ml.h-1 and was taken as representative of the activity of the batch systems. The values were then plotted against time for the different batch systems to give a visual representation of the activity of the batch systems. The SB and SM activities are illustrated in Figures 7.1 and 7.2, respectively. General comments on activity evaluation of the different batch systems For activity evaluation of the different batch systems: the BTM; 2 g.l-1 glucose added to the BTM; 4 g.l-1 lactic acid added to the BTM and 1 g.l-1 acetic acid added to the BTM, were respectively used as test substrates. The BTM contained no additional carbon substrates and thus was used as the control to enable comparisons of the activity results at a general level. Results from this study showed that not one of the batch systems showed activity in terms of either SM or SB when the BTM alone was used as test substrate (Figures 7.1 and 7.3). It was concluded from the data that when a specific microbial group was not enhanced, the activity of the microbial groups present in the different batch systems and control samples (K0- and P0-sludge) was low or absent, and did not give a measurable response. The use of glucose as test substrate was to primarily stimulate the activity of the acidogens, even though a subsequential increase in the activity of the methanogenic population could also result. From the data it was clear that more activity was shown when 2 g.l-1 glucose was added to the BTM as test substrate (Figure 7.1). Acidogens (hydrolytic and fermentative bacteria) are by far the largest of the trophic groups involved in anaerobic digestion and additionally have faster growth rates than the other trophic groups (Zeikus, 1980). Therefore, it is likely that the activity of the acidogenic populations in most of the different batch systems was enhanced by the additional glucose as carbon test substrate. In the second test batches lactic acid was used as test substrate to investigate the possible presence of lactate-utilising bacteria. Lactate is a very specific carbon substrate and metabolised only by lactate-utilising bacteria. It is known that when the microbial consortium in anaerobic digestion systems is put under “stress" conditions, lactate is utilised mostly through the formation of propionate as intermediate or end-product

65
Control
Incubation time (h)0 5 10 15 20 25 30
SB (
ml.
h-1
)
0.00
0.05
0.10
0.15
0.20
0.25
0.30
RPY-batch systemRPG-batch systemRPFc-batch systemRKY-batch systemRKG-batch systemRKFc-batch systemSPY-batch systemSPG-batch systemSPFc-batch systemP0-sludgeK0-sludge
2 g.l-1 Glucose
Incubation time (h)0 5 10 15 20 25 30
SB (
ml.
h-1
)
0.00
0.05
0.10
0.15
0.20
0.25
0.304 g.l-1 Lactic Acid
Incubation time (h)0 5 10 15 20 25 30
SB (
ml.
h-1
)
0.00
0.05
0.10
0.15
0.20
0.25
0.30
1 g.l-1 Acetic Acid
Incubation time (h)0 5 10 15 20 25 30
SB (
ml.
h-1
)
0.00
0.05
0.10
0.15
0.20
0.25
0.30
Figure 7.1 Biogas activity (ml.h-1) (SB) of the batch systems with different carbon
substrates added to the BTM as test substrates. The standard
deviation was used as the error-bar length.
A
B C
D

66
Control
Incubation time (h)0 5 10 15 20 25 30
SM (
ml.
h-1
)
0.00
0.02
0.04
0.06
0.08
0.10
RPY-batch systemRPG-batch systemRPFc-batch systemRKY-batch systemRKG-batch systemRKFc-batch systemSPY-batch systemSPG-batch systemSPFc-batch systemP0-sludgeK0-sludge
2 g.l-1 Glucose
Incubation time (h)0 5 10 15 20 25 30
SM (
ml.
h-1
)
0.00
0.02
0.04
0.06
0.08
0.10
4 g.l-1 Lactic Acid
Incubation time (h)0 5 10 15 20 25 30
SM (
ml.
h-1
)
0.00
0.02
0.04
0.06
0.08
0.10
1 g.l-1 Acetic Acid
Incubation time (h)0 5 10 15 20 25 30
SM (
ml.
h-1
)
0.00
0.02
0.04
0.06
0.08
0.10
Figure 7.2. Methanogenic activity (ml.h-1) (SM) of the batch systems with different carbon
substrates added to the BTM as test substrates. The standard deviation
was used as the error-bar length.
A
B C
D

67
(Britz et al., 1999). The degradation of lactic acid thus leads to a smaller variety of intermediate products, compared to the degradation of glucose. Thus as predicted, lower SB and SM activity values for the different batch systems were found when lactic acid was used as test substrate (Figure 7.1C and 7.2C) compared to tests where glucose was used as test substrate. The lower SB and SM activity values for the different batch systems were probably due to the limited number of trophic groups involved in the degradation of lactic acid. Acetic acid is one of the limited carbon substrates that can directly be utilised by the acetoclastic (acetate-utilising) methanogens, Methanosaeta and Methanosarcina (Garrity & Holt, 2001). The addition of 1 g.l-1 acetic acid to the BTM was thus to enhance the activity of the acetoclastic methanogens. Moreover, the growth and substrate degradation rates of acetoclastic methanogens are also quite slow with td values of between 1.5 and 7 days (Wu et al., 1990). The different batch systems showed no SB (Figure 7.1D) and SM (Figure 7.2D) activity when acetic acid was added to the BTM, with the exception of the RKG-batch system that showed a low SB and SM activity. It was concluded that only a limited number of acetoclastic methanogens were present in the RKG-batch system. The acetate activity profiles showed that the acetoclastic methanogen population was either too small to be re-activated, inactive or inhibited in the other batch systems and even control samples (K0 and P0-sludge). However, the methanogenic activity (SM) of the acidogens and lactate-utilising bacteria do suggest that methanogens are present and able to utilise and degrade the intermediate products produced by the acidogens and lactate-utilising bacteria to CH4 and CO2. Since no stimulation of CH4 production was found when acetic acid was used as test substrate, with the exception of the RKG-batch system, it is possible that these methanogens are of the hydrogenotrophic group. Overall from the data, the maximum SB activity values for the different batch systems were generally found to be at the 10 h period of incubation, with the exception of a few batch systems that showed either maximum SB activity after 25 h of incubation or did not show any SB activity after the 25 h incubation period. In the case of methane the maximum SM activities for the different batch systems obtained were found to be after 25 h of incubation, however for some batch systems the maximum SM activity was at 10 h while other batch systems did not show any SM activity. This was ascribed to the slow growth and substrate degradation rate of methanogens that resulted in the limited number of methanogens in the different batch systems only reaching maximum SM activity after 25 h of incubation. To enable comparisons of the impact of the sludge source, carbon substrates and cultivation techniques on the activity between the different batch systems, the SB and SM activity values were used that were obtained at the 10 h period of incubation. i) Impact of sludge source on activity
In this study, the activity of the control samples (K0- and P0-sludges) and the following batch systems (RPY vs. RKY, RPG vs. RKG and RPFc vs. RKFc) were compared in order to evaluate the impact of the sludge source on the activity of the different batch systems. Comparison of the activity of the control samples (K0- and P0-sludges) indicated that the K0-sludge had a higher SB and SM activity than the P0-sludge when glucose was added to the BTM as test substrate (Figure 7.1B). Thus, it was concluded that the acidogenic and methanogenic populations within the K0-sludge were more active than in the P0-sludge. Neither the K0-sludge nor the P0-sludge showed SB and SM activity when either lactic or acetic acids were used as test substrates. It is likely, therefore, that the lactate and acetate-utilising populations were either totally inactive, present in too low numbers to be re-activated or inhibited in the K0 and P0-sludge. When lactic acid was used as test substrate the RKG-batch system showed the highest SB (Figure 7.1C) and SM activity (Figure 7.2C) after the 10 h incubation period, followed by the RPG-batch system. The RKY-batch system showed SB and SM activity only after 25 h of incubation. Thus, it was concluded that the lactate-utilisers were more active in the RK-batch systems, than in the RP-batch systems. The control samples (K0 and P0-sludges) did not show SB or SM activity and it was previously concluded that the lactate-

68
utilising population in the K0 and the P0-sludges were very small, inhibited or inactive. However, this section of the data showed that the lactate-utilising populations in the RKG, RPG and RKY-batch systems could be re-activated after the 10 and 25 h incubation periods. It was observed that only the RKG-batch system showed SB (Figure 7.1D) and SM activity (Figure 7.2D) after 25 h of incubation when acetic acid was added to the BTM as test substrate. Thus, in this case it was concluded that the acetoclastic methanogenic population was present but, in limited numbers, in the K0-sludge. However, it was also concluded that the acetoclastic populations in the P0-sludge and RP-batch systems were either very small, inactive or even inhibited when acetate was used as carbon substrate. Due to activity of the acidogens (Figure 7.1B) and lactate-utilising bacteria (Figure 7.1C) and resulting methanogenic activity (Figures 7.2B and 7.2C) it can be speculated that although an acetoclastic population was inactive in the RP-batch systems and P0-sludge, the hydrogenotrophic methanogens were active and able to utilise and degrade the intermediate products produced by the acidogens and lactate-utilising bacteria. ii) Impact of batch system carbon substrates on activity In this study, the activity of the control samples (K0 and P0) and the following batch systems was compared: RPY vs. RPG vs. RPFc and RKY vs. RKG vs. RKFc, in order to evaluate the impact of the three different carbon substrates used as growth substrates (lactate, glucose and fruit cocktail effluent medium) on the activity of the different batch systems. The RKG-batch system showed the highest SB and SM activity (Figures 7.1B and 7.2B) when glucose was added as test substrate after 10 h of incubation. Only the RKY and RKFc-batch systems showed SB and SM activity after 25 h of incubation with the RKY-batch system exhibiting higher SB and SM activities than the RKFc-batch system. The order for SB and SM activity of the RP-batch system after 10 h of incubation was RPY = RPG (RPFc = 0). From the results of this study, it was clear that the addition of glucose as carbon substrate to the RK-batch system (RKG-batch system) resulted in the best enhancement of the activity of the acidogens and methanogenic populations. The fact that the control sample, K0-sludge, contained a higher number of acidogens than the P0-sludge may likely be the reason why the addition of glucose gave the best results in terms of the SB and subsequent SM activity of the RK-batch system. The addition of lactic acid and glucose to the P0-sludge inoculated batch systems as activity test substrates, led to more or less equal SB and SM activities (Figures 7.1B and 7.2B) of all the RP-type batch systems, suggesting that the addition of both lactate and glucose as carbon substrates equally enhanced the acidogenic and methanogenic activity of all the RP-batch systems. These results can be ascribed to the fact that the degradation of glucose leads to the formation of a greater variety of intermediate products, such as butyrate, lactate, acetate and propionate (Aguilar et al., 1995) that consequently can be degraded to CH4 and CO2 by the methanogens.
The fruit cocktail cultivated batch systems (Fc) showed no SB or SM activity at 10 or 25 h incubation for all the RK-type and RP-type batch systems when glucose, lactic or acetic acid were used as test substrates. The cellulose fibres present in the Fc are -glycoside carbohydrates that are more difficult to hydrolyse than -glycoside carbohydrates such as starch and sucrose (Zoetemeyer et al., 1982) and it might be speculated that the overall conversion rate of fruit cocktail effluent as carbon substrate was thus limited.
iii) Impact of batch cultivation techniques In this study, the activity resulting from the use of batch cultivation techniques was compared, namely: RPY vs. SPY; RPG vs. SPG and RPFc vs. SPFc. The activity data summarised for all the RP-type and SP-type batch systems in Figures 7.1B, 7.1C, 7.1B and 7.1C, showed that the SP-batch systems (shake-waterbath) exhibited more SB and SM activity (SPG > RPG, SPY > RPY, SPFc > RPFc) than the RP-batch systems (roller-table). The maximum SB activity and SM activity for the SP-batch

69
system was observed at the 10 h period of incubation with glucose and lactic acid as test substrates. The maximum tempo of SB activity for the RP-batch system was also observed at 10 h when glucose was used as test substrate, however maximum SM activity for the RP-batch system was only observed at the 25 h incubation period. When lactic acid was used as test substrate, the maximum tempo of SB and SM activities for the RP-batch systems were also observed after 25 h of incubation.
Thus, from the results it is clear that the shake-waterbath cultivation technique led the SP-batch system to produce more biogas and methane at an earlier incubation period (10 h), whilst the roller-table technique, eventually after a 25 h incubation period, resulted in the highest biogas and methanogenic activity. Granule formation In this study, the influence of the source of sludge, batch cultivation techniques and different carbon substrates were investigated to evaluate the impact on enhanced granulation. Granule count data showed that for the control batches, K0-sludge (day 0) contained a lower number of granules than the P0-sludge (day 0). Thus, the raw anaerobic P0-sludge that was used as a control sample already contained a measure of granulation before its use as inoculum. After 14 days of incubation the number of granules showed different levels of increases for all the batch systems.
The use of the roller-table technique (R) for batch cultivation resulted in a greater increase of granules than found when the shake-waterbath technique (S) was used. The roller-table technique was also a gentler and less vigorous technique than the shake-waterbath technique and probably increased the contact time between the biomass and the substrate. Granule formation was not optimally enhanced during these batch cultivation studies due to limited formation and production of fluffy granules. Chen & Lun (1993), and more recently, Raskin (2001) reported that the first step of granulation was the formation of nuclei and acetoclastic methanogens were mainly involved in nucleus formation. The activity test results indicated that the acetoclastic methanogens were inactive in all the P0- and K0-cultivated batch systems, with the exception of the RKG-batch system. Therefore, it can be speculated that granulation was not optimally enhanced, as the major nuclei formers were not active in all the batch systems, with the exception of the RKG-batch system. ECP content of batch cultivated granular sludge It is believed that the level of ECP produced by bacteria in anaerobic sludge is of importance in the granulation process, however information on the precise role of ECP during granulation is still very limited (Ross, 1984; Costerton, 1987). This study was done to investigate the effect of the ECP content and composition from different batch systems on granule formation. The data of the composition of the ECP extracted from the different batch studies is shown in Table 7.2. In all tests, triplicate measurements were made and results quoted are averages. The data indicated that large variations of the protein, carbohydrate, lipid and DNA analyses was found of the ECP for some of the batch systems. These large variations in composition were ascribed to the heterogeneity within the sludge batches used for the cultivation studies. The ECP content was calculated and also presented as a fraction of the VSS content of the different anaerobic granular sludge batches (Figure 7.3). An examination of the composition of the ECP content of the different batch systems did not show any readily discernible trends. In all batches, more proteinacous ECP (ECPP) was produced

70
than carbohydrate ECP (ECPC). The protein: carbohydrate ratio for all the batch systems was > 1, which is typical for anaerobic sludges (Morgan et al., 1990).
In this study, the amount of lipids found in the ECP was higher than previously found for granules and generally found to be in the range of ECPC. The amount of DNA was found, as expected, to be present in very low concentrations when compared with the protein, carbohydrate and lipid concentrations. Although the K0-sludge had a lower total ECP content (47.53 mg.g-1 VSS) than the P0-sludge (50.21 mg.g-1 VSS), no discernible trend was observed that batch systems inoculated with P0-sludge, had a higher total ECP content at day 14 than batch systems inoculated with K0-sludge. Comparisons between the granule count of the different batch systems at day 14 also showed no similar trend to the total ECP content after batch cultivation of granular sludge. Results from this study, however, indicated that SPFc and RPFc had the highest total ECP content of 68.39 and 70.07 mg.g-1 VSS, respectively. Therefore, it was concluded that fruit cocktail effluent (Fc) as carbon substrate contributed to a higher total ECP content. The cellulose fibres, as well as the fructose in the fruit cocktail effluent are -glycoside carbohydrates that are known to be more difficult to hydrolyse than -glycoside carbohydrates such as starch and sucrose (Zoetemeyer et al., 1982). Thus, it can be speculated that the bacterial cells then probably excrete these carbohydrates as ECP.
The changes in total ECP content, as well as the changes in the different components of ECP were compared with the increase in granule count from day 0 to day 14 in order to further investigate the effect of ECP on granule formation. From the data it was clear that the RP-batch system resulted in the highest increase of granule numbers, followed by the RK-batch system. These results confirmed the conclusion on granule formation that the roller-table technique resulted in a higher increase in granule numbers during batch cultivation of granular sludge. The total ECP content and composition, however, did not show a discernible trend with granule formation during batch cultivation of granular sludge.
K0 P0 SPY SPG SPFc RPY RPG RPFc RKY RKG RKFc
EC
P c
on
ten
t (m
g.g
-1 V
SS
)
0
10
20
30
40
50
DN
A c
on
ten
t (m
g.g
-1 V
SS
)
0.0
0.1
0.2
0.3
0.4
0.5
Protein Carbohydrate Lipid DNA
Figure 7.3. ECP composition (mg.g-1 VSS) of the controls (K0 and P0) at day 0 and the different batch systems on day 14 of the batch cultivation studies.

71
Table 7.2 Composition of ECP (mg.g-1 VSS) extracted during the different granulation studies. System Total ECP Prot Carbo Lipid DNA Prot:Carbo K0 47.53 31.81*3.621 6.27*0.236 9.44*0.196 0.014*0.0030 5.07 P0 50.21 33.66*0.479 7.30*0.232 9.23*0.614 0.020*0.0044 4.61 SPY 48.62 32.29*1.874 7.70* 0.148 8.61*0.987 0.024*0.0032 4.19 SPG 53.59 36.14*0.000 7.86*0.440 9.57*1.669 0.018*0.0006 4.60 SPFc 68.39 46.76*1.917 10.74*0.501 10.87*0.743 0.023*0.0070 4.35 RPY 54.16 39.01*1.438 6.45*0.237 8.68*0.308 0.016*0.0061 6.05 RPG 52.31 38.29*2.982 6.05*0.075 7.95*0.523 0.014*0.0033 6.33 RPFc 70.07 51.55*9.052 8.15*0.121 10.35*2.503 0.020*0.0004 6.33 RKY 58.46 42.17*0.852 8.01*0.276 8.26*1.647 0.020*0.0061 5.27 RKG 55.00 39.38*10.489 7.01*0.353 8.60*1.683 0.015*0.0012 5.62 RKFc 49.56 29.85*2.982 9.73*0.323 9.97*0.586 0.013*0.0002 3.07 *Standard deviation (SD) value
Results showed that the changes in ECPP followed the same trend as for the increase in total ECP content. Protein was found to be the most dominant component of ECP, and therefore it was likely that the increase in ECPP really represented the increase in total ECP content. The comparison between the increase in ECPC and granule count indicated that the ECPC showed only a slight increase (less than 5 mg.g-1 VSS) for some batch systems, and even a decrease in ECPC was observed for the RPY- and RPG-batch systems. All the batch systems where fruit cocktail effluent (Fc) was used as carbon substrate showed an increase in ECPC. The SPFc-batch system, followed by the RKFc-batch system, showed the highest increase in ECPC. It can be concluded that when fruit cocktail effluent was used as carbon substrate, it did not only result in the highest increase in ECPP (SPFc and RPFc) but also the highest increase in ECPC (SPFc and RKFc). The fibres from the fruit cocktail effluent probably acted as support to which the cells adhered and produced ECP. Moreover, it can be speculated that it was more difficult for the different trophic groups to hydrolyse the -glycoside carbohydrates (cellulose fibres and fructose) and probably excreted these carbohydrates as ECP. It is not clear whether bacteria adhere reversibly to each other and then produce ECP, or initially produce ECP and then adhere irreversibly (Rutter et al., 1984).
Unfortunately, no discernible trend was observed when the changes in lipid and DNA contents were compared to the increase in granule numbers.

72
7.5 Conclusions Results from this study showed that the source of sludge used as inoculum had a major effect on enhancement of granulation. The use of an anaerobic sludge for the initiation of batch cultivation that already had a measure of granulation, such as the P0-sludge, resulted in a greater increase in granule numbers at the end of the cultivation period. It was also concluded that the control sample, K0-sludge, had more acidogenic and methanogenic populations than the P0-sludge control sample. The use of a different sludge source as inoculum however did not show a discernible trend for changes in total ECP content and ECP composition between the different batch systems studied.
Activity test results using acetic acid as test substrate indicated that the acetoclastic methanogens were either inactive, present in low numbers or inhibited in all the different batch systems studied, with the exception of the RKG-batch system. The addition of glucose as carbon growth substrate to the K0-sludge (RKG-batch system) was sufficient to re-activate the inactive acetoclastic methanogenic population in the original K0-sludge inoculum. Chen & Lun (1993) and Raskin (2001) reported that it appears as if granulation can be easier initiated by the formation of nuclei, and that acetoclastic methanogens were mainly the bacteria involved in nucleus formation. From the granule formation results it can be concluded that the active acetoclastic methanogen populations in the RKG-batch system were present in limited numbers, because the RP-batch systems still resulted in a greater increases in granule numbers than the RKG-batch system. Based on the data it appeared that the use of the pre-granulated P0-sludge led to the greater increase in granule numbers in the RP-type batch systems, compared to the RK-type batch systems. The two-batch cultivation techniques investigated showed that the use of the roller-table technique resulted in a higher increase in granule numbers by day 14 of batch cultivation than when the shake-waterbath technique was used. Methanogenic and biogas activity results indicated that the shake-waterbath technique had a higher tempo of gas production at an earlier period of incubation (10 h). Nevertheless, the roller-table technique eventually resulted in the highest gas production rates at the later incubation stage (25 h). Thus, it can be speculated that the higher tempo of gas production at an earlier stage of incubation might have shortened the contact time between biomass and the substrate, resulting in a lower increase in granule numbers. The two batch cultivation techniques (roller-table and shake-waterbath) however did not impact the changes in the total ECP content and ECP composition in the different batch systems studied. It was also found that the addition of glucose as carbon not only enhanced the activity of the acidogens, but also led to the establishment of a greater variety of trophic groups (lactate-utilisers and hydrogenotrophic methanogens) within all the glucose cultivated batch systems (SPG, RPG and RKG-batch systems), as compared to when lactate and fruit cocktail effluent were used as carbon substrates. However, although the addition of the three carbon substrates (lactate, glucose and fruit cocktail) impacted the activity of all the different batch systems, no discernible trend was observed in granule formation itself. During this study, the different sludge sources used as inoculum for batch cultivation studies made comparisons between all the different batch systems difficult, because sludge is a biological system of which the composition of sludge, even within the same batch, can differ widely even on a daily basis.

73
CHAPTER 8
GENERAL COMMENTS
Background Increasing population and subsequent industrial activities causes many developing countries to suffer from severe environmental pollution. Pollution control is, therefore, of great concern and it is, therefore, extremely important to develop low cost wastewater treatment systems, which combine a high efficiency with a simple construction and an easy operational profile, as well as some form of valorisation of pollutants. One such treatment option is the anaerobic digestion process. The treatment of wastewaters was greatly stimulated by the development of the UASB process and its successful full-scale application. The UASB design permits high space loading rates (5 - 30 kgCOD.m-3d-1 at low hydraulic retention times of 24 h). However, one of the main problems in the application is the extensively long start-up periods.
The characteristics of the granular sludge are the striking feature of the UASB system as the bacteria somehow aggregate to form the granules. Since the operational efficiency and performance of these systems are dictated by the formation and activity of the granules, the potential use of the UASB is limited by the extended start-up periods. To address this problem a Water Research Commission project was started in 1995 to investigate the granulation process. This study was based on the hypothesis (Riedel & Britz, 1993) that when sudden stress conditions are applied to UASB systems under controlled environmental conditions, an enhancement of the granulation process takes place. The hypothesis was successfully used to develop a biological model for the simulation of the process. From the biological model, the operational parameters that must be applied to enhance the granulation were identified and these could be modified to give granulation enhancement of 100 – 1 200% (by numbers). The system was also tested by using batch grown granules as inoculum for 2-l and 50-l UASB units and this led to stabile systems at HRTs of 10 - 20 h, COD removal of 85 - 93% at OLR of 4.0 to 9.2 kgCOD.m-3.d-1 within 20 to 30 days. However, granule production is still only on small batch-scale and before the system can be of industrial value it will have to be evaluated on larger scale.
The promising results obtained showed that the separate culturing of granules holds a lot of promise for application of the UASB technology in South Africa as a stable high-rate biological treatment option. The successful cultivation of granules on larger scale has important economic implications for the optimisation of biological treatment processes in terms of faster start-up, independence of our industries from importation of granules from overseas, improved granule settlability, biomass retention and higher loading rates. Discussion of results The research in this study focussed on the granulation process in larger batch simulated UASB systems, and in particular, the enhancement of the process, characterisation of the produced granular sludge and selection of suitable seeding inoculum. The following conclusions were reached from the results obtained: 1. Larger scale batch culturing The use of UASB bioreactors in the treatment of wastewaters depends on the development of an effective granular sludge bed. In previous studies a biological model was developed for the simulation of the granulation process in very small batch systems. In this study the impact of larger scale batch systems (shaking waterbath, shaking platform and roller-table)

74
in the scaling up of the granulation model from a small batch system (250 ml) to a larger batch system (5 l), were evaluated. It was found that it is difficult to compare different volumes on the same mixing system using the same mixing speed without also taking into consideration the effect of the additional flow dynamics, which might occur within a larger container. The data clearly indicated that the roller-table (granule increase 460%) had the best potential for handling larger volumes. It was also found that the addition of Fe2+ was found to positively contribute to aggregation. 2. Inoculum seeding source The source and composition of the anaerobic granular sludge used as inoculum for the batch cultivation process can have a significant influence on the effectivity of granulation enhancement. This was demonstrated in Chapter 2 where Athlone Waterworks anaerobic sludge had to be used instead of the Kraaifontein Waterworks anaerobic sludge. Differences in the extent of granulation as well as in the type and amount of volatile fatty acids produced indicated the differences that existed between the anaerobic communities present in the Athlone and Kraaifontein anaerobic digesters. This can be expected since the two facilities treat different types of wastewaters, with Athlone treating a combination of industrial and domestic effluents while Kraaifontein treats mostly domestic wastewater. When comparing the results it would appear as if a predominantly "domestic" anaerobic sludge, such as what was originally obtained from Kraaifontein, would be a better choice for a "seeding inoculum". As previously mentioned, the Kraaifontein Waterworks's anaerobic digester had a series of breakdowns, which made it impossible to obtain the same quality anaerobic sludge.
It was these results, which led to a series of short investigations into how the addition of different agents may enhance granulation further in the batch cultivation system. Some of these investigations gave promising results, although the quality of the batch cultivated granular sludge still left much to be desired. In the meantime, the search for a good quality local "domestic" anaerobic sludge continued. In the later part of the project, batch cultivation was also done using anaerobic sludge from the Paarl Waterworks. This facility also received a combination of industrial and domestic wastewater for treatment, but the effluents were treated separately and anaerobic sludge was obtained from the anaerobic digester fed with domestic wastewater. The Paarl anaerobic sludge proved to be a better choice as a seeding inoculum since the granular sludge content after batch cultivation was much more promising than what was obtained with the Kraaifontein anaerobic sludge. Granulation still did not, however, occur to the same extent as what was initially obtained with the original Kraaifontein anaerobic sludge population. The precise requirements that an anaerobic sludge should fulfil for it to be successfully used as an inoculum for the batch cultivation process are not yet fully defined at this time. In general it is known that a variety of factors influence granulation in UASB reactors. These include factors like the presence of divalent cations (such as Fe2+ and Ca2+) (Yu et al., 2000; Mahoney et al., 1987) and inert matter (Wirtz & Dague, 1996), the accumulation of extracellular polymers (ECP) and the presence of essential microbial populations, which may serve as essential nuclei for granulation. An example of such a population is the acetoclastic methanogens, specifically Methanosaeta, which have been reported to be essential for granule formation (MacLeod et al., 1990; Grotenhuis et al., 1991; Zheng & Raskin, 2000; Raskin, 2001). It is thus logical to assume that the elements important in UASB reactors are the same elements, which are essential in anaerobic digesters. It would thus be wise to use a sludge inoculum for the batch cultivation process, which is well balanced in all respects, with all the necessary elements and populations present, and in the right quantities and numbers.
From the results obtained from the mineral analyses and the activity tests definite differences between the different anaerobic sludges were observed. It is interesting to note that the Paarl anaerobic sludge which recently showed the most promising results in terms

75
of increase in granular content also had the highest content of Nickel, Calcium and Iron, all which are known to stimulate growth of an acetoclastic organism such as Methanosaeta concilii (Boone et al., 2001). Another important element that promotes growth of this specific organism is Co, which none of the sludge samples contained. This may just be one of the reasons why it was impossible to recently obtain the same extent of granulation as was reported by Britz et al. (1999). 3. Development of a reliable activity test The activity method of Owen et al. (1979) was evaluated in terms of efficiency and applicability in determining the activity of granular samples and was found to be time consuming. Results obtained with a modified assay method were found to be more accurate, and the impact of the different test substrates (glucose, lactate, acetate and formate) on activity was more evident. The activity of 7 different sources of anaerobic granules was subsequently evaluated. In this study activity was not measured in volume of gas produced per unit COD converted or volatile suspended solids, which requires more time, but as tempo of gas production (ml.h-1) in a standardised basic growth medium. The activity data obtained were also displayed as bar charts giving valuable usable information about population dynamics as well as possible substrate inhibition. Calibration scales constructed from the data also improve the ease with which the activity of different granules and granular sludges can be compared. 4. Impact of carbon and nitrogen sources on granule batch production The need for granular seed-sludge for the start-up of UASB bioreactors is crucial in countries where granules are not readily available. A method has been developed to enhance granule production but there are many system environmental parameters that influence the production method. In this study the impact using different carbon (lactate, glucose, sucrose, lactate + glucose, lactate + fruit effluent, and glucose + fruit effluent) and nitrogen (peptone, urea and ammonium sulphate) sources, concentrations and combinations, was evaluated to find a more economically viable combination to be used for granulation enhancement. Nitrogen sources were found to be less critical for the enhancement of granules. For the carbon sources, glucose was found to give the best enhancement of granule numbers for single carbon additions, followed by lactate. A combination of lactate + glucose resulted in the best enhancement of granule numbers when carbon combinations were used. The fruit effluent, the cheapest carbon source, in combination with glucose gave the best increase in granule numbers. A major problem encountered was the need for a simplistic method to standardise the sludge inoculum. The varying quality of the raw sludge caused a problem when studies done on different batches had to be compared in terms of increases/decreases, and when a kinetic value had to be assigned to the enhancement. To overcome this problem, the best unit of each carbon source/combination was repeated using a standardised sludge-batch. Glucose again gave the best granule enhancement, followed by lactate and fruit effluent. 5. Impact of preservation methods on storage potential and activity When granules become freely available as seeding inoculum for UASB bioreactors, a reliable preservation method will be required. The level of activity of the methanogenic population in the granules is especially important when determining the efficiency of the bioreactor, as methane is the main metabolic end-product of an anaerobic digestion system. In this study, six different preservation techniques (room temperature storage; vacuum-drying; freeze-drying; vacuum freeze-drying; freeze storage and cold storage) were evaluated. The new activity test was used to evaluate the efficiency of the different preservation techniques in terms of the tempo of biogas and methane production. Freeze-

76
drying showed the best activity followed by vacuum freeze-drying, vacuum-drying and room temperature preservation. 6. ECP composition and granule activity It is generally believed that extracellular polymers (ECP) play a major role in the granulation process. Unfortunately, no universal standardised ECP extraction method is used and therefore comparison of results from the literature has to be made with caution. In this study an ECP extraction method was evaluated that optimised extraction time and included a control for cell lyses. Subsequently, this method was used to determine granule ECP composition from various full and laboratory-scale UASB reactors. The activity of the different UASB granules was also evaluated and correlated with the ECP composition of the various UASB granules. The optimal extraction time for the granules was determined at 4 h and it was found that the dominant component consisted of protein and the protein:carbohydrate ratio was always >1. However, it was found that when granules were used to treat acidogenic wastewater, the dominant ECP component from the acidogenic granules consisted of mainly carbohydrates. The ECP composition and protein:carbohydrate ratio was thus impacted by the composition of the wastewater fed to a UASB. Moreover, it was found that granules with higher ECP yields exhibited greater biogas (SB) and methane (SM) activities. 7. Impact of sludge sources, substrates and cultivation techniques on granule
activity and ECP composition During the batch cultivation of granular sludge there are many system parameters that impact the production method. In this study, the impact of two sludge sources (Paarl and Kraaifontein), carbon substrates (lactate, glucose and fruit effluent) and batch cultivation techniques (roller-table and shake-waterbath) on enhanced batch granule cultivation, metabolic activity and ECP composition of granular sludge, was investigated. It was again found that the roller-table cultivation technique resulted in the best increase in granule numbers. The use of glucose as carbon substrate did not only enhance the activity of the acidogenic populations, but also led to the establishment of a greater variety of trophic groups, such as the lactate-utilisers and hydrogenotrophic methanogens. It was also found that in the fruit effluent cultivated batch systems led to an enhancement of ECP production. As a whole, variations in ECP composition of the granules from the different batch systems were found, and this was ascribed to the heterogeneity of the sludge used for the batch cultivation studies. One important conclusion that was reached was that granulation did not proceed optimally in all the different batch system combinations studied. Data from the acetate activity profiles showed that the major nuclei formers (acetoclastic methanogenic populations, Methanosarcina and Methanosaeta) appeared to be absent or inactive in all the different batch systems and control samples. RECOMMENDATIONS The main objective of this research programme was focussed on the granulation process in larger batch systems, and in particular, the enhancement of the process, characterisation and activity of the granular sludge and selection of suitable seeding inoculum. The successful cultivation of granules on larger scale has important economic implications in terms of a faster start-up, independence from importation of granules, improved settlability, biomass retention and higher loading rates. 1. The data obtained in the study clearly indicated that the roller-table design showed the best potential for handling larger volumes. However, it was difficult to compare different

77
volumes on the same mixing system using the same mixing speed without also taking into consideration the effect of the additional flow dynamics, which occurs in larger containers. To reach the best flow dynamics, container size, mixing attributes and rotation speed will have to be optimised before the maximum granule enhancement can be obtained. 2. A major problem encountered during the study was the need for a simplistic method to standardise the sludge inoculum and to evaluate the enhancement level. The varying quality of the raw sludge causes a problem when studies on different batches have to be compared in terms of increases/decreases, and when a kinetic value has to be assigned to the enhancement. 3. The source and microbial consortium composition of the granular sludge used as inoculum for the batch cultivation process was found to have a significant influence on the effectivity of granulation enhancement. The precise requirements that an anaerobic sludge should fulfil for it to be successfully used as an inoculum for the batch cultivation process are not yet fully defined. From the studies done it is now known that a variety of factors influence granulation in UASB reactors and include factors like the presence of divalent cations, the presence of inert matter, the accumulation of ECP and the presence of essential microbial populations, which may serve as essential nuclei for granulation. An example of such a population is the acetoclastic methanogens (acetate utilising-methane-forming population), specifically Methanosarcina and Methanosaeta concilii, which appear to be essential for granule formation. Data from the acetate activity profiles showed that these major nuclei formers (acetoclastic methanogenic populations, Methanosarcina and Methanosaeta) appeared to be absent or inactive in all the different batch systems and control samples. It would thus be essential to use a sludge inoculum for the batch cultivation process, which is active and well balanced in all respects, with all the necessary elements and populations present, and in the right quantities and numbers. These observations emphasize the importance and need for an active, effective and balanced anaerobic community to be present in any anaerobic sludge that will be used as "seeding inoculum" for future batch cultivation studies. A list of parameters to which a seeding inoculum must conform to be used in the batch cultivation process must thus be compiled.

78
CHAPTER 9
REFERENCES
Aguilar, A., Casas, C. & Lema, J.M. (1995). Degradation of volatile fatty acids by differently enriched methanogenic cultures: kinetics and inhibition. Water Research, 29, 505-509.
Ahring, B.K. & Schmidt, J.E. (1992). Methanogenic subpopulations and microbial structure of UASB granules. In: Proceedings of the 3rd Southern African Anaerobic Digestion Symposium. Pp. 24-36. Pietermaritzburg, South Africa.
Alibhai, K.R.K. & Forster, C.F. (1986). An examination of the granulation process in UASB reactors. Environmental Technology Letters, 7, 193-200.
Alphenaar, P.A., Groeneveld, N. & Vanaelst, A.C. (1994). Scanning electron microscopic method for internal structure analysis of anaerobic granular sludge. Micron Microscopia Acta, 25, 129-133.
Alphenaar, P.A., Visser, A. & Lettinga, G. (1993). The effect of liquid upward velocity and hydraulic retention time on granulation in UASB reactors treating wastewater with a high sulphate content. Bioresource Technology, 43, 249-258.
American Public Health Association (APHA). (1992). Standard Methods for the Examination of Water and Wastewater, 18th ed. Washington DC, USA: American Public Health Association.
American Public Health Association. (1995). Standard Methods for the Examination of Waste and Wastewater (19th Ed.). Washington DC, USA.
Angelidaki, I., J.E. Schimdt, L. Ellegaard & Ahring, B.K. (1998). An automatic system for simultaneous monitoring of gas evolution in multiple closed vessels. Journal of Microbiological Methods, 33, 93-100.
BCA-200 protein assay kit. (unknown). Pierce Instructions. Bhatti, I.B., Furukawa, K. & Fujita, M. (1995). Comparative composition and characteristics
of methanogenic granular sludges treating industrial wastes under different conditions. Journal of Fermentation and Bioengineering, 79, 273-280.
Bligh, E.G. & Dyer, W.J. (1959). A rapid method of total lipid extraction and purification. Canadian Journal of Biochemistry and Physiology, 37, 911-917.
Boone, D.R., Whitman, W.B. & Koga, Y. (2001). Family II. Methanosaetaceae. In: Bergey's Manual of Systematic Bacteriology, 2nd Edition, Volume 1: The Archaea and the deeply branching and phototrophic Bacteria (D.R. Boone & R.W. Castenholz, eds.). Pp. 289-294. New York: Springer.
Britz, T.J., Trnovec, W., Van Schalkwyk, C. & Roos, P. (1999). Enhanced granulation in upflow anaerobic sludge-bed digesters (UASB) by process induction and microbial stimulation. Water Research Commission Report No. 667/1/99. Pretoria, South Africa.
Britz, T.J., Van Schalkwyk, C. & Roos, P. (2000). Development of a method to produce anaerobic granules in a laboratory batch system. In: Proceedings of the 4th International Symposium on Environmental Biotechnology. Pp. 119-122. Noordwijkerhout, The Netherlands.
Britz, T.J., Van Schalkwyk, C. & Roos, P. (2002). Development of a method to enhance granulation in a laboratory batch system. Water SA, 28, 49-54.
Brown, M.J. & Lester, J.N. (1980). Comparison of bacterial extracellular polymer extraction methods. Applied and Environmental Microbiology, 40, 179-185.
Chang, Y., Nishio, N. & Nagai, S. (1995). Characteristics of granular methanogenic sludge grown on phenol synthetic medium and methanogenic fermentation of phenolic synthetic waste water in a UASB reactor. Journal of Fermentation and Bioengineering, 79, 348-353.
Chen, J. & Lun, S.Y. (1993). Study on mechanism of anaerobic sludge granulation in UASB reactors. Water Science and Technology, 28, 171-178.

79
Chernicharo, C.A.L. & Campos, C.M.M. (1991). A new methodology to evaluate the behaviour of anaerobic sludge exposed to potentially inhibitory compounds. Water Science and Technology, 24(12), 201-210.
Chynoweth, D.P. (1987). Overview. In: Anaerobic Digestion of Biomass (edited by D.P. Chynoweth & R. Isaacson). Pp. 1-14. Amsterdam: Elsevier Applied Science Publishers.
Coates, J.D., Coughlan, M.F. & Colleran, E. (1996). Simple method for the measurement of the hydrogenotrophic methanogenic activity of anaerobic sludges. Journal of Microbiological Methods, 26, 247-246.
Colleran, E. (1988). Report on the technological aspects of granulation in granular anaerobic sludge. Microbiology and Technology. In: Proceedings of the GASMAT Workshop. Pp. 237-240. Lunteren, The Netherlands.
Colleran, E., Concannon, F., Golden, T., Geoghegan, F., Crumlish, B., Killilea, E., Henry, M. & Coates, J. (1992). Use of methanogenic activity tests to characterize anaerobic sludges, screen for anaerobic biodegradability and determine toxicity thresholds against individual anaerobic trophic groups and species. Water Science and Technology, 25(7), 31-40.
Condina, J.C., Ascension Murioz, Cazorla, F.M., Perez-Garcfa, A., Moririigo, M.A. & De Vincente, A. (1998). The inhibition of methanogenic activity from anaerobic domestic sludges as a simple toxicity bioassay. Water Research, 32(4), 1338-1342.
Costerton, J.W., Cheng, K.J., Geesey, G.G., Ladd, T.I., Nickel, J.C., Dasgupta, M. & Marrie, T.J. (1987). Bacterial biofilms in nature and disease. Annual Review of Microbiology, 41, 435-464.
Costerton, J.W., Irvin, R.T. & Cheng, K.J. (1981). The bacterial glycocalyx in nature and disease. Annual Review of Microbiology, 35, 299-324.
De Zeeuw, W. (1984). Acclimatization of anaerobic sludge for UASB-reactor start-up. Ph.D. Thesis, University of Wageningen, Wageningen, The Netherlands.
Dignac, M.F., Urbain, V., Rybacki, D., Bruchet, A., Snidaro, D. & Scribe, P. (1998). Chemical description of extracellular polymers: Implication on activated sludge floc structure. Water Science and Technology, 38, 45-53.
Dolfing, J. & Bloemen, W.G.B.M. (1985). Activity measurements as a tool to characterise the microbial composition of methanogenic environments. Journal of Microbiological Methods, 4, 1-12.
Dolfing, J. and Mulder, J-W. (1985). Comparison of methane production rate an coenzyme F420 content of methanogenic consortia in anaerobic granular sludge. Applied and Environmental Microbiology, 49, 1142-1145.
Dolfling, J., Griffioen, A., Van Neerven, A. R. W. & Zevenhuizen, L.P.T.M. (1985). Chemical and bacteriological composition of granular methanogenic sludge. Canadian Journal of Microbiology, 31, 744-750.
Dubois, M., Giles, K.A., Hamilton, J.K., Rebers, P.A. & Smith, F. (1956). Colorimetric method for determination of sugars and related substances. Analytical Chemistry, 28, 350-356.
DyNa Quant 200 Fluorometer User Manual. (unknown). Pharmacia, Biotech. Ehlinger, F., Audic, J.M., Verrier, D. & Faup, G.M. (1987). The influence of the carbon
source on microbiological clogging in an anaerobic filter. Water Science and Technology, 19, 261-273.
El-Mamouni, R., Guiot, S.R., Leduc, R. & Costerton, J.W. (1995). Characterization of different microbial nuclei as potential precursors of anaerobic granulation. Journal of Biotechnology, 39, 239-249.
Eng, S.C., Fernandes, X.A. & Paskins, A.R. (1986). Biochemical effects of administrating shock loads of sucrose to a laboratory-scale anaerobic (UASB) effluent treatment plant. Water Research, 20, 789-794.

80
Fang, H.H.P. (1997). Microbial distribution and syntrophic association in UASB granules. In: Proceedings of the 8th International Conference on Anaerobic Digestion. Pp. 83-90. Sendai, Japan.
Fang, H.H.P., Chui, H.K. & Li, Y.Y. (1994). Microbial structure and activity of UASB granules treating different wastewaters. Water Science and Technology, 30, 87-96.
Fang, H.H.P., Chui, H.K. & Li, Y.Y. (1995). Microstructural analysis of UASB granules treating brewery wastewater. Water Science and Technology, 31, 129-135.
Forday, W. & Greenfield, P.F. (1983). Anaerobic digestion. Effluent and Water Treatment Journal, 23, 405-410.
Forster, C.F. (1991). Anaerobic upflow sludge blanket reactors: aspects of their microbiology and their chemistry. Journal of Biotechnology, 17, 221-232.
Fukuzaki, S., Nishio, N. & Nagai, S. (1995). High rate performance and characterization of granular methanogenic sludges in upflow anaerobic sludge blanket reactors fed with various defined substrates. Journal of Fermentation and Bioengineering, 79, 354-359.
Garcia-Morales, J.L., Nebot, E., Cantoral, J.M., Romero, L.I. & Sales, D. (1996). Methanogenic and acidogenic activity tests in an anaerobic thermophilic reactor. Biotechnological Techniques, 10(4), 249-252.
Garrity, G.M. & Holt, J.G. (2001). Phylum All. Euryarchaeota phy. nov. In: Bergey’s Manual of Systematic Bacteriology, Vol.1 (edited by G.M. Garrity, D.R. Boone & R.W. Castenholz), 2nd ed. Pp. 268-269, 289. York, PA, USA: Springer-Verlag.
Gehr, R. & Henry, J.G. (1983). Removal of extracellular material. Water Research, 17, 1743-1748.
Grotenhuis, J.T., Smit, M., Plugge, C.M., Xu, Y-S., Van Lammeren, A.A., Stams, A.J. & Zehnder, A.J. (1991). Bacteriological composition and structure of granular sludge adapted to different substrates. Applied and Environmental Microbiology, 57, 1942-1949.
Grotenhuis, J.T.C., Smit, M., Van Lammeren, A.A.M., Stams, A.J.M. & Zehnder, A.J.B. (1990). Localization and quantification of extracellular polymers in methanogenic granular sludge. Applied Microbiology and Biotechnology, 36, 115-119.
Guiot, S.R., Arcand, Y. & Chavarie, C. (1992). Advantages of fluidisation on granule size and activity development in upflow anaerobic sludge bed reactors. Water Science and Technology, 26, 897-906.
Guiot, S.R., Lavoie, L., Rocheleau, S., Macleod, F.A. & Costerton, J.W. (1991). Extracellular polymeric substances in anaerobic granules. In: Proceedings of the 6th International Symposium on Anaerobic Digestion. P.12. Sâo Paulo, Brazil, (Poster Abstracts).
Harada, H., Endo, G., Tohya, Y. & Momonoi, K. (1988). High rate performance and its related characteristics of granulated sludges in UASB reactors treating various wastewaters. In: Proceedings of the 5th International Symposium on Anaerobic Digestion. Pp. 1011-1020. Bologna.
Hawkes, D.L., Horton, R. & Stafford, D.A. (1978). The use of anaerobic digestion for the treatment and recycling of organic wastes. Conservation & Recycling, 2, 181-195.
Hickey, R.F. & Switzenbaum, M.S. (1991). The response and utility of hydrogen and carbon monoxide as process indicators of anaerobic digesters subject to organic and hydraulic overloads. Journal of the Water Control Federation, 63, 129-140.
Housley, J.N. & Zoutberg, G.R. (1994). Application of the Biothane waste water treatment system in the soft drink industry. Journal of the Institution of Water and Environmental Management, 8, 239-245.
Hulshoff, L., Euler, H., Eitner, A. & Wucke, A. (1997). A GTZ sectoral project ‘Promotion of anaerobic technology for the treatment of municipal and industrial sewage and wastes’. In: Anaerobic Conversions for Environmental Protection, Sanitation and Re-Use of Residues. REUR Technology Series 51. Pp. 96-107. Rome, FAO.

81
Hungate, R.E. (1969). A roll tube method for cultivation of strict anaerobes. Methods in Microbiology, 3B, 117-132.
Ince, 0., Anderson, G.K. & Kasapgil, B. (1995). Control of organic loading rate using the specific methanogenic activity test during start-up of an anaerobic digestion system. Water Research, 29(1), 349-355.
Jain, M.K., Zeikus, J.G. & Bhatnagar, L. (1991). Methanogens. In: Anaerobic Microbiology – A Practical Approach (edited by P.N. Levett). Pp. 223-245. Oxford: IRL Press.
James, A. Chernicharo, C.A.L. and Compos, C.M.M. (1990). The development of a methodology for the assessment of specific methanogenic activity. Water Research, 24, 813-825.
Jeison, D. & Chamy, R. (1998). Novel technique for measuring the size distribution of granules from anaerobic reactors for wastewater treatment. Biotechnology Techniques, 12, 659-662.
Jia, X.S., Fang, H.H.P. & Furumai, H. (1996a). Surface charge and extracellular polymer of sludge in the anaerobic degradation process. Water Science and Technology, 34, 309-316.
Jia, X.S., Fang, H.H.P. & Furumai, H. (1996b). Yields of biomass and extracellular polymers in four anaerobic sludges. Environmental Technology, 17, 283-291.
Johnson, J.L. (1994). Similarity analysis of DNA’s. In: Methods for General and Molecular Bacteriology (edited by P. Gerhardt, R.G.E. Murray, A. Wood, & N.R. Krieg). P. 663. Washington DC, USA: American Society for Microbiology.
Kato, M.T., Field, J.A. & Lettinga, G. (1993a). High tolerance of methanogens in granular sludge to oxygen. Biotechnology and Bioengineering, 42, 1360-1366.
Kato, M.T., Field, J.A. & Lettinga, G. (1993b). Methanogenesis in granular sludge exposed to oxygen. FEMS Microbiological Letters, 114, 317-324.
Keller, G. & Warrack, B. (1997). Analysis of variance. In: Statistics for Management and Economics, 4th ed. Pp. 577-590. USA: Duxbury Press.
Lamb, E.J. (1995). Methanogenesis as a treatment option for the degradation of potentially hazardous industrial streams. M.Sc. Thesis, University of the Orange Free State, Bloemfontein, South Africa.
Lettinga, G. & Hulshoff Pol, L.W. (1991). UASB-process design for various types of waste waters. Water Science and Technology, 24, 87-107.
Lettinga, G., De Man, A., Grin, P. & Hulshoff Pol, L.W. (1987). Anaerobic waste water treatment as an appropriate technology for developing countries. La Tribune Du Cebedeau, 519, 21-32.
Lettinga, G., Hulshoff Pol, L.W., Zeeman, G., Field, J., Van Lier, J.B., Van Buuren, J.C.L., Janssen, A.J.H., & Lens, P. (1997). Anaerobic treatment in sustainable environmental production concepts. In: Proceedings of the 8th International Conference on Anaerobic Digestion. Pp. 32-39. Sendai, Japan.
Lettinga, G., Van Velsen, A.F., Hobma, S.M., De Zeeuw, W. & Klapwijk, A. (1980). Use of upflow sludge blanket (USB) reactor concept for biological wastewater treatment. Biotechnology and Bioengineering, 22, 699-734.
MacLeod, F.A., Guiot, S.R. & Costerton, J.W. (1990). Layered structure of bacterial aggregates produced in an upflow anaerobic sludge bed and filter reactor. Applied and Environmental Microbiology, 56, 1598-1607.
Mah, R.A. (1982). Methanogenesis and methanogenic partnerships. Philosophical Transactions of the Royal Society of London, 297, 599-616.
Mahoney, E.M., Varangu, L.K., Cairns, W.L., Kosaric, N. & Murray, R.G.E. (1987). The effect of calcium on microbial aggregation during UASB reactor start-up. Water Science and Technology, 19, 249-260.
Marchaim, U. & Krause, C. (1993). Propionic to acetic acid ratios in overloaded anaerobic digestion. Bioresource Technology, 43, 195-203.

82
Moosbrugger, R.E., Sam-Soon, P.A.L.N.S., Wentzel, M.C., Ekama, G.A., Lowenthal, R.E. & Marais, G.v.R. (1992). Pelletization in UASB systems. WRC Report No 249/1/93. Pretoria, South Africa.
Moreno, G., Cruz, A. and Buitron, G. (1999). Influence of So/Xo ratio on anaerobic activity. Water Science and Technology, 40, 9-15.
Morgan, J.W., Forster, C.F. & Evison, L. (1990). A comparative study of the nature of biopolymers extracted from anaerobic and activated sludges. Water Research, 24, 743-750.
Morgan, J.W., Goodwin, J.A.S., Wase, D.A.J. & Froster, C.F. (1990). The effects of using various types of carbonaceous substrates on UASB granules and on reactor performance. Biological Wastes, 34, 55-71.
Myburg, C. & Britz, T.J. (1993). Influence of higher organic loading rates on the efficiency of an anaerobic hybrid digester while treating landfill leachate. Water SA, 19, 319-324.
Nel, L H., Britz, T J. & Lategan, P M. (1985). The effect of trace elements on the performance efficiency of an anaerobic fixed film reactor treating a petrochemical effluent. Water SA, 11, 107-110.
O’Kennedy, O.D. (2000). Application of biogranules in the anaerobic treatment of distillery effluent. M.Sc. Thesis, University of Stellenbosch, Stellenbosch, South Africa.
Owen, W.F., Stuckey, D.C., Healy, J.B., Young, L.Y. & McCarty, P.L. (1979). Bioassay for monitoring biochemical methane potential and anaerobic toxicity. Water Research, 13, 485-492.
Owen, W.F., Stuckey, D.C., Healy, J.B., Young, L.Y. and McCarty, P.L. (1979). Bioassay for monitoring biochemical methane potential and anaerobic toxicity. Water Research, 13, 485-492.
Pipyn, P. & Verstraete, W. (1981). Lactate and ethanol as intermediates in two-phase anaerobic digestion. Biotechnology and Bioengineering, 23,1145-1154.
Quarmby, J. & Forster, C.F. (1994). A comparative study of the physical characteristics of anaerobic granular sludges. Transactions of the Institution of Chemical Engineers, 72, 241-246.
Raskin, L. (2001). Use of molecular probes to understand anaerobic digestion. In: Proceedings of the 9th International Symposium on Anaerobic Digestion. Pp. 43-44. Antwerpen, Belgium.
Riedel, K-H.J. & Britz, T.J. (1993). Propionibacterium species diversity in anaerobic digesters. Biodiversity and Conservation, 2, 400-411.
Ross, W.R. (1984). The phenomenon of sludge pelletisation in the anaerobic treatment of maize processing waste. Water SA, 10, 197-204.
Rutter, P.R., Dazzo, F.B., Freter, R., Gingell, D., Jones, G.W., Kjelleberg, S., Marshall, K.C., Mrozek, H., Rades-Rohkohl, E., Robb, I.D., Silverman, M. & Tylewska, S. (1984). Mechanisms of adhesion. In: Microbial Adhesion and Aggregation (edited by K.C. Marshall). Pp. 5-20. Berlin: Springer-Verlag.
Sam-Soon, P.A.L.N.S., Lowenthal, R.E., Dold, P.L. & Marais, G.v.R. (1987). Hypothesis for pelletisation in the upflow anaerobic sludge bed reactor. Water SA, 13, 69-80.
Sam-Soon, P.A.L.N.S., Lowenthal, R.E., Wentzel, M.C., & Marais, G.v.R. (1990). Growth of biopellets on glucose in upflow anaerobic sludge bed (UASB) systems. Water SA, 16, 151-164.
Schmidt, J.E. & Ahring, B.K. (1994). Extracellular polymers in granular sludge from different upflow anaerobic sludge blanket (UASB) reactors. Applied Microbiology and Biotechnology, 42, 457-462.
Schmidt, J.E. & Ahring, B.K. (1995). Granulation in thermophilic upflow anaerobic sludge blanket (UASB) reactors. Antonie van Leeuwenhoek, 68, 339-344.
Schmidt, J.E. & Ahring, B.K. (1996). Granular sludge formation in upflow anaerobic sludge blanket (UASB) reactors. Biotechnology and Bioengineering, 49, 229-246.

83
Shen, C.F., Kosaric, N. & Blaszczyk, R. (1993). The effect of selected heavy metals (Ni, Co and Fe) on anaerobic granules and their extracellular polymeric substance (EPS). Water Research, 27, 25-33.
Shin, H-S., Bae, B-U. & Oh, S-E. (1993). Preservation characteristics of anaerobic granular sludge. Biotechnology Letters, 15, 537-542.
Slobodkin, A. & Verstraete, W. (1993). Isolation and characterization of Veillonella sp. from methanogenic granular sludge. Applied Microbiology and Biotechnology, 39, 649-653.
Smalla, K., Cresswell, N., Mendonca-Hagler, L.C., Wolters, A. & van Elsas, J.D. (1993). Rapid DNA extraction protocol from soil for polymerase chain reaction-mediated amplification. Journal of Applied Bacteriology, 74, 78-85.
Smibert, R.M. & Krieg, N.R. (1994). Phenotypic characterisation. In: Methods for General and Molecular Bacteriology (edited by P. Gerhardt, R.G.E. Murray, A. Wood & N.R. Krieg). P. 649. Washington DC, USA: American Society for Microbiology.
Smith, J.S. (1994). Evaluation of analytical data. In: Introduction to the Chemical Analysis of Foods (edited by S.S. Nielsen). Pp. 51-63. Boston, MA: Jones and Bartlett Publishers.
Smith, P.K., Krohn, R.I., Hermanson, G.T., Mallia, A.K., Gartner, F.H., Provenzano, M.D., Fujimoto, E.K., Goeke, N.M., Olson, B.J. & Klenk, D.C. (1985). Measurement of protein using bicinchoninic acid. Analytical Biochemistry, 150, 76-85.
Sorensen, A.H. & Ahring, B.K. (1993). Measurements of the specific methanogenic activity of anaerobic digester biomass. Applied Microbiology and Biotechnology, 40, 427-431.
Stanley, P. & Zubay, G. (1993). Biosynthesis of complex carbohydrates. In: Biochemistry (edited by G. Zubay), 3rd ed. Pp. 585-589. Dubuque, IA: Wm. C. Brown Publishers.
Switzenbaum, M.S., Giraldo-Gomez, E. & Hickey, R.F. (1990). Monitoring of the anaerobic methane fermentation process. Enzyme and Microbial Technology, 12, 722-730.
Trnovec, W. & Britz, T.J. (1998). Influence of organic loading rate and hydraulic retention times on the efficiency of a UASB bioreactor treating a canning factory effluent. Water SA, 24, 147-152.
Uemura, S. & Harada, H. (1993). Microbial characteristics of methanogenic sludge consortia developed in thermophilic UASB reactors. Applied Microbiology and Biotechnology, 39, 654-660.
Valcke, D. & Verstraete, W. (1993). A practical method to estimate the acetoclastic methanogenic biomass in anaerobic sludges. Journal of Water Pollution Control Federation, 55, 1191-1195.
Van Lier, J.B., Tilche, A., Ahring, B.K., Macarie, H., Moletta, R., Dohanyos, M., Hulshoff Pol, L.W., Lens, P. & Verstraete, W. (2001). New perspectives in anaerobic digestion. Water Science and Technology, 43, 1-18.
Vanderhaegen, B., Ysebaert, B., Favere, K., Van Wambeke, M., Peeters, T., Panic, V., Vandenlangenbergh, V. & Verstraete, W. (1992). Acidogenesis in relation to in-reactor granule yield. Water Science and Technology, 25, 21-30.
Veiga, M.C., Jain, M.K., Wu, M-W., Hollingsworth, R.I. & Zeikus, J.G. (1997). Composition and role of extracellular polymers in methanogenic granules. Applied and Environmental Microbiology, 63, 403-440.
Verstraete, W. & Vandevivere, P. (1999). New and broader applications of anaerobic digestion. Critical Reviews in Environmental Science and Technology, 28, 151-173.
Weiland, T.T. & Rozzi, A. (1991). The start-up, operation and monitoring of high-rate anaerobic treatment systems: Discusser’s Report. Water Science and Technology, 24, 257-277.
Witz, R.A. & Dague, R.R. (1996). Enhancement of granulation and start-up in the anaerobic sequencing batch reactor. Water and Environmental Research, 68, 883-892.

84
Wu, W-M., Hickey, R.F., Bhatnagar, L., Jain, M.K. & Zeikus, J.G. (1990). Fatty acid degradation as a tool to monitor anaerobic sludge activity and toxicity. In: 44th Purdue University Industrial Waste Conference Proceedings, Pp. 225-233, Purdue.
Wu, W-M., Jain, M.K., Thiele, J.H. & Zeikus, J.G. (1995). Effect of storage on the performance of methanogenic granules. Water Research, 29, 1445-1452.
Yu, H.Q., Fang, H.H.P. & Tay, J.H. (2000). Effects of Fe2+ on sludge granulation in upflow anaerobic sludge blanket reactors. Water Science and Technology, 41, 199-205.
Yükselen, M.A. (1997). Preservation characteristics of UASB sludges. Journal of Environmental Science and Health, 32, 2069-2076.
Zeikus, G. (1977). Carbon monoxide oxidation by methanogenic bacteria. Journal of Biotechnology, 131, 118-126.
Zeikus, J.G. (1980). Microbial populations in digesters. In: Anaerobic Digestion (edited by D.A. Stafford, B.E. Wheatly & D.H. Hughes). Pp. 61-81. London: Applied Science Publishers.
Zellner, G., Neudörfer, F. & Diekman, H. (1994). Degradation of lactate by an anaerobic mixed culture in a fluidized-bed reactor. Water Research, 28, 1337-1340.
Zhang, X., Bishop, P.L. & Kinkle, B.K. (1999). Comparison of extraction methods for quantifying extracellular polymers in biofilms. Water Science and Technology, 39, 211-218.
Zheng, D. & Raskin, L. (2000). Quantification of Methanosaeta species in anaerobic bioreactors using genus- and species-specific hybridization probes. Microbial Ecology, 39, 246-262.
Zoetemeyer, R.J., Matthijsen, A.J.C.M., Van den Heuvel, J.C., Cohen, A. & Boelhouwer, C. (1982). Anaerobic acidification of glucose in an upflow reactor. Biomass, 2, 187-199.
Zubay, G. (1993). Nucleotides. In: Biochemistry, 3rd ed. Pp. 547-584. USA: Wm. C Brown Publishers.