mass accuracy and absolute mass high resolution... · 1/25/2015 1 mass accuracy and absolute mass...
TRANSCRIPT

1/25/2015
1
Mass Accuracy and Absolute Mass
Matt Renfrow
Biochemistry & Molecular Genetics
1‐26‐2015
Masses of elements and their isotopes
• Mass is defined using the mass of carbon‐12 being 12.0000 (exactly)
• On this scale,– 1H is 1.007825 and 2H is 2.014102
– 14N is 14.003074 and 15N is 15.000108
– 16O is 15.994915, 17O is 16.999132 and 18O is 17.999161
– 31P is 30.973761
– 32S is 31.972071 and 34S is 33.967867

1/25/2015
2
Assigning numerical value to the intrinsic property of “mass” is based on using carbon-12, 12C, as a reference point.
One unit of mass is defined as a Dalton (Da).
One Dalton is defined as 1/12 the mass of a single carbon-12 atom.
Thus, one 12C atom has a mass of 12.0000 Da.
How is mass defined?
Isotopes
+Most elements have more than one stable isotope.
For example, most carbon atoms have a mass of 12 Da, but in nature, 1.1% of C atoms have an extra neutron, making their mass 13 Da.
+Why do we care?
Mass spectrometers can “see” isotope peaks if their resolution is high enough.
If an MS instrument has resolution high enough to resolve these isotopes, better mass accuracy is achieved.

1/25/2015
3
Element Mass AbundanceH 1.0078
2.014199.985%0.015
C 12.000013.0034
98.891.11
N 14.003115.0001
99.640.36
O 15.994916.999117.9992
99.760.040.20
Stable isotopes of most abundant elements of peptides
1981.84
1982.84
1983.84
Mass spectrum of peptide with 94 C-atoms (19 amino acid residues)
No 13C atoms (all 12C)
One 13C atom
Two 13C atoms
“Monoisotopic mass”

1/25/2015
4
Monoisotopic mass
Monoisotopic masscorresponds tolowest mass peak
When the isotopes are clearly resolved the monoisotopic massis used as it is the most accurate measurement.
Average massAverage mass corresponds to the centroid of the unresolved peak cluster
When the isotopes are not resolved, the centroid of the envelope corresponds to the weighted average of all the the isotope peaks in the cluster, which is the same as the average or chemical mass.

1/25/2015
5
6130 6140 6150 6160 6170
Poorer resolution
Better resolution
What if the resolution is not so good?
At lower resolution, the mass measured is the average mass.
Mass
15.01500 15.01820 15.02140 15.02460 15.02780 15.03100
Mass (m/z)
100
0
10
20
30
40
50
60
70
80
90
100
% In
ten
sity
ISO:CH3
15.0229M
FWHM = M
R = M/M
How is mass resolution calculated?
1/25/2015
6
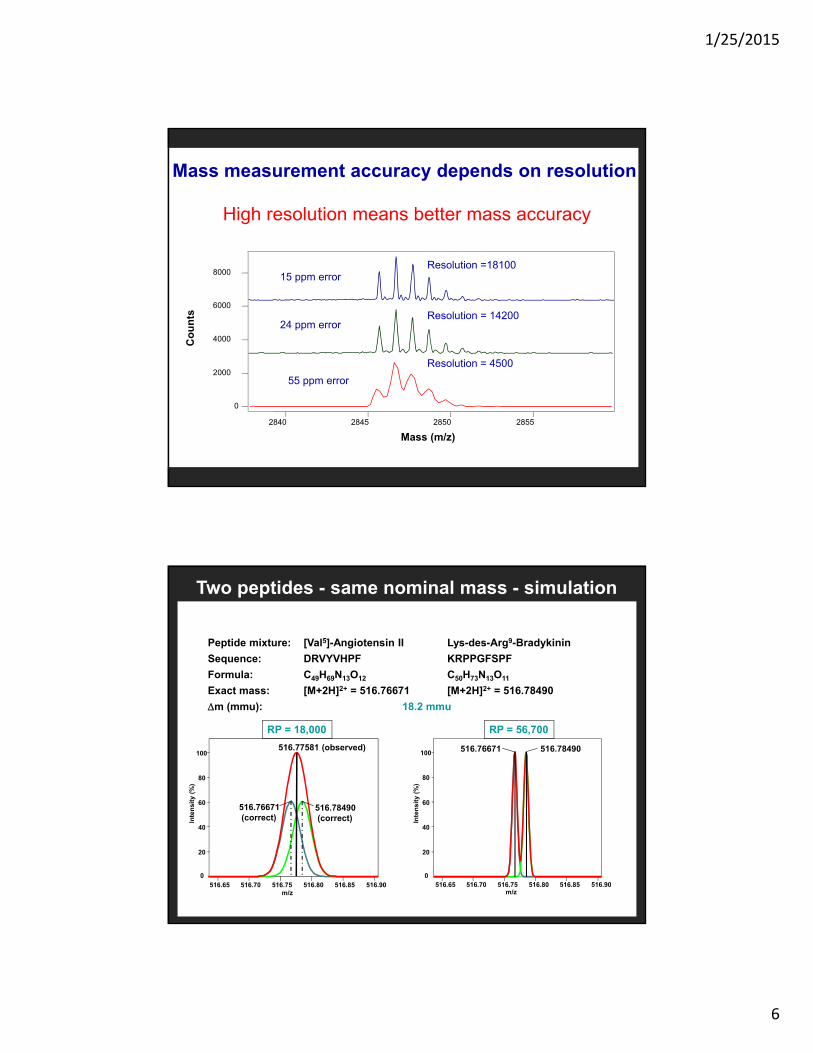
Mass measurement accuracy depends on resolution
0
2000
4000
6000
8000
Co
un
ts
2840 2845 2850 2855
Mass (m/z)
Resolution = 14200
Resolution = 4500
Resolution =18100 15 ppm error
24 ppm error
55 ppm error
High resolution means better mass accuracy
Two peptides - same nominal mass - simulation
Peptide mixture: [Val5]-Angiotensin II Lys-des-Arg9-Bradykinin
Sequence: DRVYVHPF KRPPGFSPF
Formula: C49H69N13O12 C50H73N13O11
Exact mass: [M+2H]2+ = 516.76671 [M+2H]2+ = 516.78490
m (mmu): 18.2 mmu
RP = 18,000
Inte
nsi
ty (
%)
0
20
40
60
80
100
m/z516.65 516.70 516.75 516.80 516.85 516.90
516.77581 (observed)
516.76671(correct)
516.78490(correct)
RP = 56,700
Inte
nsi
ty (
%)
0
20
40
60
80
100
m/z516.65 516.70 516.75 516.80 516.85 516.90
516.78490516.76671
1/25/2015
7
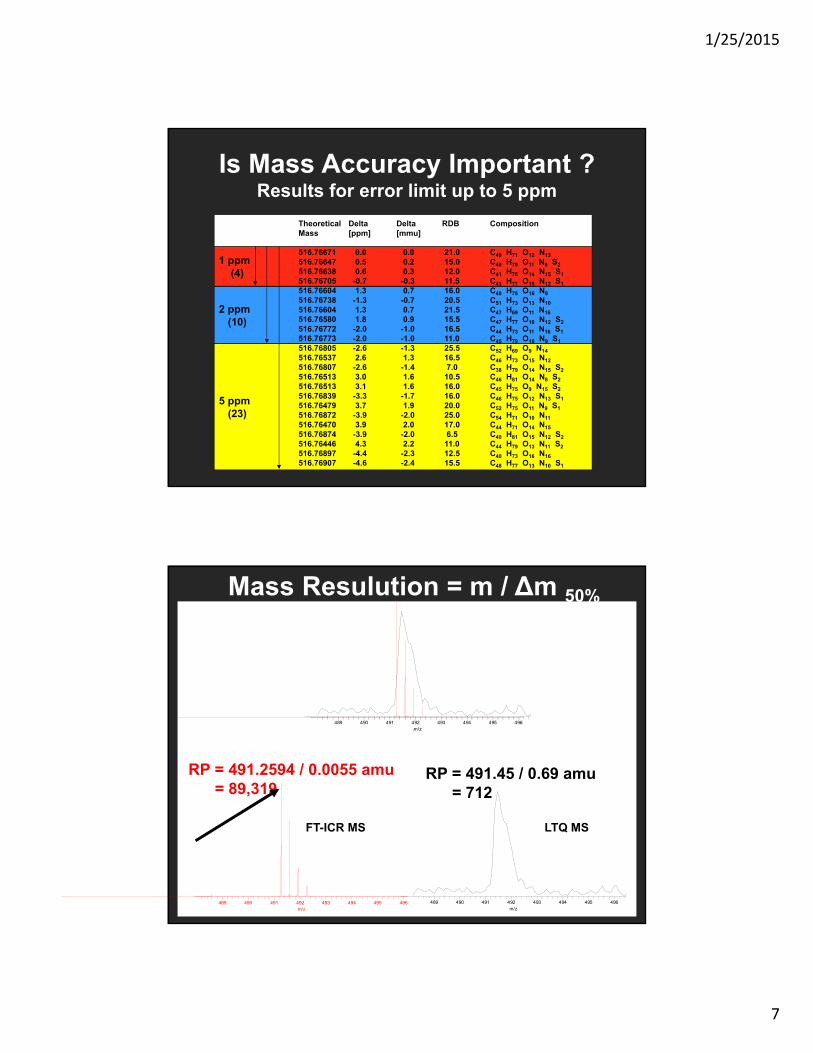
5 ppm(23)
2 ppm(10)
1 ppm(4)
Theoretical Delta Delta RDB CompositionMass [ppm] [mmu]
516.76671 0.0 0.0 21.0 C49 H71 O12 N13
516.76647 0.5 0.2 15.0 C49 H79 O11 N9 S2
516.76638 0.6 0.3 12.0 C41 H75 O14 N15 S1
516.76705 -0.7 -0.3 11.5 C43 H77 O15 N12 S1
516.76604 1.3 0.7 16.0 C48 H75 O16 N9
516.76738 -1.3 -0.7 20.5 C51 H73 O13 N10
516.76604 1.3 0.7 21.5 C47 H69 O11 N16
516.76580 1.8 0.9 15.5 C47 H77 O10 N12 S2
516.76772 -2.0 -1.0 16.5 C44 H73 O11 N16 S1
516.76773 -2.0 -1.0 11.0 C45 H79 O16 N9 S1
516.76805 -2.6 -1.3 25.5 C52 H69 O9 N14
516.76537 2.6 1.3 16.5 C46 H73 O15 N12
516.76807 -2.6 -1.4 7.0 C38 H79 O14 N15 S2
516.76513 3.0 1.6 10.5 C46 H81 O14 N8 S2
516.76513 3.1 1.6 16.0 C45 H75 O9 N15 S2
516.76839 -3.3 -1.7 16.0 C46 H75 O12 N13 S1
516.76479 3.7 1.9 20.0 C52 H75 O11 N9 S1
516.76872 -3.9 -2.0 25.0 C54 H71 O10 N11
516.76470 3.9 2.0 17.0 C44 H71 O14 N15
516.76874 -3.9 -2.0 6.5 C40 H81 O15 N12 S2
516.76446 4.3 2.2 11.0 C44 H79 O13 N11 S2
516.76897 -4.4 -2.3 12.5 C40 H73 O16 N16
516.76907 -4.6 -2.4 15.5 C48 H77 O13 N10 S1
Is Mass Accuracy Important ?Results for error limit up to 5 ppm
489 490 491 492 493 494 495 496m/z
489 490 491 492 493 494 495 496m/z
489 490 491 492 493 494 495 496m/z
FT-ICR MS
RP = 491.2594 / 0.0055 amu= 89,319
Mass Resulution = m / Δm 50%
489 490 491 492 493 494 495 496m/z
LTQ MS
RP = 491.45 / 0.69 amu= 712

1/25/2015
8
2D ion trap detection
Conversion dynodes
2D ion trap detection
Conversion dynodes(electron multipliers)

1/25/2015
9
Put the trap in a high magnetic fieldIon cyclotron resonance
7 Tesla magnet, or 9.4 T or 12 T or 14.5 T

1/25/2015
10
Penning Trap (ICR cell)
magnetic field
Penning Trap (ICR cell)

1/25/2015
11
Detecting in the ion trapIon cyclotron resonance (ICR)
7 Tesla magnet, or 9.4 T or 12 T or 14.5 T
Fourier transform-Ion cyclotron resonance
FT-ICR MS
m/z = k * B / f
Frequencies are converted to masses.

1/25/2015
12
ThermoFinnigan LTQ-FT
LTQ Orbitrap™ Hybrid Mass Spectrometer
API Ion source Linear Ion Trap C-Trap
Orbitrap
Finnigan LTQ™ Linear Ion Trap
Differential pumping
Differential pumping
Inventor: Dr. Alexander Makarov, Thermo Electron (Bremen)

1/25/2015
13
Orbitrap Mass Analyzer
zm
k
/
https://www.youtube.com/watch?v=fqfyyravJkA
https://www.youtube.com/watch?v=zJagpUbnv-Y