mashington seattle dept of mechanical engineering b …
TRANSCRIPT

MASHINGTON UNIV SEATTLE DEPT OF MECHANICAL ENGINEERINGB S KANG ET AL. JUL 86 UUA/DME/TR-86/54
UNCLASS ED N8@814-85-K-8i87 F/G 11/6 UL
EAh-hhh 99hEuhE-EhhI II.mommms

2. 8 2 5
*1.
P111112 2
p .
02.
* 1111L25 1
0:

K:
0Office of Naval Research
JContract N00014-85-K-0187
OTechnical Report No. UWA/DME/TR-86/54
STABLE CRACK GROWTH IN ALUMINUM TENSILE SPECIMENS
by
IB.S.-J. Kang, A.S. Kobayashi and D. Post
July 1986
4
The research reported in this technical report was made possible throughsupport extended to the Department of Mechanical Engineering, University ofWashington, by the Office of Naval Research under Contract N00014-85-K-0187.Reproduction in whole or in part is permitted for any purpose of the United
- States Government.
C-.
-.I.
.i.N -.'

STABLE CRACK GROWTH IN ALUMINUM TENSILE SPECIMENS
AAB.S.-J. Kang , A.S. Kobayashi and D. Post
ABSTRACT
Post's white light moire interferometry was used to obtain sequential
records of the transient u -displacement fields associated with stable cracky
growth in 7075-T6 and 2024-0, single edge notched (SEN) specimens with tatigued
cracks. The u y-displacement fields were used to evaluate the crack tip opening
displacement (CTOD), far and near-field J-integral values, Dugdale strip yield
model, William's polynomial function and the HRR fields.
0
INTRODUCTION
_ Crack growth in ductile material can be divided into three stages, namely,
1) plastic yielding and the onset of stable crack growth, 2) stable crack
,. growth and 3) rapid tearing. Since the measured crack velocity during rapid
"- tearing is less than 5 percent of the dilatational wave velocity E1,2,33, rapid
j tearing and stable crack growth can be considered as quasi-static deformation
processes. The crack-tip state for rapidly tearing and stably growing cracks,
however, are different from that of a stationary crack. Asymptotic analyses of
a stationary crack in an elastic, perfectly plastic solid under infinitesimal
deformation show that the strains vary as i/r but for a growing crack the
strains vary as ln(l/r) [4-83. On the other hand, numerical studies [9-13] on
stable crack growth do not address the crack tip singularity problem but
discuss the somewhat near stress field surrounding the crack tip.
Numerous fracture parameters which characterize stable crack growth under
small-scale yielding condition, such as average crack opening angle (COA) (14],
University of Washington, Department of Mechanical Engineering,Seattle, WA 98195.
A Virginia Polytechnic Institute and State University, Department of* Engineering Science and Mechanics, Blacksburg, VA 24061.

crack tip opening angle (CTOA) (15), crack tip opening displacement (CTOD)
[16], critical strain [17,18], energy release rate (19], crack tip force E20J,
J-resistance curve (211 and tearing modulus (T) (221, have been proposed. Of
these, the crack tip opening angle (CTOA) or displacement (CTOD) was shown to
be suited for modeling stable crack growth and instability during the fracture
process [15,20,21).
Under large-scale yielding condition, however, there is no analytical
solution available for stable crack growth. Attempts have been made to extend
the ductile fracture criteria for small-scale yielding and stable crack growth
to large-scale yielding. The few results published to date (1,2,15,201
indicate that under limited conditions, the CTOA or CTOD, are plausible ductile0
fracture criteria. The purpose of this paper is to present preliminary
experimental findings on the crack tip parameters which control the initiation
and propagation of stable crack growth. An approximate J-integral evaluationUprocedure based on u -displacement field is also presented.
y
ANALYTICAL BACKGROUND
(1) J-integral
For two-dimensional problems of materials governed by nonlinear elasticity
and deformation plasticity theory subjected to monotonically loading condition,
the J-integral is defined as (231
u'.3o
J= W dy- 3 • ds (1)
where
F : contour surrounding the crack tip
: traction vector along the :ontour
01 u : displacement vector on the contour
W : strain energy density on the contour
L44* *l"

II
In the following, an experimental procedure for direct far-field and
' approximate near-field J-integral measurement is introduced. The underlining
methodology is to compute the J value with only the u -displacement field whichy
* is obtained from a single moire interferometry recording.
Far-field J-integral Measurement
Consider a line-integration contour in a single edge notched (SEN)
specimen subjected to Mode I loading condition as shown in Figure 1. Due to
symmetry, only half of the contour is needed for J calculation.
Along the vertical segment 12, 34, which are tree surfaces, the second
4 term of the integrand as well as all stress components except oyy, which is
subject to unaxial tension, in W vanish. Thus, the strain energy density, W,
. along 12, 34 is
W a y dEy
: , andH=1 zFor an elastic field, a yy E and W E Ey, where E is the modulus of
yy yy 2 yy 0of elasticity. Under plastic yielding, e.g., Ey > , the following two
cases are considered. For an elastic, perfectly plastic material,
C Y =aC (2a)
and
2
W-- +a(E -(2b)2 E 0 yy EI
*. For d power hardening material,
YY YY I*L + .L ( _(YIN I 2c)E yy E E aE
and
4.

2" - + N M 2o YYN (2d)
2 E N+l E yy or
where ao is the yield stress, N is the strain hardening constant and % is a
" dimensionless material constant, a is calculated from Equation (2c) tor a
yy
given E which can be determined experimentally from the moire data.-~ yy
Thus the integral value of Equation (1) along the vertical edges of
segments 12 and 34, is
U "W dy
-(W. Ay + (W. Ay (3)1 112 134
where i is the ith segment of the contour.
Along the horizontal segment 23, dy is zero and the first term of the
integrand in Equation (1) vanishes. The traction, 1, along this segment are
T = a and T = i . At this point we assume that the shear stress, -r, .y yy x xy "
and the displacement, u , are negligible along segment 23, This assumption
0 is justified if segment 23 is sufficiently far away from the crack. The
integral value of Equation (1) along segment 23 thus becomes
J T IT
_ dxh 23y ax
Lu= E [(_ Y ). AX.] (4)
* yy &x 1 123
Again, for the a term, the same stress-strain relation, e.g., Equations (2)'. yy
is used. Finally, the J-integral value is given by
J = 2(J + J ) (5)
V 1
04

The above experimental procedure for determining J-integral value was
carried out using strain gaves and linear variable displacement transducers at
discrete points along the specimen boundary [24-261. Since the test data in
these references were obtained from few locations, Equation (5) could only be
- evaluated at a few discrete locations. Moire interferometry, on the other
hand, provides an easy alternative for implementing this method with better
accuracy. Since it yields highly sensitive displacement field, the approximate
analysis proposed above requires only a single u -displacement moire field fory
calculating the J-integral.
0
Near-tield J-integral Measurement
Whil- the above procedure is valid for far-field J-integral evaluation,
its validity for the near field integration contour, such as the inside
rectangular contour shown in Figure 1, must be justified. First, we will show
that the above far field J-integral measurement procedure is a reasonable
approximation for the near-field J value in a linear elastic field.
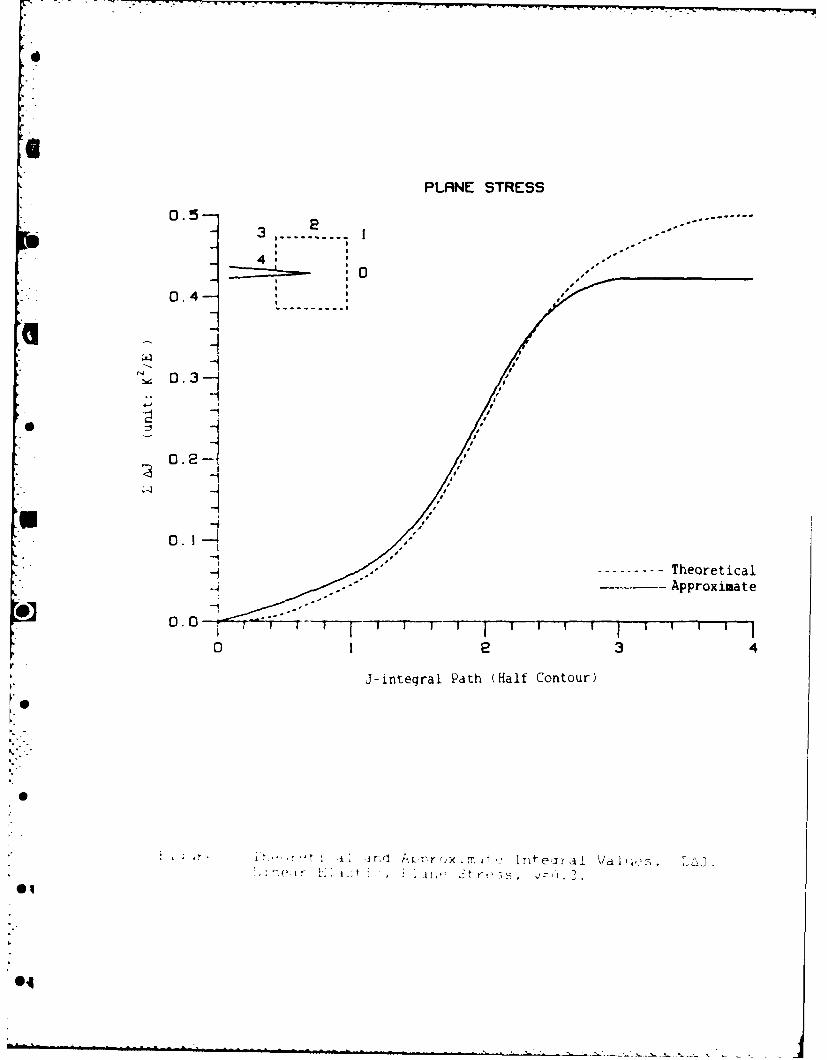
Consider a rectangular contour around the crack tip as shown in the legend
of Figure 2. For a linearly Plastic material, the J integral along the
horizontal segment 13 can be expressed in terms of displacements u and u as* x y
au 3u au au a"Jh -2GM Y Y-- -G x x +M dx (6a)hV 1 3y ax a x (6a
Along the two vertical segments, 01 and 34,
0J' Oudl a 3u au (3u 3
__Y ) +y1 1 (uX +. -1) UX __ - M 1 __}2] )dy (fb)0 1 y 3 -y 3x 3y ax I
where G is the shear modulus, v is the Poisson's ratio and
lv (plane stress)
M O* bc)
l2\, (plane s9train)
M (2M - 1 (6d)2 1
The second term of the integrand in Equations (6a) and (6b) were neglected
in evaluating the tar-tield J-integral. For the near-tield J-integrai
evaluation, we will also assume that the contour integrals, as represented by
Equation .3) and 4), can be used. The error due to such assumption is
evaluated in the rollowing.
Consider a crack in a two dimensional linear elastic material. The mode I
crack -tip displacements are
u os--) [M + si n - (7a)
K Ir-- --- 6 267bu =Gsin- [M - Cos -1 7by 2 T 2T_ 2
where r and 63 are the pOlar coordinates with the origin at the ,rack-tip, K1
*is the mode I Atress intensity ractor and
kPlane &2tres !
Viipianol :,tra iri
M4
I, -Z. plane br11 r:)

After substituting Equations (7a) and (7b) into Equations (6a) and (6b), the
g first and second terms of the integrand in Equations (6a) and (6b) are
evaluated along a non-dimensionalized half square contour, 01234, as shown in
Figure 2. Results of the numerical integration using either the first and
second terms or the first term alone in Equations (6a) and (6b) as one
. .traverses along the half contour are plotted in Figures 2 and 3. In these
figures, the former and latter J-integral values are denoted as "theoretical"
and "approximate" values respectively. Notable is the close proximity between
the theoretical and approximate summation of AJ, E&J, along the contour before
entering segment 34. The nondimensionalized J=LJ values at point 4 shows
about 14% difference between the theoretical and approximate ZAJ values.
We further evaluate the validity of this J approximation procedure for a
crack tip region characterized by a Hutchinson-Rice-Rosengren singular field
[2',283. Again consider a rectangular contour surrounding a crack tip as shown
in the legend of Figure 4. The HRR stress, strain and displacement tield
within this rectangular region can be expressed as [27,28]
* -_
S"c [ O GOOI r 1)+l(
N
N+ l (8b)
NN+I1
.. r[ =U e( ) (8c)
- N
'.."
N+I °ij tij
where IN is a dimensionless constant which varies with Plane stress or plane4V N
strain corditluns. , j, , and u. ( , ire d nm.-rjj ,t s tunt -ns1j 19

of e. For the approximate Jh and J as represented by Equations (3) and (4),v
the needed a and W can be represented as
E
.- GO k yy )I/N (9a)
Pa N+l Y yy (9b)
Equation (9a) and (9b) represents the plastic components of Equations (2c) and
(2di) here the elastic components are assumed negligible in the region
characterized by the HRR field.
The approximate J can then be evaluated by substituting Equations (8a) and
8b) into Equation (9) and evaluating the integral along the0
non-dimensionalized halt square contour. Also, the theoretical J is evaluated
by substituting Equation (8) into Equation (1) and evaluating the integral
along the non-dimensionalized half square contour. A state of plane stress
with N 2, 5, 50 were chosen for this analysis. Numerical values for
ij (-), Eij () and ui (E) were obtained trom [29]. The results are shown in
*Figures 4, 5 and 6. Good agreement between the theoretical and approximate
J-integral are noted.
The results of Figures 2 through 6 suggest that the approximate J as
determined by the far-field solution, is reasonably correct when used in a fR
dominated crack tip region. However, when used in a crack tip tield dominated
by lineir elasticity, the error is noticeable. Figures 2 and 3 show that this
error is generated during the last integration path or along the vertical
-cnfout, line 31, indicating that the assumed uniaxial tension state is n,.t a
*" -reajonarle Approximation or the true Lstate ot elastic stresses along line 34.
4In ,:ontrast, both the assumed uniaxial tension state or stress and the t:ue
state )t Tt r-ses jr the HEk tield alung line 34 have rj Ii i ible er t it o. rht,
.4

J value as evidenced in Figures 4, 5 and 6 with the flat portion along the last
g integration path or line 34, and thus the approximate procedure of evaluating J
works reasonably well. This induced error in the elastic crack tip stress
tield can be reduced it line 34 is situated within the region ot uniaxial
tension or more specitically along a tree boundary. As will be shown later,
under such restriction the approximate J will provide reasonably accurate J
* -values in an elastic rracture specimen.
The J value can also be linked to the crack tip opening displacement
(CTOD) through [30] as
F6= fi J/cro (10)
where D N values can be found in [29].
(2)Duqdale-Barenblatt Strip Yield Model
For an elastic pertect-plastic m-erial, the crack-tip displacement
fields tor a Mode I plane stress Dugdale-Barenblatt strip yield model can be
*expressed [31] as
u" { 2'f-r- cos [l-2v + 2s iln 2 - (l-2,))r Tx 2G r y It rY
-r[(l-2)(T cose + sint logR)-sin8 log R]j
- 1 f()nd rn- I2[F (n,e,v)cose - F' (n,,-v)snf]- ,. +2G n=i, 2n-I 1 3
+(-I) nd r n-F (n,O,v)cos6 - F (n,1d,v.snOP (11a2n 2 4
u I - 24rr sin [2-2d - 2 cos 2-)r logR
+ r[(2-2U)(1ogR CO36 - sine) + T sin']}
0' -n{( _ nid rn -1/2[F (n,' ,)sine + F (n,H,v)cosO]2Gn 2fl-i 13
nn+(-Il)nd r [-F (n,0,v)co3s6 + F (n,3,,) 3ino!I (11b. 2n 24
* where
r =- _-- - - (lc)y 4 c. 8 ao
" nO {7 3 3 3F (n,,v) =( -n-4v)cos(n- - )3 + (n- - )cos(n+ -
12 2 2
F n,O,v) =(3 -n -4v)cos(n - 1)O + (n + 1)cos(n + )6 (1d)2
. . .5 3 3 1F (n,Ov) = ( - +n-4v)sin(n- - )3 -(n - - )sln(n + 1)O3 2 2 2 2
F (n,),v) -(3+n-4v)sin(n-1)6 + (n+l)sin(n+lI)O4
-2 Yrr cos 0/2S=tan
- i
y
L [(r - r Z + 4r r cos Z/2 )Jl/z
r + r - 2 Tr r-sin 0/2y y
Ki 27
and K is the Mode I stress intensity tactor.
The C-TOD tor the Duigdale-Barenblatt strip yield model become [31]
r - r r + r'" - CTOD = ° r ( - --- Y ) log ( Y '' )
,. D G4-4v) Ir r 2 r r - ry y y
'dG nr \-i zn-iF F3Fn,T, + -i)d nrnF2(n, , ,v (12)
EXPERIMENTAL APPROACH
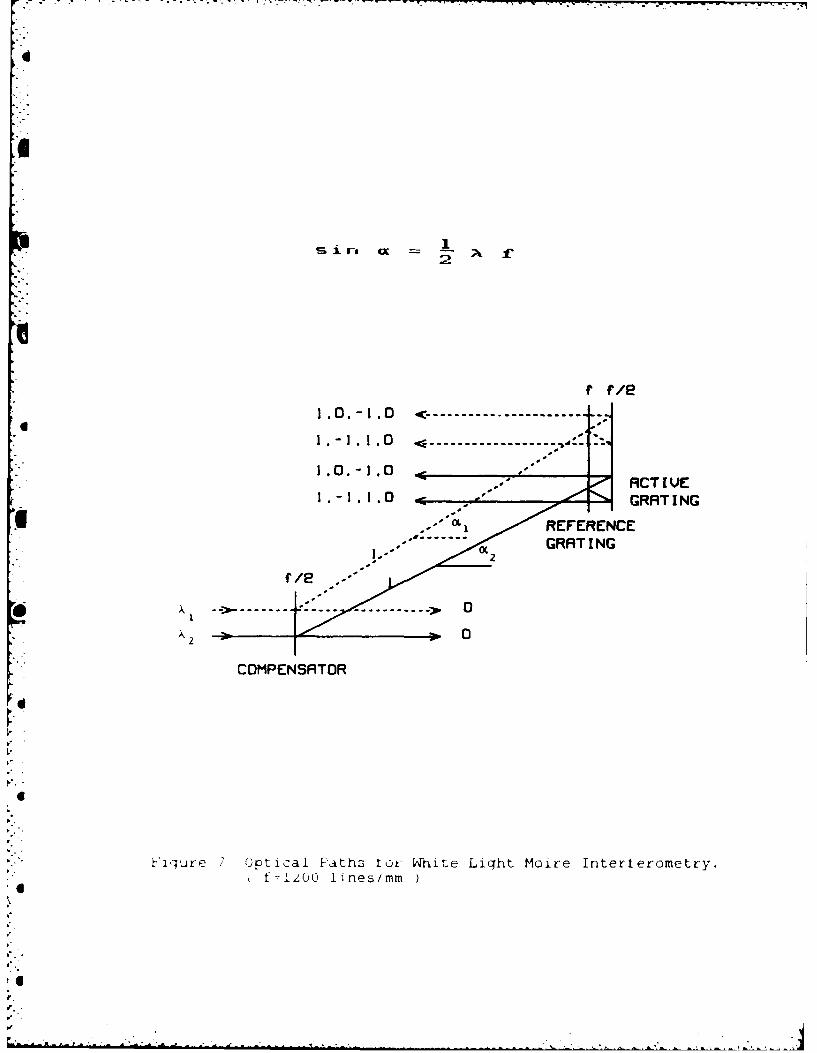
S@:White light moire interterometry [32] was used to obtain a single-trame
record ot static and dynamic displacement tields surrounding the crack tip in
slowly and rapidly tracturing 7-Tb and 2024-0 aluminum 'EN specimens.
0-4 Figures 7 and H show the optical system which utilizes a compensator grating ot
halt trequency, w/£, where t 1 '00 lines/mm, to illuminate the reterence and
.4
,.-.

F
specimen gratings ot tull and halt trequencies, respectively. The achromatic
light emerges trom the compensstor as monochromatic light beami at dirterent
diftraction angles and generates the same moire pattern tor each wave length.
The camera recLrds the scalar sum ot the light intensities associated with
various wave length and tnus much Lt the oriqinal white light intensity is
recovered. When an incoherent iight source is used, the gap between the
reerence nd 7I ve gratings must be small. This white light moire
[ r.,rt,rc r :v *rvides the hiih sensitivity associated with high trequency
-a ir :. . rcht light source using a relatively simple experimental
'- r am . :rin-e patterns were recorded on a 35 mm camera
-. IJ" rltri. A motor-driven camera provided up to 66
2" :I rA rIz cf the moire tringes. Using this
_ _, urce, which is used to align the optical
1., tt- : r d t record dynamic moire tringei ,. t id _' t'
r.- r4. '. :.~:r -, ~r, .' vincrea dispiacement
i ad~ngs. ]'ne Jp - i men ._" i F r p r ..... r, , . prp tes d, d i r2 tw material
cCe t - in: r jr tle. T,>W er ra ". r irIn .tr ,-:tair1 eiat!..,I ur shown inFi jure T. These materiai f r)- r:jji irldct C t[,at a lrn um Th. 't
essentiajly an el-stic-per ' . U na .rji, hle U 4 a
rardenng materiai. : *<nc. 1 ,ni typical wn; e I ght moire
in ,..'t eo .m,,tr y trr ir , rat t., . ., rij . rijr r i " ',. . aT id inr.l o .EJ :-pecim n with
. a . rt ; r ,". i I, .i.' .r. , f pr" ) idur Ka" s d to
r,. ?:-'i ,,. , , *p , :I ri g 2 rit paths
L -
. . . -. . .1. . . •. . .... . . . . . . ... . ... . . .:. ....r ,. . . . _ .,w . . .. . ... . .. . .. . .. .. . ... ... .. . . .. . . . . . -

7075-Tb SEN Specimens
Since 7075-T6 aluminum is a relatively brittle material with the crack-tip
being surrounded with small scale yielding, the tar-tield J value as well as
the near-tield J value outside or the yield zone can be determined by elastic
analysis. These elastic values are used to verity the accuracy or the
experimental and data reduction procedures used in this paper.
Figure 12 shows the log-log plot or the u -displacement versus radialy
distance up to marked boundary where the slope was 0.5+0.05. Experimental
deviation in the slope of log u versus log r curve was determined by lineary
regression or a straight line fitting through the data points in Figure 12 and
4then computing the percentage deviation in slope from the crack tip. The
average slope of 1/2 in the vicinity ot the crack tip indicates that the
elastic field prevailed in this specimen up to a distance 1.2 mm from the
crack tip. The approximate J values which were determined by the above
mentioned J evaluation procedure are shown in Table 1. Also shown for
comparison purpose in Table 1 are the corresponding stress intensity factor
values computed by K = Vf-E using the J values obtained trom the moire
fringes and the K values computed by using the tormula in ASTM STP 410 [33],
the William s polynomial function [34] and the Dugdale strip yield model.
Figure 13 is the corresponding plots or the stress intensity ractor, K, versus
applied load. Good agreements between the measured K and that computed by ASTM
STP 410 results are noted. Also shown in Table 1 are the experimentally
0 measured and the computed CTOD values based on the Dugdale-Barenblatt strip
yield model. The computed CTOD value were obtained by least square titting
" Equation (il) with n=2 which is a four parameter characterization ot the crack
e tip stress rield to the u --displacement tield ot the moire trinqes. The
C-y
0

parameters, (e.g. d and r ) were then back substituted to Equation (12) andn y
the CTOD value was computed. Figure 14 shows CTOD plots ot the 7075-T6 fatigue
L'. precracked specimens versus applied load. The same CTOD values were observed
before the onset of unstable crack growth in this fatigue pre-cracked SEN
specimens.
Table 2 shows the approximate J values which were determined along the
three contours in the 7075-T6 SEN specimen shown in Figure 10, for ten
sequential moire tringe patterns ot stable crack growth. As expected in this
elastic specimen, the J-values along these three contours, tar to near tield
contours are in good agreement with each other.
2024-0 SEN Specimens
A 2024-j SEN specimens, with fatigue precrack, were tested to failure.
Unlike the 7075-T6 specimens, no unstable crack growth were observed in these
specimens which exhibited large scale yielding. Figure 15 shows the log-log
plots or the u -displacement versus distance to the crack tip ot Figure 11.t[ y
The average slopes near the crack tip within the marked region in Figure 15
is 1/6+ 0.02 which is the predicted exponent ror a HRR displacement tields
[21,28]. Table 3 shows the approximate J values obtained from the sequential
moire interterometry recordings or the test specimen along three ditterent
paths as shown in Figure II tot each rrame. These results show that within
the r-elatively short crack extension or 0.75 mm, J is still a valid parameter
tor characterizing the crack tip 135] and Equation (10) is valid within
this loading range. The path independency ot the measured J values tor each
Irame is an experimental validation o the J estimation procedure proposed in
o this paper. Figure 16 shows the increases in the approximate J values, which
are consistent with published results [20,2l], with crack extension t)rr
r. -

the 2024-0 specimen. Notable in Figure 16 is the slopes dJ/da of the J
values which remain constant during the initial short crack extension ot
0.4-0.5 mm and its continuous decrease beyond this short crack extension.
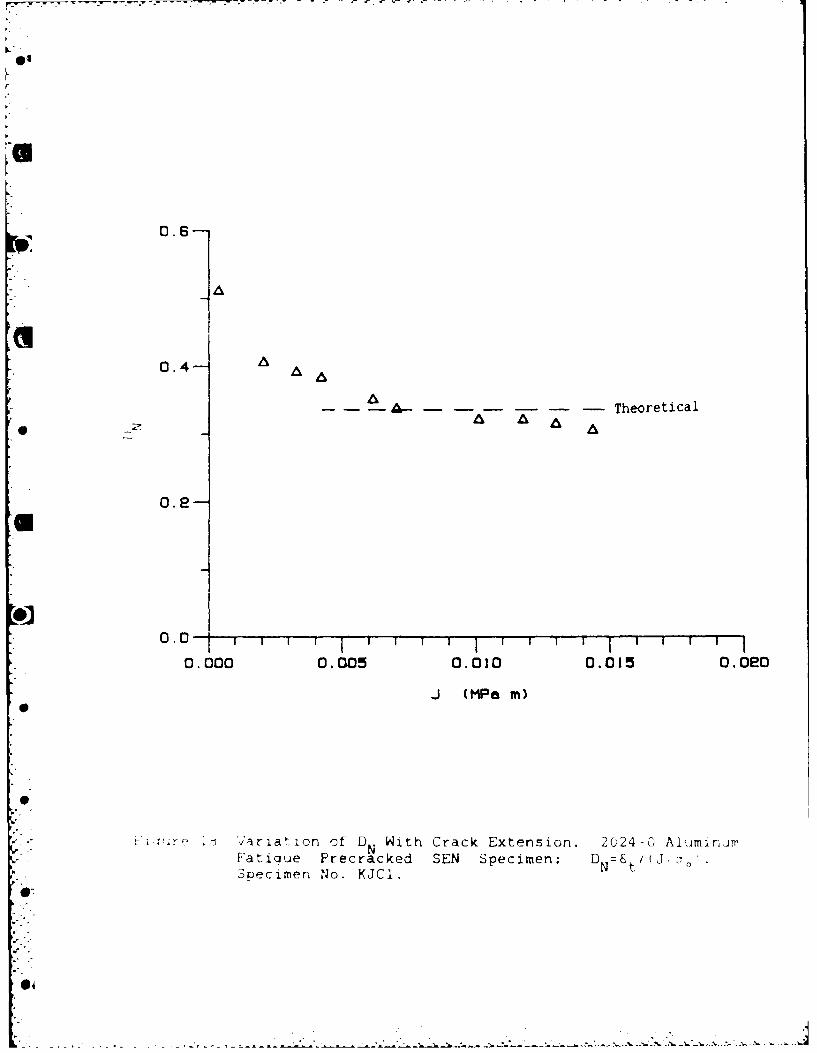
Figure 17 shows the increases in CTOD values with crack extension. These CTOD
values can be linked to the corresponding measured J values through Equation
-ii - I0) where Figure 18 show the variations ot the experimental determined DN
values which agree ravorably with the D value determined by the HRR tield,N
(e.g., D N=0.33 tor 2024--0 aluminum material).!N
CONCLUSIONS
1. White light moire technique was used to determine the u -displacementy
field of stably growing cracks in 7075-Tb and 2024-0 aluminum SEN
specimens.
2. An procedure for estimating J trom the recorded u Y--displacement field was
developed. This approximate J agrees reasonably well in a HRR crack tip
field but required special handling when used in an elastic crack tip
field.
3. The approximate J and CTOD at the onset and during stable crack growth
were recorded. Limited data suggests that there exist a constant CTOD tor
* unstable crack propagation in 7075-Tb aluminum SEN specimen. HRi tield
- dominates stable crack growth in 2024-0 aluminum SEN specimen.
re
ACKNOWLEDGMENT
.'- The work reported here was completed under ONR Contract N00014-85-K-ui8'
The authors wish to acknowledge the support and encouragement ot Dr. Yapa
Rajapakse, ONP, during the course ot this investlqation.
--. .--

REFERENCES
1. Kobayashi, A.S. and Lee, O.S., "Elastic Field Surrounding a RapidlyTearing Crack," Elastic-Plastic Fracture, Vol. I, Inelastic CrackAnalysis, ed. by C.F. Shih and J.P. Gudas, ASTM STP 803, pp. 1-21-1-38,(1983).
2. Lee, O.S., Kobayashi, A.S. and Komine, A., "Further Studies on Crack TipPlasticity of a Tearing Crack," Experimental Mechanics, Vol. 25, No. 1,pp. bb-74, (1985).
3. Emery, A.F., Kobayashi, A.S., Love, N.J., Place, B.H., Lee, _.H. andChao, Y.H., "An Experimental and Analytical Investigation ot Axial CrackPropagation in Long Pipes," Engineering Fracture Mechanics, Vol. 23, pp.
215-228, (1986).
4. Rice, J.R., Drugan, N.J. and Sham, T.-L., "Elastic-Plastic Analysis ot*" - Growing Cracks," Fracture Mechanics: Tweltth Conterence, ASTM STP 700, pp.
189-221, (1980).
* 5. Amazigo, J.C. and Hutchinson, J.Q., "Crack Tip Field in SteadyCrack-Growth with Linear Strain-Hardening," Journal o the Mechanics andPhysics of Solids, Vol. 25, pp. 81-97, (1977).
6. Gao, Y.-C. and Hwang, K.-C., "Elastic-Plastic Field in Steady Crack Growthin a Strain- Hardening Material," Advances in Fracture Mechanics,Proceedings, Fifth International Conference on Fracture, Cannes, France,pp. 669-682, (1981).
7. Rice, J.R., "Elastic-Plastic Crack Growth," Mechanics of Solids, edited byH.G. Hopkins and M.J. Sewell, Pergamon Press, Oxford, pp. 539- 562,(1982).
8. Gao Y.-C. and S. Nemat-Nasser, "Near-Tip Dynamic Fields rot a CrackAdvancing in a Power-Law Elastic-Plastic Material: Modes I, II and III,"Mechanics of Material, Vol. 2, pp. 305-317, (1983).
9. Chitaley, A.D. and McClintock, F.A., "Elastic-Plastic Mechanics ot Steady*• Crack Growth Under Anti-Plane Shear," Journal ot the Mechanics and Physics
of Solids, Vol. 19, pp. 147-163, (1971).
10. Sorensen, E.P., "A Numerical Investigation o Plane Strain Stable CrackGrowth Under Small-Scale Yielding Conditions," Elastic-Plastic Fracture,ASTM STP b68, pp. 151-174, (1979).
11. Anderson, H., "Finite Element Treatment ot A Unitormly Moving.- - Elastic-Plastlc Crack Tip," Journal or the Mechanics ind Physics ot
-olids, Vol.22, pp. 285-308, (1974).
1i.. Dean, R.H. and Hutchinson, J.W., 'Quasi-Static Steady Crack Growth in' Small-Scale Yielding," Fracture Mechanics: Twelfth Conterence, ASTM STP
i(oO(, pp. 'Hj-405f (I'jdi) .
.4
[..rn
13. Dean, R.H., "Elastic-Plastic Steady Crack Growth in Plane Stress,"Elastic-Plastic Fracture, Vol. I, Inelastic Crack Analysis, ed. byC.F. Shih and J.P. Gudas, ASTM STP 803, pp. 39-51, (1983).
14. Green, G. and Knott, J.F., "On Ettects of Thickness on Ductile CrackGrowth in Mild Steel," Journal of the Mechanics and Physics of Solids,Vol. 23, pp. 167-183, (1975).
15. de Koning, A.U., "A Contribution to the Analysis of Quasi-Static CrackGrowth," Fracture 1977, Proceedings 4th International Conference onFracture, University of Waterloo Press, Vol. 3, pp. 25-31, (1977).
lb. Green, G. and Knott, J.F., "The Initiation and Propagation or DuctileFracture in Low Strength Steels," Journal of Engineering Materials andTechnology, Trans ASME, Series H 98, (1975).
17. McClintock, F.A. and Irwin, G.R., "Plasticity Aspects or FractureMechanics," Fracture Toughness Testing and Its Applications, ASTM STP 381,pp. 64-113, (1965).
18. Achenbach, J.D. and Dunayevsky, V., "Crack Growth Under Plane StressConditions in an Elastic Perfectly-Plastic Material,' Journal or theMechanics and Physics of Solids, Vol. 32, No. 2, pp. 89-100, (1984).
19. Broberg, K.B., "On Stable Crack Growth," Journal ot the Mechanics andPhysics or Solids, Vol. 23, pp. 215-237, (1975).
20. Kanninen, M.F. Rybicki, E.F., Stonesiter, R.B., Broek, D.,Rosenfield, A.R., Marschall, C.W., and Hahn, G.T., "Elastic-PlasticFracture Mechanics for Two-Dimensional Stable Crack Growth and InstabilityProblems," Elastic-Plastic Fracture, ASTM STP 668, pp. 121-150, (1979).
21. Shih, C.F., deLorenzi, H.G., and Andrew, W.R., "Studies on CrackInitiation and Stable Crack Growth," Elastic-Plastic Fracture, ASTM STP668, pp.b5-120, (1979).
*- 22. Paris, P.C. Tada, H. Zahoor, A. and Ernst, H., "The Theory of Instabilityof the Tearing Mode of Elastic-Plastic Crack Growth," Elastic-Plastic
4 JFracture, ASTM STP bb8, pp. 5-36, (1979).
.i. Rice, J.R., A Path Independent Integral and the Approximate Analysis ofStrain Concentration by Notches and Cracks," Journal of Applied Mechanics,
-4. King, R.B. and Herrmann, G., 'Nondejtructive Evaluation ot the J and MIntegrals,' Journal ot Appled Mechanics, Vol. 48, pp. 83-87, k19b).
Z . Read, D.T. ind McHenry, H.I., Strain Dependence ot the J-Contour Integralin Tensile Panels, Advance in Fracture Research, edited by b. Francois etal, (1980).
4. Read, .J.T., Experimental Method tor Direct Evaluation ot the J C',.nt.-ur
Integral, ASTM JTP 731, pp. 13-2K, (1983).

2;. Hutchinson, J.W., "Singular Behavior at the End or Tensile CracK in aHardening Material," Journal or Mechanics and Physics or Solids, Vol. Iu,pp. 13-31, .1968).
28. Rice, J.R. and Rosengren, G.F., "Plane Strain Detormation near a Crack ripin a Power-Law Hardening Material,' Journal ot Mechanics and Physics oaSolids, Vol. 16, pp. 1-12, (1968).
29. Shih, C.F., "Tables ot Hutchinson-Rice-Rosengren Singular FieldQuantities," MRL E-147, Materials Research Laboratory, Brown University,(1983).
30. Tracy, D.M., 'Finite Element Solutions rot Crack Tip Behavior inSmall-Scale Yielding," Journal of Engineering Materials and Technology,Vol. 98, pp. 14b-151, k1976).
31. Kang, B.S.-J., Kobayashi, A.S., and Post, D., "Stable and Rapid CrackPropagation in Aluminum Tensile Specimens," Proceedings or the 1985 'EM4Sprin4Conrerence on Experimental Mechanics, Las Vegas, pp. 9-12, (1985).
32. Post, D. "Moire Interterometry with White Light," plid Optics, Vol. 18,No. 24, pp. 41b3-41b7, (1979).
*3. Plane Strain Crack Toughness Testing ot High Strength MetallicMaterials," American Society tor Testing and Materials, ASTM STP 410, pp.12 (ib66).
*i 34. Willims, M.L., "On the Stress Distribution at the base ot a Stationary
Crack," Journal or Applied Mechanics, Vol. 24, pp. 109-114, '1957).
- 35. Hutchinson, J.W. and Paris, P.C., " Stability Analysis ot J-Controlled*Crack Growth." Elastic-Plastic Fracture, ASTM STP b68, pp. 37-64, (1979).
[0
[6
6
|N

Table 1 Measured and Calculated J, K and CTOD of 7075-T6 Aluminum SENSpecimen with Fatigue Precrack.
Frame Applied' Crack Measured'K (stress intensity factor) MeasurediCalculated,
no. ,load length J I"* 2* 3* 4* CTOD CTOD *
(KN) (mm) (MPa m) (MPa V-d) (10- (103mm)
1 1.17 2.18 0.0008 7.7 7.5 7.8 7.7 3.3 4.1
2 1.93 2.18 0.0022 12.1 12.5 14.7 13.0 4.1 5.0
3 2.85 2.18 0.0050 18.8 18.9 20.5 16.9 5.8 7.9
4 3.30 2.40 0.0066 23.1 21.8 22.2 21.8 -.3 9.5
5 3.b0 2.48 0.0083 25.9 24.4 1-7.o 22.8 7.? 10.1
S3.98 2.65 0.0110 Z9.9 28.1 28.2 25.7 9.1 11.2
7 4.29 2.84 0.0133 33.9 30.8 29.4 28.b 9.9 14.1
U*** 4.35 2.94 0.0151 35.2 32.9 30.0 28.9 9.9 15.0
9* ^* 4.bl 3.11 0.0205 38.9 38.3 37.9 32.2 9.9 18.0
lu*** 4.90 4.01 0.0340 50.8 49.1 43.3 37.6 9.9 20.2
1* : based on ASTM STP 410 K evaluation procedure.2* : based on J evaluation procedure, e.g. K=J*E.3* based on the William's polynomial function.
t. 4* based on the Dugdale-Barenblatt strip yield model.
** based on the Dugdale-Barenblatt strip yield model.*A*: rapid crack growth.
0
04
, ..- -.

Table 2 Measured Approximate J Values for IDifterent Contours in7075-T6 Aluminum SEN Specimen with Fatigued Precrack.
UFra-me- Applied Crack Measured Jn(. load length #1 #2 #3A
-- (KN) m (pm
I 3 -333 .85/ 2.18 4.bbxl0 5.03xlo0 5.8310I3 -3-3
4 3.30 2.40 6. 32x10 6.6840o 7.00X40
3-3 -33.98 2C.65 10.7xl0 10.840o 11.6x10
*7 4.29 2.834 13. d2x 10 l'3.3x10 13.3xl0 3
8 ~4.35 2.94 14.9xlO 15.lx103 15.3x10-
9~4.bl 3.11 18.7xl10 20.4xlU- 22.2x10-
jQ** 4.90 4.01 33OI 3 -3713 34Ii 333.jxl - -- ,0l 34----. -
t: ar-tield contourK rapid crack growth

Table 3 Measured Approximate J Values for Different Contours in2024-0 Aluminum SEN Specimen ith Fatigued Precrack.
Framte Applied Crack Measured Jno. load length #1#2 #3
(KN) (mm) (Mpa m)
1-----.---0---1------------------- --------- - 3-------- - 3-*
-3 -3 -3;
1.24 1.63 2.06x10³ 2.34 .04
3 -3 -3'3 1.6 1.66 3.30x10³ 3.28x10 3.27xl0
-3 -3 -3* 4~~ 1.81 1.9 .23xl0 41x0 .815 18]. 1.74 6.31 3 6.12x10 6.10X10³
-3 -3 -32.00 1.78 7.OlxlO 6.71xl0 6.82x10
-3 -3 -3,*7 2.11 1.89 10.2(x10 l0.lxlO l0.OXlO
-3 -3 -38 2. 21 1.98 12.OxlO- l1.bxlo- 11.7x10-
-3 -39 2.23 4-214 ,13.2x10 12.9x10
10 2.30 2.36 14.8xl10- 14.4xl10 3
Afar-field contour
0

ljLOAD3 2
I I
I I
LOAD
,r . . _t L t L r ,- vaiuatlon ol F'Ar ind N i t - ,. 1; nt , . s t ]l <! _- Edge N,.tch o -N<] "F m ' '
I I
49
PLFINE STRESS
0.5 -3 5.. .... .. .. .
4: I I-"
0.o4-
~0. 31"
0.-
----------- Theoretical: Approximate
0 .0 1o T I I I I I' I' ' ' - I0 1 2 3 4
J-integral Path (Half Contour)
wM
I3.
04
* . . .r ... " 1 i ', -3 r . 1 t - .~i r .-x ~ r n t . l n+ , t e , ra I \ I a L A , s Z LA J .... ; a t , *}.u.;, t r t, i o J:}.
01
.4

PLANE STRAIN
3J.. .. . . ..2
4,
0.4-
S0.3-
0.2
-4 TheoreticalApproximate
0 12 3 4
J-integral Path (Halt Contour)
0
0r .r ti ,; r ,r xim Int ,jt V j ,
lie0t~an
0.4

PLANE STRESS
2.0-2
4'
1.5-
* 0.5-
--------------------------------------Theoretical-- Approximate
0.01 T 1i f 111 1 1 1 1 1 1
0 12 3 4
J-integral Path (Half~ Contour)
~7~r- 7~reti * a ri d Apprtox ima~t.p Int-r,3 Vi 1Ufe3,
Pln0'- e s 1 P i jj 7 t

PLANE STRESS
e. o-.0 2 .
4,
* 10
U 0.5-
-----------------------------------------TheoreticalApproximate
0. 00 12 3 4
J-integral Path (Half Contour)
'i ~ -r i an.-' d Xr i maite Irntoq r,3 V~a lue.' -- ~r- ~:r i:.; hi- Vjjejc with fNJ=l*

PLANE STRESS
1.5 2
0~ .0
Fic~~~~~urp~ ~ ~ -TertcladAprxmt ne~a appesximte
-:neztress HFRP Field with N=50.
d
2
1 . - - ---- - - - - - - - -
1.O.I.0~ a- -~ACT IVE
1.-I 1. - RAT ING
OL REFERENCE
COMPENSATOR
Fiiqure 7Optical Paths tcar White Light Moire Interterometry.f=1200 lines/mm

f f/2
f /2 REFERENCE
SORC
IMAGE PLANE
i i 1ir e ni I e r, Up f Dr Vh i f L i ih t Mi re I nt er t i'r o m e rv.
04

g U
VT 4
_ UI9.O mm e-.5 mm to 2.2 mm
0-9. 4 MSpecimen thickness: 0.8 mm
Yield Young'sAluinum Stress Modulus 0. N
(MPa) (MPa)
2024-0 64 722b0 0.35 5
7075-T6 504 71840 0.1 47
yE zyi . I y N-Ityy E E 0
0
1i' .r .;n ' [vl:, r, -1 '.:LN .:Fpec-imens.
6-"> :; "'"'"
. - ' .I, . . ; : , . . . ,

Cr H.
) ()
0 rD W~
AleH
-t
O i* >
17~.
..... ....

IMS
I-.34
SC

-156=1200 (3--105 0
0=
t0-6605
-2.5-
-3.0- IIIIIIII 111 1 1111111111111
*-1.00 -0.75 -0.50 -0.25 0.00 0.25 0.50 0.75 1.00
0LOG r (mm)
Fi Ture I,' Log u yVersus Loq r Flots A U y Aisplacement Fieid.
7015~-T6 Fdtique Precracked Alumninum SEN S-'pecimen.Frame No. KJA1--,.

K.m
160-
* ASTM STP 410 K evaluation procedure Onset fracture
50 0 : J evaluation procedure
tv - o : William's polynomial function
A gdale model 0-Z-4 40-
0
30
eo Rapid crack growth
S10-
00--0 -. " " I I i I I I I
1 e 3 4 5
Applied Load (KN)
rV.
-
F'iqure 13 Stress Intensity Factsr Versus Applied Load.707,-T6 Aluminum Fatiaue Precracked SEN Specimen.Specimen No. KJAI.
9'l

0.02e5
D meauredOnset fracture,
a [Xigdale model
*0.020- 0
0
0
0
0.010- 0 a A I0
U 0Rapid crack growth
0.005- 0
0.000- F I I I I I I I I I I I I I
1 2 3 4 5
Applied Load (KN)
Fi -ij r Crack Tip J)peiiflT Displacement V7orsus Applied Load.D'-KAluminum Fatiqzue Precrackei SEN Specimen.
.7

0
E
~-2.00
0=0
-2.25
2.50 Slope 1/6
-e 5-
-0.6 -0.4 -0.2 0.0 0.2 0.4 0.6 0.8 1.0
LOG r (mm)
Figure 15 Log u Versus Log r Piots ot U -displacement Field.y y
-2024-0 Fatigue Frecracked Aluminum SEN Specimen.F-rame No. KJCI-Z.

0.020
0.015-
E_
a--
L''L
0.005-
0A
0.000-
-0.25 0.00 0.25 0.50 0.75 1.00 i.25
Crack Extension (mm)
* riiurp iF Approximate J Values Versus Crack Extension.2024-0 Aluminum Fatigue Precracked SEN Specimen.vpecimen No. KJCl.
04. + .

0.08
0.06
0.04-
[ --
U
*
|0.0
o. o4-
000
-0.25 0.00 0.25 0.50 0.75 1.00 1.25
Crack Extension (mn)
r iure 7 Measured Crack Tip Opening Displacement (CTOD) ValuesVersus Crack Extension. 2024-0 Aluminum FatiauePrecracked SEN Specimen. Specimen No. KJCI.
.0.
04"
-o.--'----
0.6-
W--,
0.4- A
A- Theoretical
0.2-
0.0-
0.000 0.005 0.010 0.015 0.020
J (MPO m)
'e Variation of D With Crack Extension. 2024-0 AluminumFaticue Precracked SEN Specimen; D tSpecimen No. KJC1. N t
07
04- - - - -~

@~
A. - '-'A
U - AA-.~ A.'
- .,A,,a A** , -
* -...- *' a.,. 'S -
N
4 ., S.,
- 4 . ....0 ,. ,
A A A - A
* .- ~" -- 5- a'
- *. - - ~., -. '.5.'. .4 - 4
0 A.' AS-
0 * A
0
0
04
S A~ A A AA* - ........................- A.

uncl ass if iea5SECU RI rY C1_ AS .jFICA 71OP OJF THIS PAGE (Whoe. Dots Entered)
REPOT DCUMNTATON AGEREAD [NSTRUCTIONSREPOT DCUMNTATON AGEBEFORE COMPLETING FORM4
REPOT -AtEAI2. GOVT ACCESSION NO. 1.RECIPIENT'S CATALOG NMdER
4 TILE (nd ~btilo)S. TYPE OF REPORT & PERIOD COVERED
Stable Crack Growth in Aluminum Tensile Specimen Technical Report6. PERFORMING ORG. R~EPORT NUMBER
___________________________________________ UWA/DME/TR-86/ b4*7, AjT.OR(2, II. CONTRACT OR GRANT NUMBER(s)
3.S.-j. Nang~, A.S. Kobayashi, and D. Post
P ERFOR-41-G ORGANIZ ATION NAME ANO ADDRESS 10. PROGRAM ELEMENT, PROJECT, TASKAREA II WORK UNIT NUMBERS
* Zepart; ient of Mechanical Engineering, FU-10* jniversity of Washington
,eattle, ashington 98195 _______________
CONTROLLING OFFICE NAME AND ADDRESS 12. REPORT DATE
office of ',aval Research Jl.182-W1 in iiton, irginia 22217I.NUERPAS
14. )AG.tTCRING AGENCY NAME &ADDRIESSi'If different from Coenroling Office) IS. SECURITY CLASS. (of this report)
UnclassifiedIS.. DIECLA5SSI ICATION, 0OW14GRAOING
SCH EDULE
16 CISTPIRUTION STATEMENT (o~f this Report)
unl ii, i ted
* 7 Z,1S7Pf~u71N STATEMENT (of th~e abstract entered iny Block 20. it differentI from Report)
K -_Y YP OS 'of.os sie~e de if nhecesar adidentit), by block number)
Oir-e, tavide cra(cK growth, J-irtegral, OTOD, U~uqdale strip yield zone
2, A 3 - ,-(,hoe , vee-rte aide It nocossr and Identify by block n~umber)
Post' s w hite iGht moi re l nterf ercnetry was used to obtai n sequenti alrecords of the transient u -displacement fields associated with stable crackgrowth ir, 7075-T6 and 2024-4, single end notched (SEN) specimens with fatigued
.4 cracks. !he u -displacement fields were used to evaluate the crack tip opening
displacement ( TOD), far and near-field J-integral values, Dugdale strip yield
rrooel, Willilamn's polynomial function, and the HRR fiel ds.
'V73 i~-~JF INOV AS IS OBSOLETE
4. ,A,, I -_____ _____

UI
0
U
eq
0
0
S
9