masahiko fujikubo hiroshima university, japan
TRANSCRIPT

1
Structural Analysis for Design of VLFS
Masahiko FujikuboHiroshima University, Japan
Very Large Floating Structures for the future NTNU, Oct 28-29, 2004
1000m Floating Airport Model
L×B×D×d =1000×60/121×3×1 (in m)

2
5000m Floating Airport Model
Use of internal space
Shear bendingOpening of bulkhead

3
Analysis necessary for structural design
Global hydroelastic response analysis
Stress analysis of local structures and membersStructural modeling technique
Hierarchical system of analysis
Nonlinear collapse analysis Estimate of damages
Estimate of ultimate collapse mode and failure scenario
Outline of Presentation
1. Design Limit States2. Structural modeling for global analysis3. Stress analysis of local structures4. Collapse analysis
Damage due to accidentsCollapse in waves
5. Overall safety evaluation
4
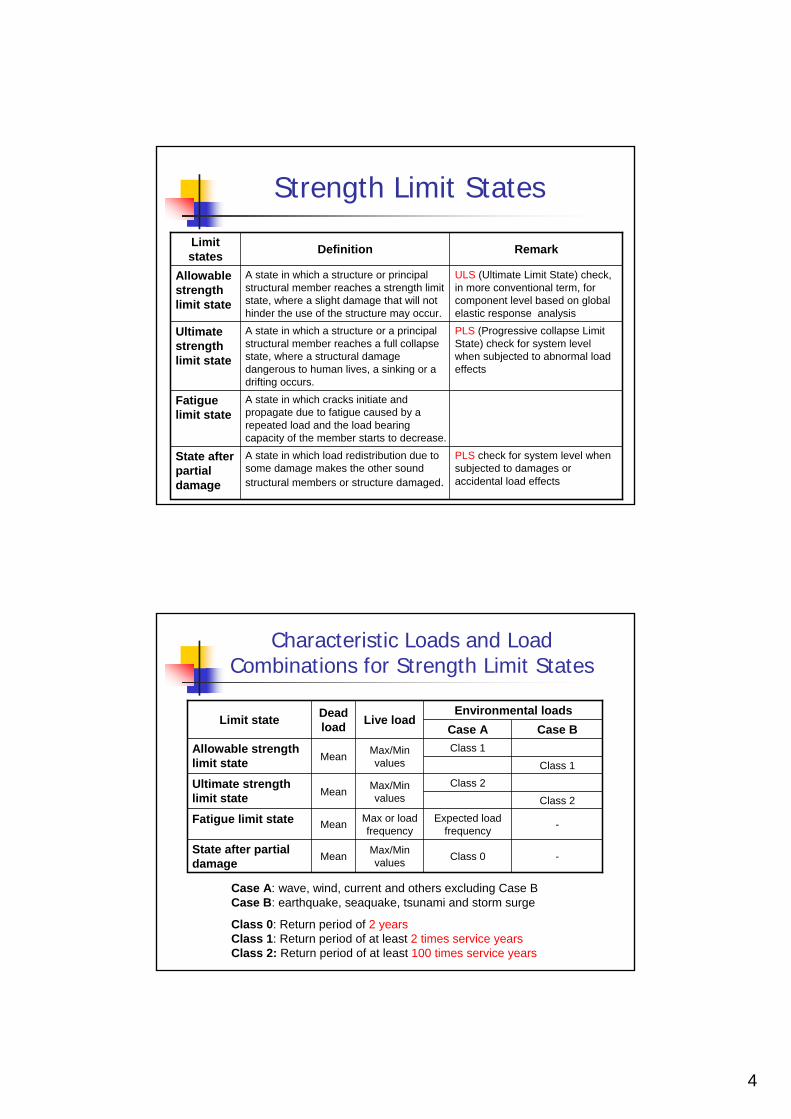
PLS check for system level when subjected to damages or accidental load effects
A state in which load redistribution due to some damage makes the other sound structural members or structure damaged.
State after partial damage
A state in which cracks initiate and propagate due to fatigue caused by a repeated load and the load bearing capacity of the member starts to decrease.
Fatigue limit state
PLS (Progressive collapse Limit State) check for system level when subjected to abnormal load effects
A state in which a structure or a principal structural member reaches a full collapse state, where a structural damage dangerous to human lives, a sinking or a drifting occurs.
Ultimate strength limit state
ULS (Ultimate Limit State) check, in more conventional term, for component level based on global elastic response analysis
A state in which a structure or principal structural member reaches a strength limit state, where a slight damage that will not hinder the use of the structure may occur.
Allowable strength limit state
RemarkDefinitionLimit states
Strength Limit States
Class 2Max/Min valuesMean
Class 1Max/Min valuesMean
Case BCase A
-
-
Class 2
Class 1
Class 0Max/Min valuesMeanState after partial
damage
Expected load frequency
Max or load frequency MeanFatigue limit state
Ultimate strength limit state
Allowable strength limit state
Environmental loadsLive loadDead
loadLimit state
Case A: wave, wind, current and others excluding Case B Case B: earthquake, seaquake, tsunami and storm surge
Class 0: Return period of 2 yearsClass 1: Return period of at least 2 times service yearsClass 2: Return period of at least 100 times service years
Characteristic Loads and Load Combinations for Strength Limit States

5
Functionality Limit States
Limit state corresponding to the criteria applicable to normal useTypical example for a floating airport:
Radius of curvature of runway > 30000 m
Class-0 environmental loads are considered.Functionality requirements are generally severe in VLFS that is used for a foundation of upper structure.
Hierarchical System of Analysis
X
Y
Z
Output Set: MSC/NASTRAN Case 4Deformed(0.0000935): Total Translation
Structural details Local structures and members
Global response analysis
X Y
Z

6
Orthotropic Plate model
Model for Global Response Analysis
Plane grillage model Sandwich grillage model 3D shell model
Orthotropic Plate Model
xy
z
t
⎪⎪⎪⎪
⎭
⎪⎪⎪⎪
⎬
⎫
⎪⎪⎪⎪
⎩
⎪⎪⎪⎪
⎨
⎧
∂∂∂
−
∂
∂−
∂
∂−
⎥⎥⎥⎥⎥⎥⎥
⎦
⎤
⎢⎢⎢⎢⎢⎢⎢
⎣
⎡
−−
−−
=⎪⎭
⎪⎬
⎫
⎪⎩
⎪⎨
⎧
yxw
yw
xw
G
EE
EE
t
MMM
xy
y
x
2
2
22
2
122112
2
2112
2122112
121
2112
1
3
200
011
011
12 ννννν
ννν
νν
2
2
2
2
2
00
0 02
x x xy
x yx y
xy xy
wxM D DwM D D
yM G
wx y
⎧ ⎫∂−⎪ ⎪∂⎪ ⎪⎧ ⎫ ⎡ ⎤
⎪ ⎪∂⎪ ⎪ ⎢ ⎥ ⎪ ⎪= −⎨ ⎬ ⎨ ⎬⎢ ⎥ ∂⎪ ⎪ ⎪ ⎪⎢ ⎥⎩ ⎭ ⎣ ⎦ ⎪ ⎪∂−⎪ ⎪
∂ ∂⎪ ⎪⎩ ⎭
( )21x x fx sx wxED s I E I Iν
= + +−
( )21y y fy sy wyED s I E I Iν
= + +−
2 /1xy yx fx x
ED D I sνν
= =− ( )
/2 1xy fx x
EG I sν
=+

7
Orthotropic Plate Model
xy
z
t
Both bending and shear stiffness can be made equivalent.Applicable to both analytical and FEA approaches.Local structural configuration like a web opening cannot be modelled.
Plane Grillage Model
Beam-element modelDeck and bottom panels are considered as an effective flange of beam elements.Equivalent torsional stiffness based on the equivalence of strain energy (Fujikubo, 2001) Effect of web opening can be considered in beam stiffness.Poisson’s effect cannot be considered.

8
Sandwich Grillage Model
Girders and floors: Beam elements Deck and bottom plate panels: Membrane elementsDeck and bottom longitudinals: included in beam elements D.O.F.s of membrane elements are expressed as a function of those of beam elements based on Kirchihoff-Love hypothesis. Effect of web opening can be considered.Poisson’s effect and torsional stiffness can be considered.
Comparison of Two Grillage Models
LxBxDxd= 1200x240x4.5x1.0 (m)
λ/L=0.08, θ=0deg
Neglect of Poisson’s effect in plane grillage model leads to a significant error in the estimate of stresses in VLFS. Hence, orthotropic plate model or sandwich grillage model is recommended.
σx
σy
Γmax
τxy
Deflection and deck stresses

9
Stress Analysis of Local Structures
Local structural configurations are considered in global hydroelastic response analysis.The stress of local members is directly obtained.
One step method
Simplified structural model is employed in global hydroelastic response analysis.The results, e.g. external-force or cross-sectional force distributions, obtained by the first-step analysis are applied to more detailed structural models quasi-statically.
Two step method
{ } { } [ ]{ } { }2 1 1 1 1 1[ ] [ ]WK d F M d N d= − − (1: first step, 2: second step)
Stress Analysis of Local Structures
For further structural details, zooming analysis is performed.
Stress factor method to consider combined load effects (Inoue, 2002)
Local pressure Transverse bending moment
F
Vertical shear
p
MM M
F
0 0 0( ) ( ) ( )p M Qp M Qσ σ σ σ= × + × + ×
Stress factors that represent the local stress due to unit load components (pressure, moment, shear etc.) are calculated by zooming model with appropriate boundary conditions. The contributions of each load components are summed up considering their amplitude and phase obtained by the global analysis.

10
Analysis of Accidental Damages
Airplane crash (Vertical fall)0.12sec
0.04sec0.0sec
0.016sec
Airplane crash (Body landing)
Flooding
Analysis of global collapse in waves
To develop a method of progressive collapse analysis of VLFSTo examine the collapse behavior of a pontoon-type VLFS in abnormal waves as a part of the Ultimate Strength Limit State Check
Objectives

11
Floating Airport Model
4770m
Girder
Floor
Girder space: 15mFloor space: 19.8m
θ
Long. space: 0.75mTrans. space: 3.3m
Wave
2055m
x
y
Hydroelastic Global Response Analysis
Hydroelastic response analysis: 3D detailed method by Prof. Seto
Structural model: Equivalent orthotropic model
in transverse regular wave (Tw=7sec)
Deflection amplitude
Wave
1650
m
Wave
Bending stress amplitude
Region for collapse analysis

12
Quasi-static Collapse Analysis
{ } { } _ _[ ] ( )NLISUM ext hydroelasic response analysisK d F t=
1st step:
Two step method
Analysis of hydroelastic global response Generation of time history of external loads distributions in irregular waves
2nd step:Quasi-static collapse analysis of VLFS mounted on elastic buoyancy spring using Idealized Structural Unit Method (ISUM) (Fujikubo and Kaeding, 2002)
Structural Modeling for Collapse Analysis
ISUM plate element
ISUM super-element
Beam element
Sandwich grillage model with both bending and in-plane D.O.F.s is used to allow a shift of neutral axis due to buckling/yielding.

13
Idealized Structural Unit Method
Collapse mode under transverse thrust
ISUM Plate element Plate under cyclic in-plane load
Collapse Behavior in Irregular Waves
Bending stress amplitude
WaveRegion for collapse analysis
Multi-directional irregular wave
Assumed uni-directional irregular wave
Spread of collapse region
14
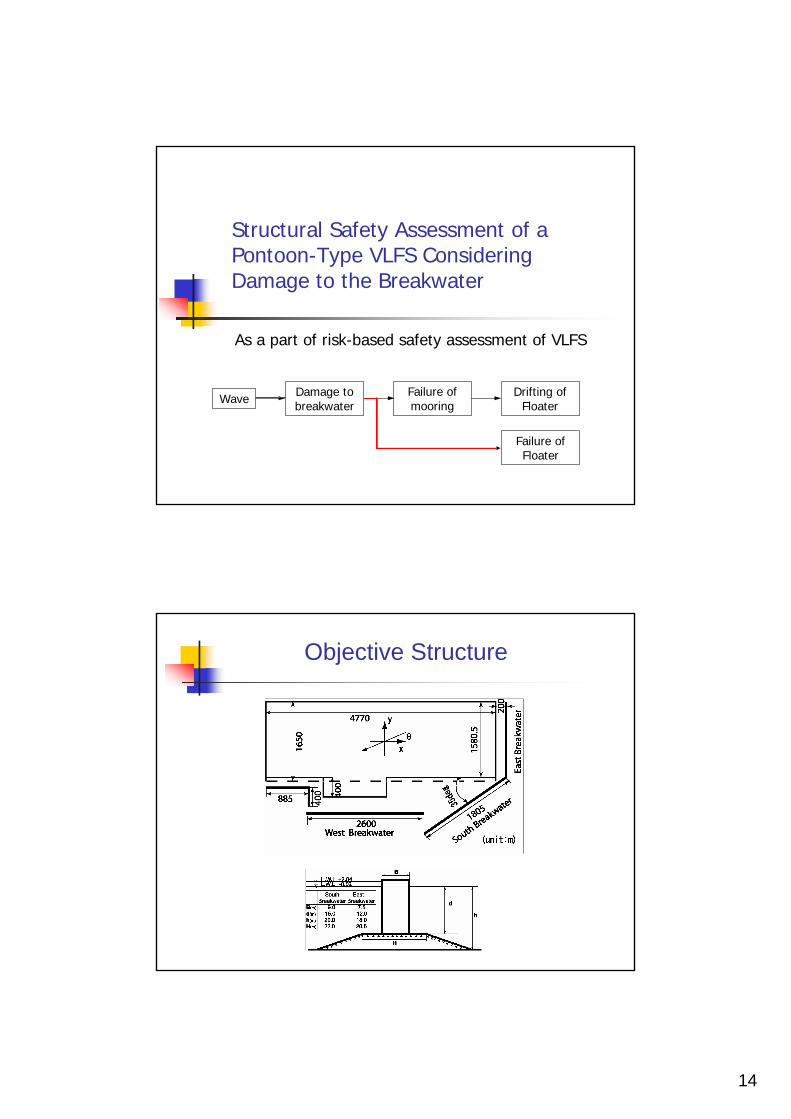
Structural Safety Assessment of a Pontoon-Type VLFS Considering Damage to the Breakwater
As a part of risk-based safety assessment of VLFS
Wave Damage to breakwater
Failure of mooring
Drifting of Floater
Failure of Floater
Objective Structure

15
Failure modes
ML15,000
StiffenerMT
FL
ML
FL
MT
Bottom
Girder
Floor
Deck
Unit structure
Breakwater: Overturning VLFS: Bending and shear collapses of a unit structure
Probability of Structural Failure
_ _(1 )f fb f intact fb f damagedP P P P P= − +
fbP : Probability of overturning of breakwater
_ _,f intact f damagedP P : Conditional probability of structural failure in intact and damaged conditions of breakwater
Wave in front of breakwater
Transmitted wave
Breakwater Mooring System
Pontoon-type VLFS
bfP
Extreme wave statistics in Tokyo Bay Technical Standards for Port and HarbourFacilities in Japan
16
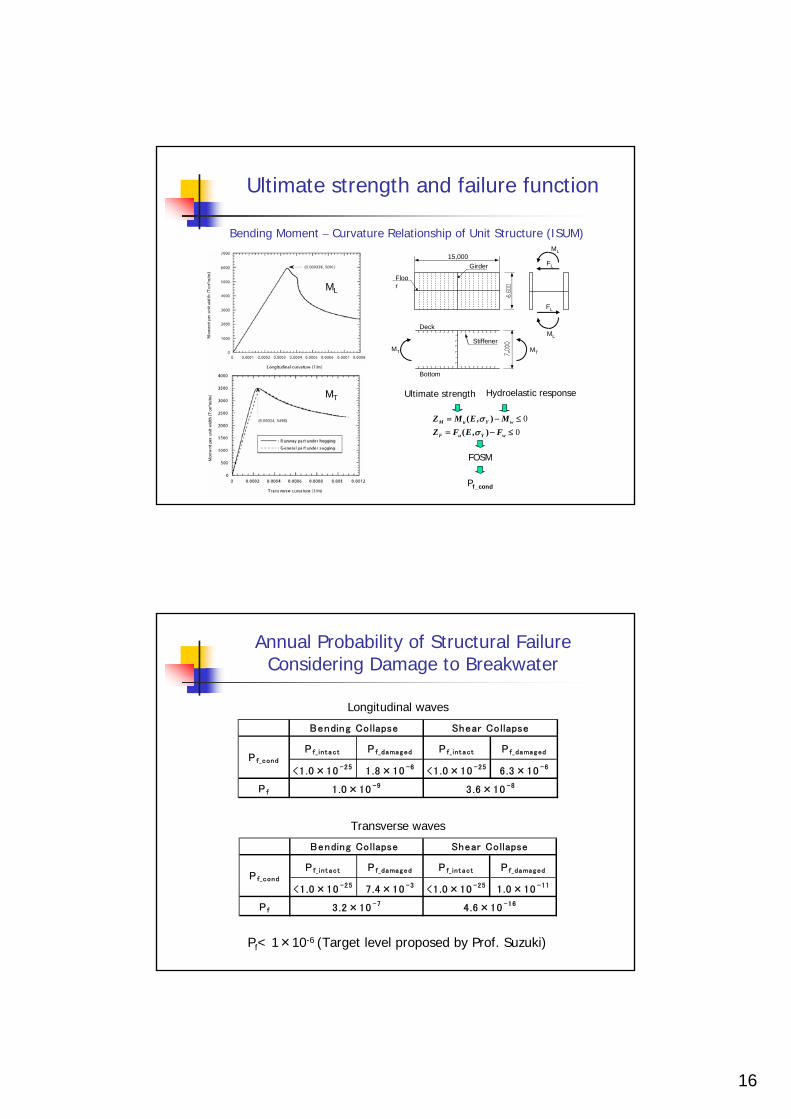
Ultimate strength and failure function
ML15,000
StiffenerMT
FL
ML
FL
MT
Bottom
Girder
Floor
Deck
Bending Moment – Curvature Relationship of Unit Structure (ISUM)
ML
MT Ultimate strength
00
( , )( , )
M u Y w
F u Y w
Z M E MZ F E F
σσ
= − ≤
= − ≤
FOSM
Pf_cond
Hydroelastic response
Annual Probability of Structural Failure Considering Damage to Breakwater
Pf_int act P f_damaged P f_ int act P f_damaged
<1.0×10 -25 1 .8×10 -6 <1.0×10 -25 6 .3×10 -6
P f
P f_cond
Bending Collapse
1 .0×10 -9
Shear Collapse
3.6×10 -8
P f_ int act P f_damaged P f_int act P f_damaged
<1.0×10 -25 7 .4×10 -3 <1.0×10 -25 1 .0×10 -11
P f
P f_cond
Bending Collapse
3 .2×10 -7
Shear Collapse
4.6×10 -16
Longitudinal waves
Transverse waves
Pf< 1×10⁻⁶ (Target level proposed by Prof. Suzuki)