marston’s plc annual report and accounts 2020
TRANSCRIPT

Marston’s PLC Annual Report and Accounts 2020


’
For all of us, this has been an incredibly challenging year. The COVID-19 global pandemic has created a huge amount of worry, stress and uncertainty across our business, and in our personal lives. I never imagined a time that would see the closure of our entire pub estate, nor that varying restrictions would remain in place as we continue to navigate our way through this crisis.
I am immensely proud and inspired by the response of our people in these very challenging circumstances. We pulled together, shared experiences and applied our knowledge and skills to close and reopen our pubs safely, for our people and our guests. Our people played their part and, along with key workers across the nation, and many members of the communities within which we live and work, went ‘above and beyond’ to help others at this time of need. I am extremely grateful and offer a personal message of thanks to you all.
Ralph Findlay Chief Executive Officer
1Marston s PLC Annual Report and Accounts 2020

’
-
–
2 Marston s PLC Annual Report and Accounts 2020
A Snapshot of 2020 For the 53 weeks ended 3 October 2020
Underlying Total 2020 2019 2020 2019
Total revenue £821.0m £1,173.5m £821.0m £1,173.5m Total (loss)/profit before tax £(22.0)m £95.1m £(397.1)m £(20.1)m Basic (Loss)/earnings per share (1.7)p 12.7p (56.8)p (2.8)p Net cash flow £50.5m £(10.5)m £50.5m £(10.5)m
Resilient trading performance post reopening
Response to COVID-19 prioritised safety, livelihoods, pub ambience, fnancial sustainability
Lower debt – net borrowings before joint venture completion c.£50m lower than 2019
Transformational Carlsberg joint venture completed 30 October 2020
Signifcant cash headroom post joint venture completion, further debt reduction targeted
Future strategy: focused pub business well placed as market recovers
Notes: The results above reflect the total performance of the Group including discontinued operations. These results are detailed in the Group Income Statement on page 84 and note 8 on page 102.
The underlying results reflect the performance of the Group before non-underlying items. The Directors consider that these figures provide a useful indication of the underlying performance of the Group. A reconciliation between the underlying results and the statutory numbers can be found in the Group Income Statement on page 84.
The Strategic Report, outlined from the inside front cover to page 43 incorporates: A Message of Thanks, A Snapshot of 2020, At a Glance, Our Business Model, Chairman’s Statement, Stakeholder Engagement, Chief Executive’s Statement, Our Market Environment, Our Strategy, Our Key Performance Indicators, Group Operating and Financial Review, Risks and Risk Management, Our Principal Risks and Uncertainties, Our Levels of Defence, Managing and Nurturing our Resources and Relationships, Non-Financial Information Statement and Section 172 (1) Statement.
By order of the Board
Ralph Findlay Chief Executive Officer
10 December 2020

Page 00-00
3 Marston’s PLC Annual Report and Accounts 2020Strategic Report
In this year’s report
Strategic Report A Message of Thanks 1 A Snapshot of 2020 2 At a Glance 4 Our Business Model 6 Chairman’s Statement 8 Stakeholder Engagement 9 Chief Executive’s Statement 10 Our Market Environment 12 Our Strategy 13 Our Key Performance Indicators 16 Group Operating and Financial Review 18 Risks and Risk Management 21
Our Principal Risks and Uncertainties 22 Our Levels of Defence 28
Managing and Nurturing our Resources and Relationships 30 Non-Financial Information Statement 42 Section 172 (1) Statement 43
Governance Chairman’s Introduction 45 Board of Directors 46 Corporate Governance Report 48 Nomination Committee Report 52 Audit Committee Report 56 Directors’ Remuneration Report: 59
Annual Statement by Chairman 59 Remuneration Summary 2019/20 63 Annual Report on Remuneration 64
Directors’ Report 72 Statement of Directors’ Responsibilities 74
Financial Statements Independent Auditor’s Report to the Members of Marston’s PLC 76 Group Income Statement 84 Group Statement of Comprehensive Income 85 Group Cash Flow Statement 86 Group Balance Sheet 87 Group Statement of Changes in Equity 88 Notes to the Group Accounts 89 Company Balance Sheet 132 Company Statement of Changes in Equity 133 Notes to the Company Accounts 134
Additional Information Information for Shareholders 146 Glossary 149
Find out more online For a full year-end press release, preliminary results presentation and webcast, visit: www.marstons.co.uk/investors
Our Business Model
Pages 6–7
Directors’ Remuneration Report
Pages 59–71
Market Environment and Strategy
Pages 12–15
Financial Statements
Page 76–144
Our Resources and Relationships
Pages 30–41
Our KPIs
Pages 16–17

Marston’s PLC Annual Report and Accounts 2020
4
At a Glance
Marston’s has around 9,400 employees and a diverse estate of over 1,350 pubs and bars that allows us to offer something for every guest, in each of the communities within which we operate.
For the first time in our long history, we are a focused pub operator, with a culture that places guests at the heart of everything we do.
Pubs and Bars • Larger food-led managed pubs, premium bars and restaurants,
accommodation.
• Typical guests: value seekers or those looking for a premium experience.
• Community and independently run pubs, either managed, franchised or tenanted, often more wet-led in their format/offer.
• Great pubs that maximise the abilities of skilled entrepreneurs, with a licensee who connects with their community.
• Typical guests: those wanting to enjoy a drink, socialise and be entertained with people from their community.
• Majority of pubs estate in suburban locations, with 27 pubs in city centres; less exposure to impact of COVID-19 on footfall in city centres.
Pubs and Bars
1,365 Rooms
1,665 Pubs and Bars revenue
£515.5m Pubs and Bars underlying operating proft
£84.7m Brewing*
• Six breweries producing a wide portfolio of cask, keg and packaged beers.
• Key brands: Pedigree, Hobgoblin, Wainwright and Shipyard, and licensed brands including Estrella Damm.
• Local provenance in regional markets with Banks’s, Jennings, Mansfield, Ringwood, Brakspear and Eagle.
• Typical consumers: discerning and knowledgeable drinker at home and away from home (in pubs, clubs and bars).
* Brewing is a discontinued operation following the sale of Marston’s Beer Company into the joint venture with Carlsberg UK, which completed on 30 October 2020.
Locations
18 Brewing revenue
£305.5m Brewing underlying operating proft
£17.3m Group Services • Our central teams provide a range of functional services that support and connect the business, including IT, HR, Finance, Health and Safety and
Governance. All are focused on setting the financial and governance framework that helps to deliver our strategic objectives.

Marston’s PLC Annual Report and Accounts 2020Strategic Report
/
5
Marston’s Estate in 2019/20
We operate across the UK, with the majority of our pubs and bars located in suburban areas.
21
1 In a city centre location
250
104 159
Scotland
North of England
Midlands
Wales
South of England
235 5537 3
7 In city centre locations
375
13 In city centre locations
4225 1
6 In city centre locations
630 3494 2
Key
Pubs and Bars Rooms Brewing* Distribution centres and depots*
* Since the period end, the Brewing assets, including distribution centres and depots, have transferred to the joint venture with Carlsberg UK.

Marston’s PLC Annual Report and Accounts 2020
–
6
Our Business Model
We are focused on operating a high-quality pub and rooms business offering great places to drink, eat and stay.
While pubs may have changed a lot over the years, the reasons people use them remain the same. The pub is where we go to socialise, celebrate, share an experience or simply enjoy a cold beer or a bite to eat at the end of a long day. We are at the heart of local communities, offering a warm welcome and value for money.
Our biggest contributor of profit comes from the sites under our direct management and our flexible approach enables us to select the right operating model and proposition for each pub to maximise its return.
Purpose To build relationships and bring people together, creating happy, memorable and meaningful experiences.
Culture Marston’s is a people-powered business and there is one element at its core that never fades, regardless of how big our business has become, and that is we care. Our ‘reason for being’ as a business is to help people feel good, whether they are…
• drinking our beer • eating our food • experiencing our hospitality • staying in our accommodation • working with us or for us • investing with us
If we are to achieve this, it is important that we run our business in an ethical and responsible manner, truly caring for the people and places we impact along the way.
People Resources and relationships
Resources and relationships Our business relies on the strength of its people and their relationships with our key stakeholders to maximise the value from our portfolio and manage our financial capital prudently.
See pages 30 41 for more information
We are one Marston’s, one team – trusted to make the right decisions and play our part.
We care – we take time to listen, understand and do the right things for our customers and stakeholders.
We celebrate – when we do something really well, we shout about it and have fun celebrating.
We dream big – together we strive to make Marston’s so much more, always aiming to exceed expectations.
Values The Marston’s Way As a business that prides itself on engaging and enabling team members to take responsibility, it is important that we all know what is expected of us and that we have the support and guidance to make the right decisions.
Marston’s PLC Annual Report and Accounts 2020Strategic Report
7
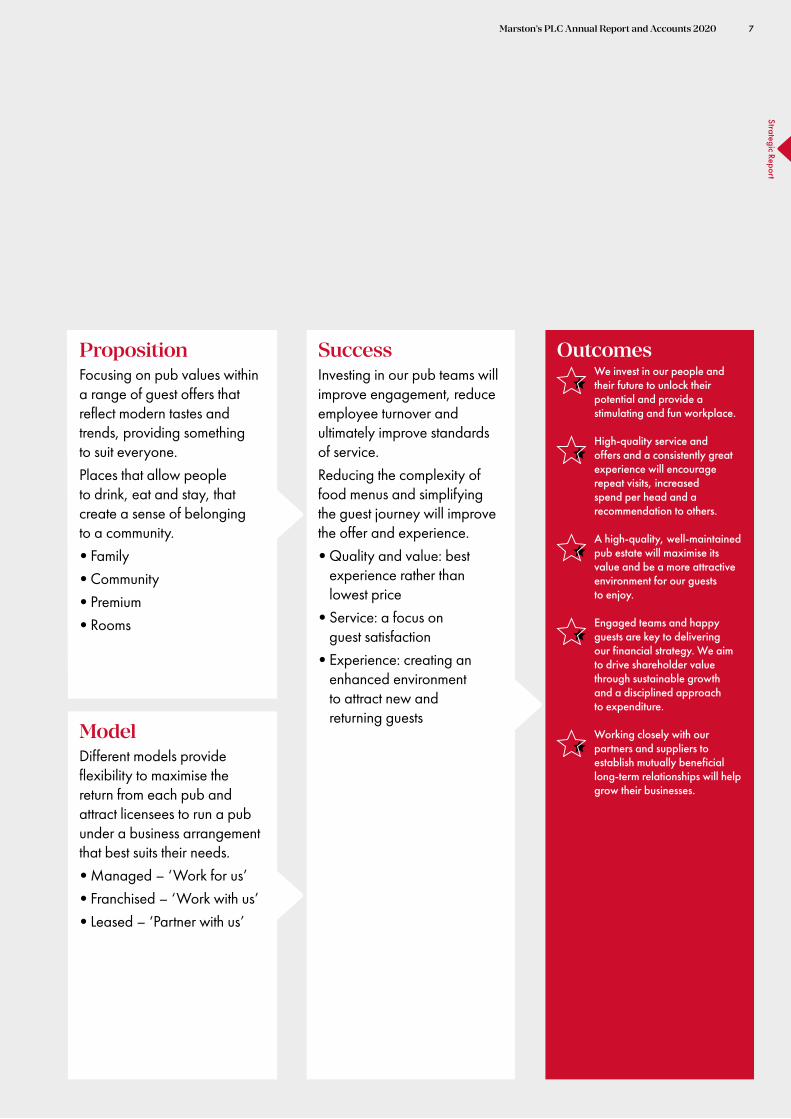
Success Investing in our pub teams will improve engagement, reduce employee turnover and ultimately improve standards of service. Reducing the complexity of food menus and simplifying the guest journey will improve the offer and experience. • Quality and value: best
experience rather than lowest price
• Service: a focus on guest satisfaction
• Experience: creating an enhanced environment to attract new and returning guests
Proposition Focusing on pub values within a range of guest offers that reflect modern tastes and trends, providing something to suit everyone. Places that allow people to drink, eat and stay, that create a sense of belonging to a community. • Family • Community • Premium • Rooms
Model Different models provide flexibility to maximise the return from each pub and attract licensees to run a pub under a business arrangement that best suits their needs. • Managed – ‘Work for us’ • Franchised – ‘Work with us’ • Leased – ‘Partner with us’
Outcomes We invest in our people and their future to unlock their potential and provide a stimulating and fun workplace.
High-quality service and offers and a consistently great experience will encourage repeat visits, increased spend per head and a recommendation to others.
A high-quality, well-maintained pub estate will maximise its value and be a more attractive environment for our guests to enjoy.
Engaged teams and happy guests are key to delivering our financial strategy. We aim to drive shareholder value through sustainable growth and a disciplined approach to expenditure.
Working closely with our partners and suppliers to establish mutually beneficial long-term relationships will help grow their businesses.

Marston’s PLC Annual Report and Accounts 2020
8
Chairman’s Statement
“I pay tribute to all our teams for their patience and dedication in implementing the ever--changing trading restrictions with a positive attitude to deliver fantastic Marston’s hospitality in such difficult circumstances.” William Rucker Chairman
Dear Shareholder,
All of us have been affected by the COVID-19 crisis. The closure of our pubs from 21 March for three months, and the subsequent restrictions placed upon our ability to trade, has had a profound effect on our business. Marston’s has traded for nearly 200 years in one form or another, and this is the first time in our history that our pubs have been unilaterally closed by law.
I am hugely grateful to all those who work at Marston’s, and to those who have pulled together to help us through the crisis – not just to survive it, but to ensure that the business is in a significantly stronger position today than it was in March, which is a remarkable achievement.
During the period of closure, our focus was on supporting our people at a time of great uncertainty, ensuring that our financial position was robust, delivering the joint venture between Marston’s Beer Company and Carlsberg UK, and planning for the reopening of our pubs on 4 July. I believe we met those objectives and met them well. Our brewing and supply chain teams deserve great credit for working tirelessly throughout lockdown, to keep supermarket shelves stocked with Marston’s beers up and down the country, with very high levels of service achieved.
On reopening on 4 July, we prioritised the safety and wellbeing of our guests and our people; the retention of as much pub ambience as possible given the onerous trading restrictions placed upon us; and operating on a financially sustainable basis. Guest feedback, the very low incidence of COVID-19 reported by guests or employees, and our trading outperformance compared to the wider pub sector, indicate that we were successful in managing these priorities. I pay tribute to our pub teams for their patience and dedication in implementing, and adhering to, the ever-changing trading restrictions with a positive attitude to deliver fantastic Marston’s hospitality in such difficult circumstances.
We have balanced the needs of our stakeholders, including our people, tenants and lessees, retailers, providers of finance (banks and bondholders), communities, suppliers, and customers. Scarce resources have had to be shared – though our support for Wolverhampton City Council in helping to distribute food to people who needed it during the lockdown shows that a huge impact can be made at low cost, and our distribution team did a fantastic job with great enthusiasm.
Despite these enormous challenges, our cash flow was strong. The c.£50 million reduction in net debt compared with the previous year – even before the receipt of £233 million on completing the joint venture with Carlsberg in October – was the result of very tight control of cash, together with disposals in the first half-year. The support of the UK Government through reduced VAT, the business rates holiday, and the furlough scheme has been essential in maintaining liquidity and many jobs across the sector. Following the completion of the joint venture, net debt has reduced further, and we now have significant headroom against bank facilities.
The uncertainties arising from COVID-19 and current Government restrictions have led us to take a very cautious view of the carrying value of property and goodwill on the balance sheet. The resulting £461million write down is reflected in the balance sheet at the period end, though it should be noted that this was partially offset by an estimated initial £280 million gain on the disposal of Marston’s Beer Company into the joint venture with Carlsberg UK in October, after the period end.
The joint venture with Carlsberg UK is an historic moment for Marston’s. I wish our brewing colleagues every success in the future, and thank Richard Westwood, Managing Director of Marston’s Beer Company, for his vision and leadership over many years. The transaction valued Marston’s Beer Company at £580 million and brought financial security through the equalisation payment of up to £273 million, of which £233 million was received in October. For the first time in our history we are a focused pub operator, but our 40% shareholding in the £780 million joint venture will allow us to benefit from substantial synergies and, we believe, the attractive opportunities available to the Carlsberg Marston’s Brewing Company.
This has been a very difficult year. We want nothing more than to get back to running pubs without restrictions, many of which are an anathema to the social nature of pubs, and I believe that people have greatly missed the contribution that pubs make to communities and to the social fabric of the country. Our experience after reopening pubs following the first lockdown in July demonstrated the enduring appeal of pubs and gives us confidence for the future.
Looking forward, the rollout of a vaccine will be critical to removing the restrictions over our business, which is essential to returning to normal levels of trading, which we hope will be by the second half of 2021.
The immediate outlook nevertheless remains challenging and it is clear that further Government support is needed for the hospitality sector to bridge the period until ‘business as usual’ can resume. In a ‘normal’ year, Marston’s would expect to raise over £500 million in taxes for the Government; it is important to return to more normal trading, but it is also very important for the Government’s finances.
As signalled in May, the Board does not recommend a dividend in respect of the 2020 financial period.
In the longer term, we believe that our high-quality pub estate, which is mainly freehold and in suburban locations, is well positioned as the market recovers. We will continue to target debt reduction from operational cash flow, with a target to reduce it to below £1 billion by the end of 2024.
William Rucker Chairman
10 December 2020

Marston’s PLC Annual Report and Accounts 2020Strategic Report
-
9
Stakeholder Engagement: How we have engaged during COVID-19 We will only succeed in running a successful and sustainable business, for the long-term benefit of our members as a whole, if we behave responsibly, have positive meaningful relationships with all our stakeholders and uphold high standards of business conduct.
This is how we have always done business but, this year, when the COVID-19 pandemic took hold of the UK and we were forced to close our pubs for 15 weeks, we were still able to demonstrate our approach. We focused on the safety of our people, the stability of our partners and suppliers, and the financial security of the business. The Board met several times over the period to specifically consider these particular matters and the long-term consequences of their decisions.
We established a Coronavirus Task Force comprising key representatives from across the business to enable a quick exchange of information to support our actions; our people, our partners and our other key stakeholders were considered, communicated with and kept informed throughout the period. Our beer business continued to brew and supply its products to those customers who remained open. As pubs reopened from 4 July, the Task Force evolved to focus on delivering a great experience to our pub guests in a safe environment.
Throughout this report we have set out, in a series of case studies, how we have engaged with our stakeholders and responded to the impact of 15 weeks of forced pub closure during the first COVID-19 lockdown, on the business.
Our People We are a business where working together, caring about each other, recognising a job well done and striving to be the best is what defines us. The welfare of our people is paramount to us and we had to make important choices when deciding that over 93% of our people should be furloughed. We wanted to ensure that we stayed in touch with all of our colleagues throughout lockdown and that they still felt part of Marston’s whether they continued to work or not. Our Group Communications Manager, in conjunction with our Head of Health and Safety, co-ordinated answers to questions raised and issued regular briefings on what was happening, as and when Government guidance changed, and to provide some motivational support and training to those who found themselves with time on their hands. Shortly after we reopened our pubs, we surveyed our teams to see how they were feeling about returning to work and the changes to running our pubs.
See pages 31–32 for more information
Our Partners (retailers, tenants and lessees) During lockdown, we worked with our partners to provide support and rent concessions. We quickly communicated that, following the closure of pubs, we would suspend all rent until they were able to reopen and that we would credit all unopened draft stock in the cellar. We encouraged all partners to have open conversations with us on rent concessions and sought to work with them to agree a fair and transparent arrangement tailored to each individual partner. Those rent concessions continued after reopening with tapered discounts to help our partners get back up and running.
See pages 36–37 for more information
Our Investors We seek to nurture long-term relationships with investors who support our strategy and share our vision for delivering sustainable and profitable growth over the longer term.
As the order from the Government came to close our pubs, both our CFO and our Director of Treasury and Tax focused on preserving our cash and ensuring we had sufficient facilities to safeguard the business during this period of uncertainty. Working closely with our banks, bondholders and other debt providers, we were able to agree additional liquidity headroom and financial flexibility to meet our obligations beyond the end of the financial year.
See page 41 for more information
Our Guests and Customers Guest satisfaction is key to our success; by listening to their feedback and engaging with them we aim to deliver a consistently great experience.
We want our pub guests to feel safe, welcome and have a great experience each and every time they visit us. During lockdown, we stayed in touch with those on our databases, sending them regular updates and links to our virtual pub site The Armchair Arms where visitors could ‘meet the brewer’ and partake in weekly interactive quizzes. We spent the time reviewing our food and drink ranges and offers and worked to create a safe environment on reopening. This culminated in a comprehensive guest-focused manual that covers all aspects of pub safety and our guest journey to ensure nothing was overlooked as we planned and prepared to reopen.
For the beer business, we saw immense demand for bottled and canned products from our customers that continued to trade. The teams working in brewing and logistics showed incredible dedication and commitment to meeting the demand from our customers without compromising on quality and service.
See pages 33–34 for more information
Our Communities Our pubs and breweries are more than just a physical presence in the communities where they are located; they are part of each community and our pubs are where people within that community can come together. We care deeply about this special relationship and actively engage within our communities to support and promote local activities. During lockdown our logistics teams stepped in to help Wolverhampton Council distribute food parcels to vulnerable people.
See pages 34–35 for more information
Our Suppliers We recognise the benefits of good business relationships with key suppliers who share our values. Without them we would not be in a position to offer our guests great places to eat, drink and stay. We foster long-term relationships and manage them in a responsible and mutually beneficial way. We have contacted our landlords of properties we lease to propose deferment of rent obligations or extended payment plans. We also worked with those suppliers who rely on our business to provide what support we could during the period of lockdown and pub closures.
See pages 37–38 for more information

Marston’s PLC Annual Report and Accounts 2020
10
Chief Executive’s Statement
“Following the transformational Beer Company transaction, we have a significantly strengthened balance sheet and are well placed to recover from the pandemic with significant synergy and growth opportunities.” Ralph Findlay Chief Executive Officer
2020 has been an extraordinarily difficult year for the pub and wider hospitality sector, which has been particularly hard hit by the pandemic. I would like to thank the entire team at Marston’s for their loyalty, dedication and hard work in such trying circumstances.
Whilst short-term uncertainty remains, we have taken swift action to future-proof the business to withstand the challenges presented by the pandemic and Marston’s has emerged a significantly stronger business, with a substantially strengthened balance sheet and well placed to rebuild trading momentum when restrictions are eased. The roll out of the vaccine is clearly critical to that but, in the meantime, the sector continues to face major challenges and Government support will need to continue in order for many viable businesses to survive.
Looking forward, Marston’s has entered the current year fit for the future and excited about the next chapter in the Group’s development as a focused pub and accommodation operator. We look forward to realising the potential of the Group’s brewing joint venture with Carlsberg and wish the team at CMBC every success. There is clear evidence that consumer demand for our pubs remains strong and our geography, as a predominantly community pub operator with 90% of our well invested, high quality pubs located outside city centres, leaves Marston’s well placed to leverage the market opportunities available to us over the medium to longer term.
2020 Performance Overview The 2020 results were significantly impacted by the COVID-19 pandemic in March 2020, including a 15-week period of enforced closure and various subsequent trading restrictions in place since reopening. During the period of closure, our focus was on supporting our people at a time of great uncertainty, ensuring that our financial position was robust, delivering the joint venture between Marston’s Beer Company and Carlsberg and planning for the reopening of our pubs on 4 July.
Following the transformational Beer Company transaction described on the opposite page, which completed on 30 October 2020, we have a significantly strengthened balance sheet, a high-quality freehold pub estate well placed to recover from the impact of the pandemic, and a 40% investment in the Carlsberg Marston’s Brewing Company with significant synergy and growth opportunities. Following the disposal of the Beer Company, we now have a clear, simplified and focused pub strategy underpinned by three core pillars: Guest Obsessed, We Raise the Bar and We will Grow, described in more detail on pages 13–15. Our financial strategy continues to be focused on debt reduction, with a revised target of net borrowings (excluding lease obligations) to be below £1 billion by financial year 2024.
Further details of our underlying and statutory earnings for the period are set out in the Group Operating and Financial Review on pages18–20.
Managing COVID-19 In response to the temporary closure of pubs mandated by Government in March, our focus was to minimise the level of cash burn within the organisation. Actions included:
• Reducing all expenditure, including capital spend, to essential spend only
• Taking advantage of the Government furlough scheme with 93% of employees being furloughed and the remaining employees taking a 20% reduction in salary
• Securing covenant amendments and waivers in our bank and securitisation facilities
• Accessing Government grants and relief, including supporting our tenants by assisting them to claim the relief
• Maintaining a mental wellbeing programme to support affected employees
In addition, and as previously announced, given the ongoing uncertainty surrounding COVID-19 no dividends will be paid in respect of financial year 2020.
Most importantly, we would like to thank our teams for their perseverance through this challenging time. Through their fantastic efforts, we reopened in July and went the extra mile in providing our guests with great experiences whilst ensuring we complied with Government guidelines. As a consequence, we outperformed the market in the final 13 weeks of the period and this is all down to them.
Cash Flow, Financing and Balance Sheet Despite the trading challenges described in this report, prudent cash management resulted in a net cash inflow for the period of £51 million, a £61 million improvement on 2019. In comparison with 2019, cash flow benefited from reduced capital investment (including the cessation of new-build investment in 2019), disposal proceeds from the sale of a number of pubs and the suspension of dividends in 2020.
Following the enforced closure of pubs, we were successful in reaching agreement with our bank syndicate and bondholders to make appropriate covenant amendments in respect of certain financial covenants, and to provide waivers where necessary. These included strong support from bondholders for covenant waivers and amendments to April 2021 and the adoption of liquidity and profit covenants with banks and private placement providers to July 2021. This collaborative approach was helped by open and constructive dialogue in a period of great uncertainty and underlines the importance of good, long-term relationships with all our stakeholders.

Marston’s PLC Annual Report and Accounts 2020Strategic Report
11
We have secure medium-term financing in place, with a £360 million bank facility and a £40 million private placement, both in place until 2024. We also have secure long-term financing in place via the securitisation liquidity facility.
In summary, we have significant headroom in our bank facility to provide operational liquidity, and a securitisation liquidity facility to protect bondholder payments for at least 18 months should that be required in the event of further interruptions to trading. Our cash preservation actions, described in the Group Operating and Financial Review, together with the Government financial support on VAT and Business Rates, mean our ongoing weekly cash burn in a full closure scenario (not the part closedown we are in at the time of writing) is estimated to be around £3–4 million per week.
Inevitably, in the event of additional restrictions in the coming months, it is possible that further covenant amendments may be required depending on the nature of any restrictions introduced, and their duration. Whilst there is no certainty that these amendments will be granted (this has been disclosed as a material uncertainty in the financial statements), given our experiences to date we are confident of securing these where necessary.
Further details are set out in the Group Operating and Financial Review on pages 18–20.
Financial capital We have a mix of predominantly long-term debt and equity with no requirements for medium-term financing.
How this supports value creation • c.90% freehold estate provides attractive security for funding
providers at competitive rates
• Flexibility to invest in assets to maximise long-term returns
• Joint venture transaction reduces debt and enhances net asset value
727 Securitisation
745
337 Sale & leaseback
336
265 Bank & Cash
296
1,329Net Debt (pre IFRS16)
1,377
304 Lease liabilities
22
1,633Net Debt (post IFRS16)
1,399
FY20 FY19
Joint Venture with Carlsberg UK On 22 May 2020, the Group announced that it had entered into an agreement to contribute its brewing business, valued at up to £580 million on a debt free/cash free basis, to a new UK brewing joint venture with Carlsberg, the Carlsberg Marston’s Brewing Company, in return for 40% of the equity in the joint venture. Under the agreement, Carlsberg would also contribute its UK brewing assets, valued at £200 million on a debt free/ cash free basis, in return for 60% of the equity in the joint venture.
On completion, the Group would realise up to £273 million in the form of a cash equalisation payment, which is subject to adjustment in respect of: (i) customary working capital and debt/cash adjustments, and (ii) £5 million of other adjustments. Of the up to £273 million equalisation payment, £34 million is deferred for 12 months from completion with the amount payable contingent on the extent of the recovery of the share price performance of a pre-agreed basket of companies to pre-COVID-19 levels.
The transaction completed on 30 October 2020 with initial proceeds of £233 million received on completion.
The cash proceeds have provided Marston’s with significant liquidity to materially reduce debt in line with our stated strategy, whilst at the same time retaining a significant stake in the joint venture and being able to benefit from significant synergy and growth opportunities.
Outlook Following the recent Government announcements on the Tier system and criteria, the winter months will be both challenging and uncertain and 780 pubs remain closed after the November lockdown.
Our experiences from the Spring helped us to swiftly and efficiently respond to the constantly moving restrictions imposed since the year end, with pub teams furloughed where appropriate, and the cessation of all non-essential spend. In addition, we have been able to minimise the extent of stock losses given the slightly longer notice period.
During the period of closure, our focus is on the future. Following the disposal of the Beer Company into the joint venture with Carlsberg, we are singularly focused on operating a great pub business. As described in the strategy section on pages 13–15, the initial lockdown provided an opportunity to review all parts of our business, from improving commercial efficiency through to development of technology. In this current period of shutdown, this gives us an opportunity to further develop and evolve those plans, ensuring we are well placed to take advantage of the significant trading opportunity that will emerge as restrictions are eased.
Looking forward, the outlook does look more positive. The Prime Minister has strongly intimated that restrictions will ease in the Spring and there is increasing confidence that an effective vaccination programme can be implemented. Our c.90% freehold pub estate is predominately located outside of the challenged city centres and our experiences of trading since 4 July demonstrate that consumer demand is strong – our guests want to go out and socialise and we are confident they will do so as soon as they are permitted. Importantly, with the development of the vaccine, the more vulnerable groups, who are a key part of our business, should have more confidence in returning to pubs.
Finally, and most importantly, we have an incredible team at Marston’s. We have worked hard to protect as far as possible the livelihoods and wellbeing of our team members and our tenanted, leased and other partners. Our focus on ‘doing the right thing’ for our people will pay dividends – we have a loyal, hardworking group of people eager to welcome our guests back into our pubs and again provide them with great experiences.
Ralph Findlay Chief Executive Officer

Marston’s PLC Annual Report and Accounts 2020
12
Our Market Environment
Since reopening in July 2020, our priorities have been the safety of our guests and employees, retaining ambience and high levels of service, and being financially sustainable. How behaviours change as the market ‘normalises’ remains to be seen, but we expect that the trends below are likely to continue for the foreseeable future. Marston’s pub estate is well positioned to take advantage of these trends over time. Whatever the future holds, our marketplace will remain a competitive one which, together with the impacts of COVID-19, presents both challenges and long-term opportunities. Our market and consumer insight team inform and support our strategic and investment decisions.
Celebrating and socialising outside the home matters more During the lockdown, there was uncertainty about how and to what extent people would resume ‘old habits’ when pubs reopened. Following the 15-week closure period, consumer confidence increased steadily throughout July, August and into September in both the drinking-out and eating-out markets. Community pubs performed particularly strongly. There is no question that demand remains strong as demonstrated by the performance of our pubs during the Eat Out to Help Out campaign in August.
Opportunities and response • Utilise the in pub draught experience and sense of shared moments
and community, which cannot be recreated at home.
• Revise our pricing to ensure that guests have the appropriate value incentive for their choices.
• Broaden the food offer to provide choices for more informal snacking and grazing occasions.
Convenience and functional reasons to visit matter less These are still important, but lockdown introduced home delivery from supermarkets and restaurants on a much greater scale than had previously been the case. Convenience dining at home has never been easier: at the same time, when people do visit pubs, there is a much higher expectation that the experience will make the effort worthwhile.
Opportunities and response • Our menus have been simplified to enable our teams to focus on
delivering our bestselling dishes more quickly and consistently.
• Offer guests the opportunity to make healthier choices in food and drink without sacrificing experience and quality; our menus feature a range of healthy options including vegan and vegetarian dishes.
• All new product development delivers against the Government’s salt and sugar reduction targets.
• Take advantage of the revival in the domestic tourist market by raising awareness of our Inns.
Value for experience is replacing price discounting as the motivation to visit pubs The eating-out sector has been impacted by extensive and severe price discounting in recent years. COVID-19 related capacity constraints to comply with social distancing requirements have been a catalyst for an increased focus on improved customer experience. Better quality in food and drink, and improved service, are facilitating a move away from unsustainable price promotion towards more premium offers.
Opportunities and response • Working closely with suppliers to deliver the best possible products
that appeal to a wide range of tastes and restrictive diets at prices our guests are happy to pay.
• ‘Low and No without the FOMO’ campaign introduced new low alcohol, low calorie and low sugar drinks to ensure no-one is excluded from a great in-pub visit.
• Range rationalisation across our pubs to reduce duplication and complexity has freed up time and space for innovation.
• Provide guests with an increased breadth of drinks to enable them to upgrade, whilst reducing the complexity for our people to enable them to deliver quality services.
On-trade supply in the eating-out market is falling In recent years capacity has expanded through an increase in casual dining brands and restaurants despite the fact that demand in the eating-out market has been relatively subdued. In recent months, supply has contracted significantly, with financial distress illustrated by high profile administrations and insolvencies, and we would expect this trend to continue over the remainder of the year. Reduced supply is likely to benefit existing operators, and home delivery.
Opportunities and response • Make sure our local pub is the best place in the area; well-maintained
with a great ambience provided by an engaged team.
• Focus on our guests’ satisfaction through improved food quality, presentation and speed of service.
• Have a range of menu items that our guests can order to take away.
Suburban pubs benefit from increased homeworking Lockdown has created a shift towards homeworking and the rapid growth in new video conferencing applications. The extent to which this remains in the future is not clear but both businesses and employees see at least some benefits in retaining more flexible working patterns. Our pub estate is primarily suburban, with relatively few city centre locations, and is well placed to exploit this trend.
Opportunities and response • Take advantage of our pubs being at the heart of the community.
• Offer a working space away from home.
• Drive our range of quality and local cask beer across our pubs and drive local engagement with guests.
• Use our pub footprint more actively to drive awareness and trial of our Inns across the country.
Technology has become mainstream Our desire to operate safely led to an acceleration in the implementation of table ordering apps (and Track & Trace systems), at a pace that would not have been thought possible prior to the pandemic. Not only have these systems been implemented quickly, they have been positively embraced by guests.
Opportunities and response • We have implemented a ‘click & collect’ menu across 150 of our
pubs and have also begun a trial with Deliveroo and Just Eat.
• Full presence on the biggest online travel agency sites with incentives, including savings on food in pubs, when booking our Inns direct for future visits to maximise the best of both worlds.
• Greater use of technology to engage with guests both pre- and post-stay to improve the guest journey, including online check-ins and the ability to order food and drink via their mobile device in room.

Marston’s PLC Annual Report and Accounts 2020Strategic Report
/
/
13
Our Strategy
Our strategic focus for much of the year has been on the immediate response to the challenges presented by the COVID-19 crisis.
Our Strategy during 2019/20
1 Operating a high-quality pub and rooms business offering great places to drink, eat and stay.
2 Operating a ‘best in class’ beer business with a wide range of premium and local brands and great service.
• Maintaining a balanced pub portfolio across all segments • Continue to exploit growth segments in the beer market. of the market. • Sustainable long-term growth of a local, national and global
• Targeted capital investment to improve pub values and premiumise portfolio of brands. the guest experience. • Delivering a complete customer experience solution.
• Operational investment to improve the execution of the offer. • A world-class supply chain delivering the highest quality service • Further investment in our technology and digital resources to at optimal cost.
improve the guest experience and operational efficiency.
Our Strategy from 2020/21: ‘Guest at the Heart’
For the first time in the Group’s long history, we have become a focused pub operator. We have revisited our operational strategy and will develop our culture to place ‘Guests at the heart of everything we do’.
1 Being Guest Obsessed
2 We Raise the Bar
3 We will Grow
• Our Ways of Working • Value for experience • More from existing guests and
• Guest satisfaction • Well-maintained property welcoming new guests
• Engaged and enabled teams • Operational excellence • More from our people
• More from simplification
• More from our capital investment

Marston’s PLC Annual Report and Accounts 2020
14
Our Strategy continued
1 Being Guest Obsessed
Ways of Working Embedding a guest obsessed people strategy across the business and all disciplines in a consistent manner as a single cultural message is central to realising our vision. At the same time, we are seeking to simplify processes and streamline structures across the business to support the delivery of that guest obsessed culture.
To that end, from 1 October 2020, we centralised support structures including marketing, procurement, finance and HR which had previously supported our Destination, Taverns and Premium businesses, and brought those businesses together under the single umbrella which is Marston’s Pubs. Our PLC Executive team is now comprised of a group of people with long service within Marston’s and the pub sector generally.
Marston’s Pubs has two Operations Directors who are responsible for food-led and wet-led pubs respectively. The Premium business, which includes Revere, has been consolidated within this structure. We have also created a single Marketing and Commercial Director role for Marston’s Pubs. This role is central to the development of guest insight and the strategic direction for marketing, as well as procurement, menu development and food and drink quality.
Guest Satisfaction In seeking to ensure that our decisions are based on insight, guest satisfaction and the evaluation and improvement of satisfaction scores over time, is a key performance indicator. This year we have invested in new feedback systems across our estate, and we are also implementing rigorous management processes which will more clearly define how guest comments are handled and resolved.
GUEST GUEST is the acronym we use to articulate the key points of our guest journey. A simple, effective and memorable tool for our pub teams to use to ensure that we deliver a great guest experience each time they visit.
GUEST training was delivered to our head office operational teams at the beginning of the year, by holding a guest focused conference, where we explored each element of the journey. Our Area Operations Managers were given tools and refresher training for each element, with the clear challenge that we must become guest obsessed at every one of our pubs.
Due to the closure of pubs in March, GUEST training at pub level was postponed until the Summer, and formed part of our pub reopening plan in the month before we reopened our doors to our much-missed guests.
We used the opportunity to not only deliver guest-obsessed training to our team members, but also as a vehicle to train our team members on the COVID-secure measures within the guest journey. We created a 30-minute mandatory e-learning course that all of our pub team members, senior team and General Managers had to complete before they returned to work in a reopened pub. We have also created a Hotel GUEST journey training module that was dedicated to our inns and lodges team members, to replicate the same training.
These training modules have been completed by over 10,000 employees to date and will be regularly updated as required.

Marston’s PLC Annual Report and Accounts 2020Strategic Report
15
2 We Raise the Bar
3 We will Grow
Value for Experience Focusing on ‘value for experience’ recognises that, as described earlier under our Strategic Priorities, value is measured in a range of ways, and experience is likely to be just as important as price when considering which pub to go to. Those experiences can relate to celebration, socialising, teams, community engagement, music, service – but they provide reasons to make ‘going out’ worthwhile and memorable.
Clearly, value for money remains very important, but higher quality food and drink and investment in improved service and ambience are critical in competing with the convenience of home delivery. The eating-out sector has suffered from unsustainable price promotion in recent years, partly due to overcapacity in casual dining, but recent trends indicate that consumers are willing to pay more if the experience is good enough and sufficiently differentiated.
In assessing our current position in relation to value for experience, we are already strong in wet-led and community pubs, but need to make further improvements in our food-led pubs. The input of the new Marketing and Commercial team will be key to determining the next steps towards improved food and drink quality in food-led pubs. Our objective is very clear: to create a pub estate that is locally loved by our guests throughout the country.
Property – clear investment strategy, regular maintenance Our property plans will ensure that each of our pubs and bars is maintained to a high standard and retains a characterful pub ambience.
Operational Excellence In 2019, and in the first half of this year, we made progress in improving Guest Satisfaction scores, EHO ratings, and our own food hygiene scores. This has been achieved by enhanced operational focus (including the incorporation of these measures into bonus schemes) and the creation of four new roles in the centre to assist in improving standards.
We have been encouraged that, since reopening in July, we have made further improvements on all these measures and achieved very high scores in relation to COVID-19 safety measures. This included achieving very high compliance with Test & Trace requests in our food-led pubs.
The simplification of our management structure detailed under Ways of Working on the previous page will, we believe, enable us to achieve better and more consistent operating standards across the business, to align our people around the guest obsessed culture, and further improve standards.
Raising the Bar • Removing complexity from structures and product ranges
• Enabling teams and assigning accountability for where we fall short
• Developing and rewarding teams that deliver a great guest experience
• Relentless pursuit of high standards and operational excellence
• Adopting a continuous listening culture for our people and our guests
The market backdrop described earlier in the report, highlights the significant opportunities for organic growth in the medium term. As such we are instilling into our organisation belief that growth is achievable, and that we will invest in our people, pubs and offers to achieve it. There are four key areas of focus:
More from: existing guests and welcoming new guests As described earlier in the report, the market and social dynamics that have emerged from the COVID-19 crisis present opportunities for our well-positioned estate and (post creation of the joint venture with Carlsberg UK) our refocused business to target increased frequency of guest visits and increased ‘spend per head’.
More from: our people We have made steady progress in developing our teams in the last couple of years, which has involved both internal development and external recruitment. However, in order to exploit future growth opportunities, we will be more rigorous in developing our teams across the organisation, including the coaching and development of senior management and in succession planning.
More from: simplification Simplification of the business is not just a measure to improve efficiency and reduce costs. Through maintaining a philosophy of simplicity, we will constantly challenge ourselves that we are doing fewer things but delivered to an excellent standard, with the aim of driving higher guest satisfaction.
More from: capital investment We have allocated modest levels of growth capex into our medium-term plans, ensuring these funds are deployed to generate maximum return. We have made it clear to our teams that consistent delivery of high return on organic growth capex will ensure the allocation of additional spend in future years.
Clearly, it is difficult to set out quantitative evidence of progress on the above from our 2019/20 results, but we will update on progress on our pillars once the sector has returned to more normalised levels of trade.
Growing • Earning the right to grow margins
• Growing loyalty through personalised offers
• Attracting new guests through recommendations and offers
• Greater rigour in identifying high-returning capital expenditure
• Consistently measuring and assessing key financial metrics

Marston’s PLC Annual Report and Accounts 2020
/
16
Our Key Performance Indicators
Our KPIs represent the principal metrics that we focus on to run the business. They align to our strategic objectives and help determine how we are remunerated. Here we report the historic data for a combined pub and beer company during a period that was significantly affected by the impact of COVID-19.
2019/20 Financial
Underlying earnings per share (EPS) (p)
20 (1.7)
19 12.7
18 13.9
Net cash flow (NCF) (£m)
20 50.5
19 (10.5)
18 (61.2)
See page 20 for how this is calculated
CROCCE* (%)
20 6.4
19 10.4
18 10.3
See page 20 for how this is calculated
Pubs and Bars
Like-for-like sales* vs CGA Peach Tracker (%)
20 7.0
19 0.9
18 0.6
Critical role turnover (%)
20 19.3
19 32.9
18 28.3
20 52.6
19 64.7
18 72.2
General manager Head chef
Happiness score
In October 2019, we launched a new guest satisfaction survey to accurately record guest satisfaction at all our pubs.
Pubs
73%
Beer business
Total own ale – market share (%)
20 16.5
19 14.2
18 14.0
World beers – market share growth (%)
20 2.1
19 2.5
18 2.6
On time in full (retail and logistics) (%)
20 96.3
19 94.6
18 93.6
20 96.2
19 95.5
18 95.4
Retail Primary
*See Glossary on page 149 for definition

Marston’s PLC Annual Report and Accounts 2020Strategic Report
/
17
Following the sale of the beer business, the Group has refined its strategic objectives and principal metrics and will be reporting on those listed below
Corporate
Employee engagement
As a consequence of COVID-19, we have been unable to carry out our normal annual survey. However, to ensure that we were listening to how engaged and enabled our people were, in its place we used a pulse survey tool to help us understand the engagement and enablement of our teams and, more importantly, listen to employee feedback and learn from their experience of working during the pandemic. Our pub teams reported a score of over 85% of those surveyed for being treated well or extremely well by Marston’s during the pandemic and lockdown periods. Over 84% of the responses from our pub teams felt Marston’s had responded well or extremely well to the challenges presented and over 82% of respondents felt that Marston’s were working as one team throughout that time. We also surveyed our head office teams following their return to work. We achieved over a 64% response rate where 95% of people confirmed they had been able to connect with others and work effectively whilst at home.
Our scores for the 2019 survey were strong, 68% engagement (63% benchmark) and 69% enablement (65% benchmark).
FTSE4Good ESG score
20 3.3
19 2.7
18 2.5
for 2020/21 onwards.
2020/21 Financial
Debt reduction
Free cash flow
Pub operations
Guest satisfaction (Happiness score)
‘Locally loved’
EHO score
Corporate
Employee engagement
FTSE4Good score
The cash generated from pub operations, after paying interest and other borrowing costs, that is available for re-investment, reducing debt or paying dividends.
We are committed to reducing debt and have revised our target to less than £1 billion by financial year 2024.
We are obsessed with our guests’ happiness. We want their pub and inn visits to be a great experience every time and we frequently measure their satisfaction to identify areas we can improve upon.
We have set ourselves a target of improving our guests’ happiness score by 5% next year.
We want to be the local choice for our guests and for them to be our advocates so we will measure this using external rating data. Our overall average score was 4* at the end of the period and our target is to increase this social media score by 0.2 next year.
The health and safety of our guests and our own people is paramount and we expect all of our pubs to operate to the highest standards of compliance. Recognising that some fall short, we will measure our progress towards an overall score of 4.7.
Happy teams make happy guests and we are committed to supporting and developing our teams to do this. We will continue to listen to and measure the engagement and enablement of our teams.
We will continue to measure our commitment to our environmental, social and governance considerations using this consolidated external metric of key sustainability factors.

Marston’s PLC Annual Report and Accounts 2020
18
Group Operating and Financial Review
“Our prudent cash management has improved our debt position and we intend to continue with our debt reduction strategy.” Andrew Andrea Chief Financial and Corporate Development Officer
Group Performance Group sales for the 53 weeks ending 3 October 2020 were £821 million, 30% below last year. Total Pubs and Bars sales for the year were £516 million, 34% below last year, principally reflecting the 15-week closure period and the impact of the disposal of 172 pubs for proceeds of £61 million in the first half-year. In Brewing, sales for the year were £306 million, 22% below last year. Off-trade volumes for the year were up 23%, driven by exceptional demand during the period of pub closure. On-trade volumes (excluding the closure period) were 11% below last year.
Overall, underlying trading prior to 16 March was solid, including strong Christmas and New Year trading, despite the impact of the severe and widespread flooding in November 2019, and again in February this year. Like-for-like sales in pubs for the 24 weeks to 14 March were down 1% and Beer Company earnings were in line with expectations. In the week commencing 16 March, when the Government issued COVID-19 guidance to the hospitality venues, unsurprisingly trading deteriorated sharply. All pubs were subsequently closed in line with Government guidance on 20 March.
From 4 July to the period end, we had reopened approximately 99% of our pubs, though a small number closed subsequently as revised regulations were introduced in Scotland where we have 21 pubs. Managed and franchised like-for-like sales averaged 90% of last year over the 13-week period to 3 October. This represented outperformance of approximately 7% relative to the UK pub sector (CGA Peach Tracker) over the 13-week period, principally reflecting the benefits of our balanced pub estate of wet-led and food-led pubs, which are predominantly suburban and community based, with limited exposure to city centres and only three pubs in Central London.
The results for the period reflect the adoption of IFRS 16 ‘Leases’, details of which are set out in note 11 of the accounts. In summary, as previously announced, this change to the accounting rules has no impact on cash flow but has increased the underlying loss before tax by £3.2 million and increased reported total net borrowings, as described on page 19, to reflect lease obligations not previously recognised as debt on the balance sheet.
The financial consequences of pub closures due to COVID-19, for the duration of the 15-week period of enforced closure, subsequent restrictions and local lockdowns in many areas across the country, are reflected in significantly reduced profit. Underlying EBITDA was £125.6 million (2019: £215.0 million), and total underlying operating profit was £74.0 million (2019: £172.8 million). The total underlying loss before tax was £22.0 million (2019: £95.1 million profit). The basic underlying loss per share for the period was 1.7 pence per share (2019: 12.7 pence earnings per share).
On a statutory basis, the total loss before tax was £397.1 million (2019: £20.1 million), and the loss per share was 56.8 pence per share (2019: 2.8 pence). The difference between underlying and statutory loss before tax is £375.1 million of exceptional items, of which £338.0 million were non-cash items, which are described in further detail on the opposite page.
Pubs and Bars Total revenue decreased by 34.3% to £515.5 million principally reflecting the impact of COVID-19 as described earlier and the impact of the disposal of 172 pubs. Total like-for-like sales were 3.6% behind last year.
Underlying operating profit was £84.7 million (2019: £167.5 million). Reported underlying operating margin of 16.4% is below last year, reflecting the weaker turnover.
Brewing Total revenue decreased by 21.5% to £305.5 million. Underlying operating profit was £17.3 million (2019: £32.6 million). Underlying operating margin of 5.7% was below last year, again reflecting the impact of the weaker turnover.
Underlying Underlying Revenue operating profit operating margin
2020 £m
2019 £m
2020 £m
2019 £m
2020 %
2019 %
Pubs and Bars 515.5 784.2 84.7 167.5 16.4 21.4 Brewing 305.5 389.3 17.3 32.6 5.7 8.4 Group Services – – (28.0) (27.3) (3.4) (2.3) Group 821.0 1,173.5 74.0 172.8 9.0 14.7

Marston’s PLC Annual Report and Accounts 2020Strategic Report
19
Taxation The total underlying rate of taxation of 52.3% in 2020 (2019: 15.7%) is above the standard rate of corporation tax. This means that the tax credit is higher than expected due to a prior year adjustment to deferred tax in respect of the net book value of assets qualifying for capital allowances.
Total tax contribution
£384.6m
Duty £201.5m
VAT £112.1m
Employee payroll taxes £34m
Business rates £16.4m
Employer payroll taxes £16.3m
Corporation tax £1.7m
Other £2.6m
Total £384.6m
Non-underlying Items There is a net non-underlying charge of £349.1 million after tax, of which £324.7 million relates to continuing operations and £24.4 million relates to discontinued operations.
The charge in respect of continuing operations primarily relates to the goodwill impairment of £200.6 million and the impairment review of the pub estate in the period, which resulted in a £105.1 million charge to the income statement.
There is also a £22.4 million loss on disposal and associated costs from portfolio disposals of smaller wet-led leased, tenanted and franchised pubs and associated properties, and £18.5 million of associated costs/charges from COVID-19, principally comprising bad debt provisions, stock write-offs and financing costs.
In addition, there are net credits of £4.2 million in respect of VAT claims, a charge of £0.9 million from the write-off of acquisition and development costs, a charge of £0.6 million in respect of the net interest on the net defined benefit pension asset/liability and a £6.4 million net loss in respect of interest rate swap movements. There is a credit of £23.8 million relating to the tax on non-underlying items and a credit of £1.8 million in relation to the change in corporation tax rate.
The charge in respect of discontinued operations relates to the impact of COVID-19, disposal costs and the impairment of central assets associated with discontinued operations.
Capital Expenditure and Disposals Capital expenditure was £63.7 million in the year (2019: £133.8 million). We expect that capital expenditure will be around £40–45 million in 2021.
Cash Flow, Financing and Balance Sheet Despite the trading challenges described earlier in the report, prudent cash management resulted in a net cash inflow for the period of £51 million, a £61 million improvement on 2019. In comparison with 2019, cash flow benefited from reduced capital investment (including the cessation of new-build investment in 2019), £75 million of disposal proceeds from the sale of 172 pubs and the suspension of dividends in 2019/20. Operating cash flow of £157 million reflected lower earnings, partially offset by improved working capital including the agreed deferral of duty and VAT payments to HMRC.
Net borrowings, excluding IFRS 16 lease commitments was £1,329 million (2019: £1,377 million), with the decrease driven by the cash actions described above. Total net debt of £1,633 million includes lease obligations of £304 million following the adoption of IFRS 16.
Following the enforced closure of pubs, we were successful in reaching agreement with our bank syndicate and bondholders to make appropriate covenant amendments in respect of certain financial covenants, and to provide waivers where necessary. These included strong support from bondholders for covenant waivers and amendments to April 2021 and the adoption of liquidity-based covenants (based on cash flow) with banks and private placement providers to July 2021. This collaborative approach was helped by open and constructive dialogue in a period of great uncertainty and underlines the importance of good, long-term relationships with all our stakeholders.
We have secure medium-term financing in place. At the period end we had a £360 million bank facility available until 2024, of which £270 million was drawn providing headroom of £90 million, significantly better than our prudent forecasts. An additional £70 million facility agreed in May 2020 to provide further short-term liquidity remained undrawn and has now been cancelled as it is not required. We also have a £40 million private placement in place until 2024.
The joint venture between Carlsberg UK and Marston’s Beer Company completed on 30 October 2020 and, on completion, we received initial proceeds of £233 million, which were used to further reduce debt. The £360 million bank facility has been reduced to £280 million, which remains available until 2024.
We also have secure long-term financing in place. We utilised £15 million of the securitisation liquidity facility to satisfy the July quarter-end principal and interest payments. However, for the quarter to October 2020, we generated sufficient funds from operations to make payments and to repay £5 million of the liquidity facility, demonstrating that we are more than able to meet securitised debt obligations despite the current trading restrictions being in place.
In summary, we have significant headroom in our bank facility to provide operational liquidity, and a securitisation liquidity facility to protect bondholder payments for at least 18 months should that be required in the event of further interruptions to trading. Our cash preservation actions described overleaf, together with the Government financial support on VAT and business rates, mean our ongoing weekly cash burn in a full closure scenario (not the part closedown we are in at the time of writing) is estimated to be around £3–4 million per week.
Inevitably, in the event of additional restrictions in the coming months it is possible that further covenant amendments may be required depending on the nature of any restrictions introduced, and their duration. Whilst there is no certainty that these amendments will be granted (this has been disclosed as a material uncertainty in the financial statements), given our experiences to date we are confident of securing these where necessary.
Furthermore, the COVID-19 situation has triggered impairment reviews of goodwill, property, plant and equipment and right-of-use assets. The total value of these impairments, as described in the notes to the accounts is £461 million. Clearly this has distorted the net asset value of the Group in the short term at the balance sheet date. However, a degree of this is purely as a result of timing as this will be significantly offset in 2021 by the positive impact of the completion of the joint venture with Carlsberg, reflecting the cash received from the disposal of the Beer business into the joint venture and the carrying value of the Group’s share of the joint venture moving forwards. The profit on disposal is estimated to be around £280 million and the spot value of the contingent payment on 4 December was around £20 million, which will increase net asset value per share by approximately 48 pence in the 2020/21 financial year.

Marston’s PLC Annual Report and Accounts 2020
20
Group Operating and Financial Review continued
Financial Strategy In 2019 we set out a target to reduce net borrowings to below £1.2 billion. Following the completion of the joint venture between Carlsberg UK and Marston’s Beer Company, and the corresponding receipt of £233 million in October 2020, our borrowings are significantly reduced.
Our debt structure is mainly long-term, secured on our high-quality 91% freehold estate, with interest rate exposure hedged using interest rate swaps.
We have further reviewed our financial strategy and have concluded that our aim to reduce debt should continue and we have set a revised target to reduce net debt before IFRS 16 lease obligations to below £1 billion by financial year 2024.
This target is expected to be achieved through:
• Cash from operations, including the benefit of c.£5 million per annum of overhead savings to be implemented in 2021.
• A more focused approach to capital allocation, targeting enhanced returns on the existing estate. This includes the suspension of new openings for the foreseeable future.
CROCCE
• Tight control of capital expenditure of £40–45 million per annum including £10 million of growth capital.
• Disposal of non-core assets of around £10 million per annum.
• Reduced interest payments as a result of lower borrowings.
• Lower levels of dividend payment reflecting the dividend considerations described below.
• Receipt of dividends from the Carlsberg Marston’s Brewing Company.
As part of our response to the COVID-19 crisis we suspended dividend payments and a decision has not yet been made regarding the timing of reinstatement of dividends. Our dividend policy moving forwards will be based on cash cover, rather than on historical earnings cover, and it is likely that any dividends paid should be covered by underlying cash flow after principal repayments of securitised bonds.
Andrew Andrea Chief Financial and Corporate Development Officer
2020
Balance Depreciation Revaluation Adjusted £m £m £m £m
Non-current assets: Goodwill – – Other intangible assets 32.5 9.1 41.6 Property, plant and equipment 2,038.3 258.1 (430.6) 1,865.8 Other non-current assets 17.5 17.5 Current assets: Inventories 10.4 10.4 Trade and other receivables 16.2 16.2 Assets held for sale 349.7 349.7
Liabilities:
Liabilities held for sale (111.0) (111.0) Creditors* (234.8) (234.8) Cash capital employed 2,118.8 267.2 (430.6) 1,955.4 EBITDA 125.6 CROCCE 6.4%
Free cash flow 2020
£m
Net cash inflow from operating activities Interest received Interest paid
156.5 1.5
(91.0)
Free cash flow 67.0
Net cash flow 2020
£m
Increase in cash and cash equivalents in the period 3.1 Cash outflow from movement in debt 47.4 Net cash flow 50.5
* Creditors comprise trade and other payables, other non-current liabilities and provisions for other liabilities and charges.

Marston’s PLC Annual Report and Accounts 2020Strategic Report
21
Risk and Risk Management
Managing Risk during an Exceptional Year The management of Marston’s during the pandemic has required a robust response from all areas of the business. As events and Government policy have progressed the business has had to respond quickly to protect its people and guests, secure its pubs, safeguard liquidity and control costs. The pandemic continues to bring significant uncertainty to the operation of our business. Since reopening sites, our business has proved to guests that we can operate in a COVID-19 safe manner that does not diminish the enjoyment of visiting the pub.
By operating safely, we have demonstrated to Government that its COVID-19 guidelines and regulations can be effectively deployed at our premises. There is currently no proof that shutting pubs or reducing trading hours reduces the rate of transmission, in fact many argue that it leads to more social mixing within the home, in conditions more conducive to infection. Further lockdowns and restrictions on trade however are possible and Government have indicated this could reach into 2021.
Throughout the year Marston’s has demonstrated sound control in the face of COVID-19, seizing the opportunities that the changing operating environment has afforded. Our central support teams have been able to work effectively at home. Our IT technology, already well prepared for agile working, has coped without any major issues and our pub teams have trained and adapted quickly to new ways of working.
The Board and Audit Committee continue to recognise the importance of sound risk management to achieving all our strategic objectives. Keeping risk management integral to the operation of the Group is a priority, requiring a continuous scan of all threats and opportunities.
The trading environment in which our business operates has changed as a result of the pandemic and is likely to continue to adapt to the needs of our guests and new opportunities. External factors will always change the risks faced by our business, many of which, such as COVID-19, are unavoidable and must be robustly mitigated if our strategic objectives are to be met.
Our risk management processes aim to anticipate risks before they impact upon our activities to ensure that we are in the best place to mitigate those risks and recognise the opportunities they may bring in a competitive marketplace. We believe that our guests rightly have a high expectation of our ability to maintain the safety and quality of our products and services.
Risk management is ultimately about control. For all our key risks, we identify the key mitigating controls and their ownership. Our assurance activities are focused upon those controls so we can continually gauge their effectiveness.
The continuity of our business is implicit in the relationship with our guests. We build resilience into our supply chain while recognising the commercial importance of taking risks within an acceptable tolerance. We invest in our IT network to ensure there is enough capacity and resilience to mitigate the threat of disruption. We actively consider and rehearse for unexpected scenarios which could impact upon us at short notice. This in turn informs the practices and policies which we follow, and the emergency plans we adopt.
Our code of conduct, The Marston’s Way, is aligned with our corporate policies to articulate what the business expects of our employees.
Our appetite for risk The Board’s appetite for risk is a statement of the degree of risk the Group is prepared to accept in order to achieve its business strategy. The statement reflects the involvement the Board takes in matters of risk and the shared understanding of the risk management practices operated and their degree of effectiveness.
Marston’s is open to taking risks, providing those risks align with, and help us to achieve, our strategic objectives in a responsible way and within agreed parameters. Marston’s will, wherever possible, remove risks completely that pose a threat to achieving our strategic objectives.
8
Key Increasing risk Decreasing risk Less movement
Current key risk drivers A. Pandemic COVID-19 currently dominates the spectrum impact of risk for the Group. The pandemic has created a changed operating environment for our pubs, and significant uncertainty regarding local and national lockdowns. The rollout of the vaccine during the current financial year should allow normal trading conditions to resume.
B. Liquidity The disruption to trade and the consequential impact of COVID-19 on profitability could affect the Group’s ability to gain additional financial backing if the pandemic was to worsen and the pub estate was subject to another national lockdown. During the first lockdown Marston’s achieved an additional short-term bank facility by demonstrating that the impact of a lockdown is temporary in nature and cannot harm the long-term prospects of the Group.
C. Health and safety The pandemic has increased the threat to public safety everywhere. We recognise that the safety of guests and our people is critical to the continuing operations of our sites. Throughout the crisis, while the breweries continued to operate, and since reopening the pubs, Marston’s has proved its ability to operate within the Government’s guidance and regulations.
D. Brexit The UK and the EU may not reach a trade agreement by the end of 2020, which could result in higher import costs for Marston’s suppliers. Marston’s could mitigate the impact by seeking alternative products, possibly from outside the EU.
If avoidance is impossible, Marston’s will seek to mitigate risk by investing in effective controls or by sharing risks with a third party. These controls are managed and monitored to give assurance that the risk level is in accordance with the parameters set by the PLC Executive Committee. Our overriding principle of care remains integral to achieving our strategic objectives. We continually review the risks affecting our business to ensure we maintain our responsibilities to our people, guests, customers and the public, by guarding against threats to health, hygiene and safety as an absolute priority.
Principal risks The risks are plotted on the matrix according to impact and likelihood. The placing of the risk reflects the position after the mitigation controls.
1. Pandemic 6. Market/operational 2. Liquidity 7. Political and economic, 3. Health and safety including Brexit
4. Food safety 8. Information technology
5. Financial covenants, pension fund deficit and accounting controls
Impa
ct
1
2 3
Likelihood
6 4 5
7

Marston’s PLC Annual Report and Accounts 2020
22
Our Principal Risks and Uncertainties
The Board recognises the following principal risks could materially impact upon the operation of the business and its strategic objectives.
Pandemic risk is recognised as an individual key risk below due to the uncertainty of the current crisis, its duration of impact and its eventual resolution. It is one of the very few risks which can result in the complete shutdown of our pub estate.
At present it is appropriate to recognise that future lockdowns at a local or national level remain possible. Many of our principal risks are amplified by the pandemic crisis, necessitating additional mitigations to be put in place to support future business continuity. The pandemic impact upon the individual principal risks is shown on the following pages.
Key Increasing risk Decreasing risk Less movement
1. Pandemic
Risk context COVID-19 uncertainty regarding the continued impact upon public health and our behaviour. The duration of measures taken to reduce the infection rate is uncertain.
The risk There is a risk that infection rates increase leading to further restrictions on the public and further trading regulations for pubs and lodges.
Potential impact Ability of our teams to operate safely.
Reduced numbers of guests, and shorter stays.
Increased operating costs.
Mitigation • Tracking government advice and implementing it effectively.
• Adapting our pubs to facilitate distancing.
• Training our team members.
• Building contingency plans for future lockdowns.
• Consulting with our employees on safety concerns and operational issues.
• Simplifying our menus, streamlining our guest proposition and our supply chain to concentrate on offering the highest guest satisfaction at the right margin.
• Regular scrutiny of asset values.
Impact The pandemic has impacted the valuation of the Group. Hospitality sector share prices are depressed to a historic low. The determination of asset values must consider future trading levels which are at present uncertain.
Movement – Increased: The world is in the midst of a global pandemic. Until a vaccine has been successfully deployed, our operating environment and the ability to engage with our guests remains potentially disrupted.
Opportunity: Our pubs have been sorely missed by guests when forced to close, and upon reopening, their popularity especially during the EOHO promotion has been a reminder of their importance to their community. The situation reinforces our guests’ loyalty to their local pub. Pubs can benefit from the increased spend by the public within the locality of their homes. The changing marketplace provides opportunity for us to stand out to our guests. The vaccination of the most vulnerable has begun in the UK, hopefully this will continue successfully, leading to widespread immunisation in 2021.

Marston’s PLC Annual Report and Accounts 2020Strategic Report
23
2. Liquidity
Risk context The risk Potential impact Mitigation Business strategy is to While the UK battles the The liquidity of the business • Continue to lobby Government for pubs to remain open reduce debt, however pandemic, there is a risk could come under strain as with the assurance that they can operate in a COVID-19 short-term disruption could of regional lockdowns or a result of steps taken by safe manner. necessitate the need for national measures which the UK Government. • Lobby Government for more financial support. additional finance. could impact upon the
ability of the pubs to trade. • Reduce debt.
• Conserve liquid funds by cutting back on capex spend and reducing costs.
• Maintain strong relationships with financial backers.
Pandemic impact Successive waves of the pandemic could impact upon the confidence of banks to back those businesses most affected, such as hospitality.
• Significant headroom in our bank facility to provide operational liquidity for at least 18 months without further recourse.
• Lobby Government on the importance of the pub trade to the UK economy.
• Plan for resilience within our financial model to cover further short-term disruption.
Movement – Increased: UK Government have taken action to help protect the hospitality business during the pandemic, which has helped liquidity within Marston’s, however trading conditions are likely to remain disrupted in the short term.
Opportunity: In the medium term competition may reduce as a result of operators scaling back or leaving the market, bringing opportunities at the right rate of return.
3. Health and safety
Risk context The risk Potential impact Mitigation The safety of our guests, our Breaches of health and Significant damage • Health, safety and hygiene management people and the public is safety regulations might to reputation. systems embedded. fundamental to our activities. endanger the health of an • Dedicated safety advisers seeking continuous improvement. We seek to attain the highest levels of safety. Lapses of
individual, attract media attention and high penalties. • Regular independent expert safety audits at our pubs.
safety damage the trust and • Training of team members. reputation of the Group. • Escalation of potential safety threats to senior
operational management.
Pandemic impact The Government and local authorities have issued instructions for hospitality venues to operate safely which have changed depending upon the rate of infection.
Once issued, regulations have been communicated by our Health and Safety team to our operational managers to ensure they are clear about the steps they need to follow. Pub teams have been retrained on new measures when necessary. Our health and safety audits and our Regional Safety Advisers have checked upon compliance at site level.
Movement – Increased: There is an increased responsibility for Marston’s to operate safely during the current pandemic. Breaches of safety are taken seriously by all levels of our business. When our systems of control are found to be at fault, we confront any failing honestly, in order to learn and build stronger processes for the future.
Opportunity: In a competitive marketplace there is an increased opportunity to be differentiated in our guests’ minds by our absolute commitment to guest care, thereby building long-term trust.

Marston’s PLC Annual Report and Accounts 202024
Our Principal Risks and Uncertainties continued
4. Food safety
Risk context The risk Potential impact Mitigation Our guests must be provided Breaches of food standards Increased regulation • Maintaining excellent levels of compliance through policies, with accurate and reliable regulations attract adverse directly affecting Marston’s, training and monitoring. information on the food media attention and or our suppliers, could • The release of a new e-learning module on allergens for ingredients within our high penalties. increase the complexity completion by all pub team members. products. It is paramount that we can guarantee this and that we keep their trust.
The reliability of the information given to our
of the information to be provided and the cost of compliance.
• Working with our supply chain to maintain robust systems for identifying constituent food ingredients.
Public concern over allergens team members, their • Due diligence on accepting new suppliers, monitoring has grown in recent years training, and their care to and tracking. and attracts media coverage. engage with this matter
is key.
Our guests’ trust in our high standards of food hygiene could be quickly eroded by individual incidents.
• Tracking meal constituents all the way through to our menus and the descriptions contained therein and the accompanying allergens lists supplied to our team members and the public.
• Rigorous investigation of complaints.
• Tracking legislative changes and adapting operations.
Pandemic impact Disruption to the food supply chain resulting in financial pressure on food suppliers to the hospitality industry. Wasted food and drink trapped in sites locked down.
• Since the first reopening of pubs we have reduced our menus, with a higher focus upon the quality of our food items.
• Limiting the number of food items also supports our suppliers’ margins.
• Substitution of food items to avoid waste.
Movement – Decreased: The decrease in the number of menu items has brought greater focus upon the quality of food. Increased training on allergens for our pub teams.
Opportunity: There is an opportunity for Marston’s reputation for food safety and the care of our guests to grow. In 2021 we will continue with the development of a new food information system to collect more detail from our suppliers and enhance safety further.
5. Financial covenants, pension fund deficit, and accounting controls
Risk context The risk Potential impact Mitigation The Group’s financial system Breach of the covenants Loss of investor confidence, • Regular detailed management accounts, budgets handles many transactions with our lenders. and reputational damage. and forecasts. accurately and securely. Incorrect reporting Breach of covenants, • Detailed financial data collected from our sites. Accurate reporting is key to running the business
of financial results. Unauthorised transactions.
resulting in additional financial operating • Financial auditing of our sites based on data analysis.
effectively, and in compliance restrictions. • Constant monitoring of financial ratios. with our financial covenants. The pension deficit will • Internal and external audits.
The Group’s assets are valued increase while investment yields fall. • Segregation of duties.
on the basis of future profitability. • Access controls within our systems. The pandemic increases • Levels of authority. uncertainty and therefore • Commitment to reduce debt. increases the risk that the accounting valuation diverges • Management of the pension’s investment portfolio to
from market valuation. spread risk.
Pandemic impact Lockdowns and COVID-19 safety restrictions impact upon the normal operation of our pubs and lodges. Covenants could be impacted by a fall in profit.
• Communication and good relations with our bond holders and financial lenders enabled agreement to make appropriate covenant amendments and waivers where necessary.
Movement – Increased: There are strong controls mitigating this risk to a low level. The pandemic has however reduced our profitability this year. The impact on our covenants is reduced by clear communication and good long-term relationships with our lenders in order to effectively explain the impact of the current trading conditions.
Opportunity: The collection of financial data from our sites continues to increase the knowledge of our guests’ spend. In recent years we have developed our capability to analyse this data to a depth not previously possible. The use of the data improves the margins we achieve on food and drink. It also means that offers to guests can be more focused, and marketing campaigns can be deployed more quickly across the pub estate.
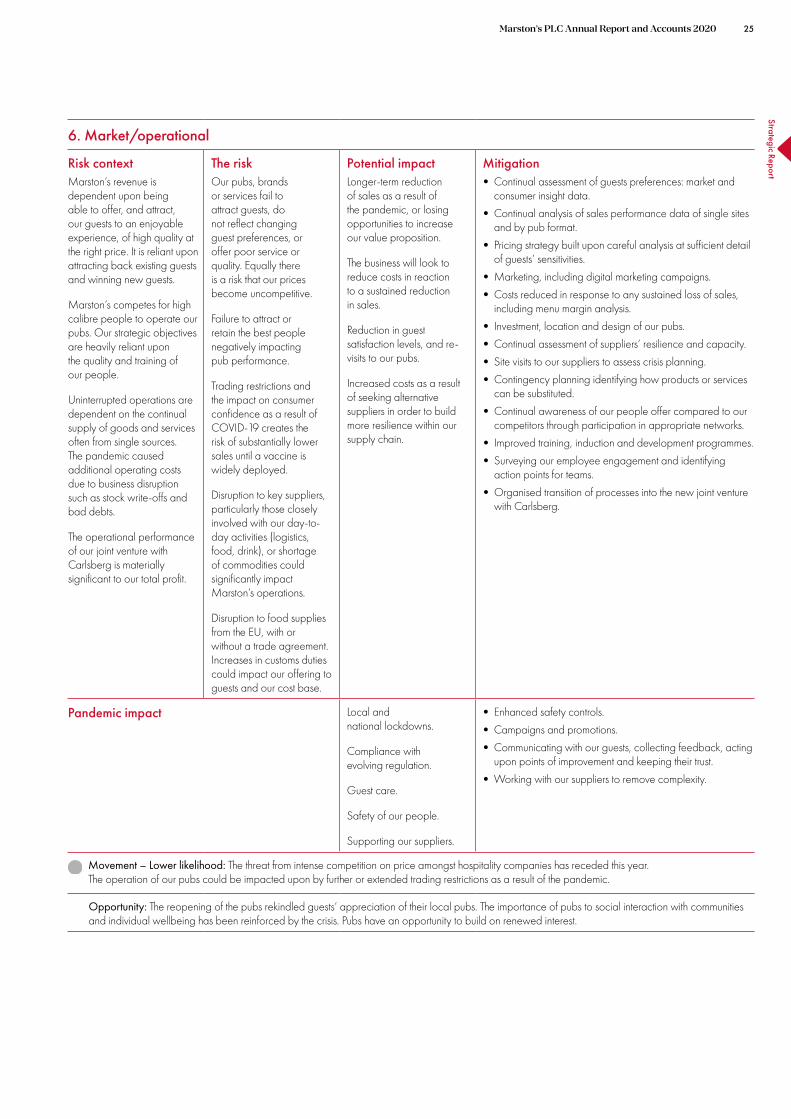
Marston’s PLC Annual Report and Accounts 2020Strategic Report
25
6. Market/operational
Risk context The risk Potential impact Mitigation Marston’s revenue is Our pubs, brands Longer-term reduction • Continual assessment of guests preferences: market and dependent upon being or services fail to of sales as a result of consumer insight data. able to offer, and attract, attract guests, do the pandemic, or losing • Continual analysis of sales performance data of single sites our guests to an enjoyable not reflect changing opportunities to increase and by pub format. experience, of high quality at the right price. It is reliant upon attracting back existing guests
guest preferences, or offer poor service or quality. Equally there
our value proposition.
The business will look to
• Pricing strategy built upon careful analysis at sufficient detail of guests’ sensitivities.
and winning new guests. is a risk that our prices become uncompetitive.
reduce costs in reaction to a sustained reduction
• Marketing, including digital marketing campaigns.
• Costs reduced in response to any sustained loss of sales, Marston’s competes for high in sales. including menu margin analysis. calibre people to operate our pubs. Our strategic objectives
Failure to attract or retain the best people Reduction in guest • Investment, location and design of our pubs.
are heavily reliant upon negatively impacting satisfaction levels, and re- • Continual assessment of suppliers’ resilience and capacity. the quality and training of pub performance. visits to our pubs. • Site visits to our suppliers to assess crisis planning. our people.
Uninterrupted operations are Trading restrictions and the impact on consumer
Increased costs as a result of seeking alternative
• Contingency planning identifying how products or services can be substituted.
dependent on the continual confidence as a result of suppliers in order to build • Continual awareness of our people offer compared to our supply of goods and services COVID-19 creates the more resilience within our competitors through participation in appropriate networks. often from single sources. risk of substantially lower supply chain. • Improved training, induction and development programmes. The pandemic caused sales until a vaccine is • Surveying our employee engagement and identifying additional operating costs widely deployed. action points for teams.due to business disruption such as stock write-offs and Disruption to key suppliers, • Organised transition of processes into the new joint venture
bad debts. particularly those closely involved with our day-to-
with Carlsberg.
The operational performance day activities (logistics, of our joint venture with food, drink), or shortage Carlsberg is materially of commodities could significant to our total profit. significantly impact
Marston’s operations.
Disruption to food supplies from the EU, with or without a trade agreement. Increases in customs duties could impact our offering to guests and our cost base.
Pandemic impact Local and national lockdowns.
Compliance with evolving regulation.
Guest care.
Safety of our people.
Supporting our suppliers.
• Enhanced safety controls.
• Campaigns and promotions.
• Communicating with our guests, collecting feedback, acting upon points of improvement and keeping their trust.
• Working with our suppliers to remove complexity.
Movement – Lower likelihood: The threat from intense competition on price amongst hospitality companies has receded this year. The operation of our pubs could be impacted upon by further or extended trading restrictions as a result of the pandemic.
Opportunity: The reopening of the pubs rekindled guests’ appreciation of their local pubs. The importance of pubs to social interaction with communities and individual wellbeing has been reinforced by the crisis. Pubs have an opportunity to build on renewed interest.

Marston’s PLC Annual Report and Accounts 202026
Our Principal Risks and Uncertainties continued
7. Political and economic
Risk context The risk Potential impact Mitigation The UK economy could stay High persistent levels of Our costs to import food • Positioning our customised offer at the right price point. in recession, compounded by unemployment could and drink could rise • Lobbying Government on the COVID-19 safety measures UK Government and the EU impact consumer spend in as a result of customs operated within our premises. failing to conclude a trade deal by December 2020.
The failure to conclude a
our pubs, particularly those with a more premium focus.
The import of goods,
duties imposed beyond December 2020. These costs could also rise as a result of a lack
• Continual assessment of supply contracts and renegotiation of terms when they fall due, to protect our business from customs duties.
trade agreement to date including fresh food, from of supply. • Where feasible, working with our key suppliers to hold has increased business the EU could be disrupted. stocks in the UK of food and drink sufficient to cover short-uncertainty regarding the flow In the event of disruption, it It may be harder to secure term disruption. of goods and services to and could be difficult to source long-term agreements with • Consider alternative sources of supply if our suppliers have from the EU. alternative supplies of food
and drink for the same cost. our suppliers. trouble importing goods.
UK Government could bring Border delays could disrupt in additional restrictions for our supply chain, impacting pubs and lodges to operate. upon the availability of
food and drink brands to our pubs.
Pandemic impact With little or no scientific data, pubs can be blamed for increased rates of infection.
• Effective deployment and management of COVID-19 safety measures.
• Lobby Government to keep pubs open.
• Keep the public’s trust.
Movement – Lower impact: Trade talks with the EU have reached a broad consensus of agreement compared to the position a year ago. However, significant uncertainty still exists and the scenario of both sides pulling away from talks is a possibility. Irrespective of an agreement, new cross border controls could still cause disruption to imports from the EU for our suppliers.
Opportunity: Measures brought in by the UK Government will ease the flow of goods when they arrive in the UK during the first half of 2021. Government investment in the infrastructure of customs handling should thereafter provide greater efficiency during the customs declaration process.
The impact on the UK economy by the pandemic is likely to be felt for a long time. The Government’s preference is for lockdowns at a local level rather than national, which allows the pubs to operate during the periods in which restrictions are released.

Marston’s PLC Annual Report and Accounts 2020Strategic Report
27
8. Information Technology
Risk context Our business activity is reliant upon the Group’s IT network to communicate, operate effectively, serve our guests, process transactions and report on results.
The continuous operation of our business is dependent upon the uninterrupted running of our computer network, site links and the internet.
Marston’s handles the personal contact details of many of its guests who opt to use the wifi or receive emails, as well as a large number of our people.
The risk Threats to IT are both external and internal and could result in a network outage, loss, theft or corruption of data or denial of service.
Potential impact Reduction in the effectiveness of operations, business interruption and loss of profit. Regulatory fines as a result of the loss of data.
Mitigation • Anti-virus and firewall protection.
• Access control, password protection and IT policy adherence.
• Network controls and monitoring.
• Penetration testing and remediation.
• Backup procedures.
• Data recovery plans and rehearsals.
• Raising people awareness regarding IT security.
• Data security policies, processes and training.
Pandemic impact An increase in homeworking. An increased cyber threat as criminals try to take advantage.
• Raised people awareness regarding IT security.
• Network monitoring increased, additional VPN capacity provided.
• Homeworking policy communicated.
Movement – Slight net movement: Global cyber risk has evolved in recent years, targeting the theft of personal data, launching ransomware attacks and intercepting transfers of money.
For many years Marston’s has invested in its network protection, firewall and device monitoring functionality. Marston’s conducts penetration testing on its network, and each year specific cyber risk reviews are conducted on security by an independent team.
Opportunity: The ability for our support teams to securely work from home, if required, creates greater agility and resilience for our business.
Our engagement with guests creates more digital marketing opportunities, for which security and continuity of our network, as well as the trust of our guests, is fundamental.

Marston’s PLC Annual Report and Accounts 2020
28
Our Levels of Defence
1. Management Ownership Our managers are responsible for understanding risks, communicating them and developing the control environment necessary to mitigate them to a level which is within the risk appetite of the business.
Governance framework The Group operates within a clear set of policies established by the Board, and the PLC Executive Committee (PLC Exec). Adherence to these policies governs the parameters within which the business accepts risk. Authority is delegated through the business to ensure that management is empowered to operate effectively while staying within the system of governance approved by the Board. Authority levels are aligned with levels of management and the degree of responsibility over risk. Changes to policies occur at the instigation of management, in response to either new threats, legislation or new opportunities.
In response to the scale and speed with which the pandemic took hold in the UK, the Group established a Coronavirus Task Force to respond at pace to the impact on our people, our business, our partners and other stakeholders. The Task Force was empowered by the PLC Exec to take the necessary actions and decisions.
Management are responsible for monitoring and reporting upon the effectiveness of the controls to the Board via the Corporate Risk Director. The managers’ assessment of the effectiveness of the key business controls is tested by the Internal Audit plan and reported to the Board on a regular basis.
The key features of the internal control system are:
• A clearly defined management structure operating within a framework of policies and procedures covering authority levels, responsibilities and accountabilities. Policies are communicated to the appropriate employees. Policies applicable to all our people are communicated on induction and cross referenced by our code of conduct, The Marston’s Way.
• Embedded risk management into day-to-day activities.
• Ensuring that our operations abide by all applicable laws and regulations.
• Continual improvement by reporting on effectiveness, recognition of weaknesses, additional investment and by encouraging achievement.
• A detailed formal budgeting process for all activities, with the annual budget and projections for future years formally approved by the Board.
• Established procedures for planning, approving and monitoring capital expenditure and major projects designed within a sound framework of risk management.
• Board approval requirement for all major investment, divestment and strategic plans and programmes.
• At each of their meetings the Board reviews financial and non-financial progress towards the strategic goals.
Control systems are designed to manage rather than eliminate risk. By their nature, such systems provide only a reasonable and not absolute defence against material errors, losses, fraud or breaches of the law.
2. Committee Oversight The PLC Exec meets regularly to consider how to implement the actions required to achieve business objectives, and to monitor risks and opportunities.
The PLC Exec take ownership of the implementation of the business strategy, the operation of the business to meet operational and financial targets, and the design of internal controls to reduce risks. The PLC Exec understand the business’s appetite for risk, and direct management to collect information through internal processes in order to measure that the control of risk is within that appetite. In turn management consider, communicate and implement the decisions on risk made by the Board and the PLC Exec and report on effectiveness.
Within our management structure we operate several committees in order to focus attention upon areas of risk requiring senior management attention:
Risk & Compliance Committee (chaired by the Group Secretary)
The Committee reviews the identification of the principal risks and considers the alignment of internal audit testing to the risks. It also conducts a focused examination of areas where risks are significantly changing. The Committee tracks the emergence of new legislation and monitors the Group’s preparation for compliance. New policies are considered by the Risk & Compliance Committee before submission to the PLC Exec and, when appropriate, the Board for approval.
Data Security Committee (chaired by the Group Secretary)
The protection of personal and commercial data is considered. The representatives on the Committee are those where the risks to the business are higher: employee data, marketing data, pub operations data and IT security. Our data security policy and management processes are maintained to govern legal compliance. All employees receive data training on induction and at appropriate intervals. Data security guidance is always available to our employees. Our data security Incident Response Plan is practised annually in order to guarantee an effective response to any data breach.
Corporate Responsibility Committee (chaired by the Corporate Risk Director)
The ethical approach of the business is considered in all respects. The Committee defines the Corporate Responsibility priorities of the business, identifies the relevant actions taken by Management and considers progress of those actions against targets. See our Managing and Nurturing our Resources and Relationships on pages 30–41 for more information on our key areas of responsibility including people, guests, partners, suppliers, community and the environment.
Business Continuity Steering Committee (chaired by the Corporate Risk Director)
The resilience of the Group to events outside of its control is considered, and the lessons learned from any actual incidents or scenario tests. The Committee considers the threats to our continual operation, the resilience of business to cope with the unexpected and the rehearsal of emergency plans. Consideration is given to the resilience of our supply chain, their own planning as well as our ability to seek alternative supplies at short notice. The Committee is briefed on improvements to IT resilience, its protection from interference and its recovery plan.

Marston’s PLC Annual Report and Accounts 2020Strategic Report
29
3. Assurance Governance The Risk team comprises the Corporate Risk Director and the Internal Audit function. The team reports to the Group Secretary who is a member of the PLC Exec and can elevate matters regarding risk where appropriate to the Board. The Corporate Risk Director and the Group Internal Audit Manager attend the Audit Committee meetings and can raise any concerns regarding risks independently.
Enterprise Risk Management (ERM) The Corporate Risk Director, who heads the Group Risk team, operates an ERM process in order to identify, monitor and report on those risks which could impact on our ability to achieve our strategic objectives. The key risks and controls are recorded in our corporate risk register. The ownership and assessment of risks is discussed and recorded during bi-annual meetings with the relevant and responsible managers.
The corporate risk register is shared appropriately with the managers in order to keep it current and relevant with the business. We use common risk management tools and language to engender cross functional consistency and measurement across the Group.
Our Internal Audit plan is developed with reference to the recorded risks and controls. The effectiveness of the controls at reducing risk to an acceptable level is tested by Internal Audit and reported to the Audit Committee.
Levels of insurance cover are managed by the Corporate Risk Director with the authority of the Board and in consultation with external advisers. New levels of insurance are considered each year in the context of changing external threats.
Internal Audit The Internal Audit function is managed by the Group Internal Audit Manager, reporting to the Corporate Risk Director, and is independent from the operations of the Group. Internal audit strategy is risk based and testing is focused upon the greatest risks to the Group. The strategy has been approved by the Audit Committee and aims to provide a sufficient level of assurance regarding the strength of the control environment as well as supporting continual improvement in risk management.
The Internal Audit plan is produced by the Group Internal Audit Manager. The plan takes into consideration the key risks within the business, areas of increased risk and the regularity of the testing. The Group Internal Audit Manager consults with the PLC Exec and the Risk & Compliance Committee regarding areas of concern which require additional assurance. Resource and expertise are sought from an independent professional internal audit co-source for individual projects. The budget for internal audit is submitted annually for approval by the PLC Exec and the Audit Committee.
Internal audit projects are planned with the assistance of senior management and the results are reported to the business, the Risk & Compliance Committee and the Audit Committee. Our internal audit co-source assists with the projects associated with higher risks or which require specialist skills.
The Risk team audits the strength of financial controls within the pubs, using data analysis to identify areas of concern. The results of this testing are communicated to the operational managers and follow-up audits conducted to measure improvement. The team also tests compliance by all the tenanted sites to their drinks contract.
When the pubs were locked down internal audit work focused on areas which could have increased in risk due to the pandemic, namely health and safety, cyber security and property maintenance. Our financial auditors tested the closing and opening cash balances of our sites, particularly where data analysis indicated anomalies.
4. Strategic The PLC Exec is chaired by the Chief Executive Officer and comprises, amongst others, operational directors who are responsible for the implementation of strategy and for carrying out actions directed by the Board, monitoring performance and overseeing risk management and internal control. Actions required are communicated to the senior managers within the Group.
5. Board/Audit Committee The Board is ultimately responsible for the Group’s framework of governance, internal control and risk management. The mitigation of risk is delegated to the Executive Directors and other senior management. The Board is responsible for ensuring that management review and report on the effectiveness of the internal controls. The Board is also responsible for understanding the nature and extent of the principal risks, its risk appetite and the Viability Statement.
Management reporting to the Board must be in sufficient detail for the Board to assess its risk appetite in the context of the risks and opportunities, and to make informed decisions in order to accomplish the strategic objectives. During the year, the Board has robustly assessed the risks and opportunities faced by the business, considering the ability of the business to achieve its strategic objectives and emerging legislation.
New non-executive members of the Board are inducted into the business which includes meetings with senior managers, the Executive Committee, the Finance team and external advisers. This gives new members opportunities to find out about the challenges for the business, risks and the controls and processes operated. New members are given a pack of information on business operations and access to previous Board minutes.
Viability Statement In accordance with Provision 31 of the UK Corporate Governance Code 2018, the Directors confirm that they have a reasonable expectation that the Group will continue to operate and meet its liabilities, as they fall due, for the next three years. In a downside scenario, incorporating a further lockdown and pub opening restrictions at a national level for a two month period in January and February 2021, the Group would be required to seek amendments to covenants on its financing facilities. Whilst there is no certainty that these amendments will be granted (this has been disclosed as a material uncertainty in the financial statements), given our experiences to date we are confident of securing these where necessary.
The Directors have determined that a three-year period is an appropriate period over which to assess viability, as it aligns with the Group’s capital investment plans and gives a greater certainty over the forecasting assumptions used. The Directors’ assessment has been made with reference to the Group’s current position, financial plan and its principal risks and uncertainties set out on pages 22–27.
To assess the impact of the Group’s principal risks and uncertainties on its long-term viability, scenarios were applied to the Group’s financial forecasts in the form of reduced like-for-like sales, the closure of some or all of its pubs and increased borrowing costs. It is assumed that the Group’s financial plans would be adjusted in response to each scenario.
In making this statement, the Directors carried out a robust assessment of the emerging and principal risks and uncertainties facing the Group, including those which would threaten its business model, future performance, solvency or liquidity. Principal risks and uncertainties set out on pages 22–27 are the result of internal risk management and control processes, with further details set out in the Audit Committee’s report on pages 56–58.

Marston’s PLC Annual Report and Accounts 2020
30
Managing and Nurturing our Resources and Relationships
Our relationships with key stakeholders and how we manage and nurture them are critical to our long-term success. We also recognise the need to manage the natural resources we rely on to operate and how we can reduce our impact on the environment around us.
Corporate responsibility is intrinsic to the way we manage resources and relationships. On the following pages we have set out these relationships, displaying the characteristics of our approach. More information is available at www.marstons.co.uk/responsibility
We invest in our people
See pages 31–32 for more information
We care about our guests’ wellbeing
See pages 33–34 for more information
Engaging with We support our our investors partners to grow
See page 41 their businesses for more information
See pages 36–37 for more information
We partner with suppliers
Engaging with government
See page 41 for more information
We celebrate our local communities who share our values
See pages 34–35 See pages 37–38 for more information for more information
Reducing our environmental impact
See pages 39–40 for more information

Marston’s PLC Annual Report and Accounts 2020Strategic Report
31
We invest in our people Marston’s recognises the responsibility it has to its employees; they are its greatest asset upon which the achievement of our strategic objectives is dependent.
This year, navigating through the COVID-19 crisis has been tough on the business and our people, yet it has provided an opportunity to see the character of our people and the Marston’s culture shine through.
Caring for our people is at the heart of our philosophy. During the pub lockdown we worked tirelessly to ensure that our people remained one team. Our communications were increased to ensure that everyone received clear messaging on the information they needed to know and act upon, alongside regular communications focused on morale and well‑being.
We have always believed the long‑term development of our people, their confidence, skills and experience, is a responsibility of the business, recognising that it is a critical requirement for sustained commercial success. Our people were highly anxious when the pubs had to close, and their livelihoods were put on hold. Therefore, we worked hard to ensure our people had the trust and confidence that the business would stand by them during this difficult time. However, inevitably, and regrettably, the ongoing restrictions have impacted jobs and we have reluctantly concluded that around 2,150 pub‑based roles have been affected. Furthermore, we have initiated a full review of overhead costs which will be concluded by the end of December. These decisions are difficult but necessary due to the ongoing restrictions placed upon our business at this time. These decisions haven’t been taken lightly and remain aligned to our core objectives of protecting the livelihoods of as many of our people as possible and ensuring that we have a profitable and sustainable business.
On reopening our pubs, our people came back to work enthusiastic to offer a warm and safe welcome to returning guests and do all they could to bring back the pub experience that had been missing for too long.
We succeed together because of the alignment of our corporate values with individual values, in turn contributing to our people’s enthusiasm to strive for success and to engage happily and safely with our guests.
Supporting our people during COVID-19 Our teams received help from the moment pubs were closed, through reopening and to this day. The principal ways in which we helped our teams were as follows:
• 93% of our people were furloughed under the Government’s Coronavirus Job Retention scheme.
• A one‑team approach was adopted regarding pay and contractual hours for both furloughed and non‑furloughed employees: with the exception of a small number of brewery teams, who worked their normal contractual hours, all employees received 80% of pay for the duration of the first lockdown period.
• COVID‑19 risk assessments were conducted at all of our sites and safety measures immediately deployed to reduce person‑to‑person contact. Our larger brewery sites and depots continued to operate safely throughout the period.
• Communication links between managers and furloughed employees were maintained during the lockdown so all team members were kept informed of any developments.
• Messages from our senior managers including the CEO were issued promptly following any significant change to guidelines that affected the business. These explained in clear and supportive language the position of the business and the actions it needed to take in order to adjust ways of working and stabilise the business.
• Q&A on the new COVID‑19 safety procedures, employment information and pay were maintained online for all our people to access. These documents were updated on a weekly basis in order to respond to new questions.
• News stories from around the business were shared on weekly basis through our communication channels including our social media sites.
• Our e‑learning platform Talent Academy Online hosted work and life related training courses.
• Our messaging focused upon wellbeing recognising that many of our people were coping with hardship, anxiety and isolation.
Other areas of focus this year • Through the provision of online training we have reduced the time
needed for completion of induction training for our pub teams to two weeks. This includes all the essential and relevant knowledge on our Ways of Working, customer care, safety, food hygiene, licensing and legal responsibilities.
• Further development of our e‑learning platform Talent Academy Online, widening its reach to all employees across the business and to take more advantage of the ability to create our own e‑learning training courses. Last year, 22,649 learning on‑demand documents were accessed by our employees.
• Mandatory online training was provided to all our pub employees prior to the pubs reopening in order to instruct them on the new COVID‑19 safety measures implemented within the pubs, what they should expect and their part to play.
Apprenticeships We are proud to have maintained our target of training nearly 500 apprentices again this year, across our pubs and bars, breweries and distribution network. We have given particular focus to the wellbeing of all apprentices, as a result of the coronavirus outbreak. We initiated a break in learning for apprentices during their period of furlough, particularly where line managers and mentors were not available for support. At the end of the summer, 87% of apprentices returned to the workplace and resumed their learning; our focus has been to support them to get back on track and continue progressing through their programmes.
As part of our commitment to all our apprentices, we have worked with our partners to develop training programmes that continue to provide support during the pandemic through virtual platforms and remote progress reviews. Our interactive online workshops have been a great way for apprentices to engage with tutors during live learning activities. We have put measures in place to comply with statutory requirements, Government recommendations, and to keep everyone safe. We have adapted our learning offer to enrich apprentices with the skills needed to prepare for the post‑COVID‑19 future.
We plan to continue to invest in the skills and abilities of our people as part of the Marston’s Apprenticeship Academies at levels 3, 4 and 5; a blended model of learning, through ‘know it’ webinars, ‘show it’ skills day masterclasses and ‘live it’ behaviours. In addition to supporting our people to develop their leadership capabilities, we will continue to engage with the next generation of school students through our ‘Take 5’ work experience programme and with parents, educators and careers advisers, promoting ‘Loving Hospitality’, a collaboration with our industry peers.

Marston’s PLC Annual Report and Accounts 2020
32
Managing and Nurturing our Resources and Relationships continued We invest in our people continued
We see first‑hand the impact apprenticeships have on individuals and our business. Apprenticeships are supporting our people to grow, which is why we are continuing to introduce more apprenticeship standards and training partners to meet the development needs of our people at any level, any age and from any background.
Case Study Throughout the lockdown period our primary goal was to keep our people informed, engaged, and motivated. Key to this was to communicate regularly and directly through emails every Monday, Wednesday and Friday. We focused on wellbeing, providing lots of inspiration on how to stay fit and healthy; physically, mentally and emotionally, by sharing ‘Mid-Week Motivation’ tools and ‘Well-being Wednesday’ ideas. We also recognised our great teams and the work they were doing in their communities, both on our internal channels and on our social media channels, further reinforcing and recognising the amazing efforts of our people. We also developed a ‘return to work’ microsite specifically created to be a one-stop-shop for all information, tools and questions for our remote people to tap into quickly and easily.
Progress against key targets 1. Employee engagement and enablement In 2019 our scores were strong for engagement and enablement at 68% and 69% respectively; 2% above the UK average. This year while our teams have been disrupted by the pandemic we have not carried out a full survey. However, we did survey our teams on our handling of the crisis, the experience of working from home, and the communications they have received. The findings showed how positively Marston’s had informed and supported colleagues. We have engaged with a new partner to provide a more dynamic platform to continuously measure engagement and enablement and facilitate responsive actions.
2. Wellbeing Support for all our people will be a priority in the year ahead. We have already increased our internal communications to reach all employees during the crisis and we intend to maintain this. There will be a renewed focus upon our ‘One Team’ approach in order to ensure that our people feel connected and sufficiently confident to express their thoughts and any concerns, whether working in the office, pub or at home.
Our People Strategy Our single people purpose is to engage and enable our teams to deliver a great guest experience, supporting the business on its journey from ‘Good to Great’. Previously, our strategy served a more diverse audience across a wider business, but with the beer business having moved into the joint venture with Carlsberg, we are now focused on a people strategy that is aligned to, and representative of, the pub business. Our people strategy is aligned to our three core strategic pillars.
1. We are Guest Obsessed Our reason for being is to deliver great guest experiences to all who visit our pubs. Our business will only be as good as the people who work in it; it is therefore critical that we not only attract the very best talent but that we ensure everyone who works for us understands the importance of a consistent guest journey, through mandatory training modules for pubs teams and central support teams alike.
Closely aligned to our culture and the wellbeing of our people, our new reward plan will focus on ensuring that we deliver the basics but also inspire and motivate our people to be the best they can be. We want our people to feel empowered to take the initiative and be engaged in the roles they perform.
We strive to attract the very best guest‑obsessed people. Over the last 12 months we have invested time and resource in improving our careers websites and developing systems that help to support our pub General Managers to recruit and hire the very best talent. We aim to invest in other new platforms that remove the complexity when recruiting for a more flexible workforce. Our campaign work both for pub and head office roles is focused upon attracting people with a passion for hospitality – we only want people who love pubs and want to work for an ambitious guest‑focused business.
2. We Raise the Bar We continually strive for improvement in the development of our teams, seeking to understand how to further enhance the engagement and enablement of our people by continuously listening to feedback and supporting managers to take action.
We are developing leadership programmes from Executive level down to first line management that will embody the values and behaviours necessary to move the Group from ‘Good to Great’. Our internal communications are focused on four key priorities: to inform, to inspire, to engage and enable, and investment in the way that we communicate to facilitate a greater clarity of focus. We are committed to building an inclusive culture where people feel welcome and included for who they are. This inclusiveness applies to all aspects of employment, recruitment, development and termination of employment; how we treat each other, and our guests should reflect the caring culture and values that define our business. Underpinning all of this is the support we will continue to provide through our weekly communications to all of our people sharing hints, tips and content focused on our teammates’ physical, mental and financial wellbeing.
3. We will Grow We have made good progress in developing our teams. The changes in internal structures as a result of becoming a pub‑focused operator, have enabled internal talent to be promoted to senior positions including the PLC Exec, alongside several strategic external appointments into other senior management roles. We intend to continue to nurture and develop our internal talent and successors by promoting from within, whilst retaining the right balance of external recruitment. We recognise that we need to get better at how we present and promote ourselves as an exciting, fun and progressive employer and our teams are working on representing us as a great place to work. Our vision is to be an ‘employer of choice’, with a rich and diverse mix of people who reflect the society and communities in which we work and serve.

Marston’s PLC Annual Report and Accounts 2020Strategic Report
33
We care about our guests’ wellbeing Our ability to deliver a great experience to our guests is of the highest priority.
We want to ensure that our guests believe that our pubs are a welcoming and safe environment, whether the purpose be to drink, eat or stay. We recognise that food can be healthy as well as special for our guests, and we are constantly looking for innovative ways in which we can achieve this. Detailed information on food, for example allergens and nutritional values, is becoming increasingly more important so we have accurate data capture and effective communication processes as well as training for team members, particularly concerning allergens. We listen to our guests’ preferences and adapt our pubs, brands, food and drinks to satisfy changing tastes, lifestyle and curiosity. We maintain a catering hotline for our pubs every day of the year so that any concerns regarding food in particular can be immediately addressed.
Our Guest Strategy The strategy is fundamentally based on these core elements: • We are Guest Obsessed – using insight‑led decision making and
dynamically responding to feedback, we aim to improve the quality of our guest journey and make their stay a happy one.
• Raise the Bar – we constantly seek to raise standards of quality and guest satisfaction and are doing this through reducing complexity, more targeted and timely communications, further enhancing the capabilities of our support specialists and building on our relationships with our suppliers.
• We will Grow – aimed at our margins, guest loyalty, new visits and return on investment. We have been working on integrated category plans, ways of rewarding guest loyalty, additional revenue opportunities and more disciplined pub investment decisions.
Supporting our guests through COVID-19 • We have kept our guests and customers informed in anticipation of
reopening of the reasons to visit us and to set out how we have followed the Government’s safety guidance through our Makes Sense initiative.
• Before reopening, our guest journey for pubs and lodges was carefully planned with all aspects of the guest experience considered. Our aim was to ensure guests felt comfortable, relaxed and welcome whilst reassured about safety.
• Our teams were trained on the new safety measures before the pubs were reopened to create the best experience from the outset and ensure our guests were happy to return.
• The Government’s Eat Out to Help Out scheme was tremendously successful. Our pub teams did their utmost to meet demand within the operating restrictions to keep everyone safe. 160,000 bookings were received in one week, outstripping Christmas threefold.
Other areas of focus this year • In recent years we have reduced the calorie content in our menus
through the use of exciting new products. We have also collected calorie information on drinks with the aim to communicate this to customers in the future.
• We continue to work with suppliers to reduce sugar. We have always ensured new products achieve the current salt reduction targets set by Public Health England and we are now working to the new 2024 targets. We are in a good position to achieve these targets given our previous work in this area.
• We now have a greater range of low and no‑alcohol drinks options. We offer a wider range of soft drinks, from traditional draught favourites to bottled fruit drinks and more adult focused premium minerals and mocktails.
• We recognise the growth of the hot drinks category, investing in recent years in new coffee machines to improve the offering to our guests. We partner with suppliers who source their own Rain Forest Alliance accredited coffee bean.
• Training on the importance of allergens has been rolled out to all members of our pub teams, food development team, marketing, customer services and operations teams. The training has reinforced how high we value the importance of equipping our teams with the right knowledge regarding allergens.
• The week beginning 4 April 2020 was our biggest ever week in Off‑Trade for the brewing division, with over 17,000 barrels of beer being delivered to supermarkets and independent retailers. In bottles and cans, that’s equivalent to 4.9 million pints (500,000 more than our busiest ever Christmas week). This rate was maintained throughout lockdown, ensuring customers at supermarkets were not disappointed

Marston’s PLC Annual Report and Accounts 2020
34
Managing and Nurturing our Resources and Relationships continued We care about our guests’ wellbeing continued
Progress against key targets 1. Food information system We have embarked on a major project to enhance our food information system. The new system will improve the collection of information from the supplier on nutrition, allergens, safety and ESG factors. This information will be delivered through to our pub teams, including the kitchen team, to ensure that guest choice regarding food, particularly allergens, is adhered to with the highest degree of accuracy.
2. Drink allergens We are extending the recording of drink ingredients to highlight allergens in order to provide clarity to our pub teams and guests.
Case Study Keeping our guests engaged during lockdown was key – just because the pubs were closed didn’t stop us from connecting with them through regular email updates, online pub quizzes and virtual brewery tours. In anticipation of reopening, we reminded guests of the many reasons they visit our pubs and clearly set out how we were planning to follow the Government’s safety guidance through our ‘Makes Sense’ initiative. Before reopening, we carefully planned our guest journey, ensuring we followed the safety rules whilst also ensuring that we retained the familiar and much-loved pub ambience our guests craved after weeks of lockdown. Our aim was to ensure guests felt comfortable, relaxed and welcome, while at the same time reassured and safe.
We celebrate our local communities Our pubs are highly valued by the communities in which they are located.
These strong relationships are essential for the long-term success of our pubs and form part of the heritage and character of Marston’s. We encourage our operators to participate in community initiatives such as Best Bar None, National Pubwatch and Purple Flag schemes. Every year we involve ourselves in community events and this year we have remained active, supporting people experiencing hardship.
Supporting our communities through COVID-19 • During lockdown some of our pubs including, Queen of Hearts in Runcorn,
Eyre Arms in Calver and the Sessile Oak in Llanelli, helped to collect donated foods and raise funds. Food parcels for the vulnerable and freshly cooked meals were delivered to care homes and foodbanks. Fundraising included virtual quizzes, virtual race nights and a 24‑hour radio marathon.
• Marston’s employee charitable funds donated £10,000 across 20 different charities, and 40 iPads to hospitals and care homes across the country.
The majority of our pubs were closed for most of the summer period, however it didn’t stop them from engaging with their communities.
• Most of our pubs participated massively in ‘clap for carers’, often being the hub of the community during this time, going above and beyond by putting up banners, posters, even broadcasting music to clap to and getting their families involved.
• Lots of our pubs did great things at Easter including dressing up and Easter egg deliveries. They did quizzes, they raised money for local charities, they donated food to food banks and local people. Many pub partners really kicked in with deliveries and take‑away, which has been really important for local communities, especially those who struggled to get out and about.

Marston’s PLC Annual Report and Accounts 2020Strategic Report
35
Other areas of focus this year • Each year we donate to Pub is the Hub, which supports pubs diversifying
within often small rural communities to incorporate local stores, play areas, postal services and libraries.
• Our people are involved in charitable activities, such as Food for Christmas. We opened up a food bank donation point in our head office before Christmas 2019 and the food donated was given to local charities. Our Area Managers nominated pubs that had carried out charitable activities during the Christmas period and sent hampers to support their fundraising, packed by our central support teams.
• We promote and support fundraising across our pub estate through our Community Heroes Week. Regrettably, we had to cancel it this year, as this annual fundraising event is normally our most active and inclusive event encompassing our offices, breweries and pubs. Our pubs and team members get involved in a variety of activities across the country to raise funds for a number of different charities chosen by our central support teams and pubs.
• We recently launched ‘local legends’ – a campaign led by the marketing team to identify local people who went above and beyond. Pubs were able to get communities to nominate their local legend and we’re also in the process of identifying national legends.
Progress against key targets 1. Encourage our pubs to engage with their
local communities We intend to increase the number of pubs taking part in our Community Heroes Week next year to include many more of our managed pubs, subject to any social distancing measures. Funding during Community Heroes Week reflects the important role that pubs play in their area. The activities are supported by our central support teams and demonstrate how important this is to everyone.
2. To match any contributions made to charities by our people through the payroll
We will continue to match the contributions of our employees to the Company’s charitable fund. The generous contributions from our employees have provided the means to react quickly to charitable requests during the pandemic.
For more information on community initiatives, please visit the links below:
Best Bar None: www.bbnuk.com
National Pubwatch: www.nationalpubwatch.org.uk
Purple Flag: www. nbcc.police.uk/guidance/purple-flag-scheme
Case Study We were proud to receive a letter from the Leader of Wolverhampton City Council, who commended our draymen for delivering 90 food parcels a day to vulnerable people. The dedication and hard work of logistics teammates at the Wolverhampton distribution hub shone through as they stepped up to support the local council, delivering thousands of food parcels to vulnerable people across the city throughout the COVID-19 pandemic. Our experts helped to plan the routes and manage the emergency deliveries, as well as providing motorised trucks for use in the temporary food distribution hub. In a letter to our CEO Ralph Findlay, Councillor Ian Brookfield praised the team for their hard work, knowledge and expertise: “We have no doubt that the food distribution hub would not have been created and run so successfully without your employees’ conscientiousness and hard work.” The assistance they provided saved lives and helped to protect the NHS.

Marston’s PLC Annual Report and Accounts 2020
36
Managing and Nurturing our Resources and Relationships continued
We support our partners to grow their businesses Our pub partners are a key part of Marston’s business and the character of our pub estate. We recognise the contribution that a committed partner brings with the determination to make their pub a success.
This passion to run their own pub, how they want, is what their guests love. They are free to innovate and reflect their own character within the ambience and offer that they create. We understand the unique contribution these pubs bring, and the recent lockdown has highlighted more than ever how treasured they are across the nation.
Supporting our partners through COVID-19 Never has a year exemplified the contribution that the tied pub model can bring. With the closure of all pubs in lockdown, partners endured a period of disruption which they could never have imagined. Having Marston’s as a partner meant that solutions could be identified together, in order to give our partner businesses the best chance to survive the lockdown period. The way ahead still looks uncertain but facing it together should make it less daunting.
• During the first lockdown, our Area Managers worked tirelessly to get the right advice to our partners on closing their pubs, managing stock, furloughing staff and conserving cash.
• The range of Government support offered our partners’ businesses a lifeline. We supported our partners’ understanding of what was offered and how they could apply for aid so that cash flow could be eased as soon as possible. In the most desperate cases, Marston’s gave direct support to keep our partners in business.
• In a situation where no money is coming into a business, the obligation to pay rent each month can be insurmountable. We recognised the concerns of our partners immediately by deferring all rent payments in the first month of lockdown and signalling our openness to listen to our partners’ requests for extended periods of deferral.
• Once the Government confirmed the date for reopening, Marston’s was committed to ensuring all our partners who could reopen had old cellar stock uplifted and new supplies delivered in time. We were able to support our partners’ preparations for opening by sharing the adoption of best practice in accordance with Government guidelines.
• Responding to temporary, local lockdowns has become part of the trading conditions faced this year by the pub industry. We intend to give all the support we can to our partners through continued periods of disruption. Through the pub industry trade bodies, Marston’s will continue to put the case to Government that pubs operate in a more controlled, COVID‑19 safe manner than socialising at home.
• We have been very proud to communicate widely through our communications channels the local stories of how our partners have supported their local communities and the NHS by fundraising, food banks and assisting vulnerable people self‑isolating.
Our Partner Strategy 1. Choice/flexibility From the outset, when someone applies to run one of our pubs, the key to success is matching the right pub and the right person to the right agreement. We take time to understand our applicants – whether they are seasoned publicans with many years of experience, or have never run a pub before but have a burning ambition to do so. We offer the most diverse range of opportunities of any pub company, encompassing retail, tenanted and leased pubs. The type of agreement will reflect the experience, confidence and ambition of the applicant. If we think that an applicant is unsuitable then we are honest about that from the start, recognising that a higher probability of long‑term mutual success and business growth is essential.
2. Training All our partners attend induction training and, once they have started, receive ongoing training through our programme that provides continued support. Running a pub requires knowledge of licensing, regulatory, legal, safety and food hygiene rules, many of which are particular to this industry and are continually evolving. Our training includes everything a new starter needs to know about pub mechanics including cellar management, financial management, ordering, stock control, till systems and marketing. Most importantly, we focus on how they can welcome and engage with their guests and keep them coming back.
3. Business support Our partners are supported by Area Managers who maintain regular contact and are always there for quick advice or an urgent need. Our partners benefit from the range of experience which our Area Managers hold, offering suggestions and advice to keep their businesses on the right track.
4. Drinks agreement At Marston’s we understand the important part we play in providing a comprehensive range of quality drinks at the right price and being able to vary that offer to meet consumer demand, keeping it current and exciting. We never take our agreements for granted, constantly reviewing them, and believe that they represent the best quality and value for our partners.
5. Investment We have the utmost pride in our pub estate, recognising that the character of these buildings is a vital part of the appeal to our guests. Our estates management team is always available to support with maintenance to ensure that the buildings are kept safe and open for business. Our refurbishments programme ensures our pubs are inviting and interesting places for customers.

Marston’s PLC Annual Report and Accounts 2020Strategic Report
37
Case Study Communicating and staying in touch with our pub partners during the COVID-19 pandemic has been absolutely essential. We knew that our partners would need information, support and help, so we approached this in the same way we approached communication for our employees. We quickly developed a microsite for all things Coronavirus related, creating a portal that was quick and easy for them to access and navigate to get all the information, tools and support they needed. We bolstered this by sending regular emails, outlining specific information about their circumstances, as well as communicating regularly through closed social media groups, where our partners could ask questions, raise queries, share ideas, and also motivate each other during the difficult times.
Progress against key targets 1. Aligning to our strategic pillars, we will benchmark all partner
pubs using the GUEST acronym to assess the current experience.
2. We will work with our partners to focus on the guest journey; we are trialling an evolution of our turnover agreement for our more entrepreneurial sites to better reflect a partnership approach and attract the strongest pub partners.
We partner with suppliers who share our values The relationships with our suppliers are integral to our success. During the COVID-19 crisis the strength of these relationships was demonstrated by our mutual support during lockdown, followed by the commitment shown to us in restocking pubs when they could reopen.
Our guests expect diligence in the ethical sourcing of goods, products and services, all delivered to an excellent standard. We seek suppliers who reflect our own corporate values, which is demonstrated during the selection process and supported by accreditations. We audit our food suppliers, albeit this was paused during the period of lockdown. Our management of procurement is centralised in order to effectively govern tendering, contract reviews, authorisations and the secure transfer of data.
Our Supplier Strategy Our procurement strategy is built on relationships which create sustainable profitability for both ourselves and our suppliers. Our supplier selection process is designed to ensure that sufficient information is collected by both parties and the arrangement is mutually advantageous. Knowledge of our suppliers and the proactive relationship involving suppliers in our business and future plans is essential to the mutual trust which we strive for. We value long‑term relationships, as evidenced by the duration of many of our core suppliers of food and services to our pubs.
The past 12 months has validated this approach to our supply chain. Our suppliers have supported us during the ongoing uncertainty caused by Brexit, the sudden lockdown of our pubs, the short notice to reopen and the adjustment of our business to comply with COVID‑19 restrictions. At a time when their own businesses were also fundamentally impacted by the crisis, they have worked tirelessly to support Marston’s, for which we have tremendous gratitude.

Marston’s PLC Annual Report and Accounts 2020
38
Managing and Nurturing our Resources and Relationships continued We partner with suppliers who share our values continued
Supporting our suppliers during COVID-19 • Our pub menus were reduced and simplified on reopening in order to
continue to provide our guests with their favourite dishes at an unsurpassed quality. We have worked with our supply chain to identify the ingredients required for these menus and the quantities necessary to meet demand, in particular to gain mutual benefit during August’s Eat Out to Help Out scheme. The menu rationalisation has helped our suppliers manage their own costs and forward plan our stocking requirements.
• Our suppliers have worked with us to manage the uncertainties caused during successive periods of disruption. The lockdown of pubs suspended all deliveries to our pubs, resulting in ageing stock left at our suppliers. Upon reopening we worked with suppliers to maximise the use of in‑date stock and reduce the potential for waste and lost profit between our businesses.
Other areas of focus this year • During the preparations for Brexit, at the end of 2019 our suppliers built up
contingent supplies in case the UK left the EU without an exit agreement. These supplies safeguarded the continuing supply of our guests’ favourite meals and drinks, in the event of problems with importing. We continue to consult and plan with our suppliers to mitigate any impact that may result from a trade agreement not being reached by December 2020.
• Our Food Supplier Charter continues to be shared with our food suppliers, both current and potential, setting out our expectations on quality of product, traceability of ingredients, ethical approach, sustainable sourcing and associated employment rights. The Charter conveys our expectations for suppliers to reduce their own environmental impact by minimising unnecessary packaging and choosing recyclable materials wherever possible. The Charter also supports our endeavour to meet Public Health England’s dietary improvements by reducing calories, salt and sugar content on our menus. The next update of the Charter will include amendments that utilise the additional information which will be collected in our new food information system.
• Support for local businesses – Marston’s is proud to be a strong partner of local family businesses.
Impact of Brexit If the UK and EU don’t manage to conclude a trade agreement by the end of 2020 then the UK would start trading with the EU under WTO rules. This may mean that our suppliers sourcing goods in the EU, particularly food and drink, might have to pay a higher import tariff which may then impact the price that Marston’s pays in the future. Marston’s can mitigate much of this increased cost by working with its suppliers to seek alternative goods from either within the UK or outside the EU, but will work with existing suppliers to find solutions where possible. The UK Government have introduced measures to ease the flow of goods from the ports during the first half of 2021, however the supply of goods could still experience disruption. A break in the continuity of supply has been partly mitigated by holding some stocks of goods, however this is more difficult when the food is perishable, such as fresh food, and could mean that Marston’s would have to source alternative products, possibly at a higher cost.
Ethical sourcing Our preference is to select suppliers who like ourselves seek to reduce their environmental impact, thereby reducing our supply chain carbon footprint. An example is our partnership with Yorkshire Greens for our premium peas, which has the lowest carbon footprint for frozen peas in the industry; they are grown within ten miles of the factory by a partnership of over 40 family farms. Their state‑of‑the‑art GWE Biogas plant generates electricity from the production waste for processing, packing and cold storage operation.
Case Study A. F. Blakemore manages the distribution of our food products to our pubs. When the COVID-19 crisis started their food supply business was materially impacted. We have worked with Blakemore to find a mutual resolution to the problems encountered during lockdown, recognising the significant impact the pandemic has had on both our businesses and the need for both companies to save costs. Once trade could resume, our joint innovation has ensured that guests have been able to return to and enjoy what they like most about eating at one of our pubs.
We support our supply chain moving to greener energy. Our supplier Accolade Wines has recently become carbon neutral for all its core branded wines and aims to become 100% carbon neutral by the end of 2020. This has been achieved through the installation of a 2.5 MW wind turbine at its distribution centre, the deployment of solar panels at their vineyards in Australia and for the rest of the carbon that cannot yet be reduced, partnering with an organisation working on quality projects to reduce carbon emissions and improve lives.
Modern slavery This year we have invested in SEDEX which is a platform used to share information on ethical trading, including employment conditions. We reach out to existing suppliers on SEDEX to share this information and will encourage other suppliers to also join. Included in the data shared by suppliers is how they are responding to the risk of modern slavery, allowing us to follow up any issues raised. Our full Modern Slavery Statement is available at www.marstons.co.uk/responsibility.
Progress against key targets 1. Development of a food information system We have recently appointed NTAssure to develop an integrated smart food information system to record information on our suppliers and the food and drink products. For allergens, the new system will include built‑in algorithms to ensure the information provided is accurate. Work on supplier and ingredient work streams are almost complete, and development will continue throughout 2021.
2. Allergen training We have reviewed all of our policies and procedures relating to allergens alongside Anaphylaxis Campaign and Food Allergy Aware. This has allowed us to develop a new guest journey specific to our guests with special dietary needs. The new guest journey was supported by the launch of a bespoke e‑learning course that covers the improvements to the guest journey whilst still providing information on the 14 mandatory allergens.

Marston’s PLC Annual Report and Accounts 2020Strategic Report
�
�
�
�
39
Reducing our environmental impact We seek to innovate through our environmental projects in order to accelerate the reduction of our environmental impact. Our estates team has gained industry recognition for their pioneering work to reduce emissions at our pubs, reduce water consumption and increase recycling. Progress on the Group’s environmental agenda is reported to the PLC Exec and is a key pillar within our Corporate Responsibility Strategy. We remain responsive to emerging technology to prevent further environmental harm, often at attractive rates of return, and to partnerships which promote and support a better environment and better lives.
In December 2020 we were named ‘Operator of the Year for Energy Efficiency & Sustainability’ at the FEJ Kitchen & Equipment Awards for the sustainable practices in our pub kitchens. We work with like-minded suppliers to make sure our equipment is good value, efficient to run and easy to repair, ensuring the highest standards across all of our kitchens.
Mitigating the environmental impacts of COVID-19 • The lockdown of our pubs presented us with the challenge of disposing of
a high volume of beer safely. Beer is many times more potent than what normally goes through drains, hence we had to agree with all our water authorities a safe method for pouring it away and, where necessary, back haul volume to the brewery for disposal.
Other areas of focus this year • In 2018 we announced a partnership with rapid electric vehicle (EV)
charge point operator, Osprey (formerly Engenie), to become the UK’s first pub company to roll out 50kW rapid chargers across our sites nationwide. The chargers are powered by 100% renewable energy and can provide an EV with around 80 – 100 miles of range in 30 minutes. The charging dwell time fits with our operating model, enabling drivers to ‘top up’ while using the pub’s facilities. Significant progress has been made over the past year which saw us reach the 100‑site milestone, making us one of the largest private rapid charging networks in the UK.
• Our water self‑supply licence, ‘Marston’s Water’, allows us to drive down water usage. Becoming our own water retailer has allowed us to take control of billing and water data and, with increased water meter readings we can ensure all sites are billed in line with consumption. We were the second company in the UK to operate a water self‑supply licence in England, supplying retail services into our pub estate, breweries and offices.
• We have invested in energy efficiency technologies in 2020, including external lighting sensor timers, central heating additives and installation energy efficiency measures when our properties are refurbished. We continue to innovate by trialling new energy efficiency technologies and take energy and lifecycle impacts into consideration for all procurement.
• Marston’s won ‘Waste and Resource Management Project of the Year’ at the 2020 edie Sustainability Leaders Awards in collaboration with UKWSL. The award recognised Marston’s partnership work since 2016 on waste reduction and management over the entirety of Marston’s estate. Marston’s was the first large pub company to achieve zero waste to landfill in 2018, and went on to exceed its other targets. The operating percentages achieved during normal trading are at the following levels, albeit these were disrupted during lockdown:
Recycle food waste at 82% of its food‑led pubs
Segregate dry mixed recycling across 97% of the estate
Recycle glass bottles at 98% of all pubs
Maintain zero waste to landfill
This cultural change has ensured total recycling rates have increased from 60% to 73%.
• 1,000 pub benches have been replaced with recycled plastic ones, saving 210 tonnes of plastic from going to landfill. They are, in turn, 100% recyclable.
• We have commenced a programme of placing clothes banks in pub car parks, diverting old clothes from landfill. We aim to have rolled this initiative out to 60 sites by the start of 2021.

Marston’s PLC Annual Report and Accounts 2020
40
Managing and Nurturing our Resources and Relationships continued Reducing our environmental impact continued
Our progress to reduce emissions Greenhouse gas emissions
2020 2019
Source CO2 tonnes CO2 tonnes
Electricity & gas 79,491 96,190 Petrol & diesel 12,031 13,760 Refrigerants – breweries 1 1 Refrigerants – pubs 5,161 4,813 LPG 2,118 2,719 Oil 160 187 Total 98,962 117,670
Greenhouse gas emissions intensity ratio 2020 2019
CO2e tonnes per £100k (turnover) 12.05 10.05
Energy usage 2020 2019
mwhrs mwhrs
Total 447,991 523,944
Notes:
1. We report on all the measured emissions sources required under the Companies Act 2006 (Strategic Report and Directors’ Reports) Regulations 2013.
2. Data collected is in respect of the year ended 30 June 2020, in accordance with the Simplified Energy and Carbon Reporting regulation.
Total gas consumption compared to last year reduced by 22% which reflected the temporary shutdown of our pubs during lockdown while our breweries continued to produce. Electricity consumption decreased by 3%, considerably less than gas. Electricity usage for lighting fell during the lockdown, however refrigeration within our kitchens to a large extent remained on because of food stocks. Fuel usage fell by 13% due to our lorries being taken off the road when the pubs were shut. Our lorries servicing supermarkets remained on the road during the lockdown.
In order to reduce the energy consumed, we have focused each year on various initiatives. Our catering equipment is sourced to increase efficiencies including fryers that filter oil to increase oil life, and high-efficiency chargrills. All of Marston’s cabinet refrigerators purchased are high-efficiency hydrocarbon units. We have installed LED lighting in all the internal areas, and used in our back of house areas integrated movement sensors, reducing the operational hours of lighting. We have also fitted voltage optimisation in all of our new-builds and retro-fitted them into over 100 other sites across the estate.
Case Study Key initiatives were implemented to mitigate and minimise the impacts of COVID-19 on the environment. During lockdown, gas, electric and water consumption data was monitored closely to ensure inefficiencies were identified and followed through to resolution. Building management systems were remotely adjusted to stop equipment running and minimising energy consumption.
Operating Marston’s Water allowed us to quickly reduce water consumption and costs in line with site closures. Meter reads were taken following site reopening to establish new trading baselines and identify further instances of high water consumption. Marston’s Water also assisted to negotiate terms of beer disposal directly with water wholesalers. Methodologies were implemented to minimise the environmental impacts of disposal.
All waste services were suspended during lockdown, eliminating emissions produced from collections. Following reopening, general waste, dry mixed recycling and glass collections were reduced across most premises. Trade levels are reviewed to ensure collections are kept to a minimum, reducing vehicle movements.
If further COVID-19 restrictions are put in place, we have robust processes to minimise environmental impacts of the business across energy, waste and water, which can be implemented quickly.
Progress against key targets 1. Increased recycling and reduce waste Marston’s has maintained its ‘Zero Waste to Landfill’ status, however we recognise the importance of reducing packaging and other forms of waste coming into our pubs in the first place. We intend to engage with WRAP to increase our commitment to work with our suppliers to reduce waste.
We expect to continue with the training and awareness campaigns for our team members to encourage them to segregate waste to maximise recycling, recognising that our performance can always be improved.
2. Aim to manage CO2 emissions in relation to activity We will continue to seek reductions in emissions through the installation of LED lighting into back-of-house areas, timer controls, voltage optimisation and the use of ambient air to cool our cellars rather than air conditioning.

Marston’s PLC Annual Report and Accounts 2020Strategic Report
41
Engaging with our investors We want to attract long-term equity and debt investors who believe in and support our strategy.
This enables us to remain focused on delivering sustainable growth and maximising return on capital invested, for the benefit of all our stakeholders.
We engage with our investors throughout the year usually through roadshows, direct meetings, the AGM and the communication of our half‑year and full‑year results and quarterly updates. Some of this has had to be curtailed this year due to COVID‑19 and social distancing measures and we have made greater use of video technology. Our Annual Report and Accounts and website continue to hold detailed information on our business, governance and corporate responsibility.
Further details of how we have engaged with shareholders and the key topics discussed are set out in the Corporate Governance Report on page 48. Here, we have summarised how we engaged with our debt providers.
Key topics raised • The impact of COVID‑19 on covenants
• The joint venture with Carlsberg
• Cash preservation measures and additional liquidity
Our response Our CFO and Director of Treasury and Tax worked hard to ensure that our bank syndicate and bondholders had sufficient understanding of the impact of COVID‑19, the measures we took and the long‑term viability of our business. This enabled them to make informed decisions to support the Group by providing additional bank facilities and agreeing to appropriate covenant amendments and waivers where necessary.
Regular calls and meetings with the Director of Treasury and Tax throughout the year, providing updates on trade to help our investors understand the strategic direction of the business, have strengthened our long‑term relationships with high levels of trust and a consistency and familiarity with how each party does business. This regular engagement and collaborative approach helped secure the necessary covenant waivers during both lockdown periods, the consents required in relation to the joint venture and additional financial headroom through the first lockdown period when there was uncertainty over the reopening date.
Engaging with government Government policy decisions impact the Group and, directly and indirectly, all of our stakeholders.
As a responsible business, we engage with Public Health England (PHE) on health initiatives and support government initiatives such as Drinkaware. As a member of the BBPA and UK Hospitality, we participate in government consultations and have actively engaged with them throughout the pandemic to help them understand the impact of the restrictions imposed on the hospitality sector, the safety in a regulated setting and the lack of clear evidence tying pubs to the increases in infection levels.
The Government support in the form of the Job Retention Scheme, deferred VAT and duty payments and business rates holiday was essential and helped in being able to retain the majority of our workforce whose work had been suspended as a result of the Government’s restrictions on our ability to trade. Last year we raised £528.8 million in taxes for the Government; this year we have raised £384.6 million, and look forward to the future when we can contribute at more ‘normal’ levels to the Government’s finances.
Key topics raised • The importance of regular and timely communications from the
Government on restrictions and changes thereto
• The employment benefit pubs offer to young people and in areas of high unemployment
Our response In addition to our engagement with the Government concerning the impact of the pandemic and various restrictions on trade, our team is dedicated to food and drink safety and compliance. It monitors and, where relevant, engages with PHE on consultations relating to food and drink.
Our Risk & Compliance Committee monitors emerging legislation and regulation to assess its relevance, impact and what preparations are needed to ensure compliance.
Our training procedures and policies are developed to ensure compliance and we provide and promote a confidential ‘Speak Up’ service to encourage an open and honest culture.

Marston’s PLC Annual Report and Accounts 2020
-
42
Non-Financial Information Statement
The information set out below, together with signposts to other relevant sections of the Annual Report, is intended to help assist users in understanding the Group’s position and approach to the following key non-financial matters: environment, employees, social matters, human rights and anti-corruption, and anti-bribery. Our values and culture underpin our Business Model and define our Ways of Working and the behaviours we expect of our people. The Marston’s Way directs and guides our people with the help and support they may need in their working life and links to relevant policies, statements and operational guidance.
The Group’s principal risks relating to the four key non‑financial matters are pandemic, health and safety, food safety and political and economic risk. The following govern our approach to these non‑financial matters and are designed to help our people recognise and manage those risks. Ultimately risk management is about control and the way we manage and mitigate those risks is set out in detail in the Risk Management section on page 21.
Additional Information • We aim to provide a safe working environment for all our people and
a business that is run in an ethical and responsible manner. Our ‘Speak Up’ policy and activities are overseen by the Board and undergo annual review and campaigns to raise awareness amongst our people.
• The health and safety of our people and our guests is of paramount importance to us and during this year, our health and safety policies and practices were continuously reviewed, updated and briefed to our teams to reflect the latest guidelines and impact of COVID‑19 restrictions.
• The development of our online training platform Talent Academy enabled us to provide timely online training on the new COVID‑19 safe measures to all our pub teams prior to pubs reopening.
• We are investing in an enhanced food information system to ensure that our guests are provided with accurate nutritional information to help inform their food choices and support their lifestyle choices.
• Our Business Model and our non‑financial key performance indicators are set out on pages 6–7 and 16–17.
Marston’s Code of Conduct, The Marston’s Way, is shared with all our employees on our website and includes links to relevant policies, many of which can be viewed publicly, including the following:
Anti‑bribery and Anti‑corruption policy
Data Protection policy
Equality, Diversity and Inclusion policy
Environmental policy
Food Safety policy
Fraud policy
Group Purchasing policy
Health and Safety policy
‘Speak Up’ policy
See: www.marstons.co.uk
Within the Responsibility section of the website there is more information on the following:
• Environmental report
• Environmental commitments
• Food Supplier Charter
• Modern Slavery Statement
See: www.marstons.co.uk/responsibility
Information for our people is available from the following sources:
• People Strategy Summarised on pages 31–32.
• Food information system Food ingredient information collected from our suppliers used to formulate our dishes, identify allergens and communicate food constituents to our guests.
• The Pubs Code The Pubs Code regulates the relationship between pub companies owning 500 or more tied pubs in England and Wales and their tenants. Information is available from the Pub Code Adjudicator at www.gov.uk/government/organisations/pubs-code-adjudicator
• Corporate hospitality Rules to be followed by all staff governing the acceptance of gifts or hospitality, the approval process and reporting.
• Competition law Outlines Marston’s overarching commitment and practices to comply with the relevant legislation on competition law matters.

Marston’s PLC Annual Report and Accounts 2020Strategic Report
43
Section 172 (1) Statement
The interests of our stakeholders and their values and expectations shape our performance and success, influencing the way we make decisions. Long‑term value creation is about more than financial results alone – we recognise that a sustainable, successful business depends on strong relationships with our key stakeholders who help create and share in the value generated. Our Ways of Working and The Marston’s Way articulate our values and underpin the actions that we take.
The Directors consider that, during the year, they have acted in a way that promotes the success of the Company for the benefit of its members as a whole, having regard to the various factors set out in section 172(1), listed below.
The Board have continued to engage with shareholders throughout the period in a variety of ways to understand their views and interests. Details are set out on page 48 of the Corporate Governance Report. The Board take every opportunity to engage directly with our employees when visiting our pubs in a personal capacity or, more formal visits as a Board, with informal presentations and dinners with senior managers from across the business. This year, we held our first Workforce Engagement session, hosted by two Board members: Octavia Morley and Carolyn Bradley and attended by a mixed group of employees from our pubs, breweries and central support teams. Additionally, the Board receives feedback from employee surveys and regular briefings from the CEO and HR Director. Further details of employee engagement are set out on page 48 of the Corporate Governance Report.
Engagement with suppliers, customers and other stakeholders takes place at an operational level through the senior management of the business responsible for the particular area and relationship. The Board receive regular updates on stakeholder views from the Executive Directors, members of the PLC Exec and other senior managers along with external input from advisers.
The interests of all relevant stakeholders are taken into account by the Board when considering significant strategic decisions. During this year, COVID‑19 and the sale of the beer business into a joint venture with Carlsberg, have comprised the two most significant strategic events for the Company. More details of how the Board had regard to stakeholder interests in considering the impact of COVID‑19 and the joint venture proposal are set out below. Throughout this report we have set out, in a series of case studies, how we have engaged with our people, our partners, our guests, our suppliers and our communities, demonstrating our regard for their interests as we were obliged to close the pub business without warning for 15 weeks during the COVID‑19 lockdown. We have also described how we have had regard to our impact on the environment, specifically in relation to the destruction of beer left in cellars during lockdown (see page 39).
COVID-19 Throughout these uncertain times, the Board have focused their attention on ensuring the safety of our people, on the business remaining financially viable and, on reopening, the safety and enjoyment of our guests. The Board have provided oversight and counsel to the CEO and CFO as they led the PLC Exec in managing a safe and orderly closure of pubs and the consequential impacts, whilst considering the sometimes conflicting interests of continuing the operation of our breweries to supply supermarkets and other off‑trade retailers. In addition to regular updates from the CEO and CFO, the Board have heard directly from the HR Director on several occasions and the Operations Directors on how the Group looked after its people, supported its partners and engaged with guests and key suppliers during lockdown. The Board took a highly prudent approach to managing the business and, in recognition of the major challenges facing many of our stakeholders, all Board members volunteered significant pay cuts during the national lockdown. The CFO led the engagement with our providers of finance and provided timely updates to the Board of the financial consequences of, and options for, extended periods of pub closure.
The Board’s decisions to strengthen the balance sheet (with additional financing facility) and to suspend the dividend for 2020 are considered to be in the best interests of promoting the success of the business over the long term for the benefit of members as whole. Further details are set out on page 41.
Continued and varying restrictions across the UK have required the Board to regularly assess the implications for the business and consider all interested parties, most notably the impact for our people and the inevitable risk of job losses. These decisions have not been taken lightly and the Board have considered the interests of all relevant stakeholders in making the decisions that they believe are for the benefit of its members as a whole.
Joint venture with Carlsberg UK Limited In May, the Board approved the joint venture proposal following several months of considerations covering a number of factors and conflicting interests when assessing the transaction as most likely to promote the success of the Company. Details of the deal are described in the Chairman and CEO Statements on pages 8–11 and within the circular sent to shareholders seeking their approval of the proposal (available at www.marstons.co.uk).
In reaching its decision to recommend the proposal to shareholders, the Board had an opportunity to discuss the various implications with relevant senior managers from within the business, and the Company’s advisers provided the Board with advice on the terms of the transaction. The Board considered:
• the long‑term consequences of the proposal and the benefits to members as a whole in separating the beer and pub businesses;
• the risks in becoming a pure pub‑focused operator;
• the financial benefits of reducing debt and its alignment to strategy;
• the impact on our people – both those transferring and those remaining – and the importance of clear and timely information;
• the benefits to both guests and partners of an enlarged beer business and stronger brand portfolio; and
• their duties as Directors to act with integrity and uphold high standards of conduct.
The information found here and on pages 30–41 form our s172 statement and demonstrates the Board’s and Company’s engagement with its key stakeholders, promoting the success of the Company for the benefit of its members as a whole, and in doing so have regard (amongst other matters) to:
(a) the likely consequences of any decision in the long term;
(b) the interests of the Company’s employees;
(c) the need to foster the Company’s business relationships with suppliers, customers and others;
(d) the impact of the Company’s operations on the community and the environment;
(e) the desirability of the Company maintaining a reputation for high standards of business conduct; and
(f) the need to act fairly between members of the Company.

Governance
Chairman’s Introduction 45 Board of Directors 46 Corporate Governance Report 48 Nomination Committee Report 52 Audit Committee Report 56 Directors’ Remuneration Report: 59
Annual Statement by Chairman 59 Remuneration Summary 2019/20 63 Annual Report on Remuneration 64
Directors’ Report 72 Statement of Directors’ Responsibilities 74
44 Marston s PLC Annual Report and Accounts 2020
’

Marston’s PLC Annual Report and Accounts 2020G
overnance
45
Chairman’s Introduction
Dear Shareholder,
I am pleased to present our Governance Report to you, together with the reports that follow from the Nomination, Audit and Remuneration Committees. Each provide an overview of the key activities during the period, including the impact of the ongoing COVID-19 pandemic.
This year has been particularly challenging and, despite the significant impact of the pandemic on the business, the Board continued to apply the same corporate values to all its considerations and decision making. We are pleased to note that the same approach was applied across the Marston’s business, reflecting the unique and special culture that is Marston’s.
Our code of conduct The Marston’s Way, recognises that our people care about the importance of running our business in an ethical and responsible manner, for the benefit of all our stakeholders, and that we are all proud to be a part of Marston’s. The Marston’s Way continues to form part of our governance framework which is designed to support the delivery of a long-term sustainable business.
The 2018 UK Corporate Governance Code (the ‘2018 Code’) has applied throughout the reporting period under review and, having received an internal briefing on the changes, the Board considers that, with the exception of the period when the membership of the Audit Committee and Nomination Committee did not comply with the relevant provisions, we have fully complied with the principles of the Code. Further explanation of this is set out on the following pages.
Board effectiveness and succession This year we carried out an external evaluation of the effectiveness of the Board and its Committees, facilitated by Equity Communications. Details of the process, the summary of our findings, plus progress on the actions from the 2019 evaluation, are set out on page 53.
As announced last year, Octavia Morley joined the Board on 1 January 2020 and Catherine Glickman stepped down from the Board on 24 January 2020. Octavia became Chairman of the Remuneration Committee on Catherine’s departure.
Succession planning is an important part of our governance process and we will continue to monitor the composition of our Board to ensure it reflects the requisite skills and experience needed to guide the Group to achieve its strategic aims as a focused pub operator.
Profiles of each Director can be found on pages 46 and 47.
Remuneration The focus for our Remuneration Committee this year has been the implementation of our new Directors’ Remuneration Policy, approved by shareholders at our AGM in 2020. We thank our shareholders for their support of the Policy. Our principles are unchanged: we aim to provide remuneration that motivates, with incentives aligned to strategy that encourage enhanced and sustainable performance, without encouraging excessive risk taking. The Committee reviewed developing market practice and emerging trends on aligning pension contributions for incumbent
UK Corporate Governance Code compliance statement The version of the Corporate Governance Code applicable to the 2019/20 reporting period is the July 2018 UK Corporate Governance Code. The Code is available on the Financial Reporting Council’s website: www.frc.org.uk
Marston’s PLC was compliant with the principles of the 2018 Code throughout the reporting period under review. However, due to the timings of Board changes and Committee appointments, the Company was non-compliant with Provision 17 of the 2018 Code from 24 January 2020 until 17 June 2020, and with Provision 24 of the 2018 Code from 31 July 2019 until 1 January 2020. Further details are set out within the Corporate Governance Report. In order to provide a more accessible report, and to avoid repetition, we have moved certain information that has not changed year-on-year, to our website www.marstons.co.uk. Where our response to principles and provisions of the 2018 Code appear in the Strategic Report, we have provided cross reference details. We welcome feedback on our approach.
Governance Report Our Governance Report explains how we have applied the main principles and, where applicable, provisions of the 2018 Code, through our governance framework, supporting procedures and the work of the Board, its Committees and management. We have used the key themes of the Code to structure this report:
1. Board Leadership and Company Purpose Read about how we engage with our people and our shareholders and what has been on the Board’s agenda this year on pages 48 to 49.
2. Division of Responsibilities Our governance framework and management structure are set out on pages 50 to 51.
3. Composition, Succession and Evaluation For details of our approach to training and induction, this year’s external Board evaluation and our approach to diversity see pages 51 to 54.
4. Audit, Risk and Internal Control Details of our internal processes and the report from our Audit Committee start on page 54.
5. Remuneration For our report on how we have applied our current Directors’ Remuneration Policy and payments made to Directors during the period, see pages 59 to 71.
Directors with the wider workforce and agreed a plan to achieve this. During the period, the Committee has also considered remuneration and reward across the organisation, particularly in the context of the impact of COVID-19. Details of how the Policy has been applied during the period, are set out in the Remuneration Committee Report on pages 59 to 71.
Audit The principal responsibility of the Audit Committee continues to be the integrity of our financial reporting and internal controls. The report from the Audit Committee is on pages 56 to 58.
The following pages provide an overview of our key governance activities, how we comply with the 2018 Code and reports from each of the Nomination, Audit and Remuneration Committees.
William Rucker Chairman

’46 Marston s PLC Annual Report and Accounts 2020
Board of Directors
Chairman
Executive Directors
William Rucker N*
Chairman William is a Chartered Accountant with experience in banking and financial services. He is Chairman of Lazard in the UK and brings a wealth of knowledge and experience of financial markets, corporate finance and strategy to his leadership of the Board. William is also currently Chairman of the UK Dementia Research Institute and Chairman of Bizspace Holdings Limited. William’s City and financial experience, together with his strong stakeholder management skills, ability to help businesses grow and his previous Chairman roles make him ideally placed to be Chairman of Marston’s.
Senior Independent Director
Carolyn Bradley A N R
Senior Independent Director (SID) Carolyn is a Non-executive Director of B&M European Value Retail S.A., SSP Group plc, The Mentoring Foundation and Majid Al Futtain Retail LLC. Carolyn has a strong consumer focused background having spent over 25 years at Tesco. She is a Trustee of Cancer Research UK and a Member of the Advisory Board of Cambridge Judge Business School. Carolyn brings significant board and committee advisory experience and, through her extensive experience in marketing in the retail industry, brings a strong consumer focus to the Board.
Independent Yes , on appointment
Appointed to the Board October 2018
Past experience Chairman of Crest Nicholson Holdings plc
Chairman of Quintain Estates and Developments
Non-executive Director of Rentokil Initial plc
Independent No
Appointed to the Board March 2009
Past experience Roles held at Guinness Brewing Worldwide, Bass Brewers Limited and Dolland & Aitchison
Independent Yes
Appointed to the Board October 2014
Past experience Non-executive Director at Legal & General plc
UK Marketing Director at Tesco
Trustee of the Drink Aware Trust
Independent No
Appointed to the Board May 1996
Past experience Financial Controller at Geest plc
Treasury Manager at Bass plc
Ralph Findlay Chief Executive Officer (CEO) Ralph was appointed to the Board as Finance Director in 1996, becoming Chief Executive in 2001. Ralph is currently the Senior Independent Director at Vistry Group PLC and a Director of the British Beer and Pub Association (BBPA).
In his role as Chief Executive, Ralph brings extensive commercial, financial and general management experience in a consumer facing industry, together with a strong track record of business growth.
N
Andrew Andrea Chief Financial and Corporate Development Officer (CFO) Andrew joined the Company in 2002 as Divisional Finance Director for Marston’s Beer Company and in 2006 he became Operations Director for Marston’s Pub Company. Andrew was appointed to the Board as Finance Director in March 2009. His role was expanded to Chief Financial and Corporate Development Officer in 2016. He is currently a Non-executive Director at Portmeirion Group PLC. Andrew is a qualified Chartered Accountant and brings to the Board a wealth of experience gained in financial and commercial roles, including strategy and leadership, risk management and mergers and acquisitions.
Key: Board Committees
A
N
Audit Committee
*
R Remuneration Committee
Nomination Committee Denotes Committee Chairman

Independent Yes
Appointed to the Board January 2020
Past experience Executive and Non-executive Chair of Spicers-Office Team Group Ltd
Non-executive Director of John Menzies PLC
Chief Executive Officer, then Chair, at LighterLife UK Limited
Managing Director at Crew Clothing Co Ltd
Chief Executive at OKA Direct Limited
Octavia Morley Non-executive Director Octavia is currently Senior Independent Director at Card Factory PLC and at Crest Nicholson Holdings PLC and Non-executive Director at Ascensos Ltd. She has extensive experience in both executive and non-executive roles in retail and multisite companies having held various senior operational and strategic roles across all areas of retail at companies including Asda Stores Limited, Laura Ashley Holdings PLC and Woolworths plc.
Balance between Executive and Non-executive Directors
Non-executive
Chairman
Executive
Male
Male/female representation on the Board
Female
Tenure of Chairman and Non-executive Directors
6+ years
3–6 years
0–3 years
A* R N
R N A
N R* A
Governance
’
-
47 Marston s PLC Annual Report and Accounts 2020
Non-executive Directors
Matthew Roberts Non-executive Director Matthew is a qualified Chartered Accountant (FCA) and was Chief Executive of Intu Properties plc until June 2020, having previously served as Chief Financial Officer from 2010 to April 2019. Matthew has significant real estate and retail experience and a strong track record on the use of and recycling of capital. Matthew also has recent and relevant financial experience, enabling him to contribute effectively to the Group as the chair of the Audit Committee.
Independent Yes
Appointed to the Board September 2019
Past experience Director of Stores, Online and Omnichannel at O2
Bridget Lea Non-executive Director Bridget is currently Managing Director (North) at J Sainsbury PLC and has had a distinguished career working across multiple leading retail brands. She has recently been appointed as Managing Director – Commercial at BT Group and is due to start her new role on 28 December 2020. She has held senior positions – spanning a wide range of disciplines including sales, operations, marketing, supply chain and digital – within retail corporates such as Body Shop International Ltd and Clarks Shoes Ltd. Bridget has been a member of the Board of Governors at Manchester University since 2018.
Group Secretary
Independent Yes
Appointed to the Board March 2017
Past experience
Chief Financial Officer of Gala Coral Group Limited
Finance Director of Debenhams plc
Appointed as Secretary October 2004
Anne-Marie Brennan Group Secretary Anne-Marie joined the Company in 1998 as Group Tax Manager. A qualified Chartered Accountant and Chartered Secretary, she was appointed Secretary in 2004.

Marston’s PLC Annual Report and Accounts 2020
48
Corporate Governance Report
1. Board Leadership and Company Purpose
Purpose, values and culture The Board provides guidance and constructive debate in establishing the strategic direction of the Group and overseeing management’s implementation of that strategy. The Board recognises the unique and special culture at Marston’s and is satisfied that it reflects and, in turn, is reflected by our purpose, our values and our ways of working; all of which are aligned to our strategy. The Board monitors the culture and values of the business in a variety of ways:
• Meeting and talking with employees from our pubs, brewery sites and central support services
• Reviewing the results of employee surveys, specifically checking the responses to behaviour-led questions
• Ensuring our policies and practices, particularly relating to pay and fair working practices, are consistent with our values
• Reviewing whistleblowing mechanisms and reports to ensure they are appropriate, accessible and meet our expected standards of conduct
The Board supports and encourages good relationships with all our stakeholders, recognising the importance of the contribution to and impact on the communities in which we operate and the partners with which we work. In seeking to understand the views of all our stakeholders, the Board engages directly with some, including investors and employees, and indirectly with others by way of sector bodies, reports and presentations by senior management and advisers. The CEO and CFO provide regular feedback and ensure the Board is kept up to date on stakeholder views.
In considering all opportunities and risks that the Group faces, the Board focuses its attention on the long-term sustainable success of the business which ultimately generates value for our shareholders. All proposals and business decisions are made for the benefit of the Group’s long-term sustainability, ensuring they are aligned to our strategy, purpose and values. The interests of relevant stakeholders are considered as part of that process and the Board recognises that sometimes there is a trade-off between different stakeholders, but at all times the Board considers it has acted fairly and transparently in evaluating a decision.
Engagement with employees We recognise the importance of engaging with our employees and our People strategy aims to inform, inspire, engage and enable our people, using a variety of media through our core channels which include print, digital, social and email. This year, the Board reviewed the proposed arrangements for employees during the lockdown period and kept close to employee communications to ensure the treatment was fair and reflected our culture and that employees were kept informed as far as possible.
We paused our annual employee engagement this year, focusing on more targeted ‘pulse’ surveys to monitor employee feedback, during the initial period of lockdown. The findings of these surveys were then discussed at Board meetings during the year. More details of the results can be found on page 17.
We have appointed Octavia Morley, Chairman of our Remuneration Committee, as our designated Non-executive Director for engagement with our workforce. Supported by Carolyn Bradley, our SID, the first Workforce Engagement session was held on 23 January 2020. The session was attended by a mixed group of employees from our pubs, breweries and head office support teams. A number of issues were discussed, and we received positive feedback from the attendees who felt that they had the opportunity to speak openly and honestly. A number of clear actions arose from the output of the session and these were discussed at the following Board meeting.
Following the first session, the intention was to facilitate further sessions, on a quarterly basis, and align these with our Board meetings, which are normally held at various pub and brewery locations across our estate, enabling more employees to have the opportunity to take part. Unfortunately, as a result of COVID-19 restrictions, no further sessions were held during the period. We will resume our approach in 2021, when it is safe and appropriate to do so.
Engagement with shareholders Engagement with our shareholders is essential to ensure that Marston’s attracts and retains long-term investors who support our strategy. Meetings and communications focus on providing updates on progress against strategy, clarifying understanding of the business and an opportunity to listen to feedback. The CEO and CFO host meetings with our major shareholders and private client fund managers to present the half-year and year-end results. Following these meetings, the Board receives formal feedback from analysts and institutional shareholders provided by the Group’s brokers and financial PR advisers. The views and any concerns are considered by the Board and, in particular, whether any action or response is appropriate. The Chairman and SID make themselves available for meetings with the Group’s major institutional investors each year. Regular announcements on business and financial performance are issued to the stock market and made available on the Group’s website, which this year have increased in frequency to provide updates on the consequences of the enforced closure of pubs and the joint venture deal with Carlsberg.
The investor relations programme is managed by the Executive Directors in conjunction with our advisers and focuses on engagement with institutional shareholders, fund managers, analysts and private client fund managers. Since March, all meetings have been either by telephone or video call. These calls have covered the interim results, the joint venture with Carlsberg and COVID-19. During this year, investor focus has been on liquidity and financial viability and the CEO and CFO have worked hard to reassure investors by setting out the impact of restrictions and closure, the financing position and Government regulations.
On behalf of the Board, the Group Secretary oversees communication with private individual shareholders. The key source of communication is through the corporate section of the Marston’s website which provides a wealth of general information on the business, as well as details of our responsible approach to business. The shareholder section provides share price information, financial calendars, results presentations and regulatory announcements. The Annual Report and Accounts is the main tool for providing a comprehensive review of the business, details of our governance framework in action and annual results.
Under normal circumstances, all shareholders have the opportunity to meet and communicate directly with the Board of Directors at the Company’s Annual General Meeting (AGM). Regrettably, due to COVID-19 restrictions in place at the time of writing this report, we are planning for our 2021 AGM to be a closed meeting, at which only the minimum number of shareholders required to form a quorum will be in attendance. Shareholders are encouraged to submit their questions in advance of the AGM. We will ensure that each question receives a direct response, with those questions pertinent to the business of the meeting being published on our website after the close of the meeting. Our CEO will record his normal presentation, and this will be available on our website. Details of how you can submit questions and cast your votes at the AGM are set out in the Notice of Meeting, which will be made available to shareholders by their chosen method of communication and is also available on our website. The Board looks forward to meeting shareholders again when circumstances allow.
To enable all shareholders to vote on all resolutions in proportion to their shareholding, the voting at the 2021 AGM will be conducted by way of a poll and shareholders are encouraged to vote as early as possible ahead of the meeting. The Company releases the results of voting including proxy votes on each resolution, on its website on the next business day and announces them through a regulatory news service. Details of the 2021 AGM are set out in the separate Notice of Meeting.

Marston’s PLC Annual Report and Accounts 2020G
overnance
49
Shareholder engagement summary Key communication channels Institutional shareholders and analysts Private client fund managers Private shareholders
Rolling investor Regular meetings with AGM relations programme CEO and CFO Bi-annual written Annual Report and feedback received Accounts Chairman and SID Website available to meet with largest shareholders
Board agenda and activities during the year The Board agenda provides the framework for the Board to shape and monitor the Group’s progress towards its strategic objectives, its values and ways of working. The agenda comprises a number of regular reports updating the Board on financial and operational performance, people matters, consumer insight and shareholder analysis. The rest of the agenda is taken up with specific items for discussion or debate, in accordance with the forward agenda or as required in response to circumstances or events. Further detail is set out in the table below. The Board met with sufficient regularity to effectively challenge and monitor the Group’s progress against its strategic objectives and in response to the impact of the pandemic and to consider the joint venture with Carlsberg UK. Meetings up until 23 March focused on the delivery of our strategic and financial plans as previously set out, having regard to the continuing uncertainty from a political and macro-economic perspective and the proposed joint venture with Carlsberg UK. Thereafter, the Board continued to meet to consider the detailed points of the proposed joint venture, along with the impact of the lockdown on our pubs, our people, our guests and the financial consequences.
Due to the pandemic most Board meetings have occurred online and, as a consequence, the programme of pre-Board presentations which take place the evening before the Board meeting, at which senior management present on various matters in greater depth and then join the Board for an informal dinner, was paused from March 2020. The intention is to resume this in 2021, subject to COVID-19 guidelines.
Analysis of shareholder register by investor type
Private client fund managers 35.55%
Private investors 17.61%
Institutional investors 46.84%
2020 strategy day – on the agenda The Board held its annual strategy day at Marston’s Talent Academy in Wolverhampton slightly later than usual as a result of the impact of the pandemic and the joint venture. They were joined by the PLC Executive Committee (PLC Exec) to consider the future strategy as a focused pub operator. The key themes of the day covered:
• Market overview and sector analysis, as presented by the Company’s brokers.
• Defining our pub DNA and communicating it to employees and other stakeholders.
• Improving operational standards through simplification and focused training.
• A greater focus on the guest journey and enabling teams to deliver a great guest experience.
• Instilling greater discipline and accountability in the new operating structures.
• Financial considerations: budgeting and cost review.
Presentations were received from the pub Operations Directors, the Group Commercial Director and the Group HR Director which informed open discussions and debate with the Board.
On the Board agenda
Strategy and performance
Guest and customer focus Shareholder Governance Leadership and and business operations focus and risk people development
COVID-19 impact and Health and safety and COVID-19 Share price performance Risk and risk management People Strategy re-opening of pubs safeguards and investor relations
Bank facility financing and Operating plans and targets for Shareholder feedback and Evaluation of Board and Employee engagement securitisation waivers 2021, updated for COVID-19 market perceptions Committee effectiveness forum and surveys
Joint venture between MBC Guest journey and simplification Year-end engagement and Governance Code, Pubs Gender pay gap reporting and Carlsberg UK of offer AGM Code and other reporting
obligations
Property disposal plans Regular Brexit updates Share register analysis Environmental and Executive succession Corporate Responsibility planning updates
Results, trading updates and Appointment of new joint Delegated authorities and Annual Report and Accounts corporate broker potential conflicts of interest

Marston’s PLC Annual Report and Accounts 2020
50
Corporate Governance Report continued
2. Division of Responsibilities
There is a clear division of responsibility between the roles of the Chairman and the Chief Executive Officer (shown below). These are agreed by the Board. Further details of the roles and responsibilities of each Board member and the Group Secretary are set out on our website www.marstons.co.uk.
Chairman Chief Executive Officer (CEO) is responsible for: is responsible for:
• leading the Board and its effectiveness in directing the Group. • setting and implementing the strategic objectives agreed by the Board. • setting an agenda, style and tone for constructive and open debate.
• providing clear and visible leadership, demonstrating the values and • the effective contribution of all Non-executive Directors. ways of working that reflect the Group’s culture. • supporting the CEO in articulating the purpose, values and culture.
• leading the PLC Executive Committee and senior management in managing the business.
• ensuring the Board is aware of shareholder and other stakeholder views.
Governance framework
The Board
Principal Committees Audit, Nomination, Remuneration
Supporting Committees Risk & Compliance, Business Continuity,
Data Security, Corporate Responsibility,
Treasury
Matters Reserved for the Board Roles and Responsibilities Committee terms of reference
Assurance ImplementationInternal controls,
of Strategy auditing, The Marston’s Way Monitoringlegal and
performanceregulatory compliance
Management Committees PLC Exec,
Marston’s Beer Company Divisional Board,
Disclosure Committee
Enterprise-wide risk management Our Ways of Working
The governance framework provides a structure of effective management and controls to measure and assess performance and risk and it facilitates the sharing of information by encouraging strategic debate and informed and timely decision-making. Board papers are circulated well in advance of each meeting to ensure that the Directors have sufficient time to consider them before the meeting.
The three principal Committees of the Board deal with financial and risk matters, remuneration and succession planning. Each has its own terms of reference which are reviewed at least annually, and updated as necessary, by the Committee before they are considered and approved by the Board. Reports from each Committee can be found on pages 52, 56 and 59.
The Board is supported by the PLC Executive Committee (PLC Exec) which comprises key members of the Marston’s management team: the CEO, CFO, Managing Director (MD) of Marston’s Beer Company (MBC) (until 30 October 2020), two Operations Directors for Marston’s Pubs, Group Commercial Director, Group HR Director and Group Secretary. The PLC Exec meets regularly to oversee the implementation of strategy and monitor performance of the business. This year, in addition to reviewing operational performance, controls and people matters, the PLC Exec considered and responded to COVID-19 guidance, the furlough scheme, the closure of pubs and their reopening following the first national lockdown. The PLC Exec also considers property proposals, capital investment and new initiatives; approves internal policies, governance and financial matters within the authority limits delegated annually by the Board.

Marston’s PLC Annual Report and Accounts 2020G
overnance
51
MBC operates a separate management board comprising the MD, Director of Finance and Customer Services, Director of Brewing, Director of Logistics, Director of Sales (Free Trade), Director of Sales (National), Director of Marketing, Group HR Director and Group Director of IT. The MBC Board met on a regular basis to review the operational performance of each channel, capital investment proposals, people matters and strategic initiatives. During the national lockdown, alongside protecting and supporting key relationships, the focus was on work towards the joint venture with Carlsberg UK.
The Disclosure Committee, comprising the CEO, CFO and Group Secretary, meets as and when required to discuss matters arising in accordance with the EU Market Abuse Regulation, the Financial Conduct Authority (FCA) Listing Rules and the Disclosure Guidance and Transparency Rules to ensure Marston’s PLC meets its obligations.
The Supporting Committees’ primary role is to provide assurance to the Board on the operation of internal controls, auditing and compliance with legal and other regulatory obligations. This framework is supported and enabled by the risk management process (see page 21), our Ways of Working and The Marston’s Way (see page 6). The work of our supporting committees is described in the Risk Management section on page 21.
Documents available at: www.marstons.co.uk • Articles of Association
• Matters Reserved for the Board
• Committee Terms of Reference
• Roles and responsibilities for each Board member
Board and Committee meeting attendance Board and Committee meeting attendance is shown in the table below. The Board calendar of meetings is set and reviewed at least 18 months in advance, allowing the Directors to plan their time accordingly.
Name Board Nomination Audit Remuneration
Andrew Andrea 14/14 – – – Carolyn Bradley 14/14 2/2 4/4 3/3 Ralph Findlay 14/14 2/2 – – Catherine Glickman1 2/2 – 1/1 1/1 Bridget Lea 14/14 2/2 – 3/3 Octavia Morley2 12/12 2/2 3/3 2/2 Matthew Roberts 14/14 2/2 4/4 – William Rucker 14/14 2/2 – –
1. Catherine Glickman stepped down from the Board with effect from 24 January 2020.
2. Octavia Morley joined the Board with effect from 1 January 2020.
3. Composition, Succession and Evaluation
Our Board comprises a majority of independent Non-executive Directors (NEDs), a Non-executive Chairman (who was independent on appointment), together with two Executive Directors, supported by the Group Secretary. A biography, setting out details of their career background, relevant skills and experience, Committee membership, length of tenure and external appointments is set out on pages 46 and 47.
Each of our Non-executive Directors are initially appointed for a three-year term, which is subject to annual re-election by our shareholders and the annual Board evaluation. This term can be renewed by mutual agreement. Renewal of the appointment after six years is considered on an annual basis.
The Board is responsible for ensuring that it maintains the necessary skills, experience and knowledge to discharge its responsibility for the long-term sustainable success of the Group. The Nomination Committee leads the process for orderly succession planning and appointments to the Board and senior management, making recommendations to the Board as appropriate. Having served on the Board since December 2014, Catherine Glickman stepped down following the conclusion of the AGM on 24 January 2020. Octavia Morley joined the Board with effect from 1 January 2020 and was appointed as Chairman of the Remuneration Committee following the conclusion of the AGM. We consider all our NEDs to be independent and the charts on page 47 show the balance and tenure of the Board.
Provision 17 of the 2018 Code requires the Company to establish a Nomination Committee comprised of a majority of independent NEDs. When Catherine Glickman, a member of the Committee, stepped down from the Board on 24 January 2020, the Company was not compliant with this provision until 17 June 2020, when both Bridget Lea and Octavia Morley joined the Committee. No Nomination Committee meetings were held during this period.
As reported in the 2019 Annual Report and Accounts, the Company was non-compliant with the requirement for its Audit Committee to be comprised of a minimum of three independent NEDs (Provision 24) from 31 July 2019, when Robin Rowland stepped down from the Board and the Audit Committee, until 1 January 2020 when Octavia Morley joined the Board and the Audit Committee.
Board training and development Prior to the lockdown, the NEDs continued to spend days in trade with members of the PLC Exec and senior management to better understand the current operational challenges and meet with teams from across the business. The pre-Board presentations are also designed to update the knowledge of NEDs and their familiarity with the business as well as providing an opportunity to spend time with those teams more informally. The NEDs also attend external technical seminars offered by professional advisers and receive internal briefings on emerging legislation, compliance and regulatory matters as it relates to the Group. The Group Secretary advises the Board on matters of governance and is available to all Directors in an advisory capacity, including the appropriateness of seeking independent professional advice.
The Group’s induction programme is tailored to each new Director, depending on their experience and nature of their role on the Board. Octavia Morley began her induction programme in December 2019, prior to her appointment to the Board. Octavia met with the CEO, CFO, Group Secretary and other members of the senior management team to discuss the Group’s strategy, performance, finances and governance matters; as well as a tour of Banks’s Brewery in Wolverhampton, and Marston’s Brewery in Burton, hosted by the MD of MBC. In addition, Octavia has also met with the Corporate Risk Director, our Group Head of Health and Safety and undertaken the required training in relation to GDPR and Competition Law. Octavia has also had meetings with our financial PR agency and remuneration advisers. Octavia spent a day in trade with the Operational Director for Marston’s Pubs and Bars, visiting various pub sites and has spent time with the Group HR Director to understand the People Strategy and approach to remuneration across the organisation.

Marston’s PLC Annual Report and Accounts 2020
52
Nomination Committee Report
Dear Shareholder,
I am pleased to present an update on progress in our succession planning and development of the Board and senior management.
Succession Planning We have continued to make progress on our succession planning strategy. Last year we appointed two new Non-executive Directors, both of whom have a customer-centric focus with operational retail experience; Bridget Lea joined us at the end of last year and Octavia Morley joined in January of this year. We continue to review our succession planning strategy to ensure the Board composition, and that of the senior management team, reflects and aligns with the needs of the business. This year, we focused on reviewing the skills and experience of the management team, assessing the leadership needs required for operating a pub business. We were delighted to endorse the promotion of Sharon Singh to Director of Operations for our food-led pubs, along with several other changes designed to improve guest focus and operational execution. The changes we made last year to allow for the Directors to be briefed more regularly on operational initiatives by teams in an informal environment have had to be suspended whilst social distancing measures and local lockdowns disrupt activities, but we have continued to receive essential briefings from senior managers through video conferencing.
Our approach to Board diversity We recognise the importance and value that diverse perspectives bring to the Board and our business. As a Committee we will continue to make appointments on merit and we require the recruitment process to incorporate the widest range of suitable candidates when drawing up long lists and short lists. The Board’s approach to diversity is aligned to the Group’s policy referred to on page 54. Currently, three of Marston’s seven Directors are female. Following a review of how the business will be organised as a pub-focused operator, senior management changes were made to simplify the structure and clarify the focus of attention on the guest experience. As a result of these changes, two members of the PLC Exec and 43% of the senior management population are female.
Evaluation and re-election Having overseen a number of changes to the composition of the Board, I have spent time getting to know each Director and assessing the overall performance of the Board. This assessment has been supplemented by the Board evaluation we undertook during the year facilitated by David Mensley of EquityCommunications. Details of the process and output, together with an update on the 2019 recommendations, are set out below. As part of this year’s evaluation I have met with each Director to discuss their personal effectiveness and commitment to the Board. I am satisfied that the tenure of each Board member provides the right balance of experience and fresh thinking to lead the business forward as a focused pub company. I have concluded that all Directors have been effective in their role during the year and therefore recommend each Director standing for re-election at the forthcoming AGM.
William Rucker Chairman of the Nomination Committee
Membership William Rucker (Chairman) Carolyn Bradley Ralph Findlay Catherine Glickman (until 24 January 2020) Bridget Lea (from 17 June 2020) Octavia Morley (from 17 June 2020) Matthew Roberts
Our responsibilities • To ensure the Board and its Committees have the right balance of
skills, knowledge and experience.
• To plan for the orderly succession of Directors to the Board and other senior managers.
• To identify and nominate suitable candidates for Executive and Non-executive Director vacancies having regard to, amongst other factors, the benefits of diversity.
Attendees Other Executive Directors, senior management and external advisers may be invited to attend meetings.
Terms of reference Full terms of reference of the Committee can be found in the Investors section of the Company’s website: www.marstons.co.uk
Key activities during the reporting year • Reviewed the structure, size and composition of the Committees.
• Reviewed the skills and experience of the Executive team, and consider Executive succession plans to assess the development of a diverse pipeline of successors.
• Consideration of this year’s Board evaluation process.
• Reviewed the contribution and tenure of each Director before recommending for re-election.

Marston’s PLC Annual Report and Accounts 2020G
overnance
53
Our Board evaluation As required by the Code, this year’s review of the effectiveness of the Board and its Committees was facilitated by an external evaluator. EquityCommunications Ltd, led by David Mensley, had previously undertaken a questionnaire-based exercise for the Board in 2013. On this occasion face-to-face interviews were arranged which, because of the restrictions caused by COVID-19 measures, were conducted via video conference.
The interviews were centred on a framework of questions drafted by EquityCommunications following discussions with the Chairman and Group Secretary. These focused on the impact of COVID-19, the strategy of the new pub company and succession planning and talent. All members of the Board were sent an advance copy of the questions to allow time for reflection ahead of their meetings. Interviews typically lasted around one and a half hours and were designed to encourage Directors to participate in an open, informal and constructive discussion with the facilitator.
Following all the one-to-one meetings, EquityCommunications prepared a report for the Board summarising the responses to the questions and, where appropriate, incorporating action points and recommendations for the Board to consider, alongside their assessment of the Board’s effectiveness. Key points/strengths noted by EquityCommunications included:
• An open and communicative Board where mutual respect, trust and support welcomes appropriate challenge.
• A cohesive approach to navigating this year’s exceptional challenges effectively, spending significant time in making the right decisions considerately.
• A smooth transition to virtual Board meetings as the impact of social distancing measures were introduced, supported by sufficiently informative and timely papers. This came at a time when more Board meetings were required to consider the joint venture proposal.
• A strong approach to communications, keeping the NEDs informed against a backdrop of swiftly moving events.
• Effective and efficient Committees that monitor management’s approach to risk, internal controls, whistleblowing and remuneration practices. There is an acknowledgment that the Remuneration Committee will need to ensure that the policy, pay and practices are aligned to the needs of the new strategy.
The Non-executive Directors also met without the Chairman being present to discuss his performance and the conclusions were fed back to the Chairman by the Senior Independent Director. The Non-executive Directors have welcomed the NED-only catch ups and the opportunity to meet more of the teams prior to the pandemic and very much look forward to re-instating these arrangements when circumstances allow. Agreed action points, together with an update on progress against 2019, are shown below.
The review concluded that the Board and its Committees continue to operate effectively.
2020 recommendations • A reorganisation of the Board agenda to facilitate a number of
online meetings covering the more transactional matters.
• A review of how Strategy Day discussions are integrated with other key planning areas and revisited throughout the year.
• Succession and people – development of leadership programmes for our senior management; and setting out our plans to ensure our new Equality, Diversity and Inclusion Policy creates the inclusive culture to which we are committed.
• Greater focus on monitoring culture in our pub teams.
• A review of remuneration policy to align it with the new strategy.
• Appoint all NEDs to serve on all the Committees.
Our 2019 recommendations • A continued review of succession planning at Board and senior
management level.
• A continuation of Board meetings held at various Group premises and of pre-Board presentations by specialist teams.
• A list of future topics for presentation to inform Board discussion.
• Greater focus on customer experience to achieve operational performance.
Update on 2019 • Changes have been made at Board and senior management level
to meet the future needs of the business.
• A number of pre-Board presentations and site visits were made before lockdown. These will resume when it is permissible.
• The forward agenda is under review to incorporate the key areas of focus of a pub business.
• The new strategy is centred around the best guest experience and our strategic framework has been aligned accordingly.
Re-election of Directors All Directors will offer themselves for re-election at the 2021 AGM. Details of each Director serving on the Board at the date of this report are set out on pages 46 to 47 and shall be set out to shareholders in the papers accompanying the re-election resolutions for the AGM. The Board is of the opinion, supported by the Nomination Committee, that each Director continues to make an effective and valuable contribution and demonstrates commitment to his or her role.

Marston’s PLC Annual Report and Accounts 2020
54
Nomination Committee Report continued
Our approach to equality, diversity and inclusion At the heart of everything Marston’s stands for is our people. We are a diverse business committed to building an inclusive culture where our people and our guests feel welcome and included for who they are. We, as a business, starting with our Board, want to celebrate, include and work with individuals from all walks, traits and backgrounds in life. Our new Equality, Diversity and Inclusion policy aims to ensure this commitment is reflected through three areas of focus:
• How we attract, nurture and develop our people.
• How we ensure our guests have the best experience possible.
• Supplier diversity to ensure inclusive procurement and an inclusive work environment.
This policy equally applies to our Board members and all of our employees, regardless of their contract, location or role in the business. We aim to ensure our inclusivity applies to all aspects of their careers, including recruitment, selection, benefits and opportunities for training and promotion.
We are guest obsessed and seek to improve the guest experience, whether travelling and looking for a great night’s sleep or a catch up at their local. We want to encourage guests to enjoy our pubs, bars and inns in a friendly and inclusive environment.
We are actively engaged with our supply chain, to ensure modern slavery does not occur, and that our suppliers share our values and are providing an inclusive environment for their own teams.
Our vision is to be an employer of choice, with a rich and diverse mix of people who reflect the societies and communities in which we work and serve.
Marston’s is a great place to work and our policy reinforces our commitment to equality, diversity and inclusion, and to having a truly representative workforce where every member of our team, every guest and every supplier feels respected, valued and able to be their best. We want to ensure that equality, diversity, and inclusion is a core part of how we operate, it’s embedded in our culture, and reflected in our people and their behaviours.
We are committed to:
• Reviewing and adapting our policies and procedures to ensure workforce diversity and equal opportunities.
• Implementing initiatives that drive an inclusive culture where all employees feel accepted and valued.
• Promoting a more inclusive environment, which attracts all candidates and signals our commitment to celebrate and promote diversity.
• Taking an inclusive approach to ensure we attract a diverse pool of talent and experience.
• The use of clear statements which promote equality and inclusion within our recruitment process.
• Training our managers and wider teams to increase cultural diversity awareness, knowledge and skills.
• Encouraging our people to share their experiences and help each other to understand more about what diversity and inclusion means.
• Authentically telling our diversity and inclusion story and celebrating our approach – both inside and outside of our organisation.
Our Equality, Diversity and Inclusion Policy can be found on our website.
Gender diversity Number of employees at 3 October 2020:
Directors
Male 4
Female 3
Senior managers
Male 26
Female 20
Total employees
Male 6,317
Female 6,778

Marston’s PLC Annual Report and Accounts 2020G
overnance
55
4. Audit, Risk and Internal Control
Fair, balanced and understandable To support the Board’s assessment of whether the Annual Report and Accounts as a whole is fair, balanced and understandable, comprehensive reviews are undertaken throughout the year-end process by Company Secretariat in conjunction with the Finance team and support from other teams across the business. Drafts of each section of the Annual Report and Accounts are reviewed for consistency in terminology across the whole document, alignment of and linkage between strategy, business model, financials, risk and governance. The accuracy of all information is verified by supporting evidence. The drafts are submitted to the Board ahead of final approval to allow the Non-executive Directors time to review, discuss and, where thought appropriate, challenge the content. The external Auditor reviews the consistency between the narrative reporting and financial disclosures and whether it is appropriately weighted to present a fair and balanced description of the year. The Audit Committee also receives a summary of the processes undertaken by management to produce the Annual Report and Accounts, highlighting the methodology of the teams involved and the input from the external Auditor.
The Board is satisfied that, as a result of these robust processes, they consider the Annual Report and Accounts, taken as a whole, to be fair, balanced and understandable and provide the information necessary for shareholders to assess the Company’s position, performance, business model and strategy.
Risks and internal controls Whilst the day-to-day management of risk is devolved and delegated to management, the Audit Committee receives a detailed update at each meeting on risks and risk management from the Corporate Risk Director and Group Internal Audit Manager. The Board regularly consider the risks faced by the Group and undertake a robust assessment of those that would threaten its business model, future performance, solvency or liquidity. In addition, they receive reports and updates from the Risk & Compliance Committee and the PLC Exec.
The Risk & Compliance Committee, chaired by the Group Secretary, monitors all areas of legal and regulatory compliance across the business. At its quarterly meetings, the Committee, which includes representatives from across the business as well as the Corporate Risk Director and Group Internal Audit Manager, considers the impact of any emerging legislation on the business, the effectiveness of our internal controls and compliance processes. The discussions inform the Internal Audit plan and provide the focus for annual compliance testing that seeks reassurance that the Group is complying with relevant legislation as well as its own policies and procedures.
More details of the Group’s approach to risk management, systems and internal controls are explained in the Strategic Report on pages to 21 to 29.
Going Concern and Viability Statements The Committee has considered the Group’s assessment of going concern and viability, including the assumptions and scenario testing applied to its financial forecasts, particularly in light of the ongoing impact of the COVID-19 pandemic. The Committee considers a three-year period to be appropriate for the assessment of viability and is satisfied that management has conducted a sufficiently robust assessment of the potential downside scenarios, specifically relating to COVID-19.
The Committee concurs with management that there is a reasonable expectation that the Group will be able to continue in operation and meet its liabilities as they fall due over the period to 3 October 2023 and therefore supports the going concern and viability statements as set out on pages 73 and 29 respectively.

Marston’s PLC Annual Report and Accounts 2020
56
Audit Committee Report
Dear Shareholder,
I am pleased to present the Audit Committee’s report for the period ended 3 October 2020. Throughout the year we have continued our focus on the integrity of financial reporting and internal controls as well as the principal risks and the potential impact on our business.
In light of the COVID-19 pandemic and the impact on the Group’s financial position as a result of the enforced pub closures, I have held regular discussions with the CFO and external Auditor and the Committee has met to discuss the implications for the Group. The financing activity undertaken as a result of the pandemic’s impact was considered by the Board as a whole and the Committee has focused its attention on the implications of COVID-19 on the estate valuation and for assessing the going concern basis of accounting.
As well as reviewing the Group’s financial statements for the full and half year, the Committee considers all forthcoming accounting changes. As Chairman, I also meet independently with the external Auditor, the CFO, the Corporate Risk Director and the Group Internal Audit Manager. I have an open and professional relationship with each of them and I am confident in their capabilities and the level of assurance that they provide.
Matthew Roberts Chairman of the Audit Committee
Membership Matthew Roberts (Chairman) Carolyn Bradley Octavia Morley (from 1 January 2020)
Our responsibilities • Reviewing the integrity of the Group’s financial statements including
the Interim Results and the Annual Report and Accounts.
• Reviewing the effectiveness of the internal controls and risk management system.
• Reviewing the Group’s systems for detecting fraud, preventing bribery and allowing employees to raise concerns in a safe and confidential manner.
• Overseeing the relationship with the external Auditor and reviewing and approving their terms of engagement; specifically overseeing the transition from PwC to KPMG.
• Reviewing and monitoring the external Auditor’s objectivity and independence and the effectiveness of the audit process.
Attendees The Corporate Risk Director and external Auditor attend each meeting.
Other individuals, such as the CEO and CFO and members of the Internal Audit team, are usually invited to attend all or part of the Committee’s meetings.
Terms of reference Full terms of reference of the Committee can be found in the Investors section of the Company’s website: www.marstons.co.uk
Key activities during the reporting year • Reviewing the Interim Results and the Annual Report and Accounts
prior to Board approval.
• Considering the key financial matters and related accounting judgements and estimates.
• Reviewing the main corporate risks and assurances from testing the systems and processes to manage and mitigate those risks.
• Reviewing the Viability Statement and associated time period.
• Approving the Internal Audit Strategy, Charter and Plan and reviewing audit outcomes.
• Reviewing and approving the Statutory Pubs Code compliance report.
• Considering and reviewing the activity and effectiveness of the ‘Speak Up’ Policy.

Marston’s PLC Annual Report and Accounts 2020G
overnance
57
External Auditor KPMG assumed the role of external Auditor at the start of this financial period having worked with our previous external Auditor to ensure a smooth transition from the last financial period. The external Auditor attends each meeting, providing the Committee with an opportunity to discuss the integrity of the Company’s financial reports. The Audit Committee Chairman has also met with the external audit partner on a number of occasions during the year to discuss preliminary findings and views on key matters. The Auditor presents their audit strategy, findings and conclusions in respect of the Annual Report and Accounts and Interim Results.
Noting the approach to objectivity, independence, consistency of professional standards, ethics and integrity that the Auditor applies in respect of all services provided to the Group, and taking note of the procedures KPMG have in place to safeguard their independence and objectivity, the Committee is satisfied that the Auditor is independent and the objectivity of the audit partner and staff is not impaired. In assessing the work of the Auditor in this their first year, the Committee considered their processes, the changes in audit approach from the previous external Auditor, the impact of COVID-19 on the audit, and their assessment of the Group’s significant risks and other areas of audit focus. The Committee is satisfied with the scope of their work, their conduct and their effectiveness.
Non-audit services The external Auditor is responsible for the statutory audit and the Committee accepts that some non-audit work is most appropriately undertaken by the external Auditor. Such work is governed by the Group’s policy on the provision of non-audit services by the external Auditor and must be in accordance with the Committee’s terms of reference. The policy is available on the website at www.marstons.co.uk/corporate/profile/governance. The purpose of the policy is to safeguard the objectivity and independence of the annual audit and sets out the approvals required according to the fees involved. The Company has also used other accounting firms for some non-audit work including the joint venture with Carlsberg UK, tax advice in respect of research and development claims, the automation of certain tax compliance processes and NMW compliance. In each case, consideration is given to the need for value for money, experience and objectivity required in the particular circumstances when assessing whether the Auditor is the most appropriate provider of the work in question.
External Auditor effectiveness review This year the Audit Committee has documented their review of the external Auditor. The Committee recognises that this is a continual process, and that it is appropriate in the Annual Report and Accounts to bring the reader’s attention to the most salient points.
The external Auditor KPMG was appointed in 2020 following a tender exercise run in 2017, the delay in appointment was to retain the experience of the outgoing auditor in respect of our accounting for leases pre IFRS 16.
The Audit Committee was satisfied that the tender process leading to the appointment of KPMG was conducted in an appropriate manner to ensure that a high-quality audit would be delivered:
• Management teams across the business were involved in the interview process.
• Audit firms were given sufficient information on which to base a tender.
• Firms involved the partners and team members expected, at the time, to deliver the audit.
• The firms were independent from the business.
• The final decision was a collective one by management, taking into account the relative strengths and experience of the firms.
The success factors expected from the appointed firm were communicated during tendering, in particular:
• The experience in our market sector.
• The time and resource which could be brought to the engagement.
• Access to specialists.
• Technological tools.
• Seniority of the partner and the team.
Since selection after the tender process, KPMG have increased their knowledge of the business, and been able to closely shadow the outgoing auditor during 2019 to guarantee a smooth transition. Following the tender, the KPMG audit team has changed since the original proposal, including the partner retiring. The Committee has observed however that the knowledge of our business has been effectively transferred to the new audit team.
KPMG have attended all the meetings of the Audit Committee this year, during which they have explained in detail their audit methodology and their planning for the audit. During the engagement KPMG have demonstrated a sound understanding of the control environment of Marston’s and of the top risks that could impact upon their performance. For each risk identified, KPMG provided a detailed response to the Committee explaining how the audit work would be scoped.
KPMG have recognised that COVID-19 has brought additional risk to the performance of the audit this year. During their planning they have been assiduous in setting out the individual impacts of the pandemic on the audit, any increased risks of misstatement, and any challenges that might arise during the audit itself, including:
• Planned scope and timing – impact of lockdown.
• Materiality – impact of uncertainty on forecasts.
• Subsequent event disclosure – increased likelihood to disclose.
• Going concern – increased levels of uncertainty.
• Accounting estimates – higher degree of estimation uncertainty.
• Sufficient appropriate audit evidence – additional time required.
KPMG have supplied a letter to the Committee explaining why, in their professional judgement, they are independent and that the objectivity of the partner and audit staff remains unimpaired. The letter confirms the firm’s fees from non-audit related services are below the cap stipulated by the FRC Ethical Standard, and a subsequent letter at the final meeting was provided re-confirming this. KPMG have confirmed that there have been no matters to disclose that might have conflicted with their audit judgement.
The FRC’s Audit Quality Review (AQR) team routinely monitors the quality of the audit work of UK audit firms through inspections of sample audits and related procedures at individual audit firms. The FRC selected the Group’s FY19 financial statement audit by PwC, our previous Auditor, as part of that routine quality monitoring process. The FRC’s AQR report on Marston’s audit in 2019 contained detailed points regarding the approach adopted by our previous Auditor. The Committee considered whether the findings of the review process were significant, and discussed these findings with KPMG, who are cognisant of the detailed points raised and are satisfied that their own audit meets those requirements.
Marston’s PLC Annual Report and Accounts 2020
58
Audit Committee Report continued
Internal Audit function The Corporate Risk Director and Group Internal Audit manager attend each Committee meeting to provide regular updates and ongoing assurance on the Group’s main risks and internal controls. The findings from internal audits, together with progress on actions identified, are reviewed and considered. As announced last year, the Committee oversaw the tender process for the Internal Audit co-source and endorsed the appointment of PwC, which was finalised in January after the conclusion of the 2020 AGM.
Statutory Pubs Code The Group has continued its commitment to working effectively within the Pubs Code regulations. Processes are reviewed on an ongoing basis and any changes that are required are implemented to ensure streamlined operations which are compliant with the provisions of the Pubs Code.
Following internal approval by the Chair of the Audit Committee, the Code Compliance Officer submitted an annual compliance report to the Pubs Code Adjudicator (PCA), for the reporting period from 1 April 2019 to 31 March 2020.
During the reporting period, Marston’s were not subject to any investigations, enforcements or representations of unfair business practices by the PCA. Seven referrals were made to the PCA, all of which were in relation to the MRO provisions of the Pubs Code. Two referrals made prior to the reporting period have been awarded against Marston’s on the grounds that it did not comply with the requirements under the Pubs Code. Remedial actions have been implemented in respect of each case.
During the reporting period, all of Marston’s Business Development Managers received updates and training on the Pubs Code.
Significant financial judgements and estimates As expected in a period where the business has been significantly impacted by the pandemic, the most significant areas of financial judgement are related to going concern and the valuation of the Group’s pub portfolio.
Going concern The Committee and the Board considered management’s assessment of the Group and the Company’s ability to continue as a going concern, based on the going concern assessment period, being the period of 12 months from the date of signing these financial statements. The Committee noted that the Group is expected to have sufficient cash headroom throughout the going concern assessment period but that a severe downside scenario, which incorporates the impact of a further lockdown, will require further covenant waivers from its lenders in order for the Group to meet its liabilities as they fall due. The Committee recognises that this would represent a material uncertainty over the Group’s ability to continue to trade as a going concern over a period of at least 12 months from the date of this report (but are satisfied with and supportive of management’s assertions that such waivers would be secured.)
Valuation of the estate The valuation, and resulting impairment charge of £243.9 million, was conducted by management and was based on three key assumptions relating to Fair Maintainable Trade, trading multiples and vacant possession value. Noting that the estimates attached to these assumptions are inherently subjective and small changes in the assumptions could have a significant effect on the overall valuation, the Audit Committee considered the methodology applied by management, recent transactions in the market and the uncertainty created by the long-term impact of COVID-19 on future earnings. The Committee met with the Executive Directors and the external Auditor in July, October and December to discuss the valuation process, the audit thereof and the key issues arising. As a result of these reviews, the Committee is satisfied that the valuation of the estate, after an impairment of £243.9 million, is appropriate and considers the long-term impact of COVID-19 and that the disclosure of the range of reasonably possible outcomes appropriately reflects the increased uncertainty around future expectations.
Valuation of goodwill in relation to pubs and bars The Committee considered the impairment assessment over the goodwill allocated to the Pubs and Bars segment. Noting that the key assumptions used in determining this value are the discount rate assumption, cash flow projections derived from the Board approved budget and five-year strategic plan and long-term growth rates, the Committee supports management’s conclusions that it is appropriate to eliminate entirely the carrying value of goodwill allocated to the Pubs and Bars segment.
Valuation of derivative financial instruments The Committee considered the methodology applied by management to determine the valuation of the Group’s interest rate swaps, recognising that the values are highly sensitive to the assumptions around discount rates, analysis of credit risk and yield curves. Particular attention was paid to the model used to calculate the credit risk adjustment noting that it was comparable to companies with similar credit risks when assessed by the auditors. The Committee is satisfied that the valuation has been arrived at after a robust and thorough process and concurred with the presentation of interest rate swaps as disclosed.
During the year, the Committee also considered a number of other items of significant risk that impact on the presentation of the financial statements, including retirement benefit obligations and level 3 assets, and the impact of uncertainties due to the UK exiting the European Union. The Committee was comfortable that the assessments made and disclosures set out in this report are acceptable and appropriate.

Marston’s PLC Annual Report and Accounts 2020G
overnance
59
Directors’ Remuneration Report Annual Statement
Dear Shareholder,
I am pleased to present our report for the period ended 3 October 2020 and my first as Chairman of the Remuneration Committee. In this unprecedented year, our focus has been to ensure that we take a fair, prudent and balanced approach to remuneration across the Group, taking into account the experience of our employees, shareholders and other stakeholders during the year.
At the 2020 AGM, shareholders approved our revised Directors’ Remuneration Policy with more than 86% of votes cast in favour. We were pleased that our shareholders continue to support and endorse our remuneration framework. The Annual Report on Remuneration describes how the Directors’ Remuneration Policy has been applied for the period ended 3 October 2020, and how we intend to implement the Directors’ Remuneration Policy for the 2020/21 financial period is provided on pages 64 to 71.
Strategic and business context In the period under review we faced the challenges of the global pandemic, with our entire pub estate closed for 15 weeks from March until July 2020 and then the majority again in November 2020. The significant impact of COVID-19 on our business, our employees, suppliers, the communities in which we operate and other stakeholders continues to be felt as, at the time of writing, we remain subject to restricted trading according to local tiers. We are grateful for and acknowledge the continuing efforts of our employees, suppliers and other partners, together with the support received from the Government through the Coronavirus Job Retention Scheme (CJRS). Regrettably, the ongoing restrictions will impact jobs, and we have reluctantly concluded that around 2,150 pub-based roles, which have remained furloughed since the first lockdown period, have been impacted. We are mindful that our shareholders have also been affected by the decision, made in response to the impact on trading by COVID-19, to suspend dividends for the reporting period; future dividends will be reviewed when normalised trading resumes. Both our CFO and our Director of Treasury and Tax have worked with our bank syndicate and bondholders throughout the year, securing additional bank facilities and covenant amendments and waivers, protecting our operational liquidity during the continuing disruption to trading, caused solely by the pandemic. This, along with a number of other prudent cash management measures, has helped us to achieve a lower net debt figure in 2020 than the previous period.
Despite this period of closures and ongoing uncertainty, we have successfully completed the transformational joint venture between Carlsberg UK and Marston’s Beer Company. We retain a significant interest in the new business through our 40% investment and we look forward to building on the relationship with Carlsberg and seeing the Carlsberg Marston’s Brewing Company grow and deliver on the opportunities available to it.
Following completion, Marston’s is now a focused pub and accommodation business, and in our Strategic Report we have set out our revised strategy comprising three pillars:
1. We are Guest Obsessed
2. We Raise the Bar
3. We will Grow
Our People Strategy on page 32 is aligned to this revised strategy and, as the revised strategy is implemented, we will continue to review workforce related remuneration and polices, together with our Directors’ Remuneration Policy, to ensure they remain aligned and fit for purpose. Performance measures and targets will be reviewed in the context of the revised strategy and, should we propose any significant changes, we will engage with our shareholders as appropriate.
Directors’ Remuneration Policy Our current Remuneration Policy became effective from the close of the 2020 AGM and the following pages describe how the policy has been applied in 2019/20. Rather than reproduce the full policy in the Annual Report on Remuneration, we have provided extracts from the policy alongside its implementation during the year. The full policy can be found on pages 57 to 64 of the 2019 Annual Report and Accounts and is also available in the Governance section of our website (www.marstons.co.uk/ investors/company-profile).
Review of the year Performance Both the Chairman’s Statement and CEO’s Statement report on our performance in 2019/20 and on the financial consequences of pub closures, restrictions on reopening and local lockdowns which resulted in significantly reduced profit. The underlying loss before tax was £22.0 million (2019: £95.1 million profit).
Performance outcomes for the year Salary and fees 2019/20 During the period of the first UK lockdown from March until July 2020, whilst 93% of the Group’s workforce was furloughed under the Government’s CJRS, those employees who continued to work to support the business were asked to accept a 20% reduction in their salary during the period from April to July 2020, with normal salaries paid from August 2020. The CFO and the Non-executive Directors also volunteered to accept the same 20% reduction in their respective salary and fees.
The Chairman volunteered a 50% reduction in his fees and our CEO reduced his salary to £250,000 over the same four-month period of closure; a 56% reduction in salary. These reductions contributed to the cash preservation measures during the period and the Committee is grateful to our people for accepting the reduction.
Annual bonus 2019/20 With the underlying loss before tax of £22.0 million and free cash flow (FCF) for the period of £67.0 million, neither threshold for the annual bonus performance measures were met. Based on these results no bonus is payable to the Executive Directors; further information is given on page 65.
Whilst no payments were earned under the Group Annual Bonus Scheme for the 2019/20 financial period, a number of employee groups were either on target to achieve budget for the reporting period or continued to work throughout the first lockdown period under challenging conditions and in unprecedented times.

Marston’s PLC Annual Report and Accounts 2020
60
Directors’ Remuneration Report Annual Statement continued In order to recognise and reward the individual contribution of these employees, a number of awards were earned during the period.
• The beer business achieved budget for the first half of the period and was forecast to be on budget for the full 2019/20 period. The business continued to supply off-trade customers during the first lockdown period, with exceptionally high levels of demand for the time of year and c.1,500 employees will receive a 100% on-target based bonus payment. These payments will be pro-rata for those employees who were furloughed during the period.
• A small group of employees within our pubs team (c.30) were achieving budget up until the enforced closure of the entire pub estate in March 2020. Those employees will receive a 100% on-target bonus payment, pro-rated for the five full periods where performance achieved budget.
• Around 180 employees who supported the business through the first lockdown period, with salary reduced to 80% but working their full-time hours, will be paid a 2.5% salary recognition payment in respect of their contribution to business continuity during the first lockdown period.
• A small group of individuals within the Group Services team (c.40), went ‘above and beyond’ in their efforts to support the business during the first lockdown period and afterwards to ensure that the joint venture with Carlsberg UK completed, securing financial stability and managing people related matters during the COVID-19 crisis. To recognise their efforts these individuals, who also received 80% of salary from April to July 2020, will receive an exceptional bonus payment equivalent to their normal maximum bonus opportunity.
With the continuing uncertainty caused by the enforced closure of pubs under additional regional and national lockdowns, these payments have been deferred to January 2021, for beer business employees, and to April 2021 for the remaining groups of employees.
LTIP 2017/18 The three-year performance period for the LTIP award made in December 2017 ended on 3 October 2020. Each of the three performance measures: CROCCE, FCF and relative TSR failed to reach threshold performance of 10.5%, £300 million and median respectively. The award, therefore, has lapsed for all participants. Further information is provided on page 66.
Alignment of the Directors’ Remuneration Policy with the Code When determining the application of the Directors’ Remuneration Policy, the Committee considered the clarity, simplicity, risk, predictability, proportionality and alignment to culture as set out in the 2018 Code. We operate simple variable pay arrangements, which are subject to clear performance measures aligned with the Group’s strategy and the interests of all stakeholders. The application of recovery provisions (malus and clawback) enables the Committee to have appropriate regard to risk considerations. In addition, the large shareholdings of the Executive Directors and the operation of a post-employment shareholding guideline further align the interests of our Executive Directors to serve the long-term interests of the Company and shareholders. As part of our culture, in determining the Remuneration Policy, the Committee was clear that it should drive the right behaviours, reflect our values and support our Group purpose and strategy.
Other key activities of the Committee during the year • Approval of the Directors’ Remuneration Policy for recommendation
to shareholders.
• Review of the Group Reward Plan – building reward structures that are relevant, engaging and sustainable for all our people.
• Pension arrangements for incumbent Executive Directors, as outlined further on in this report.
• Consideration of pay review proposals for the Executive Directors, the Chairman, senior management and the wider workforce.
• Reviewed the impact of COVID-19 pandemic on employees: their commitment during the period, wellbeing and reward.
• 2020 bonus outturn and 2017/18 LTIP award vesting, as outlined above.
• Consideration of targets for Group and senior management bonus schemes.
• Consideration of SAYE and LTIP grants.
• Review of Executive Directors and senior management shareholdings in the Company, in the context of shareholding guidelines.
• CEO pay ratio reporting.
Looking forward to 2020/21 Executive Director pay and the broader workforce Salary, benefits and performance related rewards provided to employees are taken into account when setting policy for Executive Directors’ remuneration. Although employees are not actively consulted on Directors’ remuneration the Group has regular contact with union bodies on matters of pay and remuneration for employees covered by collective bargaining or consultation arrangements. Further information is detailed in our Corporate Governance Report on pages 48 and 71.
In October of each year a paper is submitted to the Committee by the Group People Director summarising the outcome of any annual reviews made to the wider workforce. This includes head office and supply chain employees but excludes pub based staff as the majority of these employees have their remuneration rate set by statute rather than the market. This paper is taken into account when setting Executive Directors’ remuneration effective from the start of October for the following 12 months. In addition, and where relevant, a similar paper is submitted in October covering the decisions taken by the Executive Committee relating to bonus payments for employees within the wider workforce. This is taken into consideration by the Committee when approving bonus awards for Executive Directors.
Pay award effective 1 October 2020 The annual pay review, usually carried out in April, was postponed until October 2020 due to the period of uncertainty and the first UK lockdown. In recognition of the salary reductions made to preserve cash, together with the commitment, effort and resilience demonstrated by our people during this challenging period, a 2% pay increase was approved with effect from the 2020/21 financial period. In the context of the wider workforce pay review, the Committee reviewed the salaries paid to Executive Directors and an increase in base salaries of 2% was approved.
The Chairman and other Non-executive Directors fees were last reviewed in 2017/18. My fellow Non-executive Directors and I, however, agreed that a review of our fees was not appropriate this year. The Board, therefore, will review Non-executive Director fees, and the Committee will review the Chairman’s fees, in October 2021.
Retirement benefits As reported in the 2019 Remuneration Report, in response to shareholder feedback on our policy, our CEO volunteered to reduce his pension provision to 20% of salary. The Committee continued to monitor and review developing market practice and investor views during the period, noting the expectation that these will align to the contribution rate available to the wider workforce by the end of 2022.

Marston’s PLC Annual Report and Accounts 2020G
overnance
61
During the course of the year, the Committee reviewed our approach to reducing pension contribution (or cash in lieu of pension) entitlements for our existing Executive Directors. With the agreement of our Executive Directors, we are committed to reducing pension entitlement to 7%, this being the contribution rate available to the majority of employees who participate in the Group Personal Pension Plan (GPPP). We are proposing to achieve this by a phased approach. For FY 2020/21, the pension contribution rate for both Executive Directors will reduce to 18% of salary. The Committee will review the contribution rate again during the 2020/21 financial period with the intention of reducing pension provision for the existing Executive Directors to 7% no later than 2023/24. We will keep the timeframe for this phased reduction under review.
Annual bonus for 2020/21 For the 2020/21 annual bonus scheme, no changes in quantum are proposed in respect of the Executive Directors, which will remain at 100% of salary. To reflect the uncertainty surrounding the impact of COVID-19 on current trading conditions, the current pay-out at threshold of 20% will be retained but on-target performance will result in a 40% pay-out, instead of the normal 50% pay-out.
As shown in the table on page 61, the weighting of the financial measures, profit before tax (PBT) and FCF, has been adjusted from 60% to 25% of maximum and from 40% to 30% of maximum, respectively. The Committee has agreed to apply a higher weighting for FCF than PBT on the basis that there is increased focus on management to preserve cash during this period of uncertainty as a result of COVID-19 and enforced UK Government lockdown closures and restrictions.
The bonus will include the introduction of two new strategic objectives and one new financial objective to align with our revised strategy (for more details on our revised strategy and updated KPIs, see pages 13 to 17). The first strategic objective will focus on the successful implementation and managed transition to the joint venture with Carlsberg UK, underpinned by the seamless delivery of the Transitional Service Arrangements (25% of maximum); this is a key target for the transformation of the business to a pure pub and accommodation business and protects our interest in ensuring the delivery of the joint business plan. The second strategic objective will focus on our guest satisfaction scores which are a key strategic focus for the retained business (10% of maximum). The financial objective will be focused around the delivery of a cost reduction programme, specifically in regard to overhead savings for the simplified retained business (10% of maximum). The strategic measures are aligned with those applied to our senior management bonus scheme.
Strategic pillar Performance measure % weighting for 2020/21
We will Grow Profit before tax (financial) 25% Free cash flow (financial) 30% Successful implementation of 25% the transition period for the Carlsberg JV (strategic)
We are Guest Guest satisfaction scores 10% Obsessed (strategic) We Raise the Bar Cost reduction programme 10%
(financial)
The Directors consider that the annual bonus targets for 2020/21 financial year are commercially sensitive matters as they provide competitors with insight into our business plans and expectations, and therefore they should remain confidential to the Group until the performance period has ended. The Committee will continue to disclose how the bonus pay-out delivered relates to performance against the targets on a retrospective basis.
Membership Octavia Morley (Chairman) (joined Committee on 1 January 2020 and became Chairman on 24 January 2020) Catherine Glickman (Chairman until 24 January 2020) Carolyn Bradley Bridget Lea
Our responsibilities • Determining the framework and policy for Executive Directors’
remuneration.
• Within that framework, setting the remuneration for the Executive Directors and other members of the PLC Executive Committee (including the Group Secretary).
• Setting the Chairman’s remuneration.
• Establishing remuneration schemes that promote long-term shareholdings by Executive Directors, that support alignment with long-term shareholder interests.
• Designing remuneration policies and practices to support strategy and promote long-term sustainable success, with remuneration aligned to the Group’s purpose and values, linked to the successful delivery of our long-term strategy. Choosing appropriate performance measures and targets for annual and long-term incentive awards; exercising independent judgement and discretion when considering awards and pay-outs, taking account of Group and individual performance, and wider circumstances.
• When determining remuneration policy and practices, considering the Code requirements for clarity, simplicity, risk mitigation, predictability, proportionality and alignment to culture.
• To consider remuneration policy in the context of the wider workforce benefit structures, pension provision and remuneration trends across the Group and challenge, when necessary, to ensure alignment.
Attendees The Committee receives advice from a number of different sources. This helps to inform decision-making and ensures the Committee is aware of pay and conditions in the Group as a whole, and conditions in the wider market.
Ralph Findlay, CEO, has attended each meeting during the year to provide advice in respect of the remuneration of Andrew Andrea (the CFO) and senior management. Group HR Director, Liam Powell and Assistant Company Secretary, Michelle Woodall, also attend each meeting and provide advice to the Committee. No person is in attendance for any discussions regarding their own remuneration.
Deloitte LLP (Deloitte) were appointed by the Committee in 2003 and are retained as an independent adviser to the Committee, attending meetings as and when required. Deloitte is a member of the Remuneration Consultants Group and, as such, voluntarily operates under its Code of Conduct in relation to executive remuneration consulting in the UK. Deloitte received fees amounting to £14,936 during the year in respect of advice given to the Committee, and also provided advice during the year in relation to VAT and the operation of the Company’s share plans.
Terms of reference During the period, the Committee has agreed a number of changes to be made to its terms of reference, as part of the annual review. Full terms of reference can be found in the Investors section of the website www.marstons.co.uk

Marston’s PLC Annual Report and Accounts 2020
62
Directors’ Remuneration Report Annual Statement continued LTIP for 2020/21 Awards under the Long Term Incentive Plan would normally be granted annually, in December. Due to the continuing global pandemic, and the possibility of further national and local lockdowns and restrictions, target setting is challenging. In addition, the negative impact of the pandemic on our share price may cause windfall gains, if awards are granted at the normal levels. The Committee has agreed to postpone the LTIP grant until later in the financial period, by which time we may have more visibility as to future trading. The Committee has discretion to amend the vesting outcome where it considers that the formulaic outcome is inappropriate. In particular, the Committee will consider whether there has been any ‘windfall gain’ when determining the vesting outcome, taking into account a number of factors as detailed on page 67.
The Committee expects the performance measures and weightings to be unchanged (40% EPS, 40% NCF and 20% relative TSR); full details of award levels and performance targets will be disclosed when the awards are granted. In line with our current policy, the Company would consult with shareholders on any significant proposed changes to performance measures.
Committee focus for 2020/21 The Committee will continue to monitor the operation of the policy, in particular performance metrics for our short-term and long-term incentive schemes, to ensure they remain aligned with our strategy for our retained business, particularly in the context of the continuing global pandemic, and provide the right balance of challenge and reward. The Company and the Committee remain committed to a fair and responsible approach to executive pay, which is aligned with the interests of shareholders and other stakeholders in our business.
Shareholder engagement The Committee welcomes ongoing shareholder dialogue and takes an active interest in voting outcomes. We are pleased that the 2019 Annual Report on Remuneration received high levels of support, with over 95% of votes cast in favour of the resolution. We also thank our shareholders for approving the Directors’ Remuneration Policy in 2020, with over 86% of votes cast in favour of the resolution, but we recognise there is work still to be done in ensuring our shareholders are satisfied that the policy is appropriate for our Directors and aligns with our wider stakeholder interests. Ahead of the policy vote in January 2020, we received feedback on a number of policy matters, including pension contributions for incumbent Directors, our choice of TSR comparator group and post-shareholding guidelines.
As detailed above, we have begun to address the pension provision for our incumbent Directors, reducing their contributions to18% of salary for 2020/21. During the policy review in 2018/19, we considered moving our TSR comparator group to a bespoke peer group. Given the small number of listed companies within our sector, that has further reduced since our policy review, we are however confident that the FTSE250 Index (excluding Investment Trusts) remains the most appropriate comparator group. Whilst the Group is not currently a constituent of the FTSE250, our aim is to return to that index in due course.
We believe that the post-employment shareholding guidelines for Executive Directors, as set out on page 70, are reasonable and align with shareholder interests. We do intend to keep the evolving market practice in this area under review.
We welcome all feedback from our shareholders as it helps inform our thinking on remuneration matters. We will continue to engage with you and hope we can rely on your continuing support. If you would like to contact me directly to discuss any aspect of our policy or this report then please email me at [email protected]. In light of the continuing restrictions in place due to the global pandemic, I am disappointed that I will not be able to meet with you at our 2021 AGM. Provision has been made for shareholders to put their questions to the Board and I encourage you to engage with us on any matters regarding remuneration of our Directors, senior management and our wider workforce.
Octavia Morley Chairman of the Remuneration Committee

Marston’s PLC Annual Report and Accounts 2020G
overnance
/
63
Remuneration Summary 2019/20
Principles • Ensure remuneration arrangements support sustainable growth and strategic objectives of the Group.
• Substantial part of the incentive package for Executive Directors is awarded in the Company’s shares to ensure interests are aligned with shareholders.
• Ensure Director and senior management salaries are set with reference to the wider workforce.
Component Key features (current Policy) Implementation in 2019/20
Basic salary and core Reflects scope of the role; to recruit and 2% increase in salary in 2020 in line with the average salary increases across benefits retain calibre required; and reviewed in the Group
context of wider Group As noted in the Committee Chairman’s statement and below, each Executive Director’s salary was voluntarily reduced in the year having regard to the impact and circumstances of COVID-19
5% reduction in pension contributions for CEO from 25% to 20%
Other elements of benefits package unchanged Annual bonus Maximum 100% of salary 0% bonus awarded reflecting performance against targets as described on page 65
Committee discretion
Clawback provisions apply for up to two years Deferred element Payments in excess of 40% of maximum No bonus awarded so no deferral into shares of bonus usually deferred into shares
Malus provisions apply for up to three years Long Term Incentive Plan (LTIP)
Maximum annual award is 150% of salary
Normal maximum is 125% of salary
LTIP award granted in December 2017 lapsed in full as performance targets not met
Awards of 125% of salary granted during the period in December 2019
Malus and clawback provisions apply for up to two years
Share ownership 200% of salary for all Executive Directors 316% of salary for Ralph Findlay, CEO policy 123% of salary for Andrew Andrea, CFO
Outcomes Fixed
Basic salary, core benefits Variable and pension Annual bonus Long-term incentives Total
2020 £445,365 £0 £0 £445,365Andrew Andrea
2019 £486,061 £0 £01 £468,061 2020 £592,423 £0 £0 £592,423
Ralph Findlay 2019 £722,432 £0 £01 £722,432
1. 11.2% of the 2016/17 LTIP maximum met the performance conditions and were due to vest. However, the Executive Directors waived their rights to this award.
How we performed against our objectives Annual bonus for 2019/20 Performance metric Link to strategy Weighting Threshold Target Maximum Actual % of salary
Underlying Group profit before taxation
These measures reflect the Group’s business priorities
60% £90.0m £93.0m £97.0m £(22.0)m 0%
Free cash flow that underpin our strategy during the year 40% £120.0m £124.0m £130.0m £67.0m 0%
Bonus 0%
LTIP vesting in 2019/20 (2017/18 LTIP Award) On-target Maximum LTIP vesting
Performance metric Link to strategy Weighting Base Threshold 50% vesting 100% vesting Actual % of max
CROCCE These ultimately 40% 10.5% Base +0.25% Base +0.5% Base +1.0% 6.4% 0% Free cash flow determine the success 40% £300m Base +7.5% Base +15.0% Base +30.0% £289.1m 0%
Relative TSR of the Group during the year 20% – Median – Upper quintile
Below median
0%

Marston’s PLC Annual Report and Accounts 2020
64
Annual Report on Remuneration
This part of the Directors’ Remuneration Report sets out how we have implemented our current remuneration policy during the period ended 3 October 2020. Sections in the report not specifically stated as audited are not subject to audit.
Executive Directors Single total figure of remuneration (audited)
Long-term Total fixed Total variable Salary1 Benefits Bonus incentives Pension Total remuneration remuneration
Period ended 3 October 2020 £ £ £ £ £ £ £ £
Andrew Andrea 359,542 13,915 0 0 71,908 445,365 445,365 0 Ralph Findlay 466,785 18,271 0 0 107,367 592,423 592,423 0
1. In the reporting period during the first national lockdown, whilst the Group’s entire pub estate remained closed, those employees who were not furloughed were paid 80% of their base salary, this included Andrew Andrea and his salary was reduced to £308,179 during the period April 2020 to July 2020. Ralph Findlay voluntarily reduced his base salary to £250,000 during the same period; a reduction of 56%. Car allowance payments and pension contributions were reduced by 20% for the same period.
Period ended 28 September 2019 Salary
£ Benefits
£ Bonus
£
Long-term incentives
£ Pension
£ Total
£
Total fixed remuneration
£
Total variable remuneration
£
Andrew Andrea 377,670 14,857 0 0 75,534 468,061 486,061 0 Ralph Findlay 563,900 17,557 0 0 140,975 722,432 722,432 0
Individual elements of remuneration (audited) Fixed elements Base salary, benefits and retirement benefits
Directors’ Remuneration Policy Base salary is a core element of fixed remuneration, reflecting the individual’s role and experience. Base salary is usually reviewed annually by the Committee and fixed for the financial year. Salary increases are reviewed in the context of salary increases across the wider Group.
Executive Directors receive benefits in line with market practice which are set at a level which the Committee considers appropriate against the market.
Executive Directors are eligible to participate in the defined contribution pension scheme and, if a member before closure of the scheme, the defined benefit scheme. In appropriate circumstances, Executive Directors may take a salary supplement instead of contributions into a pension plan.
Increase/ Increase/ Base salary Increase to base Base salary decrease to Pension decrease to
2019/20 salary for 2020/21 benefits for 2019/20 pension for Name £ 2020/21 £ Benefits 2020/211 £ 2020/212
Car allowance, private medical insurance and
Andrew Andrea 385,223 2% 392,927 life assurance (0.6%) 71,908 (2%) Car allowance, private
medical insurance, life assurance and long
Ralph Findlay 575,178 2% 586,681 service payment (0.1%) 107,367 (2%)
1. The percentage increase/decrease to benefits for 2020/21 is calculated based on the change against contractual benefit awards for 2019/20.
2. Pension increase/decrease is presented as a percentage of salary.
Base salary For 2020/21, the basic salary increase for Executive Directors is 2%, which is in line with the average salary increases across the Group.
Benefits During the reporting period, Ralph Findlay completed 25 years’ service with the Group. It is custom and practice within the Marston’s Group to make an annual long service award payment, based on the equivalent of one day’s basic salary entitlement, to be paid in the anniversary month when employment commenced. All employees are eligible to receive this benefit after 25 years’ continuous service. Private medical insurance benefits are unchanged but premiums may vary from year to year.
Retirement benefits The pension figures shown in the single figure table above represent the cash value of pension contributions received by the Executive Directors. This includes any salary supplement in lieu of a Company pension contribution.

Marston’s PLC Annual Report and Accounts 2020G
overnance
65
Pension entitlements: Whilst the current policy permits Executive Directors to receive contributions of up to 20% of base salary under the defined contribution pension scheme, an equivalent taxable cash allowance or a combination of the two, the Committee has given further consideration to shareholder feedback and evolving market practice and has agreed to reduce the pension provision, for incumbent Executive Directors, over a period of time, to 7%. This being the contribution rate available to the majority of employees who participate in the Company’s Group Personal Pension Plan (GPPP). With effect from the 2020/21 financial period, the pension contributions for the incumbent Executive Directors will reduce by 2% to 18% of base salary. The Committee will review the contribution rate again during the 2020/21 financial period with the intention of reducing pension provision for the existing Executive Directors to 7% no later than 2023/24.
• No contributions were made into the GPPP for the defined contribution scheme, on behalf of Andrew Andrea during the year. For the period ended 3 October 2020, Andrew Andrea received a cash supplement of 20% in lieu of pension contributions.
• Ralph Findlay was previously a member of the defined benefit scheme and has opted to no longer accrue future benefits. For the period ended 3 October 2020, Ralph Findlay received a cash supplement of 20% as a salary supplement in lieu of pension contributions.
• For future hires at Executive Director level, pension provision (or cash allowance) will not exceed the pension contributions available to the majority of those employees who participate in the Company’s GPPP; this is currently 7% of salary.
• Ralph Findlay accrued benefits in the defined benefit scheme which closed to future accrual in 2014. Details are shown in the table below:
Accrued pension Accrued pension Normal at 30.09.20 at 30.09.19 retirement
£ £ age
Ralph Findlay 83,624 117,049 60
During the year, Ralph Findlay elected to draw his defined benefit pension before his normal retirement age, with effect from 9 April 2020. Ralph Findlay took a tax-free cash sum of £450,000 and a reduced pension of £83,624 per year, after allowing for cash commutation and a Lifetime Allowance tax charge. His pension before these adjustments was £109,932 per year, which allows for the adjustment due to early retirement. On his death, a spouse’s pension will be payable equal to 60% of the member’s pre-commutation pension.
Variable elements Annual Bonus and Deferred Bonus Plan
Directors’ Remuneration Policy The Annual Bonus Plan rewards performance against annual targets which support the strategic direction of the Group. Compulsory deferral into shares aligns Executive Directors with shareholder interests and provides a retention element.
The usual maximum annual bonus opportunity is 100% of base salary. At least 50% of the award is based on financial performance measures. The balance of the bonus opportunity is based on financial measures and/or the delivery of strategic/individual objectives. Performance measures are determined each year reflecting the business priorities that underpin Group strategy. The Committee has discretion to vary the bonus payout should any formulaic output not reflect the Committee’s assessment of overall business performance or not be appropriate in the context of circumstances that were unexpected or unforeseen at the start of the bonus year. Malus and clawback provisions apply.
Any bonus earned in excess of 40% of the maximum award is usually payable in shares in the Company which will be deferred for a period of three years.
With the exception of a small number of specific operational teams, and below Board members of the PLC Executive Committee, all bonus arrangements within the Group have the same structure and payout mechanism, though the maximum potential award, expressed as a percentage of salary, varies between different employee groups. Payments are calculated based upon achieving or exceeding pre-set targets for both Group profit and FCF. Sales and operations teams have additional elements within their bonus schemes linked to segmental and individual performance.
2019/20 outturn Bonuses to Executive Directors, for the period under review, are based on performance against pre-set targets for both Group profit (60%) and FCF (40%).
As disclosed last year, the Committee reviewed the structure of the annual bonus scheme and determined that going forward (i.e. from 2019/20), up to 20% of maximum would be payable for delivering an appropriately stretching level of threshold performance.
The targets and actual performance for 2019/20 are set out below:
2019/20 Threshold Target Maximum Actual % of salary Opportunity
Underlying Group profit/(loss) before taxation £90.0m £93.0m £97.0m £(22.0)m 0% 60% Free cash flow £120.0m £124.0m £130.0m £67.0m 0% 40% Award 0% 100%

Marston’s PLC Annual Report and Accounts 2020
66
Annual Report on Remuneration continued
2020/21 opportunity The bonus opportunity for the annual bonus scheme for 2020/21 remains at 100% of salary. To reflect the uncertainty surrounding the impact of COVID-19 on current trading conditions, the current pay-out at threshold at 20% will be retained but on-target performance will result in a 40% pay-out, instead of the normal 50% pay-out.
As disclosed in the Annual Statement on pages 60 to 62, the performance measures for the annual bonus have been aligned to the Group’s revised strategy and strategic pillars as shown in the table below.
Strategic pillar Performance measure % weighting for 2020/21
We will Grow Profit before tax (financial) 25% Free cash flow (financial) 30% Successful implementation of the transition period for the Carlsberg joint venture (strategic) 25%
We are Guest Obsessed Guest satisfaction scores (strategic) 10% We Raise the Bar Cost reduction programme (financial) 10%
The Directors consider that the annual bonus targets for 2020/21 financial year are commercially sensitive matters as they provide competitors with insight into our business plans and expectations and therefore, they should remain confidential to the Group until the performance period has ended. The Committee will continue to disclose how the bonus pay-out delivered relates to performance against the targets on a retrospective basis.
Given the continuing uncertainty and the possibility of further national and local lockdowns, it is currently challenging to set targets for performance measures. The Committee will keep these under review and finalise them as soon as possible, with details provided in the 2021 Annual Report and Accounts. When the Committee sets the targets, and assesses performance against these targets in the following year, it will exercise its judgement in the round to ensure that awards are appropriate in the context of all relevant factors.
Any bonus earned in excess of 40% of maximum will be deferred into shares for a period of three years.
Long Term Incentive Plan
Directors’ Remuneration Policy The Long Term Incentive Plan (LTIP) incentivises Executive Directors to deliver against the Group’s strategy over the longer term. Long-term performance targets and share-based remuneration support the creation of sustainable shareholder value.
Awards vest dependent on the achievement of performance targets, normally over a three-year performance period. The normal maximum awards size will be up to 150% of base salary in respect of any financial year. Vested awards are normally subject to an additional holding period of two years before being released to participants. The Committee has discretion to vary the formulaic vesting output where it believes the outcome does not reflect the Committee’s assessment of overall business performance or is not appropriate in the context of circumstances that were unexpected or unforeseen at the date of grant. Malus and clawback provisions apply.
At its discretion, the Committee may award dividend equivalents to reflect dividends that would have been paid on vested awards under the LTIP from the end of the performance period until the date of release.
Vesting in respect of performance during 2019/20 (2017/18 LTIP award) LTIP awards granted in 2017/18 were subject to the achievement of the metrics in the following table. Whilst the formal vesting date is in December 2020, the three-year performance period ended on 3 October 2020 and the Committee have reviewed the outturn for each measure. Each of the three performance measures, CROCCE, FCF and relative TSR, failed to meet threshold performance. Therefore, the award lapsed in full.
Threshold On-target Maximum Vesting Weighting Base at 25% 50% vesting 100% vesting Actual % of max
CROCCE 40% 10.5% Base +0.25% Base +0.5% Base +1.0% 6.4% 0% FCF 40% £300m Base +7.5% Base +15% Base +30% £289.1m 0% Relative TSR 20% – Median – Upper quintile Below median 0%
• CROCCE removes any potential distortions from subjective decisions on depreciation policy and asset revaluation.
• FCF is set as a three-year cumulative amount.
• Relative TSR against the FTSE 250 Index (excluding Investment Trusts), aligns management’s objectives with those of shareholders and is a broad measure of the extent to which Group strategy is considered appropriate by the market as well as the extent to which it is well implemented.
• In addition, the Committee applies a general performance underpin which enables the adjustment of the overall level of vesting, if the formulaic output is not justified on the basis of broader business and financial performance.

Marston’s PLC Annual Report and Accounts 2020G
overnance
67
Granted during 2019/20 LTIP awards granted in December 2019 were as follows:
2019/20 Percentage of
salary Number of shares Face value
at grant1 % of award
vesting at threshold Performance period Holding period
Andrew Andrea 125% 372,124 £481,528 25% Financial periods Financial periods Ralph Findlay 125% 555,620 £718,972 25% 2019/20–2021/22 2022/23–2023/24
1. Calculated using the mid-market share price at date of grant of £1.294.
As reported in the 2019 Annual Statement, changes were made to the performance measures for the LTIP. The detailed performance metrics and targets that apply to the 2019/20 LTIP award are shown below.
Across all of these measures the Committee retains a broad business performance underpin and more general discretion under the plan rules and the policy, to reduce the vesting outcome if it considers that the formulaic outcome is inappropriate.
Weighting Threshold at 25% On-target 50% vesting Maximum 100% vesting
Underlying EPS¹ 40% 12.7p 13.1p 13.9p NCF 40% £100m £125m £150m TSR v FTSE 250 (excluding Investment Trusts) 20% Median – Upper quartile
Straight-line vesting applies between threshold, on-target and maximum performance.
1. During the performance period the implementation of IFRS 16 ‘Leases’ will have an impact, hence EPS targets are lower than the 2019 year figure.
2020/21 awards The Committee intends to grant awards under the LTIP in 2020/21 at the level of 125% of salary. Awards would normally be made annually in December. However, in light of the current economic conditions, and as a result of the global pandemic, setting appropriate targets is challenging. The Committee has agreed to monitor trading conditions together with share price performance over the coming months and delay the grant of options until later in the financial period. The Committee has discretion to amend the vesting outcome where it considers that the formulaic outcome is inappropriate. In particular, the Committee will consider whether there has been any ‘windfall gain’ when determining the vesting outcome, taking into account a number of factors, including:
• Share price performance over the vesting period on an absolute basis and relative basis against peer companies.
• Underlying financial performance of the Group during the performance period.
• The impact of the COVID-19 pandemic and any other significant events during the vesting period on the Group’s share price or the market as a whole.
The Committee expects the award to be made in the period following the interim results announcement. Whilst the Committee expects the performance measures and weightings to be unchanged (40% EPS, 40% NCF and 20% relative TSR), full details will be disclosed in the regulatory news announcement that will be made following the grant of options. In line with our current policy, the Company would consult with shareholders on any significant proposed changes to performance measures.
Non-executive Directors
Directors’ Remuneration Policy Non-executive Directors’ fees are usually reviewed every two years and are set at a level that reflects market conditions and is sufficient to attract individuals with appropriate knowledge and experience. Fees are based on the level of fees paid to Non-executive Directors serving on Boards of similar sized UK listed companies and the time commitment and contribution expected for the role. Non-executive Directors receive a basic fee and an additional fee for further duties (for example, chairmanship of a Committee or Senior Independent Director responsibilities or holding the position of Non-executive Director responsible for employee engagement).
Total remuneration (Chairman and Non-executive Directors) (audited) Committee
Base Fee1 Chairman SID 2019/20 Total 2018/19 Total £ £ £ £ £
Carolyn Bradley 50,400 – 7,000 57,400 61,500 Bridget Lea 50,400 – – 50,400 4,500 Octavia Morley2 36,900 4,663 – 41,563 – Matthew Roberts 50,400 7,000 – 57,400 61,500 William Rucker 166,667 – – 166,667 200,000 Past Directors
Catherine Glickman3 17,049 2,337 – 19,386 61,500
1. In the reporting period during the national lockdown, whilst the Group’s entire pub estate remained closed, those employees who were not furloughed were paid 80% of their base salary. The Non-executive Directors volunteered to reduce their base fee to 80% during the period from April 2020 to July 2020 (to £50,400). The Chairman voluntarily reduced his base fee by 50% for the same period (to £166,667).
2. Octavia Morley was appointed as a Non-executive Director on 1 January 2020, the 2019/20 figures in the table above reflect her remuneration from the date of her appointment.
3. Catherine Glickman stepped down from the Board on 24 January 2020.

Marston’s PLC Annual Report and Accounts 2020
68
Annual Report on Remuneration continued
Fees The Chairman and other Non-executive Directors fees were last reviewed in 2017/18. The Chairman’s fee and Non-executive Director fees were reviewed by the Committee and the Board respectively in October 2020. It was agreed that an increase to fees was not appropriate for 2020/21. The Board will review Non-executive Director fees, and the Committee will review the Chairman’s fees, in October 2021.
Chairman’s fee £200,000 Non-executive Director basic fee £54,000 Additional fee for: Chairmanship of the Audit Committee £7,500 Chairmanship of the Remuneration Committee £7,500 Senior Independent Director £7,500
The maximum authority for Non-executive Directors’ fees (in aggregate), as outlined in our Articles of Association, is £750,000 a year, as approved by shareholders at our 2017 AGM.
Interests in ordinary shares (audited) The beneficial interests of the Non-executive Directors and their connected persons in the share capital of the Company are shown below:
As at 03.10.20 As at 28.09.19 (or, if earlier, date (or, if later, date of
of resignation) appointment)
Carolyn Bradley 25,000 25,000 Bridget Lea 25,000 – Octavia Morley1 25,000 – Matthew Roberts 25,000 25,000 William Rucker 200,000 100,000 Catherine Glickman2 50,000 50,000
1. Octavia Morley was appointed as a Non-executive Director on 1 January 2020.
2. Catherine Glickman stepped down from the Board on 24 January 2020. Her interests in ordinary shares are shown as at that date.
Payments to past Directors and payment for loss of office (audited) No payments were made to past Directors and no payments for loss of office were made during the period.
Total shareholder return chart and CEO remuneration This graph shows the value, at 3 October 2020, of £100 invested in the Company on 2 October 2010 compared to the value of £100 invested in the FTSE All Share Index. The FTSE All Share Index has been selected as a comparator because the Company is a member of that index.
The intermediate points show the value at the intervening financial period ends.
£ Marston’s TSR FTSE All Share TSR
2 October 1 October 29 September 5 October 4 October 3 October 1 October 30 September 29 September 28 September 3 October 2010 2011 2012 2013 2014 2015 2016 2017 2018 2019 2020
50
100
150
200
250
300
350

Marston’s PLC Annual Report and Accounts 2020G
overnance
69
The total remuneration of the CEO over the past ten financial periods is shown below. The annual bonus payout and LTIP vesting level as a percentage of the maximum opportunity is also shown.
Total remuneration
£
Annual bonus
(% of maximum)
LTIP vesting
(% of maximum)
2019/20 592,423 0% 0% 2018/19 722,432 0% 0%1
2017/18 807,665 17.7% 0% 2016/17 803,303 20% 0% 2015/16 1,008,320 40% 21% 2014/15 876,788 40% 0% 2013/14 1,121,294 25% 41.9% 2012/13 937,312 0% 44.2% 2011/12 815,690 40% 0% 2010/11 974,784 46% 0%
1. The performance conditions were achieved at a level such that 11.2% of the 2016/17 LTIP would have vested. However, the Executive Directors waived their rights to this award.
Change in remuneration of Directors and employee pay The table below shows how each Director’s remuneration has changed between the periods ended 3 October 2020 and 28 September 2019. This is then compared to the wider workforce. It was agreed that all employees of the Group should be included in the comparison. Marston’s PLC does not have any direct employees as all employees within the Group are employed by a wholly owned subsidiary company, Marston’s Trading Limited.
Executive Directors Non-executive Directors Wider workforce
Basic salary1 Basic salary was increased by 2% with effect from 1 October 2019.
No changes to fees during the period.
Average employee change to salary (calculated by reference to the mean of employee pay) is 6.4%.
Annual bonus No bonus earned in 2019/20 or prior period. N/A No bonuses were payable in respect of 2019/20, or the prior period, based on Group performance. However, bonuses and other discretionary payments have been earned by a number of employees to recognise individual contributions in respect of first half-year performance, business continuity through the COVID-19 crisis and, support for the completion of the Carlsberg joint venture deal. Further details are set out in the Annual Statement on pages 59–60. A small number of sales employees, within the wider workforce, received bonuses in the prior period.
Taxable benefits2 No changes to benefit policy. N/A No changes to benefit policy.
Andrew Andrea’s benefits decreased by 6.3% and Ralph Findlay’s benefits increased by 4.1%, reflecting receipt of his long service award during the reporting period.
Premiums for private medical insurance premiums may vary from year to year.
Premiums for private medical insurance premiums may vary from year to year.
1. During the period of the first UK lockdown from March until July 2020, whilst 93% of the Group’s workforce was furloughed under the Government’s CJRS, those employees who continued to work to support the business were asked to accept a 20% voluntary reduction in their salary during the period from April to July 2020, with normal salaries paid from August 2020. The CFO and the Non-executive Directors also volunteered to accept the same 20% reduction in their respective salary and fees. The Chairman volunteered a 50% reduction in his fees and the CEO volunteered a 56% reduction in salary over the same period. The majority of pub-based employees have their remuneration rate set by statute rather than the market.
2. The car allowance element of the benefits policy was subject to the 20% voluntary reduction during the period from April to July 2020. Eligibility to receive the individual benefits under the policy may be determined by an employee’s role or length of service, where applicable.
CEO pay ratio This is the first year in which we are required to disclose the ratio of our CEO’s pay to the full-time equivalent remuneration of our UK employees whose remuneration was ranked at the 25th percentile, median (50th percentile) and 75th percentile.
The table below shows how the CEO’s single total figure of remuneration compares with the equivalent figures for UK employees.
25th percentile 75th percentile Year Method pay ratio Median pay ratio pay ratio
2019/20 (reflecting voluntary reduction in salary and benefits) Option B 40:1 37:1 34:1 2019/20 (based on contractual salary and benefits) Option B 48:1 45:1 41:1
We have chosen Option B which uses the hourly rate data from the most recent Gender Pay Gap reporting. This represents the most efficient and robust method to determine the respective pay ratios. To ensure year-on-year methodology and reporting is consistent, we have removed any variances in the total remuneration package for employees sitting at each of the percentiles as, for example, not all employees contribute to a pension scheme or receive a bonus. The Company considers the median pay ratio is consistent with the Group’s wider policies on employee pay, reward and progression. In order to determine the full-time equivalent salary component for the representative employees, the hourly rate was multiplied by 35 hours to calculate the full-time equivalent salary. The calculations for the relevant representative employees were performed as at 5 April 2020. Sensitivity analysis was performed around the 25th, median and 75th percentile employees to ensure that they were reasonably representative.

Marston’s PLC Annual Report and Accounts 2020
70
Annual Report on Remuneration continued
The table below shows the UK employee percentile pay and benefits used to determine the above pay ratios and the salary component for each figure. The CEO remuneration is the single figure of total remuneration for the year ended 3 October 2020 as disclosed on page 64, therefore reflecting Ralph Findlay’s voluntary reduction in salary and benefits during the period from April to July 2020. We have also included, in the table on the previous page, the pay ratio based on Ralph Findlay’s contractual salary and benefits for 2019/20. A substantial proportion of the CEO’s total remuneration is performance-related and delivered in shares. The ratios will therefore depend significantly on the CEO’s annual bonus and long-term incentive outcomes, and may fluctuate year-on-year.
CEO 25th percentile 50th percentile 75th percentile Component £ £ £ £
Base salary 466,785 14,924 15,870 17,290 Total remuneration 592,423 14,924 15,870 17,290
Relative importance of spend on pay The table below demonstrates the relative importance of the Group’s expenditure on total employee pay compared to dividend payments to shareholders.
2019/20 2018/19 % change
Dividend payments1 £30.4m £47.5m (36%) Total employee pay2 £229.5m £237.7m (3.5%)
1. No distributions by way of share buybacks were made to shareholders during the 2019/20 financial year.
2. Excluding non-underlying items.
External appointments for Executive Directors Executive Directors are permitted to take up external appointments, subject to approval by the Board, and are allowed to retain any fees received.
Ralph Findlay is the Senior Independent Director of Vistry Group PLC and during the year he received fees of £70,372. Andrew Andrea is a Non-executive Director of Portmeirion Group Plc and during the year he received fees of £35,313.
Shareholder voting The following table sets out actual voting outcomes in respect of the Directors’ Remuneration Policy resolution and the Annual Report on Remuneration resolution at the Annual General Meeting (AGM) held on 24 January 2020.
Votes for % of vote Votes against % of vote Votes withheld
Approval of the Directors’ Remuneration Policy 89,792,873 86.05% 14,551,016 13.95% 131,691 Approval of the Annual Report on Remuneration 100,094,860 95.92% 4,253,359 4.08% 127,364
Supplementary schedules Shareholding guidelines In order to further align the interests of Executive Directors with those of shareholders, the Committee applies shareholding guidelines. These guidelines provide that each Executive Director is required to hold shares with a value equal to two times salary. To achieve these holdings Directors are required to retain any vested shares from the LTIP, net of tax, until the guidelines are satisfied. Shares subject to vested LTIP awards which are in a holding period count towards this guideline (on a net of assumed tax basis).
Post-employment shareholding requirement Executive Directors are required to retain in their first year post-employment such number of their ‘relevant shares’ as they held at the date of cessation of employment, up to a maximum of the number of shares they were required to hold during employment (for current Executive Directors, two times salary). In their second year post-employment they are required to retain such number of their ‘relevant shares’ up to a maximum of 50% of the shares they were required to hold during employment (for current Executive Directors, one times salary). For these purposes, ‘relevant shares’ exclude any shares purchased by the Executive Director or acquired as a result of a share plan award granted in respect of a financial year before 2019/20.
Directors’ share interests (audited) As at 3 October 2020, Andrew Andrea held in excess of 100% of base salary and Ralph Findlay held in excess of 200% of base salary in shares.
Executive Directors’ share interests as at 3 October 2020 Shares owned outright Share options
Not subject to Subject to Actual % of At 03.10.20 At 28.09.19 performance performance Target % of salary holding
Andrew Andrea 332,773 332,773 0 1,227,657 200% 123% Ralph Findlay 1,290,475 1,290,475 20,224 1,833,022 200% 316%
In assessing the extent to which the guidelines are satisfied, shares are valued at the end of the relevant financial year. Once the required holding has been achieved, any change in the share price is disregarded when assessing the value attributed to shares already held.

Marston’s PLC Annual Report and Accounts 2020G
overnance
71
Executive Directors’ interests in share options as at 3 October 2020 Brought forward Exercised/
Grant date 29.09.19 Granted vested Cancelled/
lapsed Carried forward
03.10.20 Exercise price £ Vesting date Release date
Andrew Andrea LTIP 20171
20183
20194
382,5002
473,033 –
– 372,124
– – –
– – –
382,500 473,033 372,124
2020 2021 2022
2022 2023 2024
Ralph Findlay SAYE
LTIP 2018 20171
20183
20194
20,224 571,1152
706,287 –
– – –
555,620
– – – –
– – – –
20,224 571,115
706,287 555,620
0.89 2021 2020 2021 2022
– 2022 2023 2024
1. The performance conditions applying to the 2017/18 LTIP are set out on pages 66.
2. The awards granted in December 2017 were granted as Approved Performance Share Plan (‘APSP’) awards, with each award comprising the following three elements: (i) a tax advantaged option with an exercise price of £1.21 per share over shares with a total value at the date of grant of £30,000; (ii) a ‘Linked Award’ which is, principally, a funding award in the form of a nil cost option to acquire such number of shares whose value at exercise equals £30,000; and (iii) an LTIP award in the form of a nil cost option over shares to the value of the remainder of the APSP award. The number of shares referred to in the table above is the aggregate of the number of shares subject to the tax advantaged option and the LTIP award; each person was also granted a ‘Linked Award’ over a maximum of 24,793 shares.
3. The performance conditions applying to the 2018/19 LTIP are set out on page 67 of the 2019 Directors’ Remuneration Report.
4. The performance conditions applying to the 2019/20 LTIP are set out on pages 67.
There have been no changes to the Directors’ share interests and interests in share options between 3 October 2020 and 8 December 2020 (being the latest practical date prior to the date of this report).
Service contracts Executive Directors’ contracts are on a rolling 12-month basis and are subject to 12 months notice when terminated by the Group and six months notice when terminated by the Director.
The current Non-executive Directors, including the Chairman, do not have a service contract and their appointments, whilst for a term of three years, may be terminated without compensation at any time. All Non-executive Directors have a letter of appointments, and their appointment and subsequent re-appointment is subject to annual approval by shareholders.
Name Commencement date Unexpired term remaining as at 3 October 2020
Andrew Andrea 31 March 2009 Terminable on 12 months’ notice Ralph Findlay 15 August 2001 Terminable on 12 months’ notice William Rucker 1 October 2018 Fixed term expiring on 30 September 2021 (subject to renewal) and terminable on six months’ notice Carolyn Bradley 1 October 2014 Fixed term expiring on 30 September 2021 (subject to renewal) and terminable on one month’s notice Octavia Morley 1 January 2020 Fixed term expiring on 31 December 2022 (subject to renewal) and terminable on one month’s notice Bridget Lea 1 September 2019 Fixed term expiring on 31 August 2022 (subject to renewal) and terminable on one month’s notice Matthew Roberts 1 March 2017 Fixed term expiring on 28 February 2023 (subject to renewal) and terminable on one month’s notice
Further details on current serving Directors’ service contracts and letters of appointment are available at www.marstons.co.uk in the Investors section.
This report was approved by the Board and signed on its behalf by
Octavia Morley Chairman of the Remuneration Committee
10 December 2020

Marston’s PLC Annual Report and Accounts 2020
72
Directors’ Report
This section contains additional information which the Directors are required by law and regulation to include within the Annual Report and Accounts. This section, along with the information from the Chairman’s Statement on page 8, to the Statement of Directors’ Responsibilities on page 74, constitutes the Directors’ Report in accordance with the Companies Act 2006.
Strategic Report The Company is required by the Companies Act to include a Strategic Report in this document. The information that fulfils the requirements of the Strategic Report can be found on pages 2 to 43, which is incorporated in this report by reference.
Corporate Governance Statement The Corporate Governance Statement, as required by the Financial Conduct Authority’s Disclosure Guidance and Transparency Rules (DTR) 7.2.1, is set out on page 45 and is incorporated into this report by reference.
Dividends As announced in May 2020, due to the global pandemic, the Board believes it is prudent to plan for no dividends for financial year 2020, therefore no dividends were or will be paid. Future dividends will be reviewed when normalised trading resumes.
Directors Biographies of the Directors currently serving on the Board are set out on pages 46 and 47. Changes to the Board during the period are set out in the Corporate Governance Report starting on page 45. Details of Directors’ service contracts are set out in the Directors’ Remuneration Report on page 71 and their shareholdings are set out on pages 69 and 71.
With regard to the appointment and replacement of Directors, the Company is governed by its Articles of Association, the UK Corporate Governance Code, the Companies Act 2006 and related legislation. The Articles may be amended by special resolution of the shareholders. In accordance with the requirements of the UK Corporate Governance Code, all Directors will offer themselves for re-election at the AGM on 27 January 2021.
Directors’ shareholdings The interests of Directors and their connected persons in the shares of the Company are set out on pages 69 and 71 of the Directors’ Remuneration Report.
Directors’ indemnities and insurance The Company maintains Directors’ and Officers’ Liability Insurance in respect of legal action that might be brought against its Directors and Officers. In accordance with the Company’s Articles of Association and to the extent permitted by law, the Company has indemnified each of its Directors and other Officers of the Group against certain liabilities that may be incurred as a result of their position within the Group. These indemnities were in place for the whole of the period ended 3 October 2020 and as at the date of the report. There are no indemnities in place for the benefit of the Auditor.
Directors’ powers Under the Articles of Association, the Directors have authority to allot ordinary shares subject to the aggregate set at the 2020 Annual General Meeting (AGM). The Company was also given authority at its 2020 AGM to make market purchases of ordinary shares up to a maximum number of 63,402,958 shares. Similar authority will again be sought from shareholders at the 2021 AGM. The powers of the Directors are further described in the Corporate Governance Report on pages 45 to 55.
Share capital and shareholder voting rights Details of the Company’s issued share capital and of the movements during the period are shown in note 29 to the financial statements on page 124. The Company has one class of ordinary shares and one class of preference shares. On a poll vote, ordinary and preference shareholders have one vote for every 25 pence of nominal value of ordinary and preference share capital held in relation to all circumstances at general meetings of the Company. The issued nominal value of the ordinary shares and preference shares is 100% of the total issued nominal value of all share capital.
There are no specific restrictions on the size of a holding nor on the transfer of shares, which are both governed by the general provisions of the Articles of Association and prevailing legislation. The Directors are not aware of any agreements between holders of the Company’s shares that may result in restrictions on the transfer of securities or on voting rights.
Details of employee share schemes are set out in note 29 to the financial statements on pages 124. Where shares are held on behalf of the Company’s share schemes, the trustees have waived their right to vote and to dividends.
No person has any special rights of control over the Company’s share capital and all issued shares are fully paid.
Significant shareholders Notifications of the following voting interests in the Company’s ordinary share capital have been received by the Company (in accordance with Chapter 5 of the DTR). The information shown below was correct at the time of disclosure. However, the date received may not have been within the current financial reporting period and the percentages shown (as provided at the time of disclosure) have not been re-calculated based on the issued share capital at the period end. It should also be noted that these holdings may have changed since the Company was notified, however, notification of any change is not required until the next notifiable threshold is crossed.
No further notifications have been received by the Company between 3 October 2020 and 8 December 2020 (being the latest practical date prior to the date of this report).
Ordinary shares of 7.375 pence each As at 3 October
2020 % of Nature of Shareholder Voting rights voting rights interest
Dimensional Fund Advisors LLP 9,339,455 4.98% Indirect The Capital Group Companies, Inc 9,291,379 4.97% Indirect Standard Life Aberdeen plc 9,228,860 4.93% Indirect Brewin Dolphin 8,392,337 4.94% Indirect Royal London Asset Management Limited 6,794,023 3.99% Direct
The Company also discloses the following information, obtained from the Register of Members, for the preference shares:
Preference shares % of
preference Shareholder Number share voting rights
Fiske Nominees Ltd 31,548 42.06% Mrs HM Medlock 10,407 13.88% George Mary Allison Ltd 5,500 7.33% Mr PF and Dr K Knowles 4,356 5.81% Mr N Aston and Mr TA Southall 2,855 3.81% CGWL Nominees Limited 2,805 3.74% Mrs H Michels 2,750 3.67% Mr R Somerville 2,750 3.67% Canaccord Nominees Limited 2,500 3.33%

Marston’s PLC Annual Report and Accounts 2020G
overnance
73
Change of control There are a number of agreements that take effect after, or terminate upon, a change of control of the Company, such as commercial contracts, bank loan agreements, property lease arrangements and employee share plans. None of these are considered to be significant in terms of their likely impact on the business as a whole. Furthermore, the Directors are not aware of any agreements between the Company and its Directors or employees that provide for compensation for loss of office or employment that occurs because of a takeover bid.
Employee information The average number of employees within the Group is shown in note 5 to the financial statements on page 100.
Marston’s is a responsible employer committed to building a diverse culture where our teams and guests feel welcome, supported and included for who they are. We aim to ensure this commitment is reflected in how we attract talent, how we nurture and develop people internally, and how we ensure our guests have the best experience. We do not discriminate in any way, ensuring that training, career development and promotion opportunities are available to all employees irrespective of gender, race, age or disability.
We are committed to keeping employees up to date on business performance and our strategy, helping them to understand the part they can play in building a successful business. This ensures our people are both engaged and enabled, having both the desire and the ability to make a difference. We do this in a variety of ways through centralised communications, as well as leader and manager-led engagement.
Human rights Marston’s is committed to respecting and upholding human rights, as expressed in the United Nations Universal Declaration of Human Rights, within our business and also within our supply chain. Our Ways of Working are aligned with our belief of, and commitment to, the Declaration of Human Rights. Our Human Rights policy is available at www.marstons.co.uk/responsibility
Modern Slavery Statement Our Modern Slavery Act disclosure is available on our website www.marstons.co.uk/responsibility and more details can be found on page 38.
Research and development Our category and insights team work with external data providers including CGA for on-trade sales and market data; IRI for on-trade data; as well as the BBPA, Kantar and IGD. We undertake in-house consumer research as well as customer satisfaction studies. We provide an ongoing review of key sector trends to customers and stakeholders as well as recommendations to grow beer sales.
Greenhouse gas emissions, energy consumption and energy efficient action One of our key priorities is to reduce our environmental impact. We recognise the importance of this to the long-term profitability of the business and operating a high quality estate. Many of the environmental initiatives we adopt reduce our environmental impact as well as saving expenditure on energy and utilities. More details on how we are reducing our environmental impact can be found on page 40 in our Strategic Report.
Political donations Our policy is not to make any donations for political purposes in the UK or to donate to EU political parties or incur EU political expenditure.
Financial instruments The disclosures required in relation to the use of financial instruments by the Group together with details of our treasury policy and management are set out in note 25 to the financial statements on pages 116 to 122.
Auditor KPMG LLP have indicated their willingness to continue as Auditor and their re-appointment has been approved by the Audit Committee. Resolutions to re-appoint them and to authorise the Audit Committee to determine their remuneration will be proposed at the 2021 AGM.
Going concern The Group’s business activities, together with the factors likely to affect its future development, performance and position are set out in the Strategic Report. The financial position of the Group is described on pages 18 to 20. In addition, note 25 to the financial statements on pages 116 to 122 includes the Group’s objectives, policies and processes for managing its exposures to interest rate risk, foreign currency risk, counterparty risk, credit risk and liquidity risk. Details of the Group’s financial instruments and hedging activities are also provided in note 25.
The impact of COVID-19 has necessitated greater focus and scrutiny of the current and projected financial position of the Group. This includes the modelling of various scenarios to test the resilience of the business to the ongoing impact of COVID-19. Further details are set out in note 1 to the financial statements on page 90. The Directors are satisfied that the Group has sufficient liquidity to withstand the downside scenarios and therefore adequate resources to continue in operational existence for the foreseeable future. The Group continues to have regular dialogue with its financiers and it is possible that further covenant amendments may be required. Whilst there is no certainty that these amendments will be granted (this has been disclosed as a material uncertainty in the financial statements), given our experiences to date the Directors are confident of securing these where necessary. Accordingly, the financial statements set out on pages 84 to13 and 132 to 144 have been prepared on the going concern basis.
Annual General Meeting The AGM of the Company will be held at on 27 January 2021 at Marston’s Talent Academy, Summerfield Road, Wolverhampton WV1 4PR. In light of COVID-19 and the current restrictions in place, this year’s AGM is planned to be held as a closed meeting. Whilst not being permitted to attend in person, shareholders are encouraged to submit their proxy voting instructions and any questions in advance of the meeting. Further details can be found in the notice convening the meeting. The notice, together with details of the special business to be considered and explanatory notes for each resolution, is distributed separately to shareholders. It is also available in the shareholder section of our website at www.marstons.co.uk/investors where a copy can be viewed and downloaded.
By order of the Board
Anne-Marie Brennan Group Secretary
10 December 2020
Company registration number: 31461

Marston’s PLC Annual Report and Accounts 2020
74
Statement of Directors’ Responsibilities in respect of the Annual Report and the Financial Statements The Directors are responsible for preparing the Annual Report and the Group and parent Company financial statements in accordance with applicable law and regulations.
Company law requires the Directors to prepare Group and parent Company financial statements for each financial year. Under that law they are required to prepare the Group financial statements in accordance with International Financial Reporting Standards as adopted by the European Union (IFRS as adopted by the EU) and applicable law and have elected to prepare the parent Company financial statements in accordance with UK accounting standards, including FRS 102 ‘The Financial Reporting Standard applicable in the UK and Republic of Ireland’.
Under company law the Directors must not approve the financial statements unless they are satisfied that they give a true and fair view of the state of affairs of the Group and parent Company and of their profit or loss for that period. In preparing each of the Group and parent Company financial statements, the Directors are required to:
• select suitable accounting policies and then apply them consistently;
• make judgements and estimates that are reasonable, relevant, reliable and prudent;
• for the Group financial statements, state whether they have been prepared in accordance with IFRS as adopted by the EU;
• for the parent Company financial statements, state whether applicable UK accounting standards have been followed, subject to any material departures disclosed and explained in the parent Company financial statements;
• assess the Group and parent Company’s ability to continue as a going concern, disclosing, as applicable, matters related to going concern;
• and use the going concern basis of accounting unless they either intend to liquidate the Group or the parent Company or to cease operations, or have no realistic alternative but to do so.
The Directors are responsible for keeping adequate accounting records that are sufficient to show and explain the parent Company’s transactions and disclose with reasonable accuracy at any time the financial position of the parent Company and enable them to ensure that its financial statements comply with the Companies Act 2006. They are responsible for such internal control as they determine is necessary to enable the preparation of financial statements that are free from material misstatement, whether due to fraud or error, and have general responsibility for taking such steps as are reasonably open to them to safeguard the assets of the Group and to prevent and detect fraud and other irregularities.
Under applicable law and regulations, the Directors are also responsible for preparing a Strategic Report, Directors’ Report, Directors’ Remuneration Report and Corporate Governance Statement that complies with that law and those regulations.
The Directors are responsible for the maintenance and integrity of the corporate and financial information included on the Company’s website. Legislation in the UK governing the preparation and dissemination of financial statements may differ from legislation in other jurisdictions.
Responsibility statement of the Directors We confirm that to the best of our knowledge:
• the financial statements, prepared in accordance with the applicable set of accounting standards, give a true and fair view of the assets, liabilities, financial position and profit or loss of the Company and the undertakings included in the consolidation taken as a whole; and
• the Strategic Report/Directors’ Report includes a fair review of the development and performance of the business and the position of the issuer and the undertakings included in the consolidation taken as a whole, together with a description of the principal risks and uncertainties that they face.
We consider the Annual Report and Accounts, taken as a whole, is fair, balanced and understandable and provides the information necessary for shareholders to assess the Group’s position and performance, business model and strategy.
Disclosure of information to Auditor The Directors who held office at the date of approval of this Directors’ Report confirm that, so far as they are each aware, there is no relevant audit information of which the Company’s Auditor is unaware; and each Director has taken all the steps that they ought to have taken as a Director to make themself aware of any relevant audit information and to establish that the Company’s Auditor is aware of that information.
Ralph Findlay Andrew Andrea Chief Executive Officer Chief Financial and
Corporate Development Officer
10 December 2020

Independent Auditor’s Report 76 Group Accounts 84 Notes to the Group Accounts 89 Company Accounts 132 Notes to the Company Accounts 134
Financial Statements
75Marston s PLC Annual Report and Accounts 2020
’

Marston’s PLC Annual Report and Accounts 2020
76
Independent Auditor’s report to the members of Marston’s PLC
Independent Auditor’s report to the members of Marston’s PLC 1. Our opinion is unmodified
We have audited the financial statements of Marston’s PLC (“the Company”) for the 53 week period ended 3 October 2020 which comprise the Group Income Statement, Group Statement of Comprehensive Income, Group Cash Flow Statement, Group Balance Sheet, Group Statement of Changes in Equity, Company Balance Sheet, Company Statement of Changes in Equity and the related notes, including the accounting policies in note 1 to both the Group and parent Company financial statements.
In our opinion: • the financial statements give a true and fair view of the state of the Group’s
and of the parent Company’s affairs as at 3 October 2020 and of the Group’s loss for the period then ended;
• the Group financial statements have been properly prepared in accordance with International Financial Reporting Standards as adopted by the European Union;
• the parent Company financial statements have been properly prepared in accordance with UK accounting standards, including FRS 102 The Financial Reporting Standard applicable in the UK and Republic of Ireland; and
• the financial statements have been prepared in accordance with the requirements of the Companies Act 2006 and, as regards the Group financial statements, Article 4 of the IAS Regulation.
Basis for opinion We conducted our audit in accordance with International Standards on Auditing (UK) (“ISAs (UK)”) and applicable law. Our responsibilities are described below. We believe that the audit evidence we have obtained is a sufficient and appropriate basis for our opinion. Our audit opinion is consistent with our report to the Audit Committee.
We were first appointed as auditor by the shareholders on 24 January 2020. The period of total uninterrupted engagement is for the one financial year ended 3 October 2020. We have fulfilled our ethical responsibilities under, and we remain independent of the Group in accordance with, UK ethical requirements including the FRC Ethical Standard as applied to listed public interest entities. No non-audit services prohibited by that standard were provided.
Overview Materiality: Group financial statements as a whole
£10 million 0.4% of Group total assets
Coverage 100% of Group total assets
Key audit matters vs 2019 Recurring risks Valuation of t
Valuation of
he estate p
derivative financial instruments p
Event driven Going concern p
The impact of uncertainties due to the UK exiting the European Union on our audit
tu
Carrying amount of goodwill in relation to the Pubs and Bars cash generating unit p

Marston’s PLC Annual Report and Accounts 2020Financial Statem
ents
77
2. Material uncertainty related to going concern The risk Our response
Going Concern
We draw attention to note 1 to the financial statements which indicates that the Group’s and the parent Company’s ability to continue as a going concern is dependent on the ability to achieve further covenant waivers and amendments if required.
These events and conditions, along with the other matters explained in note 1, constitute a material uncertainty that may cast significant doubt on the Group’s and the parent Company’s ability to continue as a going concern.
Our opinion is not modified in respect of this matter.
Disclosure quality
There is judgement involved in the Directors’ conclusion that risks and circumstances described in note 1 to the financial statements represent a material uncertainty over the ability of the Group and the parent Company to continue as a going concern for a period of at least a year from the date of approval of the financial statements.
Clear and full disclosure of the facts and the Directors’ rationale for the use of the going concern basis of preparation, including that there is a related material uncertainty, is a key financial statement disclosure and so was the focus of our audit in this area. Auditing standards require that to be reported as a key audit matter
Our procedures included:
Assessing transparency:
We assessed the completeness and accuracy of the matters covered in the going concern disclosure by:
• Evaluating how the Group’s risk assessment process identifies business risks relating to events and conditions that may cast significant doubt on the ability of the Group and of the parent Company to continue as a going concern;
• Evaluating the cash flow forecast models the Group used in its assessment and evaluating how the information system captures events and conditions that may cast significant doubt on ability to continue as a going concern;
• Evaluating whether the Group’s assessment has failed to identify all the events or conditions that may cast significant doubt on going concern and whether the method used by the Group is appropriate;
• Assessing the reasonableness of the Group’s budgets/forecasts and evaluating whether key assumptions used in its forecasts are within a reasonable range, and assessing the plausible but severe downside scenarios particularly whether those downside scenarios reflect plausible impacts of COVID-19 on the business;
• Evaluating whether sufficient and appropriate audit evidence has been obtained to conclude whether a material uncertainty exists and the appropriateness of the Directors’ use (or otherwise) of the going concern basis of accounting;
• Evaluating whether there is adequate support for the assumptions underlying the Directors’ assessment, including mitigations, whether they are realistic and achievable and consistent with the external and/or internal environment and other matters identified in the audit;
• Assessing the forecast cash position and the available committed facilities to understand the financial resources available to the Group during the forecast period; and
• Evaluating the Directors’ assessment of the Group’s ability to comply with its covenants during the forecast period.
Our results
• We found the disclosure of the material uncertainty to be acceptable.
We are required to report to you if the Directors’ going concern statement under the Listing Rules set out on page 73 is materially inconsistent with our audit knowledge. We have nothing to report in this respect.

Marston’s PLC Annual Report and Accounts 2020
78
Independent Auditor’s report to the members of Marston’s PLC continued 3. Other key audit matters: including our assessment of risks of material misstatement
Key audit matters are those matters that, in our professional judgement, were of most significance in the audit of the financial statements and include the most significant assessed risks of material misstatement (whether or not due to fraud) identified by us, including those which had the greatest effect on: the overall audit strategy; the allocation of resources in the audit; and directing the efforts of the engagement team. Going concern is a significant key audit matter and is described in section 2 of our report. We summarise below the other key audit matters in arriving at our audit opinion above, together with our key audit procedures to address those matters and, as required for public interest entities, our results from those procedures. These matters were addressed, and our results are based on procedures undertaken, in the context of, and solely for the purpose of,our audit of the financial statements as a whole, and in forming our opinion thereon, and consequently are incidental to that opinion, and we do not provide a separate opinion on these matters.
The risk Our response
The impact of uncertainties due to the UK exiting the European Union on our audit
Refer to page 26 (principal risks)
Unprecedented levels of uncertainty
All audits assess and challenge the reasonableness of estimates, in particular as described in the valuation of the estate and the carrying amount of goodwill in relation to the Pubs and Bars cash generating unit below, and related disclosures and the appropriateness of the going concern basis of preparation of the financial statements (see above). All of these depend on assessments of the future economic environment and the Group’s future prospects and performance.
In addition, we are required to consider the other information presented in the Annual Report and Accounts including the principal risks disclosure and the Viability Statement and to consider the Directors’ statement that the Annual Report and Accounts taken as a whole is fair, balanced and understandable and provides the information necessary for shareholders to assess the Group’s position and performance, business model and strategy.
Brexit is one of the most significant economic events for the UK and its effects are subject to unprecedented levels of uncertainty of consequences, with the full range of possible effects unknown.
We developed a standardised firm-wide approach to the consideration of the uncertainties arising from Brexit in planning and performing our audits. Our procedures included:
• Our Brexit knowledge: We considered the Directors’ assessment of Brexit-related sources of risk for the Group’s business and financial resources compared with our own understanding of the risks. We considered the Directors’ plans to take action to mitigate the risks;
• Sensitivity analysis: When addressing the valuation of the estate and the carrying amount of goodwill in relation to the pubs and bars cash generating unit and other areas that depend on forecasts, we compared the Directors’ analysis to our assessment of the full range of reasonably possible scenarios resulting from Brexit uncertainty and, where forecast cash flows are required to be discounted, considered adjustments to discount rates for the level of remaining uncertainty; and
• Assessing transparency: As well as assessing individual disclosures as part of our procedures on the valuation of the estate and the carrying amount of goodwill in relation to the Pubs and Bars cash generating unit, we considered all of the Brexit related disclosures together, including those in the strategic report, comparing the overall picture against our understanding of the risks.
Our results
• As reported under the valuation of the estate and the carrying amount of goodwill in relation to the Pubs and Bars cash generating unit, we found the resulting estimates and related disclosures of estimation uncertainty and disclosures in relation to going concern to be acceptable. However, no audit should be expected to predict the unknowable factors or all possible future implications for a company and this is particularly the case in relation to Brexit.

Marston’s PLC Annual Report and Accounts 2020Financial Statem
ents
79
3. Other key audit matters: including our assessment of risks of material misstatement (continued) The risk Our response
Valuation of the estate
(Group –£1,625.5 million; 2019: £2,003.6 million
Revaluation: £243.9 million; 2019: £59.0 million)
(Parent Company – £266.1 million; 2019: 320.6 million
Revaluation: £47.3 million; 2019: £10.3 million)
Group –Refer to page 58 (Audit Committee Report), page 92 (accounting policy) and note 12 on pages 106 to 108 (financial disclosures).
Parent Company –Refer to page 58 (Audit Committee Report), page 135 (accounting policy) and note 5 on pages 137 to 138 (financial disclosures).
Subjective valuation
The valuation of the Group’s and the parent Company’s estate, specifically the freehold land & buildings and ‘effective freehold’ leasehold properties held at fair value is a key area of estimation.
The valuation involves the determination of estimates, most notably the fair maintainable trade (FMT) and applicable trading multiples.
These estimations are inherently subjective and small changes in the assumptions used to value the Group’s and the parent Company’s estate could have a significant effect on the financial position of the Group and the parent Company.
The effect of these matters is that, as part of our risk assessment, we determined that the valuation of the estate has a high degree of estimation uncertainty, with a potential range of reasonable outcomes many times greater than our materiality for the financial statements as a whole. The financial statements (note 12) disclose the sensitivity estimated by the Group.
Our procedures included:
• Assessing valuation approach: We critically assessed the Directors’ valuation and methodology used to check whether it was performed in accordance with the relevant accounting standards;
• Assessing triggers for impairment: We assessed the appropriateness and completeness of impairment triggers identified;
• Benchmarking assumptions: We challenged the key assumptions, being the FMT and applicable trading multiples, for a sample of properties by making a comparison to market comparable data;
• Independent reperformance: We re-performed estate valuations with our own models, with assistance from our own KPMG valuation specialists;
• Assessing inputs: We checked observable inputs used for a sample of assets in the valuation to source documentation;
• Assessing outputs: We evaluated the output of the valuations and considered whether a material uncertainty exists due to the COVID-19 pandemic; and
• Assessing disclosures: We critically assessed the adequacy of the Group’s disclosures in relation to the valuation of the estate.
Our results
• We found the valuation of the estate to be acceptable.

Marston’s PLC Annual Report and Accounts 2020
80
Independent Auditor’s report to the members of Marston’s PLC continued 3. Other key audit matters: including our assessment of risks of material misstatement (continued)
The risk Our response
Carrying amount of goodwill in relation to the Pubs and Bars cash generating unit
(Carrying value: £nil; 2019: £200.6 million
Impairment: £200.6 million; 2019: £nil million)
Refer to page 58 (Audit Committee Report), page 91 (accounting policy) and note 10 on page104 (financial disclosures).
Subjective estimate
The recoverability of goodwill and other assets in the Pubs and Bars cash generating unit (CGU) is assessed using forecast financial information within a discounted cash flow model (“the model”).
Whilst there has historically been significant headroom, there are inherent uncertainties involved in forecasting and discounting future cash flows which have been heightened in the wake of COVID-19.
Relatively small changes in the key assumptions used in the model give rise to material changes in the assessment of the carrying value of the assets in relation to this CGU and therefore the amount of the impairment loss to recognise.
The effect of these matters is that, as part of our risk assessment, we determined that the value in use of the assets in relation to this CGU have a high degree of estimation uncertainty, with a potential range of reasonable outcomes many times greater than our materiality for the financial statements as a whole.
Our procedures included:
• Benchmarking assumptions: We compared the Group’s assumptions to externally derived data in relation to projected growth and discount rates used in the model;
• Our sector experience: We evaluated the appropriateness of underlying assumptions in determining the cash flows used in the model including considering the appropriateness of the growth assumption applied and challenging the Group where future cash flows do not reflect known or probable changes in the business environment;
• We challenged, assisted by our own KPMG valuation specialists, the key inputs used in the calculation of the discount rate used in the model by comparing it against external data sources and comparator group data;
• Sensitivity analysis: We performed our own sensitivity analysis on the assumptions noted above; and
• Assessing transparency: We assessed the Group’s disclosures in relation to the key assumptions in determining the valuation of goodwill in relation to the Pubs and Bars CGU.
Our results
• We found the carrying amount of goodwill in relation to the Pubs and Bars CGU to be acceptable.
Valuation of derivative financial instruments
(£224.4 million; 2019: £235.5 million)
Refer to page 58 (Audit Committee Report), page 94 (accounting policy) and note 25 on pages 116 to 122 (financial disclosures).
Subjective estimate
The Group uses interest rate swaps to manage exposure to interest rate risk. The valuation of these instruments is subjective and requires significant estimation, particularly in relation to the determination of the credit risk adjustment.
The level 2 fair value of these interest rate swaps is also volatile and small changes in the inputs used for the valuation, notably the discount rate and credit risk adjustment, could have a significant effect on the amounts recorded for these financial instruments.
The effect of these matters is that, as part of our risk assessment, we determined that the valuation of financial instruments has a high degree of estimation uncertainty, with a potential range of reasonable outcomes greater than our materiality for the financial statements as a whole.
Our procedures included:
• Third party confirmations: We obtained third party confirmations for the market value of the interest rate swaps;
• Specialist valuation assessments: We independently checked the value of the interest rate swaps, utilising our own KPMG valuation specialists, including the valuation of the credit risk adjustment required; and
• Assessing disclosures: We critically assessed the adequacy of the Group’s disclosures in relation to the valuation of financial instruments.
Our results
• We found the valuation of derivative financial instruments to be acceptable.

Marston’s PLC Annual Report and Accounts 2020Financial Statem
ents
81
4. Our application of materiality and an overview of the scope of our audit
Materiality for the Group financial statements as a whole was set at £10 million, determined with reference to a benchmark of Group total assets of £2,531.9 million of which it represents 0.4%.
In addition, we applied materiality of £3.4 million, to specific Group income statement items which may be of specific interest to users and that could reasonably be expected to influence the Company’s members’ assessment of the financial performance of the Group. These items comprise revenue, raw materials and employee costs. Materiality for these items was determined with reference to underlying profit before tax from continuing operations, normalised by averaging over the last four years due to volatility in the results as a consequence of COVID-19.
Materiality for the parent Company financial statements as a whole was set at £8.25 million, determined with reference to a benchmark of parent Company total assets of £1,359.5 million, of which it represents 0.6%
We agreed to report to the Audit Committee any corrected or uncorrected identified misstatements exceeding £0.4 million, in addition to other identified misstatements that warranted reporting on qualitative grounds.
The Group team performed the audit of the Group as a single aggregated set of financial information. The audit was performed using the materiality levels set out above. The audit of the parent Company was also performed by the Group team.
Group total assets Group Materiality £10 million £10 million
Total Assets Group materiality
£10 million Whole financial statements materiality
£7.5 million Materiality determined for designing our procedures to respond to aggregation risk from individually immaterial misstatements
£0.4 million Misstatements reported to the audit committee
Group revenue Group profit before tax
100%
100
100%
100
Group total assets
100%
100
Full scope for Group audit purposes 2020

82 Marston’s PLC Annual Report and Accounts 2020
Independent Auditor’s report to the members of Marston’s PLC continued 5. We have nothing to report on the other
information in the Annual Report and Accounts
The Directors are responsible for the other information presented in the Annual Report and Accounts together with the financial statements. Our opinion on the financial statements does not cover the other information and, accordingly, we do not express an audit opinion or, except as explicitly stated below, any form of assurance conclusion thereon.
Our responsibility is to read the other information and, in doing so, consider whether, based on our financial statements audit work, the information therein is materially misstated or inconsistent with the financial statements or our audit knowledge. Based solely on that work we have not identified material misstatements in the other information.
Strategic Report and Directors’ report Based solely on our work on the other information:
• we have not identified material misstatements in the Strategic report and the Directors’ report;
• in our opinion the information given in those reports for the financial year is consistent with the financial statements; and
• in our opinion those reports have been prepared in accordance with the Companies Act 2006.
Directors’ Remuneration Report In our opinion the part of the Directors’ Remuneration Report to be audited has been properly prepared in accordance with the Companies Act 2006.
Disclosures of emerging and principal risks and longer‑term viability Based on the knowledge we acquired during our financial statements audit, other than the material uncertainty related to going concern referred to above, we have nothing further material to add or draw attention to in relation to:
• the Directors’ confirmation within the Viability Statement (page 29) that they have carried out a robust assessment of the emerging and principal risks facing the Group, including those that would threaten its business model, future performance, solvency and liquidity;
• the Principal Risks disclosures describing these risks and explaining how they are being managed and mitigated; and
• the Directors’ explanation in the Viability Statement of how they have assessed the prospects of the Group, over what period they have done so and why they considered that period to be appropriate, and their statement as to whether they have a reasonable expectation that the Group will be able to continue in operation and meet its liabilities as they fall due over the period of their assessment, including any related disclosures drawing attention to any necessary qualifications or assumptions.
Under the Listing Rules we are required to review the Viability Statement. We have nothing to report in this respect.
Our work is limited to assessing these matters in the context of only the knowledge acquired during our financial statements audit. As we cannot predict all future events or conditions and as subsequent events may result in outcomes that are inconsistent with judgements that were reasonable at the time they were made, the absence of anything to report on these statements is not a guarantee as to the Group’s and the parent Company’s longer-term viability.
Corporate governance disclosures We are required to report to you if:
• we have identified material inconsistencies between the knowledge we acquired during our financial statements audit and the Directors’ statement that they consider that the Annual report and financial statements taken as a whole is fair, balanced and understandable and provides the information necessary for shareholders to assess the Group’s position and performance, business model and strategy; or
• the section of the Annual Report and Accounts describing the work of the Audit Committee does not appropriately address matters communicated by us to the Audit Committee.
We are required to report to you if the Corporate Governance Statement does not properly disclose a departure from the provisions of the UK Corporate Governance Code specified by the Listing Rules for our review.
We have nothing to report in these respects.
6. We have nothing to report on the other matters on which we are required to report by exception
Under the Companies Act 2006, we are required to report to you if, in our opinion:
• adequate accounting records have not been kept by the parent Company, or returns adequate for our audit have not been received from branches not visited by us; or
• the parent Company financial statements and the part of the Directors’ Remuneration Report to be audited are not in agreement with the accounting records and returns; or
• certain disclosures of Directors’ remuneration specified by law are not made; or
• we have not received all the information and explanations we require for our audit.
We have nothing to report in these respects.

83 Marston’s PLC Annual Report and Accounts 2020Financial Statem
ents
7. Respective responsibilities
Directors’ responsibilities As explained more fully in their statement set out on page 74, the Directors are responsible for: the preparation of the financial statements including being satisfied that they give a true and fair view; such internal control as they determine is necessary to enable the preparation of financial statements that are free from material misstatement, whether due to fraud or error; assessing the Group and the parent Company’s ability to continue as a going concern, disclosing, as applicable, matters related to going concern; and using the going concern basis of accounting unless they either intend to liquidate the Group or the parent Company or to cease operations, or have no realistic alternative but to do so.
Auditor’s responsibilities Our objectives are to obtain reasonable assurance about whether the financial statements as a whole are free from material misstatement, whether due to fraud or other irregularities (see below), or error, and to issue our opinion in an auditor’s report. Reasonable assurance is a high level of assurance, but does not guarantee that an audit conducted in accordance with ISAs (UK) will always detect a material misstatement when it exists. Misstatements can arise from fraud, other irregularities or error and are considered material if, individually or in aggregate, they could reasonably be expected to influence the economic decisions of users taken on the basis of the financial statements.
A fuller description of our responsibilities is provided on the FRC’s website at www.frc.org.uk/auditorsresponsibilities.
Irregularities –ability to detect We identified areas of laws and regulations that could reasonably be expected to have a material effect on the financial statements from our general commercial and sector experience, through discussion with the Directors and other management (as required by auditing standards), inspection of the Group’s regulatory and legal correspondence and discussed with the Directors and other management the policies and procedures regarding compliance with laws and regulations. We communicated identified laws and regulations throughout our team and remained alert to any indications of non-compliance throughout the audit. The potential effect of these laws and regulations on the financial statements varies considerably.
Firstly, the Group is subject to laws and regulations that directly affect the financial statements including financial reporting legislation (including related companies legislation), distributable profits legislation and taxation legislation and we assessed the extent of compliance with these laws and regulations as part of our procedures on the related financial statement items.
7. Respective responsibilities (continued)
Secondly, the Group is subject to many other laws and regulations where the consequences of non-compliance could have a material effect on amounts or disclosures in the financial statements, for instance through the imposition of fines or litigation. We identified the following areas as those most likely to have such an effect: food safety, health and safety, employment laws, GDPR and environmental laws and regulations recognising the nature of the Group’s activities. Auditing standards limit the required audit procedures to identify non-compliance with these laws and regulations to enquiry of the Directors and other management and inspection of regulatory and legal correspondence, if any. These limited procedures did not identify actual or suspected non-compliance.
Owing to the inherent limitations of an audit, there is an unavoidable risk that we may not have detected some material misstatements in the financial statements, even though we have properly planned and performed our audit in accordance with auditing standards. For example, the further removed non-compliance with laws and regulations (irregularities) is from the events and transactions reflected in the financial statements, the less likely the inherently limited procedures required by auditing standards would identify it. In addition, as with any audit, there remained a higher risk of non-detection of irregularities, as these may involve collusion, forgery, intentional omissions, misrepresentations, or the override of internal controls. We are not responsible for preventing non-compliance and cannot be expected to detect non-compliance with all laws and regulations.
8. The purpose of our audit work and to whom we owe our responsibilities
This report is made solely to the Company’s members, as a body, in accordance with Chapter 3 of Part 16 of the Companies Act 2006. Our audit work has been undertaken so that we might state to the Company’s members those matters we are required to state to them in an auditor’s report and for no other purpose. To the fullest extent permitted by law, we do not accept or assume responsibility to anyone other than the Company and the Company’s members, as a body, for our audit work, for this report, or for the opinions we have formed.
John Leech (Senior Statutory Auditor) for and on behalf of KPMG LLP, Statutory Auditor Chartered Accountants
One Snowhill Snow Hill Queensway Birmingham B4 6GH
10 December 2020

84
Group Income Statement For the 53 weeks ended 3 October 2020
2020 2019
(Restated)
Note Underlying
£m
Non- underlying
(note 4) £m
Total £m
Underlying £m
Non-underlying
(note 4) £m
Total £m
Continuing operations Revenue 2, 3 515.5 – 515.5 784.2 – 784.2 Operating expenses 3 (458.8) (342.2) (801.0) (644.0) (59.3) (703.3) Operating profit/(loss) 2, 4 56.7 (342.2) (285.5) 140.2 (59.3) 80.9 Finance costs 6 (96.1) (2.7) (98.8) (77.2) (0.6) (77.8) Finance income 6 1.0 1.0 2.0 0.4 0.5 0.9 Interest rate swap movements 4, 6 – (6.4) (6.4) – (48.7) (48.7)
Net finance costs 4, 6 (95.1) (8.1) (103.2) (76.8) (48.8) (125.6) (Loss)/profit before taxation (38.4) (350.3) (388.7) 63.4 (108.1) (44.7) Taxation 4, 7 14.6 25.6 40.2 (8.8) 16.1 7.3 (Loss)/profit for the period from
continuing operations (23.8) (324.7) (348.5) 54.6 (92.0) (37.4) Discontinued operations Profit/(loss) from discontinued operations 8 13.3 (24.4) (11.1) 25.6 (5.9) 19.7 (Loss)/profit for the period attributable to
equity shareholders (10.5) (349.1) (359.6) 80.2 (97.9) (17.7)
(Loss)/earnings per share: Note 2020
p
2019 (Restated)
p
Basic (loss)/earnings per share 9 Total (56.8) (2.8) Continuing (55.1) (5.9) Discontinued (1.8) 3.1
Basic underlying (loss)/earnings per share 9 Total (1.7) 12.7 Continuing (3.8) 8.6 Discontinued 2.1 4.0
Diluted (loss)/earnings per share 9 Total (56.8) (2.8) Continuing (55.1) (5.9) Discontinued (1.8) 3.1
Diluted underlying (loss)/earnings per share 9 Total (1.7) 12.7 Continuing (3.8) 8.6 Discontinued 2.1 4.0
Marston’s PLC Annual Report and Accounts 2020
The comparative information for the 52 weeks ended 28 September 2019 has been restated for the prior period adjustments detailed in note 35 and the asset class split detailed in note 36. The comparatives have also been represented to show discontinued operations separately from continuing operations.

85 Marston’s PLC Annual Report and Accounts 2020Financial Statem
ents
2.11
Group Statement of Comprehensive Income For the 53 weeks ended 3 October 2020
2020 £m
2019 (Restated)
£m
Loss for the period (359.6) (17.7) Items of other comprehensive income that may subsequently be reclassified to profit or loss Losses arising on cash flow hedges (3.8) (20.5) Transfers to the income statement on cash flow hedges 21.3 Tax on items that may subsequently be reclassified to profit or loss (0.3) 1.5
17.2 (7.8) Items of other comprehensive income that will not be reclassified to profit or loss Remeasurement of retirement benefits (6.5) (54.7) Unrealised surplus on revaluation of properties – 2.8 Reversal of past revaluation surplus (151.2) (25.1) Tax on items that will not be reclassified to profit or loss 17.7 10.6
(140.0) (66.4) Other comprehensive expense for the period (122.8) (74.2) Total comprehensive expense for the period attributable to equity shareholders (482.4) (91.9)
Other comprehensive expense for the current and prior period relates wholly to continuing operations.

Marston’s PLC Annual Report and Accounts 2020
86
Group Cash Flow Statement For the 53 weeks ended 3 October 2020
2020 £m
51.6 125.6
(367.0) (241.4)
– 15.4
Note
2 74.0 2
31 71.9 31 334.1
1.0 (7.3)
1.5 74.9
(63.7) 1.2 1.5
30
2019 (Restated)
£m
172.8 42.2
215.0 (66.4) 148.6
10.3 52.1 (3.4) (3.0) (9.0)
195.6
0.5 49.8
(133.8) 0.3
– 118.0 34.8
Operating activities Underlying operating profit Depreciation and amortisation Underlying EBITDA Non-underlying operating items EBITDA Working capital movement Non-cash movements Increase/(decrease) in provisions and other non-current liabilities Difference between defined benefit pension contributions paid and amounts charged Income tax paid Net cash inflow from operating activities Investing activities Interest received Sale of property, plant and equipment and assets held for sale Purchase of property, plant and equipment and intangible assets Movement in trade loans Finance lease capital repayments received Net transfer from other cash deposits Net cash inflow from investing activities Financing activities Equity dividends paid (47.5) Interest paid (74.4) Arrangement costs of bank facilities (1.1) Proceeds from sale of own shares 0.1 Repayment of securitised debt (31.7) Repayment of bank borrowings (0.7) Advance of bank borrowings 48.6 Capital element of lease liabilities repaid (7.5) Advance/(repayment) of other borrowings 55.0 (120.0) Net cash outflow from financing activities (168.8) (234.2) Net increase/(decrease) in cash and cash equivalents 3.1 (3.8)
(1.8) 156.5
32 (30.4) (91.0)
– –
(33.4) (60.7)
– (8.3)
30

87 Marston’s PLC Annual Report and Accounts 2020Financial Statem
ents
Group Balance Sheet As at 3 October 2020
Non-current assets Goodwill Other intangible assets Property, plant and equipment Other non-current assets Deferred tax assets Retirement benefit surplus
Current assets Inventories Trade and other receivables Current tax assets Other cash deposits Cash and cash equivalents
Assets held for sale
Current liabilities Borrowings Derivative financial instruments Trade and other payables Current tax liabilities Provisions for other liabilities and charges
Liabilities held for sale
Non-current liabilities Borrowings Derivative financial instruments Other non-current liabilities Provisions for other liabilities and charges Deferred tax liabilities Retirement benefit obligations
Net assets
Shareholders’ equity Equity share capital Share premium account Revaluation reserve Merger reserve Capital redemption reserve Hedging reserve Own shares Retained earnings Total equity
3 October 2020
£m
– 32.5
2,038.3 17.5 16.7
– 2,105.0
10.4 16.2 8.0 2.0
40.6 77.2
349.7 426.9
(64.7) (37.0)
(222.1) –
(1.1) (324.9) (111.0)
(435.9)
(1,610.9) (187.4)
(3.9) (7.7)
– (37.2)
(1,847.1) 248.9
48.7 334.0 430.6
23.7 6.8
(108.7) (111.9)
(374.3) 248.9
29 September 2018
(Restated) £m
230.3 70.0
2,361.6 9.6
– 15.6
2,687.1
44.6 104.9
– 120.0
41.4 310.9
2.3 313.2
(158.4) (14.6)
(252.2) (4.0) (2.8)
(432.0) –
(432.0)
(1,389.0) (162.9)
(1.5) (22.5) (73.8)
– (1,649.7)
918.6
48.7 334.0 600.2
23.7 6.8
(118.1) (112.3) 135.6 918.6
Note
10 11 12 13 14 15
16 17
18
19 21 22
23
18
19 21 24 23 14 15
28
29 29
29
28 September 2019
(Restated) £m
230.3 88.5
2,306.1 9.3 5.8
– 2,640.0
43.6 90.9
– 2.0
37.6 174.1
1.7 175.8
(54.9) (19.9)
(248.3) (1.7) (2.6)
(327.4) –
(327.4)
(1,383.4) (215.6)
(2.6) (19.7) (56.5) (36.4)
(1,714.2) 774.2
48.7 334.0 573.4
23.7 6.8
(125.9) (112.0)
25.5 774.2
The financial statements were approved by the Board and authorised for issue on 10 December 2020 and are signed on its behalf by:
Ralph Findlay Chief Executive Officer
10 December 2020

Marston’s PLC Annual Report and Accounts 2020
88
1.811
Group Statement of Changes in Equity For the 53 weeks ended 3 October 2020
Equity share
capital £m
Share premium account
£m
Revaluation reserve
£m
Merger reserve
£m
Capital redemption
reserve £m
Hedging reserve
£m
Own shares
£m
Retained earnings
£m
Total equity
£m
At 29 September 2019 (as originally reported) 48.7 334.0 598.9 23.7 6.8 (125.9) (112.0) 36.9
Prior period adjustment – – – – – – – 3.6 3.6 Adjustment for asset class split – – (29.9) – – – – (14.4) (44.3) Tax impact of asset class split – – 4.4 – – – – (0.6) 3.8 At 29 September 2019 (as restated) 48.7 334.0 573.4 23.7 6.8 (125.9) (112.0) 25.5 774.2 Adjustment for adoption of IFRS 16 – – – – – – – (15.9) (15.9) Tax impact of IFRS 16 adjustment – – – – – – – 3.0 3.0 At 29 September 2019 (as adjusted) 48.7 334.0 573.4 23.7 6.8 (125.9) (112.0) 12.6 761.3 Loss for the period – – – – – – – (359.6) (359.6) Remeasurement of retirement benefits – – – – – – – (6.5) (6.5) Tax on remeasurement of retirement
benefits – – – – – – – 2.0 2.0 Losses on cash flow hedges – – – – – (3.8) – – (3.8) Transfers to the income statement on
cash flow hedges – – – – – 21.3 – – 21.3 Tax on hedging reserve movements – – – – – (0.3) – – (0.3) Property impairment – – (151.2) – – – – – (151.2) Deferred tax on properties – – 15.7 – – – – – 15.7 Total comprehensive (expense)/income – – (135.5) – – 17.2 – (364.1) (482.4) Share-based payments – – – – – – – 0.4 0.4 Sale of own shares – – – – – – 0.1 (0.1) – Transfer disposals to retained earnings – – (8.1) – – – – 8.1 – Transfer tax to retained earnings – – 0.8 – – – – (0.8) – Dividends paid – – – – – – – (30.4) (30.4) Total transactions with owners – – (7.3) – – – 0.1 (22.8) (30.0) At 3 October 2020 48.7 334.0 430.6 23.7 6.8 (108.7) (111.9) (374.3) 248.9
For the 52 weeks ended 28 September 2019 Equity Share Revaluation Capital Retained Total share premium reserve Merger redemption Hedging Own earnings equity
capital account (Restated) reserve reserve reserve shares (Restated) (Restated) £m £m £m £m £m £m £m £m £m
At 30 September 2018 (as originally reported) 48.7 334.0 627.2 23.7 6.8 (118.1) (112.3) 147.6 957.6
Prior period adjustment – – – – – – – 3.6 3.6 Adjustment for asset class split – – (31.6) – – – – (14.9) (46.5) Tax impact of asset class split – – 4.6 – – – – (0.7) 3.9 At 30 September 2018 (as restated) Adjustment for adoption of IFRS 9 Tax impact of IFRS 9 adjustment
48.7 – –
334.0 – –
600.2 – –
23.7 – –
6.8 – –
(118.1) – –
(112.3) – –
135.6 (6.7) 1.2
918.6 (6.7) 1.2
At 30 September 2018 (as adjusted) 48.7 334.0 600.2 23.7 6.8 (118.1) (112.3) 130.1 913.1 Loss for the period – – – – – – – (17.7) (17.7) Remeasurement of retirement benefits – – – – – – – (54.7) (54.7) Tax on remeasurement of retirement
benefits – – – – – – – 9.3 9.3 Losses on cash flow hedges – – – – – (20.5) – – (20.5) Transfers to the income statement on
cash flow hedges – – – – – 2.11 – – 2.11 Tax on hedging reserve movements – – – – – 1.5 – – 1.5 Property revaluation – – 2.8 – – – – – 2.8 Property impairment – – (25.1) – – – – – (25.1) Deferred tax on properties – – 1.3 – – – – – 1.3 Total comprehensive expense – – (21.0) – – (7.8) – (63.1) (91.9) Share-based payments – – – – – – – 0.3 0.3 Tax on share-based payments – – – – – – – 0.1 0.1 Sale of own shares – – – – – – 0.3 (0.2) 0.1 Transfer disposals to retained earnings – – (6.8) – – – – 6.8 – Transfer tax to retained earnings – – 1.0 – – – – (1.0) – Dividends paid – – – – – – – (47.5) (47.5) Total transactions with owners – – (5.8) – – – 0.3 (41.5) (47.0) At 28 September 2019 (as restated) 48.7 334.0 573.4 23.7 6.8 (125.9) (112.0) 25.5 774.2
Further detail in respect of the Group’s equity is provided in notes 28 and 29.

Marston’s PLC Annual Report and Accounts 2020Financial Statem
ents
89
Notes For the 53 weeks ended 3 October 2020
1 Accounting policies
The Group’s principal accounting policies are set out below:
Basis of preparation These consolidated financial statements for the 53 weeks ended 3 October 2020 (2019: 52 weeks ended 28 September 2019) have been prepared in accordance with International Financial Reporting Standards (IFRS) and IFRS Interpretations Committee and Standing Interpretations Committee interpretations adopted by the European Union and with those parts of the Companies Act 2006 applicable to companies reporting under IFRS. The financial statements have been prepared under the historical cost convention as modified by the revaluation of certain items, principally effective freehold land and buildings, certain financial instruments, retirement benefits and share-based payments as explained below.
Prior period adjustments The Group has identified adjustments to prior periods regarding the amount of deferred tax recognised in respect of land and buildings which were held under finance leases under IAS 17 ‘Leases’ and the split of derivative financial instruments between non-current and current liabilities. As such the comparatives for the 52 weeks ended 28 September 2019 have been restated in accordance with IAS 8 ‘Accounting Policies, Changes in Accounting Estimates and Errors’. Full details are provided in note 35.
Asset class split The Group has split the land and buildings asset class within property, plant and equipment into an effective freehold class, held under the revaluation model, and a leasehold class, held under the cost model. This change has been applied retrospectively in accordance with IAS 8 ‘Accounting Policies, Changes in Accounting Estimates and Errors’ and as such the comparatives for the 52 weeks ended 28 September 2019 have been restated. Full details are provided in note 36.
New standards The Group has adopted IFRS 16 ‘Leases’ in the current period using the modified retrospective approach in paragraph C5(b) of the standard, whereby comparative amounts have not been restated and the cumulative effect of initially applying the standard has been recognised as an adjustment to opening retained earnings at 29 September 2019. IFRS 16 introduces an ‘on balance sheet’ model for lessees and as such the Group has recognised a lease liability within borrowings in respect of the majority of its previous operating leases along with either a right-of-use asset in property, plant and equipment or a finance lease receivable (for some sublet properties). The rental payments/receipts previously charged/credited to the income statement are treated as repayments of the lease liability/finance lease receivable and the income statement now includes depreciation of the right-of-use asset and interest on the lease liability/ finance lease receivable. Further details of the adoption of IFRS 16 are provided in note 37.
The Group has also adopted the amendment to IFRS 16 which provides lessees with an exemption from assessing whether a COVID-19-related rent concession is a lease modification.
The International Accounting Standards Board (IASB) have issued the following new or revised standards with an effective date for financial periods beginning on or after the dates disclosed below. These standards have not yet been adopted by the Group. The IASB have also issued a number of minor amendments to standards as part of their Annual Improvements to IFRS.
IFRS 3 Business Combinations Amendments to clarify the definition of a business 1 January 2020
IFRS 4 Insurance Contracts Amendments regarding the expiry date of the deferral approach 1 January 2023 Amendments regarding replacement issues in the context of the IBOR reform 1 January 2021
IFRS 7 Financial Instruments: Disclosures Amendments regarding pre-replacement issues in the context of the IBOR reform 1 January 2020 Amendments regarding replacement issues in the context of the IBOR reform 1 January 2021
IFRS 9 Financial Instruments Amendments regarding pre-replacement issues in the context of the IBOR reform 1 January 2020 Amendments regarding replacement issues in the context of the IBOR reform 1 January 2021
IFRS 10 Consolidated Financial Statements Amendments regarding the sale or contribution of assets between an investor and its associate or joint venture Date deferred
IFRS 16 Leases Amendments regarding replacement issues in the context of the IBOR reform 1 January 2021
IFRS 17 Insurance Contracts New accounting standard 1 January 2023
IAS 1 Presentation of Financial Statements Amendments regarding the definition of material 1 January 2020 Amendments regarding the classification of liabilities 1 January 2023
IAS 8 Accounting Policies, Changes in Accounting Estimates and Errors Amendments regarding the definition of material 1 January 2020
IAS 16 Property, Plant and Equipment Amendments prohibiting an entity from deducting from the cost of property, plant and equipment amounts received from selling items produced while the entity is preparing the asset for its intended use 1 January 2022
IAS 28 Investments in Associates and Joint Ventures Amendments regarding the sale or contribution of assets between an investor and its associate or joint venture Date deferred
IAS 37 Provisions, Contingent Liabilities and Contingent Assets Amendments regarding the costs to include when assessing whether a contract is onerous 1 January 2022
It is not anticipated that any of the above unadopted new standards will have a material impact on the Group’s results or financial position.

90 Marston’s PLC Annual Report and Accounts 2020
Notes continued For the 53 weeks ended 3 October 2020
1 Accounting policies (continued)
Going concern The impact of COVID-19 on the economy and the hospitality industry has resulted in heightened uncertainty about the future financial performance of the Group and the Company, which could cast significant doubt over the Group’s ability to trade as a going concern. The COVID-19 pandemic has resulted in a variety of temporary operating restrictions and it is not clear when these restrictions, such as social distancing measures and reduced pub opening times, will be removed and whether any further local or national lockdowns will be required.
The Directors have performed an assessment of the going concern assessment period, being the period of 12 months from the date of signing these financial statements, including capital expenditure and cash flow forecasts, to assess the adequacy of the Group’s financial resources. In performing their assessment, the Directors considered the Group’s financial position and exposure to principal risks, including the ongoing impact of COVID-19. The Group’s forecasts assume that sales will gradually recover to pre-COVID-19 levels over the next year, with social distancing measures reducing from April 2021. The Directors have also considered a severe but plausible downside scenario, which incorporates a further lockdown and pub opening restrictions at a national level for a two month period in January and February 2021. The conclusion of this assessment was that the Directors are satisfied that the Group has sufficient liquidity to withstand such a severe but plausible downside scenario. The completion of the disposal of the Group’s brewing operations in October 2020 has improved the Group’s liquidity significantly, with an initial cash payment of £232.7 million received on 30 October 2020. However, under this severe but plausible downside scenario, further covenant waivers/amendments would be required.
The Group has secured waivers from its bondholders in respect of the free cash flow covenant up to April 2021 and has agreed with its other lenders to replace existing financial covenant tests with a liquidity and profit covenant from 3 October 2020 up to July 2021. There is a material uncertainty as to whether the financial covenants will be met or whether the Group’s lenders will agree to further waivers if required. The Group will continue to have regular communication with its lenders throughout this period.
Considering the above, the Directors are satisfied that the Group and the Company have adequate resources to continue in operational existence for the foreseeable future, being at least 12 months from the date of signing these financial statements. For this reason, the Directors continue to adopt the going concern basis of accounting in preparing these financial statements. However, a material uncertainty exists, in particular with respect to the ability to achieve further covenant waivers or amendments if required, which may cast significant doubt on the Group’s ability to continue as a going concern and, therefore, to continue realising its assets and discharging its liabilities in the normal course of business. The financial statements do not include any adjustments that would result from the basis of preparation being inappropriate.
Basis of consolidation The consolidated financial statements incorporate the financial statements of Marston’s PLC and all of its subsidiary undertakings. The results of new subsidiary undertakings are included in the Group accounts from the date on which control transferred to the Group or, in the case of disposals, up to the date when control ceased. Transactions between Group companies are eliminated on consolidation.
The Group has applied the purchase method in accounting for the acquisition of subsidiaries. The cost of an acquisition is measured as the fair value of the consideration paid and deferred. Identifiable assets acquired and liabilities assumed in a business combination are measured initially at their fair values at the acquisition date. Acquisition costs are expensed as incurred. The excess of the cost of acquisition over the fair value of the Group’s share of the identifiable net assets acquired is recorded as goodwill. If the cost of acquisition is less than the fair value of the Group’s share of the identifiable net assets of the subsidiary acquired, the difference is recognised immediately in the income statement.
The consolidated financial statements incorporate the results of Marston’s Issuer PLC and its parent company, Marston’s Issuer Parent Limited. Marston’s Issuer PLC was set up with the sole purpose of issuing debt secured on assets owned by the Group. Wilmington Trust SP Services (London) Limited holds the shares of Marston’s Issuer Parent Limited under a declaration of trust for charitable purposes. The rights provided to the Group through the securitisation give the Group power over these companies and the ability to use that power to affect its exposure to variable returns from them. As such the Directors of Marston’s PLC consider that these companies are controlled by the Group, as defined in IFRS 10 ‘Consolidated Financial Statements’, and hence for the purpose of the consolidated financial statements they have been treated as subsidiary undertakings.
Revenue and other operating income The Group’s revenue from contracts with customers in respect of continuing operations comprises retail sales and wholesale sales.
Retail sales The Group sells food and drink to customers in its pubs. Revenue from the sale of food and drink is recognised when the goods are sold to the customers in the pubs. Payment of the transaction price is due immediately when the goods are provided to the customer.
The Group provides accommodation to customers in its public houses and lodges. Revenue from the provision of accommodation is recognised over the period of the customer’s stay. Payment of the transaction price is due at the time of the customer’s stay.
The Group provides gaming machines for customers to play in its pubs. Revenue from gaming machines is recognised when the game has been played. Payment of the transaction price is due when the game is played.
It is considered that, in respect of its franchised arrangements, the Group has exposure to the significant risks and rewards associated with the above sales of goods and rendering of services and as such the total income from franchised pubs is included within the Group’s revenue.
Wholesale sales The Group sells drinks to tenants of its licensed properties. Revenue is recognised when the Group has transferred control of the goods to the customer. This occurs when the goods have been delivered to the customer, the customer has obtained legal title to the goods, the Group cannot require the return or transfer of the goods and the customer has an unconditional obligation to pay for the goods.

91 Marston’s PLC Annual Report and Accounts 2020Financial Statem
ents
1 Accounting policies (continued)
The Group’s revenue from contracts with customers in respect of discontinued operations comprises wholesale sales and contract services.
Wholesale sales The Group sells drinks to wholesalers, retailers and other pub operators. Revenue is recognised when the Group has transferred control of the goods to the customer. This occurs when the goods have been delivered to the customer, the customer has obtained legal title to the goods, the Group cannot require the return or transfer of the goods and the customer has an unconditional obligation to pay for the goods.
Drinks are often sold with retrospective volume discounts based on sales over a defined period. The anticipated discounts are estimated based on accumulated experience using the expected value method and are deducted from the sales price that is recognised in revenue. A refund liability is recognised within trade and other payables for the volume discounts expected to be paid in respect of sales made prior to the balance sheet date.
Contract services The Group brews and packages drinks for customers. Revenue is recognised when the Group has transferred control of the goods to the customer. This occurs when the goods have been delivered to the customer, the customer has obtained legal title to the goods and the customer has an unconditional obligation to pay for the goods.
The Group also transports and delivers goods for customers. Revenue is recognised over time as the Group transports the goods; due to the short distances the goods are transported this is equivalent to recognising revenue at the point when the goods are delivered to the required location.
In respect of both wholesale sales and contract services, a receivable is recognised when the goods are delivered, and payment is due in line with each customer’s individual credit terms. These terms are all less than one year and as such no element of financing is considered to be present.
Revenue is recorded net of discounts, intra group transactions, VAT and excise duty relating to the brewing and packaging of certain products.
The Group has elected to apply the practical expedient in paragraph 63 of IFRS 15 ‘Revenue from Contracts with Customers’ whereby the promised amount of consideration is not adjusted for the effects of a significant financing component if it is expected that payment will be received within one year.
The Group also includes rent receivable from tenants of its licensed properties within revenue from continuing operations. This income is recognised in the period to which it relates.
Other operating income mainly comprises amounts receivable under the Coronavirus Job Retention Scheme and rent receivable from unlicensed properties. These are recognised in the period to which they relate.
Operating segments For segment reporting purposes the Group is considered to have three distinguishable operating segments, being Pubs and Bars, Brewing and Group Services. This mirrors the Group’s internal reporting, and reflects the different distribution channels, customer profiles and nature of products and services provided within each segment. An element of Group Services’ costs is allocated to each of the trading segments. Transfer prices between operating segments are on an arm’s length basis.
The operating segments set out in note 2 are consistent with the internal reporting provided to the chief operating decision maker. For the purposes of IFRS 8 ‘Operating Segments’ the chief operating decision maker has been identified as the Executive Directors.
Non‑underlying items In order to illustrate the underlying performance of the Group, presentation has been made of performance measures excluding those items which it is considered would distort the comparability of the Group’s results.
Non-underlying items are defined as those items that, by virtue of their nature, size or expected frequency, warrant separate additional disclosure in the financial statements in order to fully understand the underlying performance of the Group. As management of the freehold and leasehold property estate is an essential and significant area of the business, the threshold for classification of property related items as non-underlying is higher than other items.
Details in respect of non-underlying items recognised in the current and prior period are provided in notes 4 and 8.
Intangible assets Intangible assets are carried at cost less accumulated amortisation and any impairment losses. Intangible assets arising on an acquisition are recognised separately from goodwill if the fair value of these assets can be identified separately and measured reliably.
Amortisation is calculated on a straight-line basis over the estimated useful life of the intangible asset. Where the useful life of the asset is considered to be indefinite no annual amortisation is provided but the asset is subject to annual impairment reviews. Impairment reviews are carried out more frequently if events or changes in circumstances indicate that the carrying value of an asset may be impaired. Any impairment of carrying value is charged to the income statement.
The useful lives of the Group’s intangible assets are:
Acquired brands Indefinite Lease premiums Life of the lease Computer software 5 to 20 years Development costs 10 years
Goodwill Goodwill arising on acquisitions is capitalised and represents the excess of the fair value of the consideration given over the fair value of the identifiable net assets and liabilities acquired. Goodwill is not amortised but instead is reviewed for impairment on an annual basis, or more frequently if events or changes in circumstances indicate that the carrying value may be impaired. Any impairment is recognised immediately in the income statement.
For the purposes of impairment testing, goodwill is allocated to cash generating units that are consistent with the Group’s operating segments.
92 Marston’s PLC Annual Report and Accounts 2020
Notes continued For the 53 weeks ended 3 October 2020
1 Accounting policies (continued)
Property, plant and equipment • Effective freehold land and buildings are initially stated at cost and subsequently at valuation. Leasehold land and buildings, plant and machinery and
fixtures, fittings, tools and equipment are stated at cost. • Depreciation is charged to the income statement on a straight-line basis to provide for the cost or valuation of the assets less their residual values over their
useful lives. • Land and buildings are depreciated to their residual values over the lower of the lease term (where applicable) and 50 years. • Plant and machinery and fixtures, fittings, tools and equipment are depreciated over periods ranging from 3 to 20 years. • Own labour and interest costs directly attributable to capital projects are capitalised.
Residual values and useful lives are reviewed and adjusted if appropriate at each balance sheet date.
Effective freehold land and buildings are revalued by qualified valuers on a sufficiently regular basis using open market value so that the carrying value of an asset does not differ significantly from its fair value at the balance sheet date. Most of the Group’s effective freehold land and buildings have been externally valued in accordance with the Royal Institution of Chartered Surveyors’ Red Book. These valuations are performed directly by reference to observable prices in an active market or recent market transactions on arm’s length terms. Internal valuations are performed on the same basis.
For effective freehold land and buildings revaluation losses are charged to the revaluation reserve to the extent that a previous gain has been recorded, and thereafter to the income statement. Surpluses on revaluation are recognised in the revaluation reserve, except to the extent that they reverse previously charged impairment losses, in which case the reversal is recorded in the income statement.
The property estate is assessed at each reporting date to ensure that the carrying amount does not differ materially from that which would be determined using fair value at the end of the reporting period. This is consistent with the requirements of IAS 16 ‘Property, Plant and Equipment’.
Disposals of property, plant and equipment Profit/loss on disposal of property, plant and equipment represents net sale proceeds less the carrying value of the assets and any associated lease liabilities. Any element of the revaluation reserve relating to the property disposed of is transferred to retained earnings at the date of sale.
Impairment If there are indications of impairment or reversal of impairment, an assessment is made of the recoverable amount of each significant cash generating unit. These cash generating units are no larger than the operating segments set out in note 2 under IFRS 8 ‘Operating Segments’. An impairment loss is recognised where the recoverable amount is lower than the carrying value of assets, including goodwill. The recoverable amount is the higher of value in use and fair value less costs to sell. The impairment loss is recognised in the income statement unless the asset is carried at a revalued amount, in which case the impairment loss is charged to the revaluation reserve to the extent that a previous gain has been recorded, and thereafter to the income statement.
For goodwill and intangible assets that have an indefinite life, the recoverable amount is assessed annually and an impairment loss is recognised for the amount by which the asset’s carrying amount exceeds its recoverable amount.
Where there is an indication that any previously recognised impairment losses no longer exist or have decreased, a reversal of the loss is made if there has been a change in the estimates used to determine the recoverable amounts since the last impairment loss was recognised. The carrying amount of the asset is increased to its recoverable amount only up to the carrying amount that would have resulted, net of depreciation or amortisation, had no impairment loss been recognised for the asset in prior periods. The reversal is recognised in the income statement unless the asset is carried at a revalued amount. The reversal of an impairment loss on a revalued asset is recognised in other comprehensive income and increases the revaluation surplus for that asset. However, to the extent that an impairment loss on the same revalued asset was previously recognised in the income statement, the reversal of that impairment loss is recognised in the income statement. The depreciation charge is adjusted in future periods to allocate the asset’s revised carrying value, less any residual value, on a systematic basis over its remaining useful life. There is no reversal of impairment losses relating to goodwill.
Acquired brands are reviewed for impairment on a brand portfolio basis.
Leases At the inception of a contract the Group assesses whether that contract is or contains a lease. This is the case if the contract conveys the right to control the use of an identified asset for a period of time in exchange for consideration. The Group has taken the practical expedient in paragraph C3 of IFRS 16 ‘Leases’ not to reassess whether an existing contract is or contains a lease at the date of initial application and as such the IFRS 16 definition of a lease has only been applied to contracts which were entered into or amended on or after 29 September 2019.
The Group has elected not to apply the lessee requirements of IFRS 16 to short-term leases and leases for which the underlying asset is of low value. The lease payments for such leases are recognised as an expense on a straight-line basis over the lease term.
For all other leases where it is the lessee the Group recognises a lease liability and a right-of-use asset at the commencement date of the lease.
The lease liability is recognised as the present value of the lease payments discounted using either the interest rate implicit in the lease or, where that rate cannot be readily determined, the Group’s incremental borrowing rate. The lease payments include variable payments that depend on an index or rate and the exercise price of a purchase option if it is reasonably certain that it will be exercised. The lease liability is subsequently increased to reflect the interest thereon, reduced by the lease payments made and remeasured to reflect any reassessments or lease modifications, such as a change in future lease payments resulting from a change in an index or rate or a change in the lease term.

93 Marston’s PLC Annual Report and Accounts 2020Financial Statem
ents
1 Accounting policies (continued)
The right-of-use asset is recognised at an amount equal to the total of the lease liability, any lease payments made at or before the commencement date, any initial direct costs and the estimated future dismantling, removal and site restoration costs. The Group has elected to apply the revaluation model to right-of-use assets relating to the effective freehold land and buildings class of property, plant and equipment. All other right-of-use assets are held under the cost model and subsequently measured at cost less any accumulated depreciation and impairment losses, and adjusted for any remeasurement of the lease liability.
For assets where the Group is the lessor, leases are classified as finance leases if the terms of the lease transfer substantially all the risks and rewards of ownership to the lessee. All other leases are classified as operating leases. Where the Group is an intermediate lessor of an asset, the sublease is classified as a finance lease or an operating lease by reference to the right-of-use asset arising from the head lease rather than the underlying asset.
Income receivable under operating leases is credited to the income statement on a straight-line basis over the term of the lease.
Where a sublease is classified as a finance lease the right-of-use asset is derecognised and the Group recognises a finance lease receivable at an amount equal to the net investment in the lease. The lease payments are discounted at the interest rate implicit in the lease, or where this cannot be readily determined, the discount rate used for the head lease. Finance income is recognised over the lease term based on a pattern reflecting a constant periodic rate of return on the net investment in the lease.
In the prior period under IAS 17 ‘Leases’, leases were classified as finance leases if the terms of the lease transferred substantially all the risks and rewards of ownership to the lessee. All other leases were classified as operating leases.
The cost or valuation of assets held under finance leases was included within property, plant and equipment and depreciation was charged in accordance with the accounting policy for each class of asset concerned. The corresponding capital obligations under these leases were shown as liabilities. The finance charge element of rentals was charged to the income statement and classified within finance costs as incurred.
Rental costs under operating leases, including lease incentives, were charged to the income statement on a straight-line basis over the term of the lease. Similarly, income receivable under operating leases was credited to the income statement on a straight-line basis over the term of the lease.
Obligations arising from sale and leaseback arrangements with repurchase options that do not fall within the scope of IFRS 16 or IAS 17 are classified as other lease related borrowings and accounted for in accordance with IFRS 9 ‘Financial Instruments’.
Inventories Inventories are stated at the lower of cost and net realisable value. Raw materials are valued on a ‘first in, first out’ basis. Finished goods and work in progress include direct materials, labour and a proportion of attributable overheads.
Assets and disposal groups held for sale Assets, typically properties and related fixtures and fittings, and disposal groups comprising assets and liabilities, are categorised as held for sale when their value will be recovered through a sale transaction rather than continuing use. This condition is met when the sale is highly probable, the asset or disposal group is available for immediate sale in its present condition and is being actively marketed. In addition, the Group must be committed to the sale and completion should be expected to occur within one year from the date of classification. Assets and disposal groups held for sale are valued at the lower of carrying value and fair value less costs to sell. Once classified as held for sale intangible assets and property, plant and equipment are no longer amortised or depreciated.
Financial instruments The Group classifies its financial assets in one of the following two categories: at fair value through profit or loss and at amortised cost. The Group classifies its financial liabilities in one of the following two categories: at fair value through profit or loss and other financial liabilities.
The Group classifies a financial asset as at amortised cost if the asset is held within a business model whose objective is to hold financial assets in order to collect contractual cash flows and the contractual terms of the asset give rise on specified dates to cash flows that are solely payments of principal and interest.
Financial instruments at fair value through profit or loss Derivatives are categorised as financial instruments at fair value through profit or loss unless they are designated as part of a hedging relationship. Trade loans are also categorised as at fair value through profit or loss as they do not give rise on specified dates to cash flows that are solely payments of principal and interest. The Group holds no other financial instruments at fair value through profit or loss.
Financial assets at amortised cost Financial assets at amortised cost comprise finance lease receivables, trade receivables, other receivables, other cash deposits and cash and cash equivalents in the balance sheet and are measured using the effective interest method.
Other financial liabilities Non-derivative financial liabilities are classified as other financial liabilities. The Group’s other financial liabilities comprise borrowings, trade payables and other payables. Other financial liabilities are carried at amortised cost using the effective interest method.
Financial assets are derecognised when the rights to receive cash flows from the investments have expired or have been transferred and the Group has transferred substantially all risks and rewards of ownership.
It is, and has been throughout the period under review, the Group’s policy that no trading in financial instruments shall be undertaken.

94 Marston’s PLC Annual Report and Accounts 2020
Notes continued For the 53 weeks ended 3 October 2020
1 Accounting policies (continued)
Derivative financial instruments The only derivative financial instruments that the Group enters into are interest rate swaps. The purpose of these transactions is to manage the interest rate risk arising from the Group’s operations and its sources of finance.
Derivatives are initially recognised at fair value on the date the derivative contract is entered into and are subsequently remeasured at their fair value at each balance sheet date. The method of recognising the resulting gain or loss depends on whether the derivative is designated as a hedging instrument.
The effective portion of changes in the fair value of derivatives that are designated and qualify as cash flow hedges is recognised in other comprehensive income. The gain or loss relating to the ineffective portion is recognised immediately in the income statement.
Gains or losses arising from changes in the fair value of derivatives which are not designated as part of a hedging relationship are presented in the income statement in the period in which they arise.
The fair value of derivatives is split between non-current and current assets/liabilities based on the remaining maturity profile. The portion of the remaining maturity that is more than 12 months is classified as non-current and the portion of the remaining maturity that is less than 12 months is classified as current. Accrued interest is recognised separately in current assets/liabilities as appropriate.
At the inception of a hedging transaction, the Group documents the economic relationship between hedging instruments and hedged items, as well as its risk management objectives and strategy for undertaking the hedging transaction. The Group also documents its assessment, both at hedge inception and on an ongoing basis, of whether the derivatives that are used in hedging transactions are highly effective in offsetting changes in cash flows of hedged items.
When a hedging instrument expires or is sold, or when a hedge no longer meets the criteria for hedge accounting, any cumulative gain or loss existing in equity at that time remains in equity and is recognised when the forecast transaction is ultimately recognised in the income statement. When a forecast transaction is no longer expected to occur, the cumulative gain or loss that was reported in equity is immediately transferred to the income statement.
Amounts that have been recognised in other comprehensive income in respect of cash flow hedges are reclassified from equity to profit or loss as a reclassification adjustment in the same period or periods during which the hedged forecast cash flow affects profit or loss.
Trade loans In common with other major brewers, the Group makes trade loans to publicans who purchase the Group’s beer. Significant trade loans are secured against the property of the loan recipient. Trade loans are held at fair value and classified within other non-current assets in the balance sheet.
Finance lease receivables Finance lease receivables are recognised at an amount equal to the net investment in the lease and subsequently measured at amortised cost less provision for impairment.
Trade receivables and other receivables Trade receivables and other receivables are recognised initially at fair value and subsequently measured at amortised cost less provision for impairment.
The Group applies the expected credit loss model to calculate any loss allowance for finance lease receivables, trade receivables and other receivables. For finance lease receivables, trade receivables and other receivables that result from transactions that are within the scope of IFRS 15 ‘Revenue from Contracts with Customers’ or from transactions that are within the scope of IFRS 16 ‘Leases’ the loss allowance is measured as the lifetime expected credit losses. For any other trade or other receivables the loss allowance is measured as the 12-month expected credit losses unless the credit risk has increased significantly since initial recognition, in which case the lifetime expected credit losses are used. Details of the methodologies used to calculate the expected credit losses for the different groupings of finance lease receivables, trade receivables and other receivables are given in note 25.
The carrying amount of finance lease receivables, trade receivables and other receivables is reduced through the use of an allowance account, and the amount of the loss allowance is recognised in the income statement within other net operating charges. The Group’s policy is to write off finance lease receivables, trade receivables and other receivables when there is no reasonable expectation of recovery of the balance due. Indicators that there is no reasonable expectation of recovery depend on the type of debtor/customer and include a debt being over four months old, the failure of the debtor to engage in a repayment plan and the failure to recover any amounts through enforcement activity. Subsequent recoveries of amounts previously written off are credited against other net operating charges in the income statement.
Other cash deposits Cash held on deposit with banks with a maturity of more than three months at the date of acquisition is classified within other cash deposits.
Cash and cash equivalents Cash and cash equivalents include cash in hand and deposits on call with banks. Any bank overdrafts are shown within borrowings in current liabilities. For the purpose of the cash flow statement, cash and cash equivalents are as defined above, net of outstanding bank overdrafts.
Borrowings Borrowings are initially recognised at fair value, net of transaction costs incurred. Borrowings are subsequently stated at amortised cost; any difference between the proceeds (net of transaction costs) and the redemption value is recognised in the income statement over the period of the borrowings using the effective interest method.
Preference shares are classified as liabilities. The dividends on these preference shares are recognised in the income statement as finance costs.
Borrowing costs are recognised as an expense in the period in which they are incurred, except for interest costs incurred on the financing of major projects, which are capitalised until the time that the projects are available for use.

95 Marston’s PLC Annual Report and Accounts 2020Financial Statem
ents
1 Accounting policies (continued)
Trade payables and other payables Trade payables and other payables are recognised initially at fair value and subsequently measured at amortised cost using the effective interest method.
Employee benefits Pension costs for the Group’s defined benefit pension plan are determined by the Projected Unit Credit Method, with actuarial calculations being carried out at each period end date. Costs are recognised in the income statement within operating expenses and net finance costs. The current service cost, past service cost and gains or losses arising from settlements are included within operating expenses. The net interest on the net defined benefit asset/liability is included within non-underlying finance income or costs and the administrative expenses paid from plan assets are included within finance costs.
Actuarial gains or losses arising from experience adjustments and changes in actuarial assumptions are recognised in full in the period in which they occur in the statement of comprehensive income. The return on plan assets, excluding amounts included in the net interest on the net defined benefit asset/liability, is also recognised in other comprehensive income.
The asset/liability recognised in the balance sheet for the defined benefit pension plan is the fair value of plan assets less the present value of the defined benefit obligation. Where the fair value of plan assets exceeds the present value of the defined benefit obligation, the Group recognises an asset at the lower of the fair value of plan assets less the present value of the defined benefit obligation, and the present value of any economic benefits available in the form of refunds from the plan or reductions in future contributions to the plan.
Should contributions payable under a minimum funding requirement not be available as a refund or reduction in future contributions after they are paid into the plan, a liability would be recognised to this extent when the obligation arose.
Pension costs for the Group’s defined contribution pension plans are charged to the income statement in the period in which they arise.
Post-retirement medical benefits are accounted for in an identical way to the Group’s defined benefit pension plan.
Key management personnel Key management personnel are those who have authority and responsibility for planning, directing and controlling the activities of the Group. In the case of Marston’s PLC, the key management personnel are the Directors of the Group and as such the Directors are related parties of the Group.
Current and deferred tax The current tax charge is calculated on the basis of the tax laws enacted or substantively enacted at the balance sheet date and is measured at the amount expected to be paid to, or recovered from, the tax authorities.
Deferred tax is provided in full, using the liability method, on all differences that have originated but not reversed by the balance sheet date, and which give rise to an obligation to pay more or less tax in the future. Differences are defined as the differences between the carrying value of assets and liabilities and their tax base.
Deferred tax assets are recognised to the extent that it is probable that future taxable profit will be available against which the assets can be utilised.
Deferred tax is calculated using tax rates that are expected to apply when the related deferred tax asset is realised or the deferred tax liability is settled.
Provisions Provisions are recognised in the balance sheet when the Group has a present legal or constructive obligation as a result of a past event and it is probable that an outflow of economic benefits will be required to settle the obligation.
Provisions are recognised for the reinstatement costs of leasehold properties at the end of the lease term. Where leasehold properties are empty and/or loss making the unavoidable ongoing future costs associated with the properties are also recognised as provisions. Following the adoption of IFRS 16 ‘Leases’ in the current period rent is now excluded from these costs.
These provisions are measured at the present value of the expenditure expected to be required to settle the obligation using a pre-tax rate that reflects current market assessments of the time value of money and the risks specific to the obligation for which the estimates of future cash flows have not been adjusted. The key assumptions used in the discounted cash flow calculations are the discount and inflation rates and the expected future expenditure.
Share‑based payments The fair value of share-based remuneration at the date of grant is calculated using the Black-Scholes option-pricing model and charged to the income statement on a straight-line basis over the vesting period of the award. The charge to the income statement takes account of the estimated number of shares that will vest.
Non-vesting conditions are taken into account when determining the fair value of the Group’s share-based payments, and all cancellations of share-based payments, whether by the Group or by employees, are accounted for in an identical manner with any costs unrecognised at the date of cancellation being immediately accelerated.
Own shares Own shares comprise treasury shares, and shares held on trust for employee share schemes, which are used for the issuing of shares to applicable employees. Own shares are recognised at cost as a deduction from shareholders’ equity. Subsequent consideration received for the sale of such shares is also recognised in equity, with any difference between the sale proceeds and the original cost being taken to equity. No income or expense is recognised in the performance statements on own share transactions.

Marston’s PLC Annual Report and Accounts 2020
96
Notes continued For the 53 weeks ended 3 October 2020
1 Accounting policies (continued)
Dividends Dividends proposed by the Board but unpaid at the period end are recognised in the financial statements when they have been approved by the shareholders. Interim dividends are recognised when paid.
Transactions and balance sheet items in a foreign currency Transactions in a foreign currency are translated to sterling using the exchange rate at the date of the transaction. Monetary receivables and payables are remeasured at closing day rates at each balance sheet date. Exchange gains or losses that arise from such remeasurement and on settlement of the transaction are recognised in the income statement. Translation differences for non-monetary assets valued at fair value through profit or loss are reported as part of the fair value gain or loss. Gains or losses on disposal of non-monetary assets are recognised in the income statement.
Government grants Government grants are recognised when there is reasonable assurance the grants will be received and the conditions of the grant will be complied with. Income from government grants is included within other operating income.
Key estimates and significant judgements IFRS requires the Group to make estimates and assumptions that affect the application of policies and reported amounts. Estimates and judgements are continually evaluated and are based on historical experience and other factors including expectations of future events that are believed to be reasonable under the circumstances. Actual results may differ from these estimates. The Group’s key assumptions and significant judgements are in respect of non-underlying items, property, plant and equipment, impairment, retirement benefits and financial instruments. Further details are provided in the relevant accounting policy or detailed note to the financial statements.
The following judgements (apart from those involving estimates) have had the most significant effect on amounts recognised in the financial statements:
Non-underlying items • Determination of items to be classified as non-underlying (see accounting policy).
The following estimates and assumptions have a significant risk of causing a material adjustment to the carrying amount of assets and liabilities:
Property, plant and equipment • Valuation of effective freehold land and buildings (note 12).
Impairment • Assumptions made in the value in use calculation, in particular the cash flow projections, the pre-tax discount rate applied to the cash flow projections and
the growth rate used to extrapolate projected cash flows beyond the cash flow projection period (notes 10 and 11).
Retirement benefits • Actuarial assumptions in respect of the defined benefit pension plan, which include discount rates, rates of increase in pensions, inflation rates and life
expectancies (note 15).
Financial instruments • Valuation of financial instruments that are not traded in an active market (note 25).
2 Segment reporting 2019
(Restated) Revenue by segment
2020 £m
515.5 £m
Pubs and Bars 784.2 Brewing 305.5 389.3 Group Services – Total revenue 1,173.5 Revenue from discontinued operations (389.3) Revenue from continuing operations
–821.0
(305.5)515.5
2020 £m
84.7
784.2
2019 (Restated)
Underlying operating profit by segment £m
Pubs and Bars 167.5 Brewing 17.3 32.6 Group Services (27.3) Underlying operating profit 172.8 Underlying operating profit from discontinued operations (32.6) Underlying operating profit from continuing operations 140.2 Non-underlying operating items (59.3) Operating (loss)/profit 80.9 Net finance costs (125.6) Loss before taxation from continuing operations
(28.0) 74.0 (17.3) 56.7
(342.2) (285.5) (103.2) (388.7) (44.7)

Marston’s PLC Annual Report and Accounts 2020Financial Statem
ents
97
5.11
2 Segment reporting (continued) Additions to Depreciation and
non-current assets* amortisation 2019
(Restated) Other segment information
2020 (Restated) 2020 £m £m £m
2019
48.9 36.9 £m
Pubs and Bars 104.9 26.3 Brewing 7.2 16.7 9.7 Group Services 7.6 4.4 Total 42.2 Discontinued operations (11.5) Continuing operations
6.2 5.062.3 129.2 51.6 (7.2) (16.7) (9.7)
55.1 112.5 41.9 30.7
* Excludes amounts relating to deferred tax, retirement benefits and financial instruments.
In the prior period the Group had four distinguishable operating segments being Destination and Premium, Taverns, Brewing and Group Services. Following a reorganisation of the pub operational and commercial structure, the pub business has now merged into one segment and is no longer operated as Destination and Premium and Taverns. Since the start of the current period the results of the merged operations have been presented as one combined ‘Pubs and Bars’ segment in the reporting to the chief operating decision maker and management decisions are now made on a combined basis. The results for the 52 weeks ended 28 September 2019 have been restated to reflect the merging of these two segments.
Geographical areas Revenue generated outside the United Kingdom during the period was £11.0 million (2019: £12.8 million). This relates wholly to discontinued operations and the Brewing segment. All of the Group’s assets are located in the UK.
3 Revenue and operating expenses 2019
Revenue £m
Retail sales 722.8 Wholesale sales 46.7 Revenue from contracts with customers 769.5 Rental income 14.7 Total revenue from continuing operations
2020 £m
479.5 27.5
507.0 8.5
515.5
2020 £m
1.0
784.2
2019 (Restated)
Operating expenses £m
Change in stocks of finished goods and work in progress (0.5) Own work capitalised (3.0) (7.9) Other operating income (37.5) (8.0) Raw materials, consumables and excise duties 146.9 231.5 Depreciation of property, plant and equipment 38.9 29.2 Amortisation of intangible assets 3.0 1.5 Employee costs 174.4 188.9 Hire of plant and machinery 1.0 1.8 Property lease rentals – 19.5 Impairment of freehold and leasehold properties 106.8 38.1 Impairment of goodwill 200.6 – Other net operating charges 209.2 Operating expenses for continuing operations
168.9 801.0 703.3
Government grants of £33.3 million (2019: £nil) in respect of the Coronavirus Job Retention Scheme and £0.8 million (2019: £nil) in respect of the Retail, Hospitality and Leisure Grant Fund are included within other operating income from continuing operations.
The amounts included in the line items above which have been classified as non-underlying are as follows:
2020 £m
2019 (Restated)
£m
Raw materials, consumables and excise duties 3.9 – Employee costs 2.0 5.5 Impairment of freehold and leasehold properties 105.1 37.6 Impairment of goodwill 200.6 – Other net operating charges 30.6 16.2
342.2 59.3

Marston’s PLC Annual Report and Accounts 2020
98
Notes continued For the 53 weeks ended 3 October 2020
3 Revenue and operating expenses (continued)
Fees payable to the Company’s Auditor were as follows: 2020
£m 2019
£m
Fees payable to the Company’s Auditor for the audit of the Company’s annual accounts 0.3 0.2 Fees payable to the Company’s Auditor for other services to the Group:
The audit of the Company’s subsidiaries 0.2 0.1 Audit related assurance services 0.1
0.4 0.1 0.6
Fees in the current period were payable to KPMG LLP and fees in the prior period were payable to PricewaterhouseCoopers LLP.
4 Non-underlying items 2019
(Restated) £m
Non-underlying operating items Impact of change in rate assumptions used for provisions – 2.3 Reorganisation and integration costs – 1.0 Impairment of freehold and leasehold properties 105.1 37.6 Write-off of EPOS equipment – 3.9 Write-off of acquisition and development costs 0.9 9.9 Past service cost in respect of Guaranteed Minimum Pension equalisation – 4.6 Impairment of goodwill 200.6 – Portfolio disposals 22.4 – Impact of COVID-19 16.4 – VAT claims
2020 £m
– 59.3
Non-underlying non-operating items Net interest on net defined benefit asset/liability 0.6 (0.5) Swap recouponing fees – 0.6 Interest on VAT claims (1.0) – COVID-19 financing costs 2.1 – Interest rate swap movements
(3.2) 342.2
48.7 48.8
Total non-underlying items for continuing operations
6.48.1
350.3 108.1
Impairment of freehold and leasehold properties In light of the COVID-19 outbreak the Group undertook a detailed valuation review of its pub estate in the current period, which resulted in the impairment of a number of these properties.
In the prior period, due to changes in the market and pub performance, the Group undertook a detailed valuation review of its Destination and Premium estate and subsequently impaired a number of these properties.
The revaluation adjustments in respect of the above relate wholly to the Pubs and Bars segment and were recognised in the revaluation reserve or income statement as appropriate.
Write-off of acquisition and development costs In the prior period the Group decided to focus its capital expenditure upon its existing estate and as such acquisition and development costs of £9.9 million in respect of sites which the Group no longer intended to acquire and/or develop were written off. Further costs in respect of these sites of £0.9 million were incurred in the current period.
Impairment of goodwill The Group has fully impaired the goodwill allocated to the Pubs and Bars segment in the current period (note 10). The inputs to the value in use calculation were significantly impacted by the COVID-19 outbreak.
Portfolio disposals As part of its debt reduction strategy, the Group disposed of two portfolios of smaller wet-led leased, tenanted and franchised pubs and associated properties in the current period. The net loss on disposal and associated costs have been classified as a non-underlying item, together with dilapidations costs from a previous portfolio disposal.

99 Marston’s PLC Annual Report and Accounts 2020Financial Statem
ents
4 Non-underlying items (continued)
Impact of COVID-19 In order to mitigate the spread of COVID-19 the UK government required the closure of all pubs from 21 March 2020 to 3 July 2020 and has introduced various other social distancing measures and restrictions. This has had a significant impact on the Group’s business and its customers. Certain associated costs/ charges, which primarily comprise bad debt provisions and stock write-offs, have been classified as a non-underlying item.
VAT claims In the current period the Group has recognised a net credit of £3.2 million in respect of VAT claims, along with the associated interest of £1.0 million. This comprises credits received from HM Revenue & Customs (HMRC) in relation to VAT on gaming machine income, following HMRC’s decision not to further appeal the case brought by The Rank Group Plc, net of the reversal of amounts previously recognised in respect of VAT on pension scheme management expenses.
Net interest on net defined benefit asset/liability The net interest on the net defined benefit asset/liability in respect of the Group’s defined benefit pension plan was a charge of £0.6 million (2019: credit of £0.5 million) (note 15).
COVID-19 financing costs As a result of the COVID-19 outbreak and the consequential impact on its trading ability, the Group obtained additional financing facilities and certain waivers from its lenders, primarily in respect of covenants. The costs related to this have been classified as a non-underlying item.
Interest rate swap movements The Group’s interest rate swaps are revalued to fair value at each balance sheet date. For interest rate swaps which were designated as part of a hedging relationship a loss of £3.8 million (2019: £20.5 million) has been recognised in the hedging reserve in respect of the effective portion of the fair value movement and £6.7 million (2019: £7.7 million) has been reclassified from the hedging reserve to underlying finance costs in the income statement in respect of the cash paid in the period. The ineffective portion of the fair value movement has been recognised within the income statement. The cash paid of £1.7 million (2019: £1.8 million) has been recognised within underlying finance costs to ensure that underlying finance costs reflect the resulting fixed rate paid on the associated debt. The remainder of the ineffective portion of the fair value movement, a gain of £0.5 million (2019: £1.5 million), has been recognised within non-underlying items. In addition £14.6 million (2019: £3.5 million) of the balance remaining in the hedging reserve in respect of discontinued cash flow hedges has been reclassified to the income statement within non-underlying items.
For interest rate swaps which were not designated as part of a hedging relationship the fair value movement has been recognised within the income statement. The net cash paid of £11.4 million (2019: £1.3 million received) has been recognised within underlying finance costs to ensure that underlying finance costs reflect the resulting fixed rate paid on the associated debt. The remainder of the fair value movement, a gain of £7.7 million (2019: loss of £46.7 million), equal to the change in the carrying value of the interest rate swaps in the period, or from when hedge accounting ceased to be applied, has been recognised within non-underlying items.
As a result of the recouponing of the interest rate swap that fixes the interest rate payable on the floating rate elements of the Group’s A1, A2, A3 and B securitised notes on 27 March 2019, the hedging relationship between this interest rate swap and the associated debt ceased to meet the qualifying criteria for hedge accounting. The cumulative hedging loss existing in equity at 27 March 2019 remained in equity and is being recognised when the forecast transactions are ultimately recognised in the income statement. Fair value movements in respect of this interest rate swap after 27 March 2019 have been recognised wholly within the income statement.
Impact of taxation The current tax credit relating to the above non-underlying items amounts to £3.2 million (2019 (restated): £1.4 million). The deferred tax credit relating to the above non-underlying items amounts to £20.6 million (2019 (restated): £14.7 million). In addition, there is a non-underlying deferred tax credit of £1.8 million (2019: £nil) in relation to the change in corporation tax rate.
Prior period non-underlying items The update of the discount rate assumptions used in the calculation of the Group’s property lease provisions resulted in an increase of £2.3 million in the total provision in the prior period.
During the prior period the Group incurred reorganisation and integration costs of £1.0 million.
Due to the rollout of the Group’s new EPOS system the assets relating to the old system were written off in the prior period.
On 26 October 2018 a High Court ruling indicated that Guaranteed Minimum Pensions must be equalised for men and women. This requirement was reflected in the calculation of the Group’s net defined benefit asset/liability at 28 September 2019 and the resulting additional past service cost was presented as a non-underlying item in the prior period.
In the prior period the Group incurred fees of £0.6 million in relation to the above swap recouponing undertaken in the period.

100 Marston’s PLC Annual Report and Accounts 2020
5.211
Notes continued For the 53 weeks ended 3 October 2020
5 Employees 2019
Employee costs 2020
£m
205.216.6 9.90.40.4
232.5 (58.1)174.4
£m
Wages and salaries Social security costs 17.6 Pension costs 14.4 Share-based payments 0.3 Termination costs 2.3 Employee costs 246.1 Employee costs for discontinued operations (57.2) Employee costs for continuing operations 188.9
A non-underlying charge of £2.0 million (2019: £5.5 million) is included in employee costs for continuing operations.
Average monthly number of employees 2020
Number 2019
Number
Bar staff 10,392 11,139 Management, administration and production 2,924 2,914
Key management personnel compensation 2020
£m 2019
£m
Short-term employee benefits 1.4 1.6 Share-based payments 0.1 –
1.5 1.6
6 Finance costs and income
Finance costs 2020
£m
2019 (Restated)
£m
Bank borrowings 15.9 14.0 Securitised debt 40.4 40.4 Lease liabilities 16.1 1.3 Other lease related borrowings 20.9 19.9 Other interest payable and similar charges 2.8 1.6
96.1 77.2 Non-underlying finance costs Net interest on net defined benefit asset/liability 0.6 – Swap recouponing fees – 0.6 COVID-19 financing costs 2.1 –
2.7 0.6 Total finance costs 98.8 77.8
Finance income Deposit and other interest receivable (1.0) (0.4)
(1.0) (0.4) Non-underlying finance income Net interest on net defined benefit asset/liability – (0.5) Interest on VAT claims (1.0) –
(1.0) (0.5) Total finance income (2.0) (0.9)
Interest rate swap movements Hedge ineffectiveness on cash flow hedges (net of cash paid) (0.5) (1.5) Change in carrying value of interest rate swaps (7.7) 46.7 Transfer of hedging reserve balance in respect of discontinued hedges 14.6 3.5
6.4 48.7 Net finance costs for continuing operations 103.2 125.6

Marston’s PLC Annual Report and Accounts 2020Financial Statem
ents
101
7 Taxation
Income statement Current tax
Current period Adjustments in respect of prior periods Credit in respect of tax on non-underlying items
Deferred tax Current period (4.3) 6.0 Adjustments in respect of prior periods (7.1) (2.0) Credit in respect of tax on non-underlying items (20.6) (14.7) Non-underlying credit in relation to the change in tax rate (1.8) –
(33.8) (10.7) Taxation credit for continuing operations reported in the income statement (40.2) (7.3)
Statement of comprehensive income 2020
£m
2019 (Restated)
£m
Remeasurement of retirement benefits (2.0) (9.3) Impairment and revaluation of properties (15.7) (1.3) Hedging reserve movements 0.3 (1.5) Taxation credit reported in the statement of comprehensive income (17.4) (12.1)
2020 £m
2019 (Restated)
£m
(2.9) 5.5 (0.3) (0.7)
(1.4) 3.4
(3.2) (6.4)
A deferred tax charge of £5.0 million (2019: £nil) relating to the change in corporation tax rate has been recognised in the statement of comprehensive income and is included in the above amounts.
Recognised directly in equity 2020
£m 2019
£m
Tax on share-based payments – (0.1) Taxation credit recognised directly in equity – (0.1)
The actual tax rate for the period is lower (2019: lower) than the standard rate of corporation tax of 19% (2019: 19%). The differences are explained below:
Tax reconciliation 2020
£m
2019 (Restated)
£m
Loss before tax from continuing operations (388.7) (44.7)
Loss before tax multiplied by the corporation tax rate of 19% (2019: 19%) (73.9) (8.5) Effect of: Adjustments in respect of prior periods (7.4) (2.7) Deferred tax asset not recognised 4.9 – Net deferred tax credit in respect of land and buildings (0.1) (0.2) Costs not deductible for tax purposes 0.6 3.7 Impairment of goodwill 38.1 – Other amounts upon which tax relief is available (0.6) (0.6) Impact of difference between deferred and current tax rates – 1.0 Impact of change in tax rate (1.8) – Taxation credit for continuing operations (40.2) (7.3)
A UK corporation tax rate of 19% (effective from 1 April 2020) was substantively enacted on 17 March 2020, reversing the previously enacted reduction in the rate from 19% to 17% from 1 April 2020. This will increase the Group’s future current tax charge accordingly. The deferred tax assets and liabilities at 3 October 2020 have been calculated at 19% (2019: 17%).
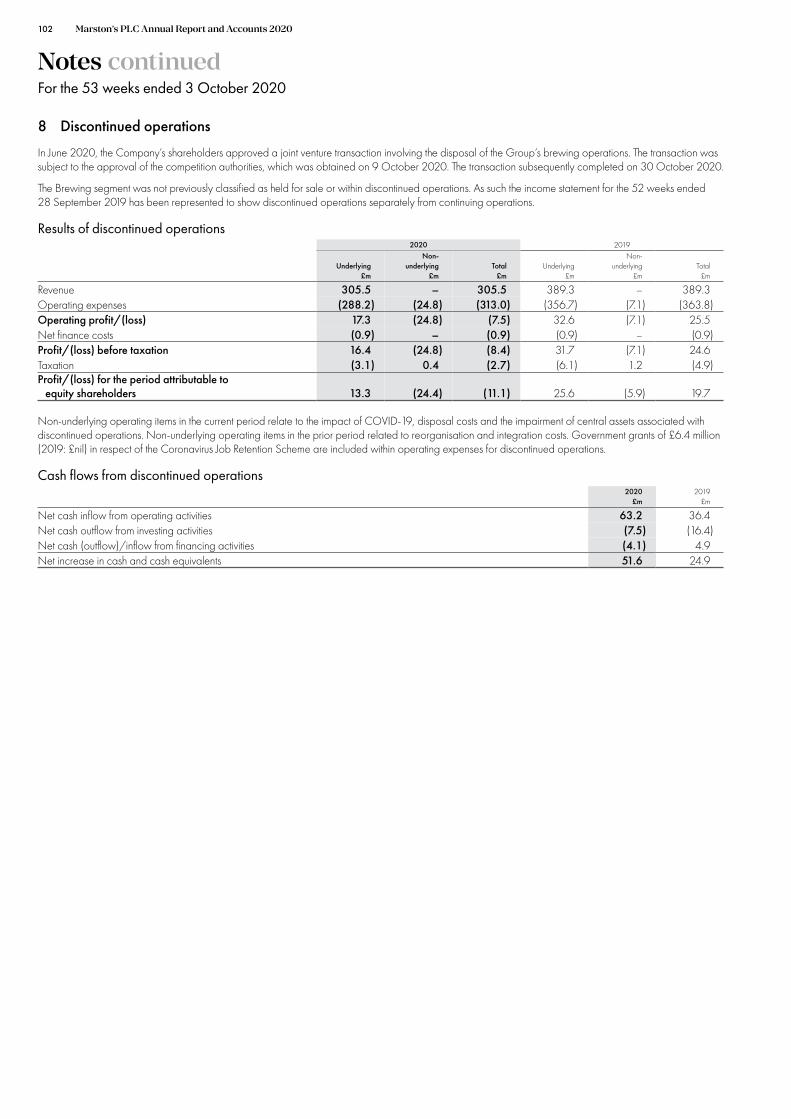
Marston’s PLC Annual Report and Accounts 2020
102
Notes continued For the 53 weeks ended 3 October 2020
8 Discontinued operations
In June 2020, the Company’s shareholders approved a joint venture transaction involving the disposal of the Group’s brewing operations. The transaction was subject to the approval of the competition authorities, which was obtained on 9 October 2020. The transaction subsequently completed on 30 October 2020.
The Brewing segment was not previously classified as held for sale or within discontinued operations. As such the income statement for the 52 weeks ended 28 September 2019 has been represented to show discontinued operations separately from continuing operations.
Results of discontinued operations 2020 2019
Underlying £m
Non- underlying
£m Total
£m Underlying
£m
Non-underlying
£m Total
£m
Revenue 305.5 – 305.5 389.3 – 389.3 Operating expenses (288.2) (24.8) (313.0) (356.7) (7.1) (363.8) Operating profit/(loss) 17.3 (24.8) (7.5) 32.6 (7.1) 25.5 Net finance costs (0.9) – (0.9) (0.9) – (0.9) Profit/(loss) before taxation 16.4 (24.8) (8.4) 31.7 (7.1) 24.6 Taxation (3.1) 0.4 (2.7) (6.1) 1.2 (4.9) Profit/(loss) for the period attributable to
equity shareholders 13.3 (24.4) (11.1) 25.6 (5.9) 19.7
Non-underlying operating items in the current period relate to the impact of COVID-19, disposal costs and the impairment of central assets associated with discontinued operations. Non-underlying operating items in the prior period related to reorganisation and integration costs. Government grants of £6.4 million (2019: £nil) in respect of the Coronavirus Job Retention Scheme are included within operating expenses for discontinued operations.
Cash flows from discontinued operations 2019
£m
Net cash inflow from operating activities 36.4 Net cash outflow from investing activities (16.4) Net cash (outflow)/inflow from financing activities 4.9 Net increase in cash and cash equivalents
2020 £m
63.2(7.5) (4.1)51.6 24.9

103 Marston’s PLC Annual Report and Accounts 2020Financial Statem
ents
9 Earnings per ordinary share
Basic earnings per share are calculated by dividing the profit/loss attributable to equity shareholders by the weighted average number of ordinary shares in issue during the period, excluding treasury shares and those held on trust for employee share schemes.
For diluted earnings per share, the weighted average number of ordinary shares in issue is adjusted to assume conversion of all dilutive potential ordinary shares. These represent share options granted to employees where the exercise price is less than the weighted average market price of the Company’s shares during the period.
Underlying earnings per share figures are presented to exclude the effect of non-underlying items. The Directors consider that the supplementary figures are a useful indicator of performance.
Basic (loss)/earnings per share Total Continuing Discontinued
Diluted (loss)/earnings per share Total Continuing Discontinued
Underlying (loss)/earnings per share figures Basic underlying (loss)/earnings per share
Total Continuing Discontinued
Diluted underlying (loss)/earnings per share Total Continuing Discontinued
2020 2019
(Restated)
Earnings £m
Per share amount
p Earnings
£m
Per share amount
p
(359.6) (56.8) (17.7) (2.8) (348.5) (55.1) (37.4) (5.9)
(11.1) (1.8) 19.7 3.1
(359.6) (56.8) (17.7) (2.8) (348.5) (55.1) (37.4) (5.9)
(11.1) (1.8) 19.7 3.1
(10.5) (1.7) 80.2 12.7 (23.8) (3.8) 54.6 8.6 13.3 2.1 25.6 4.0
(10.5) (1.7) 80.2 12.7 (23.8) (3.8) 54.6 8.6 13.3 2.1 25.6 4.0
2020 m
2019 (Restated)
m
Basic weighted average number of shares 632.7 632.6 Dilutive potential ordinary shares – – Diluted weighted average number of shares 632.7 632.6
In accordance with IAS 33 ‘Earnings per Share’ the potential ordinary shares are not dilutive as their inclusion would reduce the loss per share.

Marston’s PLC Annual Report and Accounts 2020
104
Notes continued For the 53 weeks ended 3 October 2020
10 Goodwill £m
Cost At 29 September 2019 231.4 Net transfers to assets held for sale and disposals (29.7) At 3 October 2020 201.7
Aggregate impairment At 29 September 2019 1.1 Charged in the period 200.6 At 3 October 2020 201.7
Net book amount at 28 September 2019 Net book amount at 3 October 2020 –
£m
Cost At 30 September 2018 and 28 September 2019
Aggregate impairment At 30 September 2018 and 28 September 2019
Net book amount at 29 September 2018 230.3 Net book amount at 28 September 2019 230.3
Impairment testing of goodwill Goodwill has been allocated to cash generating units which comprise the Group’s operating segments, and the value of the recoverable amounts allocated to those segments has been estimated and compared to the carrying amounts. Recoverable amounts are determined based on the higher of value in use and fair value less costs to sell.
Goodwill has been allocated to operating segments based on the extent to which the benefits of acquisitions flow to that segment, as follows:
2020 £m
2019 (Restated)
£m
Pubs and Bars – 200.6 Brewing – 29.7
– 230.3
The allocation by operating segment for the prior period has been restated for the merging of the Destination and Premium and Taverns segments as these are no longer independent cash generating units (note 2). The goodwill allocated to the Brewing segment was transferred to assets held for sale in the current period.
The key assumptions used in determining value in use are the cash flow projections, which are derived from the Board approved budgets and five-year strategic plans, the pre-tax discount rate applied to the cash flow projections of 10.8% (2019: 5.2%) and the growth rate used to extrapolate the cash flows beyond the five-year projections of 1.5% (2019: 2.0%). Risk factors are considered to be similar in each of the Group’s operating segments. Other commercial assumptions relate to market growth, market share and net selling prices. These assumptions are based on historic trends adjusted for management estimates of future prospects. These estimates take account of economic forecasts, marketing plans, political factors and assessments of competitors’ strategy. The discount rate used is the Group’s weighted average cost of capital adjusted to reflect market conditions.
The above impairment tests required an impairment of £200.6 million in the current period reducing the balance of goodwill to £nil. This impairment charge is included within non-underlying operating expenses (note 4). The impairment related to the Pubs and Bars segment which has a recoverable amount of £1,954.2 million calculated on a value in use basis. The COVID-19 outbreak had a significant impact on the inputs to the value in use calculation, increasing the discount rate and reducing the forecast cash flows and growth rate.
In the prior period the impairment tests demonstrated that the Group had substantial levels of headroom and as such no impairment of goodwill was required.
230.3
231.4
1.1

Marston’s PLC Annual Report and Accounts 2020Financial Statem
ents
105
7.11
11 Other intangible assets Acquired Lease Computer Development
brands premiums software costs Total £m £m £m £m £m
Cost At 29 September 2019 62.1 1.5 31.1 0.1 94.8 Adjustment for adoption of IFRS 16 – (1.5) – – (1.5) Additions – – 7.11 – Net transfers to assets held for sale and disposals (62.1) – (1.2) (0.1) (63.4) At 3 October 2020 – – 41.6 – 41.6
Amortisation At 29 September 2019 – 0.8 5.4 0.1 6.3 Adjustment for adoption of IFRS 16 – (0.8) – – (0.8) Charge for the period – – 3.0 – 3.0 Impairment – – 1.2 – 1.2 Net transfers to assets held for sale and disposals – – (0.5) (0.1) (0.6) At 3 October 2020 – – 9.1 – 9.1
Net book amount at 28 September 2019 62.1 0.7 25.7 – 88.5 Net book amount at 3 October 2020 – – 32.5 – 32.5
Acquired brands are initially recognised at their fair value on acquisition. Given the anticipated level of investment in acquired brands, and there being no legal or regulatory limits to their useful lives, they are regarded as having indefinite useful lives and no annual amortisation is provided.
Lease premiums classified as intangible assets were those acquired with new subsidiaries.
Acquired brands
£m
Lease premiums
£m
Computer software
£m
Development costs
£m Total
£m
Cost At 30 September 2018 62.1 1.5 12.5 0.1 76.2 Additions – – 20.3 – 20.3 Net transfers to assets held for sale and disposals – – (1.7) – (1.7) At 28 September 2019 62.1 1.5 31.1 0.1 94.8
Amortisation At 30 September 2018 – 0.8 5.3 0.1 6.2 Charge for the period – – 1.5 – 1.5 Net transfers to assets held for sale and disposals – – (1.4) – (1.4) At 28 September 2019 – 0.8 5.4 0.1 6.3
Net book amount at 29 September 2018 Net book amount at 28 September 2019
62.1 62.1
0.7 0.7
7.2 25.7
– –
70.0 88.5
Acquired brands related to Brewing. The carrying value of acquired brands was split as follows: 2019
£m
Wychwood 13.6 Jennings 2.8 Ringwood 2.9 Thwaites 12.8 Eagle 30.0
62.1
Impairment testing of acquired brands In the current period acquired brands were transferred to assets held for sale. Prior to this the carrying values of acquired brands were subject to annual impairment reviews.
In the prior period the recoverable amount of each brand was determined based on the higher of value in use and fair value less costs to sell. The fair value of each brand was determined by applying an appropriate earnings multiple to the anticipated future income generated by that brand. The key assumptions used in determining the value in use of each brand were the cash flow projections, which were derived from the Board approved budgets and strategic plans, the pre-tax discount rate of 5.2% and the long-term growth rate used to extrapolate cash flows beyond the cash flow projection period of 2.0%. These assumptions were based on historic trends adjusted for management estimates of future prospects, and took account of economic forecasts, marketing plans, political factors and assessments of competitors’ strategy. The discount rate used was the Group’s weighted average cost of capital adjusted to reflect market conditions. These impairment tests demonstrated that the Group had sufficient levels of headroom and as such no impairment of acquired brands was required in the prior period. Reasonably possible scenarios under sensitivity analysis also did not result in an impairment.

Marston’s PLC Annual Report and Accounts 2020
106
Notes continued For the 53 weeks ended 3 October 2020
12 Property, plant and equipment Effective freehold land and buildings
£m
Leasehold land and buildings
£m
Plant and machinery
£m
Fixtures, fittings,
tools and equipment
£m Total
£m
Cost or valuation At 29 September 2019 (as originally reported) 2,004.4 110.2 86.6 333.6 2,534.8 Adjustment for asset class split – (19.0) – – (19.0) At 29 September 2019 (as restated) 2,004.4 91.2 86.6 333.6 2,515.8 Adjustment for adoption of IFRS 16 – 315.2 1.2 0.4 316.8 Additions 22.6 5.6 3.4 19.0 50.6 Net transfers to assets held for sale and disposals (157.5) (20.0) (91.1) (74.3) (342.9) Revaluation (243.9) – – – (243.9) At 3 October 2020 1,625.6 392.0 0.1 278.7 2,296.4
Depreciation At 29 September 2019 (as originally reported) 0.8 5.1 35.7 142.8 184.4 Adjustment for asset class split – 25.3 – – 25.3 At 29 September 2019 (as restated) 0.8 30.4 35.7 142.8 209.7 Adjustment for adoption of IFRS 16 – 71.1 0.8 0.3 72.2 Charge for the period 0.4 12.7 5.5 30.0 48.6 Net transfers to assets held for sale and disposals (1.1) (6.7) (41.9) (39.2) (88.9) Impairment – 13.8 – 2.7 16.5 At 3 October 2020 0.1 121.3 0.1 136.6 258.1
Net book amount at 28 September 2019 (as restated) 2,003.6 60.8 50.9 190.8 2,306.1 Net book amount at 3 October 2020 1,625.5 270.7 – 142.1 2,038.3
Effective freehold Leasehold Fixtures, land and land and fittings, buildings buildings Plant and tools and Total
(Restated) (Restated) machinery equipment (Restated) £m £m £m £m £m
Cost or valuation At 30 September 2018 (as originally reported) 2,059.9 106.2 84.8 344.7 2,595.6 Adjustment for asset class split – (18.9) – – (18.9) At 30 September 2018 (as restated) 2,059.9 87.3 84.8 344.7 2,576.7 Additions 60.5 8.0 6.5 33.9 108.9 Net transfers to assets held for sale and disposals (57.0) (4.1) (4.7) (45.0) (110.8) Revaluation (59.0) – – – (59.0) At 28 September 2019 (as restated) 2,004.4 91.2 86.6 333.6 2,515.8
Depreciation At 30 September 2018 (as originally reported) 0.4 2.0 32.8 152.3 187.5 Adjustment for asset class split – 27.6 – – 27.6 At 30 September 2018 (as restated) 0.4 29.6 32.8 152.3 215.1 Charge for the period 0.4 3.0 7.0 30.3 40.7 Net transfers to assets held for sale and disposals – (3.4) (4.1) (40.0) (47.5) Impairment – 1.2 – 0.2 1.4 At 28 September 2019 (as restated) 0.8 30.4 35.7 142.8 209.7
Net book amount at 29 September 2018 (as restated) 2,059.5 57.7 52.0 192.4 2,361.6 Net book amount at 28 September 2019 (as restated) 2,003.6 60.8 50.9 190.8 2,306.1

107 Marston’s PLC Annual Report and Accounts 2020Financial Statem
ents
12 Property, plant and equipment (continued)
The net book amount of land and buildings is split as follows:
2020 £m
2019 (Restated)
£m
Freehold land and buildings 1,469.5 1,814.9 Leasehold land and buildings with a term greater than 100 years at acquisition/commencement 156.0 188.7 Leasehold land and buildings with a term less than 100 years at acquisition/commencement 270.7 60.8
1,896.2 2,064.4
If the effective freehold land and buildings had not been revalued, the historical cost net book amount would be £1,147.4 million (2019 (restated): £1,355.7 million).
Cost at 3 October 2020 includes £6.4 million (2019: £9.9 million) of assets in the course of construction.
Interest costs of £0.3 million (2019: £1.6 million) were capitalised in the period in respect of the financing of major projects. The capitalisation rate used was 5% (2019: 5%).
The net loss on disposal of property, plant and equipment, intangible assets and assets held for sale was £20.8 million (2019 (restated): £13.8 million).
Capital expenditure authorised and committed at the period end but not provided for in the financial statements was £2.3 million (2019: £3.5 million).
The net book amount of effective freehold land and buildings held as part of sale and leaseback arrangements that do not fall within the scope of IFRS 16 ‘Leases’ or IAS 17 ‘Leases’ was £269.0 million (2019: £348.6 million). The net book amount of plant and machinery held as security for bank borrowings was £nil (2019: £12.5 million).
The disaggregation of land and buildings into assets leased to tenants under operating leases and those held and used by the Group is as follows:
2020
Effective freehold land and buildings
Leased to tenants
£m
Used by the Group
£m Total
£m
Cost or valuation 279.9 1,345.7 1,625.6 Depreciation (0.1) – (0.1) Net book amount 279.8 1,345.7 1,625.5
2020
Leasehold land and buildings
Leased to tenants
£m
Used by the Group
£m Total
£m
Cost 12.1 379.9 392.0 Depreciation (7.6) (113.7) (121.3) Net book amount 4.5 266.2 270.7
Revaluation/impairment During the current and prior period various properties were reviewed for impairment and/or material changes in value. These valuation adjustments were recognised in the revaluation reserve or the income statement as appropriate.
2020 £m
2019 (Restated)
£m
Income statement: Impairment (109.2) (39.4) Reversal of past impairment – 1.3
(109.2) (38.1) Revaluation reserve: Unrealised revaluation surplus – 2.8 Reversal of past revaluation surplus (151.2) (25.1)
(151.2) (22.3) Net decrease in shareholders’ equity/property, plant and equipment (260.4) (60.4)

Marston’s PLC Annual Report and Accounts 2020
108
Notes continued For the 53 weeks ended 3 October 2020
12 Property, plant and equipment (continued)
Fair value of effective freehold land and buildings IFRS 13 ‘Fair Value Measurement’ requires fair value measurements to be recognised using a fair value hierarchy that reflects the significance of the inputs used in the measurements, according to the following levels:
Level 1 – unadjusted quoted prices in active markets for identical assets or liabilities. Level 2 – inputs other than quoted prices included within Level 1 that are observable for the asset or liability, either directly or indirectly. Level 3 – inputs for the asset or liability that are not based on observable market data.
The table below shows the level in the fair value hierarchy into which the fair value measurements of effective freehold land and buildings have been categorised:
2020 2019
(Restated)
Recurring fair value measurements Level 1
£m Level 2
£m Level 3
£m Total
£m Level 1
£m Level 2
£m Level 3
£m Total
£m
Effective freehold land and buildings: Specialised brewery properties – – – – – – 54.2 54.2 Other effective freehold land and buildings – 1,625.5 – 1,625.5 – 1,949.4 – 1,949.4
– 1,625.5 – 1,625.5 – 1,949.4 54.2 2,003.6
There were no transfers between Levels 1, 2 and 3 fair value measurements during the current or prior period.
The Level 2 fair values of effective freehold land and buildings have been obtained using a market approach, primarily using earnings multiples derived from prices in observed transactions involving comparable businesses. Whilst there are two inputs to the fair value measurement of the public house assets, being the fair maintainable trade and the multiplier applied, it is considered that the most significant input relates to the multiplier which, being indirectly observable, is a Level 2 input. Thus it has been concluded that since the most significant influence on the valuation is observable indirectly Level 2 is the most appropriate categorisation for these fair value measurements. A reasonably possible increase of 10% in the multiplier would increase the fair value by £146.5 million and a reasonably possible decrease of 10% in the multiplier would decrease the fair value by £117.2 million. A reasonably possible increase of 4% in the fair maintainable trade would increase the fair value by £57.3 million and a reasonably possible decrease of 4% in the fair maintainable trade would decrease the fair value by £51.7 million. These are based on the top ends of observable multipliers achieved in the market and historic movements in the average fair maintainable trade.
The Level 3 fair values of the specialised brewery properties were obtained using a cost approach. These breweries represent properties that are rarely, if ever, sold in the market, except by way of a sale of the business of which they are part, due to the uniqueness arising from their specialised nature, design and configuration. As such the valuation of these properties was performed using the depreciated replacement cost approach, which values the properties at the current cost of replacing them with their modern equivalents less deductions for physical deterioration and all relevant forms of obsolescence and optimisation.
The significant unobservable inputs to the Level 3 fair value measurements are: Sensitivity of fair value to unobservable inputs
Current cost of modern equivalent asset The higher the cost the higher the fair value Amount of adjustment for physical deterioration/obsolescence The higher the adjustment the lower the fair value
Level 3 recurring fair value measurements 2020
£m 2019
£m
At beginning of the period 54.2 53.1 Additions 0.2 1.5 Net transfers to assets held for sale and disposals (54.1) – Depreciation charge for the period (0.3) (0.4) At end of the period – 54.2
The Group’s effective freehold land and buildings are revalued by external independent qualified valuers at least once in each rolling three year period. The last external valuation of the Group’s effective freehold land and buildings was performed as at 28 January 2018. The Group has an internal team of qualified valuers and at each reporting date the estate is reviewed for any indication of significant changes in value. Where this is the case internal valuations are performed on a basis consistent with those performed externally.

Marston’s PLC Annual Report and Accounts 2020Financial Statem
ents
109
13 Other non-current assets 2019
£m
Trade loans 9.3 Finance lease receivables –
9.3
2020 £m
– 17.5 17.5
Further detail regarding the fair value measurement of trade loans is provided in note 25. Further detail regarding the impairment of finance lease receivables is provided in note 25.
14 Deferred tax
Deferred tax is calculated on temporary differences between tax bases of assets and liabilities and their carrying amounts under the liability method using a tax rate of 19% (2019: 17%). The movement on the deferred tax accounts is shown below:
2020 £m
2019 (Restated)
£m
58.1 81.3 (3.6) (3.6) (3.8) (3.9) 50.7 73.8 (3.0) –
– (1.2)
(33.8) (10.7) 1.0 0.5
(15.7) (1.3) 0.3 (1.5)
(0.9) (8.8) – (0.1)
(15.3) – (16.7) 50.7
Net deferred tax (asset)/liability At beginning of the period (as originally reported) Prior period adjustment Adjustment for asset class split At beginning of the period (as restated) Adjustment for adoption of IFRS 16 Adjustment for adoption of IFRS 9 (Credited)/charged to the income statement:
Continuing operations Discontinued operations
(Credited)/charged to equity: Impairment and revaluation of properties Hedging reserve Retirement benefits Share-based payments
Classified as held for sale At end of the period
Recognised in the balance sheet Deferred tax liabilities (after offsetting) Deferred tax assets (after offsetting)
2020 £m
2019 (Restated)
£m
– 56.5 (16.7) (5.8) (16.7) 50.7
The movements in deferred tax assets and liabilities (prior to the offsetting of balances within the same jurisdiction as permitted by IAS 12 ‘Income Taxes’) during the period are shown below. Deferred tax assets and liabilities are only offset where there is a legally enforceable right of offset and there is an intention to settle the balances net. Deferred tax assets have been recognised in respect of all tax losses and other temporary differences where it is probable that these assets will be recovered. A deferred tax asset of £4.9 million (2019: £nil) arising on capital losses has not been recognised due to uncertainty over its future recoverability.
Accelerated Rolled over capital Revaluation capital
Deferred tax liabilities allowances
£m of properties
£m gains
£m Other
£m Total
£m
At 29 September 2019 (as originally reported) 38.8 80.9 6.5 4.6 130.8 Prior period adjustment – (3.6) – – (3.6) Adjustment for asset class split – (3.8) – – (3.8) At 29 September 2019 (as restated) 38.8 73.5 6.5 4.6 123.4 Adjustment for adoption of IFRS 16 – 0.3 – – 0.3 (Credited)/charged to the income statement (6.4) (15.5) 0.9 0.8 (20.2) Credited to equity – (15.7) – – (15.7) Classified as held for sale (6.1) (4.4) – (5.4) (15.9) At 3 October 2020 26.3 38.2 7.4 – 71.9

Marston’s PLC Annual Report and Accounts 2020
110
0.6
Notes continued For the 53 weeks ended 3 October 2020
14 Deferred tax (continued)
Deferred tax assets Pensions
£m Tax losses
£m
Hedging reserve
£m
Interest rate
swaps £m
Other £m
Total £m
At 29 September 2019 (6.1) (26.8) (25.8) (12.6) (1.4) (72.7) Adjustment for adoption of IFRS 16 – – – – (3.3) (3.3) Credited to the income statement – (2.9) – (2.9) (6.8) (12.6) (Credited)/charged to equity (0.9) – 0.3 – – (0.6) Classified as held for sale – – – – 0.6 At 3 October 2020 (7.0) (29.7) (25.5) (15.5) (10.9) (88.6)
Net deferred tax liability/(asset) At 28 September 2019 (as restated) At 3 October 2020
50.7 (16.7)
Deferred tax liabilities Pensions
£m
Accelerated capital
allowances £m
Revaluation of properties
(Restated) £m
Rolled over capital
gains £m
Other £m
Total (Restated)
£m
At 30 September 2018 (as originally reported) 2.7 35.0 87.7 6.8 4.3 136.5 Prior period adjustment – – (3.6) – – (3.6) Adjustment for asset class split – – (3.9) – – (3.9) At 30 September 2018 (as restated) Charged/(credited) to the income statement Credited to equity At 28 September 2019 (as restated)
2.7 –
(2.7) –
35.0 3.8
– 38.8
80.2 (5.4) (1.3)
73.5
6.8 (0.3)
– 6.5
4.3 0.3
– 4.6
129.0 (1.6) (4.0)
123.4
Deferred tax assets Pensions
£m Tax losses
£m
Hedging reserve
£m
Interest rate
swaps £m
Other £m
Total £m
At 30 September 2018 – (26.4) (24.3) (4.2) (0.3) (55.2) Adjustment for adoption of IFRS 9 – – – – (1.2) (1.2) (Credited)/charged to the income statement – (0.4) – (8.4) 0.2 (8.6) Credited to equity (6.1) – (1.5) – (0.1) (7.7) At 28 September 2019 (6.1) (26.8) (25.8) (12.6) (1.4) (72.7)
Net deferred tax liability At 29 September 2018 (as restated) 73.8 At 28 September 2019 (as restated) 50.7
15 Retirement benefits
During the period the Group contributed to a funded defined benefit pension plan and a number of defined contribution pension plans. These are considered to be related parties of the Group.
Defined contribution plans Pension costs for defined contribution plans are as follows:
2019 £m
Defined contribution plans
2020 £m
9.9 9.8
Defined benefit plan The Marston’s PLC Pension and Life Assurance Scheme is a final salary pension plan which provides benefits to members in the form of a guaranteed level of pension payable for life. The plan closed to future accrual on 30 September 2014 and the link to future salary increases was also removed.
The plan operates under the UK regulatory framework and is governed by a board of Trustees composed of plan participants and representatives of the Group. The Trustees make investment decisions and set the required contribution rates based on independent actuarial advice.
The key risks to which the plan exposes the Group are as follows:
• Volatility of plan assets • Changes in bond yields • Inflation risk • Changes in life expectancy

Marston’s PLC Annual Report and Accounts 2020Financial Statem
ents
111
15 Retirement benefits (continued)
The movements in the fair value of plan assets and the present value of the defined benefit obligation during the period were:
Present value Fair value
of plan assets of defined
benefit obligation Net (deficit)/
surplus 2020
£m 2019
£m 2020
£m 2019
£m 2020
£m 2019
£m
At beginning of the period 534.4 516.6 (570.8) (501.0) (36.4) 15.6 Past service cost – – – (4.6) – (4.6) Interest income/(expense) 9.5 14.6 (10.1) (14.1) (0.6) 0.5 Remeasurements:
Return on plan assets (excluding interest income) 3.0 20.3 – – 3.0 20.3 Effect of changes in financial assumptions – – (7.8) (86.1) (7.8) (86.1) Effect of changes in demographic assumptions – –
Cash flows: (1.8) 2.11 (1.8) 2.11
Employer contributions 7.3 7.6 – – 7.3 7.6 Administrative expenses paid from plan assets (0.9) (0.9) – – (0.9) (0.9)
(22.2) (23.8) 22.2 23.8 – At end of the period 531.1 534.4 (568.3) (570.8) (37.2) (36.4)
Benefits paid –
Pension costs recognised in the income statement A charge of £nil (2019: £4.6 million) comprising the past service cost is included within employee costs, a charge of £0.6 million (2019: credit of £0.5 million) comprising the net interest on the net defined benefit asset/liability is included within non-underlying finance costs/income and a charge of £0.9 million (2019: £0.9 million) comprising the administrative expenses paid from plan assets is included within finance costs.
On 26 October 2018 a High Court ruling indicated that Guaranteed Minimum Pensions must be equalised for men and women. This requirement was reflected in the calculation of the Group’s net defined benefit asset/liability in the prior period and the resulting additional past service cost of £4.6 million was classified as a non-underlying item (note 4).
On 20 November 2020 a further High Court ruling indicated that historic cash equivalent transfer values that were calculated on an unequalised basis should be topped up if an affected member makes a successful claim. This has created a legal obligation for the plan to pay additional liabilities however at this stage it is not possible to estimate the impact of this on the net defined benefit asset/liability and as such this has not been reflected in the calculation at 3 October 2020.
It is considered that contributions payable under a minimum funding requirement would be available as a refund or reduction in future contributions after they are paid into the plan. As such where the fair value of plan assets exceeds the present value of the defined benefit obligation, the Group recognises an asset at the lower of the fair value of plan assets less the present value of the defined benefit obligation, and the present value of any economic benefits available in the form of refunds from the plan or reductions in future contributions to the plan.
An updated actuarial valuation of the plan was performed by Mercer as at 3 October 2020 for the purposes of IAS 19 ‘Employee Benefits’. The principal assumptions made by the actuaries were:
2020 2019
Discount rate 1.7% 1.8% Rate of increase in pensions – 5% LPI 2.8% 2.9% Rate of increase in pensions – 2.5% LPI 2.0% 2.0% Inflation assumption (RPI) 2.9% 3.0% Inflation assumption (CPI) 2.1% 2.0% Employed deferred revaluation 2.1% 2.0% Life expectancy for deferred members from age 65 (years)
Male 22.7 22.8 Female 25.3 25.4
Life expectancy for current non-insured pensioners from age 65 (years) Male 20.9 21.1 Female 23.5 23.4
Life expectancy for current insured pensioners from age 65 (years) Male 21.6 21.1
23.9Female
The Group has changed its methodology for determining the CPI inflation assumption in the current period. This has increased the present value of the defined benefit obligation by £3.7 million.
Mortality assumptions are based on standard tables adjusted for plan experience and with an allowance for future improvement in life expectancy.
23.4

Marston’s PLC Annual Report and Accounts 2020
112
Notes continued For the 53 weeks ended 3 October 2020
15 Retirement benefits (continued)
The sensitivity of the defined benefit obligation to changes in the principal actuarial assumptions is:
Change in assumption Increase in assumption Decrease in assumption
Discount rate 0.25% Decrease by 4.0% Increase by 4.3% Inflation assumption 0.25% Increase by 2.1% Decrease by 2.0% Life expectancy One year Increase by 4.5% Decrease by 4.4%
The above sensitivity analyses have been determined by changing one assumption while holding all other assumptions constant. This is unlikely to be the case in practice as changes in some of the assumptions could be correlated. When calculating the above sensitivities the same method has been applied as when calculating the net defined benefit asset/liability in the balance sheet i.e. the present value of the defined benefit obligation calculated using the Projected Unit Credit Method.
2019 Plan assets £m
Equities 103.5 Bonds/Gilts 162.0 Cash/Other 10.0 Buy-in policies (matching annuities) 258.9
534.4
2020 £m
76.5 135.9 58.8
259.9 531.1
The actual return on plan assets was a gain of £12.5 million (2019: £34.9 million).
A proportion of the defined benefit obligation has been secured by buy-in policies and as such this proportion of liabilities is matched by annuities.
The Trustees of the plan hold a range of assets and are aiming to better align the cash flows from these to those of the plan. They are also working with the Group to de-risk their portfolio further.
The Group is aiming to eliminate the plan’s funding deficit in the medium term. A schedule of contributions was agreed as part of the 30 September 2017 triennial valuation and contributions of £0.5 million per month are payable until 30 September 2021 and may continue until 2031 depending on the plan’s funding position. Contributions are also payable in respect of the plan’s expenses. The next triennial valuation will be performed as at 30 September 2020.
The employer contributions expected to be paid during the financial period ending 2 October 2021 amount to £7.3 million.
The weighted average duration of the defined benefit obligation is 17 years.
Post‑retirement medical benefits A gain of £0.1 million (2019: loss of £0.1 million) in respect of the remeasurement of post-retirement medical benefits has been included in the statement of comprehensive income.
16 Inventories 2019
£m
Raw materials and consumables 10.5 Work in progress 1.4 Finished goods 31.7
43.6
2020 £m
2.8 –
7.6 10.4
17 Trade and other receivables 2020
£m 2019
£m
Trade receivables 4.4 61.5 Prepayments and accrued income 6.0 25.4 Finance lease receivables 2.0 – Other receivables 3.8 4.0
16.2 90.9
Further detail regarding the impairment of trade receivables, finance lease receivables and other receivables is provided in note 25.
All of the Group’s trade receivables are denominated in pounds sterling.
At 3 October 2020 the value of collateral held in the form of cash deposits was £6.0 million (2019: £6.6 million).
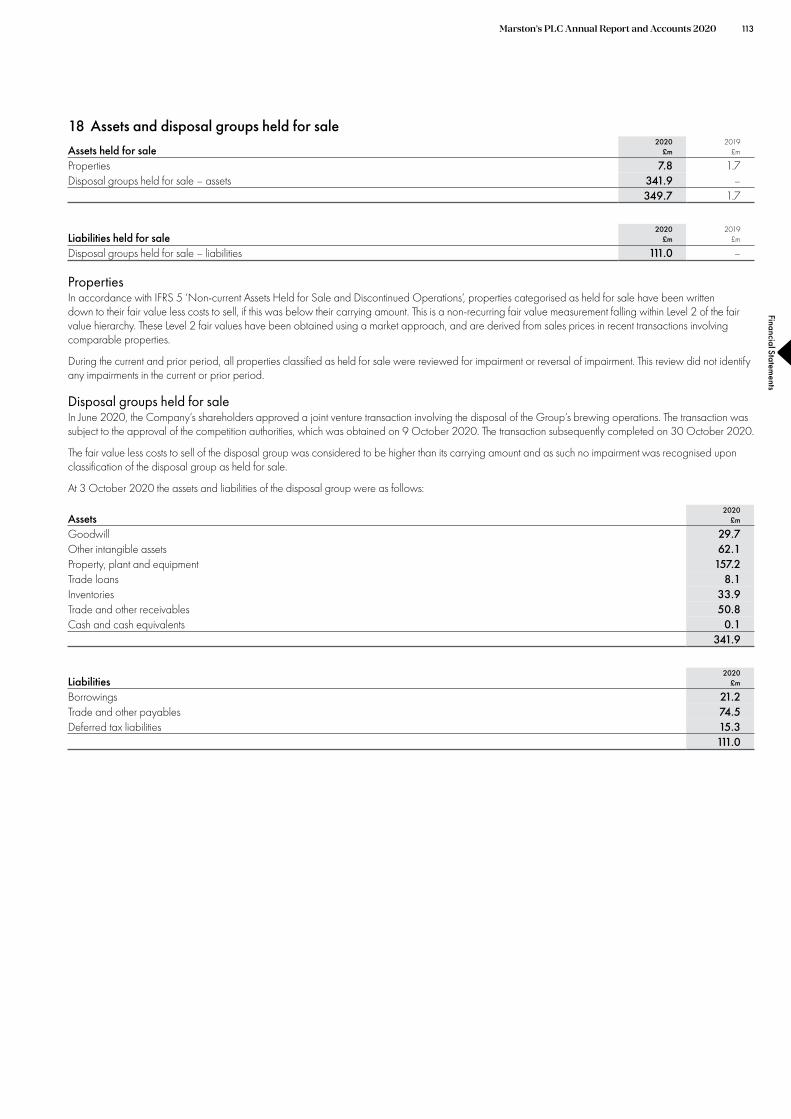
Marston’s PLC Annual Report and Accounts 2020Financial Statem
ents
113
18 Assets and disposal groups held for sale Assets held for sale
2020 £m
2019 £m
Properties 7.8 1.7 Disposal groups held for sale – assets 341.9 –
349.7 1.7
Liabilities held for sale 2020
£m 2019
£m
Disposal groups held for sale – liabilities 111.0 –
Properties In accordance with IFRS 5 ‘Non-current Assets Held for Sale and Discontinued Operations’, properties categorised as held for sale have been written down to their fair value less costs to sell, if this was below their carrying amount. This is a non-recurring fair value measurement falling within Level 2 of the fair value hierarchy. These Level 2 fair values have been obtained using a market approach, and are derived from sales prices in recent transactions involving comparable properties.
During the current and prior period, all properties classified as held for sale were reviewed for impairment or reversal of impairment. This review did not identify any impairments in the current or prior period.
Disposal groups held for sale In June 2020, the Company’s shareholders approved a joint venture transaction involving the disposal of the Group’s brewing operations. The transaction was subject to the approval of the competition authorities, which was obtained on 9 October 2020. The transaction subsequently completed on 30 October 2020.
The fair value less costs to sell of the disposal group was considered to be higher than its carrying amount and as such no impairment was recognised upon classification of the disposal group as held for sale.
At 3 October 2020 the assets and liabilities of the disposal group were as follows:
Assets Goodwill Other intangible assets 62.1 Property, plant and equipment 157.2 Trade loans 8.1 Inventories 33.9 Trade and other receivables 50.8 Cash and cash equivalents
2020 £m
29.7
0.1 341.9
Liabilities Borrowings Trade and other payables 74.5 Deferred tax liabilities
2020 £m
21.2
15.3 111.0

Marston’s PLC Annual Report and Accounts 2020
114
Notes continued For the 53 weeks ended 3 October 2020
19 Borrowings 2019
Current £m
Bank borrowings 21.5 Securitised debt 32.9 Lease liabilities 0.8 Other lease related borrowings (0.3) Other borrowings –
54.9
2020 £m
(0.7) 34.9 15.9 (0.4) 15.0 64.7
Non-current Bank borrowings Securitised debt Lease liabilities Other lease related borrowings Other borrowings Preference shares
2020 £m
268.2 677.2 288.2 337.2 40.0
0.1 1,610.9
2019 £m
313.3 712.2 21.1
336.7 –
0.1 1,383.4
Bank borrowings of £nil (2019: £9.2 million) are secured against items of property, plant and equipment. All other bank borrowings are unsecured.
Other lease related borrowings represent amounts due under sale and leaseback arrangements that do not fall within the scope of IFRS 16 ‘Leases’ or IAS 17 ‘Leases’. The Group has an option to repurchase each leased property for a nominal amount at the end of the lease. The leases have terms of 35 to 40 years and rents which are linked to RPI, subject to a cap and collar.
The Group has 75,000 (2019: 75,000) preference shares of £1 each in issue at the balance sheet date. The preference shares carry the right to a fixed cumulative preferential dividend at the rate of 6% per annum (they are also entitled to a non-cumulative dividend of 1% per annum provided that dividends of not less than £24,000 have been paid on the ordinary shares in that year). They participate in the event of a winding-up and on a return of capital and carry the right to attend and vote at general meetings of the Company, carrying four votes per share.
All of the Group’s borrowings are denominated in pounds sterling. There were no instances of default, including covenant terms, in either the current or prior period. The Group obtained certain covenant waivers from its lenders in the current period as a result of the COVID-19 outbreak.
Maturity of borrowings The maturity profile of the carrying amount of the Group’s borrowings at the period end was as follows:
2020 2019
Due: Within one year In more than one year but less than two years In more than two years but less than five years In more than five years
Fair value of borrowings The carrying amount and the fair value of the Group’s borrowings are as follows:
Bank borrowings Securitised debt Lease liabilities Other lease related borrowings Other borrowings Preference shares
Gross borrowings
£m
Unamortised issue costs
£m
Net borrowings
£m
66.3 (1.6) 64.7 45.9 (1.6) 44.3
460.0 (3.7) 456.3 1,134.7 (24.4) 1,110.3 1,706.9 (31.3) 1,675.6
Gross borrowings
£m
56.5 38.1
433.5 943.1
1,471.2
Carrying amount
Unamortised issue costs
£m
(1.6) (1.6) (4.4)
(25.3) (32.9)
Fair value
Net borrowings
£m
54.9 36.5
429.1 917.8
1,438.3
2019 £m
338.1 725.5
21.9 361.7
– 0.1
1,447.3
2020 £m
2019 £m
2020 £m
270.0 338.1 270.0 716.0 749.4 543.8 304.1 21.9 304.1 361.7 361.7 361.7 55.0 – 55.0
0.1 0.1 0.1 1,706.9 1,471.2 1,534.7
The fair value of the Group’s securitised debt is based on quoted market prices and is within Level 1 of the fair value hierarchy. The fair values of all of the Group’s other borrowings approximate to their carrying amounts and are within Level 2 of the fair value hierarchy.

Marston’s PLC Annual Report and Accounts 2020Financial Statem
ents
115
20 Securitised debt
On 9 August 2005 £805.0 million of secured loan notes were issued in connection with the securitisation of 1,592 of the Group’s pubs held in Marston’s Pubs Limited. On 22 November 2007, a further £330.0 million of secured loan notes (tranches A4 and AB1) were issued in connection with the securitisation of an additional 437 of the Group’s pubs, also held in Marston’s Pubs Limited. The loan notes are secured over the properties and their future income streams and were issued by Marston’s Issuer PLC, a special purpose entity. On 15 January 2014 all of the AB1 notes were repurchased by the Group at par and immediately cancelled.
During the period ended 3 October 2020, 156 (2019: 26) of the securitised pubs were sold to third parties and no pubs (2019: 1) were sold to other members of the Group. The carrying amount of the securitised pubs at 3 October 2020 was £1,142.3 million (2019: £1,303.0 million).
The securitisation is governed by various covenants, warranties and events of default, many of which apply to Marston’s Pubs Limited. These include covenants regarding the maintenance and disposal of securitised properties and restrictions on the ability to move cash to other companies within the Group. The Group obtained certain covenant waivers from its bondholders in the current period as a result of the COVID-19 outbreak.
The tranches of securitised debt have the following principal terms:
2020 £m
– 209.2 200.0 151.8 155.0 155.0 Fixed/floating 2032 to 2035 15 years 2035 716.0 749.4
2019 Principal repayment Expected Expected Tranche £m Interest period – by instalments average life maturity date
A1 18.8 Floating 2020 N/A 2020 A2 214.0 Fixed/floating 2020 to 2027 7 years 2027 A3 200.0 Fixed/floating 2027 to 2032 12 years 2032 A4 161.6 Floating 2020 to 2031 11 years 2031 B
The interest payable on each tranche is as follows:
Tranche Before step up After step up Step up date
A1 3 month LIBOR + 0.55% 3 month LIBOR + 1.375% July 2012 A2 5.1576% 3 month LIBOR + 1.32% July 2019 A3 5.1774% 3 month LIBOR + 1.45% April 2027 A4 3 month LIBOR + 0.65% 3 month LIBOR + 1.625% October 2012 B 5.6410% 3 month LIBOR + 2.55% July 2019
All floating rate notes are economically hedged in full by the Group using interest rate swaps whereby all interest payments are swapped to fixed interest payable.
At 3 October 2020 Marston’s Pubs Limited held cash of £25.6 million (2019: £19.7 million), which was governed by certain restrictions under the covenants associated with the securitisation. In addition, Marston’s Issuer PLC held cash of £0.1 million (2019: £0.1 million).
21 Derivative financial instruments
Interest rate swaps 2020
£m
2019
(37.0) (187.4) (215.6) (224.4) (235.5)
(Restated) £m
Current liabilities (19.9) Non-current liabilities
Details of the Group’s interest rate swaps are provided in note 25. Included within current liabilities above is an amount of £19.8 million (2019: £19.9 million) which relates to interest rate swaps with a maturity of greater than 12 months. An amount of £14.6 million in respect of such interest rate swaps was included in current liabilities as at 29 September 2018.
22 Trade and other payables 2020
£m
96.9 46.5 66.4 12.3 14.7
222.1 248.3
2019 £m
Trade payables 9.117 Other taxes and social security Accruals and deferred income Other payables
The Group has deferred VAT payments of £31.8 million under the UK government’s scheme for the deferral of VAT payments due to COVID-19.
41.2 74.5

116 Marston’s PLC Annual Report and Accounts 2020
Notes continued For the 53 weeks ended 3 October 2020
23 Provisions for other liabilities and charges 2019
Property leases 2020
£m
22.3(14.6)
(1.0) 3.00.1
(1.0) 8.8
£m
At beginning of the period 25.3 Adjustment for adoption of IFRS 16 – Released in the period (3.5) Provided in the period 4.4 Unwinding of discount 0.4 Utilised in the period (4.3) At end of the period 22.3
Recognised in the balance sheet 2020
£m 2019
£m
Current liabilities 1.1 2.6 Non-current liabilities 7.7 19.7
8.8 22.3
Payments are expected to continue for periods of 1 to 49 years (2019: 1 to 68 years).
In the prior period the £2.3 million increase in the provision as a result of updating the discount rate assumptions used in the calculation was classified as a non-underlying item (note 4).
24 Other non-current liabilities 2019
£m
Other liabilities 2.6
2020 £m
3.9
25 Financial instruments
Financial instruments by category
At 3 October 2020
Assets at amortised
cost £m
Total £m
Assets as per the balance sheet Finance lease receivables (before provision) 22.4 22.4 Trade receivables (before provision) 4.9 4.9 Other receivables (before provision) 12.5 12.5 Other cash deposits 2.0 2.0 Cash and cash equivalents 40.6 40.6
82.4 82.4
At 3 October 2020
Derivatives used for
hedging £m
Liabilities at fair value
through profit or
loss £m
Other financial liabilities
£m Total
£m
Liabilities as per the balance sheet Derivative financial instruments 47.9 176.5 – 224.4 Borrowings – – 1,675.6 1,675.6 Trade payables – – 96.9 96.9 Other payables – – 12.3 12.3
47.9 176.5 1,784.8 2,009.2

Marston’s PLC Annual Report and Accounts 2020Financial Statem
ents
117
25 Financial instruments (continued) Assets at
fair value through Assets at profit or amortised
loss cost Total At 28 September 2019 £m £m £m
Assets as per the balance sheet Trade loans 9.3 – 9.3 Trade receivables (before provision) – 64.2 64.2 Other receivables (before provision) – 13.1 13.1 Other cash deposits – 2.0 2.0 Cash and cash equivalents – 37.6 37.6
9.3 116.9 126.2
Liabilities at fair value
Derivatives through Other used for profit or financial hedging loss liabilities Total
At 28 September 2019 £m £m £m £m
Liabilities as per the balance sheet Derivative financial instruments 51.3 184.2 – 235.5 Borrowings – – 1,438.3 1,438.3 Trade payables – – 9. 9 117 .117 Other payables – – 14.7 14.7
51.3 184.2 1,570.9 1,806.4
Fair values of financial instruments The only financial instruments which the Group holds at fair value are trade loans and derivative financial instruments, which are classified as at fair value through profit or loss or derivatives used for hedging.
IFRS 13 ‘Fair Value Measurement’ requires fair value measurements to be recognised using a fair value hierarchy that reflects the significance of the inputs used in the measurements, according to the following levels:
Level 1 – unadjusted quoted prices in active markets for identical assets or liabilities. Level 2 – inputs other than quoted prices included within Level 1 that are observable for the asset or liability, either directly or indirectly. Level 3 – inputs for the asset or liability that are not based on observable market data.
The tables below show the level in the fair value hierarchy into which fair value measurements have been categorised:
2020 2019 Level 1
£m Level 2
£m Level 3
£m Total
£m Level 1 Level 2 Level 3 Total
– – – –
2020 2019 Level 1
£m Level 2
£m Level 3
£m Total
£m Level 1 Level 2 Level 3 Total
– 224.4 – 224.4
Assets as per the balance sheet £m £m £m £m
Trade loans – – 9.3 9.3
Liabilities as per the balance sheet £m £m £m £m
Derivative financial instruments – 235.5 – 235.5
There were no transfers between Levels 1, 2 and 3 fair value measurements during the current or prior period.
The Level 2 fair values of derivative financial instruments have been obtained using a market approach and reflect the estimated amount the Group would expect to pay or receive on termination of the instruments, adjusted for the Group’s own credit risk. The Group utilises valuations from counterparties who use a variety of assumptions based on market conditions existing at each balance sheet date. The fair values are highly sensitive to the inputs to the valuations, such as discount rates, analysis of credit risk and yield curves.
The Level 3 fair values of trade loans reflect the loan balances outstanding net of any deemed impairment.
Level 3 recurring fair value measurements 2020
£m
9.3 1.6
(2.4) (0.4) (8.1)
At end of the period –
2019 £m
At beginning of the period Additions Disposals and repayments (2.7) Valuation changes (0.2) Classified as held for sale –
9.6 2.6
9.3

Marston’s PLC Annual Report and Accounts 2020
118
Notes continued For the 53 weeks ended 3 October 2020
25 Financial instruments (continued)
The fair values of all the Group’s other financial instruments are equal to their book values, with the exception of borrowings (note 19). The carrying amount less impairment provision of finance lease receivables, trade receivables and other receivables, and the carrying amount of other cash deposits, cash and cash equivalents, trade payables and other payables, are assumed to approximate their fair values.
Financial risk factors The Group’s activities expose it to a variety of financial risks: market risk (including interest rate risk and foreign currency risk), counterparty risk, credit risk and liquidity risk. The Group’s overall risk management programme focuses on the unpredictability of financial markets and seeks to minimise potential adverse effects on the Group’s financial performance. The Group uses derivative financial instruments to hedge certain risk exposures.
Risk management is carried out by a central treasury department (Group Treasury) under policies approved by the Board. Group Treasury identifies, evaluates and hedges financial risks. The Board provides principles for overall risk management, as well as policies covering specific areas, such as interest rate risk, credit risk, investment of excess liquidity and use of derivative and non-derivative financial instruments.
Interest rate risk: The Group’s income and operating cash flows are substantially independent of changes in market interest rates, and as such the Group’s interest rate risk arises from its borrowings. Borrowings issued at variable rates expose the Group to cash flow interest rate risk. Borrowings issued at fixed rates expose the Group to fair value interest rate risk.
The Group analyses its interest rate exposure on a dynamic basis. Various scenarios are simulated taking into consideration refinancing, renewal of existing positions, alternative financing and hedging. Based on these scenarios, the Group calculates the impact on the income statement of a defined interest rate shift. The scenarios are run only for liabilities that represent the major interest-bearing positions.
The Group manages its cash flow interest rate risk by using floating-to-fixed interest rate swaps. Such interest rate swaps have the economic effect of converting borrowings from floating rates to fixed rates. Generally, the Group raises borrowings at floating rates and will often swap them into fixed rates that are lower than those available if the Group borrowed at fixed rates directly. Under the interest rate swaps, the Group agrees with other parties to exchange, at specified intervals, the difference between fixed contract and floating rate interest amounts calculated by reference to the agreed notional amounts.
If interest rates had been 0.5% higher/lower during the period ended 3 October 2020, with all other variables held constant, the post-tax loss for the period would have been £1.0 million (2019: £1.0 million) higher/lower as a result of higher/lower interest expense.
Interest rate swaps designated as part of a hedging relationship The Group uses interest rate swaps to fix the interest rate payable on the floating rate tranches of its securitised debt.
The interest rate swaps have the same critical terms as the securitised debt including reset dates, payment dates, maturities and notional amounts (note 20). The economic relationship between the forecast floating rate interest payments and the interest rate swaps is determined and assessed through quantitative hedge effectiveness calculations performed at each reporting date, and upon a significant change in the circumstances affecting the hedge effectiveness requirements. As the interest rate swaps have a notional amount profile the same as that of the principal amount profile of the securitised debt on which the floating rate interest is paid the hedge ratio is 1:1. Sources of ineffectiveness that might affect the hedging relationships are the Group’s own credit risk, changes in the timing and amount of the interest payments and the recouponing of the swaps from a single fixed rate to a stepped profile.
On 27 March 2019 the Group recouponed the interest rate swap that fixes the interest rate payable on the floating rate elements of its A1, A2, A3 and B securitised notes. The recouponing had the effect of reducing the fixed interest rate paid for the next five years and increasing the fixed interest rate paid in the final four years of the swap’s term. As a result, the hedging relationship between this interest rate swap and the associated debt ceased to meet the qualifying criteria for hedge accounting. The cumulative hedging loss existing in equity at 27 March 2019 remained in equity and is being recognised when the forecast transactions are ultimately recognised in the income statement. Fair value movements in respect of this interest rate swap after 27 March 2019 have been recognised wholly within the income statement.
The fixed rate of the interest rate swap designated as a hedging instrument at 3 October 2020 was 6.0% (2019: 6.0%).
Interest rate swaps designated as part of a hedging relationship 2020
£m 2019
£m
Carrying amount of hedging instruments (included within derivative financial instruments) 47.9 51.3 Change in fair value of hedging instruments used as the basis for recognising hedge ineffectiveness in the period 5.0 20.8 Nominal amount of hedging instruments 151.8 161.6 Change in fair value of hedged items used as the basis for recognising hedge ineffectiveness in the period (3.8) (35.3) Hedging reserve balance in respect of continuing hedges (35.4) (38.6) Hedging reserve balance in respect of discontinued hedges (73.3) (87.3) Hedging losses recognised in other comprehensive income (3.8) (20.5) Hedge ineffectiveness losses recognised in profit or loss (1.2) (0.3) Amount reclassified from the hedging reserve to profit or loss in respect of continuing hedges 6.7 7.7 Amount reclassified from the hedging reserve to profit or loss in respect of discontinued hedges 14.6 3.5

Marston’s PLC Annual Report and Accounts 2020Financial Statem
ents
119
25 Financial instruments (continued) Hedging reserve
2020 £m
2019 £m
At beginning of the period (125.9) (118.1) Hedging losses recognised in other comprehensive income (3.8) (20.5) Amount reclassified from the hedging reserve to profit or loss 21.3 11.2Deferred tax on hedging reserve movements (0.3) 1.5 At end of the period (108.7) (125.9)
Interest rate swaps not designated as part of a hedging relationship On 22 March 2012 the Group entered into two forward starting interest rate swaps of £60.0 million each to fix the interest rate payable on the Group’s bank borrowings. In the current period the final termination date of one of the swaps was extended to 30 June 2031 and the terms were amended to fix interest at 2.8% until 30 November 2020 and 4.0% thereafter. This swap has an early termination date of 30 March 2024. The other swap was terminated on 2 November 2020. This swap had a fixed rate of 2.8% until 30 September 2019, with a rate of 3.9% thereafter.
On 30 October 2017 the Group entered into a forward starting interest rate swap of £60.0 million to fix the interest rate payable on the Group’s bank borrowings. This interest rate swap fixes interest at 2.2% and commences on 30 April 2025. There are early termination dates of 30 October 2022 and 1 November 2027. The final termination date is 30 April 2029.
Following the above recouponing of the interest rate swap that fixes the interest rate payable on the floating rate elements of the A1, A2, A3 and B securitised notes and the resulting discontinuance of hedge accounting, fair value movements in respect of this swap after 27 March 2019 have been recognised wholly within the income statement.
The interest rate risk profile, after taking account of derivative financial instruments, is as follows:
2020 2019 Floating rate
financial liabilities
£m
Fixed rate financial liabilities
£m Total
£m
Floating rate financial liabilities
£m
Fixed rate financial liabilities
£m Total
£m
Borrowings 566.7 1,140.2 1,706.9 600.3 870.9 1,471.2
The weighted average interest rate of the fixed rate borrowings was 5.1% (2019: 5.1%) and the weighted average period for which the rate is fixed was 14 years (2019: 11 years).
Foreign currency risk: The Group buys and sells goods denominated in non-sterling currencies, principally US dollars, Canadian dollars and euros. As a result, movements in exchange rates can affect the value of the Group’s income and expenditure. The Group’s exposure in this area is not considered to be significant.
Counterparty risk: The Group’s counterparty risk in respect of its cash and cash equivalents and other cash deposits is mitigated by the use of various banking institutions for its deposits.
There is no significant concentration of counterparty risk in respect of the Group’s pension assets, as these are held with a range of institutions.
Credit risk: Credit risk is managed on a Group basis. Credit risk arises from credit exposure to customers, including outstanding receivables and committed transactions. If customers are independently rated, these ratings are used. Otherwise, if there is no independent rating, an assessment is made of the credit quality of the customer, taking into account its financial position, past experience and other factors. Individual credit limits are set based on internal or external ratings in accordance with limits set by the Board. The utilisation of and adherence to credit limits is regularly monitored.
The financial assets of the Group which are subject to the expected credit loss model under IFRS 9 ‘Financial Instruments’ comprise finance lease receivables, trade receivables and other receivables. Other cash deposits and cash and cash equivalents are also subject to the impairment requirements of IFRS 9 however the impairment loss is immaterial.

Marston’s PLC Annual Report and Accounts 2020
120
Notes continued For the 53 weeks ended 3 October 2020
25 Financial instruments (continued)
Finance lease receivables, trade receivables and other receivables have been grouped as set out below for the purpose of calculating the expected credit losses:
Gross Loss allowance 2020
£m 2019
£m 2020
£m
22.4 – 2.9 22.4 – 2.9
3.5 3.1 0.3 0.2 59.4 0.1 1.2 1.7 0.1 4.9 64.2 0.5
8.6 8.7 8.4 0.8 0.9 0.1 3.1 3.5 0.2
12.5 13.1 8.7 39.8 77.3 12.1
2019 £m
Finance lease receivables Net investment in the lease –
– Trade receivables Amounts due from current pub tenants 0.1 Amounts invoiced to non-tenant customers 2.5 Miscellaneous trade receivables 0.1
2.7 Other receivables Amounts due from previous pub tenants 8.4 Amounts due from other property tenants 0.5 Miscellaneous other receivables 0.2
9.1 8.11
Expected credit losses have been calculated as follows: Gross Loss allowance
2020 £m
2019 £m
2020 £m
3.1 3.5 0.2 36.7 73.8 11.9 11.639.8 77.3 12.1 11.8
2019 £m
12-month expected credit losses 0.2 Lifetime expected credit losses for trade and lease receivables
Finance lease receivables Finance lease receivables are lease receivables that result from transactions that are within the scope of IFRS 16 ‘Leases’ and as such the loss allowance is calculated as the lifetime expected credit losses. For tenants where it is considered that there is a significant risk of default the expected credit losses are calculated on an individual basis taking into account the circumstances involved. For all other tenants, after accounting for collateral held in the form of cash deposits and the value of the asset itself, the remaining balance due is low and as such the expected credit losses are minimal.
Amounts due from pub tenants Amounts due from current pub tenants result almost entirely from transactions that are within the scope of IFRS 15 ‘Revenue from Contracts with Customers’ or are lease receivables that result from transactions that are within the scope of IFRS 16, and as such the loss allowance is calculated as the lifetime expected credit losses. After accounting for collateral held in the form of cash deposits the remaining balance due is low and as such the expected credit losses are minimal.
Amounts due from previous pub tenants predominantly result from transactions that are within the scope of IFRS 15 or are lease receivables that result from transactions that are within the scope of IFRS 16 and as such the loss allowance is calculated as the lifetime expected credit losses. The historical loss rate on closed accounts, adjusted to reflect current and forward-looking information regarding macroeconomic factors affecting customers’ ability to pay, such as the impact of Brexit and COVID-19 and forecasts of the UK’s GDP, is used to measure the expected credit losses on these receivables.
Amounts invoiced to non-tenant customers Amounts invoiced to non-tenant customers result almost entirely from transactions that are within the scope of IFRS 15 and as such the loss allowance is calculated as the lifetime expected credit losses.
At 3 October 2020 the receivables in respect of amounts invoiced to non-tenant customers were not significant and as such the loss allowance is minimal.
At 28 September 2019 the receivables were grouped based on the number of months the balance had been outstanding. The expected loss rates were based on historical payment profiles of sales and the credit losses incurred thereon. The historical loss rates were adjusted to reflect current and forward-looking information regarding macroeconomic factors affecting customers’ ability to pay, such as the impact of Brexit and forecasts of the UK’s GDP.
The groupings of the gross carrying amounts and the associated expected loss rates were as follows:
1 More month 1 to 2 2 to 3 3 to 4 4 to 5 5 to 6 6 to 12 12 to 24 than 24 or less months months months months months months months months Total
At 28 September 2019 £m £m £m £m £m £m £m £m £m £m
Gross carrying amount 31.6 17.5 3.5 2.5 0.1 0.7 1.5 0.5 1.5 59.4 Expected loss rate 0.2% 0.4% 0.7% 1.5% 5.7% 9.1% 35.1% 74.7% 86.0%

121 Marston’s PLC Annual Report and Accounts 2020Financial Statem
ents
25 Financial instruments (continued)
Miscellaneous trade receivables Miscellaneous trade receivables result almost entirely from transactions that are within the scope of IFRS 15 and as such the loss allowance is calculated as the lifetime expected credit losses.
Amounts due from other property tenants Amounts due from other property tenants are almost entirely lease receivables that result from transactions that are within the scope of IFRS 16 and as such the loss allowance is calculated as the lifetime expected credit losses. For tenants where it is considered that there is a significant risk of default the expected credit losses are calculated on an individual basis taking into account the circumstances involved. For all other tenants, after accounting for collateral held in the form of cash deposits, the remaining balance due is low and as such the expected credit losses are minimal.
Miscellaneous other receivables Miscellaneous other receivables do not generally result from transactions that are within the scope of IFRS 15 and do not comprise lease receivables resulting from transactions that are within the scope of IFRS 16. These receivables are considered to have low credit risk and as such the loss allowance is calculated as the 12-month expected credit losses. Receivables are considered to have low credit risk where there is a low risk of default and it is expected that the debtor will be able to meet its payment obligations in the near future.
The movements in the loss allowances for finance lease receivables, trade receivables and other receivables are as follows: 2019
Finance lease receivables £m
At beginning of the period – Net increase in loss allowance recognised in profit or loss – At end of the period
2020 £m
–2.92.9 –
Trade receivables 2020
£m 2019
£m
At beginning of the period 2.7 1.5 Adjustment for adoption of IFRS 9 – 1.7 At beginning of the period (after adjustment) 2.7 3.2 Net increase in loss allowance recognised in profit or loss 2.9 0.2 Amounts written off as uncollectible (1.2) (0.7) Classified as held for sale (3.9) – At end of the period 0.5 2.7
12-month expected Lifetime expected credit losses credit losses
2019 Other receivables £m
At beginning of the period 4.2 Adjustment for adoption of IFRS 9 4.8 At beginning of the period (after adjustment) 9.0 Net (decrease)/increase in loss allowance recognised in profit or loss 0.2 Amounts written off as uncollectible (0.3) At end of the period
2020 2019 2020 £m £m £m
0.2 – 8.9– 0.2 –
0.2 0.2 8.9– – (0.1)– – (0.3)
0.2 0.2 8.5 8.9
The Group has no significant concentration of credit risk in respect of its customers. The maximum exposure to credit risk at the reporting date is the carrying value of each class of receivable.
Liquidity risk: The Group applies a prudent liquidity risk management policy, which involves maintaining sufficient cash, ensuring the availability of funding through an adequate amount of committed credit facilities and having the ability to close out market positions. Due to the dynamic nature of the underlying business, Group Treasury maintains the availability of committed credit lines to ensure that the Group has flexibility in funding.
Management monitor rolling forecasts of the Group’s liquidity reserve (comprising undrawn borrowing facilities and cash and cash equivalents) on the basis of expected cash flow. In addition, the Group’s liquidity management policy involves maintaining debt financing plans, projecting cash flows and considering the level of liquid assets necessary to meet these, and monitoring balance sheet liquidity ratios against internal and external regulatory requirements. The Group’s borrowing covenants are subject to regular review.

Marston’s PLC Annual Report and Accounts 2020
122
Notes continued For the 53 weeks ended 3 October 2020
25 Financial instruments (continued)
The tables below analyse the Group’s financial liabilities and non-settled derivative financial instruments into relevant maturity groupings based on the remaining period at the balance sheet date to the contractual maturity date. The amounts disclosed in the tables are the contractual undiscounted cash flows.
At 3 October 2020
Less than 1 year
£m
Between 1 and 2 years
£m
Between 2 and 5 years
£m
Over 5 years
£m Total
£m
Borrowings 132.8 104.7 585.8 1,932.3 2,755.6 Derivative financial instruments 40.6 18.9 71.5 169.5 300.5 Trade payables 96.9 – – – 96.9 Other payables 12.3 – – – 12.3
282.6 123.6 657.3 2,101.8 3,165.3
Less than Between 1 Between 2 Over 1 year and 2 years and 5 years 5 years Total
At 28 September 2019 £m £m £m £m £m
Borrowings 115.4 92.8 591.4 1,603.9 2,403.5 Derivative financial instruments 20.3 19.7 53.5 206.8 300.3
9. 9 117 .117 Trade payables – – – Other payables 14.7 – – – 14.7
268.3 112.5 644.9 1,810.7 2,836.4
26 Subsidiary undertakings
Details of the Group’s subsidiary undertakings are provided in note 6 to the Company financial statements.
27 Share-based payments
During the period there were three classes of equity-settled employee share incentive plans outstanding:
(a) Save As You Earn (SAYE). Under this scheme employees enter into a savings contract for a period of three to seven years and options are granted on commencement of the contract, exercisable using the amount saved under the contract at the time it terminates. Options under the scheme are granted at a discount to the market price of the shares at the time of the invitation and are not subject to performance conditions. Exercise of options is subject to continued employment.
(b) Deferred bonus. Under this scheme nil cost options are granted to eligible employees in lieu of a cash bonus. Exercise of options is subject to a period of continued employment.
(c) Long Term Incentive Plan (LTIP). Under this scheme nil cost options are granted that will only vest provided the participant satisfies the minimum shareholding requirement and performance conditions relating to earnings per share, cash flow, return on capital and relative total shareholder return are met.
In 2010, HM Revenue & Customs (HMRC) approved an Approved Performance Share Plan (APSP) to enable participants in the LTIP to benefit from UK tax efficiencies. As such, awards made in 2010 and subsequent years may comprise an HMRC approved option (in respect of the first £30,000 worth of an award) and an unapproved LTIP award for amounts in excess of this HMRC limit. A further share award (a linked award) is also provided to enable participants to fund the exercise of the approved option. This linked award is satisfied by way of shares held on trust but these additional shares are not generally delivered to the participant. Under these rules the LTIP options are still issued at nil cost to the employee.
The tables below summarise the outstanding share options:
Number of shares Weighted average
exercise price
SAYE: 2020
m 2019
m 2020
p 2019
p
Outstanding at beginning of the period 7.1 7.6 98.2 102.3 Granted – 1.5 – 96.0 Exercised – (0.1) 102.0 95.6
(3.5) 99.1 3.6 7.1 97.3 0.8 113.4
Weighted average remaining contractual life (years) 1.5
Expired (1.9) Outstanding at end of the period Exercisable at end of the period 0.6 Range of exercise prices 89.0p 78.7p
to 136.0p to 136.0p 2.3
112.7 98.2
123.1

Marston’s PLC Annual Report and Accounts 2020Financial Statem
ents
123
27 Share-based payments (continued) Weighted average
Number of shares exercise price
Deferred bonus: 2020
m 2019
m 2020
p 2019
p
Outstanding at beginning of the period 0.4 0.3 – – Granted – 0.1 – – Outstanding at end of the period 0.4 0.4 – – Exercisable at end of the period 0.2 0.1 – –
Weighted average Number of shares exercise price
LTIP: 2020
m 2019
m 2020
p 2019
p
Outstanding at beginning of the period 7.2 6.7 – – Granted 2.3 2.7 – – Expired (2.2) (2.2) – – Outstanding at end of the period 7.3 7.2 – – Exercisable at end of the period – – – –
LTIP and deferred bonus options are exercisable no later than the tenth anniversary of the date of grant.
The fair values of the SAYE, deferred bonus and LTIP rights are calculated at the date of grant using the Black-Scholes option-pricing model. The significant inputs into the model for all schemes unless otherwise stated were:
2020 2019
Dividend yield % 6.2 7.7 to 7.8 Expected volatility % 20.7 to 22.5 Risk-free interest rate % 0.5 to 0.9 Expected life of rights
SAYE 3 years Deferred bonus 3 years LTIP
23.40.6
N/AN/A
5 years 5 years
The expected volatility is based on historical volatility over the expected life of the rights.
No options were granted in the current period in relation to the SAYE. The fair value of options granted during the prior period in relation to the SAYE was 7.9p. No options were granted in the current period in relation to the deferred bonus scheme. The fair value of options granted during the prior period in relation to the deferred bonus scheme was 79.0p. The fair value of options granted during the period in relation to the LTIP was 90.7p (2019: 67.6p).
The weighted average share price for options exercised over the period was 122.7p (2019: 106.8p). The total charge for the period relating to employee share-based payment plans was £0.4 million (2019: £0.3 million), all of which related to equity-settled share-based payment transactions. After tax, the total charge was £0.5 million (2019: £0.2 million).
28 Equity share capital 2019
Number Value Allotted, called up and fully paid
2020 Number
m Value
£m
660.4 48.7
m £m
Ordinary shares of 7.375p each: At beginning and end of the period 660.4 48.7

Marston’s PLC Annual Report and Accounts 2020
124
Notes continued For the 53 weeks ended 3 October 2020
29 Other components of equity
The merger reserve of £23.7 million (2019: £23.7 million) arose on the issue of ordinary shares in the period ended 30 September 2017 and represented the difference between the nominal value of the shares issued and the net proceeds received.
The capital redemption reserve of £6.8 million (2019: £6.8 million) arose on share buybacks.
Own shares represent the carrying value of the investment in treasury shares and shares held on trust for employee share schemes (including executive share option schemes) as set out in the table below. The trustees of the schemes are Banks’s Brewery Insurance Limited, a wholly-owned subsidiary of Marston’s PLC, and Computershare Trustees (C.I.) Limited.
2020 2019 Number
m Value
£m Number
m Value
£m
Shares held on trust for employee share schemes 1.4 1.7 1.4 1.7 Treasury shares 26.3 110.2 26.3 110.3
27.7 111.9 27.7 112.0
The market value of own shares held is £11.4 million (2019: £36.3 million). Shares held on trust for employee share schemes represent 0.2% (2019: 0.2%) of issued share capital. Treasury shares held represent 4.0% (2019: 4.0%) of issued share capital. Dividends on own shares have been waived.
The Group considers its capital to comprise total equity (as disclosed on the face of the Group balance sheet) and net debt (note 30). In managing its capital the primary objectives are to ensure that the Group is able to continue to operate as a going concern and to maximise return to shareholders through a combination of capital growth and distributions. The Group seeks to maintain a ratio of debt to equity that both balances risks and returns at an acceptable level and retains sufficient funds to comply with lending covenants, achieve working capital targets and meet investment requirements. The Board reviews the Group’s dividend policy and funding requirements at least once a year.
30 Net debt Non-cash
movements Adjustment Classified as and deferred for adoption held for sale Cash flow issue costs of IFRS 16 2019
Analysis of net debt 2020
£m
40.640.6
2.02.0
£m £m £m £m £m
Cash and cash equivalents Cash at bank and in hand (0.1) 3.1 – – 37.6
(0.1) 3.1 – – 37.6 Financial assets Other cash deposits – – – – 2.0
– – – – 2.0 Debt due within one year Bank borrowings 0.7 2.3 21.7 (1.8) – (21.5) Securitised debt (34.9) – 33.4 (35.4) – (32.9) Lease liabilities (15.9) 1.6 8.3 (11.7) (13.3) (0.8) Other lease related borrowings 0.4 – – 0.1 – 0.3 Other borrowings – (15.0) – – –(15.0)
(64.7) 3.9 48.4 (48.8) (13.3) (54.9) Debt due after one year Bank borrowings (268.2) 5.1 39.0 1.0 – (313.3) Securitised debt (677.2) – – 35.0 – (712.2) Lease liabilities (288.2) 12.2 – 2.7 (282.0) (21.1) Other lease related borrowings (337.2) – – (0.5) – (336.7) Other borrowings (40.0) – (40.0) – – – Preference shares – – – – (0.1)(0.1)
(1,610.9) (1,633.0)
17.3 (1.0) 38.2 (282.0) (1,383.4) Net debt 21.1 50.5 (10.6) (295.3) (1,398.7)
Other cash deposits comprises deposits securing letters of credit for reinsurance contracts. Included within cash and cash equivalents is an amount of £6.0 million (2019: £6.6 million) relating to collateral held in the form of cash deposits. These amounts are both considered to be restricted cash. In addition, any other cash held in connection with the securitised business is governed by certain restrictions under the covenants associated with the securitisation (note 20).

125 Marston’s PLC Annual Report and Accounts 2020Financial Statem
ents
3.111
30 Net debt (continued) 2019
Reconciliation of net cash flow to movement in net debt £m 2020
£m
3.1 –
47.4 50.5
(10.6) 21.1 61.0
(1,398.7) (295.3)
Net debt at end of the period (1,633.0) (1,398.7)
2020 £m
2019 £m
(1,328.9) (304.1)
(1,633.0) (1,398.7)
Increase/(decrease) in cash and cash equivalents in the period (3.8) Decrease in other cash deposits (118.0) Cash outflow from movement in debt Change in debt resulting from cash flows (10.5) Non-cash movements and deferred issue costs (2.2) Classified as held for sale – Movement in net debt in the period (12.7) Net debt at beginning of the period (1,386.0) Adjustment for adoption of IFRS 16 –
Net debt excluding lease liabilities (1,376.8) Lease liabilities (21.9) Net debt
Changes in liabilities arising from financing activities are as follows:
2020 2019
Borrowings £m
Derivative financial
instruments £m
Total financing liabilities
£m Borrowings
£m
Derivative financial
instruments £m
Total financing liabilities
£m
(1,438.3) (235.5) (1,673.8) (295.3) – (295.3)
47.4 19.8 67.2 – (8.7) (8.7)
10.6 – 10.6 At end of the period (1,675.6) (224.4) (1,900.0) (1,438.3) (235.5) (1,673.8)
At beginning of the period (1,547.4) (177.5) (1,724.9) Adjustment for adoption of IFRS 16 – – – Cash flow 3.111 8.2 119.5 Changes in fair value – (66.2) (66.2) Other changes (2.2) – (2.2)
31 Working capital and non-cash movements Working capital movement
2020 £m
(0.7) 18.5 54.1 1.4 71.9 10.3
2020 £m
(0.2) 131.2
200.6 2.1 0.4 0.3
334.1 52.1
2019 £m
(Increase)/decrease in inventories 1.0 Decrease in trade and other receivables 7.9 Increase in trade and other payables
2019 (Restated)
Non-cash movements £m
Income from other non-current assets (0.1) Movements in respect of property, plant and equipment, assets held for sale and intangible assets 51.9 Impairment of goodwill – Non-cash movements in respect of leases – Share-based payments
Further details of movements in respect of property, plant and equipment, assets held for sale and intangible assets are given in notes 11, 12 and 18.
32 Ordinary dividends on equity shares Paid in the period
2020 £m
30.4 – 17.1
30.4 47.5
2019 £m
Final dividend for 2019 of 4.8p per share (2018: 4.8p) Interim dividend for 2020 of nil per share (2019: 2.7p)
A final dividend for 2020 has not been proposed.
30.4

Marston’s PLC Annual Report and Accounts 2020
126
Notes continued For the 53 weeks ended 3 October 2020
33 Leases
The Group as lessee The Group leases a number of its properties. Right-of-use assets in respect of leasehold land and buildings with a term exceeding 100 years at acquisition/ commencement of the lease or where there is an option to purchase the freehold at the end of the lease term for a nominal amount are classed as effective freehold land and buildings within property, plant and equipment. Right-of-use assets in respect of any other leasehold land and buildings are classed as leasehold land and buildings within property, plant and equipment. The Group’s property leases have various terms, escalation clauses and renewal rights. A number of the leases include variable payments that depend on changes in RPI, often subject to a cap and collar.
The Group also leases certain items of plant and machinery and fixtures, fittings, tools and equipment. These are generally held under leases with terms of five years or less and in some cases contain an option to purchase the asset for a nominal amount at the end of the lease.
Depreciation charge for right-of-use assets 2020
£m
Effective freehold land and buildings – Leasehold land and buildings 10.6 Plant and machinery 0.4 Fixtures, fittings, tools and equipment 0.2
11.2
Carrying amount of right-of-use assets Effective freehold land and buildings Leasehold land and buildings 231.9
2020 £m
71.7
Plant and machinery – Fixtures, fittings, tools and equipment 1.0
304.6
Interest expense on lease liabilities Expenses relating to short-term leases 0.6 Expenses relating to leases of low-value assets, excluding short-term leases of low-value assets 0.4 Income from subleasing right-of-use assets 0.5 Total cash outflow for leases 25.3 Additions to right-of-use assets 6.4
The table below analyses the Group’s lease liabilities into relevant maturity groupings based on the remaining period at the balance sheet date to the contractual maturity date. The amounts disclosed in the table are the contractual undiscounted cash flows.
2020 £m
16.1
Less than one year Between one and two years 23.4
2020 £m
31.1
Between two and five years 67.3 Over five years 482.8
604.6
Future minimum lease rentals payable under non-cancellable operating leases for the prior period under IAS 17 ‘Leases’ were as follows: 2019
£m
Within one year 24.2 In more than one year but less than five years 88.6 In more than five years 480.1
Future minimum lease payments under finance leases for the prior period under IAS 17 were as follows: 2019
£m
Within one year 1.9 In more than one year but less than five years 6.4 In more than five years 33.7
42.0 Future finance charges (20.1) Present value of finance lease obligations 21.9
592.9

Marston’s PLC Annual Report and Accounts 2020Financial Statem
ents
127
21.9
33 Leases (continued)
The present value of finance lease obligations for the prior period under IAS 17 was as follows: 2019
£m
Within one year 0.8 In more than one year but less than five years 2.1 In more than five years 19.0 Present value of finance lease obligations
The net book amount of effective freehold land and buildings held under finance leases at 28 September 2019 was £25.5 million. The net book amount of plant and machinery and fixtures, fittings, tools and equipment held under finance leases was £1.6 million.
The Group as lessor The Group leases a proportion of its licensed estate and other unlicensed properties to tenants. The majority of lease agreements have terms of 21 years or less. For leases where the Group is the intermediate lessor certain subleases have been reclassified as finance leases upon adoption of IFRS 16 ‘Leases’ as the classification has been determined by reference to the right-of-use asset arising from the head lease rather than the underlying asset. All other leases continue to be classified as operating leases from a lessor perspective.
Amounts recognised in the income statement are as follows: 2020
£m
Finance income on the net investment in the lease 1.0 Lease income for operating leases 9.7
The maturity analysis of the undiscounted lease payments to be received for finance leases is as follows:
Finance leases 2020
£m
Within one year 5.8 In more than one year but less than two years 2.9 In more than two years but less than three years 2.6 In more than three years but less than four years 2.4 In more than four years but less than five years 2.1 In more than five years 12.3
28.1 Unearned finance income (5.7) Net investment in the lease 22.4
The maturity analysis of the undiscounted lease payments to be received for operating leases is as follows:
Operating leases under IFRS 16 2020
£m
Within one year 11.6 In more than one year but less than two years 9.9 In more than two years but less than three years 8.7 In more than three years but less than four years 6.3 In more than four years but less than five years 4.3 In more than five years 16.3
57.1
Future minimum lease rentals receivable under non-cancellable operating leases for the prior period were as follows: 2019
Operating leases under IAS 17 £m
Within one year 16.5 In more than one year but less than five years 49.4 In more than five years 38.9
104.8

Marston’s PLC Annual Report and Accounts 2020
128
Notes continued For the 53 weeks ended 3 October 2020
34 Contingent liabilities and financial commitments
On 9 August 2005 the Group entered into a Tax Deed of Covenant, which was amended on 22 November 2007, the primary objective of which was to ensure that the Group did not trigger a de-grouping liability comprising Capital Gains Tax (CGT) and Stamp Duty Land Tax (SDLT). This would arise in the event of Marston’s Pubs Limited being sold outside the Group, within six years of the relevant asset transfer date for CGT purposes, and within three years of the relevant asset transfer date for SDLT purposes. Due to the passage of time and changes in the statutory rate of corporation tax, the total potential de-grouping liability now stands at £nil (2019: £2.1 million in respect of CGT).
The Group has issued letters of credit totalling £2.4 million (2019: £2.7 million) to secure reinsurance contracts. Certain of these letters of credit are secured on fixed deposits (note 30).
The Group has also entered into a Deed of Guarantee with the Trustees of the Marston’s PLC Pension and Life Assurance Scheme (‘the Scheme’) whereby it guarantees to the Trustees the ongoing obligations of the Group to contribute to the Scheme, and the obligations of the Group to contribute to the Scheme in the event of a debt becoming due under section 75 of the Pensions Act 1995 on the occurrence of either a Group company entering liquidation or the Scheme winding up.
35 Prior period adjustments
The Group has identified adjustments to prior periods regarding the amount of deferred tax recognised in respect of land and buildings which were held under finance leases under IAS 17 ‘Leases’ and the split of derivative financial instruments between non-current and current liabilities. These adjustments have been corrected by retrospective restatement in accordance with IAS 8 ‘Accounting Policies, Changes in Accounting Estimates and Errors’.
The impact of this retrospective restatement on the Group balance sheet as at 28 September 2019 and 29 September 2018 has been set out below. There was no impact on the Group income statement, Group statement of comprehensive income, Group cash flow statement or loss per share for the 52 weeks ended 28 September 2019. The adjustments shown below are before those made in respect of the asset class split detailed in note 36.
As at 28 September 2019 As originally Deferred tax Derivatives Restated
stated adjustment adjustment amount Impact on the Group balance sheet £m £m £m £m
Derivative financial instruments – current liabilities (184.2) – 164.3 (19.9) Derivative financial instruments – non-current liabilities (51.3) – (164.3) (215.6) Deferred tax liabilities (63.9) 3.6 – (60.3) Other assets and liabilities 1,110.5 – – 1,110.5 Net assets 1.811 3.6 – 814.7
Retained earnings 36.9 3.6 – 40.5 Other capital and reserves 774.2 – – 774.2 Total equity 1.811 3.6 – 814.7
As at 29 September 2018 As originally Deferred tax Derivatives Restated
Impact on the Group balance sheet stated
£m adjustment
£m adjustment
£m amount
£m
Derivative financial instruments – current liabilities (28.9) – 14.3 (14.6) Derivative financial instruments – non-current liabilities (148.6) – (14.3) (162.9) Deferred tax liabilities (81.3) 3.6 – (77.7) Other assets and liabilities 1,216.4 – – 1,216.4 Net assets 957.6 3.6 – 961.2
Retained earnings 147.6 3.6 – 151.2 Other capital and reserves 810.0 – – 810.0 Total equity 957.6 3.6 – 961.2

Marston’s PLC Annual Report and Accounts 2020Financial Statem
ents
129
36 Asset class split
In order to provide more reliable and relevant information in respect of its property assets the Group has split the land and buildings asset class within property, plant and equipment into an effective freehold class and a leasehold class.
The effective freehold class comprises land and buildings which are either freehold or are in substance freehold assets. This includes leasehold land and buildings with a term exceeding 100 years at acquisition/commencement of the lease or where there is an option to purchase the freehold at the end of the lease term for a nominal amount. The leasehold class comprises all other leasehold land and buildings.
It is considered that the two groupings above comprise assets which have a different nature and use within the Group’s operations and as such it is appropriate to classify them as separate asset classes under IAS 16 ‘Property, Plant and Equipment’. Leasehold assets derive their value solely from generating income over the lease term and their use/development can be restricted, whereas with effective freehold assets there is additional value from the underlying property asset (including alternative uses and development potential), the assets can be used as security and the value of the property asset is generally maintained over time. It is considered that providing information separately for these two different classes will provide more reliable and relevant information.
The Group has adopted the revaluation model for the effective freehold class and the cost model for the leasehold class. The land and buildings asset class has been held under the revaluation model and as such the measurement basis for assets in the leasehold class has changed. This has been treated as a change in accounting policy and has been applied retrospectively in accordance with IAS 8 ‘Accounting Policies, Changes in Accounting Estimates and Errors’ and as such the comparatives for the 52 weeks ended 28 September 2019 have been restated.
The impact of this retrospective restatement on the Group income statement, Group statement of comprehensive income, Group cash flow statement, Group balance sheet and loss per share for the 52 weeks ended 28 September 2019, and on the Group balance sheet as at 29 September 2018, has been set out below. The adjustments, where applicable, are after the restatements detailed in note 35.
52 weeks ended 28 September 2019 Representation
As originally of discontinued Restated
Impact on the Group income statement stated
£m operations
£m Adjustment
£m amount
£m
Revenue 1,173.5 (389.3) – 784.2 Operating expenses (1,067.0) 363.8 (0.1) (703.3) Operating profit 106.5 (25.5) (0.1) 80.9 Net finance costs (126.5) 0.9 – (125.6) Loss before taxation (20.0) (24.6) (0.1) (44.7) Taxation 2.0 4.9 0.4 7.3 Loss for the period from continuing operations (18.0) (19.7) 0.3 (37.4) Profit from discontinued operations – 19.7 – 19.7 Loss for the period attributable to equity shareholders (18.0)
Impact on the Group statement of comprehensive income Loss for the period
–
As originally stated
£m
(18.0)
0.3
Adjustment £m
0.3
(17.7)
Restated amount
£m
(17.7) Items of other comprehensive income that may subsequently be reclassified to profit or loss (7.8) – (7.8) Remeasurement of retirement benefits (54.7) – (54.7) Unrealised surplus on revaluation of properties 2.8 – 2.8 Reversal of past revaluation surplus (27.4) 2.3 (25.1) Tax on items that will not be reclassified to profit or loss 1.11 (0.5) 10.6 Items of other comprehensive income that will not be reclassified to profit or loss (68.2) 1.8 (66.4) Other comprehensive expense for the period (76.0) 1.8 (74.2) Total comprehensive expense for the period attributable to equity shareholders (94.0) 2.1 (91.9)

Marston’s PLC Annual Report and Accounts 2020
130
Notes continued For the 53 weeks ended 3 October 2020
36 Asset class split (continued)
Impact on the Group cash flow statement
As originally stated
£m Adjustment
£m
Restated amount
£m
Operating activities Underlying operating profit 178.7 (5.9) 172.8 Depreciation and amortisation 43.2 (1.0) 42.2 Underlying EBITDA 221.9 (6.9) 215.0 Non-underlying operating items (72.2) 5.8 (66.4) EBITDA 149.7 (1.1) 148.6 Working capital movement 10.3 – 10.3 Non-cash movements 51.0 1.1 52.1 Decrease in provisions and other non-current liabilities (3.4) – (3.4) Difference between defined benefit pension contributions paid and amounts charged (3.0) – (3.0) Income tax paid (9.0) – (9.0) Net cash inflow from operating activities 195.6 – 195.6
As stated following
prior period Restated
adjustments Adjustment amount Impact on the Group balance sheet £m £m £m
Property, plant and equipment 2,350.4 (44.3) 2,306.1 Deferred tax liabilities (60.3) 3.8 (56.5) Other assets and liabilities (1,475.4) – (1,475.4) Net assets 814.7 (40.5) 774.2
Revaluation reserve 598.9 (25.5) 573.4 Retained earnings 40.5 (15.0) 25.5 Other capital and reserves 175.3 – 175.3 Total equity 814.7 (40.5) 774.2
As originally Restated stated Adjustment amount
Impact on loss per share p p p
Basic loss per share (2.8) – (2.8) Diluted loss per share (2.8) – (2.8)
As at 29 September 2018 As stated
following prior
period Restated adjustments Adjustment amount
Impact on the Group balance sheet £m £m £m
Property, plant and equipment 2,408.1 (46.5) 2,361.6 Deferred tax liabilities (77.7) 3.9 (73.8) Other assets and liabilities (1,369.2) – (1,369.2) Net assets 961.2 (42.6) 918.6
Revaluation reserve 627.2 (27.0) 600.2 Retained earnings 151.2 (15.6) 135.6 Other capital and reserves 182.8 – 182.8 Total equity 961.2 (42.6) 918.6

Marston’s PLC Annual Report and Accounts 2020Financial Statem
ents
131
37 Adoption of IFRS 16 ‘Leases’
The Group has adopted IFRS 16 ‘Leases’ in the current period using the modified retrospective approach in paragraph C5(b) of the standard, whereby comparative amounts have not been restated and the cumulative effect of initially applying the standard has been recognised as an adjustment to opening retained earnings at 29 September 2019.
Impact on accounting policies Details of the new accounting policies adopted under IFRS 16 are set out in note 1.
Impact on transition For leases previously classified as operating leases under IAS 17 ‘Leases’ the lease liability at 29 September 2019 has been recognised at the present value of the remaining lease payments discounted using the Group’s incremental borrowing rate at 29 September 2019. The Group has applied the practical expedient in IFRS 16 to apply a single discount rate to a portfolio of leases with reasonably similar characteristics. The Group has taken the option to recognise all of the associated right-of-use assets at their carrying amounts had IFRS 16 always been applied, discounted using the Group’s incremental borrowing rate at 29 September 2019, less any impairment required under IAS 36 ‘Impairment of Assets’.
For leases where the Group is the intermediate lessor the subleases have been reassessed at 29 September 2019 to determine whether the sublease should be classified as a finance lease or an operating lease based on the remaining contractual terms and conditions of the head lease and sublease at that date. Subleases that were classified as operating leases under IAS 17 but are required to be accounted for as finance leases under IFRS 16 have been treated as new finance leases entered into at 29 September 2019 and a finance lease receivable has been recognised instead of a right-of-use asset. The finance lease receivable has been recognised at the present value of the remaining lease payments discounted at the discount rate used for the head lease.
For leases previously classified as finance leases under IAS 17, the carrying amount of the lease liability and right-of-use asset at 29 September 2019 has been taken as the carrying amount of the IAS 17 lease liability and lease asset immediately before that date. These liabilities and assets have subsequently been accounted for by applying the requirements of IFRS 16.
The impact on the balance sheet upon transition to IFRS 16 at 29 September 2019 is as follows: 29 September
2019 £m
Other intangible assets (0.7) Property, plant and equipment 244.6 Finance lease receivables 20.2 Lease liabilities (295.3) Property lease provisions 14.6 Trade and other receivables/payables 0.7
(15.9) Deferred tax 3.0 Total adjustment to opening retained earnings (12.9)
The weighted average incremental borrowing rate applied to the lease liabilities recognised in the balance sheet at 29 September 2019 was 5%. 29 September
2019 £m
Operating lease commitments at 28 September 2019 as previously disclosed 592.9 Discounted using the incremental borrowing rate at 29 September 2019 297.4 Commitments relating to short-term leases and leases of low-value assets (2.1) Lease liabilities recognised in the balance sheet at 29 September 2019 295.3
38 Events after the balance sheet date
On 4 October 2020 the Group transferred its brewing operations into a wholly-owned subsidiary, Marston’s Beer Company Limited. On 30 October 2020 the Group sold Marston’s Beer Company Limited to Carlsberg Marston’s Brewing Company Limited in exchange for an initial cash receipt of £232.7 million and a 40% shareholding in Carlsberg Marston’s Brewing Company Limited. The initial profit on disposal, excluding working capital adjustments and deferred contingent consideration, is estimated to be around £280 million.

Marston’s PLC Annual Report and Accounts 2020
132
Company Balance Sheet As at 3 October 2020
28 September 2019
(Restated) Note £m
Fixed assets
3 October 2020
£m
Tangible assets 5 307.7 365.9 Investments 6 260.9
626.8 Current assets Debtors
Amounts falling due within one year 7 540.1 525.1
162.9 470.6
Amounts falling due after more than one year 7 334.8 484.2 Cash at bank 14.0 15.9
888.9 1,025.2
Creditors Amounts falling due within one year 8 (756.2) (730.5) Net current assets 132.7 294.7 Total assets less current liabilities 603.3 921.5
Creditors Amounts falling due after more than one year 8 (180.2) (160.2) Provisions for liabilities 9 (16.0) Net assets 745.3
Capital and reserves Equity share capital 13 48.7 48.7 Share premium account 14 334.0 334.0 Revaluation reserve 14 39.1 63.8 Merger reserve 14 23.7 23.7 Capital redemption reserve 14 6.8 6.8 Own shares 14 (111.9) (112.0) Profit and loss reserves
(8.4) 414.7
380.3 Total equity
74.3 414.7 745.3
The comparative information for the 52 weeks ended 28 September 2019 has been restated for the prior period adjustments detailed in note 16 and the asset class split detailed in note 17.
The loss of the Company for the 53 weeks ended 3 October 2020 was £277.3 million (2019 (restated): profit of £19.3 million).
The financial statements were approved by the Board and authorised for issue on 10 December 2020 and are signed on its behalf by:
Ralph Findlay Chief Executive Officer
10 December 2020
Company registration number: 31461

Marston’s PLC Annual Report and Accounts 2020Financial Statem
ents
133
Company Statement of Changes in Equity For the 53 weeks ended 3 October 2020
Profit Equity Share Revaluation Capital and loss Total share premium reserve Merger redemption Own reserves equity
capital account (Restated) reserve reserve shares (Restated) (Restated) £m £m £m £m £m £m £m £m
At 30 September 2018 (as originally reported) 48.7 334.0 78.9 23.7 6.8 (112.3) 935.6 1,315.4 Subordinated loan adjustment – – – – – – (532.0) (532.0) Deferred tax adjustment – – – – – – 3.6 3.6 Adjustment for asset class split – – (11.0) – – – 0.8 (10.2) Tax impact of asset class split – – 1.4 – – – (0.1) 1.3 At 30 September 2018 (as restated) 48.7 334.0 69.3 23.7 6.8 (112.3) 407.9 778.1 Profit for the period (as restated) – – – – – – 19.3 19.3 Revaluation of properties – – (2.1) – – – – (2.1) Deferred tax on properties – – (2.9) – – – – (2.9) Total comprehensive (expense)/income – – (5.0) – – – 19.3 14.3 Share-based payments – – – – – – 0.3 0.3 Sale of own shares – – – – – 0.3 (0.2) 0.1 Transfer to profit and loss reserves – – (0.5) – – – 0.5 – Dividends paid – – – – – – (47.5) (47.5) Total transactions with owners – – (0.5) – – 0.3 (46.9) (47.1) At 28 September 2019 (as restated) 48.7 334.0 63.8 23.7 6.8 (112.0) 380.3 745.3 Loss for the period – – – – – – (277.3) (277.3) Revaluation of properties – – (26.7) – – – – (26.7) Deferred tax on properties – – 3.4 – – – – 3.4 Total comprehensive expense – – (23.3) – – – (277.3) (300.6) Share-based payments – – – – – – 0.4 0.4 Sale of own shares – – – – – 0.1 (0.1) – Transfer to profit and loss reserves – – (1.4) – – – 1.4 – Dividends paid – – – – – – (30.4) (30.4) Total transactions with owners – – (1.4) – – 0.1 (28.7) (30.0) At 3 October 2020 48.7 334.0 39.1 23.7 6.8 (111.9) 74.3 414.7

134 Marston’s PLC Annual Report and Accounts 2020
Notes For the 53 weeks ended 3 October 2020
1 Accounting policies
The Company’s principal accounting policies are set out below:
Company information Marston’s PLC is a public company limited by shares incorporated in England and Wales and domiciled in the UK. The registered office is Marston’s House, Brewery Road, Wolverhampton, WV1 4JT.
Basis of preparation These financial statements have been prepared in accordance with FRS 102 ‘The Financial Reporting Standard applicable in the UK and Republic of Ireland’ (FRS 102) and the requirements of the Companies Act 2006.
The financial statements are prepared in sterling, which is the functional currency of the Company. Monetary amounts in these financial statements are rounded to the nearest £0.1 million.
The financial statements have been prepared under the historical cost convention modified to include the revaluation of effective freehold land and buildings and the holding of certain financial instruments at fair value.
The Company is a qualifying entity for the purposes of FRS 102, as it prepares publicly available consolidated financial statements, which are intended to give a true and fair view of the assets, liabilities, financial position and profit or loss of the Group. The Company has therefore taken advantage of the exemptions from the following disclosure requirements in FRS 102:
• Section 7 ‘Statement of Cash Flows’ – Presentation of a statement of cash flows and related notes and disclosures; • Section 11 ‘Basic Financial Instruments’ – Interest income/expense and net gains/losses for each category of financial instrument not measured at
fair value through profit or loss, impairment losses for each class of financial asset and information that enables users to evaluate the significance of financial instruments;
• Section 26 ‘Share-based Payment’ – Reconciliation of the opening and closing number and weighted average exercise price of share options, how the fair value of options granted was measured, and an explanation of modifications to arrangements;
• Section 33 ‘Related Party Disclosures’ – Compensation for key management personnel.
These financial statements present information about the Company as an individual entity and not about its group.
As permitted by section 408(3) of the Companies Act 2006, no profit and loss account has been presented for the Company.
The Directors continue to adopt the going concern basis of accounting in preparing the financial statements. Details of the going concern assessment performed by the Group are provided in note 1 to the Group financial statements.
Prior period adjustments The Company has identified that the accounting treatment for the subordinated loan upon transition to FRS 102, for deferred tax recognised in respect of land and buildings which are held under finance leases and for the split of derivative financial instruments between amounts falling due within one year and amounts falling due after more than one year required adjustment. As such the comparatives for the 52 weeks ended 28 September 2019 have been restated in accordance with Section 10 ‘Accounting Policies, Estimates and Errors’ of FRS 102. Full details are provided in note 16.
Asset class split The Company has split the land and buildings asset class within tangible fixed assets into an effective freehold class, held under the revaluation model, and a leasehold class, held under the cost model. This change has been applied retrospectively in accordance with Section 10 ‘Accounting Policies, Estimates and Errors’ of FRS 102 and as such the comparatives for the 52 weeks ended 28 September 2019 have been restated. Full details are provided in note 17.
Turnover Turnover represents rent receivable, which is recognised over time and in the period to which it relates.
Current and deferred tax The tax currently payable is based on taxable profit for the period. Taxable profit differs from net profit as reported in the accounts because it excludes items of income or expense that are taxable or deductible in other periods and it further excludes items that are never taxable or deductible. The Company’s liability for current tax is calculated using tax rates that have been enacted or substantively enacted by the reporting end date.
Deferred tax liabilities are generally recognised for all timing differences and deferred tax assets are recognised to the extent that it is probable that they will be recovered against the reversal of deferred tax liabilities or other future taxable profits. Such assets and liabilities are not recognised if the timing difference arises from goodwill or from the initial recognition of other assets and liabilities in a transaction that affects neither the tax profit nor the accounting profit.
The carrying amount of deferred tax assets is reviewed at each reporting end date and reduced to the extent that it is no longer probable that sufficient taxable profits will be available to allow all or part of the asset to be recovered. Deferred tax is calculated at the tax rates that are expected to apply in the period when the liability is settled or the asset is realised. Deferred tax is charged or credited to profit or loss, except when it relates to items charged or credited directly to equity, in which case the deferred tax is also dealt with in equity. Deferred tax assets and liabilities are offset when the Company has a legally enforceable right to offset current tax assets and liabilities and the deferred tax assets and liabilities relate to taxes levied by the same tax authority.

135 Marston’s PLC Annual Report and Accounts 2020Financial Statem
ents
1 Accounting policies (continued)
Fixed assets • Effective freehold land and buildings are initially stated at cost and subsequently at valuation. Leasehold land and buildings and fixtures, fittings, plant and
equipment are stated at cost. • Depreciation is charged to the profit and loss account on a straight-line basis to provide for the cost or valuation of the assets less their residual values over
their useful lives. • Land and buildings are depreciated to their residual values over the lower of the lease term (where applicable) and 50 years. • Fixtures, fittings, plant and equipment are depreciated over periods ranging from 3 to 20 years. • Interest costs directly attributable to capital projects are capitalised.
Effective freehold land and buildings are revalued by qualified valuers at least once in each rolling three year period, on an open market value basis. External valuations are in accordance with the Royal Institution of Chartered Surveyors’ Red Book. These valuations are performed directly by reference to observable prices in an active market or recent market transactions on arm’s length terms. Internal valuations are performed on the same basis.
When a valuation is below current carrying value, the asset concerned is reviewed for impairment. Impairment losses are charged to the revaluation reserve to the extent that a previous gain has been recorded, and thereafter to the profit and loss account. Surpluses on revaluation are recognised in the revaluation reserve, except to the extent they reverse previously charged impairment losses, in which case the reversal is recorded in the profit and loss account.
Disposals of fixed assets Profit/loss on disposal of fixed assets represents net sale proceeds less the carrying value of the assets. Any element of the revaluation reserve relating to the fixed assets disposed of is transferred to profit and loss reserves at the date of sale.
Financial instruments The Company has elected to apply the provisions of Section 11 ‘Basic Financial Instruments’ and Section 12 ‘Other Financial Instruments Issues’ of FRS 102 to all of its financial instruments.
Financial instruments are recognised in the balance sheet when the Company becomes party to the contractual provisions of the instrument.
Financial assets and liabilities are offset, with the net amounts presented in the financial statements, when there is a legally enforceable right to set off the recognised amounts and there is an intention to settle on a net basis or to realise the asset and settle the liability simultaneously.
Basic financial assets Basic financial assets, which comprise amounts owed by Group undertakings, other debtors and cash and cash equivalents, are initially measured at the transaction price including transaction costs and are subsequently carried at amortised cost using the effective interest method.
Other financial assets Derivatives, including interest rate swaps, are not basic financial assets and are accounted for as set out below.
Financial assets, other than those held at fair value through profit or loss, are assessed for indicators of impairment at each reporting end date.
Financial assets are impaired where there is objective evidence that, as a result of one or more events that occurred after the initial recognition of the financial asset, the estimated future cash flows have been affected. If an asset is impaired, the impairment loss is the difference between the carrying amount and the present value of the estimated cash flows discounted at the asset’s original effective interest rate. The impairment loss is recognised in profit or loss.
If there is a decrease in the impairment loss arising from an event occurring after the impairment was recognised, the impairment is reversed. The reversal is such that the current carrying amount does not exceed what the carrying amount would have been, had the impairment not previously been recognised. The impairment reversal is recognised in profit or loss.
Financial assets are derecognised only when the contractual rights to the cash flows from the asset expire or are settled, or when the Company transfers the financial asset and substantially all the risks and rewards of ownership to another entity.
Financial liabilities and equity instruments are classified according to the substance of the contractual arrangements entered into. An equity instrument is any contract that evidences a residual interest in the assets of the Company after deducting all of its liabilities.
Basic financial liabilities Basic financial liabilities, comprising amounts owed to Group undertakings, other creditors and borrowings, are initially recognised at the transaction price and subsequently carried at amortised cost using the effective interest method.
Other financial liabilities Derivatives, including interest rate swaps, are not basic financial liabilities and are accounted for as set out below.
Financial liabilities are derecognised when the Company’s contractual obligations expire or are discharged or cancelled.
Derivatives The Company uses derivative financial instruments to hedge the Group’s exposure to fluctuations in interest rates. Derivative financial instruments are initially recognised in the balance sheet at fair value and are subsequently remeasured to their fair value at each balance sheet date. The Company has not designated any derivative financial instruments as hedging instruments and as such any gains or losses on remeasurement are recognised in the profit and loss account immediately.
A derivative with a positive fair value is recognised as a financial asset, whereas a derivative with a negative fair value is recognised as a financial liability. The fair value of derivatives is split between amounts falling due within one year and amounts falling due after more than one year based on the remaining maturity profile.

136 Marston’s PLC Annual Report and Accounts 2020
Notes continued For the 53 weeks ended 3 October 2020
1 Accounting policies (continued)
Leases Leases are classified as finance leases whenever the terms of the lease transfer substantially all the risks and rewards of ownership to the lessee. All other leases are classified as operating leases.
Assets held under finance leases are recognised as assets at the lower of the assets’ fair value at the date of inception of the lease and the present value of the minimum lease payments. The related liability is included in the balance sheet as a finance lease obligation. Lease payments are treated as consisting of capital and interest elements. The interest is charged to the profit and loss account so as to produce a constant periodic rate of interest on the remaining balance of the liability.
Rentals payable under operating leases, including any lease incentives received, are charged to the profit and loss account on a straight-line basis over the term of the relevant lease except where another more systematic basis is more representative of the time pattern in which economic benefits from the leased asset are consumed.
Lease premiums received are recognised on a straight-line basis over the life of the lease.
Obligations arising from sale and leaseback arrangements with repurchase options that do not fall within the scope of Section 20 ‘Leases’ of FRS 102 are classified as other lease related borrowings and accounted for as secured loans on an amortised cost basis.
Investments in subsidiaries Interests in subsidiaries are initially measured at cost and subsequently measured at cost less any accumulated impairment losses. The investments are assessed for impairment at each reporting date and any impairment losses or reversals of impairment losses are recognised immediately in profit or loss.
Provisions Provisions are recognised in the balance sheet when the Company has a present legal or constructive obligation as a result of a past event and it is probable that an outflow of economic benefits will be required to settle the obligation.
The amount recognised as a provision is the best estimate of the consideration required to settle the present obligation at the balance sheet date, taking into account the risks and uncertainties surrounding the obligation.
Where the effect of the time value of money is material, the amount expected to be required to settle the obligation is recognised at present value, using a pre-tax rate that reflects current market assessments of the time value of money and the risks specific to the obligation for which the estimates of future cash flows have not been adjusted. When a provision is measured at present value the unwinding of the discount is recognised as a finance cost in profit or loss in the period it arises.
When valuations of leasehold properties (based on future estimated income streams) give rise to a deficit as a result of onerous lease conditions they are recognised as provisions. Other contractual property costs are also recorded as provisions as appropriate.
Dividends Dividends proposed by the Board but unpaid at the period end are recognised in the financial statements when they have been approved by the shareholders. Interim dividends are recognised when paid.
Preference shares Preference shares are treated as borrowings, and dividends payable on those preference shares are charged as interest in the profit and loss account.
Group undertakings There is an intra group funding agreement in place between the Company and certain other members of the Group. This agreement stipulates that all balances outstanding on any intercompany loan account between these companies which exceed £1 are interest bearing at a prescribed rate.
There is a 12.5% subordinated loan owed to the Company by Marston’s Pubs Limited and there are deep discount bonds owed by the Company to Banks’s Brewery Insurance Limited. No interest is payable on any other amounts owed by/to Group companies who are not party to the intra group funding agreement.
All amounts owed by/to Group undertakings are unsecured and, with the exception of the subordinated loan and deep discount bonds, repayable on demand.
2 Judgements and key sources of estimation uncertainty
In the application of the Company’s accounting policies, the Directors are required to make judgements, estimates and assumptions about the carrying amounts of assets and liabilities that are not readily apparent from other sources. The estimates and associated assumptions are based on historical experience and other factors that are considered to be relevant. Actual results may differ from these estimates.
The estimates and underlying assumptions are reviewed on an ongoing basis. Revisions to accounting estimates are recognised in the period in which the estimate is revised where the revision affects only that period, or in the period of the revision and future periods where the revision affects both current and future periods.
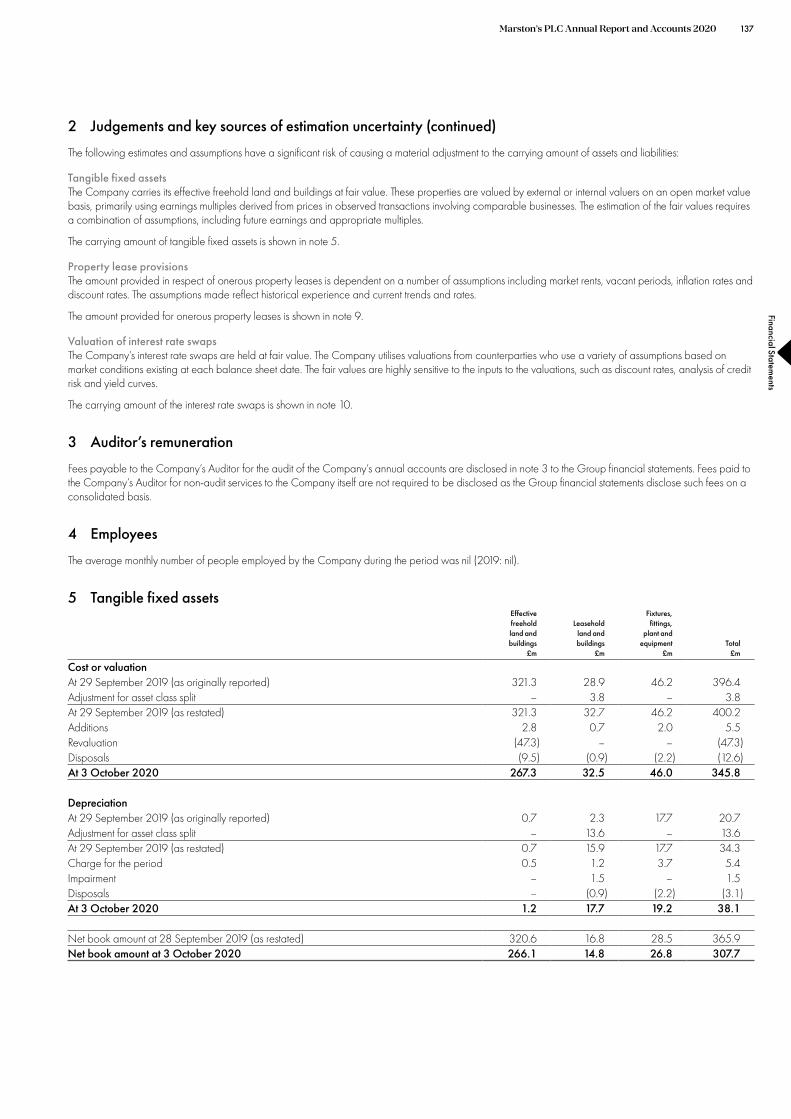
Marston’s PLC Annual Report and Accounts 2020Financial Statem
ents
137
2 Judgements and key sources of estimation uncertainty (continued)
The following estimates and assumptions have a significant risk of causing a material adjustment to the carrying amount of assets and liabilities:
Tangible fixed assets The Company carries its effective freehold land and buildings at fair value. These properties are valued by external or internal valuers on an open market value basis, primarily using earnings multiples derived from prices in observed transactions involving comparable businesses. The estimation of the fair values requires a combination of assumptions, including future earnings and appropriate multiples.
The carrying amount of tangible fixed assets is shown in note 5.
Property lease provisions The amount provided in respect of onerous property leases is dependent on a number of assumptions including market rents, vacant periods, inflation rates and discount rates. The assumptions made reflect historical experience and current trends and rates.
The amount provided for onerous property leases is shown in note 9.
Valuation of interest rate swaps The Company’s interest rate swaps are held at fair value. The Company utilises valuations from counterparties who use a variety of assumptions based on market conditions existing at each balance sheet date. The fair values are highly sensitive to the inputs to the valuations, such as discount rates, analysis of credit risk and yield curves.
The carrying amount of the interest rate swaps is shown in note 10.
3 Auditor’s remuneration
Fees payable to the Company’s Auditor for the audit of the Company’s annual accounts are disclosed in note 3 to the Group financial statements. Fees paid to the Company’s Auditor for non-audit services to the Company itself are not required to be disclosed as the Group financial statements disclose such fees on a consolidated basis.
4 Employees
The average monthly number of people employed by the Company during the period was nil (2019: nil).
5 Tangible fixed assets Effective Fixtures, freehold Leasehold fittings, land and land and plant and buildings buildings equipment Total
£m £m £m £m
Cost or valuation At 29 September 2019 (as originally reported) 321.3 28.9 46.2 396.4 Adjustment for asset class split – 3.8 – 3.8 At 29 September 2019 (as restated) 321.3 32.7 46.2 400.2 Additions 2.8 0.7 2.0 5.5 Revaluation (47.3) – – (47.3) Disposals (9.5) (0.9) (2.2) (12.6) At 3 October 2020 267.3 32.5 46.0 345.8
Depreciation At 29 September 2019 (as originally reported) 0.7 2.3 17.7 20.7 Adjustment for asset class split – 13.6 – 13.6 At 29 September 2019 (as restated) 0.7 15.9 17.7 34.3 Charge for the period 0.5 1.2 3.7 5.4 Impairment – 1.5 – 1.5 Disposals – (0.9) (2.2) (3.1) At 3 October 2020 1.2 17.7 19.2 38.1
Net book amount at 28 September 2019 (as restated) 320.6 16.8 28.5 365.9 Net book amount at 3 October 2020 266.1 14.8 26.8 307.7

Marston’s PLC Annual Report and Accounts 2020
138
Notes continued For the 53 weeks ended 3 October 2020
5 Tangible fixed assets (continued)
The net book amount of land and buildings is split as follows:
2020 £m
2019 (Restated)
£m
Freehold land and buildings 210.9 254.5 Leasehold land and buildings with a term greater than 100 years at acquisition/commencement 55.2 66.1 Leasehold land and buildings with a term less than 100 years at acquisition/commencement 16.8
337.4 14.8
280.9
If the effective freehold land and buildings had not been revalued, the historical cost net book amount would be £220.2 million (2019 (restated): £246.3 million).
Capital expenditure authorised and committed at the period end but not provided for in the financial statements was £0.2 million (2019: £0.4 million).
The net book amount of effective freehold land and buildings held under finance leases at 3 October 2020 was £18.4 million (2019: £25.5 million). The net book amount of effective freehold land and buildings held as part of sale and leaseback arrangements that do not fall within the scope of Section 20 ‘Leases’ of FRS 102 was £94.0 million (2019: £120.6 million). The net book amount of fixtures, fittings, plant and equipment held under finance leases was £1.0 million (2019: £0.5 million). The net book amount of fixtures, fittings, plant and equipment held as security for bank borrowings was £6.7 million (2019: £7.0 million).
The Company has charged effective freehold land and buildings with a value of £4.0 million (2019: £4.9 million) in favour of the Marston’s PLC Pension and Life Assurance Scheme (the ‘Scheme’) as continuing security for the Group’s obligations to the Scheme.
Revaluation/impairment During the current period various properties were reviewed for impairment and/or material changes in value. These valuation adjustments were recognised in the revaluation reserve or profit and loss account as appropriate.
2020 £m
2019 (Restated)
£m
Profit and loss account: Impairment (22.1) (8.5) Reversal of past impairment 0.5
(8.0) Revaluation reserve: Reversal of past revaluation surplus (2.1)
(2.1) Net decrease in shareholders’ equity/tangible fixed assets
–(22.1)
(26.7) (26.7) (48.8) (10.1)
6 Fixed asset investments Subsidiary
undertakings £m
Cost At 29 September 2019 261.7 Capital contribution in respect of equity-settled share-based payments 0.4 At 3 October 2020 262.1
Impairments At 29 September 2019 0.8 Charged in the period 98.4 At 3 October 2020 99.2
Net book amount at 28 September 2019 Net book amount at 3 October 2020
260.9 162.9

Marston’s PLC Annual Report and Accounts 2020Financial Statem
ents
139
6 Fixed asset investments (continued)
These financial statements are separate company financial statements for Marston’s PLC.
The Company had the following subsidiary undertakings at 3 October 2020: Proportion of shares Proportion
held directly by of shares held Nature of business Class of share Marston’s PLC by the Group
Marston’s Estates Limited Property management Ordinary 25p – 100% Marston’s Operating Limited Pub retailer Ordinary £1 – 100% Marston’s Pubs Limited Pub retailer Ordinary £1 – 100% Marston's Pubs Parent Limited Holding company Ordinary £1 – 100% Marston's Telecoms Limited Telecommunications Ordinary £1 – 100% Marston’s Trading Limited Pub retailer and brewer Ordinary £5 – 100% Banks’s Brewery Insurance Limited Insurance Ordinary £1 – 100% Marston's Acquisitions Limited Acquisition company Ordinary 25p – 100%
Preference £1 – 100% Marston’s Corporate Holdings Limited Holding company Ordinary £1 100% 100% Marston's Issuer PLC Financing company Ordinary £1 – – Marston's Issuer Parent Limited Holding company Ordinary £1 – – Bedford Canning Company Limited Dormant Ordinary £1 – 100% Bluu Limited Dormant Ordinary £1 – 100% Brasserie Restaurants Limited Dormant Ordinary £1 – 100% Celtic Inns Holdings Limited Dormant Ordinary 1p – 100% Celtic Inns Limited Dormant Ordinary £1 – 100% Eldridge, Pope & Co., Limited Dormant Ordinary 50p – 100% English Country Inns Limited Dormant Ordinary 50p – 100% EP Investments 2004 Limited Dormant Ordinary 1p – 100% Fairdeed Limited Dormant ‘A’ Ordinary £1 – 100% Fayolle Limited Dormant Ordinary £1 – 100% John Marston's Taverners Limited Dormant Ordinary £1 – 100% Lambert Parker & Gaines Limited Dormant Ordinary £1 – 100% Mansfield Brewery Limited Dormant Ordinary 25p – 100% Mansfield Brewery Properties Limited Dormant Ordinary £1 – 100% Mansfield Brewery Trading Limited Dormant Ordinary £1 – 100% Marston, Thompson & Evershed Limited Dormant Ordinary 25p – 100% Marston’s Beer Company Limited Dormant Ordinary £1 – 100% Marston’s Developments Limited Dormant Ordinary £1 – 100% Marston’s Property Developments Limited Dormant Ordinary £1 – 100% Osprey Inns Limited Dormant Ordinary £1 – 100% Pitcher and Piano Limited Dormant Ordinary £1 – 100% Porter Black (2003) Limited Dormant Ordinary £1 – 100% QP Bars Limited Dormant Ordinary £1 – 100% Refresh Group Limited Dormant Ordinary 1p – 100% Refresh UK Limited Dormant Ordinary 10p – 100% Ringwood Brewery Limited Dormant Ordinary £1 – 100% S.K. Williams Limited Dormant Ordinary £1 – 100% SDA Limited Dormant Ordinary £1 – 100% Sherwood Forest Properties Limited Dormant Ordinary £1 – 100% Sovereign Inns Limited Dormant Ordinary £1 – 100% The Gray Ox Limited Dormant Ordinary £1 – 100% The Wychwood Brewery Company Limited Dormant Ordinary £1 – 100% W&DB (Finance) Limited Dormant Ordinary £1 – 100% W. & D. Limited Dormant Ordinary £1 – 100% Wizard Inns Limited Dormant ‘A’ Ordinary 1p – 100%
Deferred 1p – 100% Wychwood Holdings Limited Dormant ‘A’ Ordinary 1p – 100%
‘B’ Ordinary 1p – 100%
The registered office of all of the above subsidiaries is Marston’s House, Brewery Road, Wolverhampton, WV1 4JT, with the exception of Banks’s Brewery Insurance Limited, Marston’s Beer Company Limited, Marston’s Issuer PLC and Marston’s Issuer Parent Limited. The registered office of Banks’s Brewery Insurance Limited is PO Box 33, Dorey Court, Admiral Park, St Peter Port, Guernsey, GY1 4AT. The registered office of Marston’s Beer Company Limited is 22 Grenville Street, St Helier, Jersey, JE4 8PX. The registered office of Marston’s Issuer PLC and Marston’s Issuer Parent Limited is Wilmington Trust SP Services (London) Limited, Third Floor, 1 King’s Arms Yard, London, EC2R 7AF.
All subsidiaries have been included in the consolidated financial statements. Although the Group does not hold any shares in Marston’s Issuer PLC and its parent company, Marston’s Issuer Parent Limited, these companies are treated as subsidiary undertakings for the purpose of the consolidated financial statements as it is considered that they are controlled by the Group. Marston’s Issuer PLC was set up with the sole purpose of issuing debt secured on the assets of Marston’s Pubs Limited. Wilmington Trust SP Services (London) Limited holds the shares of Marston’s Issuer Parent Limited under a declaration of trust for charitable purposes.

Marston’s PLC Annual Report and Accounts 2020
140
Notes continued For the 53 weeks ended 3 October 2020
7 Debtors
Amounts falling due within one year 2020
£m
2019 (Restated)
£m
Amounts owed by Group undertakings 520.5 520.5 Derivative financial instruments 19.5 3.9 Prepayments and accrued income 0.1 0.2 Other debtors 0.5
525.1 –
540.1
Amounts falling due after more than one year 2020
£m
2019 (Restated)
£m
12.5% subordinated loan owed by Group undertaking 317.0 447.6 Derivative financial instruments 17.8 36.6
334.8 484.2
The gross contractual amount outstanding in respect of the subordinated loan was £1,163.0 million (2019: £1,049.8 million) and the accumulated impairment losses were £846.0 million (2019: £602.2 million).
Included within derivative financial instruments falling due within one year is an amount of £2.3 million (2019: £3.9 million) which relates to interest rate swaps with a maturity of greater than 12 months.
8 Creditors 2019
(Restated) Amounts falling due within one year
2020 £m
698.6 £m
Amounts owed to Group undertakings 707.8 Bank borrowings 1.0 1.0 Finance leases 0.9 0.6 Other lease related borrowings (0.1) (0.1) Corporation tax 25.4 9.4 Derivative financial instruments 19.5 3.9 Accruals and deferred income 7.9
730.5 10.9
756.2
2019 (Restated)
Amounts falling due after more than one year 2020
£m
2.3 £m
Bank borrowings 3.0 Finance leases 20.5 20.4 Other lease related borrowings 88.2 88.1 Other borrowings 40.0 – Preference shares 0.1 0.1 Derivative financial instruments 17.8 36.6 Accruals and deferred income 10.8 Other creditors 0.5
160.2 0.5
180.2
5.11
The preference shares carry the right to a fixed cumulative preferential dividend. They participate in the event of a winding-up and on a return of capital and carry the right to attend and vote at general meetings of the Company, carrying four votes per share.
Other lease related borrowings represent amounts due under sale and leaseback arrangements that do not fall within the scope of Section 20 ‘Leases’ of FRS 102. The Company has an option to repurchase each leased property for a nominal amount at the end of the lease. The leases have terms of 35 to 40 years and rents which are linked to RPI, subject to a cap and collar.
The amount falling due for payment after more than five years from the balance sheet date on debts repayable by instalments was £107.4 million (2019: £107.6 million). Debts of £0.1 million (2019: £0.1 million) were repayable otherwise than by instalments after more than five years from the balance sheet date.
Included within derivative financial instruments falling due within one year is an amount of £2.3 million (2019: £3.9 million) which relates to interest rate swaps with a maturity of greater than 12 months.

Marston’s PLC Annual Report and Accounts 2020Financial Statem
ents
141
9 Provisions for liabilities Deferred Property
tax leases Total £m £m £m
At 29 September 2019 (as originally reported) 17.2 3.7 20.9 Prior period adjustment (3.6) – (3.6) Adjustment for asset class split (1.3) – (1.3) At 29 September 2019 (as restated) 12.3 3.7 16.0 Provided in the period – 2.4 2.4 Released in the period – (0.1) (0.1) Utilised in the period – (0.7) (0.7) Credited to profit or loss (5.8) – (5.8) Credited to other comprehensive income (3.4) – (3.4) At 3 October 2020 3.1 5.3 8.4
Payments are expected to continue in respect of these property leases for periods of 1 to 24 years (2019: 1 to 25 years).
Deferred tax The amount provided in respect of deferred tax is as follows:
2019 (Restated)
£m
Excess of capital allowances over accumulated depreciation 6.1 Property related items 3.1 6.2 Other
2020 £m
5.2
– 12.3
(5.2) 3.1
A deferred tax asset of £2.6 million (2019: £nil) arising on capital losses has not been recognised due to uncertainty over its future recoverability.
10 Financial instruments 2019
Carrying amount of financial assets 2020
£m
37.3 £m
Measured at fair value through profit or loss 40.5
Carrying amount of financial liabilities 2020
£m 2019
£m
Measured at fair value through profit or loss 37.3 40.5
The only financial instruments that the Company holds at fair value are interest rate swaps. The fair values of the Company’s interest rate swaps are obtained using a market approach and reflect the estimated amount the Company would expect to pay or receive on termination of the instruments, adjusted for the Company’s own credit risk. The Company utilises valuations from counterparties who use a variety of assumptions based on market conditions existing at each balance sheet date.
11 Operating lease commitments
At 3 October 2020 the Company had outstanding commitments for future minimum lease payments under non-cancellable operating leases as follows:
2019 £m
Within one year 7.0 In more than one year but less than five years 25.0 25.0 In more than five years
2020 £m
9.9
71.9 103.9
70.0 104.9

142 Marston’s PLC Annual Report and Accounts 2020
Notes continued For the 53 weeks ended 3 October 2020
12 Finance lease obligations
The Company leases various properties and items of equipment under finance leases. The leases have various terms, escalation clauses and renewal rights. Future minimum lease payments under finance leases are as follows:
2020 £m
2019 £m
Within one year 2.0 1.7 In more than one year but less than five years 6.0 5.6 In more than five years 32.4 33.7
40.4 41.0 Future finance charges (19.0) (20.0) Present value of finance lease obligations 21.4 21.0
13 Equity share capital 2019
Number Value Allotted, called up and fully paid
2020 Number
m Value
£m
660.4 48.7 m £m
Ordinary shares of 7.375p each 660.4 48.7
14 Reserves
The share premium account comprises amounts in excess of nominal value received for the issue of shares less any transaction costs.
When effective freehold land and buildings are revalued any gains and losses are recognised in the revaluation reserve, except to the extent that a revaluation gain reverses a revaluation loss previously recognised in profit or loss or a revaluation loss exceeds the accumulated revaluation gains recognised in the revaluation reserve; such gains and losses are recognised in profit or loss. The associated deferred tax on revaluations is also recognised in the revaluation reserve. Amounts representing the equivalent depreciation are transferred to profit and loss reserves annually and the full amount is transferred on disposal of the associated property.
The merger reserve arose on the issue of ordinary shares in the period ended 30 September 2017 and represented the difference between the nominal value of the shares issued and the net proceeds received.
The capital redemption reserve arose on share buybacks.
Details of own shares are provided in note 29 to the Group financial statements.
15 Guarantees and contingent liabilities
The Company has entered into a Deed of Guarantee with Marston’s Trading Limited (‘Trading’) and the Trustees of the Marston’s PLC Pension and Life Assurance Scheme (‘the Scheme’) whereby it guarantees to the Trustees the ongoing obligations of Trading to contribute to the Scheme and the obligations of Trading to contribute to the Scheme in the event of a debt becoming due under section 75 of the Pensions Act 1995 on the occurrence of either Trading entering liquidation or the Scheme winding up.
The Company has guaranteed the obligations of Trading under certain of its banking facilities and the obligations of Marston’s Estates Limited under various property leases.

Marston’s PLC Annual Report and Accounts 2020Financial Statem
ents
143
16 Prior period adjustments
The Company has identified that the accounting treatment for the subordinated loan upon transition to FRS 102, for deferred tax recognised in respect of land and buildings which are held under finance leases and for the split of derivative financial instruments between amounts falling due within one year and amounts falling due after more than one year required adjustment. The appropriate accounting treatment has been applied by retrospective restatement in accordance with Section 10 ‘Accounting Policies, Estimates and Errors’ of FRS 102.
The adjustment to the subordinated loan arose in respect of the determination of the carrying amount of the instrument on transition to FRS 102. When corrected, the cumulative impact on opening profit and loss reserves at 30 September 2018 amounted to £532.0 million. The impact for the 52 weeks ended 28 September 2019 amounted to a write down of the instrument of £70.2 million and resulted in a total reduction to profit and loss reserves at 28 September 2019 of £602.2 million. The impact on net current assets at 28 September 2019 was a reduction of £602.2 million.
The adjustments to the presentation of derivative financial instruments impact the split between amounts falling due within one year and amounts falling due after more than one year in respect of debtors and creditors as set out in the table below. The adjustments increase net current assets at 28 September 2019 by £36.6 million.
The impact of these retrospective restatements on the balance sheet as at 28 September 2019 and the profit for the 52 weeks ended 28 September 2019 has been set out below. The adjustments, where applicable, are before those made in respect of the asset class split detailed in note 17.
As at 28 September 2019 Subordinated
As originally loan Deferred tax Derivatives Restated
Impact on the balance sheet stated
£m adjustment
£m adjustment
£m adjustment
£m amount
£m
Debtors: Amounts falling due within one year 561.7 – – (36.6) 525.1 Debtors: Amounts falling due after more than one year 1,049.8 (602.2) – 36.6 484.2 Creditors: Amounts falling due within one year (767.1) – – 36.6 (730.5) Creditors: Amounts falling due after more than one year (123.6) – – (36.6) (160.2) Deferred tax liabilities (17.2) – 3.6 – (13.6) Other assets and liabilities 648.8 – – – 648.8 Net assets 1,352.4 (602.2) 3.6 – 753.8
Profit and loss reserves 978.6 (602.2) 3.6 – 380.0 Other capital and reserves 373.8 – – – 373.8 Total equity 1,352.4 (602.2) 3.6 – 753.8
52 weeks ended 28 September 2019 Subordinated
As originally loan Deferred tax Derivatives Restatedstated adjustment adjustment adjustment amount
£m £m £m £m £m
Profit for the period 89.4 (70.2) – – 19.2

Marston’s PLC Annual Report and Accounts 2020
144
Notes continued For the 53 weeks ended 3 October 2020
17 Asset class split
In order to provide more reliable and relevant information in respect of its property assets the Company has split the land and buildings asset class within tangible fixed assets into an effective freehold class and a leasehold class.
The effective freehold class comprises land and buildings which are either freehold or are in substance freehold assets. This includes leasehold land and buildings with a term exceeding 100 years at acquisition/commencement of the lease or where there is an option to purchase the freehold at the end of the lease term for a nominal amount. The leasehold class comprises all other leasehold land and buildings.
It is considered that the two groupings above comprise assets which have a different nature and use within the Company’s operations and as such it is appropriate to classify them as separate asset classes under Section 17 ‘Property, Plant and Equipment’ of FRS 102. Leasehold assets derive their value solely from generating income over the lease term and their use/development can be restricted, whereas with effective freehold assets there is additional value from the underlying property asset (including alternative uses and development potential), the assets can be used as security and the value of the property asset is generally maintained over time. It is considered that providing information separately for these two different classes will provide more reliable and relevant information.
The Company has adopted the revaluation model for the effective freehold class and the cost model for the leasehold class. The land and buildings asset class has been held under the revaluation model and as such the measurement basis for assets in the leasehold class has changed. This has been treated as a change in accounting policy and has been applied retrospectively in accordance with Section 10 ‘Accounting Policies, Estimates and Errors’ of FRS 102 and as such the comparatives for the 52 weeks ended 28 September 2019 have been restated.
The impact of this retrospective restatement on the balance sheet as at 28 September 2019 and the profit for the 52 weeks ended 28 September 2019 has been set out below. The adjustments, where applicable, are after the restatements detailed in note 16.
As at 28 September 2019 As stated
following prior
period Restated
Impact on the balance sheet adjustments
£m Adjustment
£m amount
£m
Tangible fixed assets Deferred tax liabilities Other assets and liabilities
375.7 (13.6) 391.7
(9.8) 1.3
–
365.9 (12.3) 391.7
Net assets 753.8 (8.5) 745.3
Revaluation reserve Profit and loss reserves
72.6 380.0
(8.8) 0.3
63.8 380.3
Other capital and reserves Total equity
301.2 753.8
– (8.5)
301.2 745.3
52 weeks ended 28 September 2019 As stated
following prior
period adjustments
£m Adjustment
£m
Restated amount
£m
Profit for the period 19.2 0.1 19.3
18 Events after the balance sheet date
On 4 October 2020 the Company transferred its assets and liabilities associated with the Group’s brewing operations to Marston’s Beer Company Limited for their net book amount of £83.5 million.
Information for Shareholders 146 Glossary 149
Additional Information
145 Marston s PLC Annual Report and Accounts 2020
’
Marston’s PLC Annual Report and Accounts 2020
146
Information for Shareholders
Annual General Meeting (AGM)
The Company’s AGM will be held at 9.00am on 27 January 2021 at Marston’s Talent Academy, Summerfield Road, Wolverhampton WV1 4PR.
At the time of writing, government measures are in force restricting physical public gatherings, due to COVID-19. In view of these measures, and our responsibility to protect the health and safety of our shareholders and employees, we are currently planning that our AGM in 2021 will be held as a closed meeting and convened with the minimum quorum of shareholders (which will be facilitated by Marston’s management) in order to conduct the business of the meeting. Therefore, we regret that shareholders will not be permitted to attend the meeting in person and, in the interests of safety, anyone seeking to attend in person will be refused entry. We strongly encourage shareholders to vote by proxy on the resolutions set out in the Notice of Meeting.
Any changes to the AGM arrangements will be communicated to shareholders before the AGM through our website and, where appropriate, by RNS announcement.
Online Voting for the Annual General Meeting
Although shareholders are not able to attend the meeting, shareholder participation remains important to us and we strongly encourage all shareholders to participate in the business of the meeting by submitting your votes on each of the resolutions in advance.
To register the appointment of a proxy electronically, visit www.sharevote.co.uk and follow the instructions provided (you will need the voting numbers found on your Form of Proxy).
Alternatively, shareholders who have already registered with Equiniti Registrars’ online portfolio service, Shareview, can appoint their proxy electronically by logging on to their portfolio at www.shareview.co.uk using their user ID and password. Once logged in, click “view” on the “My Investments” page. Click on the link to vote and follow the on-screen instructions.
Financial calendar AGM and Interim Management Statement 27 January 2021 Half-year results May 2021 Full-year results November 2021
These dates are indicative only and may be subject to change.
The Marston’s website
Shareholders are encouraged to visit our website www.marstons.co.uk for further information about the Company. The dedicated Investors section on the website contains information specifically for shareholders, including share price information, historical dividend amounts and payment dates together with this year’s (and prior years’) Annual Report and Accounts.
Registrars
The Company’s shareholder register is maintained by our Registrar, Equiniti. If you have any queries relating to your Marston’s PLC shareholding you should contact Equiniti directly by one of the methods below:
Online: help.shareview.co.uk – from here you will be able to securely email Equiniti with your query
Telephone: 0371 384 2274*
By post: Equiniti, Aspect House, Spencer Road, Lancing, West Sussex BN99 6DA
* Lines are open from 9.00am to 5.00pm (UK time), Monday to Friday, excluding public holidays in England and Wales.
Dividend payments
As announced in May 2020, no dividends will be paid in the 2020 financial year. Future dividends will be reviewed.
However, if you believe you have any unclaimed dividends or have misplaced a cheque, please contact Equiniti or visit www.shareview.co.uk. By completing a bank mandate form, dividends can be paid directly into your bank or building society account. Those selecting this payment method will benefit from receiving cleared funds in their bank account on the payment date, avoiding postal delays and removing the risk of any cheques being lost in the post. To change how you receive your dividends contact Equiniti or visit www.shareview.co.uk
Duplicate documents
If you have received two or more sets of the documents concerning the AGM this means that there is more than one account in your name on the shareholder register, perhaps because either your name or your address appear on each account in a slightly different way. If you think this might be the case and would like to combine your accounts, please contact Equiniti.

Marston’s PLC Annual Report and Accounts 2020A
dditional Information
147
Moving house?
It is important that you notify Equiniti of your new address as soon as possible. If you hold 2,500 shares or fewer, and reside in the UK, this can be done quickly over the telephone. However, for holdings greater than 2,500 shares, your instruction will need to be in writing, quoting your full name, shareholder reference number (if known), previous address and new address.
Electronic communications
Changes in legislation in recent years allow the Company to use its corporate website as the main way to communicate with shareholders. Annual Report and Accounts are only sent to those shareholders who have opted to receive a paper copy. Registering to receive shareholder documentation from the Company electronically will allow shareholders to:
• view the Annual Report and Accounts on the day it is published; • receive an email alert when the Annual Report and Accounts and any other shareholder documents are available; • cast their AGM votes electronically; and • manage their shareholding quickly and securely online, through www.shareview.co.uk
This reduces our impact on the environment, minimises waste and reduces printing and mailing costs. For further information and to register for electronic shareholder communications, visit www.shareview.co.uk
Buying and selling shares in the UK
If you wish to buy or sell Marston’s PLC shares and hold a share certificate, you can:
• use the services of a stockbroker or high street bank; or • use a telephone or online service.
If you sell your shares in this way you will need to present your share certificate at the time of sale. Details of low cost dealing services may be obtained from www.shareview.co.uk or 0345 603 7037**.
** Lines are open Monday to Friday, 8.00am to 4.30pm for dealing and until 6.00pm for enquiries (UK time), excluding English public holidays.
Ordinary shares
Range of shareholding Balance ranges
Total number of holdings
Percentage of holders
Total number of shares
Percentage issued capital
1–1,000 3,647 40.54% 1,525,355 0.23% 1,001–10,000 4,028 44.77% 15,613,363 2.36% 10,001–100,000 1,031 11.46% 26,619,682 4.03% 100,001–1,000,000 192 2.13% 65,868,529 9.98% 1,000,001+ 99 1.10% 550,735,265 83.40% Totals 8,997 100.00% 660,362,194 100.00%
An analysis of the register by shareholder type can be found in the Governance section on page 49.
Share fraud warning
Share fraud includes scams where investors are called out of the blue and offered an inflated price for shares they own or shares that often turn out to be worthless or non-existent. These calls come from fraudsters operating ‘boiler rooms’ that are mostly based abroad. While high profits are promised, those who buy or sell shares in this way usually lose their money. The Financial Conduct Authority (FCA) has found most share fraud victims are experienced investors who lose an average of £20,000, with around £200 million lost in the UK each year.
If you are offered unsolicited investment advice, discounted shares, a premium price for shares you own, or free company or research reports, you should take these steps before handing over any money:
• Get the name of the person and organisation contacting you. • Check the Financial Services Register at www.fca.org.uk/register to ensure they are authorised. • Use the details on the FCA Register to contact the firm. • Call the FCA Consumer Helpline on 0800 111 6768 if there are no contact details on the Register or you are told they are out of date. • Search the FCA list of unauthorised firms and individuals to avoid doing business with.
Remember, if it sounds too good to be true, it probably is.
If you use an unauthorised firm to buy or sell shares or other investments, you will not have access to the Financial Ombudsman Service or Financial Services Compensation Scheme if things go wrong.
If you are approached about a share scam you should tell the FCA using the share fraud reporting form at www.fca.org.uk where you will find out about the latest investment scams. You can also call the Consumer Helpline on 0800 111 6768.

148 Marston’s PLC Annual Report and Accounts 2020
Information for Shareholders continued
Company details
Registered office: Marston’s House, Brewery Road, Wolverhampton WV1 4JT
Telephone: 01902 711811
Company registration number: 31461
Investor queries: [email protected]
Auditor
KPMG LLP, One Snowhill, Snowhill Queensway, Birmingham B4 6GH
Advisers
JP Morgan Cazenove, 20 Moorgate, London EC2R 6DA
Peel Hunt LLP, Moor House, 120 London Wall, London EC2Y 5ET
Solicitors
Freshfield Bruckhaus Deringer LLP, 65 Fleet Street, London EC4Y 1HS
Pinsent Masons LLP, 55 Colmore Row, Birmingham B3 2FF
Slaughter & May LLP, One Burnhill Row, London EC1Y 8YY
Shoosmiths LLP, 2 Colmore Square, 38 Colmore Circus Queensway, Birmingham B4 6BJ
Squire Patton Boggs (UK) LLP, Rutland House, 148 Edmund Street, Birmingham B3 2JR
Glossary
Anaphylaxis Campaign British charity that supports people at risk from severe allergic reactions
BBPA British Beer & Pub Association – a body representing Britain’s brewers and pub companies
Capex Capital investment
Carlsberg/Carlsberg UK The Carlsberg Group’s UK brewing business
CGA Coffer Peach Business Tracker Sales data for the UK eating and drinking out market
Critical role turnover The number of times the person in a critical role changes
CROCCE Cash Return on Cash Capital Employed – calculated in the same way as ROC
CR Corporate Responsibility – businesses’ response to their impact on society
EBIT Earnings before interest and tax
EBITDA Earnings before interest, tax, depreciation and amortisation
EBITDAR Earnings before interest, tax, depreciation, amortisation and restructuring or rent
EHO Environmental Health Officer
EOHO Eat Out to Help Out Government initiative through August 2020
EPOS Electronic point of sale
EPS Earnings per share
ESG Environmental, Social and Governance
EV Electric vehicle
Export Anything sold outside the UK
FCF Free cash flow – operating cash flow of the business after tax and interest
FRC Financial Reporting Council – independent regulator
Free trade Independently owned pubs and clubs
FTSE4Good Ethical stock market indices launched in 2001, with inclusion based on a range of Corporate Responsibility criteria
GWE Biogas plant Food waste processing plant
Happiness score Measure of guest satisfaction used in our pubs and bars
IRI Market research provider for consumer and retail insight
Kantar Data and insight consultancy
kW Kilowatt – a measure of electric power
IGD Data and insight provider for food and grocery industry
Designed and produced by Radley Yeldar | ry.com
This report has been printed on materials that are FSC Certifed and sourced from a mill which is ISO14001 accredited.
The report is printed by an FSC and ISO14001 certifed printer, using vegetable oil based inks and an alcohol free process.
Like-for-like Sales this year compared to sales in the previous year, of the same pubs trading in both periods, expressed as a percentage
Low and no-alcohol No more than 1.2% abv and no more than 0.05% abv, respectively
MBC Marston’s Beer Company, internal division
MRO Market rent only – as defined in The Pubs Code
MW Megawatt – a measure of electric power
National Living Wage Government minimum pay requirements for 25s and over
National Minimum Wage Government minimum pay requirements for under 25s
NAV Net asset value
NED Non-executive Director
NCF Net cash flow – Change in debt resulting from cash flows
Off-trade Business with food and drink retailers, such as supermarkets (also known as take home)
On-trade Business with hotels, bars, restaurants and pub companies
On time in full Fulfilling 100% of order requirements within agreed timeframe
Packaged Includes bottles and cans
PBT Profit before tax
PBA Premium bottled ale
PCA Pubs Code Adjudicator
PCDR Performance, Career and Development Review
Primary logistics Delivery to off-trade and on-trade depots
Rapid electrical vehicle chargers Fast charging network for electric vehicles
Retail logistics Delivery direct to our pubs
ROC Return on capital – a measure of how effectively we use the capital invested in our business
SEDEX Supplier Ethical Data Exchange – membership organisation for auditing supply chains
The Pubs Code Statutory regulation effective 21 July 2016
TSR Total shareholder return – a combination of share price appreciation and dividends paid
Total revenue Total revenue from continuing and discontinued operations
Venture Pubs Tenanted and leased pubs
Ways of Working Marston’s values and principles that guide our expected behaviours and actions
WRAP Waste & Resources Action Programme
WTO World Trade Organisation

Marston’s PLC Marston’s House, Brewery Road,
Wolverhampton WV1 4JT
Telephone 01902 711811 Registered No. 31461