marsden area property watch q3 2012
DESCRIPTION
Sales activity across the Marsden Area property market remains flat despite modest price corrections in an already affordable market.TRANSCRIPT
www.prdresearch.com.au Your home of property knowledge
Third Quarter │2012
MARSDEN/ CRESTMEAD Property Watch®
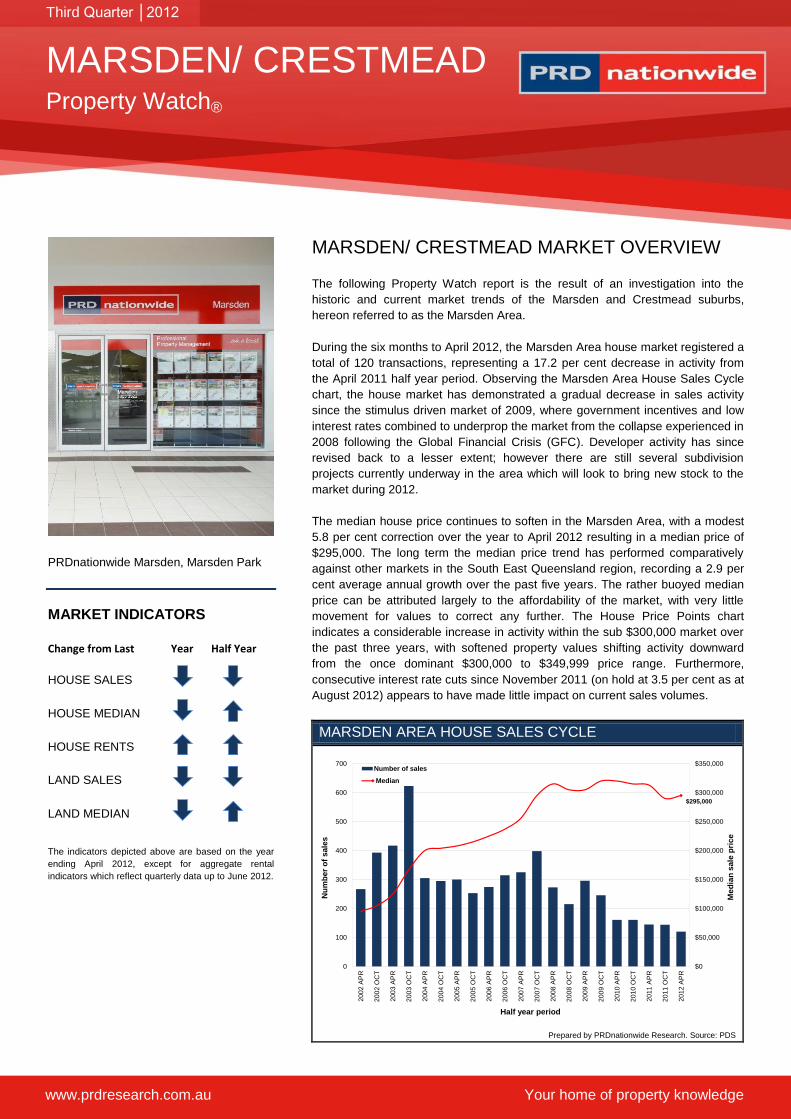
PRDnationwide Marsden, Marsden Park
MARKET INDICATORS
Change from Last Year Half Year
HOUSE SALES
HOUSE MEDIAN
HOUSE RENTS
LAND SALES
LAND MEDIAN
The indicators depicted above are based on the year
ending April 2012, except for aggregate rental
indicators which reflect quarterly data up to June 2012.
MARSDEN/ CRESTMEAD MARKET OVERVIEW
The following Property Watch report is the result of an investigation into the
historic and current market trends of the Marsden and Crestmead suburbs,
hereon referred to as the Marsden Area.
During the six months to April 2012, the Marsden Area house market registered a
total of 120 transactions, representing a 17.2 per cent decrease in activity from
the April 2011 half year period. Observing the Marsden Area House Sales Cycle
chart, the house market has demonstrated a gradual decrease in sales activity
since the stimulus driven market of 2009, where government incentives and low
interest rates combined to underprop the market from the collapse experienced in
2008 following the Global Financial Crisis (GFC). Developer activity has since
revised back to a lesser extent; however there are still several subdivision
projects currently underway in the area which will look to bring new stock to the
market during 2012.
The median house price continues to soften in the Marsden Area, with a modest
5.8 per cent correction over the year to April 2012 resulting in a median price of
$295,000. The long term the median price trend has performed comparatively
against other markets in the South East Queensland region, recording a 2.9 per
cent average annual growth over the past five years. The rather buoyed median
price can be attributed largely to the affordability of the market, with very little
movement for values to correct any further. The House Price Points chart
indicates a considerable increase in activity within the sub $300,000 market over
the past three years, with softened property values shifting activity downward
from the once dominant $300,000 to $349,999 price range. Furthermore,
consecutive interest rate cuts since November 2011 (on hold at 3.5 per cent as at
August 2012) appears to have made little impact on current sales volumes.
MARSDEN AREA HOUSE SALES CYCLE
Prepared by PRDnationwide Research. Source: PDS
$295,000
$0
$50,000
$100,000
$150,000
$200,000
$250,000
$300,000
$350,000
0
100
200
300
400
500
600
700
200
2 A
PR
200
2 O
CT
200
3 A
PR
200
3 O
CT
200
4 A
PR
200
4 O
CT
200
5 A
PR
200
5 O
CT
200
6 A
PR
200
6 O
CT
2007
AP
R
200
7 O
CT
200
8 A
PR
200
8 O
CT
200
9 A
PR
200
9 O
CT
201
0 A
PR
201
0 O
CT
201
1 A
PR
201
1 O
CT
201
2 A
PR
Me
dia
n s
ale
pri
ce
Nu
mb
er
of
sa
les
Half year period
Number of sales
Median

Prepared by PRDnationwide Research. Source: PDS, ABS, Residential Tenancy Authority. PRDnationwide does not give any warranty in relation to the accuracy of the information contained in this report. If you intend to rely upon the information contained herein, you must take note that the information, figures and projections have been provided by various sources and have not been verified by us. We have no belief one way or the other in relation to the accuracy of such information, figures and projections. PRDnationwide will not be liable for any loss or damage resulting from any statement, figure, calculation or any other information that you rely upon that is contained in the material. Prepared by PRDnationwide Research © All medians and volumes are calculated by PRDnationwide Research. Use with written permission only. All other responsibilities disclaimed. © 2012
Your home of property knowledge www.prdresearch.com.au
Research Analyst │Robert Matta P (07) 3026 3357 F (07) 3166 0457 E [email protected]
PRDnationwide Marsden │Principal Ronn Nielsen P (07) 3805 3322 F (07) 3805 2112 E [email protected]
Anecdotal evidence
highlights an
increase in buyer
enquiry since July
2012, with well-
priced property
quick to move.
HOUSE PRICE POINTS
Prepared by PRDnationwide Research. Source: PDS
MEDIAN RENTS – 4132 PC
Prepared by PRDnationwide Research. Source: RTA
Sales activity across the Marsden Area land market has diluted during the year to
April 2012 as the availability of land tightens and developer activity subsides.
Further residential growth in the immediate area is likely to be facilitated via the
Park Ridge/ Logan Reserve urban growth corridor which is earmarked to bring to
market new residential estates in the coming years. The prevailing median land
price of $198,000 indicates sustained demand for a product which is running low
in supply. Whilst there are still several small subdivision prospects in the area,
most large scale sites have already been exploited and brought to market.
MARSDEN AREA LAND SALES CYCLE
Prepared by PRDnationwide Research. Source: PDS
Investor activity across the Marsden Area property market remains low, with little
to no movement in rental price growth over the past three years and rather
modest capital appreciation as indicated by the Average Capital Growth chart,
placing a cloud over the short term growth prospects of the market. With that
being said, the availability of competitively priced property in the current market
affords many would-be property investors with an opportunity to secure a solid
entry level property to kick start their property portfolio, with sound rental yields
available to those who purchase well-presented property at the right price.
MARSDEN AREA HOUSE AVERAGE CAPITAL GROWTH
Prepared by PRDnationwide Research. Source: PDS
4%
21%
49%
17%
6%
4%
11%
20%
43%
14%
7%
5%
19%
21%
32%
16%
10%
1%
10%
42%
22%
15%
7%
3%
17%
38%
20%
13%
11%
1%
0% 20% 40% 60% 80% 100%
Less than$250,000
$250,000 to$299,999
$300,000 to$349,999
$350,000 to$399,999
$400,000 to$449,999
At least$450,000
Portion of total sales
Pri
ce p
oin
ts
2010 APR 2010 OCT 2011 APR 2011 OCT 2012 APR
$310
$360
$310
$370
$320
$365
$-
$5
0
$1
00
$1
50
$2
00
$2
50
$3
00
$3
50
$4
00
3 Bed
4 Bed
Median rent
Ho
us
e t
yp
e
2010 JUN 2011 JUN 2012 JUN
$198,000
$0
$50,000
$100,000
$150,000
$200,000
$250,000
0
20
40
60
80
100
120
140
160
180
200
2 A
PR
200
2 O
CT
200
3 A
PR
200
3 O
CT
200
4 A
PR
200
4 O
CT
200
5 A
PR
200
5 O
CT
200
6 A
PR
200
6 O
CT
200
7 A
PR
200
7 O
CT
200
8 A
PR
200
8 O
CT
200
9 A
PR
200
9 O
CT
201
0 A
PR
201
0 O
CT
201
1 A
PR
201
1 O
CT
201
2 A
PR
Med
ian
sale
pri
ce
Nu
mb
er
of
sale
s
Half year period
Number of sales
Median
0%
5%
10%
15%
20%
25%
200
2 A
PR
200
2 O
CT
200
3 A
PR
200
3 O
CT
200
4 A
PR
200
4 O
CT
200
5 A
PR
200
5 O
CT
2006
AP
R
200
6 O
CT
200
7 A
PR
200
7 O
CT
200
8 A
PR
2008
OC
T
200
9 A
PR
200
9 O
CT
201
0 A
PR
201
0 O
CT
2011
AP
R
201
1 O
CT
201
2 A
PR
Avera
ge a
nn
ual
cap
ital g
row
th r
ate
Half year period