mars radar sounders marsis data inversion roma 10.03.07
TRANSCRIPT
Mars Radar Sounders
MARSIS data inversion
Roma 10.03.07
Mars Radar Sounders
MARSIS data inversion
Main items on the MARSIS data inversionObjective: The aim of the inversion process is to evaluate possible values of the permittivity of the materials composing the different detected interfaces, including the impurity (inclusion), if any, and its percentage that would generate the observed radio echoes. This will be achieved by a best fitting approach between the available models and the data obtained from the radar.Constraints: It is necessary an “a priori” hypothesis on the surface dielectric constant or on the host material in case of presence of inclusion. In this last case the inclusion and its percentage will be estimated by the inversion process. An accurate and dedicated frame selection is necessary to reduce the uncertainty on the estimated data.Models: Few models of inclusion have been developed and utilized to invert the data. A simulator of the Mars surface, based on MOLA data and with a facet model has utilized in order to verify the correct selection of the frames used for the data inversion (absence of clutter echoes). Available data: the sounder observations, that is the surface to subsurface power ratio and the relative time delay.
Mars Radar Sounders
MARSIS data inversion
Issues: Due to the experimental data fluctuation (ionosphere residuals that have not been correctly compensated for, errors in the surface maps and possible errors in the radar processing) the dielectric constant estimation will be established within a range of possible valuesResults: The data inversion method can not provide an unique solution, in terms of identification of the dielectric constant of the surface and subsurface, only a solution that is possible. The results described thus also have to be compatibility with a range of realistic material models, confined by the extreme models considered possible by geologists. In obtaining the error bars on the reported data the radar data fluctuation due to surface behaviour has been included. A relative calibration has been performed to determine the capability of MARSIS to resolve different surface dielectric constants. In this calibration, based on the estimate of surface backscattering, the influence of the ionosphere has also been taken into account. Constraints from the known geological history of the surface, the local temperature and the thermal condition of the observed zones and the results of other instruments situated on Mars Express and other missions to Mars have been considered in order to improve the validity of the selected models.
Mars Radar Sounders Surface and subsurface reflectivity
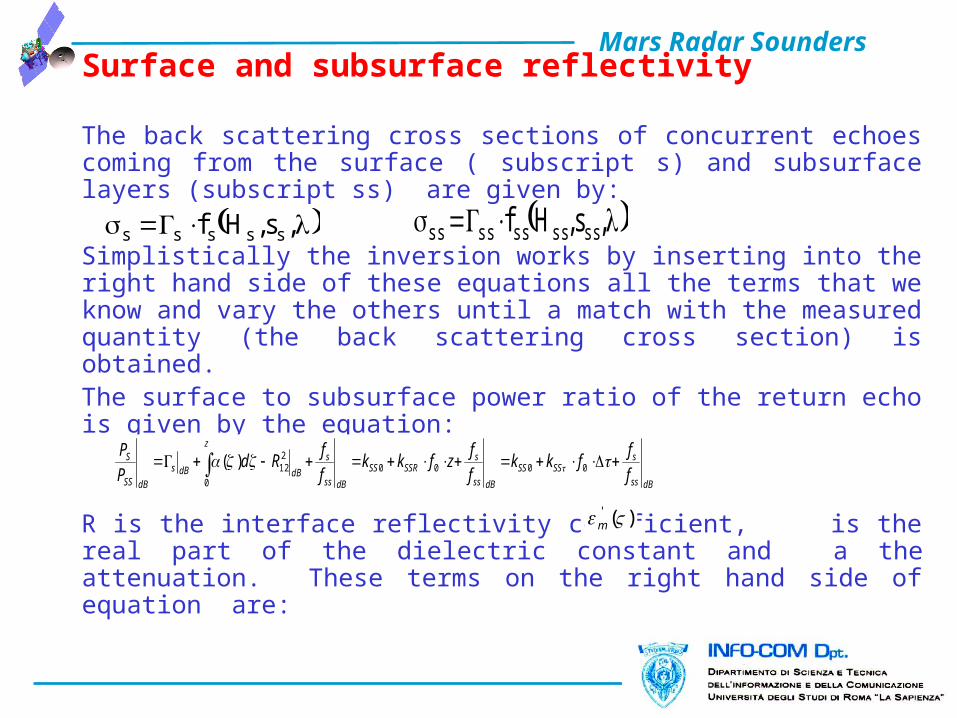
The back scattering cross sections of concurrent echoes coming from the surface ( subscript s) and subsurface layers (subscript ss) are given by: Simplistically the inversion works by inserting into the right hand side of these equations all the terms that we know and vary the others until a match with the measured quantity (the back scattering cross section) is obtained.The surface to subsurface power ratio of the return echo is given by the equation:
R is the interface reflectivity coefficient, is the real part of the dielectric constant and a the attenuation. These terms on the right hand side of equation are:
,s,Hf sssss ,s,Hf ssssssssss
)(' m
dBss
sSSSS
dBss
sSSRSS
dBss
s
dB
z
dBs
dBSS
S
f
ffkk
f
fzfkk
f
fRd
P
P 0000
212
0
)(
Mars Radar Sounders Surface and subsurface reflectivity
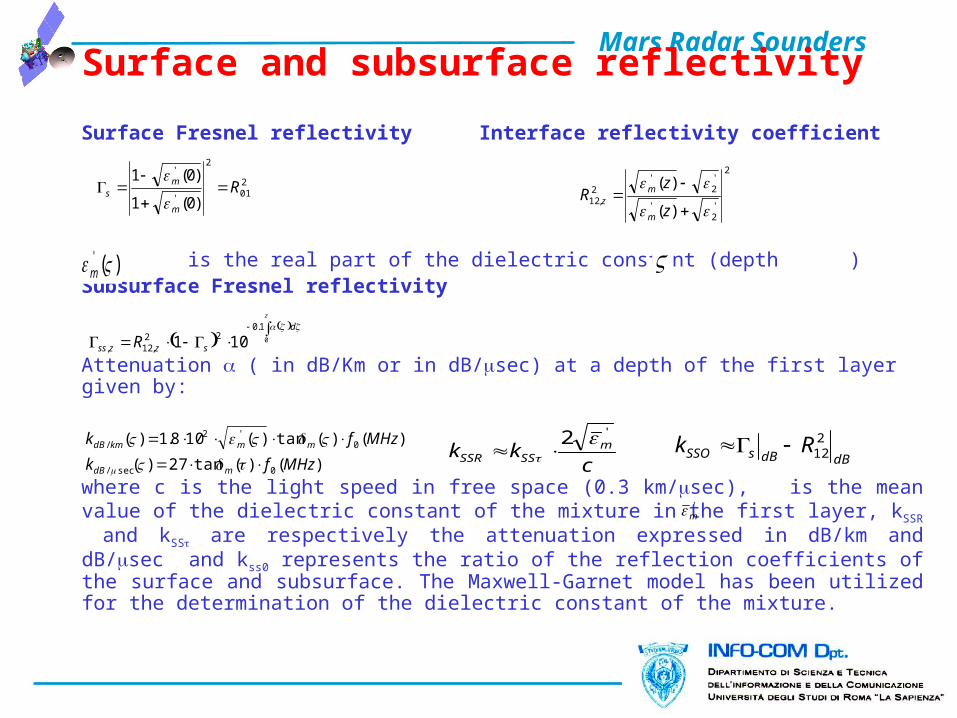
Surface Fresnel reflectivity Interface reflectivity coefficient
is the real part of the dielectric constant (depth )Subsurface Fresnel reflectivity
Attenuation ( in dB/Km or in dB/sec) at a depth of the first layer given by:
where c is the light speed in free space (0.3 km/sec), is the mean value of the dielectric constant of the mixture in the first layer, kSSR and kSS are respectively the attenuation expressed in dB/km and dB/sec and kss0 represents the ratio of the reflection coefficients of the surface and subsurface. The Maxwell-Garnet model has been utilized for the determination of the dielectric constant of the mixture.
201
2
'
'
)0(1
)0(1R
m
ms
2
'2
'
'2
'2
,12)(
)(
z
zR
m
mz
)(' m
z
d
szzss R 0
1.022
,12, 101
)()(tan27)(
)()(tan)(108.1)(
0sec/
0'2
/
MHzfk
MHzfk
mdB
mmkmdB
ckk m
SSSSR
'2 dBdBsSSO Rk 2
12
'm

Mars Radar Sounders
Surface and subsurface reflectivity
Once a potential subsurface echo has been detected, the following checks must be carried out:•Analysis of the surface backscattering in the cross track direction (performed also with the help of a simulator utilizing MOLA data) must be carried out to verify that surface clutter does not affect the subsurface return echoes •Analysis of the return echoes from adjacent available orbits to differentiate between surface clutter and subsurface echoes.•Analysis of return echoes from different regions (supposing same composition of the first layer materials ), in order to obtain information on how the composition of the first layer varies with depth.•Multi frequency analysis must be carried out to establish how the frequency dependent parameters affecting the behaviour of the radar echoes •After the selection of suitable frames, they must be integrated together to improve the signal to noise ratio.•Ionosphere effects in radar signal must also be corrected by using the Ionosphere plasma frequency estimation.
Mars Radar Sounders
Surface and subsurface reflectivity
It is possible to obtain a preliminary estimation of the composition of the first layer down to a large enough depth to allow us to estimate the composition of any pore filling material. This will be performed along the orbit direction by considering the mean value of multi profiles selected by considering the radar spatial resolution. This procedure, when the orbits are available, should be performed either on parallel orbits as well on perpendicular orbit within the same area of the Martian surface and with different solar zenith angle. This estimation can be improved if the surface is stationary. Therefore for the Inversion Approach to work we need to:•Select areas where stationary hypothesis is verified •Selection areas that are suitably flat (first layer depth)•Selection of suitable frames, taking into account :
Surface and subsurface behaviour Local stationary hypothesis: the statistical parameters must be
constant within the area under analysis.
The most likely detection scenario are [1] :• Ice/water interface detection scenario (I/W)
Mars Radar Sounders
Surface and subsurface reflectivity
• Dry/ice interface detection (D/I)• Pure Ice/Crust material interface detection scenario (PI/CM):
• Solid CO2/Crust material interface detection scenario (CO2/CM)
In the first two scenarios the host material is the same for the two layers with different composition within the inclusion while in last two scenarios inclusions are only present only in the first layer. The second layer is assumed to be composed of materials that are described in the following table. Although a multitude of different chemical compositions is present on the surface of Mars, it is necessary to select a few that are representative of the crust materials as far as electromagnetic studies are concerned. These are shown in the following tables; with the two values of the dielectric constants tabled representing the extremes of possible values.
Mars Radar Sounders
Surface and subsurface reflectivity
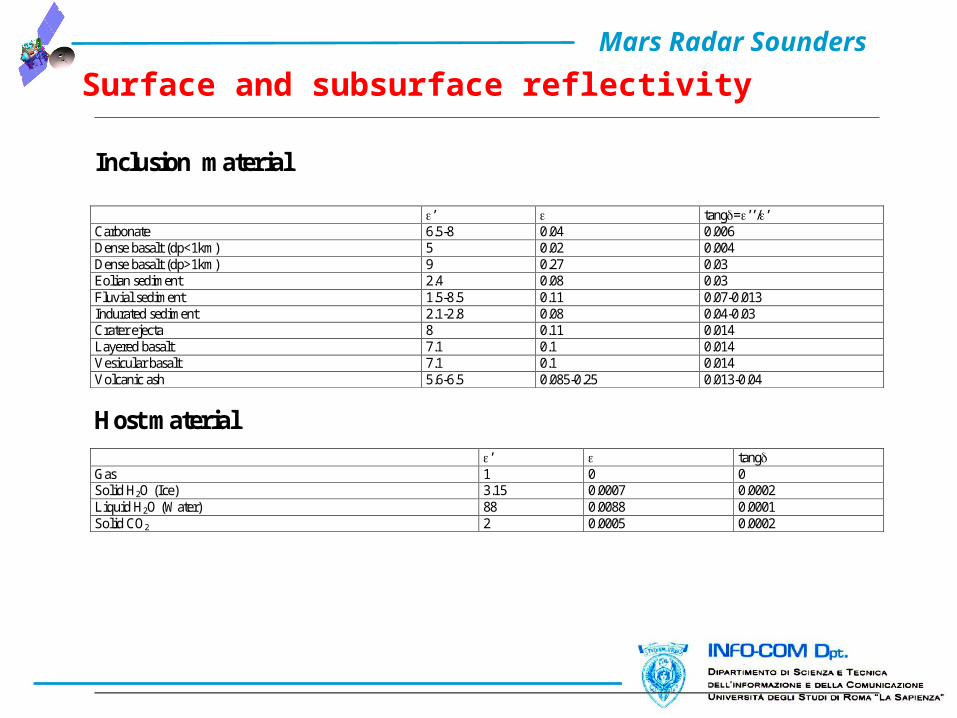
Inclusion material
Host material
’ ” tang=’’/’ Carbonate 6.5-8 0.04 0.006 Dense basalt (dp<1km) 5 0.02 0.004 Dense basalt (dp>1km) 9 0.27 0.03 Eolian sediment 2.4 0.08 0.03 Fluvial sediment 1.5-8.5 0.11 0.07-0.013 Indurated sediment 2.1-2.8 0.08 0.04-0.03 Crater ejecta 8 0.11 0.014 Layered basalt 7.1 0.1 0.014 Vesicular basalt 7.1 0.1 0.014 Volcanic ash 5.6-6.5 0.085-0.25 0.013-0.04
’ ” tang Gas 1 0 0 Solid H2O (Ice) 3.15 0.0007 0.0002 Liquid H2O (Water) 88 0.0088 0.0001 Solid CO2 2 0.0005 0.0002
Mars Radar Sounders
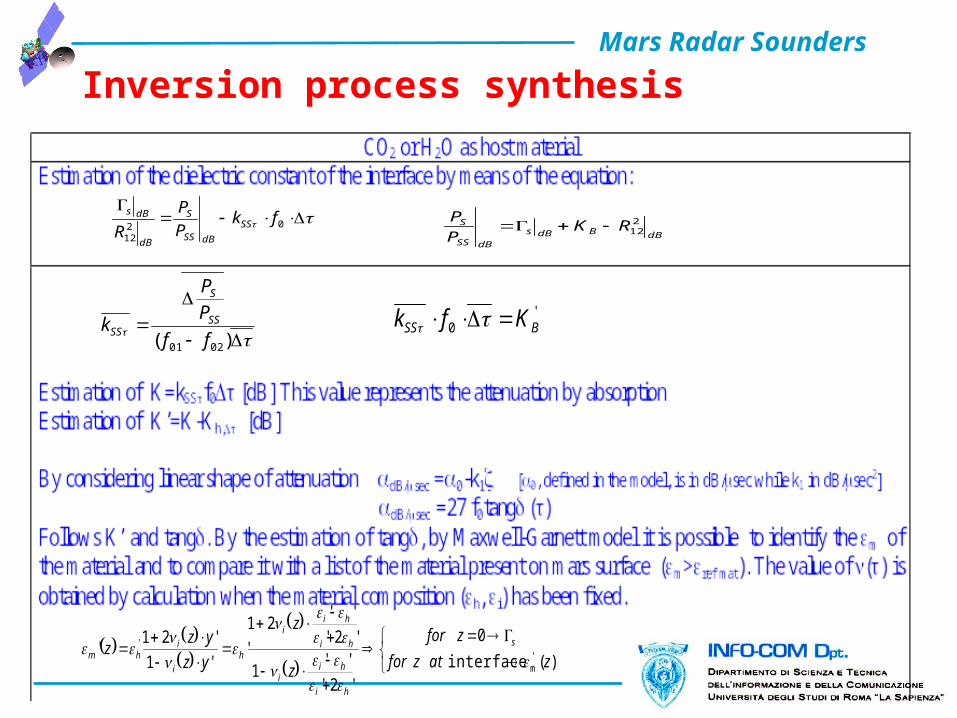
Inversion process synthesis
0212
fkP
P
RSS
dBSS
S
dB
dBs
dBBdBs
dBSS
S RKP
P 212
)(interface
0
'2'
''1
'2'
''21
''1
'21' '
m
'
zatzfor
zfor
z
z
yz
yzz s
hi
hii
hi
hii
hi
ihm
)( 0201 ff
P
P
k SS
S
SS
'0 BSS Kfk
Mars Radar Sounders
Orbits and frames selection
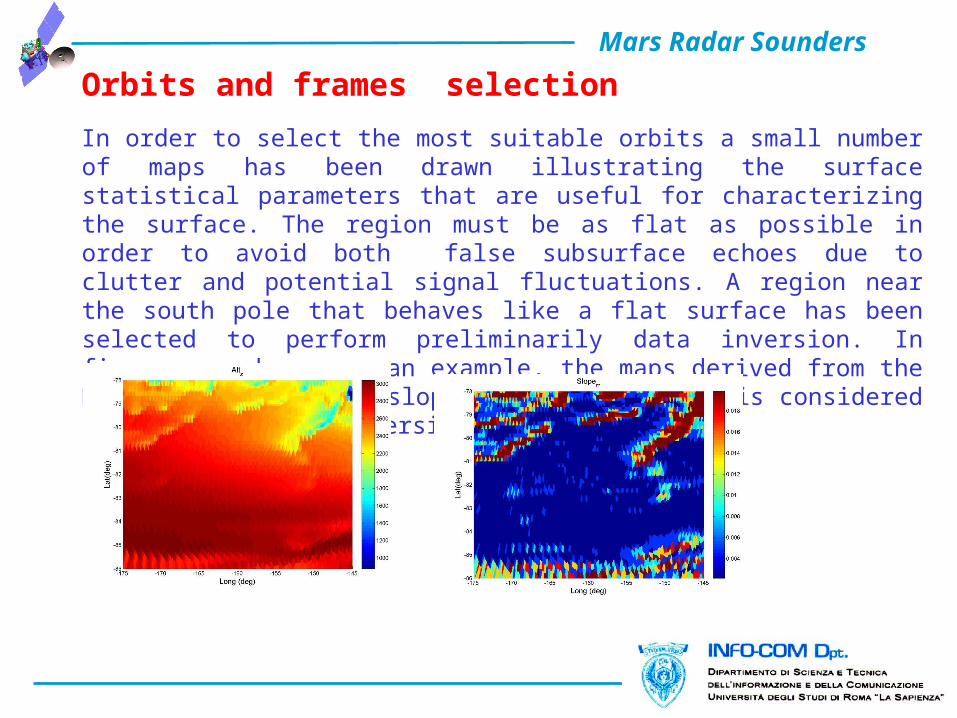
In order to select the most suitable orbits a small number of maps has been drawn illustrating the surface statistical parameters that are useful for characterizing the surface. The region must be as flat as possible in order to avoid both false subsurface echoes due to clutter and potential signal fluctuations. A region near the south pole that behaves like a flat surface has been selected to perform preliminarily data inversion. In figure are shows, as an example, the maps derived from the MOLA data and of the slope for the area that is considered suitable for data inversion.
Mars Radar Sounders
Orbits and frames selectionThe surface characteristics are important in the selection of the frames. The surface to be utilized for data inversion first of all must of course show the existence of a subsurface echo and second must satisfy a stationary behavior. The depth of first layer, , must me constant. This condition is necessary, otherwise, subsurface time delay variations between consecutive frames in the same orbit or nearby frames on different orbits may impact on the selection of the frames. In order to satisfy the stationary (backscattering parameters) condition, the following must be considered:• surface backscattering parameters (roughness, etc): by the first return echo• subsurface backscattering parameters (roughness, etc): by the second return echo •Sun Elevation (by parameter a2 of ionosphere contrast loop [8]) and satellite height)Any residual fluctuation of the return power due to the above items will have an impact on the data inversion (i.e. error bar on the estimation of the dielectric constant of the detected interface) and for this reason the frame must be selected in order to minimize the fluctuation in Ps/Pss . Therefore an integration of many frames along the orbit is not possible because the surface
Mars Radar Sounders
Orbits and frames selection
and subsurface characteristics suddenly change and so it is impossible to find wide areas satisfying the stationary conditions. In addition due to other phenomenon such as the presence of a magnetic field, the low level of the sun elevation (ionosphere effect), the presence of clutter which is possible for part of the surface even in a flat area, the number of frame that can be utilized for the data inversion is limited.
Mars Radar Sounders
Orbits and frames selection
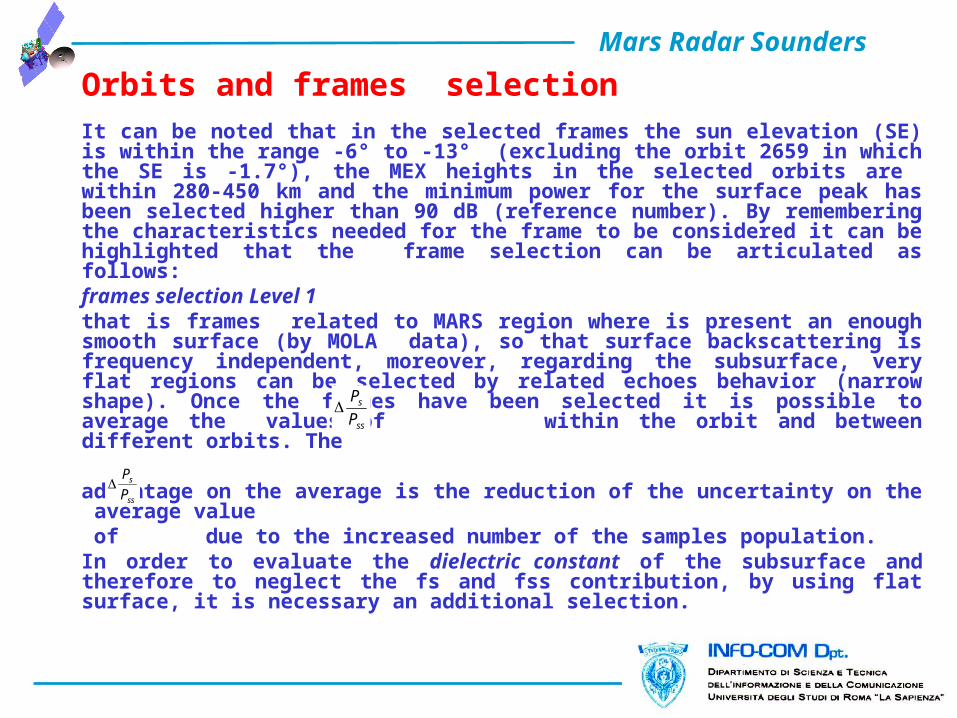
It can be noted that in the selected frames the sun elevation (SE) is within the range -6° to -13° (excluding the orbit 2659 in which the SE is -1.7°), the MEX heights in the selected orbits are within 280-450 km and the minimum power for the surface peak has been selected higher than 90 dB (reference number). By remembering the characteristics needed for the frame to be considered it can be highlighted that the frame selection can be articulated as follows:frames selection Level 1that is frames related to MARS region where is present an enough smooth surface (by MOLA data), so that surface backscattering is frequency independent, moreover, regarding the subsurface, very flat regions can be selected by related echoes behavior (narrow shape). Once the frames have been selected it is possible to average the values of within the orbit and between different orbits. The
advantage on the average is the reduction of the uncertainty on the average value of due to the increased number of the samples population. In order to evaluate the dielectric constant of the subsurface and therefore to neglect the fs and fss contribution, by using flat surface, it is necessary an additional selection.
ss
s
P
P
ss
s
P
P
Mars Radar Sounders
Orbits and frames selection
frames selection Level 2
according to the aim of the data inversion, it is necessary the evaluation of the Ps/Pss ratio (see equations (2)) to estimate the surface and subsurface backscattering coefficient which are respectively surface and subsurface dependent. In this case both surface and subsurface must be very flat: Ps value shall be as high as possible and as narrow as possible (compatible with the Hanning weighting network) and Ps/Pss minimum taking into account that the Pss value will be maximum if the subsurface is flat.
Mars Radar Sounders
Orbits and frames selection
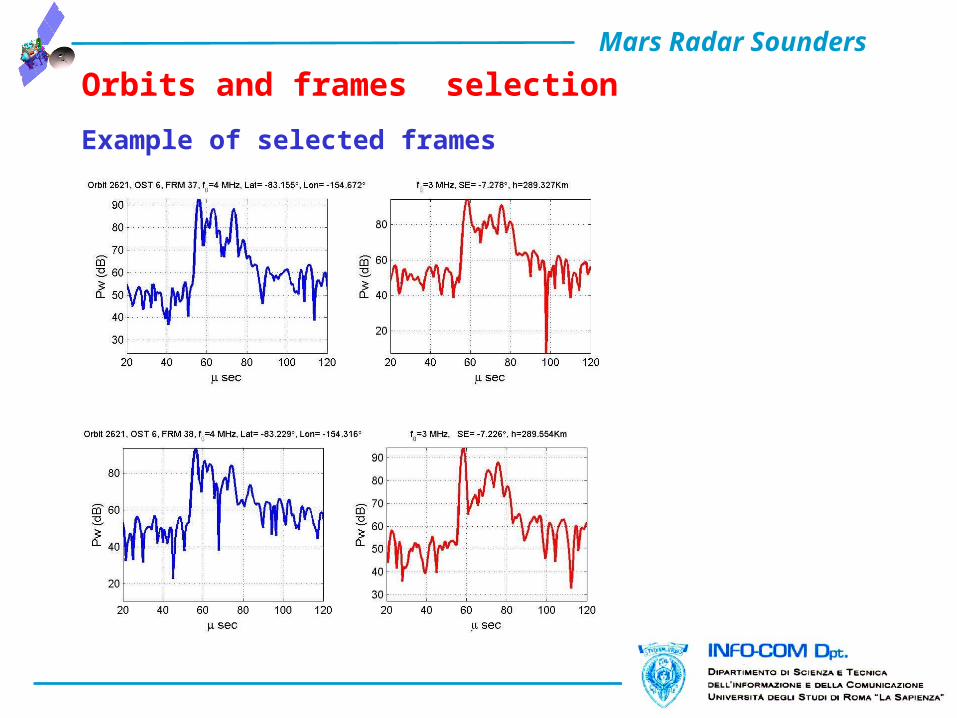
Example of selected frames
Mars Radar Sounders
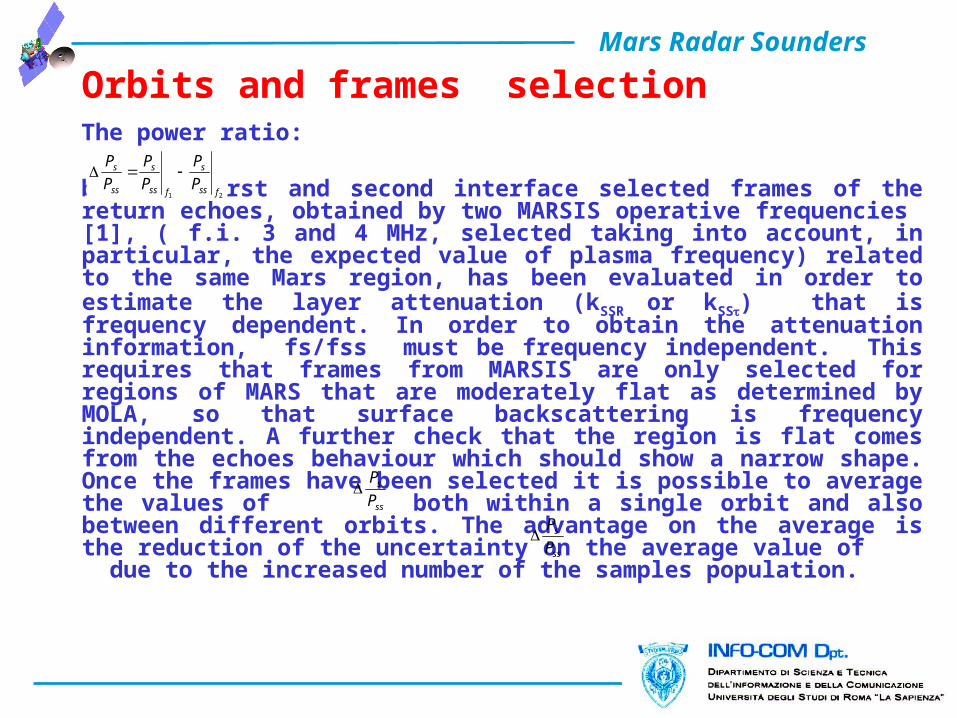
Orbits and frames selectionThe power ratio:
between first and second interface selected frames of the return echoes, obtained by two MARSIS operative frequencies [1], ( f.i. 3 and 4 MHz, selected taking into account, in particular, the expected value of plasma frequency) related to the same Mars region, has been evaluated in order to estimate the layer attenuation (kSSR or kSS) that is frequency dependent. In order to obtain the attenuation information, fs/fss must be frequency independent. This requires that frames from MARSIS are only selected for regions of MARS that are moderately flat as determined by MOLA, so that surface backscattering is frequency independent. A further check that the region is flat comes from the echoes behaviour which should show a narrow shape. Once the frames have been selected it is possible to average the values of both within a single orbit and also between different orbits. The advantage on the average is the reduction of the uncertainty on the average value of due to the increased number of the samples population.
21 fss
s
fss
s
ss
s
P
P
P
P
P
P
ss
s
P
P
ss
s
P
P
Mars Radar Sounders
Orbits and frames selection
Having selected flat surfaces so that we can neglect the fs and fss contribution , in order to evaluate the dielectric constant of the subsurface it is necessary to make a further selection of the frames to be used. We need to evaluate the ratio Ps/Pss to estimate the surface and subsurface backscattering coefficient which are respectively surface and subsurface dependent. To successfully do this we require the value of Ps to be as high and narrow as possible (compatible with the Hanning weighting network) and for Ps/Pss to be near its minimum since the value of Pss will be at its maximum for a flat surface.
Mars Radar Sounders Data inversion in Mars south polar region: mono-layered deposit.
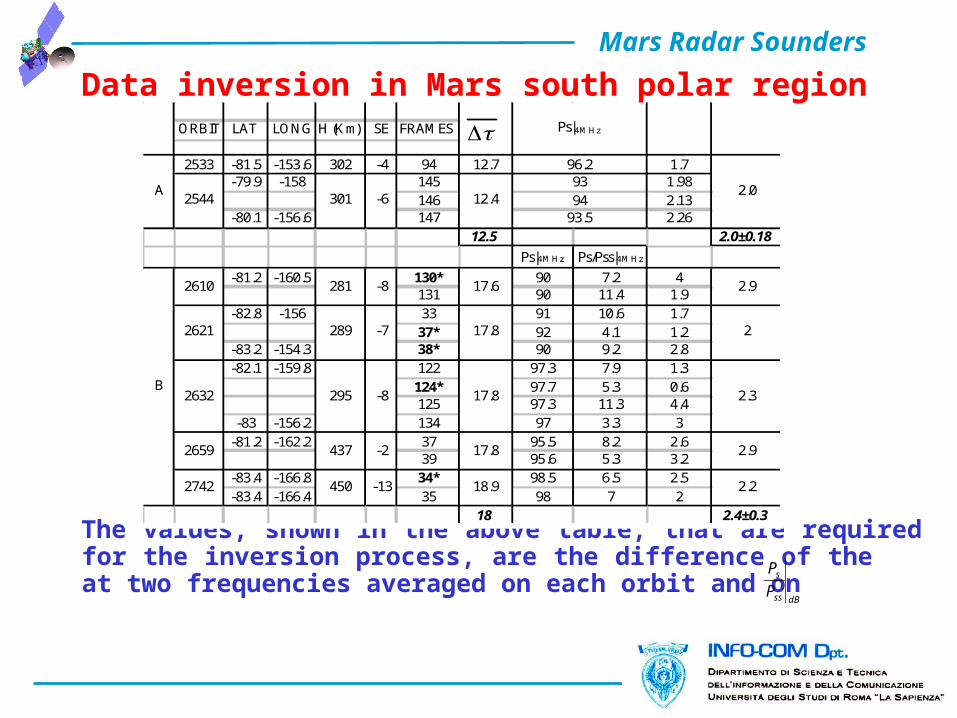
Very smooth areas in the South Mars region, where several adjacent orbits are suitable, have been selected in line with the previous discussion to test the data inversion process. In particular region B (Latitude -80.5° to -84°, Longitude -154° to -170°) was found to be very suitable since there are subsurface return echoes at roughly 17.8 sec. A second region has been selected (region A) located between (Latitude -79.3° to -80.1°, Longitude -155.5 ° to -158°) where the subsurface echoes are located at roughly 13 sec.In the selected frames the sun elevation (SE) is within the range -6° to -13° (excluding orbit 2659 where the SE is -1.7°), the MEX heights in the selected orbits are within 280-450 km and the minimum power for the surface peak is higher than 90 dB (reference number). The values of all the parameters obtained for the selected frames from orbits whose ground tracks pass over the area shown in the previous figure are given in the following table.
Mars Radar Sounders
Data inversion in Mars south polar region
The values, shown in the above table, that are required for the inversion process, are the difference of the at two frequencies averaged on each orbit and on
ORBIT LAT LONG H (Km) SE FRAMES
2533 -81.5 -153.6 302 -4 94 12.7 1.7-79.9 -158 145 1.98
146 2.13-80.1 -156.6 147 2.26
12.5 2.0±0.18
Ps|4MHz Ps/Pss|4MHz
-81.2 -160.5 130* 90 7.2 4131 90 11.4 1.9
-82.8 -156 33 91 10.6 1.737* 92 4.1 1.2
-83.2 -154.3 38* 90 9.2 2.8-82.1 -159.8 122 97.3 7.9 1.3
124* 97.7 5.3 0.6125 97.3 11.3 4.4
-83 -156.2 134 97 3.3 3-81.2 -162.2 37 95.5 8.2 2.6
39 95.6 5.3 3.2-83.4 -166.8 34* 98.5 6.5 2.5-83.4 -166.4 35 98 7 2
18 2.4±0.3
-2 17.8 2.9
2742 450 -13 18.9 2.2
2
2632 295 -8 17.8 2.3
2.0
B
2610 281
2621 289
2659 437
-7 17.8
A
96.2
3012544 94
-8 17.6
93
93.5
2.9
-6 12.4
Ps|4MHz
dBSS
S
P
P
dBSS
S
P
P
dBss
s
P
P
Mars Radar Sounders
Data inversion in Mars south polar region
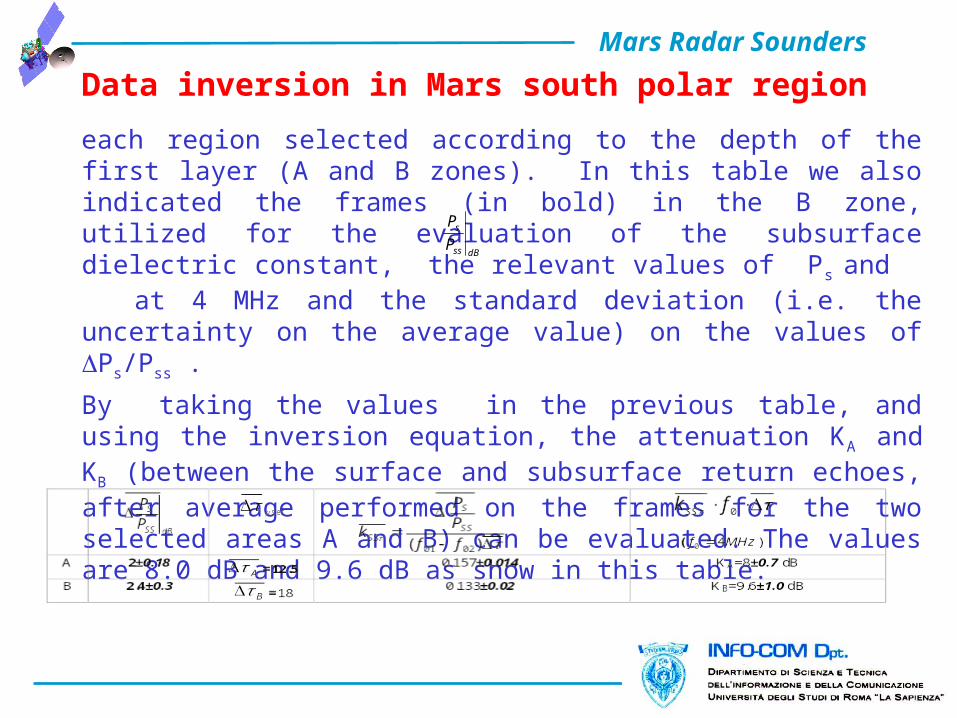
each region selected according to the depth of the first layer (A and B zones). In this table we also indicated the frames (in bold) in the B zone, utilized for the evaluation of the subsurface dielectric constant, the relevant values of Ps and at 4 MHz and the standard deviation (i.e. the uncertainty on the average value) on the values of Ps/Pss .
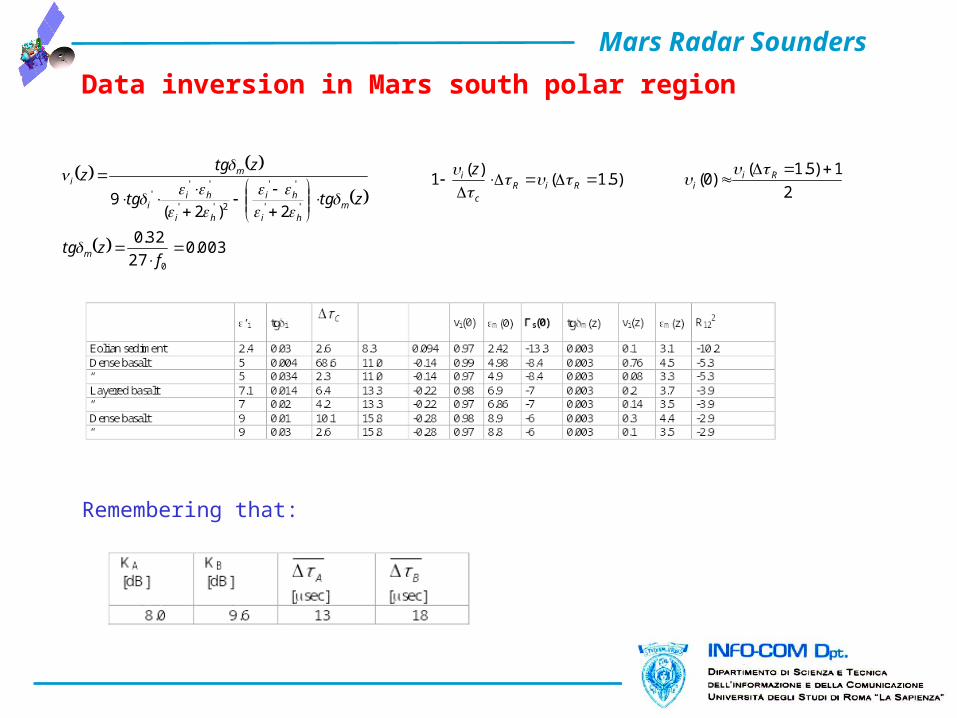
By taking the values in the previous table, and using the inversion equation, the attenuation KA and KB (between the surface and subsurface return echoes, after average performed on the frames for the two selected areas A and B) can be evaluated. The values are 8.0 dB and 9.6 dB as show in this table.
dBss
s
P
P
Mars Radar Sounders
Data inversion in Mars south polar region
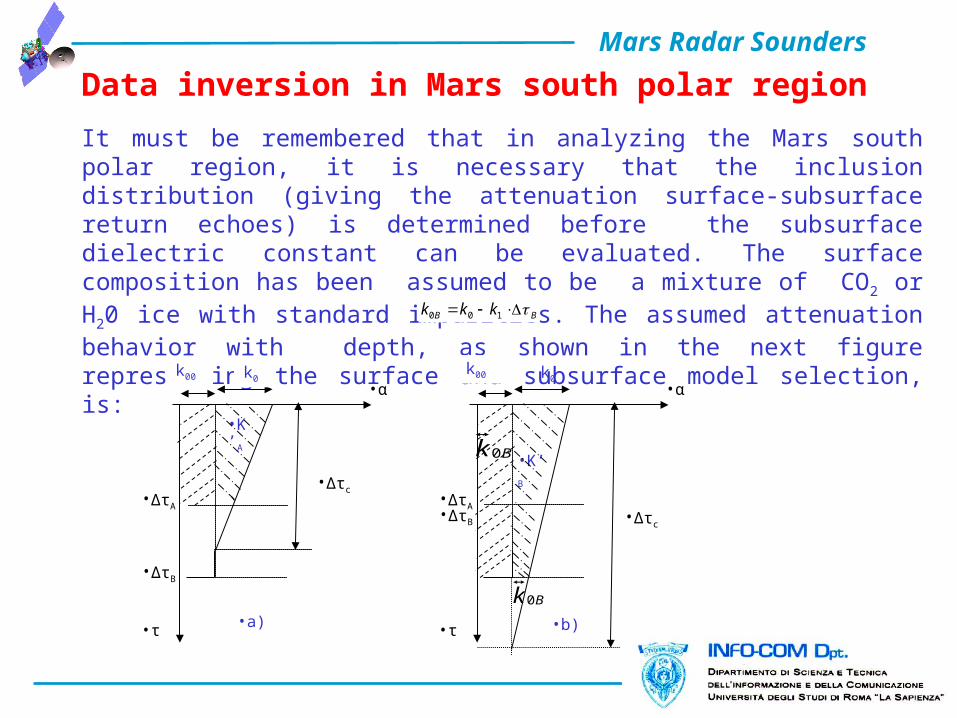
It must be remembered that in analyzing the Mars south polar region, it is necessary that the inclusion distribution (giving the attenuation surface-subsurface return echoes) is determined before the subsurface dielectric constant can be evaluated. The surface composition has been assumed to be a mixture of CO2 or H20 ice with standard impurities. The assumed attenuation behavior with depth, as shown in the next figure representing the surface and subsurface model selection, is:
•α
•τ
•α
•∆τB
•∆τA
•∆τc
k0
•K’A
k00
•τ
•∆τB
•∆τA•∆τc
k0
•K’B
k00
Bk 0
Bk 0
•a) •b)
BB kkk 100
Mars Radar Sounders
Data inversion in Mars south polar region
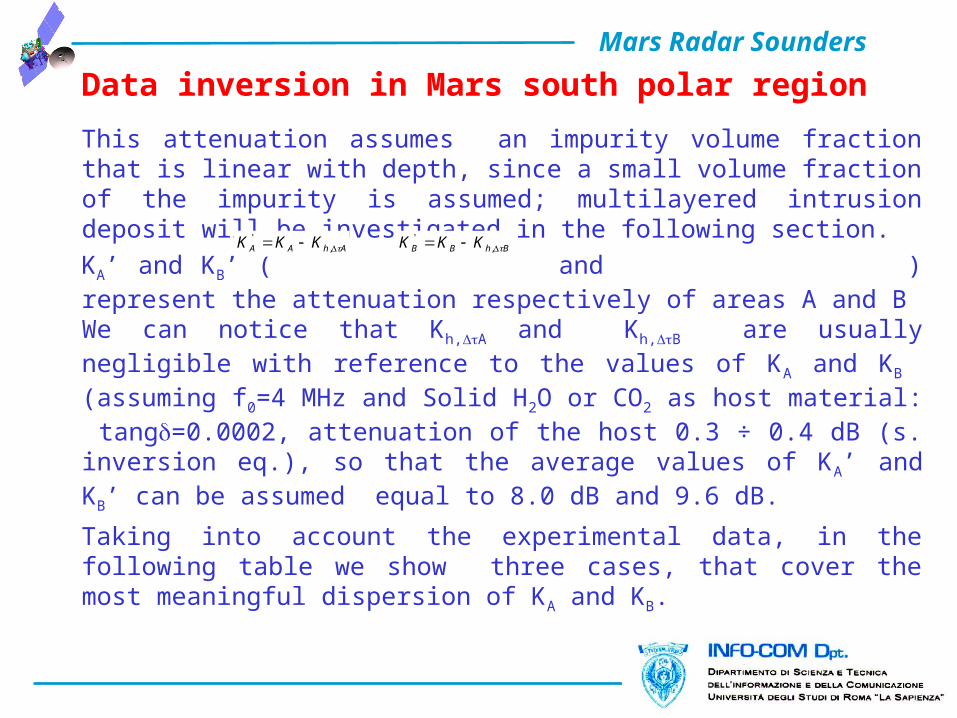
This attenuation assumes an impurity volume fraction that is linear with depth, since a small volume fraction of the impurity is assumed; multilayered intrusion deposit will be investigated in the following section.
KA’ and KB’ ( and ) represent the attenuation respectively of areas A and B We can notice that Kh,A and Kh,B are usually negligible with reference to the values of KA and KB (assuming f0=4 MHz and Solid H2O or CO2 as host material: tang=0.0002, attenuation of the host 0.3 ÷ 0.4 dB (s. inversion eq.), so that the average values of KA’ and KB’ can be assumed equal to 8.0 dB and 9.6 dB.
Taking into account the experimental data, in the following table we show three cases, that cover the most meaningful dispersion of KA and KB.
AhAA KKK ,'
BhBB KKK ,'
Mars Radar Sounders
Data inversion in Mars south polar region
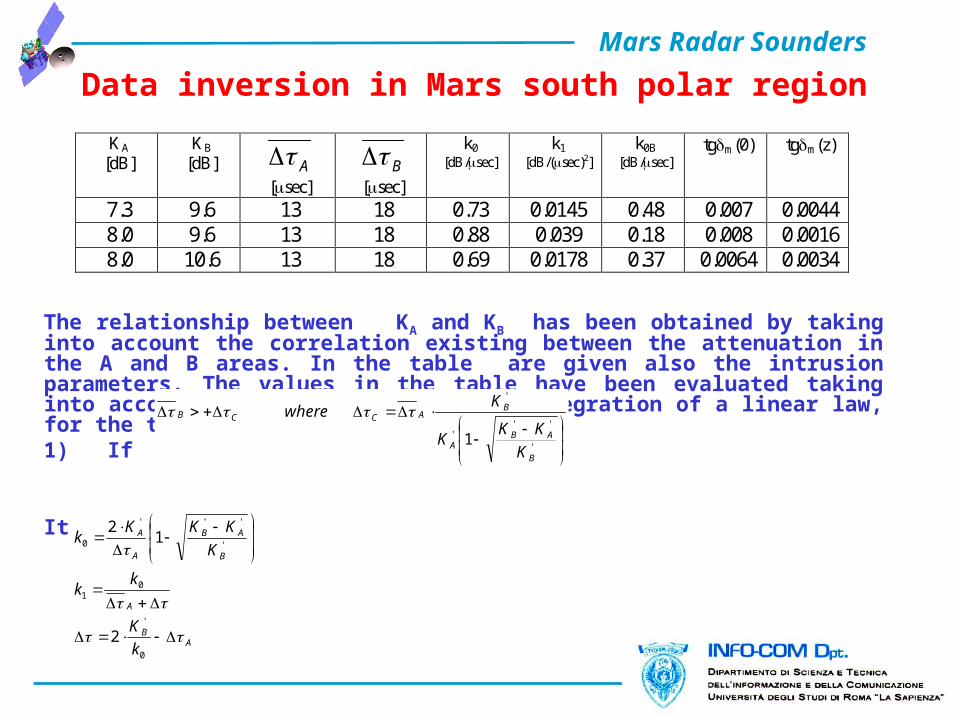
The relationship between KA and KB has been obtained by taking into account the correlation existing between the attenuation in the A and B areas. In the table are given also the intrusion parameters. The values in the table have been evaluated taking into account the inclusion model, by integration of a linear law, for the two cases of interest:1) If
It follows that:
KA
[dB] KB
[dB] A
[sec] B
[sec]
k0 [dB/sec]
k1 [dB/(sec)2]
k0B [dB/sec]
tgm(0) tgm(z)
7.3 9.6 13 18 0.73 0.0145 0.48 0.007 0.0044 8.0 9.6 13 18 0.88 0.039 0.18 0.008 0.0016 8.0 10.6 13 18 0.69 0.0178 0.37 0.0064 0.0034
'
'''
'
1B
ABA
BACCB
K
KKK
Kwhere
AB
A
B
AB
A
A
k
K
kk
K
KKKk
0
'
01
'
'''
0
2
12
Mars Radar Sounders
Data inversion in Mars south polar region
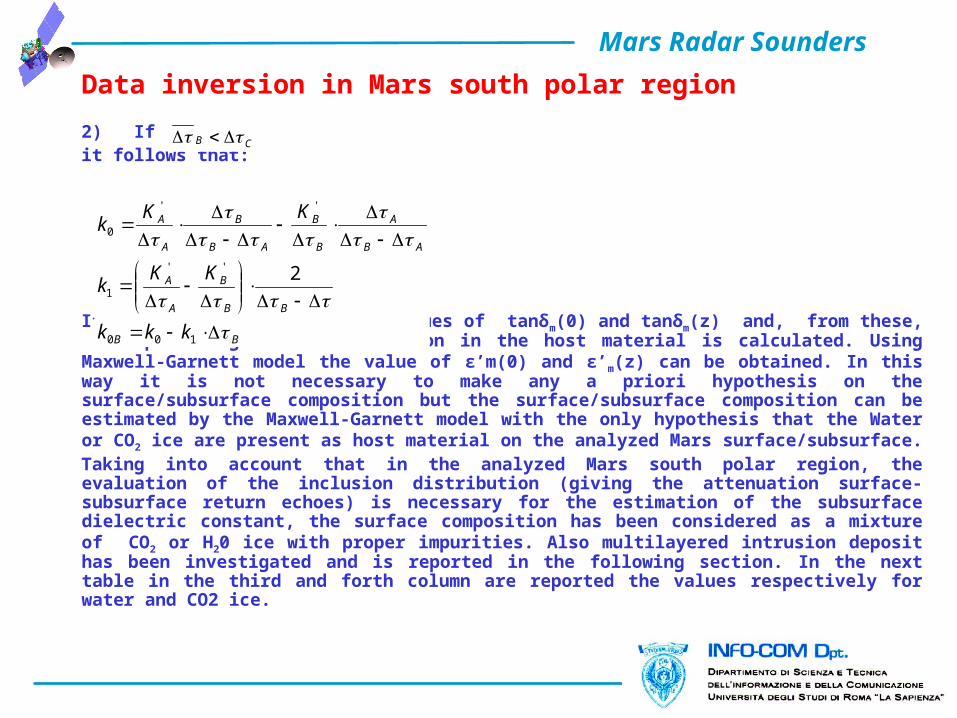
2) Ifit follows that:
It is possible to obtain the values of tanδm(0) and tanδm(z) and, from these, the percentage of the inclusion in the host material is calculated. Using Maxwell-Garnett model the value of ε’m(0) and ε’m(z) can be obtained. In this way it is not necessary to make any a priori hypothesis on the surface/subsurface composition but the surface/subsurface composition can be estimated by the Maxwell-Garnett model with the only hypothesis that the Water or CO 2 ice are present as host material on the analyzed Mars surface/subsurface. Taking into account that in the analyzed Mars south polar region, the evaluation of the inclusion distribution (giving the attenuation surface-subsurface return echoes) is necessary for the estimation of the subsurface dielectric constant, the surface composition has been considered as a mixture of CO2 or H20 ice with proper impurities. Also multilayered intrusion deposit has been investigated and is reported in the following section. In the next table in the third and forth column are reported the values respectively for water and CO2 ice.
CB
BB
BB
B
A
A
AB
A
B
B
AB
B
A
A
kkk
KKk
KKk
100
''
1
''
0
2
Mars Radar Sounders
Data inversion in Mars south polar region
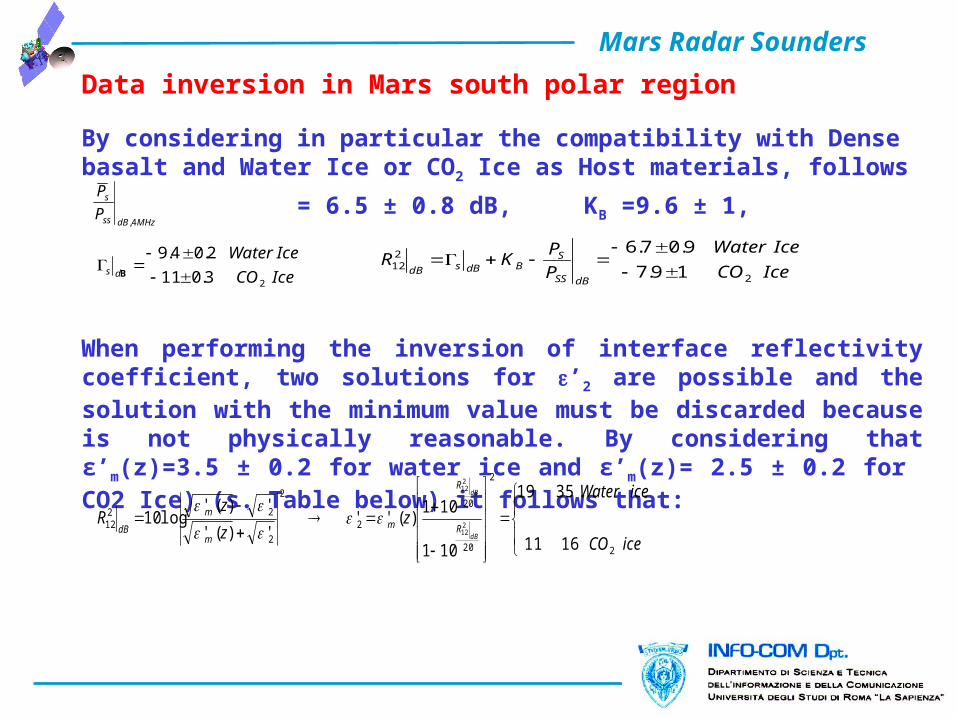
By considering in particular the compatibility with Dense basalt and Water Ice or CO2 Ice as Host materials, follows
= 6.5 ± 0.8 dB, KB =9.6 ± 1,
When performing the inversion of interface reflectivity coefficient, two solutions for ’2 are possible and the solution with the minimum value must be discarded because is not physically reasonable. By considering that ε’m(z)=3.5 ± 0.2 for water ice and ε’m(z)= 2.5 ± 0.2 for CO2 Ice) (s. Table below) it follows that:
MHzdBss
s
P
P
4,
IceCO
IceWaterds
23.011
2.04.9
B IceCO
IceWater
P
PKR
dBSS
SBdBsdB
2
212 19.7
9.07.6
iceCO
iceWater
zz
zR
dB
dB
R
R
m
m
m
dB
2
2
20
20
2
2
2
2212
1611
3519
101
101)(''
')('
')('log10
212
212
Mars Radar Sounders
Data inversion in Mars south polar region
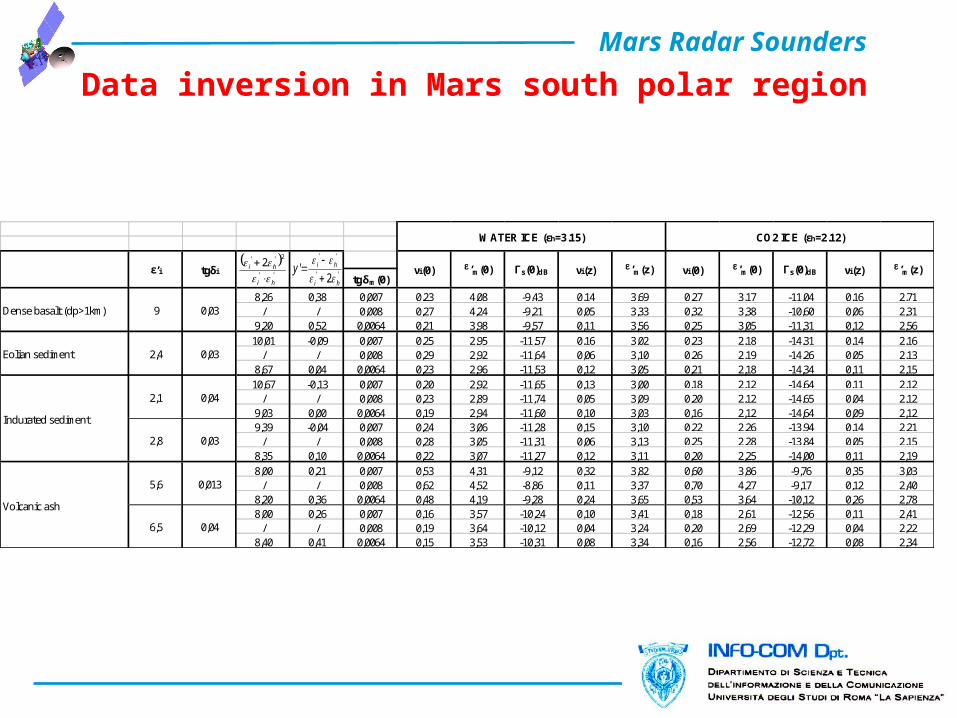
tgδm(0)
8,26 0,38 0,007 0,23 4,08 -9,43 0,14 3,69 0,27 3,17 -11,04 0,16 2,71/ / 0,008 0,27 4,24 -9,21 0,05 3,33 0,32 3,38 -10,60 0,06 2,31
9,20 0,52 0,0064 0,21 3,98 -9,57 0,11 3,56 0,25 3,05 -11,31 0,12 2,56
10,01 -0,09 0,007 0,25 2,95 -11,57 0,16 3,02 0,23 2,18 -14,31 0,14 2,16/ / 0,008 0,29 2,92 -11,64 0,06 3,10 0,26 2,19 -14,26 0,05 2,13
8,67 0,04 0,0064 0,23 2,96 -11,53 0,12 3,05 0,21 2,18 -14,34 0,11 2,15
10,67 -0,13 0,007 0,20 2,92 -11,65 0,13 3,00 0,18 2,12 -14,64 0,11 2,12/ / 0,008 0,23 2,89 -11,74 0,05 3,09 0,20 2,12 -14,65 0,04 2,12
9,03 0,00 0,0064 0,19 2,94 -11,60 0,10 3,03 0,16 2,12 -14,64 0,09 2,129,39 -0,04 0,007 0,24 3,06 -11,28 0,15 3,10 0,22 2,26 -13,94 0,14 2,21
/ / 0,008 0,28 3,05 -11,31 0,06 3,13 0,25 2,28 -13,84 0,05 2,158,35 0,10 0,0064 0,22 3,07 -11,27 0,12 3,11 0,20 2,25 -14,00 0,11 2,19
8,00 0,21 0,007 0,53 4,31 -9,12 0,32 3,82 0,60 3,86 -9,76 0,35 3,03/ / 0,008 0,62 4,52 -8,86 0,11 3,37 0,70 4,27 -9,17 0,12 2,40
8,20 0,36 0,0064 0,48 4,19 -9,28 0,24 3,65 0,53 3,64 -10,12 0,26 2,788,00 0,26 0,007 0,16 3,57 -10,24 0,10 3,41 0,18 2,61 -12,56 0,11 2,41
/ / 0,008 0,19 3,64 -10,12 0,04 3,24 0,20 2,69 -12,29 0,04 2,228,40 0,41 0,0064 0,15 3,53 -10,31 0,08 3,34 0,16 2,56 -12,72 0,08 2,34
νi(z) ’m(z)
WATER ICE (εh=3.15)
’m(0) Γs(0)dBνi(0)
6,5 0,04
2,4
Indurated sediment
2,1 0,04
ε’i tgδi
Dense basalt (dp>1km) 9 0,03
Volcanic ash
Eolian sediment 0,03
2,8 0,03
5,6 0,013
CO2 ICE (εh=2.12)
νi(0) ’m(0) Γs(0)dB νi(z) ’m(z) ''
2'' 2
hi
hi
''
''
2'
hi
hiy
Mars Radar Sounders
Data inversion in Mars south polar region
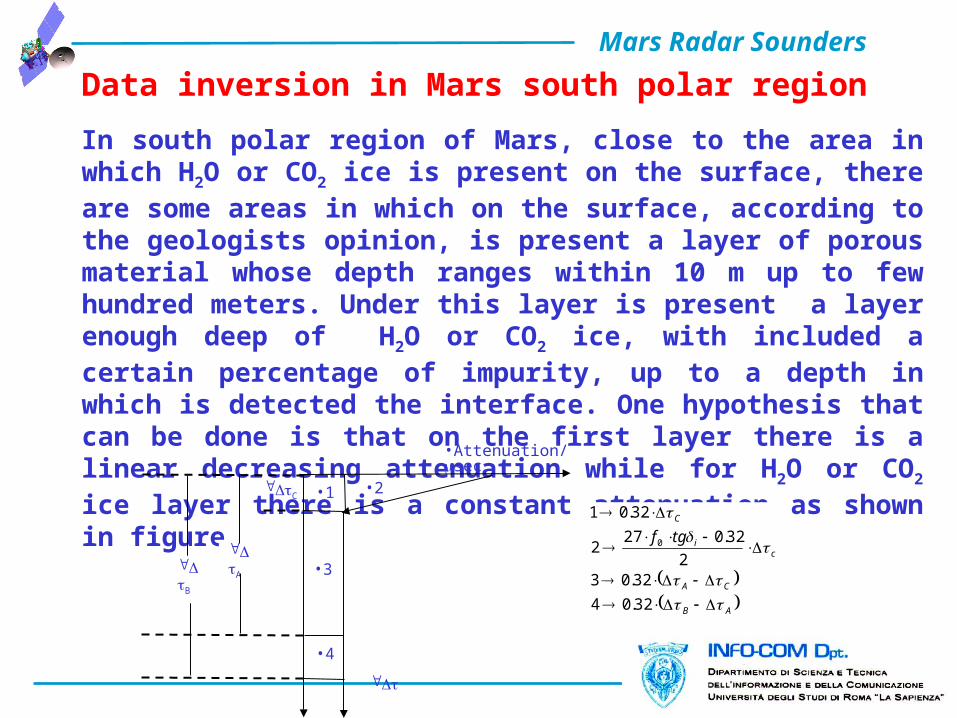
In south polar region of Mars, close to the area in which H2O or CO2 ice is present on the surface, there are some areas in which on the surface, according to the geologists opinion, is present a layer of porous material whose depth ranges within 10 m up to few hundred meters. Under this layer is present a layer enough deep of H2O or CO2 ice, with included a certain percentage of impurity, up to a depth in which is detected the interface. One hypothesis that can be done is that on the first layer there is a linear decreasing attenuation while for H2O or CO2 ice layer there is a constant attenuation as shown in figure.
C
A
B
•1 •2
•3
•4
•Attenuation/sec
AB
CA
ci
C
tgf
32.04
32.032
32.0272
32.01
0
Mars Radar Sounders
Data inversion in Mars south polar region
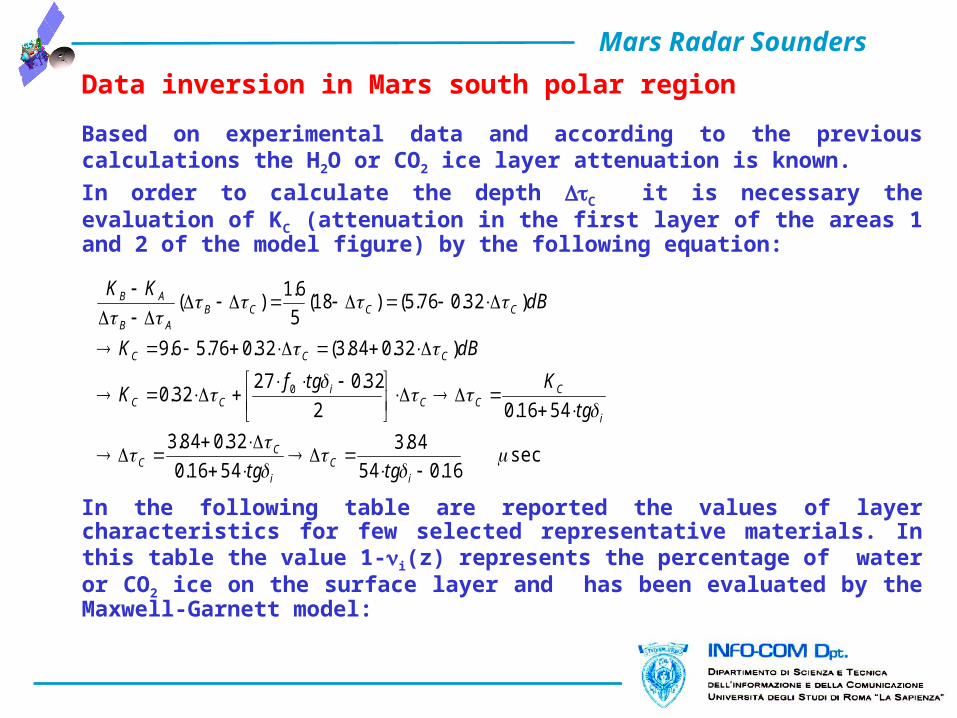
Based on experimental data and according to the previous calculations the H2O or CO2 ice layer attenuation is known.
In order to calculate the depth C it is necessary the evaluation of KC (attenuation in the first layer of the areas 1 and 2 of the model figure) by the following equation:
In the following table are reported the values of layer characteristics for few selected representative materials. In this table the value 1-i(z) represents the percentage of water or CO2 ice on the surface layer and has been evaluated by the Maxwell-Garnett model:
sec16.054
84.3
5416.0
32.084.3
5416.02
32.02732.0
)32.084.3(32.076.56.9
)32.076.5()18(5
6.1)(
0
iC
i
CC
i
CCC
iCC
CCC
CCCBAB
AB
tgtg
tg
KtgfK
dBK
dBKK
Mars Radar Sounders
Data inversion in Mars south polar region
003.027
32.0
2)2(9
0
''
''
2''
'''
fztg
ztgtg
ztgz
m
mhi
hi
hi
hii
mi
)5.1()(
1
RiRc
i z
2
1)5.1()0(
Ri
i
Remembering that:
Mars Radar Sounders
Data inversion in Mars south polar region
dBBdBs
dBSS
S RKP
P 212
MHzdBss
s
P
P
4,
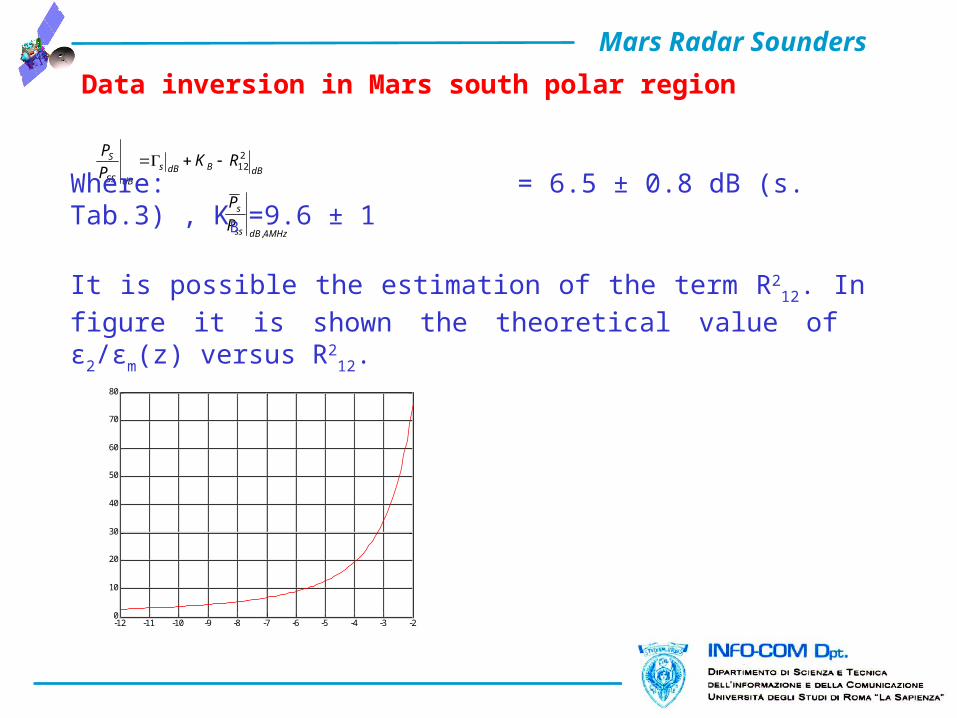
Where: = 6.5 ± 0.8 dB (s. Tab.3) , KB =9.6 ± 1
It is possible the estimation of the term R212. In figure it is shown the
theoretical value of ε2/εm(z) versus R212.
-12 -11 -10 -9 -8 -7 -6 -5 -4 -3 -20
10
20
30
40
50
60
70
80
Normalized diagram (m(z))
R122 (dB)
2/m
(z)
Mars Radar Sounders
Data inversion in Mars south polar region: Conclusions
The data inversion (estimation of the materials composing the surface and the subsurface by the identification of the dielectric constants) is based on the analysis of the data available from the sounder observations, that is the surface to subsurface power ratio and the relative time delay. The data, available at different frequencies, permits the identification of the dielectric constant of the surface and subsurface with a proper accuracy. The tolerances on the estimated vales of the parameters, necessary for the data inversion, have been evaluated. The results of the analysis are, therefore, provided in terms of compatibility with the material models considered as end to end members of possible scenarios defined by the geologists. A simulator, performed with a facet model, starting from MOLA data, permitted the clutter false alarms identification as well as the validation of the maps drawn by means of the statistical surface parameters preliminarily defined. The measurements performed on the South pole of Mars detected interfaces with a range of values of permittivity that suggest the compatibilities with a presence of water mixed with basalt. In addition on few orbits whose ground track are passing on flat areas has been verified the radar capability to identify the surface dielectric constant variation.
Mars Radar Sounders
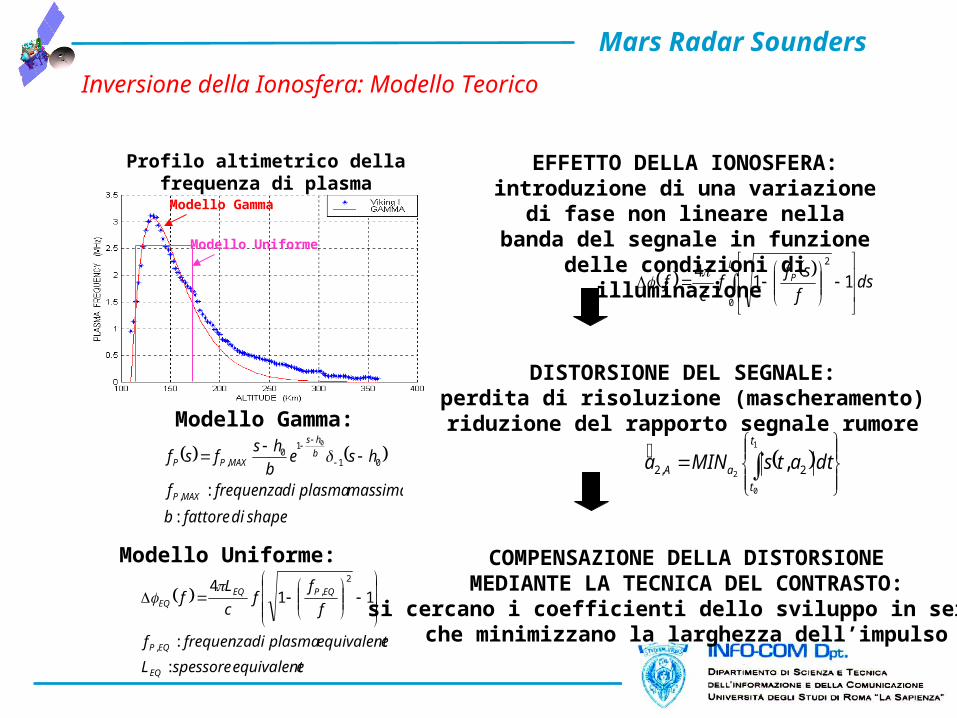
Profilo altimetrico della frequenza di plasma
Modello Gamma
Modello Uniforme
Inversione della Ionosfera: Modello Teorico
ds
f
sff
cf
LP
0
2
114
EFFETTO DELLA IONOSFERA:introduzione di una variazione di fase non lineare nella banda del segnale in funzione
delle condizioni di illuminazione
DISTORSIONE DEL SEGNALE:perdita di risoluzione (mascheramento)riduzione del rapporto segnale rumore
eequivalentspessoreL
eequivalentplasmadifrequenzaf
f
ff
c
Lf
EQ
EQP
EQPEQEQ
:
:
114
,
2
,
shapedifattoreb
massimaplasmadifrequenzaf
hseb
hsfsf
MAXP
b
hs
MAXPP
:
:,
01
10
,
0
Modello Gamma:
Modello Uniforme:
1
0
2 2,2 ,t
t
aA dtatsMINa
COMPENSAZIONE DELLA DISTORSIONEMEDIANTE LA TECNICA DEL CONTRASTO:
si cercano i coefficienti dello sviluppo in serie che minimizzano la larghezza dell’impulso
Mars Radar Sounders
Inversione della Ionosfera: Applicazione (1 di 3)
a2 (3MHz)
0
2E-11
4E-11
6E-11
8E-11
1E-10
1,2E-10
1,4E-10
1,6E-10
1,8E-10
-24 -22 -20 -18 -16 -14 -12 -10 -8 -6 -4
SUN deg
rad/H
z2 _ orb 1890
orb 1892
orb 1893
orb 1907
Fit
a2 (4 MHz)
0,00E+00
1,00E-11
2,00E-11
3,00E-11
4,00E-11
5,00E-11
6,00E-11
-24 -22 -20 -18 -16 -14 -12 -10 -8 -6 -4
SUN deg
rad/H
z2 _ orb 1901
orb 1903
orb 1904
orb 1896
Fit
coefficiente quadratico (4MHz)
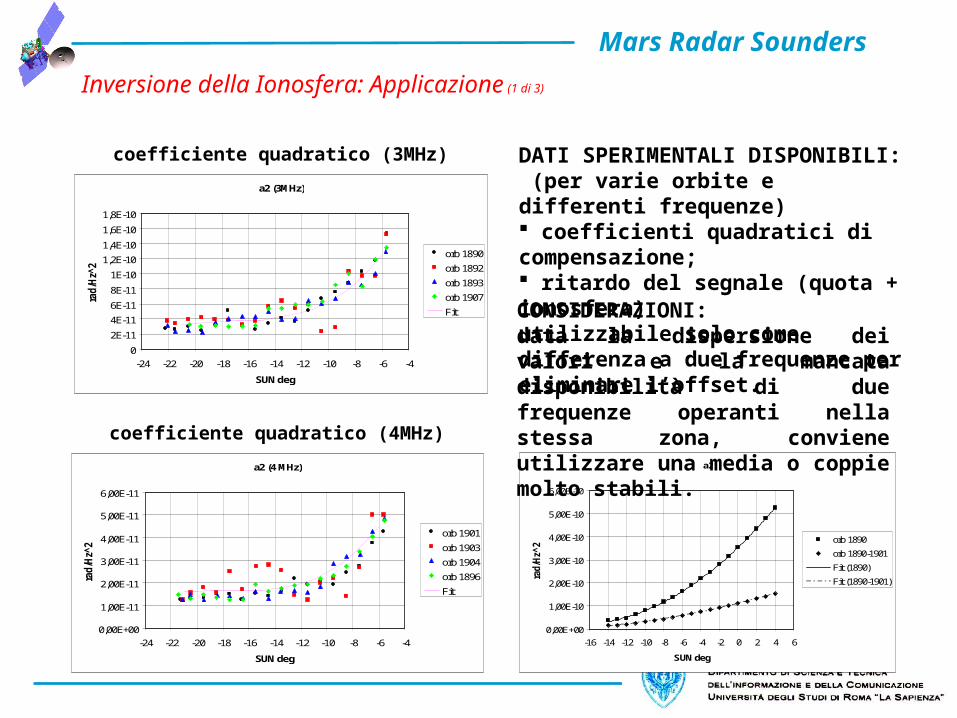
coefficiente quadratico (3MHz) DATI SPERIMENTALI DISPONIBILI: (per varie orbite e differenti frequenze) coefficienti quadratici di compensazione; ritardo del segnale (quota + ionosfera) utilizzabile solo come differenza a due frequenze per eliminare l’offset.
a2
0,00E+00
1,00E-10
2,00E-10
3,00E-10
4,00E-10
5,00E-10
6,00E-10
-16 -14 -12 -10 -8 -6 -4 -2 0 2 4 6
SUN deg
rad/H
z^2
_ orb 1890
orb 1890-1901
Fit (1890)
Fit (1890-1901)
CONSIDERAZIONI:data la dispersione dei valori e la mancata disponibilità di due frequenze operanti nella stessa zona, conviene utilizzare una media o coppie molto stabili.
Mars Radar Sounders
b
)(
)(
)(
)(
)4(
)3(
02322
04
2
02322
03
2
2
2
parametro
dalteindipenden
dssff
sf
dssff
sf
MHza
MHzah
h pMHz
p
h
h pMHz
p
2.5 3.5 4 4.5a23a240.5
1
1.5
2
2.5
3fpmax MHz
Inversione della Ionosfera: Applicazione (2 di 3)
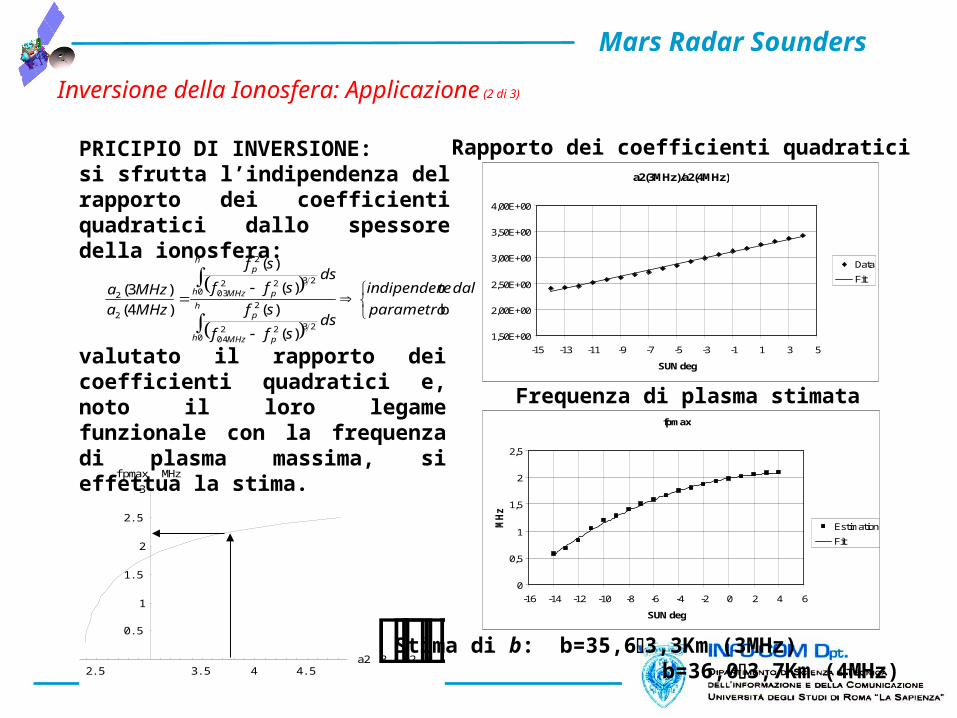
PRICIPIO DI INVERSIONE:si sfrutta l’indipendenza del rapporto dei coefficienti quadratici dallo spessore della ionosfera:
valutato il rapporto dei coefficienti quadratici e, noto il loro legame funzionale con la frequenza di plasma massima, si effettua la stima.
a2(3MHz)/a2(4MHz)
1,50E+00
2,00E+00
2,50E+00
3,00E+00
3,50E+00
4,00E+00
-15 -13 -11 -9 -7 -5 -3 -1 1 3 5
SUN deg
Data
Fit
Rapporto dei coefficienti quadratici
fpmax
0
0,5
1
1,5
2
2,5
-16 -14 -12 -10 -8 -6 -4 -2 0 2 4 6
SUN deg
MH
z .
Estimation
Fit
Frequenza di plasma stimata
Stima di b: b=35,63,3Km (3MHz) b=36,03,7Km (4MHz)
Mars Radar Sounders
Inversione della Ionosfera: Applicazione (3 di 3)
fpmax Estimation
0
0,5
1
1,5
2
2,5
-16 -14 -12 -10 -8 -6 -4 -2 0 2 4 6
SUN deg
MH
z .
Uniform Model
Gamma Model
delay Estimation Gamma Model
0
50
100
150
200
250
300
350
-16 -14 -12 -10 -8 -6 -4 -2 0 2 4
SUN deg
micr
osec
.
1.8 MHz 3 MHz4 MHz
Fpmax
0
1
2
3
4
5
20 40 60 80 100
SZA
MHz
.
fpmax
fpmodel
● AIS Model● Gamma Model
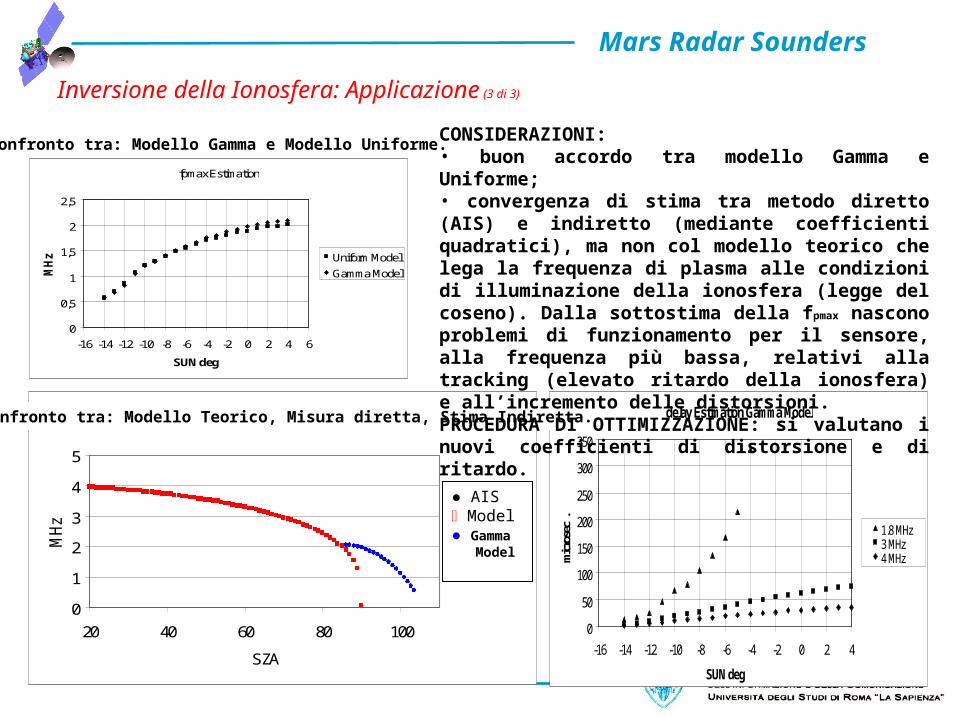
Confronto tra: Modello Teorico, Misura diretta, Stima Indiretta.
Confronto tra: Modello Gamma e Modello Uniforme.CONSIDERAZIONI:• buon accordo tra modello Gamma e Uniforme;• convergenza di stima tra metodo diretto (AIS) e indiretto (mediante coefficienti quadratici), ma non col modello teorico che lega la frequenza di plasma alle condizioni di illuminazione della ionosfera (legge del coseno). Dalla sottostima della fpmax nascono problemi di funzionamento per il sensore, alla frequenza più bassa, relativi alla tracking (elevato ritardo della ionosfera) e all’incremento delle distorsioni.PROCEDURA DI OTTIMIZZAZIONE: si valutano i nuovi coefficienti di distorsione e di ritardo.