married only at the weekends? a study of the amount of ...s3.amazonaws.com/.../ · a study of the...
TRANSCRIPT
1
Married only at the weekends? A study of the amount of time spent together by spouses. Reg Gatenby, Office for National Statistics Abstract Studies of time use generally concentrate on the amount of time spent by each member of a household on various activities (sleep, paid work, housework, childcare, leisure and so on), and typically comparisons are made between men and women While this is interesting and valuable, time use data can be used more flexibly than that. The aim of this paper is to study the time that spouse's daily spend together on shared activities. We look at the total amount of time spouses spend together and how this is allocated among different types of activity. We look at the split between weekdays and weekend, and investigate how shared time is influenced by household characteristics, including employment status, social class and household composition. On average couples spend about 2 ½ hours a day together. There is wide variation in this figure. The time spent together on weekdays is much lower than at weekends (2hrs compared to 3 ½ hrs). The presence of children decreases the amount of time couples spend together, falling from about 2 ½ hrs on a weekday for couples without children, to about 1 ¼ hours on a weekday for couples with children. Unsurprisingly, retired couples spend longer together, while those in full-time work spend less time together. And interestingly, cohabiting couples spend about half an hour less per day together than married couples. The most common shared activity for most groups is TV watching, accounting for about a third of all shared time together (about an hour per day), followed by eating together (about half an hour per day).
2
Introduction The aim of this paper is to study the time that spouse's daily spend together on shared activities, that is, the amount of time couples spend together carrying out the same activities. Note that this does not include, for instance, the time couples spend together in the same house doing different activities. As well as being an interesting topic in itself, this has a current relevance to the examination of work-life balance. The well-being of a relationship can be related to the amount and type of interaction between the partners. Sections 1 and 2 first set the context. Section 1 looks at travel patterns for all adults, then Section 2 looks at the travel patterns just for those adults who live as couples (we include married and co-habiting couples). Section 3 then looks at the shared time of couples. It looks at the total amount of time couples spend together and how this is allocated among different types of activity. It describes the split between weekdays and weekend, and investigates how shared time is influenced by household characteristics, including employment status, educational qualifications, social class and household composition. Methodology The data source was the UK 2000 Time Use Survey. This was conducted on behalf of a funding consortium consisting of the ESRC and a number of government departments.
The UK 2000 Time Use Survey was the first time that a major survey of this type had been conducted in the UK. The main aim of the Survey was to measure the amount of time spent by the UK population on various activities. The Survey was designed to achieve a representative sample of the population in the UK. The data collected included 6,500 household interviews, 11,700 interviews with individuals within those households, and 21,000 diaries recording people's use of time in 10 minute time slots across a whole day. Each person in a selected household aged 8 or over was asked to complete two time use diaries, one for a specified weekday, and another for a specified weekend day. For each 10 minute time slot the respondent described the main activity they carried out, any secondary activity, where the activity was carried out, and who it was carried out with.
The Time Use Survey was designed, where possible, to provide results comparable with other European studies as part of a wider Harmonised European Time Use Survey (HETUS). Appendix 1 contains further details of the Time Use Survey.
3
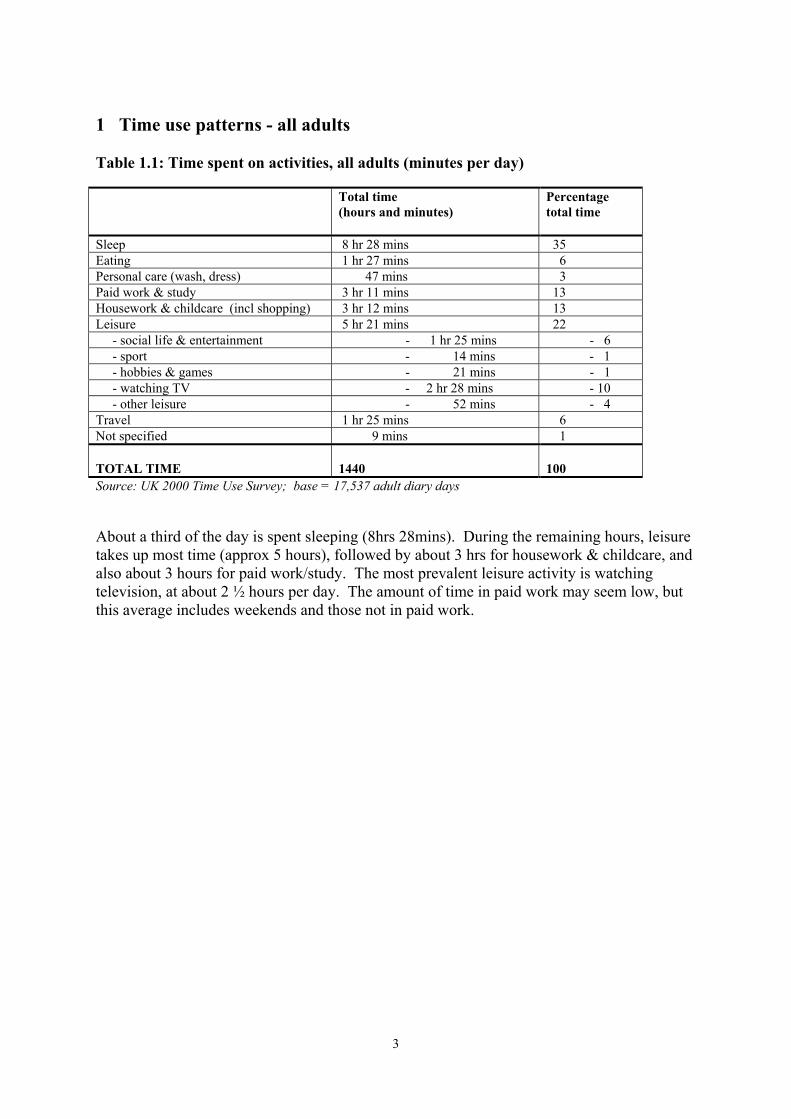
1 Time use patterns - all adults Table 1.1: Time spent on activities, all adults (minutes per day) Total time
(hours and minutes) Percentage total time
Sleep 8 hr 28 mins 35 Eating 1 hr 27 mins 6 Personal care (wash, dress) 47 mins 3 Paid work & study 3 hr 11 mins 13 Housework & childcare (incl shopping) 3 hr 12 mins 13 Leisure 5 hr 21 mins 22 - social life & entertainment - 1 hr 25 mins - 6 - sport - 14 mins - 1 - hobbies & games - 21 mins - 1 - watching TV - 2 hr 28 mins - 10 - other leisure - 52 mins - 4 Travel 1 hr 25 mins 6 Not specified 9 mins 1 TOTAL TIME
1440
100
Source: UK 2000 Time Use Survey; base = 17,537 adult diary days About a third of the day is spent sleeping (8hrs 28mins). During the remaining hours, leisure takes up most time (approx 5 hours), followed by about 3 hrs for housework & childcare, and also about 3 hours for paid work/study. The most prevalent leisure activity is watching television, at about 2 ½ hours per day. The amount of time in paid work may seem low, but this average includes weekends and those not in paid work.
4
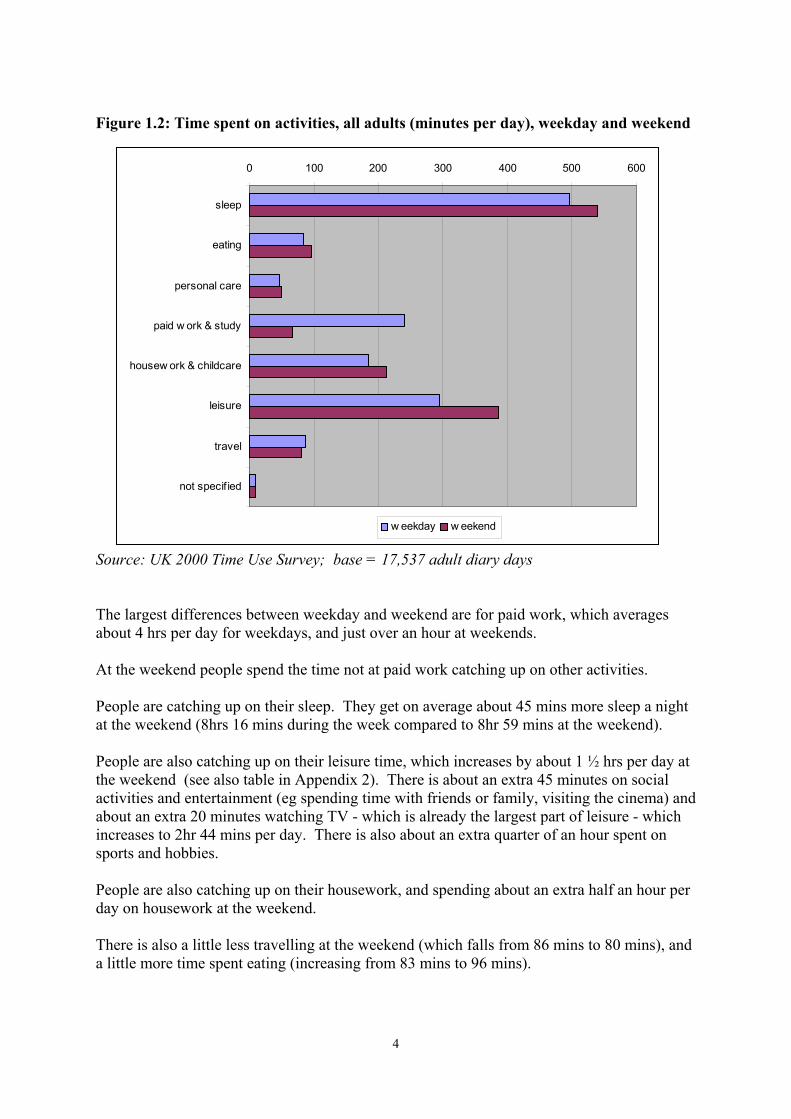
Figure 1.2: Time spent on activities, all adults (minutes per day), weekday and weekend
Source: UK 2000 Time Use Survey; base = 17,537 adult diary days The largest differences between weekday and weekend are for paid work, which averages about 4 hrs per day for weekdays, and just over an hour at weekends. At the weekend people spend the time not at paid work catching up on other activities. People are catching up on their sleep. They get on average about 45 mins more sleep a night at the weekend (8hrs 16 mins during the week compared to 8hr 59 mins at the weekend). People are also catching up on their leisure time, which increases by about 1 ½ hrs per day at the weekend (see also table in Appendix 2). There is about an extra 45 minutes on social activities and entertainment (eg spending time with friends or family, visiting the cinema) and about an extra 20 minutes watching TV - which is already the largest part of leisure - which increases to 2hr 44 mins per day. There is also about an extra quarter of an hour spent on sports and hobbies. People are also catching up on their housework, and spending about an extra half an hour per day on housework at the weekend. There is also a little less travelling at the weekend (which falls from 86 mins to 80 mins), and a little more time spent eating (increasing from 83 mins to 96 mins).
0 100 200 300 400 500 600
sleep
eating
personal care
paid w ork & study
housew ork & childcare
leisure
travel
not specif ied
w eekday w eekend
5
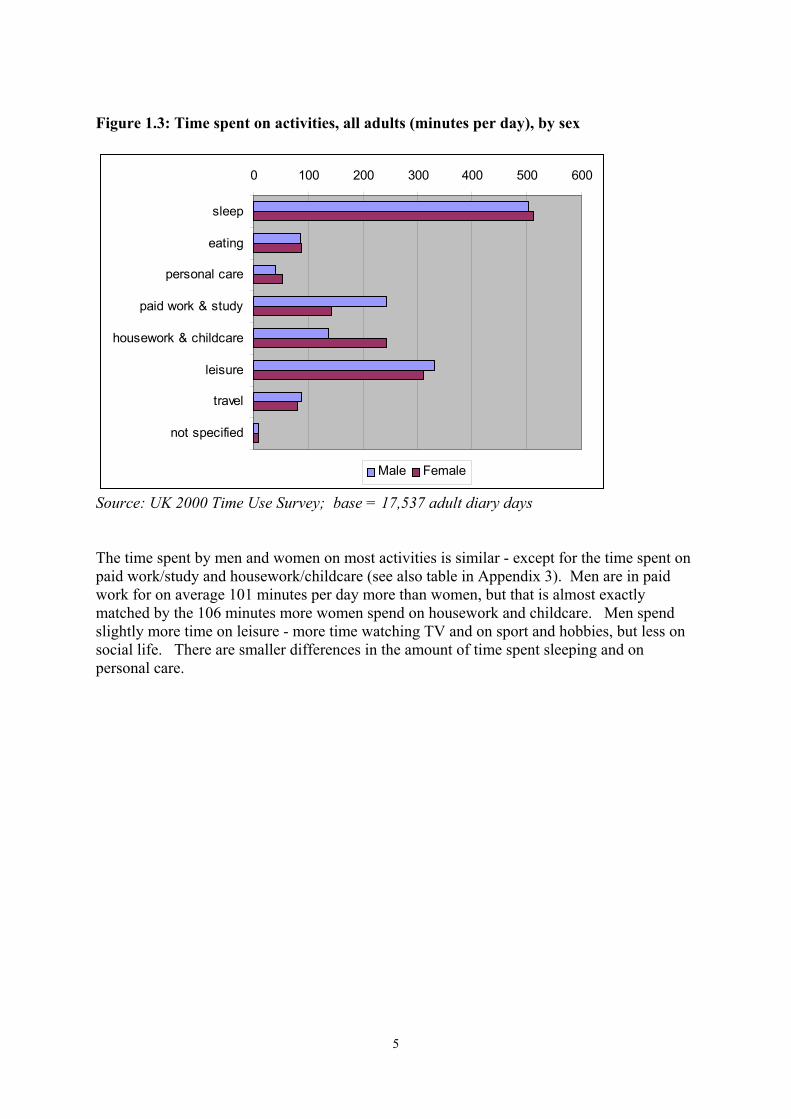
Figure 1.3: Time spent on activities, all adults (minutes per day), by sex
Source: UK 2000 Time Use Survey; base = 17,537 adult diary days The time spent by men and women on most activities is similar - except for the time spent on paid work/study and housework/childcare (see also table in Appendix 3). Men are in paid work for on average 101 minutes per day more than women, but that is almost exactly matched by the 106 minutes more women spend on housework and childcare. Men spend slightly more time on leisure - more time watching TV and on sport and hobbies, but less on social life. There are smaller differences in the amount of time spent sleeping and on personal care.
0 100 200 300 400 500 600
sleep
eating
personal care
paid work & study
housework & childcare
leisure
travel
not specified
Male Female
6
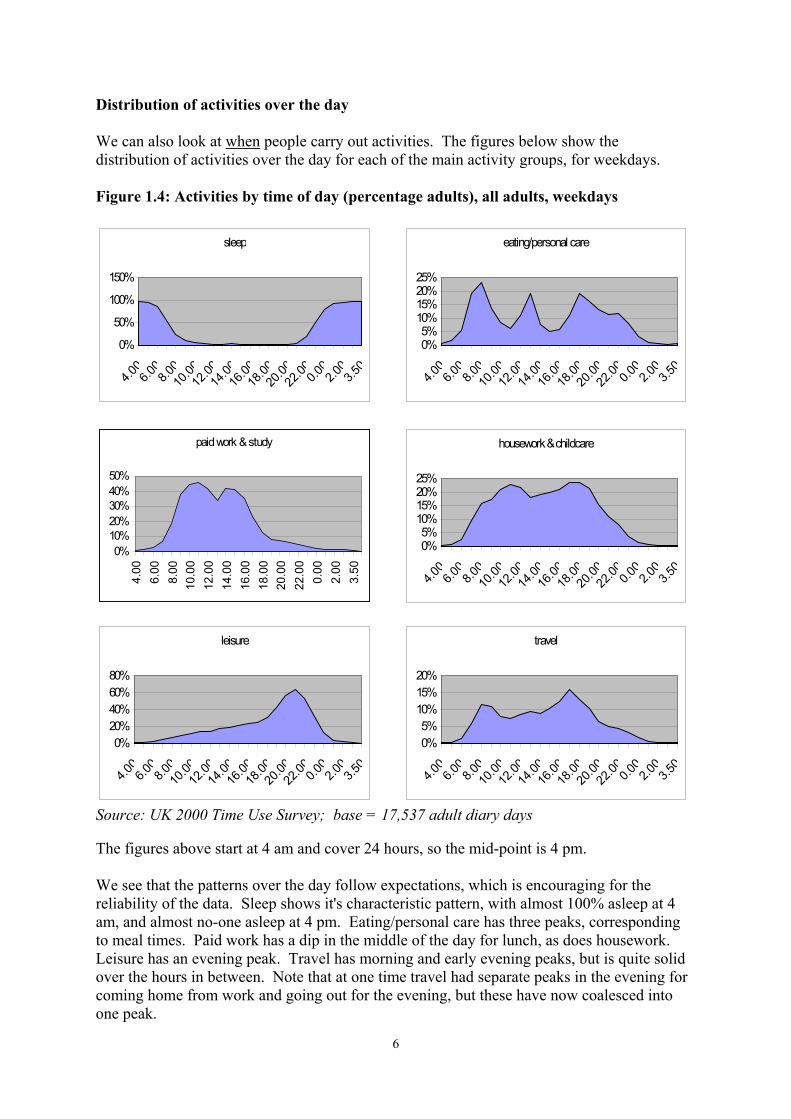
Distribution of activities over the day We can also look at when people carry out activities. The figures below show the distribution of activities over the day for each of the main activity groups, for weekdays. Figure 1.4: Activities by time of day (percentage adults), all adults, weekdays
Source: UK 2000 Time Use Survey; base = 17,537 adult diary days The figures above start at 4 am and cover 24 hours, so the mid-point is 4 pm. We see that the patterns over the day follow expectations, which is encouraging for the reliability of the data. Sleep shows it's characteristic pattern, with almost 100% asleep at 4 am, and almost no-one asleep at 4 pm. Eating/personal care has three peaks, corresponding to meal times. Paid work has a dip in the middle of the day for lunch, as does housework. Leisure has an evening peak. Travel has morning and early evening peaks, but is quite solid over the hours in between. Note that at one time travel had separate peaks in the evening for coming home from work and going out for the evening, but these have now coalesced into one peak.
eating/personal care
0%5%
10%15%20%25%
4.00
6.00
8.0010
.0012
.0014
.0016
.0018
.0020
.0022
.00 0.00
2.00
3.50
housework & childcare
0%5%
10%15%20%25%
4.00
6.00
8.0010
.0012
.0014
.0016
.0018
.0020
.0022
.00 0.00
2.00
3.50
leisure
0%20%40%60%80%
4.00
6.00
8.0010
.0012
.0014
.0016
.0018
.0020
.0022
.000.00
2.00
3.50
travel
0%5%
10%15%20%
4.00
6.00
8.0010
.0012
.0014
.0016
.0018
.0020
.0022
.00 0.00
2.00
3.50
sleep
0%
50%
100%
150%
4.006.0
08.0
010
.0012
.0014
.0016
.0018
.0020
.0022
.000.002.0
03.5
0
paid work & study
0%10%20%30%40%50%
4.00
6.00
8.00
10.0
012
.00
14.0
016
.00
18.0
020
.00
22.0
00.
002.
003.
50
7
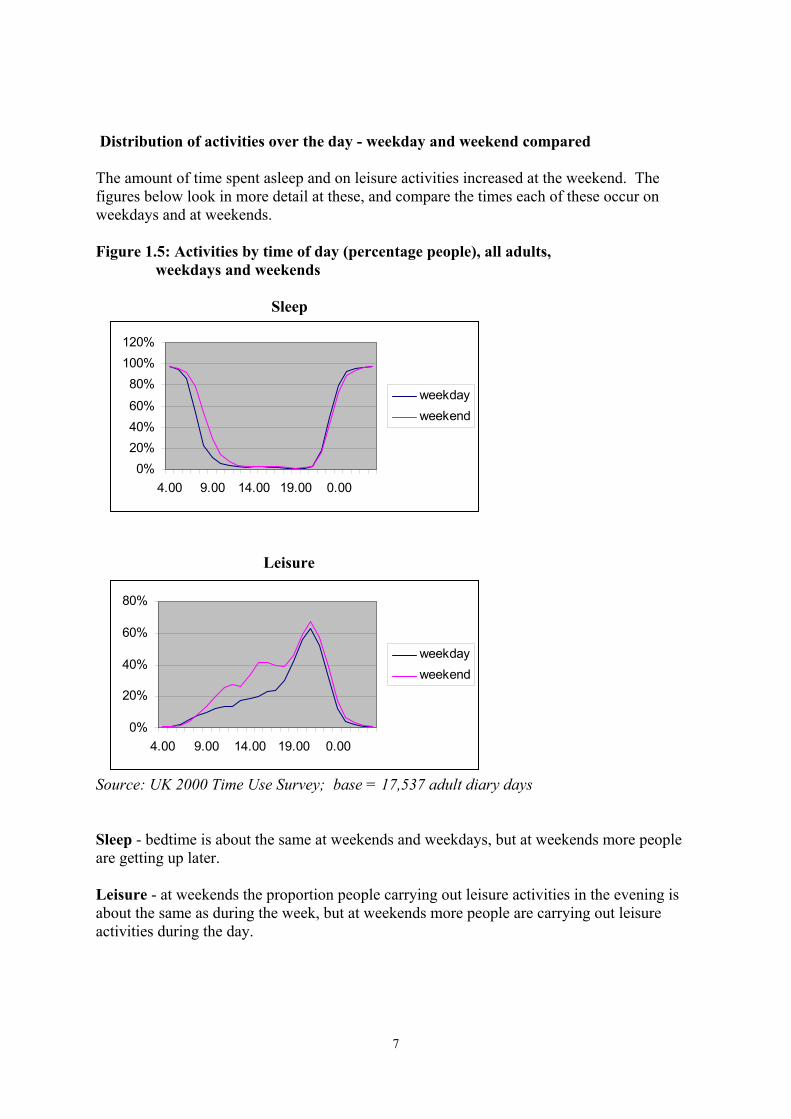
Distribution of activities over the day - weekday and weekend compared The amount of time spent asleep and on leisure activities increased at the weekend. The figures below look in more detail at these, and compare the times each of these occur on weekdays and at weekends. Figure 1.5: Activities by time of day (percentage people), all adults, weekdays and weekends Sleep
Leisure
Source: UK 2000 Time Use Survey; base = 17,537 adult diary days Sleep - bedtime is about the same at weekends and weekdays, but at weekends more people are getting up later. Leisure - at weekends the proportion people carrying out leisure activities in the evening is about the same as during the week, but at weekends more people are carrying out leisure activities during the day.
0%20%40%60%
80%100%120%
4.00 9.00 14.00 19.00 0.00
weekdayweekend
0%
20%
40%
60%
80%
4.00 9.00 14.00 19.00 0.00
weekdayweekend
8
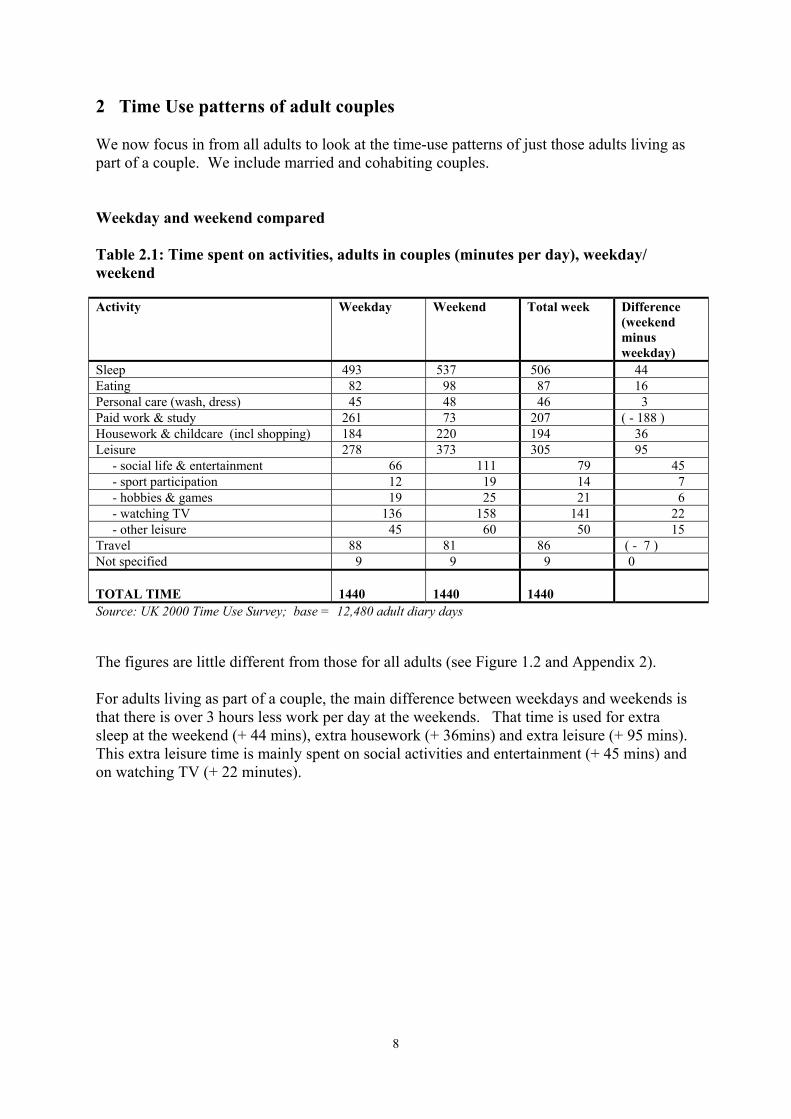
2 Time Use patterns of adult couples We now focus in from all adults to look at the time-use patterns of just those adults living as part of a couple. We include married and cohabiting couples. Weekday and weekend compared Table 2.1: Time spent on activities, adults in couples (minutes per day), weekday/ weekend Activity
Weekday Weekend Total week Difference (weekend minus weekday)
Sleep 493 537 506 44 Eating 82 98 87 16 Personal care (wash, dress) 45 48 46 3 Paid work & study 261 73 207 ( - 188 ) Housework & childcare (incl shopping) 184 220 194 36 Leisure 278 373 305 95 - social life & entertainment 66 111 79 45 - sport participation 12 19 14 7 - hobbies & games 19 25 21 6 - watching TV 136 158 141 22 - other leisure 45 60 50 15 Travel 88 81 86 ( - 7 ) Not specified 9 9 9 0 TOTAL TIME
1440
1440
1440
Source: UK 2000 Time Use Survey; base = 12,480 adult diary days The figures are little different from those for all adults (see Figure 1.2 and Appendix 2). For adults living as part of a couple, the main difference between weekdays and weekends is that there is over 3 hours less work per day at the weekends. That time is used for extra sleep at the weekend (+ 44 mins), extra housework (+ 36mins) and extra leisure (+ 95 mins). This extra leisure time is mainly spent on social activities and entertainment (+ 45 mins) and on watching TV (+ 22 minutes).
9
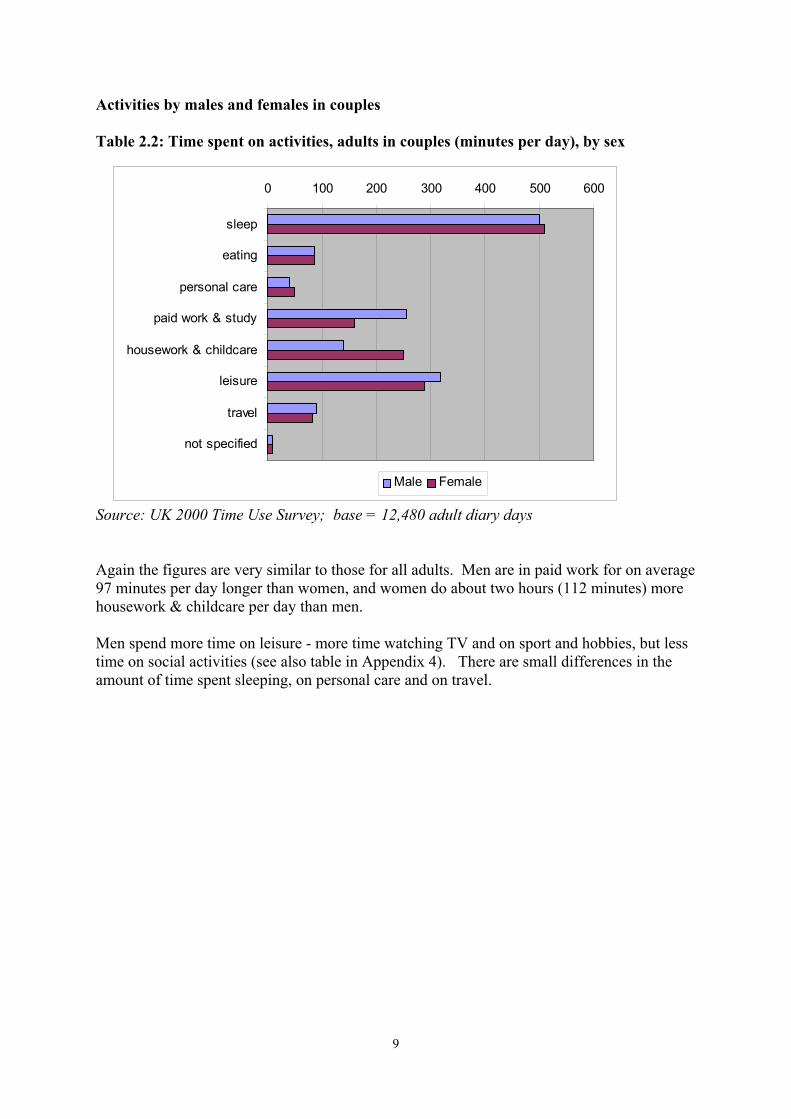
Activities by males and females in couples Table 2.2: Time spent on activities, adults in couples (minutes per day), by sex
Source: UK 2000 Time Use Survey; base = 12,480 adult diary days Again the figures are very similar to those for all adults. Men are in paid work for on average 97 minutes per day longer than women, and women do about two hours (112 minutes) more housework & childcare per day than men. Men spend more time on leisure - more time watching TV and on sport and hobbies, but less time on social activities (see also table in Appendix 4). There are small differences in the amount of time spent sleeping, on personal care and on travel.
0 100 200 300 400 500 600
sleep
eating
personal care
paid work & study
housework & childcare
leisure
travel
not specified
Male Female
10
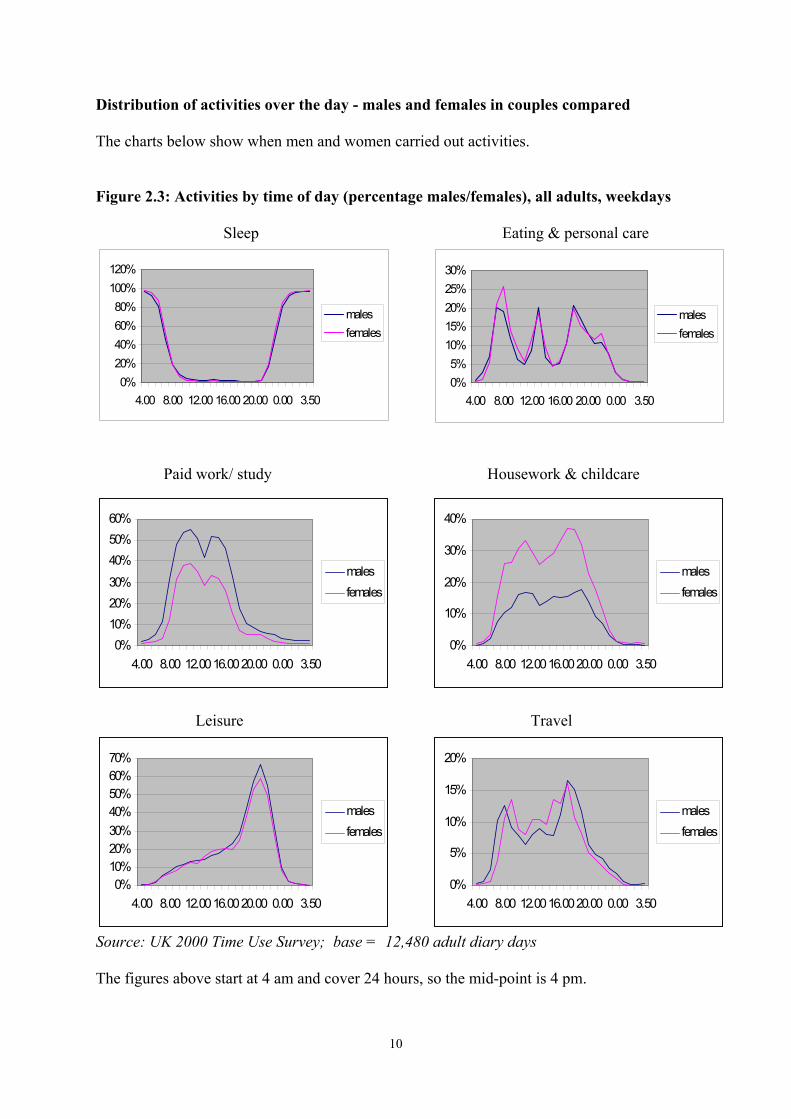
Distribution of activities over the day - males and females in couples compared The charts below show when men and women carried out activities. Figure 2.3: Activities by time of day (percentage males/females), all adults, weekdays Sleep Eating & personal care
Paid work/ study Housework & childcare
Leisure Travel
Source: UK 2000 Time Use Survey; base = 12,480 adult diary days The figures above start at 4 am and cover 24 hours, so the mid-point is 4 pm.
0%5%
10%15%20%25%30%
4.00 8.00 12.00 16.00 20.00 0.00 3.50
malesfemales
0%10%20%30%
40%50%60%
4.00 8.00 12.0016.0020.00 0.00 3.50
malesfemales
0%
10%
20%
30%
40%
4.00 8.00 12.0016.0020.00 0.00 3.50
malesfemales
0%10%20%30%40%50%60%70%
4.00 8.00 12.0016.0020.00 0.00 3.50
malesfemales
0%20%40%60%80%
100%120%
4.00 8.00 12.00 16.00 20.00 0.00 3.50
malesfemales
0%
5%
10%
15%
20%
4.00 8.00 12.0016.0020.00 0.00 3.50
malesfemales
11
Overall the day charts for men and women within couples are very similar to those for all adults. Men and women have similar activity patterns over time. The shapes of the charts are similar, but the extent of participation varies. Sleep: men and women are very closely matched on this: very similar proportions get up at the same time and go to bed at the same time. Personal care (washing & dressing): men and women have very similar patterns, with a greater proportion of women engaging in this activity in the morning, and a slightly greater proportion late in the evening. Paid work/ study: men and women have very similar patterns to time use, with more males in paid work than females at all times of the day. Housework and childcare: this is carried out by almost twice as many women as men at all times of the day. Leisure: men and women have very similar patterns of behaviour, except in the evening, when more a slightly greater proportion of men participate in leisure activities than women. Travel: note the slight shift in the peak periods of travel for men and women. In the morning, a greater proportion of men travel earlier, and in the evening, a greater proportion of men travel later, while during the day the proportion of women travelling is greater than men. This is not unexpected. None of these charts is showing any surprises, and they do reassure us that the data appears to reliably reflect time use patterns. We have shown how men and women have similar patterns of time use. The next section goes further, and looks at how much and what couples are actually doing together.
12
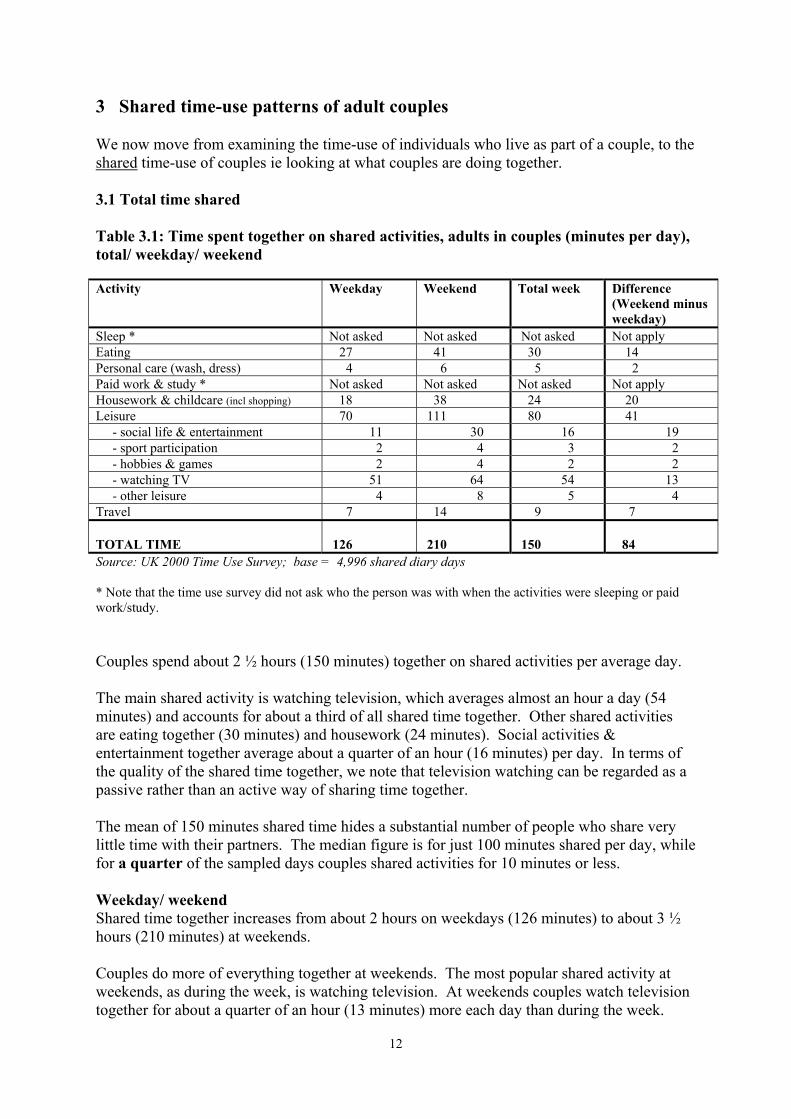
3 Shared time-use patterns of adult couples We now move from examining the time-use of individuals who live as part of a couple, to the shared time-use of couples ie looking at what couples are doing together. 3.1 Total time shared Table 3.1: Time spent together on shared activities, adults in couples (minutes per day), total/ weekday/ weekend Activity
Weekday Weekend Total week Difference (Weekend minus weekday)
Sleep * Not asked Not asked Not asked Not apply Eating 27 41 30 14 Personal care (wash, dress) 4 6 5 2 Paid work & study * Not asked Not asked Not asked Not apply Housework & childcare (incl shopping) 18 38 24 20 Leisure 70 111 80 41 - social life & entertainment 11 30 16 19 - sport participation 2 4 3 2 - hobbies & games 2 4 2 2 - watching TV 51 64 54 13 - other leisure 4 8 5 4 Travel 7 14 9 7 TOTAL TIME
126
210
150
84
Source: UK 2000 Time Use Survey; base = 4,996 shared diary days * Note that the time use survey did not ask who the person was with when the activities were sleeping or paid work/study. Couples spend about 2 ½ hours (150 minutes) together on shared activities per average day. The main shared activity is watching television, which averages almost an hour a day (54 minutes) and accounts for about a third of all shared time together. Other shared activities are eating together (30 minutes) and housework (24 minutes). Social activities & entertainment together average about a quarter of an hour (16 minutes) per day. In terms of the quality of the shared time together, we note that television watching can be regarded as a passive rather than an active way of sharing time together. The mean of 150 minutes shared time hides a substantial number of people who share very little time with their partners. The median figure is for just 100 minutes shared per day, while for a quarter of the sampled days couples shared activities for 10 minutes or less. Weekday/ weekend Shared time together increases from about 2 hours on weekdays (126 minutes) to about 3 ½ hours (210 minutes) at weekends. Couples do more of everything together at weekends. The most popular shared activity at weekends, as during the week, is watching television. At weekends couples watch television together for about a quarter of an hour (13 minutes) more each day than during the week.
13
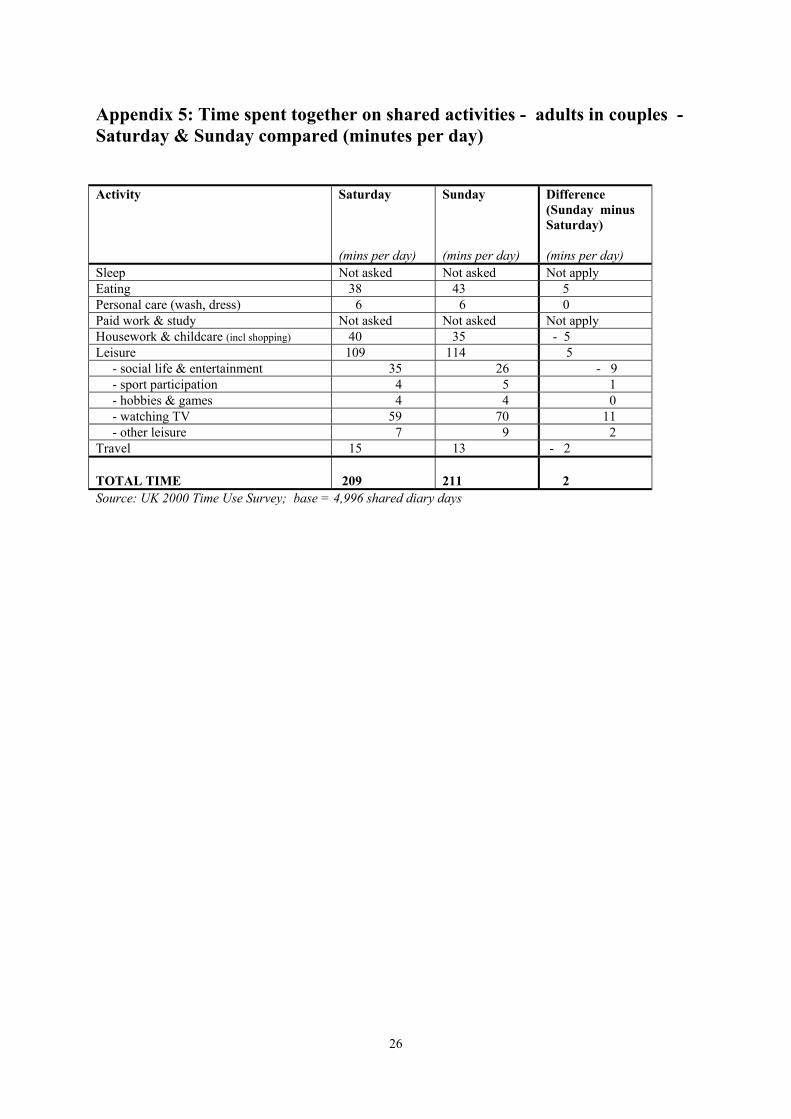
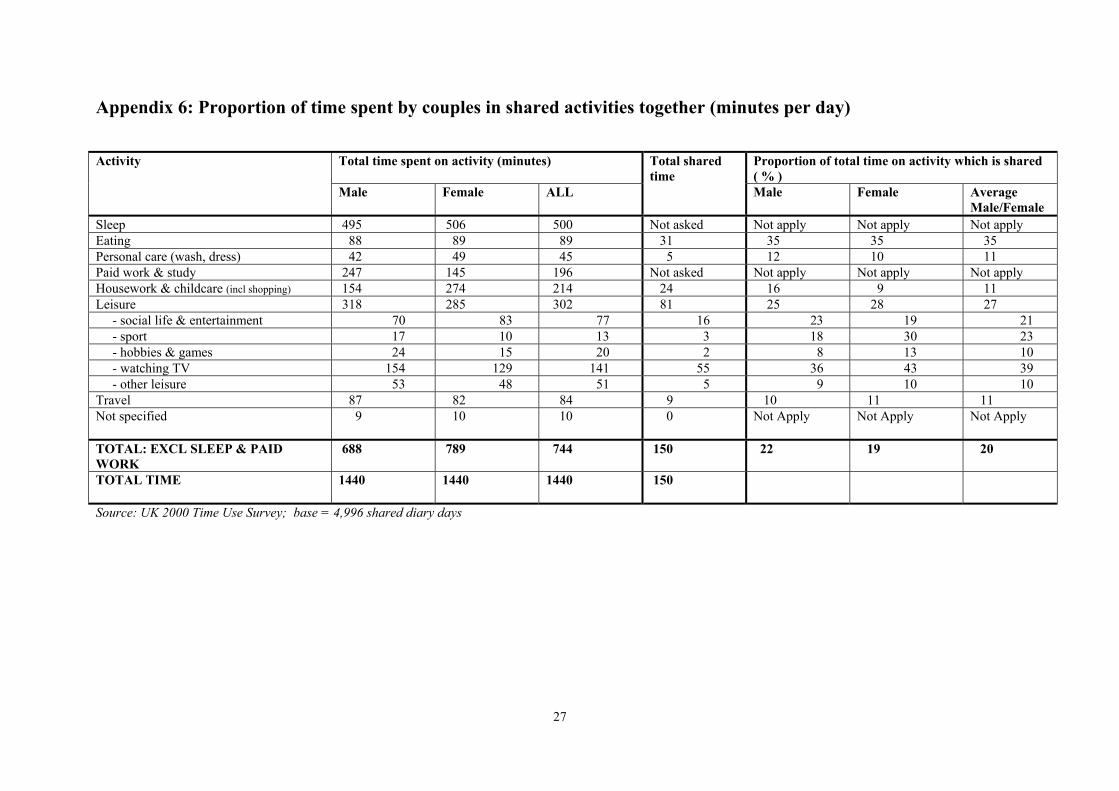
Amongst leisure activities the greatest increase in shared time at weekends is not in TV watching but is in social activities and entertainment (at an extra 19 minutes spent together). At weekends more time is also spent doing housework together (an extra 20 minutes) and more time is spent eating together (14 minutes more). Saturday and Sunday In previous sections, when describing time use patterns over the week, we have combined Saturday and Sunday and made weekday/ weekend comparisons. This has been sensible, as it turns out that time-use patterns on Saturday and Sunday are quite similar. Now, with so much shared time-use being at the weekends, we have looked at Saturday and Sunday separately (see table in Appendix 5). It also turns out that the patterns for shared time-use are similar on Saturdays an Sundays. First, there is very little difference between the total amount of time spent together on Saturdays and Sundays, at about 3 ½ hours on each day (209 minutes on Saturday, and 211 minutes on Sunday). The amount of time spent together on specific activities is also about the same: about 40 minutes on eating, and about the same on housework, about 15 minutes on travel and just under 2 hours on leisure. On Sunday a little more time is spent watching TV (an extra 11 minutes), and on Saturdays a little more time is spent on social activities and entertainment (an extra 9 minutes). 3.2 Proportion of time shared We have looked at the absolute amount of time spent on shared activities, now we look at shared time in the context of all time spent on activities. Couples spend far more time NOT doing things together than doing things together. Only a small proportion of a person's time is shared with their partner. Excluding sleep and paid work, each person spends a fifth (20%) of their time with their partner doing the same activities (see table in Appendix 6). Even for the most popular shared activities, more time is spent doing these apart than together: 39% of television watching is spent together, 35% of the time spent eating is spent together, 23% of sport and 21% of social activities are spent together. The activities most likely to be carried out apart are housework, hobbies, personal care and travel, with about 90% of the time a person spends on each of these spent without their partner. Looking at men and women separately, the proportion of each person's time which is spent on shared activities with their partner is about the same, at about a fifth of their total time. Looking at specific activities, the largest differences are where there are differences in the total time spent on an activity. Thus a greater proportion of women's time spent on sport is shared (30% of their time, compared to 18% of men's time), and a greater proportion of men's time spent on housework is shared (16% of the time they spend on housework, compared to 9% for women).
14
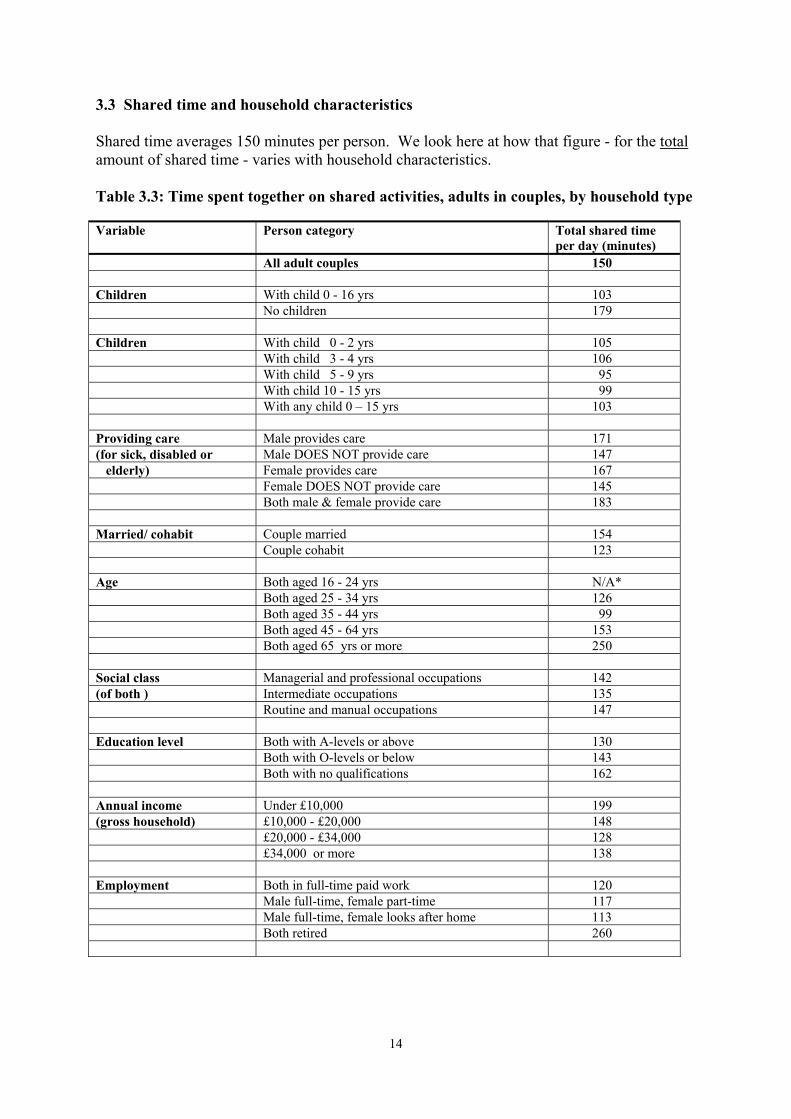
3.3 Shared time and household characteristics Shared time averages 150 minutes per person. We look here at how that figure - for the total amount of shared time - varies with household characteristics. Table 3.3: Time spent together on shared activities, adults in couples, by household type Variable Person category Total shared time
per day (minutes) All adult couples 150 Children With child 0 - 16 yrs 103 No children 179 Children With child 0 - 2 yrs 105 With child 3 - 4 yrs 106 With child 5 - 9 yrs 95 With child 10 - 15 yrs 99 With any child 0 – 15 yrs 103 Providing care Male provides care 171 (for sick, disabled or Male DOES NOT provide care 147 elderly) Female provides care 167 Female DOES NOT provide care 145 Both male & female provide care 183 Married/ cohabit Couple married 154 Couple cohabit 123 Age Both aged 16 - 24 yrs N/A* Both aged 25 - 34 yrs 126 Both aged 35 - 44 yrs 99 Both aged 45 - 64 yrs 153 Both aged 65 yrs or more 250 Social class Managerial and professional occupations 142 (of both ) Intermediate occupations 135 Routine and manual occupations 147 Education level Both with A-levels or above 130 Both with O-levels or below 143 Both with no qualifications 162 Annual income Under £10,000 199 (gross household) £10,000 - £20,000 148 £20,000 - £34,000 128 £34,000 or more 138 Employment Both in full-time paid work 120 Male full-time, female part-time 117 Male full-time, female looks after home 113 Both retired 260
15
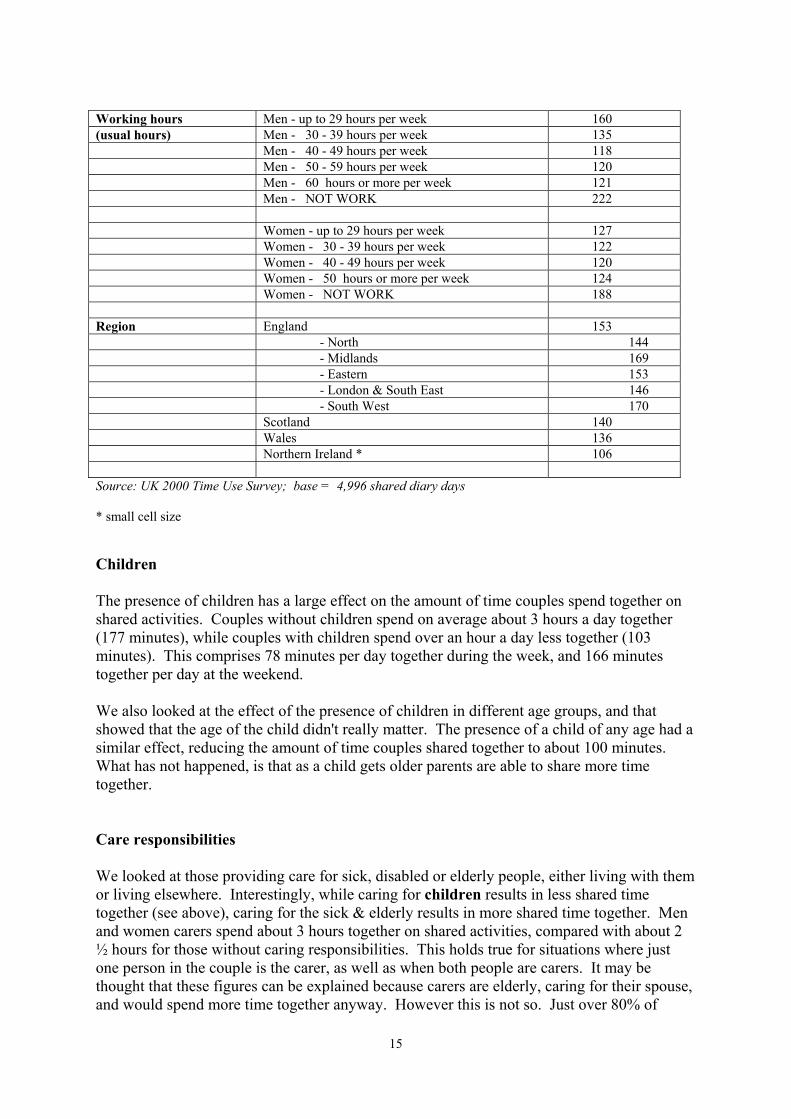
Working hours Men - up to 29 hours per week 160 (usual hours) Men - 30 - 39 hours per week 135 Men - 40 - 49 hours per week 118 Men - 50 - 59 hours per week 120 Men - 60 hours or more per week 121 Men - NOT WORK 222 Women - up to 29 hours per week 127 Women - 30 - 39 hours per week 122 Women - 40 - 49 hours per week 120 Women - 50 hours or more per week 124 Women - NOT WORK 188 Region England 153 - North 144 - Midlands 169 - Eastern 153 - London & South East 146 - South West 170 Scotland 140 Wales 136 Northern Ireland * 106 Source: UK 2000 Time Use Survey; base = 4,996 shared diary days * small cell size Children The presence of children has a large effect on the amount of time couples spend together on shared activities. Couples without children spend on average about 3 hours a day together (177 minutes), while couples with children spend over an hour a day less together (103 minutes). This comprises 78 minutes per day together during the week, and 166 minutes together per day at the weekend. We also looked at the effect of the presence of children in different age groups, and that showed that the age of the child didn't really matter. The presence of a child of any age had a similar effect, reducing the amount of time couples shared together to about 100 minutes. What has not happened, is that as a child gets older parents are able to share more time together. Care responsibilities We looked at those providing care for sick, disabled or elderly people, either living with them or living elsewhere. Interestingly, while caring for children results in less shared time together (see above), caring for the sick & elderly results in more shared time together. Men and women carers spend about 3 hours together on shared activities, compared with about 2 ½ hours for those without caring responsibilities. This holds true for situations where just one person in the couple is the carer, as well as when both people are carers. It may be thought that these figures can be explained because carers are elderly, caring for their spouse, and would spend more time together anyway. However this is not so. Just over 80% of
16
carers are under 65, and only 10% care for a spouse or partner. Most caring is for parents, parents-in-law or other relatives. Married/ cohabit Married people spend more time together than cohabiting people - about 2 ½ hours per day compared to 2 hrs. The difference is because of age. Married people are more likely to be older than cohabiting people - there are very few retired people cohabiting. Within the same age group, married and cohabiting couples have similar amounts of shared time. Age Couples in most age groups spend about 2 to 2 ½ hours per day together, and this increases to over 4 hrs per day for couples aged over 65 years (who have passed the state retirement age). However, something interesting is happening with couples aged 35-44 years - they spend less time together than couples in any other age group, at just over 1 ½ hours per day. Social class We have compared categories where both members of the couple have the same occupational status. There is little difference between social groups, with the highest social group spending about the same time together as the lowest. Education level Those with the highest qualifications spend least time together on shared activities, at just over 2 hours per day. Those with no qualifications (there is a large proportion of elderly in this group) spend the most shared time together, at over 2 ½ hours. Annual income Those in most income groups spend about 2 to 2 ½ hours together per day. The lowest earners - those earning under £10,000 per year - spend almost 3 ½ hours together. This is a reflection of the number of retired couples in that category. Employment We looked at combinations of full-time and part-time employment for each partner. It is not surprising that when both partners are in full-time paid work they get to spend only about two hours per day together. However, if the woman is in part-time paid work, or is not in paid work at all, the amount of time together is hardly affected, and remains at about two hours per day. Not working at all is the key to sharing more time together - retired couples spend about 4 ½ hours together per day on shared activities.
17
As employment and children have such great effects on shared time, we also looked at the combination of working full-time and having children to see if the amount of shared time reduced further - but it did not. Couples with children who both worked full-time still had about 2 hrs per week shared time. Working hours There are interesting patterns here. For working men, at first as their working hours increase they spend less time with their partners. But then beyond 40 hours per week the amount of shared time barely changes with increased hours, bottoming out at about 2 hours per week, even for men working over 60 hours per week. The story for working women is different. They average about 2 hrs shared time per day with their partners irrespective of the number of hours they work. For instance, women working under 29 hours per week average 127 minutes per day shared time, while those working over 50 hours average 124 minutes. Region The countries and regions of the UK all average about 2 ½ hours shared time per day. The sample size for Northern Ireland is too small to produce a reliable estimate.
18
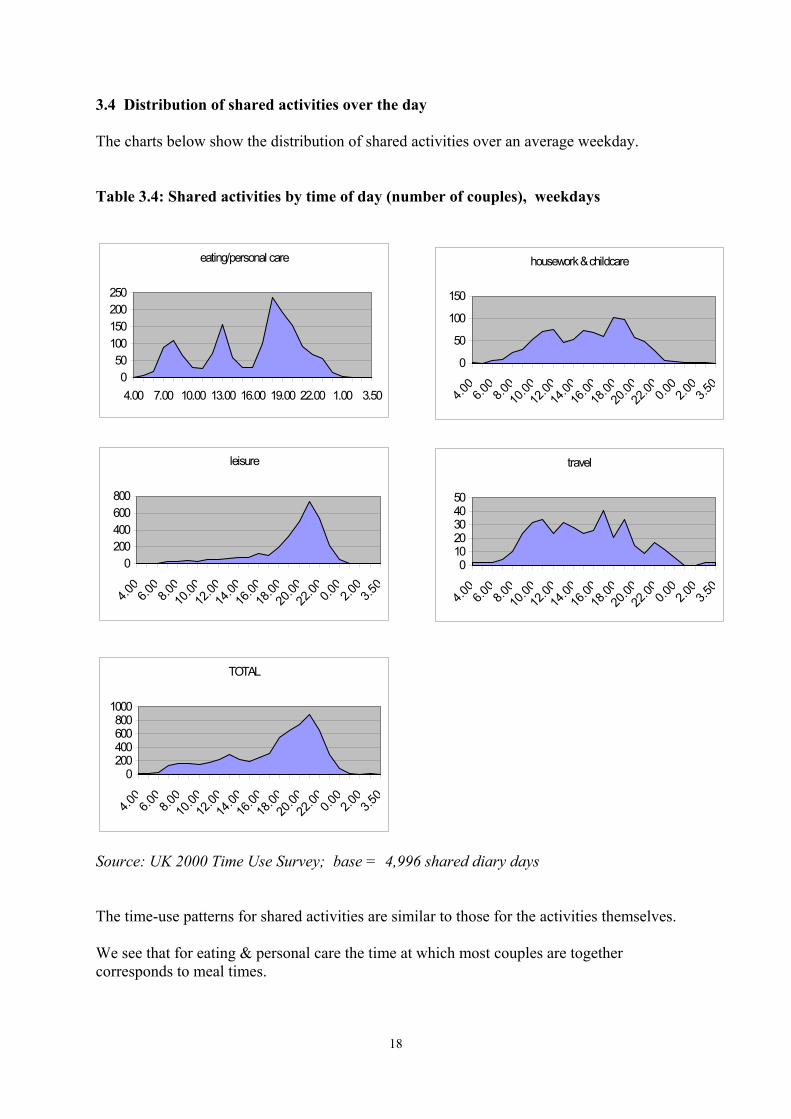
3.4 Distribution of shared activities over the day The charts below show the distribution of shared activities over an average weekday. Table 3.4: Shared activities by time of day (number of couples), weekdays
Source: UK 2000 Time Use Survey; base = 4,996 shared diary days The time-use patterns for shared activities are similar to those for the activities themselves. We see that for eating & personal care the time at which most couples are together corresponds to meal times.
housework & childcare
0
50
100
150
4.00
6.00
8.0010
.0012
.0014
.0016
.0018
.0020
.0022
.00 0.00
2.00
3.50
leisure
0200400600800
4.00
6.00
8.0010
.0012
.0014
.0016
.0018
.0020
.0022
.00 0.00
2.00
3.50
travel
01020304050
4.00
6.00
8.0010
.0012
.0014
.0016
.0018
.0020
.0022
.00 0.00
2.00
3.50
TOTAL
0200400600800
1000
4.00
6.00
8.0010
.0012
.0014
.0016
.0018
.0020
.0022
.00 0.00
2.00
3.50
eating/personal care
050
100150200250
4.00 7.00 10.00 13.00 16.00 19.00 22.00 1.00 3.50
19
For housework and childcare there is solid sharing throughout the day, with three peak periods. The peak time for sharing housework is in the evening at about 7pm. There is also a slightly lower peak for sharing late morning (11am - 12am), which corresponds to the morning peak for all housework activity. However, shared housework has a third peak at 3pm, which housework overall does not have. Shared leisure activities peak in the evening, very much as all leisure activities themselves do. Overall, because leisure represents over half of all shared time, the time-use pattern for all shared time closely resembles that for shared leisure time, which peaks in the evening. Shared travel patterns tell an interesting story. The day-time pattern for shared travel is similar to the pattern for all travel, but in the evening the picture is more complicated. Whereas for all travel we have one evening peak, for shared travel we have three. We noted earlier how the wide peak for all travel in the evening now combines work trips and evening leisure trips. For shared travel these are still separate. The first peak represents the journey from work, the second the journey to a leisure activity, and the third the journey from the leisure activity. 4 Conclusion Couples spend on average about 2 ½ hours per day on shared activities together. There is more shared time at the weekends: during weekdays shared time averages about 2 hours per day, increasing to about 3 ½ hours per day at weekends. The main shared activity might be regarded as a passive one - watching television. Shared time watching television averages almost an hour a day and accounts for about a third of all shared time together. Other prominent shared activities are eating together and housework which each average about half an hour a day each. Social activities & entertainment together average about a quarter of an hour per day. The single factor which most reduces the amount of shared time together is the presence of children - of any age. Couples without children average about 3 hours per day on shared activities while couples with children average just over 1 ½ hours per day. The age of the child has little effect - the presence of a child of any age means that shared time averages about the same, at just over 1 ½ hours per day. Children particularly squeeze the amount of shared time couples have during weekdays. Those with children share activities for on average 78 minutes on a weekday. When either or both partners are in paid work, the average amount of shared time together is lower than the overall average. However the effects of employment are not straightforward. When both partners are in full-time paid work they get to spend about two hours per day on shared activities together, but if the woman is in part-time paid work, or is not in paid work at all, the amount of time together is hardly affected, and remains at about two hours per day. This is borne out by the working hours data. No matter how many hours the woman works, the amount of time spent with her partner on shared activities is about two hours per day. Similarly for the man working full time, as his hours increase from 40 to 50 to over 60 hours, the amount of shared time is static at about two hours.

20
21
Appendix 1: Summary of the UK 2000/01 Time-Use Survey Background The UK 2000 Time Use Survey was conducted on behalf of a funding consortium consisting of: the Economic and Social Research Council; the Department of Culture, Media and Sport; the Department for Education and Skills; the Department of Health; the Department of Transport, Local Government and the Regions; and the Office for National Statistics.
The main aim of the survey was to measure the amount of time spent by the UK population on various activities. The UK 2000 Time Use Survey is the first time that a major survey of this type has been conducted in the UK and as such will provide an opportunity to inform a cross-section of policy areas as well as having interest for academia, social research centres and the advertising and retail sector.
The Time Use Survey was designed, where possible, to provide results comparable with other European studies as part of a wider Harmonised European Time Use Survey.
Sample design and fieldwork
The Survey was designed to achieve a representative sample of the population of households and individuals in the UK. The survey comprised only private households and the household members living in those households. The 52 week year was divided into 13 fieldwork months (this was later extended to 15 months) each of which covered a nationally representative sample.
The primary sampling unit consisted of postcode sectors divided into five Government Office Region combinations. Within these postcode sectors account was taken of the population density and the social-economic group of the head of the household. For cost-effectiveness reasons the sample was allocated using a cluster design.
Selected household heads or there partners completed a household questionnaire. All individuals aged 8 or over in the sampled household were asked to complete an individual questionnaire, two one-day diaries and a one week work and education time sheet. An equal distribution of week and weekend days was required for the diaries so household members were given a randomly selected combination of days which minimised the gap between the two diary days.
The household and individual questionnaires were mainly used to gather background information and demographics. The diaries record primary and secondary activities as well as information on the respondent’s location, and who they were with at the time. The one week worksheet recording time spent in work and full time education over the week the diaries were completed in.
The project was managed by the Office for National Statistics on behalf of the consortium. The fieldwork was carried out under contract by IPSOS-RSL between June 2000 and September 2001, an extension of three months over the planned project. This was deemed necessary to help boost the response rate by way of a telephone and mail re-issue procedure which began in May 2001.
22
Response rates
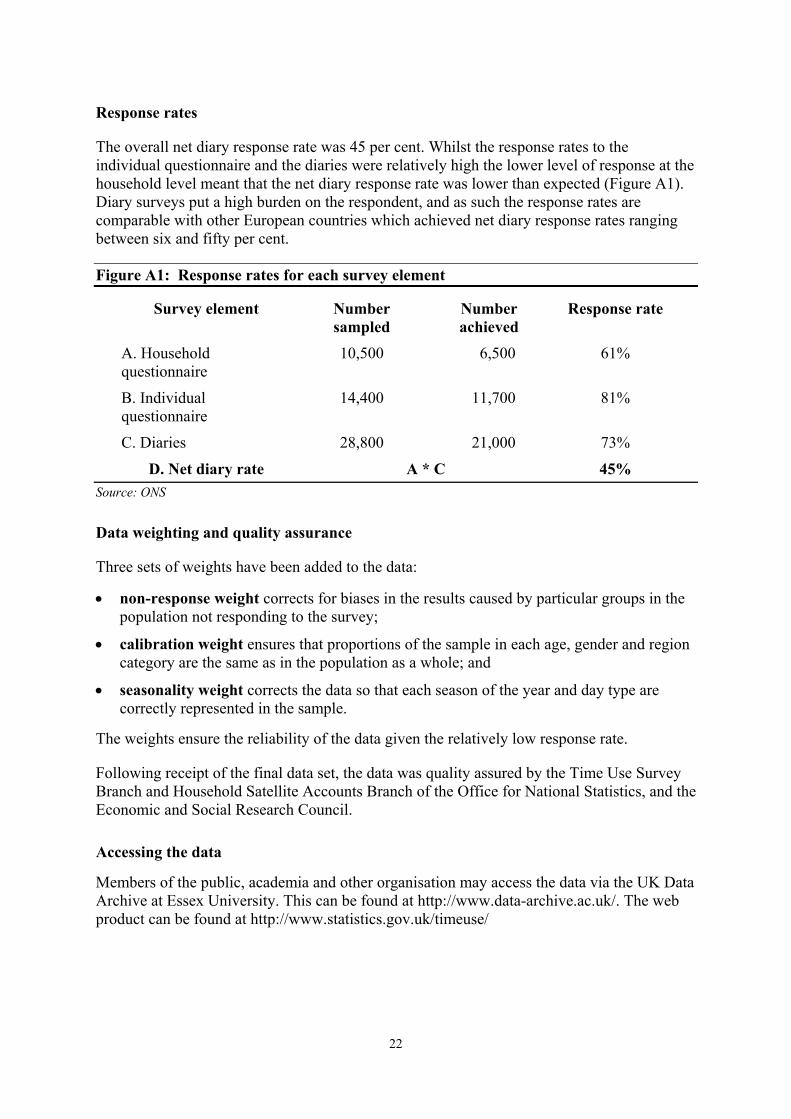
The overall net diary response rate was 45 per cent. Whilst the response rates to the individual questionnaire and the diaries were relatively high the lower level of response at the household level meant that the net diary response rate was lower than expected (Figure A1). Diary surveys put a high burden on the respondent, and as such the response rates are comparable with other European countries which achieved net diary response rates ranging between six and fifty per cent.
Figure A1: Response rates for each survey element
Survey element Number sampled
Number achieved
Response rate
A. Household questionnaire
10,500 6,500 61%
B. Individual questionnaire
14,400 11,700 81%
C. Diaries 28,800 21,000 73%
D. Net diary rate A * C 45% Source: ONS
Data weighting and quality assurance
Three sets of weights have been added to the data:
• non-response weight corrects for biases in the results caused by particular groups in the population not responding to the survey;
• calibration weight ensures that proportions of the sample in each age, gender and region category are the same as in the population as a whole; and
• seasonality weight corrects the data so that each season of the year and day type are correctly represented in the sample.
The weights ensure the reliability of the data given the relatively low response rate.
Following receipt of the final data set, the data was quality assured by the Time Use Survey Branch and Household Satellite Accounts Branch of the Office for National Statistics, and the Economic and Social Research Council.
Accessing the data
Members of the public, academia and other organisation may access the data via the UK Data Archive at Essex University. This can be found at http://www.data-archive.ac.uk/. The web product can be found at http://www.statistics.gov.uk/timeuse/
23
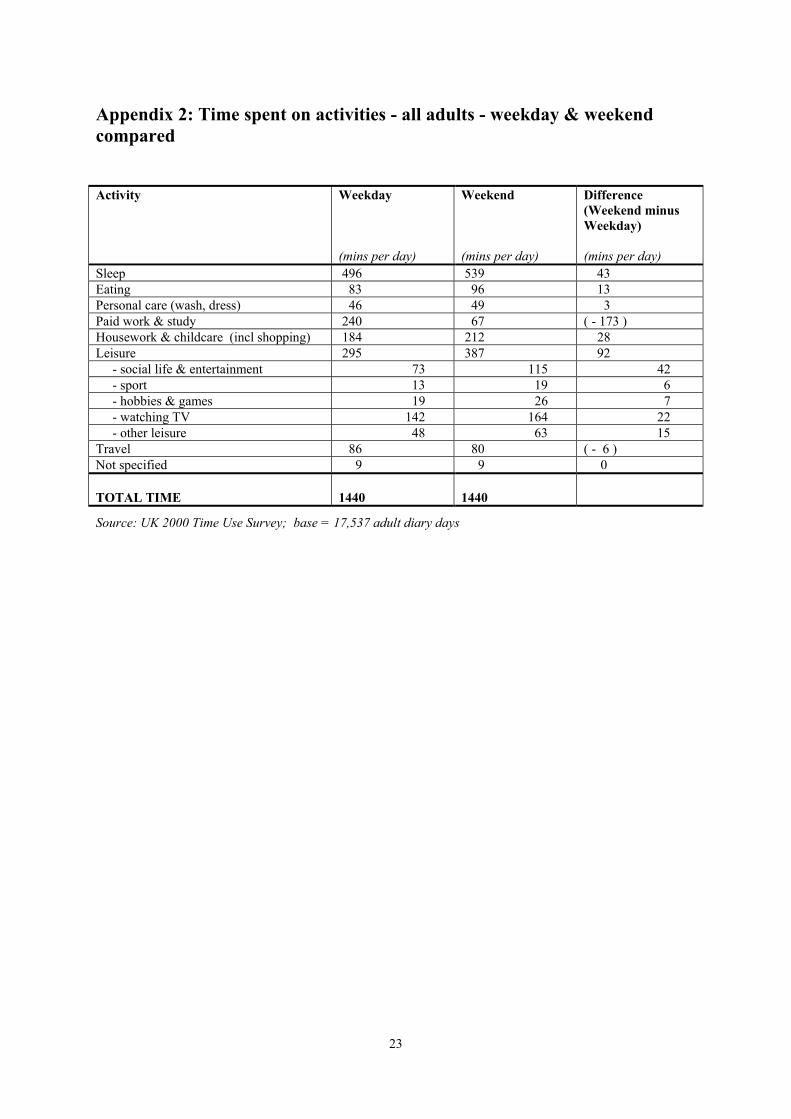
Appendix 2: Time spent on activities - all adults - weekday & weekend compared
Activity
Weekday (mins per day)
Weekend (mins per day)
Difference (Weekend minus Weekday) (mins per day)
Sleep 496 539 43 Eating 83 96 13 Personal care (wash, dress) 46 49 3 Paid work & study 240 67 ( - 173 ) Housework & childcare (incl shopping) 184 212 28 Leisure 295 387 92 - social life & entertainment 73 115 42 - sport 13 19 6 - hobbies & games 19 26 7 - watching TV 142 164 22 - other leisure 48 63 15 Travel 86 80 ( - 6 ) Not specified 9 9 0 TOTAL TIME
1440
1440
Source: UK 2000 Time Use Survey; base = 17,537 adult diary days
24
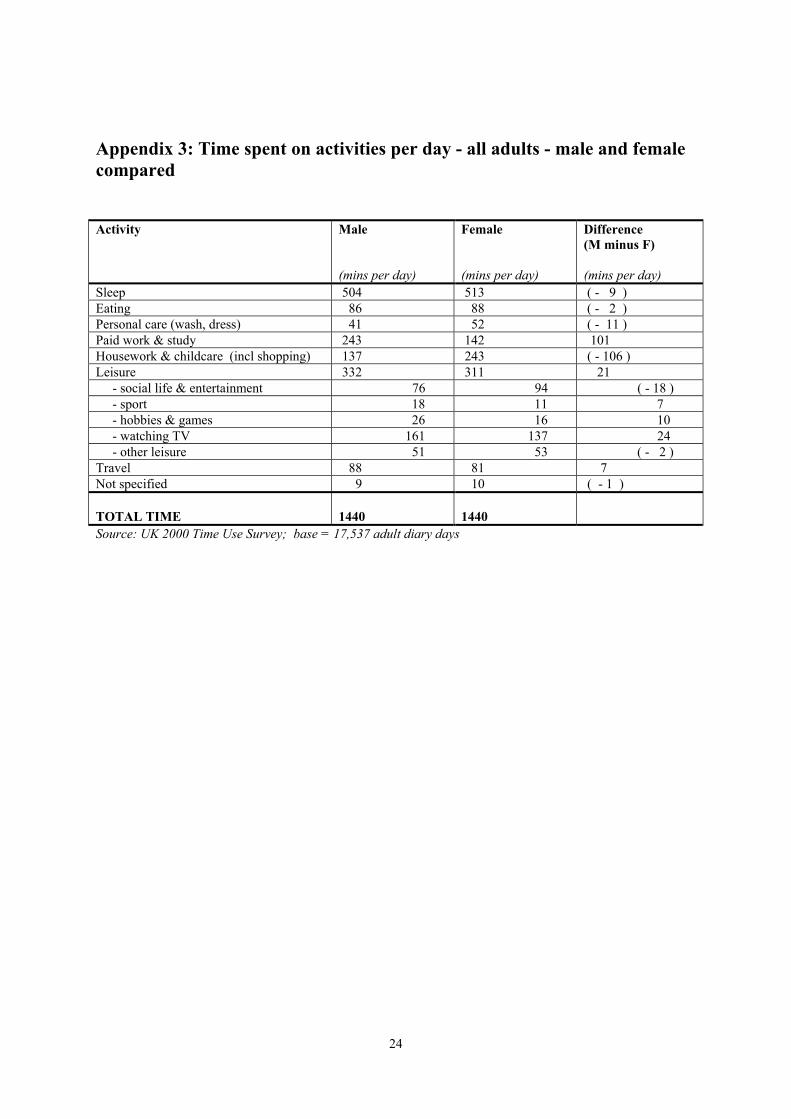
Appendix 3: Time spent on activities per day - all adults - male and female compared
Activity
Male (mins per day)
Female (mins per day)
Difference (M minus F) (mins per day)
Sleep 504 513 ( - 9 ) Eating 86 88 ( - 2 ) Personal care (wash, dress) 41 52 ( - 11 ) Paid work & study 243 142 101 Housework & childcare (incl shopping) 137 243 ( - 106 ) Leisure 332 311 21 - social life & entertainment 76 94 ( - 18 ) - sport 18 11 7 - hobbies & games 26 16 10 - watching TV 161 137 24 - other leisure 51 53 ( - 2 ) Travel 88 81 7 Not specified 9 10 ( - 1 ) TOTAL TIME
1440
1440
Source: UK 2000 Time Use Survey; base = 17,537 adult diary days
25
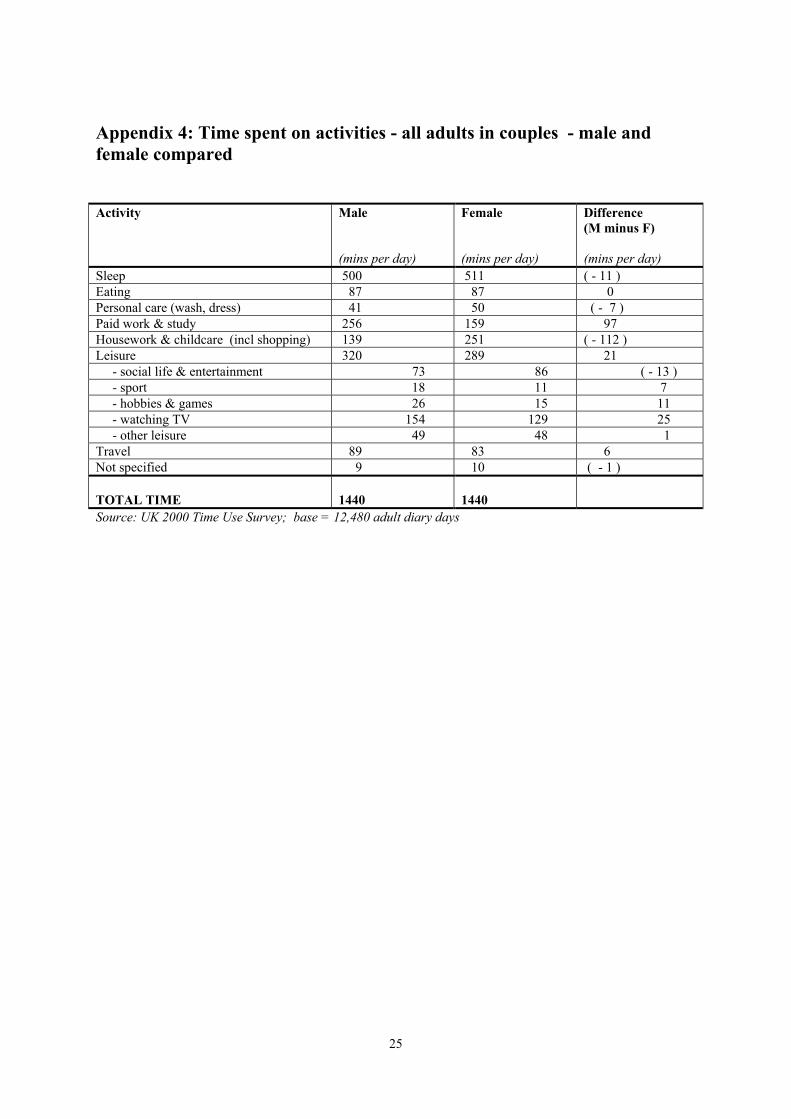
Appendix 4: Time spent on activities - all adults in couples - male and female compared Activity
Male (mins per day)
Female (mins per day)
Difference (M minus F) (mins per day)
Sleep 500 511 ( - 11 ) Eating 87 87 0 Personal care (wash, dress) 41 50 ( - 7 ) Paid work & study 256 159 97 Housework & childcare (incl shopping) 139 251 ( - 112 ) Leisure 320 289 21 - social life & entertainment 73 86 ( - 13 ) - sport 18 11 7 - hobbies & games 26 15 11 - watching TV 154 129 25 - other leisure 49 48 1 Travel 89 83 6 Not specified 9 10 ( - 1 ) TOTAL TIME
1440
1440
Source: UK 2000 Time Use Survey; base = 12,480 adult diary days
26
Appendix 5: Time spent together on shared activities - adults in couples - Saturday & Sunday compared (minutes per day) Activity
Saturday (mins per day)
Sunday (mins per day)
Difference (Sunday minus Saturday) (mins per day)
Sleep Not asked Not asked Not apply Eating 38 43 5 Personal care (wash, dress) 6 6 0 Paid work & study Not asked Not asked Not apply Housework & childcare (incl shopping) 40 35 - 5 Leisure 109 114 5 - social life & entertainment 35 26 - 9 - sport participation 4 5 1 - hobbies & games 4 4 0 - watching TV 59 70 11 - other leisure 7 9 2 Travel 15 13 - 2 TOTAL TIME
209
211
2
Source: UK 2000 Time Use Survey; base = 4,996 shared diary days
27
Appendix 6: Proportion of time spent by couples in shared activities together (minutes per day)
Total time spent on activity (minutes)
Proportion of total time on activity which is shared ( % )
Activity
Male Female ALL
Total shared time
Male Female Average Male/Female
Sleep 495 506 500 Not asked Not apply Not apply Not apply Eating 88 89 89 31 35 35 35 Personal care (wash, dress) 42 49 45 5 12 10 11 Paid work & study 247 145 196 Not asked Not apply Not apply Not apply Housework & childcare (incl shopping) 154 274 214 24 16 9 11 Leisure 318 285 302 81 25 28 27 - social life & entertainment 70 83 77 16 23 19 21 - sport 17 10 13 3 18 30 23 - hobbies & games 24 15 20 2 8 13 10 - watching TV 154 129 141 55 36 43 39 - other leisure 53 48 51 5 9 10 10 Travel 87 82 84 9 10 11 11 Not specified
9 10 10 0 Not Apply Not Apply Not Apply
TOTAL: EXCL SLEEP & PAID WORK
688 789 744 150 22 19 20
TOTAL TIME 1440
1440 1440 150
Source: UK 2000 Time Use Survey; base = 4,996 shared diary days