marlborough uk micro-cap growth fundfunds.marlboroughfunds.com/uploads/documents... · over the six...
TRANSCRIPT

INTERIM REPORT AND UNAUDITED FINANCIAL STATEMENTS
for the six month period ended 31 January 2020
MARLBOROUgHUK MICRO-CAP GROWTH FUND

MARLBOROUGH UK MICRO-CAP GROWTH FUND
CONTACT INFORMATION
Authorised Fund Manager and Registrar
Marlborough Fund Managers LtdMarlborough House59 Chorley New RoadBolton BL1 4QP
Investor Support: (0808) 145 2500 (FREEPHONE)
Authorised and regulated by the Financial Conduct Authority.
Trustee
HSBC Bank plc8 Canada SquareLondonE14 5HQ
Investment Adviser
Hargreave Hale LimitedTalisman HouseBoardmans WayBlackpoolLancashireFY4 5FY
Authorised and regulated by the Financial Conduct Authority.
Auditor
Ernst & Young LLPAtria One144 Morrison StreetEdinburghEH3 8EX
Directors of Marlborough Fund Managers Ltd
Andrew Staley ChairmanNicholas F J Cooling Deputy ChairmanAllan Hamer Joint Managing Director Wayne D Green Joint Managing DirectorDom Clarke Finance DirectorGeoffrey Hitchin Investment DirectorHelen Derbyshire Director – Compliance & RiskRichard Goodall Director – Strategy & Business DevelopmentGuy Sears Non-Executive Director David Kiddie Non-Executive DirectorSarah Peaston Non-Executive Director (appointed 1 October 2019)
Authorised by the Prudential Regulation Authority and regulated by the Financial Conduct Authority and the Prudential RegulationAuthority.

MARLBOROUGH UK MICRO-CAP GROWTH FUND
CONTENTS PAGE
AUTHORISED INVESTMENT ADVISER’S REPORT 1
AUTHORISED STATUS AND GENERAL INFORMATION 3
DIRECTORS’ STATEMENT 4
COMPARATIVE TABLE 5
SYNTHETIC RISK AND REWARD INDICATOR 6
PORTFOLIO STATEMENT 7
PORTFOLIO TRANSACTIONS 13
UNAUDITED INTERIM FINANCIAL STATEMENTS
STATEMENT OF TOTAL RETURN 14
STATEMENT OF CHANGE IN NET ASSETS ATTRIBUTABLE TO UNITHOLDERS 14
BALANCE SHEET 15
NOTES TO THE INTERIM FINANCIAL STATEMENTS 15

MARLBOROUGH UK MICRO-CAP GROWTH FUND
AUTHORISED INVESTMENT ADVISER'S REPORTfor the six month period ended 31 January 2020
Percentage change and sector position to 31 January 2020
Six months 1 year 3 years 5 years * 05.10.2004Marlborough UK Micro-Cap Growth Fund 10.29% 19.15% 42.91% 103.97% 790.42%FTSE Small Cap Ex. Investment Trusts 11.34% 9.62% 5.49% 27.31% 91.63%IA UK Smaller Companies 12.48% 20.47% 38.00% 76.47% 383.26%Quartile Ranking** 3 3 2 1 1 * Launch period ended 4 October 2004.** Based on ranking within The Investment Association's UK Smaller Companies sector.External Source of Economic Data: Morningstar (class P Acc - bid to bid).Class P units first priced on 2 January 2013. In the period to that date, the past performance information for Class A units has been used.
Giles Hargreave / Guy FeldHargreave Hale Ltd21 February 2020
This report contains FTSE data. Source: FTSE International Limited (“FTSE”) © FTSE 2020. “FTSE®” is a trade mark of the London Stock Exchange Groupcompanies and is used by FTSE International Limited under licence. All rights in the FTSE indices and / or FTSE ratings vest in FTSE and/or its licensors. NeitherFTSE nor its licensors accept any liability for any errors or omissions in the FTSE indices and / or FTSE ratings or underlying data. No further distribution of FTSEData is permitted without FTSE’s express written consent.
Over the six months to 31 January 2020 P class units in our Microcap fund rose 10.3%. This compares to a rise of 11.3% for the FTSESmall Cap Ex. Investment Trusts Index.
The six-month period to 31 January 2020 was a tale of two halves, the pre- and post-Election periods. The first half was characterised by a state of paralysis in the UKParliament and increasing pessimism regarding the UK economy and the Brexitnegotiations. The election of Boris Johnson as leader of the Conservative party and,more significantly, the subsequent large Tory majority at the General Election hascaused a significant change in sentiment. UK focussed stocks reacted positively tothe news and there is early evidence that the shift in mood is taking place in the realeconomy too, with rising consumer confidence levels, retail sales and positive RICSsurveys; this, compounded by the last few years of real wage growth, bodes well forthe UK domestic economy.
Turning to contributors to performance, our largest riser was Ceres Power (+121%). The company develops solid oxide fuel celltechnology using ‘Steel Cell’ design. The company’s target market is small, stationary, conventional fuel (e.g. natural gas) applicationsin combined heat and power as well as distributed power generation. Triple drivers of air quality, energy conservation and climatechange are driving interest in the company from a commercial and stock market perspective. Petropavlovsk (+83%) was the nextlargest riser; this is one of the Fund’s larger gold holdings which has risen on the back of strong production figures with the tailwind of arising gold price. The next largest riser was Alpha FX (+76%); the company continues to perform ahead of market expectations as itcontinues to take market share and launch new products. Other notable contributors included Liontrust Asset Management (+68%),Impax Asset Management (+68%) and Augean (+63%).
Turning to the detractors, the largest faller was Wilmcote Holdings (-98%) which was a cash shell that failed to secure an acquisitionand as such burned through a significant portion of the cash with which it listed. Given the nature of the investment it was a very smallposition so the overall impact on the Fund’s performance was negligible. C4X Discovery (-72%) fell following disappointing operationalprogress and a fundraising at a deeply discounted price. Other notable detractors included Smartspace Software (-66%), accessoTechnologies (-52%), and Sensyne Health (-63%).
The IPO (Initial Public Offering) market was quiet over the period with companies and brokers holding off until after the GeneralElection; we participated in only two IPOs in the period, Brickability and MJ Hudson which are off to reasonable but unspectacularstarts, up 15% and 7% respectively. We are starting to see more activity now given the rebound in sentiment.
Early in 2020, the outbreak in novel coronavirus (2019-nCoV) in Wuhan, China, spooked both commodity and equity markets as fearsspread that both Chinese GDP growth and global supply chains will be negatively impacted. Whilst these adverse factors have notdisappeared, stock markets globally have been calmer with more recent focus on the likely impact of the large stimulatory packageintroduced by the Chinese government which could encourage Central Banks in Europe and potentially the US to follow suit. Whilst theultimate impact of the virus remains to be seen, we expect disruption to supply chains and profit warnings from companies that eithersource directly from China or supply into Chinese manufacturing sites. What we have seen, however, is that the market has been ableto see through shorter term profit warnings in many companies, with Apple being a leading example.
1

MARLBOROUGH UK MICRO-CAP GROWTH FUND
AUTHORISED INVESTMENT ADVISER'S REPORTfor the six month period ended 31 January 2020
Post period end
Distributions (pence per unit)
Year 2019 Year 2018 Year 2017A AccumulationAccumulation paid 30 September - - 0.6684 B AccumulationAccumulation paid 30 September 2.5969 2.3427 3.6169 P AccumulationAccumulation paid 30 September 4.4858 4.1920 5.0702
Portfolio changes
Largest purchases Cost (£) Largest sales Proceeds (£)
Tracsis 6,304,315 GB Group 19,258,290Polymetal International 5,563,336 Eland Oil & Gas 9,270,487Jubilee Metals Group 5,270,346 Future 8,047,773MJ Hudson Group 4,018,277 easyHotel 6,590,172Tatton Asset Management 3,848,852 Fever-Tree Drinks 6,545,414Brickability Group 3,835,377 Nasstar 6,440,000Games Workshop Group 3,424,760 Amerisur Resources 6,036,742NWF Group 3,206,402 Tarsus Group 5,960,625Creo Medical Group 3,134,189 StatPro Group 5,957,000S4 Capital 3,018,383 On the Beach Group 5,639,663
Other purchases 61,024,066 Other sales 109,259,121
Total purchases for the period 102,648,303 Total sales for the period 189,005,287
The speed and magnitude of the declines in equity indices has made history. The Covid-19 pandemic has shifted from being a supplyled issue to a demand led issue, with the attendant liquidity ramifications for those businesses who cannot weather the storm. We tendto avoid high fixed cost, low-margin and financially geared businesses as a matter of course; these are the businesses that will beunder the most pressure but the majority of firms will feel at least a short-term impact. The key from here is finding the stocks wherethe market has overreacted, and we think there are many, and where the market has underreacted, where again there are many. Forcompanies with strong competitive positions, operating models and balance sheets this presents a significant opportunity to takemarket share and potentially acquire cheaply whilst also capitalising on trends such as working from home, the de-risking of supplychains and healthcare. For stock market investors, lower valuations decreases risk and increases total return expectations in the rightcompanies.
Post period end and since writing the above commentary, the Covid-19 pandemic has accelerated throughout the world and causedsharp falls in global equity markets.
2

MARLBOROUGH UK MICRO-CAP GROWTH FUND
AUTHORISED STATUS AND GENERAL INFORMATION
Authorised status
Investment objective and policy
The Fund will be eligible for quotation in the IA UK Smaller Companies sector.
Rights and terms attaching to each unit class
Changes in prospectus
At least 80% of the Fund will be invested in the shares of smaller companies and investment trusts listed on UK stock exchanges.These will be incorporated/domiciled in the UK or will have significant business operations in the UK. These are companies whosemarket capitalisation (the market value of a company’s shares) is £250m or less at the time the initial purchase is made.
These investments will include very small companies, whose market capitalisation is less than £150m.
The aim of the investment team is to identify companies which they believe show good long-term growth potential, or which appear tobe under-valued given their future prospects.
The team consider economic and market conditions, but the main focus is on individual company analysis and selection.
Following the same investment philosophy, the Fund may also invest in companies which are listed on overseas stock exchanges, theshares of larger companies, other securities which offer returns linked to the company performance, such as, preference shares,convertible bonds and warrants, and unquoted companies.
Up to date Key Investor Information Documents, Prospectus and Long Reports and Financial Statements for any fund within the AFM’srange, can be requested by the investor at any time.
The investment objective and policy has been updated, and there has been a change of auditor from Barlow Andrews LLP to Ernst &Young LLP. Details of these changes can be found in the latest Prospectus dated 19 December 2019.
Marlborough UK Micro-Cap Growth Fund (the Fund) is an authorised unit trust scheme within the meaning of the Financial Servicesand Markets Act 2000 and is a UCITS scheme operating under the Collective Investment Schemes Sourcebook (COLL) as issued bythe Financial Conduct Authority.
A unit of each class represents a proportional entitlement to the assets of the Fund. The allocation of income and taxation and therights of each unit in the event the Fund is wound up are on the same proportional basis.
The investment objective of the Fund is to increase the value of your investment by more than any increase in the FTSE SmallCapIndex (ex-Investment Companies), after any charges have been taken out of the Fund, over any 5 year period. However, there is nocertainty this will be achieved.
The Fund is actively managed, which means the investment manager decides which investments to buy or sell and when. The Fundinvests in a diverse portfolio of investments and is not constrained by any industry or sector.
The Fund may hold cash, government bonds and money market instruments (short terms loans typically issued by governments andbanks) to enable ready settlement of liabilities (including the redemption of units), for the efficient management of the Fund and in orderto meet its objective.
3

MARLBOROUGH UK MICRO-CAP GROWTH FUND
AUTHORISED STATUS AND GENERAL INFORMATION
Post balance sheet events
Since the period end there has been a significant global market reaction to the ongoing Covid-19 global pandemic.
Since 31 January 2020 the Net Asset Value per unit of the Fund, expressed in pence per unit, has changed as follows31 January 2020 * 27 March 2020 Movement (%)
A Accumulation 797.01 561.94 -29.49%B Accumulation 837.14 590.83 -29.42%P Accumulation 841.33 594.11 -29.38%* These Net Asset Values differ from those in the Comparative Table as they are the quoted Net Asset Values.
DIRECTORS' STATEMENT
ALLAN HAMERJOINT MANAGING DIRECTOR
G R HITCHININVESTMENT DIRECTOR
MARLBOROUGH FUND MANAGERS LTD
This report has been prepared in accordance with the requirements of the Collective Investment Schemes Sourcebook as issued andamended by the Financial Conduct Authority.
31 March 2020
The impact on global markets going forward will depend on the ongoing scale, duration and individual approach of each country'sgovernment in their management of the pandemic, which continues to evolve on a day by day basis.
MFM as the ACD and Hargreave Hale Ltd as the Investment Manager to the Fund continue to monitor UK government announcementsand advice as the situation continues to develop.
This economic market uncertainty could have a significant adverse impact on the Fund, including on the fair value of its investments.
4
MARLBOROUGH UK MICRO-CAP GROWTH FUND
COMPARATIVE TABLE
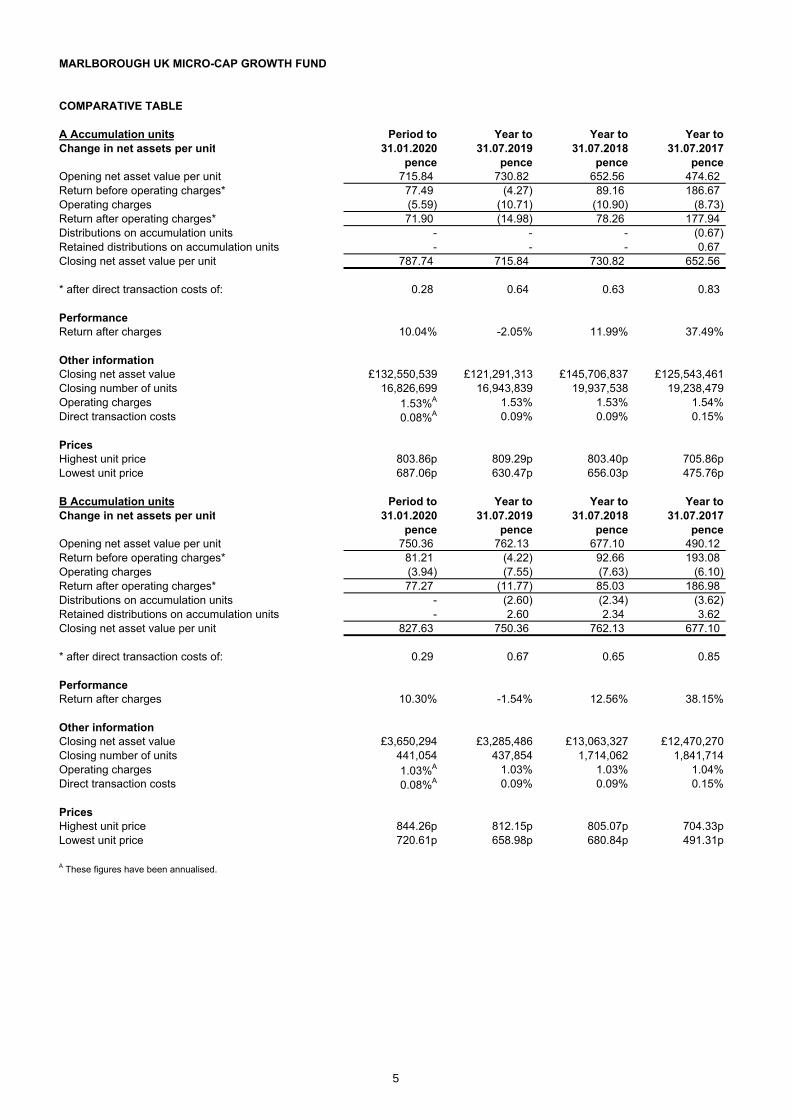
A Accumulation units Period to Year to Year to Year toChange in net assets per unit 31.01.2020 31.07.2019 31.07.2018 31.07.2017
pence pence pence penceOpening net asset value per unit 715.84 730.82 652.56 474.62Return before operating charges* 77.49 (4.27) 89.16 186.67Operating charges (5.59) (10.71) (10.90) (8.73)Return after operating charges* 71.90 (14.98) 78.26 177.94Distributions on accumulation units - - - (0.67)Retained distributions on accumulation units - - - 0.67Closing net asset value per unit 787.74 715.84 730.82 652.56
* after direct transaction costs of: 0.28 0.64 0.63 0.83
PerformanceReturn after charges 10.04% -2.05% 11.99% 37.49%
Other informationClosing net asset value £132,550,539 £121,291,313 £145,706,837 £125,543,461Closing number of units 16,826,699 16,943,839 19,937,538 19,238,479Operating charges 1.53%A 1.53% 1.53% 1.54%Direct transaction costs 0.08%A 0.09% 0.09% 0.15%
PricesHighest unit price 803.86p 809.29p 803.40p 705.86pLowest unit price 687.06p 630.47p 656.03p 475.76p
B Accumulation units Period to Year to Year to Year toChange in net assets per unit 31.01.2020 31.07.2019 31.07.2018 31.07.2017
pence pence pence penceOpening net asset value per unit 750.36 762.13 677.10 490.12Return before operating charges* 81.21 (4.22) 92.66 193.08Operating charges (3.94) (7.55) (7.63) (6.10)Return after operating charges* 77.27 (11.77) 85.03 186.98Distributions on accumulation units - (2.60) (2.34) (3.62)Retained distributions on accumulation units - 2.60 2.34 3.62Closing net asset value per unit 827.63 750.36 762.13 677.10
* after direct transaction costs of: 0.29 0.67 0.65 0.85
PerformanceReturn after charges 10.30% -1.54% 12.56% 38.15%
Other informationClosing net asset value £3,650,294 £3,285,486 £13,063,327 £12,470,270Closing number of units 441,054 437,854 1,714,062 1,841,714Operating charges 1.03%A 1.03% 1.03% 1.04%Direct transaction costs 0.08%A 0.09% 0.09% 0.15%
PricesHighest unit price 844.26p 812.15p 805.07p 704.33pLowest unit price 720.61p 658.98p 680.84p 491.31p
A These figures have been annualised.
5

MARLBOROUGH UK MICRO-CAP GROWTH FUND
COMPARATIVE TABLE
P Accumulation units Period to Year to Year to Year toChange in net assets per unit 31.01.2020 31.07.2019 31.07.2018 31.07.2017
pence pence pence penceOpening net asset value per unit 753.20 763.16 676.32 488.31Return before operating charges* 81.69 (4.23) 92.64 192.66Operating charges (3.00) (5.73) (5.80) (4.65)Return after operating charges* 78.69 (9.96) 86.84 188.01Distributions on accumulation units - (4.49) (4.19) (5.07)Retained distributions on accumulation units - 4.49 4.19 5.07Closing net asset value per unit 831.89 753.20 763.16 676.32
* after direct transaction costs of: 0.29 0.67 0.65 0.86
PerformanceReturn after charges 10.45% -1.31% 12.84% 38.50%
Other informationClosing net asset value £1,144,151,395 £1,115,313,951 £1,118,393,696 £799,431,894Closing number of units 137,537,119 148,076,186 146,547,768 118,202,360Operating charges 0.78%A 0.78% 0.78% 0.79%Direct transaction costs 0.08%A 0.09% 0.09% 0.15%
PricesHighest unit price 848.44p 813.42p 805.75p 703.39pLowest unit price 723.70p 660.60p 680.09p 489.50p
A These figures have been annualised.
SYNTHETIC RISK AND REWARD INDICATOR
Lower risk Higher risk
Typically lower rewards Typically higher rewards
1 2 3 4 5 6 7
Operating charges are the same as the ongoing charges and are the total expenses paid by each unit class in the period. Directtransaction costs are the total charges for the period, included in the purchase and sale of investments in the portfolio of the Fund.These amounts are expressed as a percentage of the average net asset value over the period and the average units in issue for thepence per unit figures.
The synthetic risk and reward indicator above aims to provide you with an indication of the overall risk and reward profile of the Fund.It is calculated based on the volatility of the Fund using weekly historic returns over the last five years. If five years data is notavailable for a fund, the returns of a representative portfolio are used.
The Fund has been measured as 5 because it has experienced moderate to high volatility historically. During the period the syntheticrisk and reward indicator has remained unchanged.
6
MARLBOROUGH UK MICRO-CAP GROWTH FUND
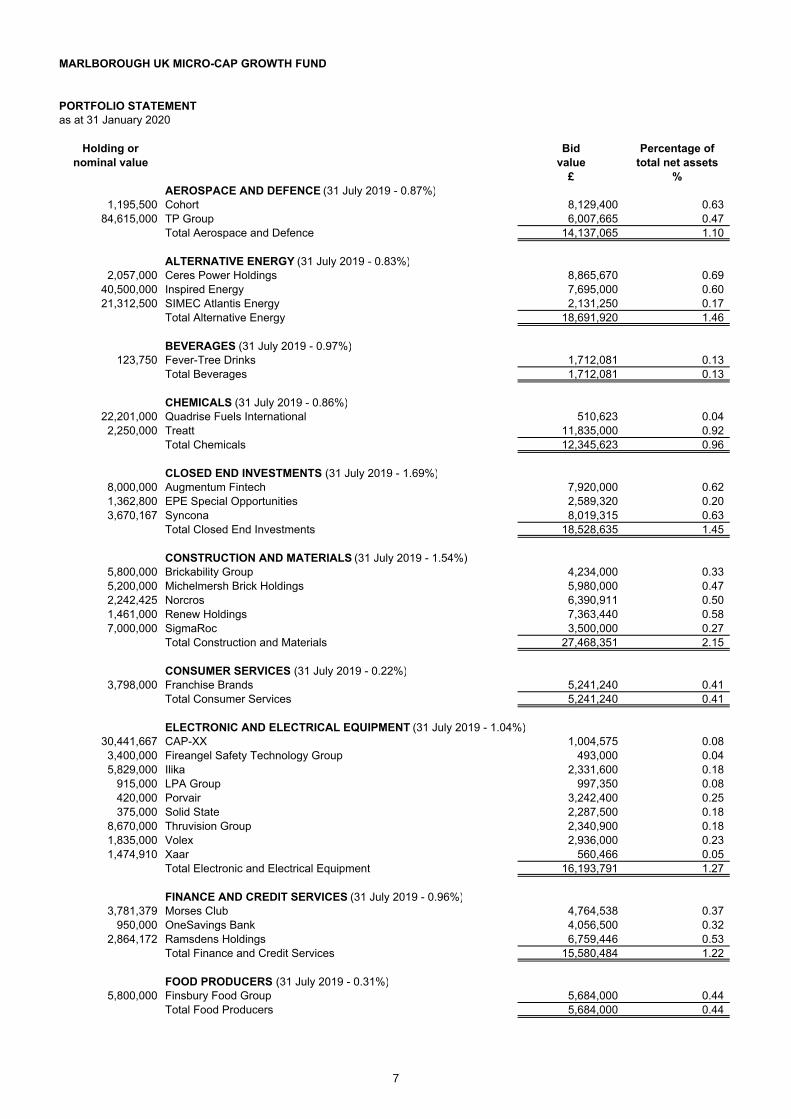
PORTFOLIO STATEMENTas at 31 January 2020
Holding or Bid Percentage ofnominal value value total net assets
£ %AEROSPACE AND DEFENCE (31 July 2019 - 0.87%)
1,195,500 Cohort 8,129,400 0.6384,615,000 TP Group 6,007,665 0.47
Total Aerospace and Defence 14,137,065 1.10
ALTERNATIVE ENERGY (31 July 2019 - 0.83%)2,057,000 Ceres Power Holdings 8,865,670 0.69
40,500,000 Inspired Energy 7,695,000 0.6021,312,500 SIMEC Atlantis Energy 2,131,250 0.17
Total Alternative Energy 18,691,920 1.46
BEVERAGES (31 July 2019 - 0.97%)123,750 Fever-Tree Drinks 1,712,081 0.13
Total Beverages 1,712,081 0.13
CHEMICALS (31 July 2019 - 0.86%)22,201,000 Quadrise Fuels International 510,623 0.042,250,000 Treatt 11,835,000 0.92
Total Chemicals 12,345,623 0.96
CLOSED END INVESTMENTS (31 July 2019 - 1.69%)8,000,000 Augmentum Fintech 7,920,000 0.621,362,800 EPE Special Opportunities 2,589,320 0.203,670,167 Syncona 8,019,315 0.63
Total Closed End Investments 18,528,635 1.45
CONSTRUCTION AND MATERIALS (31 July 2019 - 1.54%)5,800,000 Brickability Group 4,234,000 0.335,200,000 Michelmersh Brick Holdings 5,980,000 0.472,242,425 Norcros 6,390,911 0.501,461,000 Renew Holdings 7,363,440 0.587,000,000 SigmaRoc 3,500,000 0.27
Total Construction and Materials 27,468,351 2.15
CONSUMER SERVICES (31 July 2019 - 0.22%)3,798,000 Franchise Brands 5,241,240 0.41
Total Consumer Services 5,241,240 0.41
ELECTRONIC AND ELECTRICAL EQUIPMENT (31 July 2019 - 1.04%)30,441,667 CAP-XX 1,004,575 0.083,400,000 Fireangel Safety Technology Group 493,000 0.045,829,000 Ilika 2,331,600 0.18
915,000 LPA Group 997,350 0.08420,000 Porvair 3,242,400 0.25375,000 Solid State 2,287,500 0.18
8,670,000 Thruvision Group 2,340,900 0.181,835,000 Volex 2,936,000 0.231,474,910 Xaar 560,466 0.05
Total Electronic and Electrical Equipment 16,193,791 1.27
FINANCE AND CREDIT SERVICES (31 July 2019 - 0.96%)3,781,379 Morses Club 4,764,538 0.37
950,000 OneSavings Bank 4,056,500 0.322,864,172 Ramsdens Holdings 6,759,446 0.53
Total Finance and Credit Services 15,580,484 1.22
FOOD PRODUCERS (31 July 2019 - 0.31%)5,800,000 Finsbury Food Group 5,684,000 0.44
Total Food Producers 5,684,000 0.44
7

MARLBOROUGH UK MICRO-CAP GROWTH FUND
PORTFOLIO STATEMENTas at 31 January 2020
Holding or Bid Percentage ofnominal value value total net assets
£ %GAS, WATER AND MULTI-UTILITIES (31 July 2019 - 0.44%)
2,017,000 MYCELX Technologies 1,129,520 0.09494,783 MYCELX Technologies 'Reg S' 197,913 0.02
Total Gas, Water and Multi-utilities 1,327,433 0.11
GENERAL INDUSTRIALS (31 July 2019 - 1.48%)17,000,000 Coats Group 12,733,000 0.991,300,000 Eurocell 3,380,000 0.26
500,000 Hargreaves Services 1,550,000 0.125,125,000 Macfarlane Group 5,611,875 0.44
Total General Industrials 23,274,875 1.81
HEALTH CARE PROVIDERS (31 July 2019 - 1.67%)1,950,000 Cambridge Cognition Holdings 565,500 0.041,700,000 CareTech Holdings 7,735,000 0.601,680,000 Cello Health 2,268,000 0.184,800,000 Diaceutics 6,096,000 0.482,560,000 Sensyne Health 1,459,200 0.11
Total Health Care Providers 18,123,700 1.41
HOUSEHOLD GOODS AND HOME CONSTRUCTION (31 July 2019 - 0.98%)76,500 Churchill China 1,499,400 0.12
4,188,409 Springfield Properties 5,905,657 0.463,534,109 Watkin Jones 8,764,590 0.68
Total Household Goods and Home Construction 16,169,647 1.26
INDUSTRIAL ENGINEERING (31 July 2019 - 2.20%)920,000 AB Dynamics 19,964,000 1.56
Total Industrial Engineering 19,964,000 1.56
INDUSTRIAL MATERIALS (31 July 2019 - 0.49%)Total Industrial Materials - -
INDUSTRIAL METALS AND MINING (31 July 2019 - 1.53%)2,900,000 Anglo Pacific Group 5,075,000 0.401,980,000 Griffin Mining 1,227,600 0.10
86,740,000 Horizonte Minerals 2,688,940 0.211,300,000 Kenmare Resources 3,510,000 0.27
140,000,000 Landore Resources 910,000 0.072,600,000 Tricorn Group 260,000 0.02
371,428 Tricorn Group Sub Shares - -1,875,000 Trifast 3,581,250 0.28
Total Industrial Metals and Mining 17,252,790 1.35
INDUSTRIAL SUPPORT SERVICES (31 July 2019 - 9.13%)7,082,163 Boku 'Reg S' 5,878,195 0.46
377,000 Impellam Group 1,319,500 0.107,031,830 Johnson Service Group 14,837,161 1.162,000,000 Keystone Law Group 11,400,000 0.894,550,000 Knights Group Holdings 19,838,000 1.55
562,635 Midwich Group 2,891,944 0.232,554,562 Mind Gym 5,058,033 0.402,000,000 NWF Group 3,700,000 0.293,200,000 Restore 15,680,000 1.221,956,630 RWS Holdings 11,328,888 0.892,500,000 Science Group 5,800,000 0.451,800,000 Smart Metering Systems 9,342,000 0.73
840,000 Synectics 1,218,000 0.102,000,000 The SimplyBiz Group 4,500,000 0.35
200,000 Water Intelligence 560,000 0.04Total Industrial Support Services 113,351,721 8.86
8

MARLBOROUGH UK MICRO-CAP GROWTH FUND
PORTFOLIO STATEMENTas at 31 January 2020
Holding or Bid Percentage ofnominal value value total net assets
£ %INDUSTRIAL TRANSPORTATION (31 July 2019 - 1.00%)
3,250,000 Avation 9,912,500 0.773,000,000 DX (Group) 360,000 0.032,635,000 Gama Aviation 1,449,250 0.11
Total Industrial Transportation 11,721,750 0.91
INVESTMENT BANKING AND BROKERAGE SERVICES (31 July 2019 - 11.18%)674,644 AJ Bell 2,658,097 0.21
4,000,000 Allied Minds 1,460,000 0.111,572,650 Alpha FX Group 19,972,655 1.56
595,000 Aquis Exchange 2,201,500 0.17470,250 City of London Investment Group 2,054,993 0.16
2,890,703 Curtis Banks Group 10,117,461 0.793,127,236 Draper Esprit 15,823,814 1.24
35,545,000 Duke Royalty 16,350,700 1.285,525,000 Frenkel Topping Group 2,486,250 0.193,575,031 Frontier IP Group 2,359,520 0.184,674,360 Harwood Wealth Management Group 6,544,104 0.515,042,500 Impax Asset Management Group 19,514,475 1.521,690,000 IntegraFin Holdings 8,323,250 0.651,400,000 K3 Capital Group 3,178,000 0.25
500,000 Kingswood Holdings 97,000 0.011,250,000 Liontrust Asset Management 16,687,500 1.302,500,000 Manolete Partners 10,000,000 0.782,295,750 Marlowe 11,203,260 0.88
10,168,028 Mercia Asset Management 2,725,032 0.2116,000,000 MJ Hudson Group 8,800,000 0.69
350,000 Polar Capital Holdings 2,037,000 0.161,000,000 PraxisIFM Group 1,450,000 0.111,900,000 Premier Miton Group 3,135,000 0.251,026,904 Sigma Capital Group 1,129,594 0.091,500,000 Tatton Asset Management 4,110,000 0.32
Total Investment Banking and Brokerage Services 174,419,205 13.62
LEISURE GOODS (31 July 2019 - 3.60%)4,468,675 Codemasters Group Holdings 13,182,591 1.032,462,000 Focusrite 17,726,400 1.38
365,000 Games Workshop Group 24,382,000 1.90758,526 Sumo Group 1,456,370 0.11
Total Leisure Goods 56,747,361 4.42
MEDIA (31 July 2019 - 9.60%)375,000 4imprint Group 12,375,000 0.97
7,092,334 Ebiquity 2,553,240 0.201,510,000 Future 23,103,000 1.801,435,780 GlobalData 18,521,562 1.45
17,500,000 Huntsworth 11,550,000 0.903,655,000 Jaywing 146,200 0.015,880,600 Kin and Carta 6,468,660 0.512,790,200 Next Fifteen Communications Group 14,062,608 1.10
12,654,372 S4 Capital 23,790,219 1.861,250,000 STV Group 5,187,500 0.41
Total Media 117,757,989 9.21
MEDICAL EQUIPMENT AND SERVICES (31 July 2019 - 2.70%)1,800,000 Advanced Medical Solutions Group 5,085,000 0.408,441,216 Creo Medical Group 14,518,892 1.13
22,000,000 EKF Diagnostics Holdings 7,040,000 0.5520,000,000 Kromek Group 4,600,000 0.362,077,500 Renalytix AI 'Reg S' 7,188,150 0.56
Total Medical Equipment and Services 38,432,042 3.00
9

MARLBOROUGH UK MICRO-CAP GROWTH FUND
PORTFOLIO STATEMENTas at 31 January 2020
Holding or Bid Percentage ofnominal value value total net assets
£ %OIL, GAS AND COAL (31 July 2019 - 3.93%)
114,285,714 Cluff Natural Resources 1,771,429 0.142,250,000 Eco (Atlantic) Oil & Gas 945,000 0.07
21,000,000 Egdon Resources 903,000 0.071,325,000 Getech Group 291,500 0.021,508,000 IGas Energy 640,900 0.058,000,000 Jadestone Energy 5,880,000 0.46
11,700,000 Serica Energy 13,525,200 1.0625,577,485 Serinus Energy 2,557,749 0.202,467,829 Tekmar Group 3,948,526 0.31
224,294,117 UK Oil & Gas 1,345,765 0.11138,775,000 Wameja 9,159,150 0.7211,389,494 Westmount Energy 1,708,424 0.13
Total Oil, Gas and Coal 42,676,643 3.34
OPEN END AND MISCELLANEOUS INVESTMENT VEHICLES (31 July 2019 - Nil)1,458,333 Wilmcote Holdings 29,167 -
Total Open End and Miscellaneous Investment Vehicles 29,167 -
PERSONAL CARE, DRUG AND GROCERY STORES (31 July 2019 - 1.43%)3,241,468 IG Design Group 24,959,304 1.95
Total Personal Care, Drug and Grocery Stores 24,959,304 1.95
PERSONAL GOODS (31 July 2019 - 0.36%)1,060,000 Brand Architekts Group 1,590,000 0.121,000,000 Warpaint London 780,000 0.06
Total Personal Goods 2,370,000 0.18
PHARMACEUTICALS AND BIOTECHNOLOGY (31 July 2019 - 4.94%)14,285,714 Agronomics 1,107,143 0.09
245,000 Bioventix 9,481,500 0.746,654,531 C4X Discovery Holdings 831,816 0.06
845,000 Clinigen Group 8,196,500 0.641,513,328 Destiny Pharma 575,065 0.041,439,666 ECO Animal Health Group 3,714,338 0.295,000,000 Horizon Discovery Group 7,630,000 0.602,393,000 MaxCyte 3,733,080 0.29
882,350 MaxCyte 'Reg S' 1,323,525 0.101,410,000 Mereo BioPharma Group 'Reg S' 366,600 0.03
635,000 Oxford BioMedica 3,810,000 0.305,500,000 PureTech Health 17,160,000 1.342,075,000 Verona Pharma 1,099,750 0.09
Total Pharmaceuticals and Biotechnology 59,029,317 4.61
PRECIOUS METALS AND MINING (31 July 2019 - 2.12%)5,250,000 Highland Gold Mining 11,119,500 0.87
136,350,000 Jubilee Metals Group 5,249,475 0.4137,935,000 Pan African Resources 4,802,571 0.38
100,000,000 Petropavlovsk 18,060,000 1.41450,000 Polymetal International 5,780,250 0.45500,000 Sylvania Platinum 197,500 0.02
Total Precious Metals and Mining 45,209,296 3.54
REAL ESTATE INVESTMENT AND SERVICES (31 July 2019 - 0.05%)1,115,000 Boot (Henry) 3,634,900 0.28
Total Real Estate Investment and Services 3,634,900 0.28
REAL ESTATE INVESTMENT TRUSTS (31 July 2019 - 0.39%)2,825,728 Regional REIT 3,289,147 0.26
Total Real Estate Investment Trusts 3,289,147 0.26
10
MARLBOROUGH UK MICRO-CAP GROWTH FUND
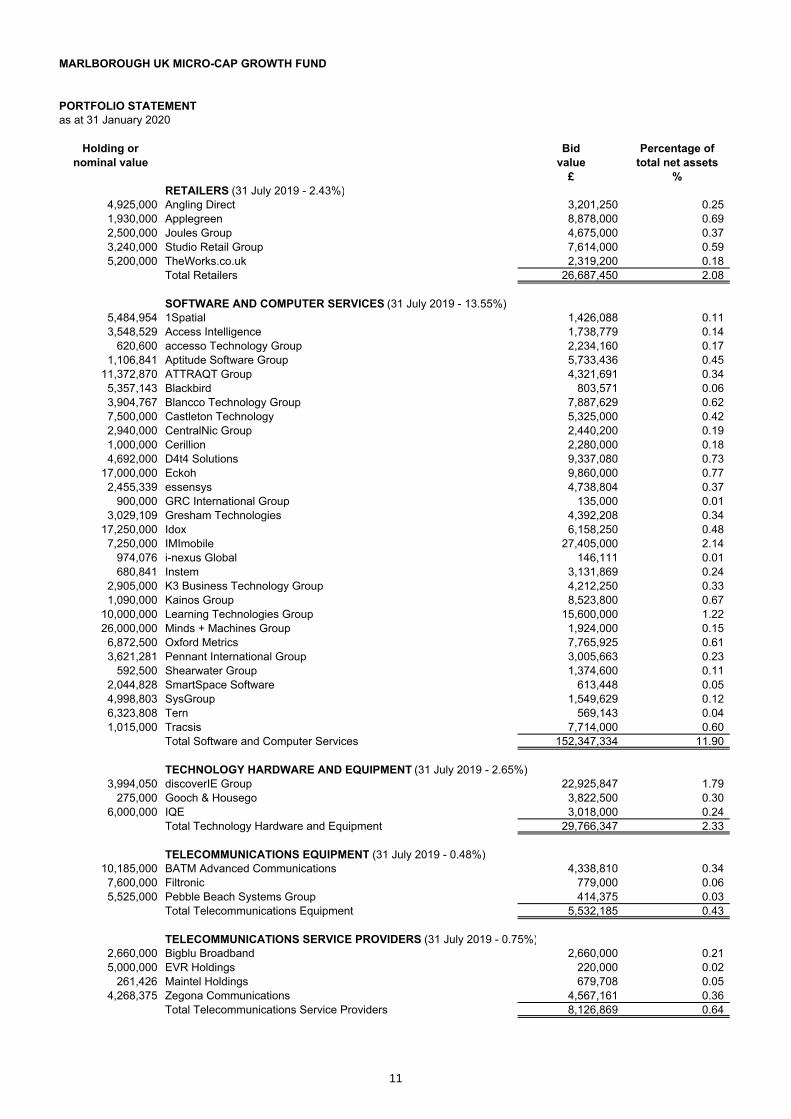
PORTFOLIO STATEMENTas at 31 January 2020
Holding or Bid Percentage ofnominal value value total net assets
£ %RETAILERS (31 July 2019 - 2.43%)
4,925,000 Angling Direct 3,201,250 0.251,930,000 Applegreen 8,878,000 0.692,500,000 Joules Group 4,675,000 0.373,240,000 Studio Retail Group 7,614,000 0.595,200,000 TheWorks.co.uk 2,319,200 0.18
Total Retailers 26,687,450 2.08
SOFTWARE AND COMPUTER SERVICES (31 July 2019 - 13.55%)5,484,954 1Spatial 1,426,088 0.113,548,529 Access Intelligence 1,738,779 0.14
620,600 accesso Technology Group 2,234,160 0.171,106,841 Aptitude Software Group 5,733,436 0.45
11,372,870 ATTRAQT Group 4,321,691 0.345,357,143 Blackbird 803,571 0.063,904,767 Blancco Technology Group 7,887,629 0.627,500,000 Castleton Technology 5,325,000 0.422,940,000 CentralNic Group 2,440,200 0.191,000,000 Cerillion 2,280,000 0.184,692,000 D4t4 Solutions 9,337,080 0.73
17,000,000 Eckoh 9,860,000 0.772,455,339 essensys 4,738,804 0.37
900,000 GRC International Group 135,000 0.013,029,109 Gresham Technologies 4,392,208 0.34
17,250,000 Idox 6,158,250 0.487,250,000 IMImobile 27,405,000 2.14
974,076 i-nexus Global 146,111 0.01680,841 Instem 3,131,869 0.24
2,905,000 K3 Business Technology Group 4,212,250 0.331,090,000 Kainos Group 8,523,800 0.67
10,000,000 Learning Technologies Group 15,600,000 1.2226,000,000 Minds + Machines Group 1,924,000 0.156,872,500 Oxford Metrics 7,765,925 0.613,621,281 Pennant International Group 3,005,663 0.23
592,500 Shearwater Group 1,374,600 0.112,044,828 SmartSpace Software 613,448 0.054,998,803 SysGroup 1,549,629 0.126,323,808 Tern 569,143 0.041,015,000 Tracsis 7,714,000 0.60
Total Software and Computer Services 152,347,334 11.90
TECHNOLOGY HARDWARE AND EQUIPMENT (31 July 2019 - 2.65%)3,994,050 discoverIE Group 22,925,847 1.79
275,000 Gooch & Housego 3,822,500 0.306,000,000 IQE 3,018,000 0.24
Total Technology Hardware and Equipment 29,766,347 2.33
TELECOMMUNICATIONS EQUIPMENT (31 July 2019 - 0.48%)10,185,000 BATM Advanced Communications 4,338,810 0.347,600,000 Filtronic 779,000 0.065,525,000 Pebble Beach Systems Group 414,375 0.03
Total Telecommunications Equipment 5,532,185 0.43
TELECOMMUNICATIONS SERVICE PROVIDERS (31 July 2019 - 0.75%)2,660,000 Bigblu Broadband 2,660,000 0.215,000,000 EVR Holdings 220,000 0.02
261,426 Maintel Holdings 679,708 0.054,268,375 Zegona Communications 4,567,161 0.36
Total Telecommunications Service Providers 8,126,869 0.64
11

MARLBOROUGH UK MICRO-CAP GROWTH FUND
PORTFOLIO STATEMENTas at 31 January 2020
Holding or Bid Percentage ofnominal value value total net assets
£ %TRAVEL AND LEISURE (31 July 2019 - 4.70%)
1,910,000 Cake Box Holdings 3,304,300 0.2617,931,747 DP Poland 1,344,881 0.112,374,352 Escape Hunt 332,409 0.03
425,000 Gamesys Group 3,111,000 0.241,966,825 Hollywood Bowl Group 5,782,466 0.455,000,000 Loungers 12,750,000 1.001,000,000 On the Beach Group 3,926,000 0.312,142,550 Ten Entertainment Group 6,663,331 0.521,300,000 Ten Lifestyle Group 1,664,000 0.131,576,232 The City Pub Group 2,868,742 0.22
14,185,850 The Fulham Shore 1,560,444 0.12Total Travel and Leisure 43,307,573 3.39
WASTE AND DISPOSAL SERVICES (31 July 2019 - 0.99%)10,750,000 Augean 20,425,000 1.60
Total Waste and Disposal Services 20,425,000 1.60
OVERSEAS SECURITIES (31 July 2019 - 2.47%)1,400,000 Dalata Hotel Group 5,432,767 0.426,337,500 Foran Mining 948,424 0.075,800,000 Global Atomic (Restricted Line) 1,552,360 0.12
20,000,000 Nevada Copper 3,511,084 0.275,525,000 Summit Properties 6,596,932 0.52
300,000 Tecogen 470,821 0.041,940,700 Titan Mining 284,846 0.02
584,958 TMT Investments 1,738,029 0.14Total Overseas Securities 20,535,263 1.60
UNQUOTED SECURITIES (31 July 2019 - 2.08%)7,937,506 Albert Technologies 396,875 0.031,891,500 Constellation Healthcare Technologies Promissory Notes - -
500,000 Conviviality - -3,311,071 Crawshaw Group - -3,575,000 Gable Holdings - -4,153,087 HaloSource - -
15,917,167 HaloSource 'Reg S' - -17,829 Infinity Reliance 511,336 0.04
360,000 Lamaune Iron - -86,666,667 Landore Resources Warrants - -5,395,683 London Capital Group Warrants - -
14,479,166 Moxico Resources 3,475,000 0.272,040,000 Normandy 142,800 0.011,850,000 Norseman Gold - -6,999,000 Okullo - -
6,830 Oxford Genetics 2,185,600 0.173,490,856 Patisserie Holdings - -
540,500 Quadrise Fuels International Warrants - -252,165 SCA Investments 13,362,223 1.04919,886 Serinus Energy Warrants - -
45,333,000 Snoozebox Holdings - -13,896 Vanoil Energy - -
425,618 Verona Pharma Warrants - -Total Unquoted Securities 20,073,834 1.56
Portfolio of investments 1,252,125,332 97.80Net current assets 28,226,896 2.20Total net assets 1,280,352,228 100.00
12

MARLBOROUGH UK MICRO-CAP GROWTH FUND
PORTFOLIO STATEMENTas at 31 January 2020
Constellation Healthcare Technologies Promissory Notes are unlisted and valued at the expected redemption proceeds.Conviviality is in administration and valued at zero until further information is received.Crawshaw Group is in administration and valued at zero until further information is received.Gable Holdings is delisted and valued at zero until further information is received. HaloSource is delisted and valued at zero until further information is received.HaloSource 'Reg S' is delisted and valued at zero until further information is received.Infinity Reliance is unlisted and is being valued using the latest information received on the company.Lamaune Iron is valued at zero, based on the latest reports from the company . Moxico Resources is being valued based on the latest placement allocation.
Norseman Gold is in voluntary liquidation and deemed to be valueless.Okullo is delisted and valued at zero, based on the latest information received. Oxford Genetics is being valued at cost until the shares are listed.Patisserie Holdings is in administration and valued at zero until further information is received.SCA Investments is a private company being valued, based on the price of the share placing in August 2018.Snoozebox Holdings is in liquidation and valued at zero until further information is received.Vanoil Energy is suspended and valued at zero until further information is received.All holdings of warrants have been valued at the exercise price less the price of the underlying ordinary shares.
PORTFOLIO TRANSACTIONSfor the six month period ended 31 January 2020 £
Total purchases costs, including transaction charges 102,648,303
Total sales proceeds, net of transaction charges 189,005,287
Normandy shares were received instead of a cash dividend from Impellam and are being priced at the dividend amount untilfurther information is received.
Albert Technologies is delisted and is being valued at a discount, based on the volume of shares being traded off-market andthe volumes the Fund would be looking to trade in.
13
MARLBOROUGH UK MICRO-CAP GROWTH FUND
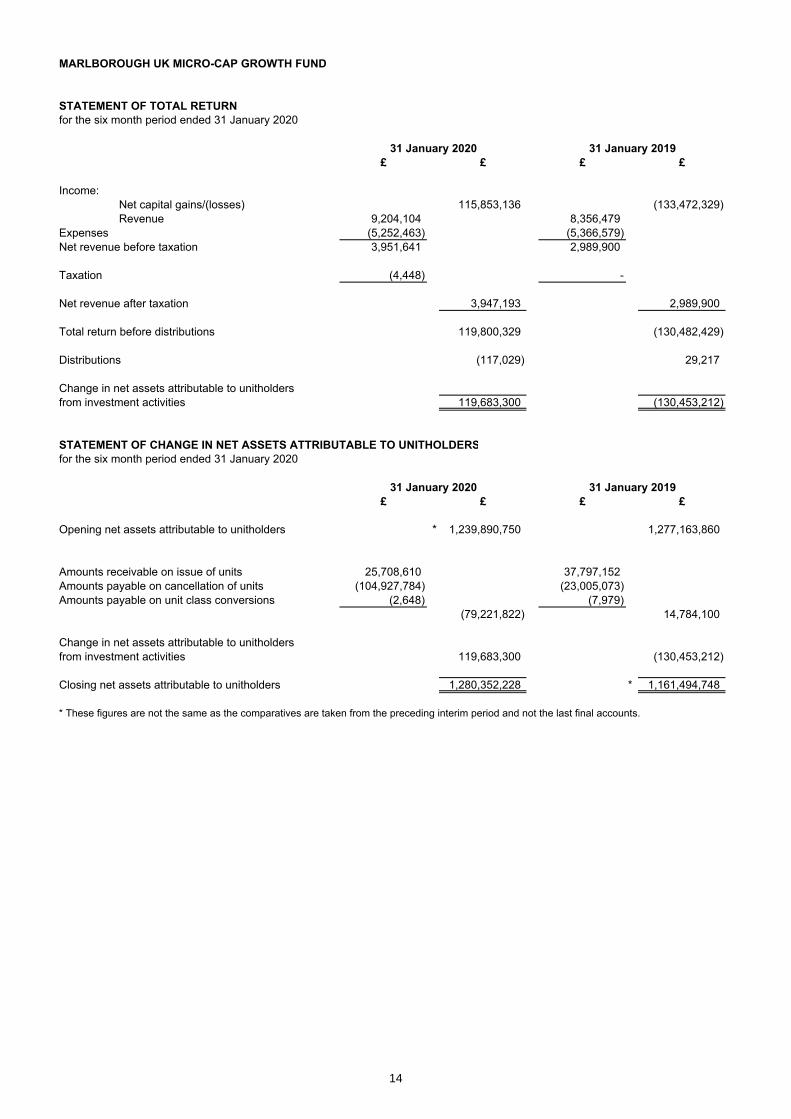
STATEMENT OF TOTAL RETURNfor the six month period ended 31 January 2020
31 January 2020 31 January 2019£ £ £ £
Income:Net capital gains/(losses) 115,853,136 (133,472,329)Revenue 9,204,104 8,356,479
Expenses (5,252,463) (5,366,579)Net revenue before taxation 3,951,641 2,989,900
Taxation (4,448) -
Net revenue after taxation 3,947,193 2,989,900
Total return before distributions 119,800,329 (130,482,429)
Distributions (117,029) 29,217
Change in net assets attributable to unitholders from investment activities 119,683,300 (130,453,212)
STATEMENT OF CHANGE IN NET ASSETS ATTRIBUTABLE TO UNITHOLDERSfor the six month period ended 31 January 2020
31 January 2020 31 January 2019£ £ £ £
Opening net assets attributable to unitholders * 1,239,890,750 1,277,163,860
Amounts receivable on issue of units 25,708,610 37,797,152Amounts payable on cancellation of units (104,927,784) (23,005,073)Amounts payable on unit class conversions (2,648) (7,979)
(79,221,822) 14,784,100
Change in net assets attributable to unitholders from investment activities 119,683,300 (130,453,212)
Closing net assets attributable to unitholders 1,280,352,228 * 1,161,494,748
* These figures are not the same as the comparatives are taken from the preceding interim period and not the last final accounts.
14

MARLBOROUGH UK MICRO-CAP GROWTH FUND
BALANCE SHEETas at 31 January 2020
31 January 2020 31 July 2019£ £
Assets:Fixed Assets:Investments 1,252,125,332 1,222,607,167
Current Assets:Debtors 11,340,481 5,198,404Cash and bank balances 22,430,708 15,496,308Total assets 1,285,896,521 1,243,301,879
Liabilities:Creditors:Bank overdraft 4 -Other creditors 5,544,289 3,411,129Total liabilities 5,544,293 3,411,129
Net assets attributable to unitholders 1,280,352,228 1,239,890,750
NOTES TO THE INTERIM FINANCIAL STATEMENTSfor the six month period ended 31 January 2020
Basis for preparation
Accounting policies
The interim financial statements have been prepared in compliance with FRS102 and in accordance with the Statement ofRecommended Practice for UK Authorised Funds issued by The Investment Association in May 2014.
The interim financial statements are prepared in sterling, which is the functional currency of the Fund. Monetary amounts inthese financial statements are rounded to the nearest pound.
The interim financial statements have been prepared on the historical cost convention, modified to include the revaluation ofinvestments and certain financial instruments at fair value.
The accounting policies applied are consistent with those of the annual financial statements for the year ended 31 July 2019and are described in those annual financial statements.
The investments of the Fund have been valued at their fair value at 12 noon on 31 January 2020.
15

Marlborough Fund Managers LtdMarlborough House,59 Chorley New Road,Bolton BL1 4QP
Investor Support: 0808 145 2500 (FREEPHONE)Dealing: 0808 145 2501 (FREEPHONE)Fax: 01204 533045
Email: [email protected]: www.marlboroughfunds.com
Marlborough Fund Managers Ltd. Registered in England No. 2061177Authorised and regulated by the Financial Conduct Authority and a member of The Investment Association