marlborough public schools comprehensive review october 15 ... · web viewin july 2018,...
TRANSCRIPT

District Review Report Marlborough Public Schools
Comprehensive review conducted
October 15–18, 2018
Office of District Reviews and Monitoring
Massachusetts Department of Elementary and Secondary Education
Organization of this Report
Executive Summary.....................................................................................................................................1
Marlborough Public Schools District Review Overview...............................................................................6
Leadership and Governance......................................................................................................................18
Curriculum and Instruction........................................................................................................................23
Assessment................................................................................................................................................35
Human Resources and Professional Development....................................................................................43
Student Support........................................................................................................................................50
Financial and Asset Management..............................................................................................................60
Appendix A: Review Team, Activities, Schedule, Site Visit.........................................................................68
Appendix B: Enrollment, Attendance, Expenditures..................................................................................71
Appendix C: Instructional Inventory..........................................................................................................75
Massachusetts Department of Elementary and Secondary Education
75 Pleasant Street, Malden, MA 02148-4906Phone 781-338-3000 TTY: N.E.T. Replay 800-439-2370www.doe.mass.edu

Marlborough Public Schools Comprehensive District Review
This document was prepared by the Massachusetts Department of Elementary and Secondary Education
Jeffrey C. Riley Commissioner
Published January 2019
The Massachusetts Department of Elementary and Secondary Education, an affirmative action employer, is committed to ensuring that all of its programs and facilities are accessible to all members of
the public. We do not discriminate on the basis of age, color, disability, national origin, race, religion, sex, gender identity, or sexual orientation. Inquiries regarding the Department’s compliance with Title IX
and other civil rights laws may be directed to the Human Resources Director, 75 Pleasant St., Malden, MA 02148-4906. Phone: 781-338-6105.
© 2019 Massachusetts Department of Elementary and Secondary Education
Permission is hereby granted to copy any or all parts of this document for non-commercial educational purposes. Please credit the “Massachusetts Department of Elementary and Secondary Education.”
This document printed on recycled paper
Massachusetts Department of Elementary and Secondary Education75 Pleasant Street, Malden, MA 02148-4906
Phone 781-338-3000 TTY: N.E.T. Relay 800-439-2370www.doe.mass.edu

Marlborough Public Schools Comprehensive District Review
Executive Summary
In July 2018, Marlborough welcomed a new superintendent who had served as the district’s director of finance and operations for the previous four and a half years. He is the seventh superintendent to lead the district in ten years and already has key support from the school committee and city leaders. The assistant superintendent for teaching and learning, five of six principals, and several directors and supervisors also recently assumed their leadership roles. Almost all were promoted from within the district, providing some continuity to a shifting leadership base. In addition, in 2018–2019 the district created new teacher leader roles for all schools, to develop more leadership from within and to assign selected teachers the responsibility to work collaboratively with colleagues at identifying and solving teaching and learning problems in professional learning communities (PLCs). The vision for improvement is present in the district and the new superintendent is refining it using a communitywide collaborative process.
The city of Marlborough has made a commitment to improve its public schools and has affirmed that strong public education helps ensure a more viable community. Impetus for this support derives partly from an effort of the Marlborough Economic Development Corporation (MEDC). Critical support for the school system also comes from city hall. School district and city leaders work well and collaboratively to ensure that the schools have the resources, facilities, and support to achieve their goals. For example, in 2017–2018 the city funded the schools at 36.4 percent above required net school spending level. It has also approved funding for a new elementary school to open in 2020 using its bonding capacity and MSBA support without the need for an override vote.
Although enrollment in the Marlborough Public Schools has remained steady at approximately 4,500 students since 2014, the student population has changed in recent years. In 2013–2014, the student body was 36.5 percent Hispanic and 54.7 percent white. In 2017–2018, the district student body was 46.8 percent Hispanic and 43.4 percent white. Between 2014 and 2018, the percentage of high needs students1 remained relatively steady: 57.5 percent in 2013–2014 and 58.4 percent in 2017–2018. However, between 2014 and 2018 the distribution of other student groups changed: the percentage of students whose first language is not English increased from 34.3 percent in 2014 to 46.8 percent in 2018 and the English learner population grew from 14.5 percent in 2014 to 24.1 percent in 2018. Between 2015 and 2018, the percentage of economically disadvantaged students2 increased from 25.2 percent in 2015 to 35.8 percent in 2018. Between 2014 and 2018, the percentage of students with disabilities decreased from 19.1 percent in 2014 to 17.2 percent in 2018. The district has increased staffing and programs to accommodate the needs of its changing population but has not created a proactive approach and coherent system to meet the needs of all students.
Marlborough High School, which is rated in the 20th percentile of high schools in the state, is in need of focused targeted support. The rest of the district’s schools are meeting or partially meeting
1 Students in the high needs group are in one or more of the following student groups: economically disadvantaged students, students with disabilities, and English learners (ELs) or former ELs.2 In 2014–2015, “economically disadvantaged,” based on direct certification by Health and Human services, replaced “low-income,” based on family income self-reporting for the federal lunch program.
1

Marlborough Public Schools Comprehensive District Review
performance targets. In both ELA and math, the percentage of students meeting or exceeding expectations on the Next-Generation MCAS assessment was below the state rate in grades 3 through 8 as were high school results on the grade 10 MCAS assessment. Between 2015 and 2018, science proficiency for grades 5, 8, and 10 declined and in 2018 was below the state rate.
Instruction
The team observed 107 classes throughout the district: 35 at the high school, 25 at the middle school, and 47 at the 3 elementary schools. The team observed 48 ELA classes, 33 mathematics classes, 15 science classes, and 10 classes in other subject areas. Among the classes observed were four EL (English learner) classes, three STEM (science, technology, engineering, and math) classes, and one music class. The observations were approximately 20 minutes in length. All review team members collected data using DESE’s Instructional Inventory, a tool for recording observed characteristics of standards-based teaching. This data is presented in Appendix C.
In a large majority of observed classes, classroom climate was conducive to teaching and learning and positive classroom routines and supports were in place to ensure that students behaved appropriately and attended to learning. While the quality of instruction has improved since the Department of Elementary and Secondary Education’s (ESE’s) 2013 review of the district, it varied across the district with a generally slightly higher incidence of effective practices observed at the elementary level than at the middle- and high-school levels. This was particularly evident in the use of appropriate classroom activities well matched to learning objectives and in the frequency of checks for student understanding followed by feedback to students and adjustments to teaching. In only 49 percent of observed classes did review team members see sufficient and compelling evidence of students working on challenging and rigorous tasks requiring the use of higher-order thinking. In addition, in only 39 percent of observed classrooms did team members see sufficient and compelling evidence that teachers use a variety of instructional strategies.
In observed classrooms, there were wide variations in how well students engaged in high-quality instruction that reflected a rich curriculum supported by leaning targets, success criteria, and rigor. Learning experiences for the most part were teacher centered with limited student involvement and few evidence-based strategies to inform instruction to meet students’ learning needs, skill levels, interests, or levels of readiness.
Strengths
2
Marlborough Public Schools Comprehensive District Review
• District leaders and city officials are building a collaborative culture to continue to strengthen the district and provide greater leadership stability.
• The district has adopted one K–5 math and two K–5 ELA programs, developed curriculum pacing guides aligned with the 2017 Massachusetts Curriculum Frameworks, and implemented the programs consistently in its elementary schools.
• In observed classrooms across the district, student behavior and classroom climate were conducive to teaching and learning.
• The district supports the consistent administration of a variety of assessments that provide actionable information to support all students in making progress toward achieving state standards.
• The district has established teacher-led Professional Learning Communities, data teams, and teacher leaders at every school to support systematic improvements to student learning, curriculum, instruction, and assessment.
• The district has made a commitment to recruit and retain highly qualified teachers and administrators from current staff as well as from external sources.
• The district has prioritized the physical and emotional safety of all students. It supports schools to foster safe, positive, inclusive, and welcoming learning environments.
• The district is well funded by the city, and it has made it a priority to use its funds effectively to improve students’ performance, opportunities, and outcomes.
• The city and the district ensure that school facilities are clean, safe, and conducive to learning, and are constructing a new elementary school to alleviate overcrowding. They are planning effectively for financing and implementing needed improvements of facilities and technology.
Challenges and Areas for Growth
• The district does not set measurable goals based on an analysis of historical, longitudinal, and
current disaggregated student achievement data in its planning documents.
The district’s curricula for ELA in grades 6-–12, math in grades 6–8, and science and social studies K–12 are incomplete. The district does not have a curriculum mapping model or a systematic process to monitor, review, and revise curriculum.
In observed classrooms across the district, the quality of instruction was inconsistent.
• There is an absence of clarity about the role and responsibilities of teacher leaders and principals in professional learning communities, and inconsistent use of collaborative inquiry protocols.
3

Marlborough Public Schools Comprehensive District Review
• The district’s educator evaluation system does not prioritize opportunities for educators to receive high-quality feedback3 that helps them improve their practice and does not systematically include evidence of educators’ impact on student learning.
• The district has not developed a professional development program that is informed by student performance and outcome data and is sufficiently aligned with areas of need identified by teachers.
• The district has not created a proactive approach and coherent system to meet the needs of all students.
• The district’s policies and practices are not sufficiently improving high chronic absence in grades 9–12 (see Table 29 in the Student Performance section, the Contextual Background in the Student Support standard, and Table B2b in Appendix B).
• The district has not fully established a strong, collaborative family partnership.
• The district’s budget document does not clearly detail how funds and staffing are allocated to schools and programs. The document is linked only to one district goal; it does not contain references to student performance data. The budget document does not summarize anticipated grants and other revolving funds.
• The district and the city do not have a formal written agreement about how municipal expenditures are provided to the district.
Recommendations
• The district should ensure that its planning documents have clear goals that are based on an analysis of historical, longitudinal, and current disaggregated student data.
• The district should complete as soon as possible its K–12 ELA, math, science, and social studies curricula. It should ensure that curricula are high quality, comprehensive, aligned with appropriate standards and aligned vertically between contiguous grades and horizontally across grades and schools. The district should develop and implement an ongoing process for reviewing and revising curriculum.
The elementary science committee, with guidance from district leaders, should ensure that all K-5 science teachers have access to high-quality, standards-aligned curricular materials and the support they need to use those materials consistently and skillfully.
• The district should ensure that all teachers provide effective instruction that challenges and supports all students.
3 High-quality feedback is specific, timely, and actionable.
4

Marlborough Public Schools Comprehensive District Review
• The district should clarify the roles and responsibilities of teacher leaders and principals in PLCs, and establish and articulate expectations for the use of data analysis protocols.
• The district should promote educators’ growth by fully implementing all components of the educator evaluation system, with a particular emphasis on ensuring that all educators receive high-quality feedback and reflect on their impact on student learning.
• The district’s professional development systems should be informed by data and aligned with teachers’ goals.
• The district should develop and implement a districtwide system to identify at-risk students using assessment data, provide multi-tiered academic interventions, and employ ongoing progress monitoring to meet the needs of all students.
• The district should review its efforts to improve student attendance and adjust efforts as needed.
• The district should enhance its current practices to strengthen collaborative relationships with families.
• The district should develop a budget document that is clear, comprehensive, and details how the budget supports district and school goals, how much schools and programs cost, and how outside funds are used.
• In compliance with 603 CMR 10.5, the district and the city should formalize in writing their agreement on municipal expenditures that are provided to the district.
5

Marlborough Public Schools Comprehensive District Review
Marlborough Public Schools District Review Overview
Purpose
Conducted under Chapter 15, Section 55A of the Massachusetts General Laws, comprehensive district reviews support local school districts in establishing or strengthening a cycle of continuous improvement. Reviews consider carefully the effectiveness of systemwide functions, with reference to the six district standards used by the Department of Elementary and Secondary Education (DESE): Leadership and Governance, Curriculum and Instruction, Assessment, Human Resources and Professional Development, Student Support, and Financial and Asset Management. Reviews identify systems and practices that may be impeding improvement as well as those most likely to be contributing to positive results. In addition to providing information to each district reviewed, ESE uses review reports to identify resources and/or technical assistance to provide to the district.
Methodology
Reviews collect evidence for each of the six district standards above. A district review team consisting of independent consultants with expertise in each of the district standards reviews documentation, data, and reports for two days before conducting a four-day district visit that includes visits to individual schools. The team conducts interviews and focus group sessions with such stakeholders as school committee members, teachers’ association representatives, administrators, teachers, students, and students’ families. Team members also observe classroom instruction. Subsequent to the onsite review, the team meets for two days to develop findings and recommendations before submitting a draft report to ESE. ESE edits and fact-checks the draft report and sends it to the district for factual review before publishing it on the ESE website.
Site Visit
The site visit to the Marlborough Public Schools was conducted from October 15–18, 2018. The site visit included 34 hours of interviews and focus groups with approximately 73 stakeholders, including school committee members, district administrators, school staff, students, students’ families, and teachers’ association representatives. The review team conducted three focus groups with two elementary-school teachers, four middle-school teachers, and one high-school teacher, respectively.
A list of review team members, information about review activities, and the site visit schedule are in Appendix A and Appendix B provides information about enrollment, attendance, and expenditures. The team observed classroom instruction in 107 classrooms in 5 schools. The review team collected data using DESE’s Instructional Inventory, a tool for recording observed characteristics of standards-based teaching. This data is contained in Appendix C.
6

Marlborough Public Schools Comprehensive District Review
District Profile
Marlborough has a mayoral form of government and the chair of the school committee is the mayor. The seven members of the school committee meet twice monthly.
The current superintendent has been in the position since July 1, 2018. The district leadership team includes the superintendent, the assistant superintendent of teaching and learning, the director of English language education, the director of student services, the director of human resources, the director of finance and operations, the director of information technology, the director of instructional technology, the supervisor of counseling services, and the facilities manager. The number of central office positions has been mostly stable in recent years, although several new leaders have been appointed. The district has five principals leading five schools and a director leads the early childhood center. Other school administrators include 7 assistant principals, the assistant director of special education, the assistant director of English language education, grades 6–12 supervisors in humanities, science, engineering, and math, and K–12 supervisors in visual arts, music, and wellness. In the 2017–2018 school year, there were 387 teachers in the district.
In the 2017–2018 school year, 4,575 students were enrolled in the district’s 6 schools:
Table 1: Marlborough Public Schools, Type, Grades Served, and Enrollment*, 2017–2018
School Type Grades Served Enrollment
Early Childhood Center Pre-K Pre-K 174
Sgt. Charles J. Jaworek Elementary School ES K–4 761
Francis J. Kane Elementary School ES K–4 618
Raymond C. Richer Elementary School ES K–4 604
1st Lt. Charles W. Whitcomb School MS 5–8 1,308
Marlborough High School** HS 9–12 1,110
Totals 6 schools Pre-K–12 4,575
* As of October 1, 2017
** Enrollment includes students enrolled in the Alternative High School program at the Hildreth School. In the 2018–2019 school year, 52 students are enrolled.
Between 2014 and 2018 overall student enrollment increased by 0.9 percent (from 4,535 in 2014 to 4,575 in 2018). Enrollment figures by race/ethnicity and high needs populations (i.e., students with
7
Marlborough Public Schools Comprehensive District Review
disabilities, economically disadvantaged students, and English learners (ELs) and former ELs) as compared with the state are provided in Tables B1a and B1b in Appendix B.
The total in-district per-pupil expenditure was higher than the median in-district per-pupil expenditure for 19 K–12 districts of similar size (4,000–4,999 students) in fiscal year 2017: $16,324 as compared with $13,045 (see District Analysis and Review Tool Detail: Staffing & Finance ). Actual net school spending has been well above what is required by the Chapter 70 state education aid program, as shown in Table B3 in Appendix B.
Student Performance
Note: The Next-Generation MCAS assessment is administered to grades 3–8 in English language arts (ELA) and mathematics; it was administered for the first time in 2017. (For more information, see http://www.doe.mass.edu/mcas/parents/results-faq.html.) The MCAS is administered to grades 5 and 8 in science and to grade 10 in ELA, math, and science. Data from the two assessments are presented separately because the tests are different and cannot be compared.
Table 2: Marlborough Public SchoolsAccountability Percentile, Criterion Reference Target (CRT) Percentage, Reason for Classification
School Accountability Percentile
CRT Percentage
Overall Classification
Reason For Classification
Early Childhood Center -- -- -- --Kane 37 70% Not requiring
assistance or intervention
Partially meeting targets
Richer 53 92% Not requiring assistance or intervention
Meeting targets
Jaworek 38 79% Not requiring assistance or intervention
Meeting targets
Whitcomb 25 65% Not requiring assistance or intervention
Partially meeting targets
Marlborough High 20 31% Requiring assistance or intervention
In need of focused/targeted support: Low participation rate
for students with disabilitiesMarlborough 60% Not requiring
assistance or intervention
Partially meeting targets
8

Marlborough Public Schools Comprehensive District Review
Table 3: Marlborough Public SchoolsNext-Generation MCAS ELA Scaled Scores Grades 3–8, 2017–2018
Group N (2018) 2017 2018 Change State (2018)
Above/Below
African American/Black 78 487.7 487.1 -0.6 490.3 -3.2Asian 53 509.5 510.7 1.2 511.6 -0.9Hispanic or Latino 1,018 485.3 486.9 1.6 489.7 -2.8Multi-Race 71 497.2 501.0 3.8 502.8 -1.8White 879 496.8 500.7 3.9 504.2 -3.5High Needs 1,331 482.9 486.1 3.2 490.1 -4.0Econ. Dis. 910 483.6 486.7 3.1 490.2 -3.5SWD 380 470.3 473.5 3.2 480.8 -7.3EL 742 480.3 483.8 3.5 488.4 -4.6All 2,100 491.7 493.8 2.1 500.5 -6.7Next Generation MCAS Achievement Levels: 440–470 Not Meeting Expectations; 470–500 Partially Meeting Expectations; 500–530 Meeting Expectations; 530-–560 Exceeding Expectations
Table 4: Marlborough Public SchoolsNext-Generation MCAS Math Scaled Scores Grades 3–8, 2017–2018
Group N (2018) 2017 2018 Change State (2018) Above/BelowAfrican American/Black
77 486.7 485.3 -1.4 486.9 -1.6
Asian 53 511.8 515.1 3.3 514.3 0.8Hispanic or Latino
1,016 485.3 487.2 1.9 487.4 -0.2
Multi-Race 70 493.3 496.3 3.0 499.7 -3.4White 878 497.0 498.3 1.3 501.8 -3.5High Needs 1,327 482.3 485.4 3.1 488.2 -2.8Econ. Dis. 906 483.4 485.6 2.2 487.7 -2.1SWD 378 468.5 470.2 1.7 479.2 -9.0EL 741 481.3 485.1 3.8 488.5 -3.4All 2,095 491.6 492.8 1.2 498.4 -5.6Next Generation MCAS Achievement Levels: 440–470 Not Meeting Expectations; 470–500 Partially Meeting Expectations; 500–530 Meeting Expectations; 530–560 Exceeding Expectations
9

Marlborough Public Schools Comprehensive District Review
Table 5: Marlborough Public SchoolsNext-Generation MCAS ELA Percent Meeting or Exceeding Expectations Grades 3–8, 2017-2018
Group N (2018) 2017 2018 Change State (2018)
Above/Below
African American/Black
78 33% 28% -5 31% -3
Asian 53 75% 66% -9 71% -5Hispanic or Latino
1,018 24% 30% 6 31% -1
Multi-Race 71 42% 56% 14 54% 2White 879 45% 49% 4 58% -9High Needs 1,331 20% 27% 7 31% -4Econ. Dis. 910 21% 27% 6 32% -5SWD 380 6% 7% 1 14% -7EL 742 16% 25% 9 30% -5All 2,100 36% 40% 4 51% -11
Table 6: Marlborough Public SchoolsNext-Generation MCAS Math Percent Meeting or Exceeding Expectations Grades 3–8, 2017–2018
Group N (2018) 2017 2018 Change State (2018)
Above/Below
African American/Black
77 32% 25% -7 26% -1
Asian 53 79% 75% -4 74% 1Hispanic or Latino
1,016 24% 26% 2 27% -1
Multi-Race 70 41% 41% 0 49% -8White 878 46% 48% 2 55% -7High Needs 1,327 19% 24% 5 28% -4Econ. Dis. 906 20% 24% 4 27% -3SWD 378 5% 6% 1 14% -8EL 741 18% 22% 4 30% -8All 2,095 36% 37% 1 48% -11
Table 7: Marlborough Public SchoolsMCAS ELA Percent Scoring Proficient or Advanced in Grade 10, 2017–2018
Group N (2018) 2017 2018 Change State (2018) Above/BelowAfrican American/Black
9 -- -- -- 85% --
Asian 7 -- -- -- 95% --Hispanic or Latino
119 81% 79% -2 78% 1
Multi-Race 3 -- -- -- 93% --White 115 90% 93% 3 94% -1High Needs 134 70% 73% 3 79% -6Econ. Dis. 89 77% 76% -1 81% -5SWD 33 43% 52% 9 69% -17EL 57 52% 63% 11 64% -1
10
Marlborough Public Schools Comprehensive District Review
Table 7: Marlborough Public SchoolsMCAS ELA Percent Scoring Proficient or Advanced in Grade 10, 2017–2018
All 254 86% 86% 0 91% -5
Table 8: Marlborough Public SchoolsMCAS Math Percent Scoring Proficient or Advanced in Grade 10, 2017–2018
Group N (2018) 2017 2018 Change State (2018) Above/BelowAfrican American/Black
8 -- -- -- 60% --
Asian 7 -- -- -- 91% --Hispanic or Latino
118 51% 56% 5 56% 0
Multi-Race 3 -- -- -- 79% --White 111 79% 82% 3 85% -3High Needs 130 38% 46% 8 57% -11Econ. Dis. 85 48% 53% 5 59% -6SWD 29 13% 14% 1 40% -26EL 57 10% 35% 25 44% -9All 248 67% 69% 2 78% -9
Table 9: Marlborough Public SchoolsMCAS Science Percent Scoring Proficient or Advanced in Grades 5, 8, and 10, 2015–2018
Group N (2018) 2015 2016 2017 2018 4-yr change State (2018)
African American/Black
32 37% 58% 39% 25% -12 30%
Asian 21 68% 76% 80% 62% -6 68%Hispanic or Latino
409 33% 26% 28% 26% -7 30%
Multi-Race 25 54% 53% 44% 48% -6 54%White 417 55% 57% 54% 55% 0 60%High Needs 538 26% 24% 24% 23% -3 31%Econ. Dis. 373 31% 28% 26% 25% -6 32%SWD 157 13% 13% 8% 7% -6 21%EL 253 14% 14% 16% 17% 3 20%All 905 47% 46% 43% 41% -6 53%
Table 10: Marlborough Public SchoolsNext-Generation MCAS ELA Percent Meeting or Exceeding Expectations in Grades 3–8, 2017–2018
Grade N (2018) 2017 2018 Change State (2018) Above/Below3 395 44% 43% -1 52% -94 400 38% 43% 5 53% -105 400 42% 41% -1 54% -136 295 30% 46% 16 51% -57 315 33% 25% -8 46% -218 295 25% 39% 14 51% -12
3–8 2,100 36% 40% 4 51% -11
11

Marlborough Public Schools Comprehensive District Review
Table 11: Marlborough Public SchoolsNext-Generation MCAS Math Percent Meeting or Exceeding Expectations in Grades 3–8, 2017–2018
Grade N (2018) 2017 2018 Change State (2018) Above/Below3 397 43% 41% -2 50% -94 400 44% 50% 6 48% 25 399 35% 30% -5 46% -166 291 30% 33% 3 47% -147 314 27% 28% 1 46% -188 294 34% 38% 4 50% -12
3–8 2,095 36% 37% 1 48% -11
Table 12: Marlborough Public SchoolsMCAS Science Percent Scoring Proficient or Advanced in Grades 5, 8, and 10, 2015–2018
Grade N (2018) 2015 2016 2017 2018 4-yr change State (2018)
5 399 45% 40% 42% 40% -5 47%8 294 32% 35% 24% 24% -8 35%
10 212 73% 70% 71% 66% -7 74%All 905 47% 46% 43% 41% -6 52%
Table 13: Marlborough Public SchoolsEnglish Language Arts and Math Mean Student Growth Percentile, 2018
ELA MathGrade N (2018) 2018 State N (2018) 2018 State
3 -- -- -- -- -- --4 360 47.1 50.0 361 60.9 50.15 360 48.1 50.1 359 36.9 50.06 258 60.3 50.1 254 54.1 50.07 280 47.0 50.0 280 54.3 50.08 261 55.1 50.0 260 66.8 50.0
10 185 44.8 49.9 182 42.8 49.9
Table 14: Marlborough Public SchoolsNext-Generation MCAS ELA Percent Meeting or Exceeding Expectations by Grade and School, 2018
School 3 4 5 6 7 8 3–8Early Childhood Center -- -- -- -- -- -- --Kane 36% 52% -- -- -- -- 43%Richer 52% 46% -- -- -- -- 49%Jaworek 45% 34% -- -- -- -- 40%Whitcomb -- -- 42% 48% 25% 39% 39%District 43% 43% 41% 46% 25% 39% 40%State 52% 53% 54% 51% 46% 51% 51%
12

Marlborough Public Schools Comprehensive District Review
Table 15: Marlborough Public SchoolsNext-Generation MCAS Math Percent Meeting or Exceeding Expectations by Grade and School, 2018
School 3 4 5 6 7 8 3–8Early Childhood Center -- -- -- -- -- -- --Kane 28% 53% -- -- -- -- 39%Richer 55% 52% -- -- -- -- 53%Jaworek 45% 49% -- -- -- -- 47%Whitcomb -- -- 32% 35% 28% 38% 33%District 41% 50% 30% 33% 28% 38% 37%State 50% 48% 46% 47% 46% 50% 48%
Table 16: Marlborough Public SchoolsMCAS ELA and Math Percent Scoring Proficient or Advanced in Grade 10, 2018
Marlborough High School ELA Math86% 70%
State 91% 78%
Table 17: Marlborough Public SchoolsMCAS Science Percent Scoring Proficient or Advanced by School and Grade, 2018
School 3 4 5 6 7 8 10 TotalEarly Childhood Center -- -- -- -- -- -- -- --Kane -- -- -- -- -- -- -- --Richer -- -- -- -- -- -- -- --Jaworek -- -- -- -- -- -- -- --Whitcomb -- -- 41% -- -- 25% -- 34%Marlborough High -- -- -- -- -- -- 67% 67%District -- -- 40% -- -- 24% 66% 41%State -- -- 47% -- -- 35% 74% 52%
Table 18: Marlborough Public SchoolsNext-Generation MCAS ELA Percent Meeting and Exceeding Expectations by School, 2018
School
All
High N
eeds
Econ. Dis.
SWD
ELs
African Am
erican
Asian
Hispanic
Multi-
race
White
Early Childhood Center -- -- -- -- -- -- -- -- -- --Kane 43% 29% 27% 9% 28% 33% -- 34% 62% 51%Richer 49% 40% 40% 9% 39% -- -- 40% 73% 59%Jaworek 40% 27% 26% 3% 29% -- 64% 27% -- 49%Whitcomb 39% 25% 26% 7% 20% 30% 73% 28% 51% 49%Marlborough 40% 27% 27% 7% 25% 28% 66% 30% 56% 49%State 51% 31% 32% 14% 30% 31% 71% 31% 54% 58%
13

Marlborough Public Schools Comprehensive District Review
Table 19: Marlborough Public SchoolsNext-Generation MCAS Math Percent Meeting and Exceeding Expectations by School, 2018
School
All
High N
eeds
Econ. Dis.
SWD
ELs
African Am
erican
Asian
Hispanic
Multi-
race
White
Early Childhood Center -- -- -- -- -- -- -- -- -- --Kane 39% 28% 25% 15% 23% 17% -- 27% 54% 50%Richer 53% 42% 40% 14% 42% -- -- 46% 55% 66%Jaworek 47% 34% 34% 0% 34% -- 86% 36% -- 53%Whitcomb 33% 18% 19% 4% 15% 25% 77% 21% 33% 46%Marlborough 37% 24% 24% 6% 22% 25% 75% 26% 41% 48%State 48% 28% 27% 14% 30% 26% 74% 27% 49% 55%
Table 20: Marlborough Public SchoolsMCAS ELA and Math Percent Scoring Proficient or Advanced in Grade 10, 2015–2018
ELA MathSchool/Group 2015 2016 2017 2018 4-yr
Change2015 2016 2017 2018 4-yr
ChangeMarlborough High 89% 85% 87% 86% -3 77% 69% 68% 70% -7
African American/Black 80% -- -- -- -- 40% -- -- -- --Asian -- 100% -- -- -- -- 94% -- -- --Hispanic 78% 76% 81% 80% 2 62% 49% 52% 57% -5Multi-race -- -- -- -- -- -- -- -- -- --White 96% 87% 92% 93% -3 87% 77% 82% 84% -3
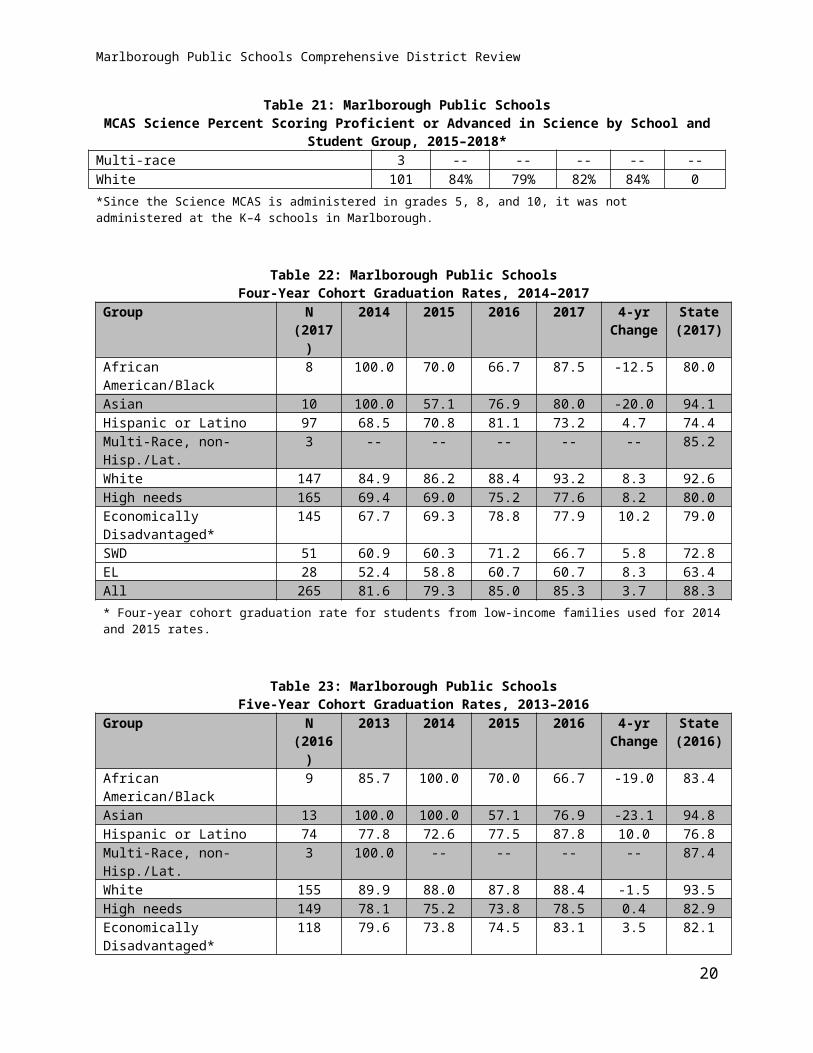
Table 21: Marlborough Public SchoolsMCAS Science Percent Scoring Proficient or Advanced in Science by School and Student Group, 2015–2018*
School/Group N (2018)
2015 2016 2017 2018 4-yr Change
Whitcomb 671 39% 38% 34% 34% -5African American/Black 22 35% 50% 17% 14% -21Asian 14 62% 64% 76% 64% 2Hispanic 306 26% 18% 19% 20% -6Multi-race 21 52% 50% 35% 48% -4White 308 47% 50% 45% 47% 0
Marlborough High 209 75% 72% 72% 67% -8African American/Black 7 -- -- -- -- --Asian 6 -- 93% -- -- --Hispanic 91 62% 54% 59% 47% -15Multi-race 3 -- -- -- -- --
14

Marlborough Public Schools Comprehensive District Review
Table 21: Marlborough Public SchoolsMCAS Science Percent Scoring Proficient or Advanced in Science by School and Student Group, 2015–2018*
White 101 84% 79% 82% 84% 0
*Since the Science MCAS is administered in grades 5, 8, and 10, it was not administered at the K–4 schools in Marlborough.
Table 22: Marlborough Public SchoolsFour-Year Cohort Graduation Rates, 2014–2017
Group N (2017)
2014 2015 2016 2017 4-yr Change
State (2017)
African American/Black 8 100.0 70.0 66.7 87.5 -12.5 80.0Asian 10 100.0 57.1 76.9 80.0 -20.0 94.1Hispanic or Latino 97 68.5 70.8 81.1 73.2 4.7 74.4Multi-Race, non-Hisp./Lat. 3 -- -- -- -- -- 85.2White 147 84.9 86.2 88.4 93.2 8.3 92.6High needs 165 69.4 69.0 75.2 77.6 8.2 80.0Economically Disadvantaged* 145 67.7 69.3 78.8 77.9 10.2 79.0SWD 51 60.9 60.3 71.2 66.7 5.8 72.8EL 28 52.4 58.8 60.7 60.7 8.3 63.4All 265 81.6 79.3 85.0 85.3 3.7 88.3* Four-year cohort graduation rate for students from low-income families used for 2014 and 2015 rates.
Table 23: Marlborough Public SchoolsFive-Year Cohort Graduation Rates, 2013–2016
Group N (2016)
2013 2014 2015 2016 4-yr Change
State (2016)
African American/Black 9 85.7 100.0 70.0 66.7 -19.0 83.4Asian 13 100.0 100.0 57.1 76.9 -23.1 94.8Hispanic or Latino 74 77.8 72.6 77.5 87.8 10.0 76.8Multi-Race, non-Hisp./Lat. 3 100.0 -- -- -- -- 87.4White 155 89.9 88.0 87.8 88.4 -1.5 93.5High needs 149 78.1 75.2 73.8 78.5 0.4 82.9Economically Disadvantaged* 118 79.6 73.8 74.5 83.1 3.5 82.1SWD 52 74.4 67.2 67.6 73.1 -1.3 76.5EL 28 62.5 57.1 61.8 67.9 5.4 70.9All 254 86.7 84.8 82.2 87.0 0.3 89.8* Four-year cohort graduation rate for students from low-income families used for 2013 and 2014 rates.
Table 24: Marlborough Public SchoolsIn-School Suspension Rates by Student Group, 2015–2018
Group 2015 2016 2017 2018 4-yr Change
State (2018)
African American/Black 0.6 1.8 1.8 0.5 -0.1 3.4Asian 0.0 0.0 0.0 0.0 0.0 0.6Hispanic or Latino 0.2 0.2 0.4 0.5 0.3 2.4Multi-Race, non-Hispanic or Latino 0.0 0.0 0.0 0.0 0.0 2.3White 0.5 0.3 0.2 0.6 0.1 1.4High Needs 0.4 0.3 0.4 0.8 0.4 2.7
15

Marlborough Public Schools Comprehensive District Review
Table 24: Marlborough Public SchoolsIn-School Suspension Rates by Student Group, 2015–2018
Economically disadvantaged* 0.6 0.3 0.5 1.1 0.5 2.9SWD 0.6 0.3 0.5 1.9 1.3 3.3EL 0.0 0.1 0.2 0.4 0.4 1.8All 0.3 0.3 0.3 0.5 0.2 1.8
Table 25: Marlborough Public SchoolsOut-of-School Suspension Rates by Student Group, 2015–2018
Group 2015 2016 2017 2018 4-yr Change
State (2018)
African American/Black 4.5 7.3 3.5 4.4 -0.1 3.4Asian 0.0 0.0 0.0 0.0 0.0 0.6Hispanic or Latino 1.6 1.9 2.7 1.9 0.3 2.4Multi-Race, non-Hispanic or Latino 0.0 0.0 0.0 0.0 0.0 2.3White 1.7 1.7 1.8 2.0 0.3 1.4High Needs 2.4 2.2 3.0 2.4 0.0 2.7Economically disadvantaged* 3.1 2.7 3.5 2.9 -0.2 2.9SWD 4.3 3.4 5.8 5.7 1.4 3.3EL 0.0 0.7 0.4 0.8 0.8 1.8All 1.7 1.9 2.2 2.0 0.3 1.8
Table 26: Marlborough Public SchoolsDropout Rates by Student Group, 2014–2017
Group 2014 2015 2016 2017 4-yr Change
State (2017)
African American/Black 0.0 0.0 5.4 14.3 14.3 2.9Asian 0.0 0.0 2.5 0.0 0.0 0.6Hispanic or Latino 2.3 2.7 3.3 5.9 3.6 4.2Multi-Race, non-Hispanic or Latino
0.0 0.0 0.0 0.0 0.0 1.7
White 2.1 2.7 1.5 1.7 -0.4 1.1High Needs 3.0 4.1 3.9 6.3 3.3 3.5Economically disadvantaged* 3.1 4.0 3.3 5.3 2.2 3.6SWD 1.1 5.6 3.6 6.3 5.2 3.3EL 10.3 4.8 7.4 10.9 0.6 6.5All 2.0 2.4 2.3 3.8 1.8 1.8*Dropout rates for students from low-income families used for 2014 rates.
16

Marlborough Public Schools Comprehensive District Review
Table 27: Marlborough Public SchoolsAdvanced Coursework Completion, 2017–2018
Group N (2018) 2017 2018 Change TargetAfrican American/Black 16 -- -- -- --Asian 19 -- -- -- --Hispanic or Latino 256 48.2 95.3 47.1 56.8Multi-Race, non-Hispanic or Latino 7 -- -- -- --White 286 76.0 93.0 17.0 81.1High Needs 272 37.0 88.2 51.2 44.0Economically disadvantaged 168 48.2 90.5 42.3 57.3SWD 80 22.2 80.0 57.8 37.7EL 108 29.2 97.2 68.0 34.8All 584 65.7 94.9 29.2 70.3
Table 28: Marlborough Public SchoolsProgress toward Attaining English Language Proficiency, 2017–2018
Non-high school High schoolGroup N
(2018)2017 2018 Change Target N
(2018)2017 2018 Change Target
EL 608 55.2 60.9 5.7 69.2 116 45.6 43.1 -2.5 43.1All 608 55.2 60.9 5.7 69.2 116 45.6 43.1 -2.5 43.1
Table 29: Marlborough Public SchoolsChronic Absence Rates,* 2017–2018
Non-high school High schoolGroup N
(2018)2017 2018 Change Target N
(2018)2017 2018 Change Target
African American/Black
107 -- -- -- -- 41 -- -- -- --
Asian 96 -- -- -- -- 29 -- -- -- --Hispanic or Latino
1,557 10.6 12.5 -1.9 7.8 574 28.1 30.7 -2.6 25.3
Multi-Race, non-Hisp./Lat.
91 -- -- -- -- 16 -- -- -- --
White 1,266 8.5 9.2 -0.7 7.5 540 14.6 19.8 -5.2 13.6High needs 1,986 13.2 14.9 -1.7 11.3 656 31.0 34.9 -3.9 29.1Economically Disadvantaged
1,159 16.7 18.4 -1.7 14.1 355 36.0 35.8 0.2 33.4
SWD 540 16.5 18.1 -1.6 14.1 198 40.2 49.0 -8.8 37.8EL 1,232 10.0 11.6 -1.6 6.6 283 29.0 31.8 -2.8 25.6All 3,119 10.0 11.2 -1.2 8.9 1,201 20.7 24.3 -3.6 19.6* The percentage of students absent 10% or more of their total number of student days of membership in a school
17

Marlborough Public Schools Comprehensive District Review
Leadership and Governance
Contextual Background
From 2008 to 2018, leadership in the Marlborough Public Schools was in a state of flux with seven superintendents leading the district during that time. The current superintendent was unanimously appointed on July 1, 2018, after serving as the district’s director of finance and operations since 2014. To maintain stability and strengthen programing and instruction, the district appointed several district staff members to leadership positions. The high school principal, appointed in June 2018, is a 15-year veteran teacher and director of mathematics and the district’s STEM program. The current assistant superintendent of teaching and learning served as the principal at the middle school, while the current middle-school principal and two elementary principals were assistant principals in the district. In addition, the director of finance and operations is new in 2018–2019. Although there have been several recent changes in the leadership team, the superintendent and other leaders possess a great deal of institutional knowledge and experience to draw upon.
School committee governance is focused on improvement and informed about the needs of the district. The mostly veteran school committee members cooperatively assume their roles and responsibilities to review and revise policies, develop and monitor the district budget, and annually evaluate the superintendent. The seven-member committee, chaired by the mayor, maintains a collaborative and transparent relationship with the superintendent and the community. School committee members have voiced their confidence in the new superintendent and have collaborated with city council members and others to support school funding. The district and the city share the funding of the director of information technology position and maintenance services. To resolve space issues, the city has funded a new elementary school, which was under construction at the time of the onsite review in September 2018. The district will move grade 5 from the middle school to the elementary level, creating four K–5 elementary schools.
The district’s improvement plan, called Marlborough Public Schools Transforming Education 2017–2020, includes goals, action steps, benchmarks, and progress indicators to assist in strengthening instruction and improving student achievement. For the most part, School Improvement Plans are aligned with the District Improvement Plan, but schools do not consistently set measurable improvement goals and make decisions by measuring and monitoring student growth.
The superintendent is participating in ESE’s three-year New Superintendent Induction Program, which provides professional development, coaching, and support for new superintendents. The superintendent has developed his entry plan and goals for 2018–2019. He is in the process of meeting with various stakeholders to collect ideas and suggestions for district and school improvement, maintain momentum during the transition, and set a new vision for the district.
The number of recent changes in curricular and instructional leadership has made an impact on progress and continuity in curriculum and instruction. Many programs and initiatives brought into the district
18

Marlborough Public Schools Comprehensive District Review
have been short-lived or not implemented with fidelity. With a lack of sustained focus and urgency on the part of the administration, there has been slow progress in student achievement.
Strength Finding
1. District leaders and city officials are building a collaborative culture to continue to strengthen the district and provide greater leadership stability.
A. Interviews and a review of documents indicated that the superintendent’s entry plan included conversations and meetings within the district and throughout the community to listen, learn, and collect information to maintain forward momentum during the transition in leadership.
1. The superintendent presented his entry plan and goals to the school committee in September 2018 and shared his goals with the faculty on opening day of school year 2018–2019.
2. To set a course and vision, the superintendent is reviewing qualitative data to understand where progress is being made.
3. The superintendent has held several informal breakfast meetings with administrators and school committee members, as well as after-school meetings at each of the schools to solicit feedback from district personnel.
4. The superintendent provided an open-response survey to collect additional feedback from all stakeholders.
B. District leaders and city officials work collaboratively and positively to support a culture of transparency and trust.
1. School committee members stated confidence in the superintendent’s knowledge and understanding of the budget process and his transparency in articulating the needs of the district.
2. A school committee member stated that the superintendent was very positive and that there was two-way open communication between the school committee and superintendent.
3. The superintendent updates the school committee at every meeting about school-related issues and the director of finance provides a budget update every other month.
4. The superintendent stated that the mayor and city officials have been extremely collaborative and supportive of the district.
5. A city official stated that the town was fortunate to have a positive relationship with the schools and the school committee. The official noted that the superintendent stopped by the mayor’s office regularly to keep him informed of the district’s needs.
19

Marlborough Public Schools Comprehensive District Review
6. The mayor expressed confidence in the superintendent’s appointment. He noted that it was important to him that the district provided continuity of leadership for its students, parents, and teachers. In addition, he stated that the superintendent provided that leadership continuity while also bringing new perspectives to support the Marlborough Public Schools.
7. Administrators, teachers’ association members, and city officials spoke highly of the superintendent’s accessibility and timely communication.
8. Administrators said that the superintendent’s leadership meeting agendas were more focused on addressing district issues and expectations for behavioral norms, and less focused on “administrivia.”
9. Representatives from the Marlborough Teachers’ Association (MTA) described their relationship with the superintendent as “positive and easy.” They stated that they had “a good feeling” that they were working “with the superintendent” as opposed to in the past where they worked “for the superintendent.”
10. An association member reported that the superintendent understood data and was looking at the district through a new lens.
Impact: When the superintendent, school committee, and city officials maintain an open, transparent and focused dialogue on the goals and priorities of the district, they promote a culture of shared responsibility for student learning. This makes it likely that district leaders can identify and focus on appropriate goals and strategies to improve learning and student outcomes.
Challenges and Areas for Growth
2. The district does not set measurable goals in its planning documents based on an analysis of historical, longitudinal, and current disaggregated student data.
A. The district’s improvement plan (DIP), called Marlborough Public Schools Transforming Education 2017–2020, is organized by six district standard goals and their related indicators. Each standard goal and indicator includes a list of action steps for each year, with responsible staff, implementation benchmarks, assessment of progress/evidence, and status.
1. Indicator 3 under the Leadership, Governance, and Communication standard goals is “To use school and school-level data to create School Improvement Plans, which align with District Improvement Plans. All improvement plans will contain measurable benchmarks, targets, and goals.”
B. The DIP and the School Improvement Plans (SIPs) are aligned. The DIP contains broad metrics to measure final outcomes; it does not contain measurable goals. Only one SIP includes student performance targets or benchmarks.
20

Marlborough Public Schools Comprehensive District Review
1. Although the district has identified goals and designated staff with primary responsibility for achieving goals in its plans, it has not identified specific student performance goals based on an analysis of historical, longitudinal, and current disaggregated student achievement data.
2. Interviews and a document review indicated that a priority focus for the district was to improve rigor and relevance in instruction. Although all SIPs mention improving rigor and relevance, the SIPs do not use student performance data to measure progress toward this goal.
Impact: Without planning documents with measurable goals based on an analysis of historical, longitudinal, and current disaggregated student performance, opportunity, and outcome data, the district cannot ensure that its priorities are based on evidence and that its improvement plans drive the development, implementation, and modification of educational programs and practices.
Recommendation
1. The district should ensure that its planning documents have clear goals that are based on an analysis of historical, longitudinal, and current disaggregated student data.
A. Under the leadership of the superintendent, the district should convene a representative group of stakeholders to develop measurable goals (including progress benchmarks and final outcomes) for its planning documents.
1. The goals should be based on an analysis of historical, longitudinal, and current disaggregated data related to student performance, opportunities, and outcomes.
2. The goals should be SMART (Specific and Strategic; Measurable; Action Oriented; Rigorous, Realistic, and Results Focused; and Timed and Tracked).
3. The district should develop a process for using the most recent student data to continually monitor and update district and school improvement plans.
B. Principals, in collaboration with school councils, should ensure that each School Improvement Plan includes specific measures to determine the progress of school-based initiatives.
1. Similar to the DIP, these measures should be SMART.
C. District and school leaders should provide frequent, timely, and thorough information to the school committee, staff, students, families, and community on progress toward the achievement of plan goals.
Benefits: By developing, communicating, and using measurable goals based on an analysis of historical, longitudinal, and current disaggregated student data and other data sources, the district will ensure that it is focused on the most important areas for improvement. By making a commitment to the yearly amount of change that it plans to achieve, the district will be able to plan and regularly monitor the
21
Marlborough Public Schools Comprehensive District Review
impact of key improvement strategies, instructional practices, and the use of resources on student performance, opportunities, and outcomes.
Recommended resources:
What Makes a Goal Smarter? (http://www.doe.mass.edu/edeval/resources/presentations/SMARTGoals/Handout5.pdf) is a description of SMART goals with accompanying examples. The handout was designed to support educators in developing goals as part of the educator evaluation system, but could also be a useful reference for the district as it develops or refines its DIP and SIPs
ESE’s Planning for Success tools (http://www.doe.mass.edu/research/success/) support the improvement planning process by spotlighting practices, characteristics, and behaviors that support effective planning and implementation and meet existing state requirements for improvement planning.
o Selecting Outcome Measures and Setting Targets (http://www.doe.mass.edu/research/success/setting-outcomes-targets.docx) might be particularly helpful as the district analyzes data in order to establish measurable goals.
District Accelerated Improvement Planning - Guiding Principles for Effective Benchmarks (http://www.mass.gov/edu/docs/ese/accountability/turnaround/level-4-guiding-principles-effective-benchmarks.pdf) provides information about different types of benchmarks to guide and measure district improvement efforts.
22

Marlborough Public Schools Comprehensive District Review
Curriculum and Instruction
Contextual Background
The newly appointed superintendent has strategically organized personnel to create a network of positions to oversee curriculum and instruction. For school year 2018–2019, the district established lead teacher positions K–12 by appointing full-time teachers to serve as curriculum and instructional resource professionals. Their role is to work directly with teachers and administrators to support high academic standards and instructional practices. Lead teachers are part of the superintendent’s cabinet and attend scheduled leadership meetings. The assistant superintendent for teaching and learning, appointed in 2016, is responsible for curriculum coordination, the adoption of new curriculum/programs, and professional development. The content supervisors for ELA, math, and science grades 6–12, the EL director and assistant directors, and the three K–12 supervisors for art, music, and wellness are responsible for data analysis and distribution, curriculum development and revisions, and professional learning community (PLC) agendas; they report to the assistant superintendent. The elementary principals and assistant principals are the curricular and instructional leaders in their schools and work collaboratively with lead teachers. Structured time is embedded in elementary teachers’ schedules to enable them to meet in professional learning communities (PLCs) by grade level or content area.
In 2015, the elementary schools adopted new academic programs: Go Math for math, and Journeys and Fundations for ELA. In addition, the district implemented its own STEM program (science, technology, engineering, and math) for students in grades 6–8. At the high school, the district recently instituted a new cluster model of instruction for students in grades 9 and 10, providing a choice of three options of study: STEM, business IT technology, or arts. The district has formed an elementary science committee to develop curriculum for grades 3–5. Interviewees told the team that a life science unit was in place in some grades, noting that the work was ongoing.
The District Improvement Plan, Marlborough Public Schools Transforming Education, 2017–2020, includes specific indicators to address curriculum and instruction: training in writing language objectives, developing a curriculum mapping template, writing curriculum, and teaching for rigor and relevance.
23

Marlborough Public Schools Comprehensive District Review
Strength Findings
1. The district has adopted one K–5 math and two K–5 ELA programs, developed curriculum pacing guides aligned with the 2017 Massachusetts Curriculum Frameworks, and implemented the programs consistently in its elementary schools.4
A. Before adopting the K–5 math and ELA programs, the district followed a process that included data analysis and teacher input.
1. In 2014, Go Math was implemented K–5, replacing Everyday Math. During the first year of adoption, teachers received limited professional development from Houghton-Mifflin Harcourt consultants. In 2016, math specialists received additional training.
2. School leaders reported that after analysis of MCAS, Fast Bridge, and Lexia data, they identified a need for a new reading program.
3. In 2015, the district selected teachers from the three elementary schools to pilot three different ELA programs. They also visited elementary classrooms in Fitchburg and Littleton to observe lessons.
4. During the pilot phase, teachers and principals monitored student performance. In 2016, the pilot teachers shared teaching strategies and student progress data with the district’s leadership team. This resulted in the decision to adopt Journeys K–5 and Fundations K–3.5
5. A key factor in selecting Journeys was the need to support the English language needs of students whose primary language was not English. Journeys has a version for English learners.
6. Curriculum pacing guides and unit plans for Journeys, Fundations, and Go Math are aligned with the Massachusetts curriculum Frameworks.
Impact: Shared research-based quality curricula K-5 for math and ELA provide clarity and consistency of instructional expectations for educators and the likelihood that all elementary students have access to high-quality programs that can meet their diverse learning needs.
2. In observed classrooms across the district, the classroom climate was conducive to teaching and learning.
A. The review team noted sufficient and compelling evidence showed that classroom routines and positive supports were in place to ensure that students behaved appropriately (characteristic #11) in 92 percent of observed elementary classrooms, in 80 percent of middle-school classrooms, and in 86 percent of high-school classrooms.
4 At the time of the review in October 2018, Grade 5 was housed at the middle school.5 Fundations is a K–3 reading and spelling curriculum and is only used in grade 4 as an intervention.
24

Marlborough Public Schools Comprehensive District Review
1. At the elementary schools, rituals and routines included alerts such as chimes to transition students, countdowns to re-focus students, and a single clap as an attention grabber.
2. At the middle school, teachers used refocusing techniques to signal task completion. For example, teachers used a countdown to call students’ attention to completing tasks.
3. At the high school, rituals and routines included “do now” activities related to homework assignments, open-ended questions to start a lesson, music playing/stopping when the teacher started the lesson, and posted or articulated class rules/expectations.
B. Review team members found sufficient and compelling evidence that classroom climate was conducive to teaching and learning (characteristic #12) in 87 percent of elementary classes, in 56 percent of middle-school classes, and in 89 percent of high-school classes.
1. Team members noted strong evidence of reciprocal respect on the part of students and teachers. Classrooms reflected an all-inclusive atmosphere where students were comfortable participating, and demonstrated respect toward one another.
2. In one elementary classroom, a student experienced a health issue. The teacher calmly and professionally handled the situation. Questions and concerns were immediately addressed, and classroom instruction proceeded as planned.
Impact: Well-managed classrooms with established routines and behavioral expectations likely provide optimal conditions for teaching and learning.
Challenges and Areas for Growth
3. The district’s curricula for ELA in grades 6-–12, math in grades 6–8, and science and social studies K–12 are incomplete. The district does not have a curriculum mapping model or a systematic process to monitor, review, and revise curriculum.
A. Interviews and a document review indicated that the district’s curriculum guides contained different elements; many curriculum guides did not include key mapping elements (e.g., sequence of instruction, content resources and materials, formative and summative assessments, and essential questions).
1. At the time of the onsite review in October 2018, the district’s math curriculum K–5 and for grades 9–12 was the most complete.
a. The math department uses a curriculum mapping model for algebra 1, unit 2 (revised 6/22/17).
2. Administrators told the team that the district was developing a new curriculum mapping model.
25

Marlborough Public Schools Comprehensive District Review
3. Go Math, the K–8 math program, is not fully implemented in grades 6 and 7. Sixth and seventh grade teachers teach their own curriculum and use Go Math as a resource.
4. Mapping of social studies curriculum for grades 3–5 is in process. Grade 8 teachers are teaching civics using curriculum that they have developed.
5. The district has two scheduled periods for science instruction K–5; teachers can teach science or social studies. The district does not have a standards-based elementary science curriculum in place.
6. The district’s K–5 ELA and math programs have been aligned with the Massachusetts Curriculum Frameworks. A review of the District Improvement Plan indicated that the district expected to align 50 percent of the curriculum with the current frameworks by 2019, with the remaining 50 percent to be completed by 2020.
B. The district does not have a regular, rigorous, transparent, consistent, and inclusive process to review and revise curriculum.
1. Teachers said that curriculum was part of the professional learning community agenda, but they had not done extensive reviews or revisions.
C. The alignment of ELA, math, and science curricula is a work in progress at all levels.
1. Interviewees stated that the ELA and math curricula for grades 6–12 and the science curriculum K–12 were not aligned across classrooms and grade levels.
a. School leaders stated that teachers had few opportunities for conversations on vertical alignment because the curriculum still needed considerable work.
2. The K–12 science curriculum is not aligned with the 2016 Massachusetts Science and Technology/Engineering Framework.
Impact: The absence of a systematic process to document and monitor curricula and of a data-driven approach to guide the mapping and alignment of curricula prevent students from accessing high-quality teaching and learning.
4. In observed classrooms across the district, the quality of instruction was inconsistent.
A. Focus Area #1: Learning Objectives& Expectations Instructional practices that reflected elements of effective instructional design---including clearly articulated learning targets and success criteria, activities that support and are adjusted to meet intended learning targets, and checks for understanding---varied across grade levels. These elements were more prevalent at the elementary level than at the secondary level.
1. The review team observed sufficient and compelling evidence that teachers ensured that students understood what they should be learning and why (characteristic #2) in 64 percent
26

Marlborough Public Schools Comprehensive District Review
of observed elementary classrooms, in 68 percent of middle-school classes, and in 51 percent of high-school classes.
a. In many classrooms, teachers noted learning objectives and stated them at the beginning of class and/or posted them. In these classes, when asked what they were learning, students were able to articulate the purpose of the learning activity and place it in a larger context (e.g., “I am researching my author’s argument to be able to defend his position.” “I’m looking at the symbolism and deciding on the author’s underlying message.”)
b. In other classrooms, teachers posted learning objectives but did not refer to them during the lesson. Students often worked individually on a Chromebook or worksheet and explained the directions on the worksheet if asked what they were learning.
2. Team members found sufficient and compelling evidence of appropriate classroom activities well matched to the learning objective (characteristic #3) in 75 percent of observed elementary classes, in 56 percent of middle-school classes, and in 63 percent of high-school classes.
a. For example, in one classroom students were learning to use the plural suffixes -ies and -es. Students were observed jotting the proper plural words on their white boards. Later they posted their plural words, explained how they arrived at their answers, and used their words in a sentence. Students also were asked to choose a challenging word to pluralize and use in a sentence. In this class, students answered questions using two or three sentences.
b. Conversely, in other classrooms students copied problems or copied notes from the white board that matched the learning objective. However, the learning activities were not aligned with the cognitive demand of the objective.
3. Review team members observed sufficient and compelling evidence that teachers made frequent checks for understanding, provided feedback, and adjusted instruction (characteristic #4) in 72 percent of observed elementary classrooms, in 54 percent of middle-school classrooms, and in 57 percent of high-school classrooms.
a. In a high-school ELA class, the teacher circulated from one group of students to another, probing for evidence to substantiate students’ thinking about the story’s symbolism.
b. In contrast, in a middle-school class the teacher asked, “Do you all understand?” No one responded, and the teacher continued talking.
B. Focus Area #2: Student Engagement & Higher Order Thinking Rigor and relevance are two district priorities for 2018–2019. The review team found a higher incidence of students assuming responsibility for their learning at the middle school than at the high-school and elementary levels. Opportunities for students to communicate ideas with one another, engage
27

Marlborough Public Schools Comprehensive District Review
in higher-order thinking, and engage with real-world tasks were not consistently embedded in lessons.
1. Team members found sufficient and compelling evidence of students assuming responsibility for learning and engaging in the lesson (characteristic #5) in 66 percent of observed elementary classes, in 76 percent of middle-school classes, and in 51 percent of high-school classes.
a. In a strong example of student engagement at the middle school, students were asked to turn and explain to their partner how they solved their math problems.
b. In a grade 9 class in which students were not given sufficient opportunities to do the thinking or to be engaged in the lesson, the teacher spoke for the entire observation period and students were not involved in activities beyond copying the teacher’s notes.
2. The review team observed sufficient and compelling evidence of students engaged in tasks requiring critical thinking (characteristic #6) in 54 percent of observed elementary classrooms, in 44 percent of middle-school classrooms, and in 49 percent of high-school classes.
a. Learning activities requiring higher-order thinking included a grade 12 ELA class in which students predicted the end of the story and a high-school STEM (science, technology, engineering, and math) class where groups of students were designing a space suit.
b. Less rigorous thinking tasks observed in middle-school and elementary classes included questions requiring “Yes” or “No” answers, questions asked and answered by the teacher, and fill-in-the-blank worksheets.
3. Observers found sufficient and compelling evidence that students communicated their ideas and thinking with each other (characteristic #7) in 57 percent of observed elementary classrooms, in 48 percent of middle-school classrooms, and in 43 percent of high-school classes.
a. For example, in a grade 8 math class students shared math problems with partners and discussed ways to solve them. In a grade 4 ELA class working to understand the use of prefixes, students created sentences using prefixes and shared them with each other for understanding.
b. In contrast, in some classes students gave one-word answers and were not asked to explain their reasoning.
4. The review team found sufficient and compelling evidence that students had opportunities to engage with meaningful tasks connected to their lives (characteristic #8) in 51 percent of observed elementary classes, in 52 percent of middle-school classes, and in 37 percent of high-school classes.
28

Marlborough Public Schools Comprehensive District Review
a. For example, in a grade 10 ELA class, students were conducting research on books that they had read over the summer with topics on social issues such as police brutality, the “me too movement,” domestic abuse, and gender bias, to support their papers’ theses. In a grade 10 ELA class, students were sharing their analysis of images used in advertisements for size, color, scale, roles and stereotypes.
b. In classes in which students were not given sufficient opportunities to engage with meaningful real-world tasks, teachers presented a concept to the students in a lecture style, and then distributed a worksheet or asked students to take notes. Questions posed by the teachers required one-word answers and the teachers elaborated on the answers rather than asking students to explain their answers.
C. Focus Area #3: Inclusive Practices and Classroom Culture The use of a variety of instructional strategies was least evident in high-school classrooms.
1. Team members found sufficient and compelling evidence of students engaged in challenging tasks regardless of learning needs (characteristic #9) in 60 percent of observed elementary classrooms, in 52 percent of middle-school classrooms, and in 42 percent of high-school classes.
a. For example, in a grade 2 reading lesson, the teacher reviewed vocabulary words by having students tap each syllable before repeating the word. Next students sang the alphabet song as they placed tiles in alphabetical order. They used these tiles to spell out their words. Students were placed in two learning groups with a teacher. Here they learned new words; one group used manipulatives (tiles), the other tapped the syllables and sounded out the word.
b. In contrast, in many high-school classes, observers noted little group work and limited use of differentiated tasks or individualized support.
2. The review team found sufficient and compelling evidence that teachers used a variety of instructional strategies (characteristic #10) in 49 percent of observed elementary classes, in 48 percent of middle-school classes, and in only 20 percent of high-school classrooms.
a. For example, in a grade 3 ELA class, students read, wrote, and shared their thinking in large and small groups.
b. In many high-school classes, all students were doing the same task throughout the observation.
Impact: Without consistent delivery of effective, research-based instruction in all grades and subjects, the district cannot achieve its goal of delivering high-quality instruction to all students, optimizing their learning opportunities, and preparing them for college, careers, and civic participation.
29

Marlborough Public Schools Comprehensive District Review
Recommendations
1. The district should complete as soon as possible its K–12 ELA, math, science, and social studies curricula. It should ensure that curricula are high quality, comprehensive, aligned with appropriate standards and aligned vertically between contiguous grades and horizontally across grades and schools. The district should develop and implement an ongoing process for reviewing and revising curriculum.
A. The district should complete its curriculum-mapping model to guide the development of curricula, instructional practices, and assessments.
1. District leaders and teachers should consider reviewing model-mapping documents that the math department is using, for example, for algebra I, unit 2 (revised 6/22/17).
2. School leaders should provide teacher training on mapping and schedule regular time for this work.
B. The district should identify ways to provide support to teachers to supplement the district’s selected curricula in order to ensure full coverage of the Massachusetts curriculum frameworks.
C. District leaders should develop a process for the regular review and revision of curriculum.
1. District leaders should develop and implement a formal cyclical planning process to review and revise curriculum.
2. As part of the planning process, the district should consider specifying the roles that central office staff, principals, and school-based staff will perform.
Benefits: Implementing this recommendation will help to ensure that teachers and students have access to an updated, comprehensive, and clearly articulated curriculum that prepares students for success in high school and beyond.
Recommended resources:
DESE’s Instructional Materials and Professional Development page (www.doe.mass.edu/candi/impd/) provides resources for improving and collaborating on curriculum, including quick reference guides and maps designed to facilitate cross-district communication about curriculum.
EdReports.org (http://www.edreports.org/) provides free, independent reviews of K-12 education materials. The reviews focus on alignment to college and career ready standards and other indicators of high quality as recommended by educators.
Quick Reference Guide: Aligning Curriculum to Massachusetts Standards (http://www.doe.mass.edu/candi/impd/qrg-aligning-curriculum.pdf) is designed to support teachers, coaches, administrators, and curriculum developers in the work of considering the ways in which curricular materials may diverge from the Massachusetts standards.
30

Marlborough Public Schools Comprehensive District Review
Quick Reference Guide: Assessing Your Curriculum Landscape (http://www.doe.mass.edu/candi/impd/qrg-assessing-curriculum.pdf) is designed to support districts assess their curriculum landscape by asking three questions: (1) Do teachers have ready access to high-quality, standards-aligned curricular materials? (2) Do sustained and collaborative professional learning structures empower teachers to use those materials in ways responsive to their students’ needs? (3) Are curriculum review processes regular, rigorous, and responsive to stakeholder input and needs?
ESE’s Massachusetts Curriculum Frameworks web page (http://www.doe.mass.edu/frameworks/current.html) provides information about the 2017 ELA/Literacy and Mathematics Frameworks, including grade-by-grade comparisons between the 2010 and 2017 Frameworks and a slide deck supporting implementation of the 2017 Frameworks.
2. The elementary science committee, with guidance from district leaders, should ensure that all K–5 science teachers have access to high-quality, standards-aligned curricular materials and the support they need to use those materials consistently and skillfully.
A. The district should consider building on the project-based learning units for grade 3 to include all elementary grades.
1. School leaders should schedule and provide time for professional development on project-based learning.
2. Elementary school leaders should consider providing daily science instruction K–5.
Benefits: Implementing this recommendation will provide a high-quality research-based science curriculum at the elementary level that will develop students’ knowledge of science and the scientific method along with the life skills of collaboration, inquiry, organization, and problem solving. These skills will likely serve students well as they prepare for career or college in this scientific and technological world.
Recommended resources:
The Massachusetts Science and Technology/Engineering Curriculum Framework web page (http://www.doe.mass.edu/stem/review.html) provides the 2016 Science and Technology/Engineering Framework and resources supporting its implementation.
Quick Reference Guide: Establishing an Effective Science and Technology/Engineering (STE) Program (http://www.doe.mass.edu/stem/ste/STEprogram.docx): ESE has identified five components districts should attend to when designing a rigorous, coherent and relevant pre-K–12 STE education program. Educators, administrators and curriculum designers can refer to this guide for brief descriptions and resources for each component.
31

Marlborough Public Schools Comprehensive District Review
ESE’s STE Quality Review Rubric (http://www.doe.mass.edu/candi/model/rubrics/STE.pdf) is designed to help educators determine the quality, rigor, and alignment of lessons and units to the 2016 MA STE Curriculum Framework.
3. The district should ensure that all teachers provide effective instruction that challenges and supports all students.
A. The district should convene a representative group of teachers and instructional leaders to identify key instructional practices.
1. The district’s educator evaluation rubric can support this work.
2. The recommended product of these meetings is a set of expectations that challenges and engages students and reflects the district’s emphasis on rigor and relevance.
3. The district should prioritize these instructional strategies as its “non-negotiables.”
B. Once the set of instructional expectations has been defined, district leaders should develop a plan for communicating these expectations with staff.
1. The district is encouraged to provide opportunities for educators to discuss ideas and strategies from the set of instructional expectations. These opportunities might include grade-level, department meetings, common planning time, faculty meetings, and professional development days.
2. The district should develop structures to support peer observation to both model instructional feedback and encourage peer feedback.
a. Equitable opportunities should be provided by level for teachers to share best practices.
C. Teachers should receive appropriate guidance and feedback as they implement the district’s instructional expectations.
1. Professional development should focus on elements of the instructional expectations as applied to the specific curricula that teachers and students work with every day.
2. Principals and other instructional leaders should ensure that teachers have the information and support necessary to meet the district’s expectations for instruction.
3. The district should continue to provide teachers with high-quality feedback6 that helps them to improve instruction.
Benefits: Implementing this recommendation will mean clear and articulated expectations for teachers and administrators for best instructional practices. A district that provides high-quality instruction for all students and ongoing professional supports for teachers and administrators creates and sustains a
6 High-quality feedback is specific, timely, and actionable.
32

Marlborough Public Schools Comprehensive District Review
culture of continuous improvement, resulting in professional growth and increased student achievement.
Recommended resources:
ESE’s Learning Walkthrough Implementation Guide (http://www.mass.gov/edu/docs/ese/accountability/dart/walkthrough/implementation-guide.docx) is a resource to support instructional leaders in establishing a Learning Walkthrough process in a school or district. It is designed to provide guidance to those working in an established culture of collaboration as well as those who are just beginning to observe classrooms and discuss teaching and learning in a focused and actionable manner. (The link above includes a presentation to introduce Learning Walkthroughs.)
Appendix 4, Characteristics of Standards-Based Teaching and Learning: Continuum of Practice (http://www.mass.gov/edu/docs/ese/accountability/dart/walkthrough/continuum-practice.pdf) is a framework that provides a common language or reference point for looking at teaching and learning.
ESE’s Calibration Video Library (http://www.doe.mass.edu/edeval/resources/calibration/) is a collection of professionally created videos of classroom instruction produced by the School Improvement Network. These videos depict a range of practice (this is NOT a collection of exemplars) to support within-district calibration activities that promote a shared understanding of instructional quality and rigor.
ESE’s Online Calibration Training Platform (http://www.doe.mass.edu/edeval/resources/calibration/) uses videos of classroom instruction to simulate brief, unannounced observations. Groups of educators, such as a district leadership team, watch a video together and then individually assess the educator’s practice related to specific elements from the Model Classroom Teacher Rubric and provide the educator with written feedback. Through real-time data displays, the group members can then see how their conclusions compare to each other, as well educators throughout the state.
ESE’s "What to Look For" Observation Guides (Updated August 2017) (http://www.doe.mass.edu/candi/observation/) describe what observers should expect to see in a classroom at a particular grade level in a specific subject area. This includes the knowledge and skills students should be learning and using (as reflected in state learning standards) and best practices related to classroom curriculum, instruction, and assessment for each subject area. The guides are not designed to replace any evaluation system or tools districts currently use, but are a resource to help classroom observers efficiently identify what teachers and students should be experiencing in specific subjects and grade levels.
33

Marlborough Public Schools Comprehensive District Review
Assessment
Contextual Background
Since the time of the last DESE review in 2013, Marlborough has taken steps to ensure that the assessment system plays a more critical and integral role in improving teaching, learning, and decision-making, especially at the elementary schools. The district has improved the balance and comprehensiveness of its assessments by mandating the use of a range of common benchmark and summative assessments, especially in K–4 ELA and in math grades 5–12. At the time of the onsite in October 2018, the district was reviewing its formative assessments to ensure that they were useful, systematic, and implemented widely.
In the 2018–2019 school year, the district has deployed resources---people, time, and funding---to strengthen the use of assessments and data analysis to improve teaching and learning. For example, the district made the assistant superintendent of teaching and learning and the principals responsible for the oversight of assessment. In addition, it has appointed teacher leaders in every school to collaborate with the principal as members of the school leadership team. At the elementary schools, there is a teacher leader for every grade level; at the high school, there are teacher leaders for each content area. Since 2015, the middle school has had grade-level teacher leaders who lead meetings for interdisciplinary teams and content meetings. Teacher leaders meet weekly, sometimes about one content area and sometimes with an interdisciplinary focus. A key responsibility of all teacher leaders is to lead teacher colleagues in regularly scheduled Professional Learning Communities (PLCs) focused on problem solving using data and other information in order to adjust teaching strategies and improve learning. To date, this new practice has not been consistently implemented across the district.
Educators have made modest progress in these efforts to improve the use of data. The review team found some examples of effective practice. Overall, however, there is an absence of clarity about the roles and responsibilities for teacher leaders and principals in PLCs. In addition, at the classroom level, there is limited knowledge and capacity to analyze and use assessment data in a seamless and timely process to guide decision-making to improve instructional practice, curriculum, and student performance.
34

Marlborough Public Schools Comprehensive District Review
Strength Finding
1. The district supports the consistent administration of a variety of assessments that provide actionable information to support all students in making progress toward achieving state standards.
A. Interviews and a document review indicated that the district was analyzing its use of formative assessments and collecting benchmark and summative assessment data that could provide a balanced and comprehensive picture of student, school and district performance, particularly for ELA and math at the elementary levels.
1. At the elementary schools, leaders and teachers systematically collect data from universal screeners, formative, benchmark, and summative assessments as well as from on-demand writing prompts.7
a. K–4 teachers administer several ELA and math formative and benchmark assessments multiple times a year to measure and monitor all students’ progress and to provide students with interventions when needed. They also administer supplementary assessments for high risk and struggling students and the TELL and ACCESS to English learners (ELs).
b. Teachers access data from interventions---such as Lexia and Wilson Reading, especially for students reading below grade level, and Power-Up for math---with the goal of tracking improvement and skill development.
c. At some elementary schools, teachers review student work samples to measure students’ progress toward standards-based lesson targets. Student work samples also inform adjustments to teaching, assessments, or curriculum.
2. Leaders and teachers said that middle-school assessments included universal screeners in ELA and math, benchmarked unit mid-terms and finals as summative assessments, TELL (Test of English Language Learning) and ACCESS for ELLs, and Wilson Reading and Lexia for struggling readers.
a. A district administrator noted that middle-school teachers also collected and reviewed PBIS (Positive Behavioral Intervention and Supports) data.
b. Middle-school teachers also review student work samples to measure student progress and achievement.
7 The elementary schools administer FASTT ELA and FASTT Math, FastBridge ELA and Math, unit assessments (from Journeys, Fundations and Go Math), Developmental Reading Assessment (DRA), Developmental Indicators for the Assessment of Learning (DIAL) for kindergarten students, TELL and ACCESS for English learners, and on-demand writing samples at the end of each Writers Workshop unit.
35

Marlborough Public Schools Comprehensive District Review
3. District- and school-level interviewees told the review team that the high school was beginning to have a systematic approach to collecting and using data.
a. In addition to beginning to collect and review data from common unit tests, mid-terms, finals, MCAS assessments, and AP exams, high-school teachers use common exit tickets and quizzes to inform adjustments to instruction.
b. Two high-school reading interventionists8 administer Lexia to struggling readers and collect data to monitor students’ progress.
4. Assessments, particularly K–4, are aligned across schools and grade levels.
B. In recent years, instructional technology specialists9 at the elementary schools have collaborated with teachers to analyze data to assess the impact of interventions and gather longitudinal data by grade level and by school.
1. For example, an instructional technology specialist shared data with the review team from Lexia (ELA intervention) and Power-Up (math intervention) to track percentage increases in reading skills by grade level and by school during the school year and to compare the data from one year to the next.
C. At the time of the onsite review in October 2018, district leaders and teachers said that the district was in the process of moving from the Aspen data dashboard to the Otus data dashboard, in order for all staff to more easily access and analyze multiple forms of achievement data and other student information.
1. The Aspen dashboard provides educators, students, and families with access to K–12 student achievement data and to behavioral data for grades 6–12. At the time of the review, K–4 behavioral data was being introduced on Aspen.
2. While on-site, the review team heard morning announcements at the middle school, encouraging students to access their Aspen accounts in order to review their data.
3. In the winter of 2017–2018, the district introduced Otus, a new data dashboard, and began training district administrators, principals, and content supervisors how to use it. Once Otus has been implemented, educators will be able to review and analyze schoolwide MCAS, ACCESS, and FastBridge data; student grades (for grades 5–12); and attendance data. Training is ongoing.
D. District and school leaders stated and teachers confirmed that leaders analyzed MCAS assessment results, shared the analysis with teachers, and provided teachers with their students’ MCAS data.
8These are two new positions created in the 2018–2019 school year.9 Each elementary school has an instructional technology specialist who supports teachers in using online assessments and applications that support teaching and learning.
36

Marlborough Public Schools Comprehensive District Review
1. In multiple interviews, the review team was told that the district used MCAS results to inform school improvement planning, budgeting, and teachers’ SMART goals, and to guide decisions for curriculum and instruction in order to improve student achievement.
Impact: When a district and its schools have a coherent assessment system in place districtwide which provides multiple forms of assessment data and other key information, leaders and teachers have the opportunity to access and analyze student performance, opportunities, and outcomes to improve teaching, learning, and the curriculum.
2. The district has established teacher-led Professional Learning Communities, data teams, and teacher leaders at every school to support systematic improvements to student learning, curriculum, instruction, and assessment.
A. Interviewees and a document review indicated that the district established Professional Learning Communities (PLCs), data teams, and the teacher leader role to create a collaborative and data-based focus on improvement.
1. PLCs have access to a range of common formative and summative assessment data and other information including behavioral data.
2. At all schools, PLCs meet regularly during the school day. The goal of the PLCs is to address topics related to improving teaching, student learning, and the curriculum. The frequency and length of PLC meetings varies across schools.
a. At the elementary level, most PLCs meet twice a month. At the middle school, they meet two or three times during a seven-day cycle. At the high school, PLCs meet five times in a seven-day cycle.
3. The district and principals ensure that every school has regularly scheduled time for PLCs to meet.
4. The district created the position of teacher leader as a stipended position for full-time teachers to lead PLCs at each school. Principals select most teacher leaders. 10
5. Principals work with teacher leaders to set meeting agendas. Examples include using achievement data to differentiate instruction, understanding Project-Based Learning (PBL), and the analysis of disaggregated results from common assessment data.11
6. Interviewees stated that PLCs have started in 2018–2019 at the high school and some departments have made more progress than others have. A district leader identified the
10 Elementary school PLCs are composed of one grade-level teacher per grade. At the middle school, there are 2 teacher leaders for grade 5; one each for grades 6, 7, and 8; and one for world languages. At the high school, there are content lead teachers for ELA, math, science, business, history/social studies, and special education. 11 School data teams are usually composed of the principal, assistant principal(s), grade-level or content-level lead teachers, supervisors (at the secondary level), special educational team leaders, and key ELL staff at the school.
37

Marlborough Public Schools Comprehensive District Review
math department as the group with the most effective practices for PLCs and data analysis, which they have modeled for teacher colleagues.
7. Principals and teachers told the review team that the PLCs have begun to change the culture at the schools to one that is more data-based and reflective.
B. District and school data teams composed of the school leadership teams meet intermittently throughout the year to analyze the results of common assessments and prepare teacher leaders to share analyses and lead discussions with their teams.
1. After a data team meeting, K–5 teacher leaders and supervisors and teacher leaders in grades 6–12 are responsible for disseminating and discussing data with grade- and content-level teams.
Impact: By ensuring regular and collaborative meetings of teacher teams led by teacher leaders to address the learning needs of students and use data to guide decision-making, the district is promoting a culture of shared responsibility and accountability for assessing performance and taking actions that lead to improved outcomes for all students. With deeper knowledge of students’ strengths and challenges, with data as evidence, and with the opportunity for more collaborative discussions of how teaching and the curriculum can be adjusted to meet students’ learning needs, it is likely that teachers can use data to guide instructional practice and increase students’ learning.
Challenges and Areas for Growth.
3. There is an absence of clarity about the role and responsibilities of teacher leaders and principals in professional learning communities, and inconsistent use of collaborative inquiry protocols.
A. Interviews and a document review indicated that teacher leaders, district leaders, and principals had differing views and understanding of their roles in professional learning communities (PLCs).
1. District leaders and principals told the review team that teacher leaders were responsible for leading PLCs at their schools.
2. Some teacher leaders said that they did not understand their role in supporting teachers and that they did not lead PLCs---principals did.
B. Schools are using different data analysis protocols across the district.
1. Although all principals have benefitted from Research for Better Teaching’s consultations in order to learn protocols to establish high-functioning PLCs, each school has adapted these protocols differently.
38

Marlborough Public Schools Comprehensive District Review
a. One elementary school has demonstrated success12 using a three-week data cycle for improvement. Teachers identify learning targets and criteria for success that are monitored and measured. Data from assessments and the analysis of student work samples prompt grade-level discussions and help identify interventions and re-teaching before the cycle begins again.
b. Individual teachers and leaders are encouraged to observe what is taking place at that school, but the district has not systematically replicated and aligned best practices throughout the three K-–4 schools.
2. The superintendent acknowledged that “wildly different things” in the use of data were taking place across classrooms.”
3. Another district administrator told the review team that the analysis of data was an ongoing process, noting that the district had a long way to go [i.e., before data analysis was consistent across schools].
4. A district administrator noted that some teachers did not have a strong understanding of how to use data, although data literacy was a priority for the 2018–2019 year.
5. Interviewees stated that although the middle school started collecting data across one grade, in 2016, the focus of data analysis in grades 5–8 has been mostly PBIS (Positive Behavioral Intervention and Supports) data rather than achievement data and that data teams were not making an impact on instruction.
6. It was unclear to the review team whether best practices were shared among principals and then shared among staff for replication.
7. An administrator told the review team that although educators were sharing data with other educators, the district had not established a clear expectation about what teachers were supposed to do with the data.
C. In a reflective moment during an interview, a district leader noted that the district represented “seven boats in the water, floating the same way… but not a navy.”
1. When asked about how best practices were highlighted and honored, school leaders gave examples such as including them in weekly memos, doing “shout-outs” every Friday, and including best practices in daily letters to staff. Interviewees did not mention adapting or replicating best practices to improve instruction, curriculum, or assessment.
2. Administrators stated that the district made efforts to find best practices in data analysis in similar communities. For example, some Marlborough educators have sought information
12 2018 MCAS scores showed meaningful one-year gains in students’ literacy achievement at this elementary school.
39

Marlborough Public Schools Comprehensive District Review
from Milford and Somerville on how to analyze data to reduce chronic absence in the schools.
Impact: Without clear and consistent data analysis practices and a shared understanding of roles and responsibilities of those charged with using data for improvement, educators cannot use collaborative inquiry effectively to use data to inform decision making at the classroom level.
Recommendation
1. The district should clarify the roles and responsibilities of teacher leaders and principals in PLCs and establish and articulate expectations for the use of data analysis protocols.
A. The district should clarify the roles and responsibilities of teacher leaders and principals in PLCs.
B. The district should establish and articulate expectations for the use of data analysis protocols.
C. The district should build leaders’ and teachers’ data analysis skills to support improvement.
1. The district should provide educators professional development in analyzing aggregate and disaggregated student achievement data and other student information to inform curricular and instructional decisions and planning.
2. The district should provide educators support and guidance as they implement the data analysis protocols.
Benefits: Implementing this recommendation will mean a more systematic and thorough process to use data to guide instructional practice. In addition, teacher leaders will be able to collaboratively design and implement data-informed improvement practices with colleagues and develop their role as leaders. By establishing an effective collaborative inquiry process, educators will create a more data literate culture that continuously and competently supports improvement in students’ performance, opportunities, and outcomes.
Recommended resources:
ESE’s Assessment Literacy Self-Assessment and Gap Analysis Tool (http://www.doe.mass.edu/edeval/ddm/webinar/PartI-GapAnalysis.pdf) is intended to support districts in understanding where their educators fit overall on a continuum of assessment literacy. After determining where the district as a whole generally falls on the continuum, districts can determine potential next steps.
40

Marlborough Public Schools Comprehensive District Review
ESE’s District Data Team Toolkit (http://www.doe.mass.edu/accountability/toolkit/) is a set of resources to help a district establish, grow, and maintain a culture of inquiry and data use through a District Data Team.
41

Marlborough Public Schools Comprehensive District Review
Human Resources and Professional Development
Contextual Background
Marlborough has established an effective human resources department led by a director and staffed by two human resources professionals. The human resources department has the overall responsibility for recruitment and posting of all teacher, administrator, and support staff positions. The department maintains responsibility for ensuring all professional staff are appropriately licensed.
The district maintains a human resources link on its web site allowing employees access to information about mandated trainings and to the various federal, state, and local forms necessary for district employment. Such forms include district employee policies, payroll withholdings, and Criminal Offender Records Information (CORI).
The district provides a wide range of professional development (PD) offerings, ranging from in-service courses, to full and half-day PD, professional learning communities, tuition reimbursement for college and university graduate-level courses, and teachers sharing best practices. The district develops PD offerings based on PD committee survey results rather than teachers’ professional goals and student performance and outcome data.
Principals stated that the staff needed training on what could be causing students’ misbehavior. The superintendent emphasized the need for PD on strategies to raise rigor in the belief that increased rigor would result in improved student behavior.
On a school level, PD is taking on a positive new impetus for the 2018–2019 school year with the addition of teacher leaders. The principals are working with the teacher leaders to offer PD on topics such as social-emotional learning (SEL) and language-based learning. However, it was clearly stated in multiple interviews that PD at the school level was inconsistent across schools.
Strength Findings
1. The district has made a commitment to recruit and retain highly qualified teachers and administrators from current staff as well as from external sources.
A. The district has made a concerted effort to attract highly qualified candidates that reflect the composition of its student body.
1. In order to develop a diverse pool of highly qualified teacher candidates, the district’s human resources department regularly participates in job fairs at Boston University, Worcester State University, and Framingham State University. It also advertises open teaching positions on the district’s web site and on SchoolSpring.
2. In seeking to diversify its teacher workforce, the district has developed a partnership with Lasell College to provide a pipeline of diverse candidates. For example, a Marlborough High
42

Marlborough Public Schools Comprehensive District Review
School graduate attending Lasell College is preparing to become a chemistry teacher at Marlborough High School.
3. When asked what attributes make Marlborough attractive to new teachers, interviewees spoke of the support that staff receive when they work in Marlborough, the thoroughness of the hiring process, the addition of supervisory positions to increase support for teachers, technology resources, the fact that the district embraces all students, and the emphasis on teachers’ professional growth.
4. The district has provided Sheltered English Immersion (SEI) training for all teachers and provides a staff of eight translators.13
5. At the high school, teacher assignments are generally based on students’ needs and teachers’ qualifications, as opposed to a strict seniority assignment.
B. To support teachers new to the profession, Marlborough has a required two-year mentoring program with an orientation and trained mentors paired with new teachers. New teachers meet periodically with their mentors. Veteran teachers new to the district participate in the year 1 new teacher program but do not receive a mentor. A purpose of the district’s induction program is to promote “The Marlborough Way.”14
C. The district has identified a priority to develop and maintain a career ladder and opportunities for leadership development for employees.
1. Interviews and a document review indicated that in the 2018–2019 school year, the district instituted a teacher leader program at all schools. In these positions, teacher leaders facilitate grade-level professional learning communities (PLCs) to discuss student achievement and curriculum development/implementation, while also developing their potential as school leaders.
a. Teacher leaders also serve as the voice for a grade level (for example, by participating in some district leadership meetings) in matters dealing with curriculum or district and school-based concerns.
2. Three of the five current school principals were promoted from within the district.
3. Likewise, the previous and current superintendents each moved into their leadership positions from within the district.
Impact By embracing ongoing efforts to recruit, develop, and support diverse, highly qualified teachers, the district is likely to see an increase in the overall quality of instructional practices resulting in increased student learning. 13 Translators provide written translations, answer dedicated telephone lines, and attend conferences and all school events.14 The Marlborough Way as stated in the Marlborough High School Improvement Plan, 2018–2021,: “Through Mutual Respect, Kindness, Responsibility, Teamwork, and Problem-Solving, we take pride in the pursuit of excellence.”
43

Marlborough Public Schools Comprehensive District Review
Challenges and Areas for Growth
2. The district’s educator evaluation system does not prioritize opportunities for educators to receive high-quality feedback15 that helps them improve their practice.
A. The team reviewed the evaluative documentation of 46 teachers in TeachPoint, the district’s educator evaluation management system.
1. Although teachers’ evaluations were informative,16 they were missing instructive feedback that would promote the professional growth of a teacher.
2. Only 9 of 46 teacher evaluations spanning 2015–2016 and the start of the 2017–2018 school year provided high-quality feedback that would contribute to teacher growth.
3. Administrators in several interviews stated that formal evaluations did not drive learning as much as informal conversations after observations.
4. Some teachers told the team that effective development of SMART goals and the quality of evaluation feedback varied depending on the evaluator.
5. Teachers and administrators stated that while TeachPoint was a powerful tool, evaluations were seen as a task, and the work invested in the educator evaluation process was exhausting. One interviewee stated that the time could be better used for planning and instruction.
B. The team also reviewed the evaluative documentation of 29 principals, supervisors, and central office administrators in TeachPoint.
1. Although administrators’ evaluations were informative, they did not generally provide high-quality feedback that would contribute to the professional growth of the respective supervisor, principal, or other administrator.
C. Many of the student learning and professional practice goals in the evaluative documentation reviewed were not SMART goals.17
1. The district provides training on the development of SMART goals for teachers new to the district.
15 High-quality feedback is specific, timely, and actionable.16 An informative evaluation is factual and cites instructional details such as methodology, pedagogy, Standards and Indicators of Effective Teaching Practice or instruction of subject-based knowledge that is aligned with the state curriculum frameworks. It does not commit to improvement strategies. An instructive evaluation includes comments intended to improve instruction.17 SMART goals are specific and strategic; measureable; action-oriented; rigorous, realistic, and results- focused; and timed and tracked.
44

Marlborough Public Schools Comprehensive District Review
D. As of the 2015–2016 school year, state educator evaluation regulations (603 CMR 35.07) call for districts to collect and use student feedback as evidence in the teacher evaluation process and staff feedback as evidence in the administrator evaluation process. This feedback may also be used to inform an educator’s self-assessment, goal setting, or as evidence to demonstrate growth over time.
1. The use of student feedback as evidence in the teacher evaluation process is prevalent at the secondary level in the district, with plans to extend this practice to additional grade levels.
2. The team did not find evidence that staff feedback was used in the administrator evaluation process.
E. The team did not find evidence of the use of educators’ impact on student learning in the educator evaluation process.18
Impact: Without high-quality (specific, timely, and actionable) feedback designed to contribute to the professional growth of teachers and administrators, the district is missing opportunities to help educators build their skills and improve students’ learning experiences and outcomes.
Recommendations
1. The district should promote educators’ growth by fully implementing all components of the educator evaluation system, with a particular emphasis on ensuring that all educators receive high-quality feedback.
A. The district should implement systems to ensure that all educators develop student learning and professional practice goals that are SMART (Specific and Strategic; Measureable; Action-Oriented; Rigorous, Realistic, and Results- Focused; and Timed and Tracked).
18 On Tuesday, February 28, 2017, after collecting public comment since November 2016, the Board of Elementary and Secondary Education voted 9-1 to amend the educator evaluation regulations. The most significant change in the regulations is the elimination of a separate student impact rating. Under the amended regulations, evaluators do not have to make a separate judgment about an educator’s impact on student learning. Instead, student learning is embedded as an indicator within one of the Massachusetts Educator Evaluation Framework’s four standards.
45

Marlborough Public Schools Comprehensive District Review
1. Performance ratings for all educators should be based in part on educators’ impact on student learning.
B. The district should support and monitor the skills and practices of evaluators to ensure that the feedback they provide is specific, instructive, actionable, and relevant to professional growth and student outcomes.
1. Evaluators should participate in calibration training and activities to ensure quality, accuracy, and consistency in the evaluation process and documentation.
C. The district should identify opportunities to streamline the evaluation process to ensure that it is valuable to educators and supports their growth and development.
Benefits: A fully implemented educator evaluation system that prioritizes high-quality feedback will help educators improve their practice. This will likely lead to increased student performance and outcomes.
Recommended resources:
A Protocol for developing S.M.A.R.T Goal Statements (http://www.doe.mass.edu/edeval/resources/) is designed to support educators in developing S.M.A.R.T. goal statements using the appropriate evaluation rubric and an ESE-developed protocol. The Evidence Collection Toolkit (http://www.doe.mass.edu/edeval/resources/) is designed to help districts establish clear and consistent expectations for evidence collection and promote a meaningful process for the collection, analysis, and sharing of high-quality artifacts. The toolkit Includes: brief guidance, examples of district strategies, a worksheet for district decision-making, and a handout of Evidence Collection Tips for Educators.
On Track with Evaluator Capacity (http://www.doe.mass.edu/edeval/resources/pln/OnTrack-EvaluatorCapacity.pdf) is an interactive document that provides specific strategies, lessons learned, and links to district-created resources. It was produced by eight districts that were part of a Professional Learning Network for Supporting Evaluator Capacity.
Quick Reference Guide: Opportunities to Streamline the Evaluation Process (http://www.doe.mass.edu/edeval/resources/QRG-Streamline.pdf) is designed to help districts reflect on and continuously improve their evaluation systems:
o What’s working? What are the bright spots?
o How can we streamline the process to stay focused on professional growth and development?
o What do we need to adjust to ensure our system is valuable to educators and students?
ESE’s Educator Evaluation Training Workshops (http://www.doe.mass.edu/edeval/training/teachers/default.html) provide a general overview to the educator evaluation framework as well as opportunities to engage in activities associated with
46

Marlborough Public Schools Comprehensive District Review
the first three steps of the 5-Step Cycle. This is a particularly helpful resource for educators new to the educator evaluation framework.
ESE’s Evaluator Calibration Training resources (http://www.doe.mass.edu/edeval/resources/calibration/) include tools, protocols, and videos to support evaluator calibration around perceptions of practice aligned to ESE’s model rubrics as well as high quality feedback.
Quick Reference Guide: Student and Staff Feedback (http://www.doe.mass.edu/edeval/resources/QRG-Feedback.pdf) provides information about how to select feedback instruments and use feedback as part of the educator evaluation system, along with links to relevant resources.
2. The district’s professional development systems should be informed by data and aligned with teachers’ professional goals.
A. The district’s professional development (PD) committee should provide a set of learning experiences that is varied, systematic, informed by student and educator data, and aligned with teachers’ professional goals.
1. The district’s PD plan should identify specific PD needs, determine how they might be met, and recommend adjustments in PD practices to meet them.
2. PD should include teacher-led PD and job-embedded, content-based, and individually pursued learning, with structures for collaboration that enable teachers to improve implementation of standards-aligned curricula and instructional practice.
3. The program should address needs indicated by student achievement data, trends from classroom observations, and the district’s annual needs assessment survey. It should include goals focused on improving teachers’ practices and student outcomes in alignment with the district’s curricula.
Benefits: Implementing this recommendation will help to ensure that educators at all stages of their careers receive high-quality, appropriately targeted PD that improves their knowledge, skills, and ability to meet the learning needs of all students. A high-quality PD program coupled with the time and resources available in the district will likely serve to improve professional practice and student outcomes.
Recommended resources:
The Massachusetts Standards for Professional Development (http://www.doe.mass.edu/pd/standards.pdf) describe, identify, and characterize what high quality learning experiences should look like for educators.
47

Marlborough Public Schools Comprehensive District Review
Identifying Meaningful Professional Development (https://youtu.be/zhuFioO8GbQ) is a video in which educators from three Massachusetts districts discuss the importance of targeted, meaningful professional development and the ways districts can use the evaluation process to identify the most effective PD supports for all educators.
Professional development case studies (http://www.doe.mass.edu/pd/CaseStudies/) highlight districts implementing meaningful professional development programs that support educators throughout the entire career continuum. Watch examples of PD programs that are job-embedded, teacher-led, data-driven, and aligned to educator and district needs.
48

Marlborough Public Schools Comprehensive District Review
Student Support
Contextual Background
Marlborough is a mid-sized district with overall student enrollment that increased by 0.9 percent between 2014 and 2018. Many students come to school each day with unique programmatic and support needs. In 2018, 58.4 percent of the district’s students were part of the high needs student group because they were in one or more of the following student groups: economically disadvantaged students, students with disabilities, and English learners (ELs) or former ELs, compared with 46.6 percent of statewide enrollment. ELs made up 24.1 percent of the total student population, compared with the state average of 10.2 percent. Economically disadvantaged students represented 35.8 percent, compared with 32.0 percent statewide. In addition, students with disabilities made up 17.2 percent of enrollment, compared with 17.7 percent across the state. In 2018, the district’s rate of chronic absence was 13.3 percent, compared with the state rate of 13.2 percent. The percentages of chronically absent students in the district were as follows: 23.3 percent in grade 9; 24.2 percent in grade 10; 26.8 percent in grade 11; and 22.7 percent in grade 12.19
The district supports these students by offering various academic interventions to support language acquisition and mastery of English and math content. The district follows an inclusion model along with academic interventions for students with disabilities and it offers pull-out programs for English learners to support mastery of content and specialized services. The district has invested heavily in providing paraprofessionals to support the learning objectives of its struggling students and the new superintendent has been studying the use of paraprofessionals in the district.20
The district has not established a districtwide system to identify and provide differentiated support for students. The district has some elements of a student support system including administration of universal screeners and benchmarks at the elementary and middle schools. However, the high school does not have universal screeners, benchmarks, and progress monitoring to adjust curriculum, instruction, and move students in and out of interventions. There is an absence of data and diagnostic evidence to identify and provide social-emotional learning interventions and supports for students. The district does not have a districtwide screening tool, progress monitoring, and benchmarks and/or summative assessments to identify and move students in and out of interventions. The district is exploring universal screeners for making decisions about placement, progress monitoring, and exiting social-emotional supports and interventions.
There is structured time for K–12 teachers to meet and they have access to data via Aspen, but many staff have not received training on how to analyze data, conduct root cause analysis, and systematically provide student interventions. High-school teachers are challenged to schedule PLCs to include special education and English learner teachers.
19 See the Student Performance section and Table B2b in Appendix B of this report.20 According to DESE’s RADAR Benchmarking, between 2014 and 2018 the number of paraprofessional FTEs per 100 students in the district increased by 45 percent, compared with an 8 percent increase statewide.
49

Marlborough Public Schools Comprehensive District Review
The district’s approach to ensuring physical safety, security, equity, and access in its schools is not based on school-level data analysis but rather on providing parity among all school sites. To ensure the social and emotional safety and support for all students, the schools have taken great efforts to implement positive behavioral approaches. At the middle school, the ROAR21 program has shown promise and resulted in the elementary and high schools decision to implement their own PBIS (Positive Behavioral Intervention & Supports) programs in 2018–2019. The high school has also been redesigned into 9 th and 10th grade teams with two houses each to improve student behavior. One elementary school has instituted a safe harbor room and the middle school has an anti-bullying curriculum as part of the health class.
Strength Finding
1. The district has prioritized the physical and emotional safety of all students. It supports schools to foster safe, positive, inclusive, and welcoming learning environments.
A. The district has made efforts to ensure that all schools are safe, supportive, culturally responsive, and reflective of the community and students’ cultures and identities.
1. The review team was told that the district has hired translators for every school and has hired EL (English learner) district and school staff who speak Spanish and Portuguese.
a. The high school has one bilingual counselor, the middle school has two, and elementary schools each have one bilingual counselor.
b. To foster greater school-home communication, the district created a translation department to translate documents and to interpret during meetings and events.
2. Interviews and a document review indicated cultural proficiency as a district priority.
a. WE Surveys are administered at all schools. WE Survey results have encouraged district- and school-based cultural proficiency training and are a Professional Learning Community (PLC) focus.
b. The district used a K–4 ELA curricular materials review process to ensure selection of academic programs free of bias and accessible to all learners.
3. Interviews and a document review indicated that the district has provided multiple levels of supports to increase engagement.
a. The district has hired school adjustment counselors, guidance counselors for grades 5–12, school psychologists K–12, behavioral specialists, and nurses.
b. The middle and high schools offer a variety of extracurricular activities to promote engagement of all students, for example, social justice clubs for LGBTQ students
21 ROAR stands for No LeaRning can Occur without A significant Relationship. ROAR core values: We are Respectful, we explore Opportunities, we engage in Academics, and we are Responsible.
50
Marlborough Public Schools Comprehensive District Review
(lesbian, gay, bisexual, transgender, and queer). The high school has over 40 clubs and 31 sports teams. Each elementary school offers a variety of extracurricular activities and clubs during and after school.
c. The district reorganized the high school into 9th and 10th grade teams themed around art, business and STEM (science, technology, engineering, and math). Each team contains two houses with an Advisory system to increase student engagement. The middle school has interdisciplinary teaming with approximately 100 students per team.
4. Interviews and a document review indicated that the district has made efforts to ensure a safe environment for all students, as outlined in District Improvement Plan objective 5.5.
a. To ensure that students, staff, and visitors are safe and secure, each school has an electronic entry system located at the main entrance. Schools have limited the number of entrances to buildings and required all visitors to sign in at the main office and wear identification badges. Surveillance cameras have been installed in all schools.
b. Every staff member has ALICE22 training every year.
c. The Marlborough police department has hired and has supervised two school resource officers, who provide an additional level of security and protection to students and staff at the middle and high schools.
Impact: The district has personnel, programs, and resources in place to provide an environment that is conducive to teaching and learning.
Challenges and Areas for Growth
2. The district has not created a proactive approach and coherent system to meet the needs of all students.
A. Interviews, observations, and a document review indicated that core instruction did not follow a data-based tiered approach to support the varied learning needs of all students.
1. In observed classrooms, the review team found few evidence-based instructional strategies designed to meet students’ individual learning needs, skill levels, interests, or levels of readiness.
2. In addition, pull-out instruction replaces rather than supplements core instruction for English learners (ELs) at the middle school; these ELs do not have access to the full curriculum, including STEAM and Mandarin classes.
22 ALICE stands for (Alert, Lockdown, Inform, Counter, Evacuate).
51

Marlborough Public Schools Comprehensive District Review
3. Interviewees reported that high-school teachers did not have access to research-based interventions to implement as part of core instruction when students were struggling.
4. Professional learning is abundant but is not data driven.
a. The district allows teachers to select professional learning offerings based on interest rather than on student needs or identified professional growth goals.
B. Interviews and a document review indicated limited use at the high school of scientifically validated assessments for screening, diagnostic, and progress monitoring to make instructional and intervention decisions.
1. Assessment at the high school is more course dependent than at the elementary and middle-school levels. Interviewees told the review team that high-school teams have not been trained on the use of data and tiered interventions. As a result, assessment data does not effectively inform curriculum adjustment, instruction, and moving students in and out of interventions.
2. The elementary and middle schools use FASTT Reading, FASTT Math, CBM Reading and CBM math, Developmental Reading Assessment (DRA), and the Test of English Language Learning (TELL). Teachers use assessment data to plan instruction, interventions, and curriculum.
3. The district adopted the screening brief intervention report for treatment (SBRIT) for grades 7 and the high school to identify mental health concerns. The high school also administers the MetroWest Health Survey every other year to identify the frequency of behaviors such as drinking and smoking.
4. Interviewees told the team that while the district had student support teams and provided after-school help, supports were not systematic and academic and behavior interventions were uneven.
C. There is inconsistency between the new procedures used by school-based leadership teams and teacher teams in PLCs to facilitate data-based discussions and decisions on behalf of students.
1. Documents describe a four-step problem-solving model.
a. The process is described as providing the structure to “identify, develop, implement and evaluate strategies to accelerate the performance of ALL students.” Documents note that the use of scientifically based or evidenced-based practices should take place.
b. Documents note that “the process is applicable to all three tiers of instruction/intervention and can be used… at the community, district, school, classroom and/or individual student levels.
c. The use of this model is not evident within school leadership and teacher teams’ processes and procedures.
52

Marlborough Public Schools Comprehensive District Review
Impact: In a highly functioning student support system, academic outcomes are influenced by several factors, including core instruction that meets students’ needs, the use of data from scientifically validated assessments to inform the additional supports provided to students, and a consistent process for evaluating the impact of interventions. Without these elements, students’ academic, behavioral, and social-emotional growth may not be supported and sustained. Proactive systems and practices to address the needs of all struggling students are especially critical given the persistent performance gaps in the district for students with disabilities, English learners, and economically disadvantaged students.
3. The district has not fully established a strong, collaborative family partnership.
A. Interviews and a document review indicated that district’s model of family engagement relies upon traditional methods of communication and participation rather than research-based, collaborative best practices for engaging families.23
1. Methods of family engagement in the district include finding services for families, one-way communication, and volunteering.
a. For example, the district provides book events and classes for members of the community.
2. Interviewees’ responses indicated that the district did not have a shared definition of engagement and did not use data to measure the effectiveness of family engagement efforts.
B. The district has made efforts to ensure communication with non-English speaking families. These efforts include hiring translators to attend school meetings and events and using telephone systems that send messages in Spanish, Portuguese, and English; translating all written communications; and offering family nights and classes for families to improve English language acquisition.
C. The district is working to increase parents’ input on issues related to special education via the special education parent advisory council and English learners via the parent/guardian of English learners advisory council (PELAC).
Impact: Research consistently confirms that family engagement is one of the most powerful predictors of children’s development, educational attainment, and success in school and life. Limited family engagement can disrupt the formal and informal systems and supports that are necessary to support students’ academic progress and behavioral, social, emotional, and physical development and well-being, as well as their persistence in school and success beyond high school. Without a shared definition and clear metrics to measure effectiveness, the district’s ability to evaluate its family engagement efforts is limited.
23 Research-based best practices of family engagement include students learning anywhere, anytime, rather than only in school; the district determining the goals of family engagement and providing engagement activities to meet these goals; and the district and families actively co-creating opportunities for family engagement.
53

Marlborough Public Schools Comprehensive District Review
Recommendations
1. The district should develop and implement a districtwide system to identify at-risk students using assessment data, provide multi-tiered academic interventions, and employ ongoing progress monitoring to meet the needs of all students.
A. District leaders should ensure that the district’s comprehensive data system includes a live dashboard that holds student information, academic data, and social-emotional interventions coded by tier.
1. The district should establish or build on academic and social-emotional early warning indicators for grades 6–12 and align current interventions to each early warning indicator.
B. District leaders should identify and schedule administration at the high school of research-validated universal screeners, interim/benchmark and summative academic and social-emotional assessments.
1. The district should establish performance targets for students K–12 based on research-validated assessments with pre-identified scale scores and/or cut points.
C. District leaders should enhance the district’s system of support by clarifying the supports in each tier and providing guidance to educators as they provide support and interventions to students.
1. The district should revisit Tier 1 to ensure equity and access to high-quality, core academic instruction and social/emotional/behavioral learning and supports. Tier 1 should be differentiated for students through the principles of universal design for learning---creating instructional goals, methods, materials, and assessments that work for everyone---and should provide flexible approaches that can be customized and adjusted for individual needs.
a. District leaders should establish the duration and intensity of core instruction, including differentiation in Tier 1 by grade level and content area.
b. District and school leaders should collaboratively identify job-embedded, ongoing professional learning opportunities for teachers and paraprofessionals to learn and use Tier 1 classroom interventions and supports in curriculum and instruction.
c. District leaders should ensure that educators have access to a complete and aligned curriculum that supports teachers to challenge and support all students.
2. District leaders should ensure that Tiers 2 and 3 reflect targeted and intensive instruction, supports, and interventions for students who have not progressed in Tier 1 based on early warning indicators and thresholds.
54

Marlborough Public Schools Comprehensive District Review
a. District leaders should identify targeted, time-bound (6–8 weeks or as identified by district) interventions and/or supports for either academic or social-emotional issues.
b. District and school leaders should review current schedules to ensure that Tiers 2 and 3 interventions and/or supports have sufficient time to improve outcomes and are free of access barriers (i.e., students missing core instruction by being placed in an intervention).
c. The district should revise pre- and post-assessment and progress monitoring tools for Tiers 2 and 3 interventions/supports as needed.
d. District leaders should revisit school support team roles and responsibilities and re-establish them at each school. In addition, the district should offer districtwide training to support implementation and success of student supports.
3. District leaders should revise current professional learning community processes to include identification of students at-risk and students who struggle.
a. District leaders should identify professional learning opportunities for school leaders, teachers, and paraprofessionals to build their capacity to meet protocols and use data in professional learning communities.
b. The district should establish expectations for teachers who monitor students’ academic and social-emotional progress and the role the grade-level or content team plays in making support decisions on behalf of students and in partnership with families.
c. District and school leadership teams should regularly and systematically evaluate the implementation of tiered instruction, interventions, and supports, including reviewing individual, group, and aggregate data and determining whether interventions are structured and assigned equitably.
Benefits: By implementing these recommendations, the district will be better able to identify students at risk of poor academic and social-emotional outcomes, and to respond early and often in order to meet students’ unique needs.
Recommended resources:
ESE’s Early Warning Indicator System (http://www.doe.mass.edu/edwin/analytics/ewis.html ) is a tool to provide information to districts about the likelihood that their students will reach key academic goals. Districts can use the tool in conjunction with other data and sources of information to better target student supports and interventions and to examine school-level patterns over time in order to address systemic issues that may impede students’ ability to meet academic goals.
The Early Warning Implementation Guide http://www.doe.mass.edu/edwin/analytics/implementation-guide.pdf ) provides information on how to use early warning data, including the Massachusetts Early Warning Indicator System (EWIS),
55

Marlborough Public Schools Comprehensive District Review
to identify, diagnose, support and monitor students in grades 1-12. It offers educators an overview of EWIS and how to effectively use these data in conjunction with local data by following a six-step implementation cycle.
The Massachusetts Systems for Student Success (SfSS) (http://www.doe.mass.edu/sfss/) is a blueprint for school improvement that focuses on systems, structures and supports across the district, school, and classroom to meet the academic and non-academic needs of all students. The SfSS website includes links to a self-assessment and a variety of helpful resources.
The Educator Effectiveness Guidebook for Inclusive Practice (http://www.doe.mass.edu/edeval/guidebook/) includes tools for districts, schools, and educators that are aligned to the MA Educator Evaluation Framework and promote evidence-based best practices for inclusion following the principles of Universal Design for Learning, Positive Behavior Interventions and Supports, and Social and Emotional Learning.
The Wraparound Replication Cookbook (https://sites.google.com/site/masswazcookbook/) is a practical guide focused on improving academic performance by systematically addressing students’ social emotional and non-academic needs. It is based on the experience of several Massachusetts districts, and is organized according to the following key strategy areas:
o Addressing School Culture and the Social Emotional Aspects of Learning
o Rethinking Systems for Identifying and Addressing Academic and Social Emotional Needs
o Creating Focused Partnerships & Coalitions
Every Student, Every Day: A Community Toolkit to Address and Eliminate Chronic Absenteeism (http://www2.ed.gov/about/inits/ed/chronicabsenteeism/toolkit.pdf) is a set of Action Guides that provide information and resources to help ensure that all young people are in school every day and benefitting from coordinated systems of support.
2. The district should enhance its current practices to strengthen collaborative relationships with families.
A. The district should establish a districtwide definition of family engagement at each level.
1. The district should ensure that family engagement practices and programs are aligned with district and school goals.
a. District leaders and families should collaboratively establish family engagement goals that are aligned with district and school goals, and develop metrics to measure family engagement and its impact on student outcomes.
b. Educators should regularly analyze data to evaluate family engagement and determine whether programs and practices should be continued, modified, or eliminated.
56

Marlborough Public Schools Comprehensive District Review
c. The district should ensure that family engagement practices, programs, and partnerships are strengths-based, culturally responsive, and equitable.
d. The district should establish and expand meaningful opportunities for family leadership, and ensure that those in leadership roles are representative of the community.
B. The district should ensure that family engagement practices and programs are informed by research-based best practices for family engagement.
1. The district should ensure that family engagement practices and programs take place across a variety of settings, including homes, schools, and community spaces, libraries, after-school programs, and museums.
2. District leaders in collaboration with school leaders should determine ways of incorporating data sharing into family engagement practices, programs and partnerships.
3. The district should develop districtwide strategies to engage families in transitions in their children’s education (i.e., entry into pre-school, kindergarten, middle school, and high school).
Benefits: Implementing this recommendation will foster a strengths-based collaboration between the schools and home that will enable and empower families to be more involved in their children’s development. This likely will result in improved student outcomes.
Recommended resources:
ESE’s Family and Community Involvement web page (http://www.doe.mass.edu/FamComm/f_involvement.html) provides several resources, including ESE’s Guide to Parent, Family, and Community Involvement.
The Global Family Research Project’s overview of resources (https://globalfrp.org/Articles) includes links to several articles and videos related to empowering families in children’s learning.
Joining Together to Create a Bold Vision for Next-Generation Family Engagement: Engaging Families to Transform Education (https://globalfrp.org/Articles/Joining-Together-to-Create-a-Bold-Vision-for-Next-Generation-Family-Engagement-Engaging-Families-to-Transform-Education) is a report from the Global Family Research Project that identifies five areas that can serve as “building blocks” for family engagement strategies and recommendations for the future of family engagement.
ESE’s Special Education web page (http://www.doe.mass.edu/sped/) includes links to guidance, legislation, and resources for parents of children with disabilities.
o Overview, technical assistance documents: http://www.doe.mass.edu/sped/docs.html
o Overview, other parent information: http://www.doe.mass.edu/sped/parents.html
57

Marlborough Public Schools Comprehensive District Review
Guidance for Special Education Parent Advisory Councils (http://www.doe.mass.edu/sped/pac/) was created to ensure that every PAC operating in the state fully understands the capacity and potential that PACs have to collaborate with the school community to influence special education programs and policies in their school districts.
Ninth Grade Counts (https://www.greatschoolspartnership.org/resources/ninth-grade-counts/) is a resource to help high schools identify weaknesses in their ninth-grade programs, and then develop a purposeful, proactive plan to strengthen this critical educational transition. The guide is divided into three areas of focus:
o Strengthening the Transition into High School
o Strengthening the High School Transition for English Language Learners
o Using Summer Bridge Programs to Strengthen the High School Transition
Parents’ Guides to Student Success (http://pta.org/parents/content.cfm?ItemNumber=2583 ) are grade-specific guides from the National PTA (available in English and Spanish) with specific descriptions for parents of what children should be learning once Common Core standards are fully implemented, along with suggestions for helping students at home and communicating with teachers.
58

Marlborough Public Schools Comprehensive District Review
Financial and Asset Management
Contextual Background
According to the Department of Revenue’s At A Glance report for Marlborough, in 2015 the city had a population of 39,818. According to DESE data, in 2017 the district had an enrollment of 4,543 students. An additional 733 students were tuitioned out of district to charter, choice, and special education schools. According to the Department of Revenue’s 2018 At A Glance Report, the city is in a strong financial position with $3.4 million in new growth, excess levy capacity of $33.6 million, a stabilization fund of $13.7 million, and free cash of $8.9 million. Because of substantial new growth and a large commercial tax base, the average family tax bill is reasonable at $5,075.
The city has supported education; in 2017–2018, the city funded the district at 42 percent above the required net school spending level. Through its long-range capital plan, the city has also supported the district’s capital needs, including roof replacements, masonry repairs, window replacements, and security systems. The city has approved funding for a new elementary school to open in 2020 using its bonding capacity and MSBA (Massachusetts School Building Authority) support without the need for an override vote. The city has recently taken over maintenance needs of school buildings and shares the services and costs of some technology staff. City offices assist the district with bids, contracts, and other procurements. The district and the city do not have a formal written agreement on municipal expenditures that are provided to the district, but the district and the city have found those charges reasonable.
The district has implemented several improvements to its financial management procedures. It has documented on its website and in staff handbooks policies and procedures for purchasing, bidding contracts, reimbursements, accepting gifts and grants, and student activity accounts. As required by law, its student activity accounts were scheduled for audit in October 2018. The school committee receives monthly financial reports on the status of the school budget. The district manages deficits in school and program salary and operating accounts by making monthly transfers approved by the school committee. The district has not overspent its budget or grant appropriations in recent years. Following an accumulation of unpaid student lunch bills a few years ago the school committee now receives regular reports on those unpaid balances and monitors them.
The District Improvement Plan includes a goal and initiatives to improve the alignment of district budgets and expenditures to school and student needs, based on student performance data and district and school goals. Other goals include better tracking of financial data, improving inventories of capital needs, and forecasting capital replacements.
59

Marlborough Public Schools Comprehensive District Review
Strength Findings
1. The district is well funded by the city, and it has made it a priority to use its funds effectively to improve students’ performance, opportunities, and outcomes.
A. Between 2008 and 2018, according to DESE data, the city’s support of the district consistently exceeded the net school spending (NSS) requirement.
1. In fiscal year 2017, the district’s NSS exceeded the requirement by 36 percent and showed a 5 percent increase over fiscal year 2016.
2. For fiscal year 2018, the budgeted district and city spending on education was 42 percent above the required NSS level.
B. City officials voiced support for the schools and their needs and expressed trust in district leaders and their budget requests.
1. The mayor serves as chair of the school committee. The superintendent and school committee members stated that the mayor has supported district budgets and funding for capital needs.
2. City officials emphasized that the city needed to support a high-quality school system.
3. City officials stated that they trusted the district to make reasonable requests.
4. Administrators told the review team that they avoided surprises by bringing to the attention of school committee members and city officials anticipated increases such as the busing contract and operations needs for the new elementary school.
5. City officials reported that they could fund city and district capital needs, including a new elementary school, from the general fund, free cash, new growth, and bonding capacity without the need for an override.
a. The city’s fiscal years 2019–2023 capital plan includes $5.75 million in school capital projects in addition to the new elementary school and other projected Massachusetts School Building Authority (MSBA) reimbursements.
6. The district has funded up-to-date classroom technology and a one-to-one Chromebook program for grades 3–12.
C. Interviews and a document review indicated that the district has made a priority of using its funds effectively by reallocating funds and searching for savings.
1. District administrators said that they tried to reallocate funds from other areas when funding new initiatives or improvements.
60

Marlborough Public Schools Comprehensive District Review
a. Principals and administrators are given the opportunity to make budget requests for initiatives and school needs but they are asked to look for savings to help fund them. The budget document includes some of their requests along with descriptions of offsets or savings elsewhere.
a. Administrators reported that they were able to use surplus funds at the end of the 2017–2018 school year to fund new printers for the district.
2. The district has reallocated resources to hire translators instead of contracting them. It reallocates funds from staffing such as paraprofessionals, a communications director, and the salary reserve account to fund needed instructional staff and translators.
3. In the proposed fiscal 2019 budget, administrators suggested reallocating Title I funds to hire two reading specialists needed for the high school.
4. Administrators look for savings in areas such as out-of-district tuitions and salary reserves, and audit district transportation to reduce costs.
5. Administrators have reallocated funding for curriculum coordinators to fund teacher leaders and curriculum supervisors.
D. The district has been able to maintain services and programs such as the arts, early college experiences, and robotics, and has avoided charging fees for kindergarten, field trips, student sports, and other activities. The district also hopes to fund the expansion of the preschool program.
Impact: The district’s educational programs have benefitted from the city’s support for the schools and the district’s efforts to search for savings and reallocate funds.
2. The city and the district ensure that school facilities are clean, safe, and conducive to learning, and are constructing a new elementary school to alleviate overcrowding. They are planning effectively for financing and implementing needed improvements of facilities and technology.
A. School facilities are clean, safe, and conducive to learning; when problems arise with facilities they are dealt with promptly.
1. The school buildings date from 1931 to 1976 with renovations and additions as recent as 2000. Two elementary schools added modular classrooms in 1995.
2. In 2017, the district and the city agreed to transfer maintenance operations to the city because some maintenance supervisors and personnel were reporting to both the district and the city. District and school administrators agreed the change was working well.
3. Municipal officials and district administrators reported that they were keeping up with school cleaning and maintenance needs.
61

Marlborough Public Schools Comprehensive District Review
a. They reported that maintenance staff dedicated to schools included electricians, HVAC (heating, ventilation, and air conditioning) specialists, a plumber, and custodial staff at each school.
b. Municipal officials and district administrators submitted to reviewers a comprehensive checklist of routine maintenance performed for all the schools including annual boiler maintenance, fire alarm system inspections, and elevator maintenance.
4. When a moisture problem affected one of the schools in August 2018, maintenance and custodial personnel were able to remediate the classrooms promptly, preparing them in time for opening day.
5. Reviewers found the schools to be clean and well maintained, with secure entrances.
a. Parents also reported that schools were locked and secure.
B. A new elementary school is under construction in order to alleviate current and anticipated overcrowding and to implement the district’s desire to move grade 5 into the elementary schools.
1. Administrators said that the Massachusetts School Building Authority (MSBA) has approved funding for the construction of the new school. At the time of the onsite in October 2018, bids for the general contractor were scheduled to open in October 2018.
2. Administrators and city officials reported that the city has approved funding for the new school with the city using its bonding capacity and revenues from new growth and without the need for an override vote.
3. Administrators and school committee members told the team that the new school was being built to alleviate overcrowding at some schools and enable grade 5 to move from the middle school to the elementary schools.
a. Elementary teachers and parents reported that there was not enough space in some schools for specialists to work with pull-out groups.
b. Reviewers observed overcrowding in some schools, including an absence of elementary art and music rooms and pull-out instruction taking place in corridors.
4. Reviewers observed site preparation for the new school already underway, and district administrators confirmed the scope and scale of the project.
C. The city and the district have long-range plans for facility repairs and renovations and for technology upgrades.
1. The city’s long-range capital plan includes extraordinary maintenance and renovation projects for the schools along with other city facilities, including masonry repairs, roof
62

Marlborough Public Schools Comprehensive District Review
replacements, generators, and window replacements. It also includes a funding plan allocating general funds, debt, and MSBA support to each project. The district technology plan for 2017–2020 notes accomplishments, such as the one-to-one Chromebook plan for grades 3–12 as well as action steps for future replacements and upgrades of equipment, planned professional development and IT staffing.
Impact: Because the district has maintained and renovated its buildings, its classroom spaces are appropriate for teaching and learning. It is dealing effectively with overcrowding problems by building a new school. The district’s commitment to maintaining and upgrading technology and to training teachers to use technology effectively contributes to a high-quality education for today’s students.
Challenges and Areas for Growth
3. The district’s budget document does not clearly detail how funds and staffing are allocated to schools and programs. The document is linked to only one district goal; it does not contain references to student performance data. The budget document does not summarize anticipated grants and other revolving funds.
A. The budget document includes a message from the superintendent emphasizing the relationship of a budget to the district’s shared values, but the budget document does not make clear the relationship of the budget to district and school goals and student performance data.
1. The budget is not explicitly connected to district improvement planning. The budget document’s only reference to district goals concerns support for family participation.
2. The only reference to data is to student enrollment data. References to group, school, and district performance data are not evident in the budget document. It is unclear how student data is used to set budget priorities.
3. The superintendent told the review team that he and other administrators answered questions during school committee budget workshops about additional staff or reductions in teachers at certain schools. The superintendent noted that the budget document provided enrollment data for each elementary school and grade to justify those additions and reductions.
4. The superintendent said that he was looking at adjusting the budget and stated that student performance and resources needed to show better alignment.
5. In its self-assessment submitted before the onsite review, the district noted that it wanted to improve the use of student outcomes in justifying budget requests and to tie them to district and school improvement goals.
63

Marlborough Public Schools Comprehensive District Review
a. Administrators stated that they hoped to improve budget documents so that they conformed to the high standard recommended by the National Association of School Business Officials.
B. The budget document summarizes the total cost for the budget compared with previous years and it highlights significant proposed changes.
1. The total for the fiscal year 2019 budget was $61,756,164, an increase of 2.88 percent over fiscal year 2018.
2. The budget document notes significant increases in costs such as for collective bargaining and translators for the schools. It also notes that additional staff will not be required to maintain current class sizes.
3. The budget document compares the proposed budget to district budgets for fiscal years 2014–2018 and explains the effect of moving the responsibility for maintenance services to the city. It also notes increases in state funding.
4. The budget document provides information on anticipated fiscal year 2021 increases for busing and opening a new school, and the appendices list requests for technology and capital improvements.
C. An additional document provides detail about each budget line and staffing request sorted by function code rather than by location or program, and without a subtotal for each program and school.
1. A MUNIS printout lists every budget line for the proposed fiscal year 2019 budget compared with fiscal year 2017 actuals and fiscal year 2018 approved budgets, along with every employee’s name and salary.
2. Because the MUNIS printout is grouped by function codes (such as administrators, principals, teachers, etc.), the subtotals for the budget and staffing for schools and programs are not evident.
3. Certain cost and staffing offsets are provided, such as Title I funds or the reserve salary account used to offset a cost or salary.
D. The budget document and the MUNIS printout do not include a subtotal or a total for anticipated grants and revolving funds.
1. Administrators acknowledged that comprehensive grant or revolving fund reports were not presented to the school committee, although they approve grants individually.
E. School committee members reported that they would like to see additional information such as what was being eliminated from the recommended budget and a “wish list if funds were unlimited.”
64

Marlborough Public Schools Comprehensive District Review
Impact: A proposed budget without and explicit connection to district and school goals, and without student performance data and clear information about funding and staffing, does not give stakeholders a clear picture of how resources are allocated to support the district’s priorities.
4. The district and the city do not have a formal written agreement about how municipal expenditures are provided to the district.
A. The district and the city do not have a formal written agreement about municipal expenditures that are provided to the district as required by state regulation 603 CMR 10.05.
1. City officials and district administrators reported that the city and the district did not have a formal written agreement, but noted that both parties found the estimates of charges for city services reasonable.
2. City officials said that their estimates for municipal expenditures provided to the district were accompanied by documentation indicating how they were calculated.
3. In its self-assessment submitted before the onsite review, the district described the municipal agreement as “Not at all well” described by the indicator: “Costs paid and managed directly by the municipality are described in a current written agreement and clearly documented in the budget and financial accounting.”
Impact: Without a written agreement about indirect costs for municipal services that are provided to the district, the district cannot effectively monitor and internally audit costs for education-related services and ensure the accuracy of these expenditures.
Recommendations
1. The district should develop a budget document that is clear, comprehensive, and details how the budget supports district and school goals, how much schools and programs cost, and how outside funds are used.
A. The district should produce a budget document that contains all essential information about the financial operations of the district.
1. All funding sources should be included with detailed spending plans. Estimated grant amounts, circuit breaker, school choice, and expenses from other revolving accounts would be included in this section.
B. The budget document should include information about how the budget supports district and school goals, as well as descriptions and subtotals for school and program staffing and costs.
65

Marlborough Public Schools Comprehensive District Review
1. The document should demonstrate how student performance data, particularly data related to performance, access, and opportunity outcomes and gaps, have been used to set budget priorities.
2. The district should consider including in the budget document narratives explaining underlying assumptions and major changes.
C. In addition to budget documents, administrators may wish to prepare other information such as PowerPoint presentations to summarize the proposed budget. The presentations might include detail about how the budget is to be funded by state and local appropriations, grants, and other outside funds.
Benefits: By implementing this recommendation, the district will have a comprehensive budget document that clearly presents the district’s current education efforts. In addition, the budget document, and the process used to create it, will inform budget development and likely create trust and confidence among stakeholders in the district’s sound stewardship of public funds.
Recommended resources:
Best Practices in School District Budgeting (http://www.gfoa.org/best-practices-school-district-budgeting) outlines steps to developing a budget that best aligns resources with student achievement goals. Each step includes a link to a specific resource document with relevant principles and policies to consider.
The Rennie Center’s Smart School Budgeting (http://www.renniecenter.org/sites/default/files/2017-01/SmartSchoolBudgeting.pdf) is a summary of existing resources on school finance, budgeting, and reallocation.
2. In compliance with 603 CMR 10.5, the district and the city should formalize in writing their agreement on municipal expenditures that are provided to the district.
A. The district and the city should formalize their agreement by detailing the calculation process and/or amounts to be used in calculating municipal expenditures that are provided to the district.
Benefits from implementing this recommendation will include aligning the district’s budget documents with state requirements. A formal written agreement on municipal expenditures that are provided to the district will provide clarity about district spending.
Recommended resource:
ESE’s webpage on school finance laws and regulations (http://www.doe.mass.edu/lawsregs/603cmr10.html?section=04) provides a list of municipal payments commonly made on behalf of school districts.
66

Marlborough Public Schools Comprehensive District Review
Appendix A: Review Team, Activities, Schedule, Site Visit
Review Team Members
The review was conducted from October 15–18, 2018, by the following team of independent ESE consultants.
1. Marianne O’Connor, Leadership and Governance
2. Mary Jo Nawrocki, Curriculum and Instruction
3. Linda L. Greyser, Ed. D., Assessment and review team coordinator
4. Charles Milton Burnett, Ed. D., Human Resources and Professional Development
5. Carla Hulce, Student Support
6. George Gearhart, Ed. D., Financial and Asset management
District Review Activities
The following activities were conducted during the review:
The team conducted interviews with the following financial personnel: the director of finance and operations, the manager of finance and operations, the grants manager, office support for finance, office support for special education, and the city comptroller.
The team conducted interviews with the following members of the school committee: three school committee members.
The review team conducted interviews with the following representatives of the teachers’ association: president and seven teachers.
The team conducted interviews/focus groups with the following central office administrators: the superintendent, the assistant superintendent of teaching and learning, the director of finance and operations, the director of student services, the director of English learners, the director of human resources, the director of instructional technology, the systems administrator (technology), and the supervisor of counseling services.
The team visited the following schools: Charles J. Jaworek Elementary School (K–4), Francis J. Kane Elementary School] (K–4), Raymond C. Richer Elementary School (K–4), 1st Lt. Charles W. Whitcomb School (grades 5–8), Marlborough High School (grades 9–12), and Hildreth School (grades 9–12, Alternative High School Program).
67

Marlborough Public Schools Comprehensive District Review
During school visits, the team conducted interviews/focus groups with students, students’ families, four principals, and three focus groups with two elementary-school teachers, four middle-school teachers, and one high-school teacher, respectively.
The team observed 103 classes in the district: 33 at the high school and alternative high school, 25 at the middle school, and 45 at the 3 elementary schools.
The review team analyzed multiple data sets and reviewed numerous documents before and during the site visit, including:
o Student and school performance data, including achievement and growth, enrollment, graduation, dropout, retention, suspension, and attendance rates.
o Data on the district’s staffing and finances.
o Published educational reports on the district by ESE, the New England Association of Schools and Colleges (NEASC), and the former Office of Educational Quality and Accountability (EQA).
o District documents such as district and school improvement plans, school committee policies, curriculum documents, summaries of student assessments, job descriptions, collective bargaining agreements, evaluation tools for staff, handbooks, school schedules, and the district’s end-of-year financial reports.
o All completed program and administrator evaluations, and a random selection of completed teacher evaluations.
68

Marlborough Public Schools Comprehensive District Review
Site Visit Schedule
Monday
10/15/2018
Tuesday
10/16/2018
Wednesday
10/17/2018
Thursday
10/18/2018
Orientation with district leaders and principals; interviews with district staff and principals; document reviews; interview with the teachers’ association; and visits to the Charles Jaworek Elementary School and the Hildreth School (alternative High School Program) for classroom observations.
Interviews with district staff and principals; interview with town officials; review of personnel files; teacher focus groups; students and students’ families focus groups; and visits to Marlborough High School for classroom observations.
Interviews with district and school leaders; interviews with school committee members; visits to the Charles J. Jaworek Elementary School, the Francis J. Kane Elementary School, the 1st Lt. Charles W. Whitcomb School, the Raymond C. Richer Elementary School, and Marlborough High School for classroom observations.
Interviews with school leaders; follow-up interviews; district review team meeting; visits to the Charles J. Jaworek Elementary School, the Francis J. Kane Elementary School, the 1st Lt. Charles W. Whitcomb School, the Raymond C. Richer Elementary School, and Marlborough High School for classroom observations; district wrap-up meeting with the superintendent.
69

Marlborough Public Schools Comprehensive District Review
Appendix B: Enrollment, Attendance, Expenditures
Table B1a: Marlborough Public Schools2017–2018 Student Enrollment by Race/Ethnicity
Group District Percentof Total
State Percent ofTotal
African-American 155 3.4% 86,305 9.0%Asian 170 3.7% 65,667 6.9%Hispanic 2,142 46.8% 191,201 20.0%Native American 3 0.1% 2,103 0.2%White 1,987 43.4% 573,335 60.1%Native Hawaiian 2 0.0% 818 0.1%Multi-Race, Non-Hispanic 116 2.5% 34,605 3.6%All 4,575 100.0% 954,034 100.0%Note: As of October 1, 2017
Table B1b: Marlborough Public Schools2017–2018 Student Enrollment by High Needs Populations
Group District StateN Percent of
High NeedsPercent of
DistrictN Percent of
High NeedsPercent of
StateStudents w/ disabilities 798 29.5% 17.2% 171,061 38.0% 17.7%Econ. Dis. 1,636 60.5% 35.8% 305,203 67.9% 32.0%EL and Former EL 1,103 40.8% 24.1% 97,334 21.6% 10.2%All high needs students 2,706 100.0% 58.4% 449,584 100.0% 46.6%Notes: As of October 1, 2017. District and state numbers and percentages for students with disabilities and high needs students are calculated including students in out-of-district placements. Total district enrollment including students in out-of-district placement is 4,636; total state enrollment including students in out-of-district placement is 964,806.
70

Marlborough Public Schools Comprehensive District Review
Table B2a: Marlborough Public SchoolsAttendance Rates, 2015–2018
Group N (2018) 2015 2016 2017 2018 4-yr Change
State (2018)
African American/Black 181 94.9 94.7 94.4 95.2 0.3 94.1Asian 188 95.3 95.7 94.9 94.4 -0.9 96.2Hispanic or Latino 2,407 94.1 94.1 93.9 93.6 -0.5 92.7Multi-Race 123 94.7 94.5 94.2 93.7 -1.0 94.4White 2,100 95.0 94.8 94.6 94.6 -0.4 95.1High Needs 2,381 93.5 93.5 93.0 92.9 -0.6 93.2Econ. Dis. 1,748 92.9 93.0 92.6 92.7 -0.2 92.5SWD 891 92.9 92.8 91.8 91.6 -1.3 92.9EL 1,263 94.3 94.2 93.9 93.8 -0.5 93.3All 5,005 94.6 94.5 94.3 94.1 -0.5 94.5Notes: The attendance rate is calculated by dividing the total number of days students attended school by the total number of days students were enrolled in a particular school year. A student’s attendance rate is counted toward any district the student attended. In addition, district attendance rates included students who were out placed in public collaborative or private alternative schools/programs at public expense. Attendance rates have been rounded; percent change is based on unrounded numbers.
Table B2b: Marlborough Public SchoolsChronic Absence Rates,* 2015–2018
Group N (2018) 2015 2016 2017 2018 4-yr Change
State (2018)
African American/Black 178 12.7 13.4 18.3 14.0 1.3 16.4Asian 188 9.9 8.2 13.4 14.4 4.5 7.6Hispanic or Latino 2,384 16.1 15.1 16.1 17.6 1.5 22.5Multi-Race 122 14.5 10.1 16.5 17.2 2.7 14.2White 2,093 10.5 10.3 11.1 12.8 2.3 10.0High Needs 3,081 18.2 16.9 19.9 19.9 1.7 20.1Econ. Dis. 2,064 21.0 19.7 22.3 21.8 0.8 22.9SWD 889 19.4 18.2 23.5 26.5 7.1 20.7EL 1,251 15.9 13.4 16.9 16.9 1.0 20.4All 4,971 12.9 12.3 13.9 15.3 2.4 13.2* The percentage of students absent 10% or more of their total number of student days of membership in a school
71

Marlborough Public Schools Comprehensive District Review
Table B3: Marlborough Public SchoolsExpenditures, Chapter 70 State Aid, and Net School Spending Fiscal Years 2016–2018
FY16 FY17 FY18
Estimated Actual Estimated Actual Estimated Actual
Expenditures
From local appropriations for schools:
By school committee $60,100,000 $59,433,887 $58,369,000 $58,357,860 $60,263,767 $60,913,611
By municipality $23,509,375 $22,651,195 $29,079,520 $27,724,312 $30,452,182 $29,526,854
Total from local appropriations $83,609,375 $82,085,082 $87,502,743 $86,082,172 $90,715,949 $90,440,465
From revolving funds and grants -- $7,365,682 -- $9,315,054 -- $5,894,386
Total expenditures -- $89,450,765 -- $95,397,226 -- $96,334,851
Chapter 70 aid to education program
Chapter 70 state aid* -- $22,916,101 -- $24,140,701 -- $24,972,052
Required local contribution -- $32,493,304 -- $31,931,943 -- $32,073,087
Required net school spending** -- $55,409,405 -- $56,072,644 -- $57,045,139
Actual net school spending -- $72,749,156 -- $76,503,140 -- $80,971,081
Over/under required ($) -- $17,339,751 -- $20,4390,496 -- $23,925,942
Over/under required (%) -- 31.3% -- 36.4% -- 41.9%
*Chapter 70 state aid funds are deposited in the local general fund and spent as local appropriations.**Required net school spending is the total of Chapter 70 aid and required local contribution. Net school spending includes only expenditures from local appropriations, not revolving funds and grants. It includes expenditures for most administration, instruction, operations, and out-of-district tuitions. It does not include transportation, school lunches, debt, or capital.Sources: FY16, FY17, and FY18 District End-of-Year Reports, Chapter 70 Program information on ESE websiteData retrieved 11/13/18 and 1/25/19
72

Marlborough Public Schools Comprehensive District Review
Table B4: Marlborough Public SchoolsExpenditures Per In-District Pupil
Fiscal Years 2015–2017
Expenditure Category 2015 2016 2017
Administration $467 $551 $519
Instructional leadership (district and school) $1,018 $1,069 $1,243
Teachers $6,003 $6,286 $6,682
Other teaching services $1,435 $1,486 $1,613
Professional development $357 $399 $152
Instructional materials, equipment and technology $349 $416 $284
Guidance, counseling and testing services $446 $501 $590
Pupil services $1,490 $1,482 $1,531
Operations and maintenance $1,282 $1,141 $1,196
Insurance, retirement and other fixed costs $2,202 $2,352 $2,513
Total expenditures per in-district pupil $15,048 $15,684 $16,324Sources: Per-pupil expenditure reports on ESE websiteNote: Any discrepancy between expenditures and total is because of rounding.
73

Marlborough Public Schools Comprehensive District Review
Appendix C: Instructional Inventory
Focus Area #1: Learning Objectives & Expectations
Insufficient Evidence
Limited Evidence
Sufficient Evidence
Compelling Evidence
Avg Number of points
(1) (2) (3) (4) (1 to 4)1. The teacher demonstrates knowledge of the subject matter.
ES 9% 30% 30% 32% 2.9MS 4% 36% 48% 12% 2.7HS 6% 37% 43% 14% 2.7Total # 7 36 41 23 2.7Total % 7% 34% 38% 21%
2. The teacher ensures that students understand what they should be learning in the lesson and why.
ES 6% 30% 45% 19% 2.8MS 4% 28% 60% 8% 2.7HS 11% 37% 37% 14% 2.5Total # 8 34 49 16 2.7Total % 7% 32% 46% 15%
3. The teacher uses appropriate classroom activities well matched to the learning objective(s).
ES 4% 21% 43% 32% 3.0MS 12% 32% 36% 20% 2.6HS 6% 31% 49% 14% 2.7Total # 7 29 46 25 2.8Total % 7% 27% 43% 23%
4. The teacher conducts frequent checks for student understanding, provides feedback, and adjusts instruction.
ES 6% 21% 53% 19% 2.9MS 20% 24% 44% 12% 2.5HS 14% 31% 37% 17% 2.6Total # 13 27 49 18 2.7Total % 12% 25% 46% 17%
Total Score For Focus Area #1 ES 11.5MS 10.5HS 10.5Total 10.9
74

Marlborough Public Schools Comprehensive District Review
Focus Area #2: Student Engagement & Higher-Order
Thinking
Insufficient Evidence
Limited Evidence
Sufficient Evidence
Compelling Evidence
Avg Number of points
(1) (2) (3) (4) (1 to 4)5. Students assume responsibility to learn and are engaged in the lesson.
ES 4% 30% 51% 15% 2.8MS 4% 20% 48% 28% 3.0HS 20% 29% 40% 11% 2.4Total # 10 29 50 18 2.7Total % 9% 27% 47% 17%
6. Students engage in higher-order thinking.
ES 15% 32% 45% 9% 2.5MS 20% 36% 40% 4% 2.3HS 23% 29% 29% 20% 2.5Total # 20 34 41 12 2.4Total % 19% 32% 38% 11%
7. Students communicate their ideas and thinking with each other.
ES 23% 19% 55% 2% 2.4MS 28% 24% 40% 8% 2.3HS 20% 37% 37% 6% 2.3Total # 25 28 49 5 2.3Total % 23% 26% 46% 5%
8. Students engage with meaningful, real-world tasks.
ES 21% 28% 38% 13% 2.4MS 12% 36% 36% 16% 2.6HS 23% 40% 20% 17% 2.3Total # 21 36 34 16 2.4Total % 20% 34% 32% 15%
Total Score For Focus Area #2 ES 10.0MS 10.1HS 9.5Total 9.9
75

Marlborough Public Schools Comprehensive District Review
Focus Area #3: Inclusive Practice & Classroom Culture
Insufficient Evidence
Limited Evidence
Sufficient Evidence
Compelling Evidence
Avg Number of points
(1) (2) (3) (4) (1 to 4)9. The teacher ensures that students are engaging in challenging tasks regardless of learning needs.
ES 11% 30% 49% 11% 2.6MS 24% 24% 48% 4% 2.3HS 23% 34% 31% 11% 2.3Total # 19 32 46 10 2.4Total % 18% 30% 43% 9%
10. The teacher uses a variety of instructional strategies.
ES 6% 45% 32% 17% 2.6MS 16% 36% 48% 0% 2.3HS 34% 46% 17% 3% 1.9Total # 19 46 33 9 2.3Total % 18% 43% 31% 8%
11. Classroom routines and positive supports are in place to ensure that students behave appropriately.
ES 2% 6% 49% 43% 3.3MS 4% 16% 52% 28% 3.0HS 9% 6% 40% 46% 3.2Total # 5 9 50 43 3.2Total % 5% 8% 47% 40%
12. The classroom climate is conducive to teaching and learning.
ES 0% 13% 51% 36% 3.2MS 4% 40% 36% 20% 2.7HS 9% 3% 60% 29% 3.1Total # 4 17 54 32 3.1Total % 4% 16% 50% 30%
Total Score For Focus Area #3 ES 11.7MS 10.4HS 10.5Total 11.0
76