marketing strategy & cm update€¦ · of activity, performance or achievements to be...
TRANSCRIPT

INVESTOR PRESENTATIONAugust 2019
1

This presentation contains forward-looking statements. All statements other than statements of historical fact contained in this presentation are forward-looking statements. In some cases, you can identify forward-looking statements by terminology such as “may,” “will,” “should,” “expects,” “plans,” “anticipates,” “believes,” “estimates,” “predicts,” “potential” or “continue” or the negative of these terms or other comparable terminology. These statements are only current predictions and are subject to known and unknown risks, uncertainties and other factors that may cause our or our industry’s actual results, levels of activity, performance or achievements to be materially different from those anticipated by the forward-looking statements. Although we believe that the expectations reflected in the forward-looking statements are reasonable, we cannot guarantee future results, levels of activity, performance or achievements. Except as required by law, we are under no duty to update or revise any of the forward-looking statements, whether as a result of new information, future events or otherwise, after the date of this presentation.
In addition to U.S. GAAP financials, this presentation includes certain non-GAAP financial measures. These non-GAAP financial measures are in addition to, and not a substitute for or superior to, measures of financial performance prepared in accordance with U.S. GAAP.
This presentation contains statistical data that we obtained from industry publications and reports generated by third parties. Although we believe that the publications and reports are reliable, we have not independently verified this statistical data.
The trademarks included herein are the property of the owners thereof and are used for reference purposes only. Such use should not be construed as an endorsement of the products or services of the Company or this offering.
This document may not be retained, reproduced or distributed, in whole or in part, by any means (including electronic) without the prior written consent of CyberArk Software Ltd.
This document will not be left behind after this presentation, and by accepting this document and attending the presentation, you agree to be bound by the foregoing limitations.
DISCLAIMER
2

3
Innovative
technology that
breaks the cycle
of cyber attacks
Pioneer and
leader in
privileged
account security
Loyal blue-chip
global customer
base with large
upsell opportunity
Strong revenue
growth and track
record of
sustainable
profitability
Differentiated
platform that is
adding a critical
layer of security

4
#1 Leader in Privileged
Access Security
Securing Privilege at more
than 50% of the Fortune 500
More than 4,800
customer globally

STRONG BUSINESS MOMENTUM
5
$23M
CASH FLOW
$22M
OPERATING INCOMEREVENUECUSTOMERS
1.8K $103M2014

STRONG BUSINESS MOMENTUM
6
$23M
CASH FLOW
$22M
OPERATING INCOMEREVENUECUSTOMERS
1.8K $103M2014
2018
$130M$90M
$343M
4.5K

PROVEN RECORD OF GROWTH & PROFITABILITY
7
39%5 Year CAGR
• 4,800+ global customers
• More than 50% of Fortune 500
• More than 30% of Global 2000
$66$103
$161
$217
$262
$343
$9$22
$44$58 $52
$90
2013 2014 2015 2016 2017 2018
Revenue
1See appendix for Non-GAAP reconciliation
Non-GAAP Operating Income1

MARKET LEADERS CHOOSE CYBERARK
22 OF THE TOP 25
IT Services
20 OF THE TOP 25
Manufacturing
18 OF THE TOP 25
Telecom
17 OF THE TOP 25
Energy
20 OF THE TOP 25
Insurance
24 OF THE TOP 25
Banks
Sourced: CyberArk analysis based on the following industry rankings found in the links above
Rankings
Rankings
Rankings
Rankings
Rankings
Rankings

9
PRIVILEGED CREDENTIALS IN THE NEWS

PRIVILEGED ACCOUNTS - “KEYS TO THE IT KINGDOM”
Provides Proactive
Protection and Detection
MALICIOUS INSIDERSEXTERNAL ATTACKERS
PRIVILEGED ACCOUNTS“Keys to the IT Kingdom”

CYBERARK’S MISSION
11
PRIVILEGED SECURITYTo protect against advanced cyber threats
Provide a critical layer of
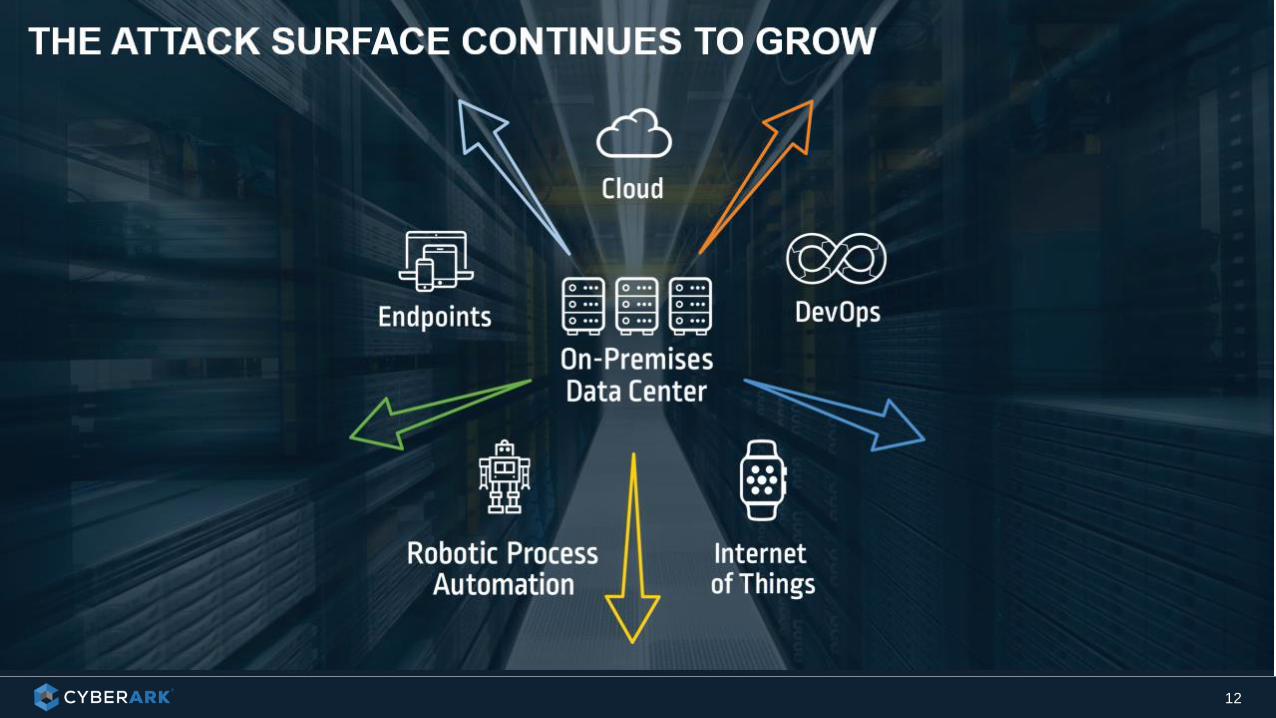
THE ATTACK SURFACE CONTINUES TO GROW
12

CYBERARK BREAKS THE ATTACK CHAIN
13
Existing Access
External Compromise
On-Premises
Hybrid
Cloud
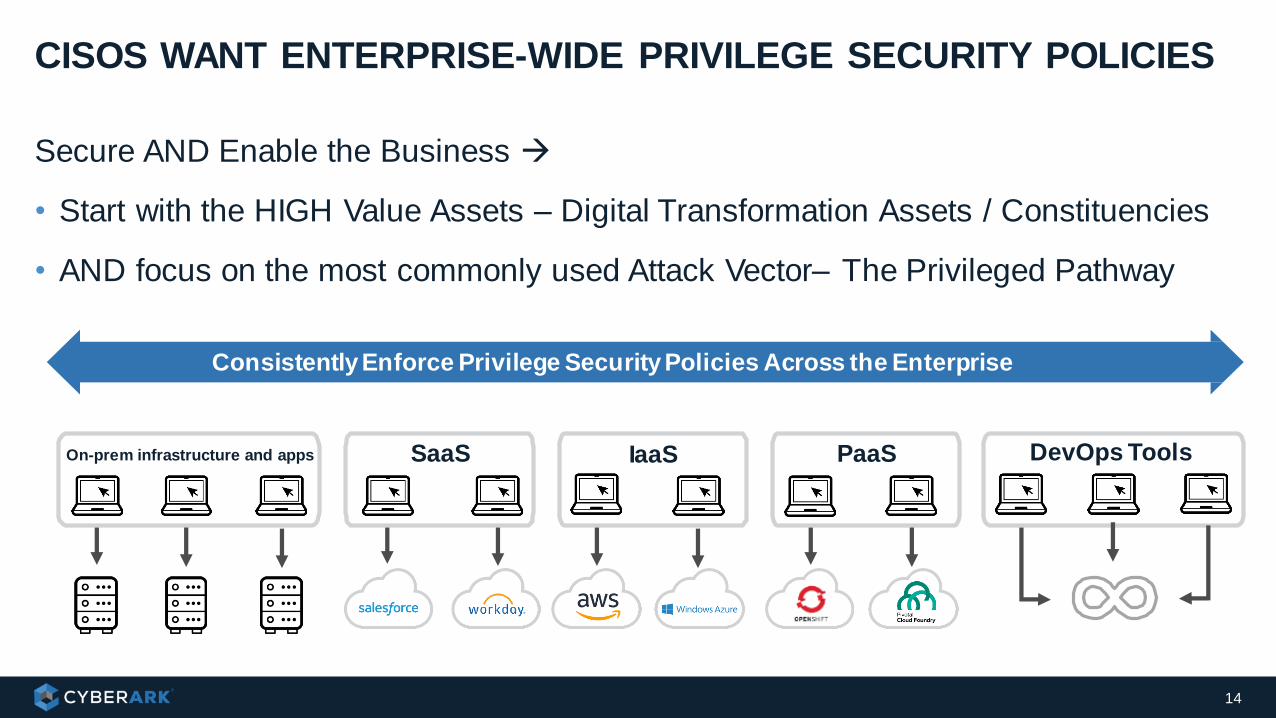
Secure AND Enable the Business →
• Start with the HIGH Value Assets – Digital Transformation Assets / Constituencies
• AND focus on the most commonly used Attack Vector– The Privileged Pathway
CISOS WANT ENTERPRISE-WIDE PRIVILEGE SECURITY POLICIES
SaaS IaaSOn-prem infrastructure and apps DevOps Tools
Consistently Enforce Privilege Security Policies Across the Enterprise
PaaS
14

CYBERARK PRIVILEGED ACCESS SECURITY SOLUTION
15

INNOVATION IS PART OF OUR DNA
16
2018200920082004 2005 2006 2007 2010 2011 2012 2013 2014 2015 2016 20172003
2009Secure and Monitor Privileged Sessions
2003Vault and Rotate
Privileged
Credentials
Secure DevOps Secrets
2017
Automate on-boarding of credentials with
AWS
2016Secure Endpoint
Credentials
2018Secure XaaSAdmins and
Privileged Business Users
Detect and Prevent Kerberos Attacks
2015
Privileged Attacks
Research
Detect and Prevent Privileged Threats
2013
Discover Unprotected
Privileged Accounts
2012
Secure Cloud and Virtual
Infrastructure
2011
Protect Privilege in Applications
2007
2018Admins and Priv ileged
Business UsersSaaS Of f ering
2019
Zero Trust Remote Vendor
Access SaaS Offering
2019

TRUSTED BY CUSTOMERS WORLDWIDE
17
4,800+ Global Customers
More than 50% of Fortune 500
More than 30% of Global 2000

18

MULTIPLE DRIVERS FOR LONG-TERM GROWTH
19

20
• CyberArk positioned highest for ability to execute and furthest for completeness of vision
CYBERARK NAMED A LEADER IN GARTNER 2018 MAGIC QUADRANT FOR PRIVILEGED ACCESS MANAGEMENT
Gartner, Magic Quadrant for Privileged Access Management, Felix Gaehtgens, Dale Gardner, Justin Taylor, Abhyuday Data, Michael Kelley, 3 December 2018
This graphic was published by Gartner, Inc. as part of a larger research document and should be evaluated in the context of the entire document. The Gartner document is available upon request from https://lp.cyberark.com/gartner-mq-pam-leader
Gartner does not endorse any vendor, product or service depicted in its research publications, and does not advise technology users to select only those vendors with the highest ratings or other designation. Gartner research publications consist of the opinions of Gartner’s research organization and should not be construed as statements of fact. Gartner disclaims all warranties, expressed or implied, with respect to this research, including any warranties of merchantability or fitness for a particular purpose.

21
FINANCIAL OVERVIEW

TRACK RECORD OF STRONG GROWTH
22
$132 $148$192
$79$103
$85
$114
$151
$70
$93
$217
$262
$149
$196
2016 2017 2018 6 Months 2018 6 Months 2019
31%GROWTH
21%GROWTH
Maint. / PS
License
($mm)
35%GROWTH
31%GROWTH
$343

GLOBAL BUSINESS ACROSS DIVERSE INDUSTRIES
Bookings by VerticalRevenue by Geography
30%
11%
10%8%
6%
6%
6%
5%
5%
3%5%
3%3% Banking
Government
Manufacturing
Energy
Retail
Insurance
Telecom
IT Services
Transportation & Travel
Health
Pharmaceuticals
Professional Services
Other
60%
33%
7%
Geographies
FY2018
Verticals
FY2018
Americas
EMEA
APJ

PROFITABLE WHILE INVESTING FOR GROWTH
24
$58 $52
$90
$30
$52
2016 2017 2018 6 Months 2018 6 Months 2019
Non-GAAP Operating Income1 and Margins
1 See appendix for Non-GAAP reconciliation
($mm)
20%27%
27%
20%
26%

HISTORY OF STRONG CASH FLOW
25
$56
$81
$130
$56$67
2016 2017 6M 2018 6M 2019
Operating Cash Flow and Margins
38%
($mm)
$74
$105
$150$130
$174
2016 2017 2018 Jun-18 Jun-19
Total Deferred Revenue
($mm)
26%
42%GROWTH
38%
31%
43%GROWTH
34%
34%GROWTH

26
NASDAQ: CYBRwww.cyberark.com

GAAP TO NON-GAAP RECONCILIATION
27
(in thousands) 2016 2017 2018 1H 2018 1H 2019
GAAP operating income to Non-GAAP operating income:
Operating Income $35,956 $20,326 $47,292 $10,992 $26,603
Share-based compensation 17,535 25,237 35,964 15,336 22,148
Acquisition related costs &
amortization of acquired intangibles4,523 5,945 6,624 3,339 3,176
Facility exit costs - 342 580 -- --
Non-GAAP operating income $58,014 $51,850 $90,460 $29,667 $51,927
GAAP net income to Non-GAAP net income:
Net Income $28,124 $16,015 $47,072 $14,798 $27,080
-
Share-based compensation 17,535 25,237 35,964 15,336 22,148
Acquisition related costs &
amortization of acquired intangibles4,523 5,945 6,624 3,339 3,176
Facility exit costs - 342 580 -- --
Non-GAAP tax adjustments (4,937) (5,644) (13,717) (8,193) (7,892)
Non-GAAP net income $45,245 $41,895 $76,523 $25,280 $44,512