marketing science institute - how incentives shape strategy: the … · 2018-03-05 · 1 how...
TRANSCRIPT

1
How Incentives Shape Strategy:
The Role of CMO and CEO Equity
Compensation in Inducing Marketing Myopia
Martin Artz, Frankfurt School of Finance & Management
Natalie Mizik, University of Washington
February 2018

2
Do Managers Have Appropriate
Long-term Focus?
The Concern Over
Myopic Management:
• Managers may unduly emphasize current-
term financial performance
(i.e., have a discount rate higher than justified by the cost of capital
considerations)

3
Summary of Previous Myopic Research
• Wave 1: Econ Theory – Myopic Management is possible under certain conditions (Narayanan 1985, Stein
1989, Bizjak et al. 1993)
• Wave 2: Accounting Lit on Accruals Manipulation (AM) – Accrual Manipulation occurs and has negative consequences (Teoh, Welch and Wong
JFE 1998, Rangan JFE 1998, DuCharme, Malatesta and Sefcik JFE 2004)
• Wave 3: Acct and Mktg Lit on Real Activity Manipulation – Real Activity Manipulation (MM) occurs and has negative consequences that are more
severe than AM (Graham at al. 2005, Roychowdhury 2006, Mizik and Jacobson 2007, Cohen and Zarowin 2010, Kothari et al. 2016)
• Wave 4: Myopic Marketing Management
– MMM takes various forms (Chapman and Steenburgh 2011, Chakravarty and Grewal 2011, Moorman et al. 2012, Ahearne et al. 2016)
• Wave 5: What Drives Myopic Management ???

4
Study Objectives:
Assess whether the CMOs help reduce
the incidence and/or the severity of
Myopic Marketing Management
– does CMO presence affect incidence & severity of MMM?
– does CMO equity compensation affect incidence &
severity of MMM?
– do CMOs trade personal equity holding more actively
with incidence & severity of MMM?

5
Controversy around equity
compensation
“Pay-for-
performance“
theory
“Pay-without-
performance“
theory
Equity incentives align manager and owner
incentives; can increase firm value; stock options
reward making risky decisions
Event studies: positive abnormal returns for
announcements of stock-price based
compensation plans (e.g., DeFusco et al. 1990)
Top executives influence compensation
committees
Top executives manipulate the timing of equity /
option grants (Yermack, 1997)
Top executive manipulate stock prices by
announcements or manipulation of profits

6
CMO presence and MMM
Conflicting views on CMO effects and power:
1. CMOs are increasingly important. CMO’s role is to mitigate
marketing resource misallocation and to oversee the overall marketing
strategy (Aaker 2008, Jaworski 2011, Court 2007)
2. “The CMO Is Dead” (Forbes On Marketing, 10/03/2012, Webster et
al. 2005): CMOs are increasingly powerless and peripheral
Hypothesis 1: The mere presence of a CMO in an organization reduces or has no relation to the incidence and severity of MMM

7
Equity Compensation and MMM
Economics literature:
Under Perfect information tying managerial compensation to stock
prices leads to efficient managerial decision making
Imperfect information Incentive to manipulate earnings
e.g., Bizjak, Brickley, and Coles (1993) show that managers are more
likely to engage in MM the more managerial remuneration depends
on current stock price
Hypothesis 2: The more executive compensation
depends on equity, the greater the extent (incidence
and severity) of MMM

8
CMO compensation and MMM
1. Managers further down in the firm hierarchy can be more influential in
their domain than the CEOs (Jiang et. al 2010) and have “greater
opportunity to influence reported earnings in a manner that maximizes
these managers’ personal income” (Oberholzer-Gee and Wulf, ssrn 2012)
2. Currim et al. 2012, Luo et al. 2012: Equity-based compensation may curb
executive opportunism and reduce myopic management
Hypothesis 3: CMO equity incentives have a greater association with MMM than those of the CEO. The effect might be positive (increasing MMM, consistent with econ theory) or negative (decreasing MMM, consistent with mktg literature)

9
CMO Equity Trading and MMM
If CMOs facilitate MMM (or have advanced insight into MMM’s future negative effects on valuation), they would take advantage of the opportunity and trade more actively in the years when MMM occurs to divest their personal equity holdings
Hypothesis 4: There is a greater equity selling activity in the years of MMM

10
Data: 1993-2014
• Annual COMPUSTAT for accounting data
• CRSP for stock returns
• Execucomp for executive compensation
• Thomson Reuters and US Insider Filing Feed for
executive trading
it
itit
Assets
Expense D)/Adv&R-D/(SGA&RIntensity /Mktg/AdvD&R
1
)(Accruals Total
tsTotalAsset
trtizDeprecAmmotrmDebttionLongTeCurrentPortbiltCurrentLiatCashtetsCurrentAss
it
it
itAssets
onDepreciati before Income OperatingROA

11
Measuring Exec Equity Incentives
• Identifying Executives (CEO, CMO, CFO, etc.): Execucomp database from 1993 to 2014
Identification of CMOs by job title (e.g., “CMO”, “Marketing”,
“Sales”)
• Equity Incentive: Sensitivity of exec’s annual
compensation to a 1% change in stock price
Equity Incentivei,t = Delta Stocksi,t + Delta Optionsi,t
(Salaryi,t + Bonusi,t + Delta Stocksi,t + Delta Optionsi,t)
Delta Stocksi,t = Sensitivity of stockholdings to stock price = .01 × Price𝑡 × Sharesi,t
Delta Optionsi,t = Sensitivity of optionholdings to stock price(Core and Guay 1999)
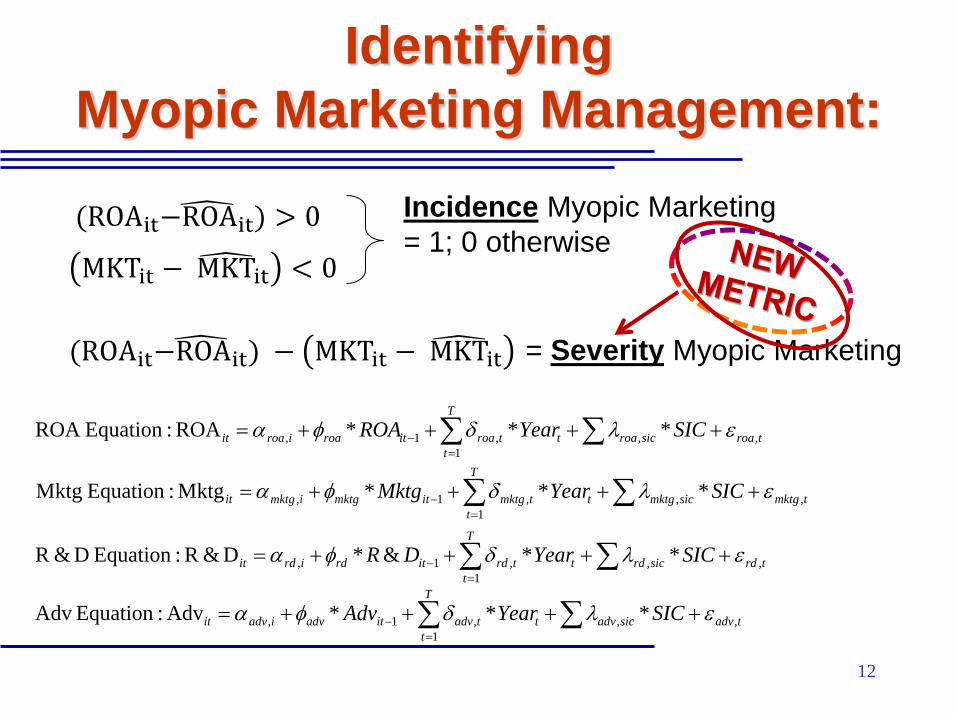
12
Identifying
Myopic Marketing Management:
T
t
trdsicrdttrditrdirdit SICYearDR1
,,,1, **&*D&R:Equation D&R
T
t
tmktgsicmktgttmktgitmktgimktgit SICYearMktg1
,,,1, ***Mktg:Equation Mktg
T
t
tadvsicadvttadvitadviadvit SICYearAdv1
,,,1, ***Adv:Equation Adv
T
t
troasicroattroaitroairoait SICYearROA1
,,,1, ***ROA:EquationROA
MKTit − MKT it < 0
(ROAit−ROAit ) > 0 Incidence Myopic Marketing
= 1; 0 otherwise
= Severity Myopic Marketing (ROAit−ROAit ) − MKTit − MKT it

13
Three Proxies of
Myopic Marketing Management
Incidence of Myopic 1. Management: ROA surprise>0, Mktg surprise <0, R&D surprise <0
2. Marketing: ROA surprise>0, Mktg surprise <0
3. Advertising: ROA surprise>0, Adv surprise <0
Severity of Myopic 1. Management: (ROA surprise - Mktg surprise - R&D surprise)
2. Marketing: (ROA surprise - Mktg surprise)
3. Advertising: (ROA surprise - Adv surprise)

14
Testing CMO Presence Effects:
no significant effects found
1. Basic Regressions may be subject to selection bias:
– Logit for Incidence, OLS for Severity
2. Treatment Effects, Selection on Observables:
– IPWRA
– Heckman
3. Treatment Effects, Relaxing Conditional Independence Assm:
– endogenous treatment effects models
4. Endogeneity tests
Incidence
Myopic
MKT_R&D
Incidence
Myopic
MKT
Incidence
Myopic
ADV
Severity
Myopic
MKT_R&D
Severity
Myopic
MKT
Severity
Myopic
ADV
CMO Presence (t) ATE 0.010 0.011 -.016 0.004 0.004 -0.0005
[0.011] [0.013] [0.018] [0.004] [0.003] [0.003]
Myopia Controls Included Included Included Included Included Included
Observations 11,330 11,330 5,000 11, 330 11, 330 5,000
Endogeneity test n/s n/s n/s n/s n/s n/s

15
Testing the Effect of Executive Equity
Incentives and Incidence of MMM
1. Instrumental Variables and Control Function approach to Address Potential Endogeneity
2. Treatment Effects models, Heckman
3. Differences-in-Differences (using FAS 123 adoption in 2005)

16
Executive Equity Incentives and Incidence of
MMM: no CEO effect, but CMO equity
increases MMM Incidence
Severity
Myopic
MKT_R&D
Severity
Myopic
MKT_R&D
Severity
Myopic
MKT
Severity
Myopic
MKT
Severity
Myopic
ADV
Severity
Myopic
ADV
CEO Equity Incentive (t-1) 0.172 0.033 -0.008 -0.148 0.084 -0.029
[0.160] [0.164] [0.147] [0.150] [0.200] [0.207]
CMO Equity Incentive (t-1) 1.639*** 1.721*** 1.422*
[0.561] [0.545] [0.765]
Abnormal Accruals (t) 5.141*** 5.158*** 5.462*** 5.470*** 3.900*** 3.883***
[0.458] [0.454] [0.418] [0.415] [0.605] [0.605]
Size (t-1) -0.084*** -0.100*** -0.043* -0.059** -0.040 -0.054
[0.030] [0.030] [0.025] [0.025] [0.035] [0.035]
Market-to-Book (t-1) 0.039*** 0.035*** 0.039*** 0.035*** 0.023** 0.019*
[0.008] [0.008] [0.008] [0.008] [0.010] [0.011]
Leverage (t-1) -1.203*** -1.165*** -0.947*** -0.912*** -0.802*** -0.772***
[0.227] [0.228] [0.189] [0.190] [0.298] [0.299]
Annual Stock Return (t-1) 0.263*** 0.252*** 0.240*** 0.229*** 0.281*** 0.269***
[0.048] [0.049] [0.047] [0.048] [0.070] [0.071]
Sales Volatility (t-1) -0.901*** -0.901*** 0.068 0.069 0.503** 0.502**
[0.275] [0.276] [0.162] [0.162] [0.248] [0.247]
Competition (t-1) 1.650 1.368 -0.116 -0.364 -1.792 -1.881
[1.595] [1.594] [1.532] [1.521] [2.339] [2.339]
Observations 5,135 5,135 5,135 5,135 2,625 2,625
Wald test, p-value
(Ho: γCMO= γCEO)
6.83
0.009
9.87
0.002
3.01
0.083
Hausman test of endogeneity n/s n/s n/s n/s n/s n/s

17
Executive Equity Incentives and Severity of
MMM: no CEO effect, but
CMO equity increases MMM Severity
Severity
Myopic
MKT_R&D
Severity
Myopic
MKT_R&D
Severity
Myopic
MKT
Severity
Myopic
MKT
Severity
Myopic
ADV
Severity
Myopic
ADV
CEO Equity Incentive (t-1) 0.017** 0.011 0.013* 0.008 0.006 0.003
[0.008] [0.008] [0.007] [0.007] [0.007] [0.007]
CMO Equity Incentive (t-1) 0.070** 0.059** 0.054**
[0.029] [0.026] [0.026]
Abnormal Accruals (t) 0.657*** 0.658*** 0.600*** 0.600*** 0.571*** 0.570***
[0.042] [0.042] [0.039] [0.039] [0.051] [0.051]
Size (t-1) 0.005*** 0.004*** 0.004*** 0.003** -0.001 -0.001
[0.001] [0.001] [0.001] [0.001] [0.001] [0.001]
Market-to-Book (t-1) 0.002*** 0.002*** 0.002*** 0.002*** 0.001 0.001
[0.001] [0.001] [0.001] [0.001] [0.001] [0.001]
Leverage (t-1) -0.055*** -0.054*** -0.044*** -0.043*** 0.006 0.007
[0.009] [0.009] [0.009] [0.009] [0.010] [0.011]
Annual Stock Return (t-1) 0.028*** 0.027*** 0.025*** 0.025*** 0.022*** 0.021***
[0.003] [0.003] [0.003] [0.003] [0.003] [0.003]
Sales Volatility (t-1) -0.015 -0.015 -0.008 -0.007 0.006 0.005
[0.014] [0.014] [0.013] [0.013] [0.019] [0.019]
Competition (t-1) 0.034 0.025 0.020 0.012 -0.050 -0.054
[0.069] [0.069] [0.067] [0.067] [0.068] [0.067]
Observations 5,135 5,135 5,135 5,135 2,625 2,625
Wald test, p-value
(Ho: γCMO= γCEO)
3.45
0.063
3.26
0.071
3.37
0.067
Hausman test of endogeneity n/s n/s n/s n/s n/s n/s
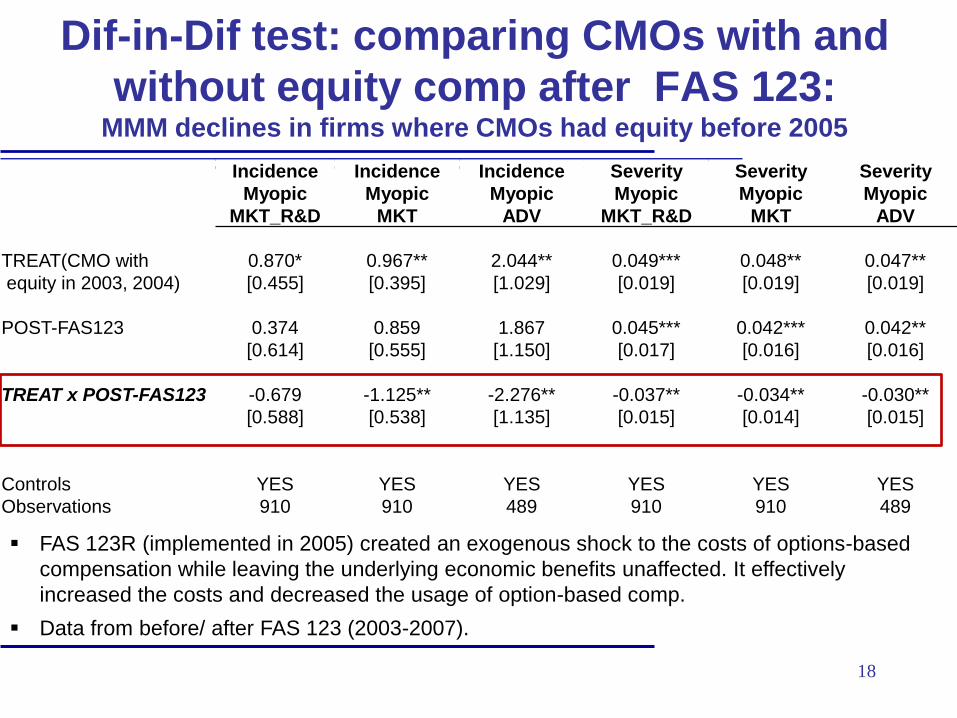
18
Incidence
Myopic
MKT_R&D
Incidence
Myopic
MKT
Incidence
Myopic
ADV
Severity
Myopic
MKT_R&D
Severity
Myopic
MKT
Severity
Myopic
ADV
TREAT(CMO with 0.870* 0.967** 2.044** 0.049*** 0.048** 0.047**
equity in 2003, 2004)
[0.455] [0.395] [1.029] [0.019] [0.019] [0.019]
POST-FAS123 0.374 0.859 1.867 0.045*** 0.042*** 0.042**
[0.614] [0.555] [1.150] [0.017] [0.016] [0.016]
TREAT x POST-FAS123 -0.679 -1.125** -2.276** -0.037** -0.034** -0.030**
[0.588] [0.538] [1.135] [0.015] [0.014] [0.015]
Controls YES YES YES YES YES YES
Observations 910 910 489 910 910 489
Dif-in-Dif test: comparing CMOs with and
without equity comp after FAS 123: MMM declines in firms where CMOs had equity before 2005
FAS 123R (implemented in 2005) created an exogenous shock to the costs of options-based
compensation while leaving the underlying economic benefits unaffected. It effectively
increased the costs and decreased the usage of option-based comp.
Data from before/ after FAS 123 (2003-2007).

19
Incidence
Myopic
MKT_R&D
Incidence
Myopic
MKT
Incidence
Myopic
ADV
Severity
Myopic
MKT_R&D
Severity
Myopic
MKT
Severity
Myopic
ADV
TREAT(CEO with high -0.057 0.246 0.135 0.026 0.021 -0.002
equity in 2003, 2004)
[0.419] [0.401] [0.847] [0.019] [0.018] [0.017]
POST-FAS123 -0.336 0.616 0.279 0.018 0.019 0.017
[0.487] [0.470] [1.010] [0.023] [0.021] [0.018]
TREAT x POST-FAS123 0.196 -0.529 0.686 -0.030 -0.026 0.012
[0.553] [0.512] [1.081] [0.022] [0.020] [0.018]
Controls YES YES YES YES YES YES
Observations 423 423 209 423 423 209
Dif-in-Dif test: comparing CEOs with high vs.
low equity comp in no-CMO firms: no significant effect on MMM
FAS 123R (implemented in 2005) created an exogenous shock to the costs of options-based
compensation while leaving the underlying economic benefits unaffected. It effectively increased
the costs and decreased the usage of option-based comp.
Data from before/ after FAS 123 (2003-2007) for firms that did not have a CMO.

20
CMO Exercise More Options when
MMM Occurs and is More Severe
Myopic Management Proxy
Incidence
Myopic
MKT_R&D
Incidence
Myopic MKT
Incidence
Myopic ADV
Severity
Myopic
MKT_R&D
Severity
Myopic MKT
Severity
Myopic ADV
Myopic Management Proxy (t) 0.042*** 0.028*** 0.036** 0.127*** 0.134*** 0.070
[0.012] [0.011] [0.017] [0.041] [0.045] [0.069]
CEO Share Options Ex. (t) 0.426*** 0.426*** 0.429*** 0.424*** 0.424*** 0.430***
[0.028] [0.028] [0.036] [0.028] [0.028] [0.037]
Abnormal Accruals (t) -0.007 -0.002 -0.096 -0.059 -0.058 -0.115
[0.053] [0.054] [0.078] [0.060] [0.061] [0.090]
Annual Stock Return (t-1) 0.065*** 0.066*** 0.073*** 0.064*** 0.064*** 0.074***
[0.008] [0.008] [0.012] [0.008] [0.008] [0.012]
Stock Return Volatility (t-1) -0.186** -0.179** -0.248** -0.168** -0.161** -0.238**
[0.078] [0.079] [0.107] [0.078] [0.078] [0.108]
Market to Book (t-1) 0.004*** 0.004*** 0.004*** 0.004*** 0.004*** 0.004***
[0.001] [0.001] [0.001] [0.001] [0.001] [0.001]
R&D Expenses (t-1) -0.142** -0.127** -0.068 -0.131** -0.139** -0.079
[0.062] [0.063] [0.085] [0.062] [0.063] [0.085]
Market Value (t-1) 0.108 0.116 -0.412 0.091 0.101 -0.443
[0.315] [0.315] [0.324] [0.314] [0.314] [0.324]
CMO Equity Holdings (t-1) -0.009 -0.015 -0.075 -0.013 -0.013 -0.069
[0.041] [0.042] [0.047] [0.042] [0.042] [0.047]
Observations 3,303 3,303 1,773 3,303 3,303 1,773

21
CMO Reduce Equity Holdings when
MMM Occurs and is More Severe
Myopic Management Proxy
Incidence
Myopic
MKT_R&D
Incidence
Myopic MKT
Incidence
Myopic ADV
Severity
Myopic
MKT_R&D
Severity
Myopic MKT
Severity
Myopic ADV
Myopic Management Proxy (t) -0.008 -0.012*** -0.014** -0.036*** -0.037** -0.042*
[0.005] [0.004] [0.007] [0.014] [0.015] [0.022]
CEO Share Options Ex. (t) 0.014** 0.014** 0.010** 0.014** 0.014** 0.010**
[0.006] [0.006] [0.005] [0.006] [0.006] [0.005]
Abnormal Accruals (t) -0.077** -0.070** -0.053** -0.060 -0.061 -0.039
[0.035] [0.033] [0.024] [0.037] [0.037] [0.028]
Annual Stock Return (t-1) -0.009*** -0.008*** -0.009** -0.008*** -0.008*** -0.009*
[0.003] [0.003] [0.004] [0.003] [0.003] [0.005]
Stock Return Volatility (t-1) -0.003 -0.001 -0.037 -0.005 -0.006 -0.038
[0.030] [0.030] [0.028] [0.030] [0.030] [0.028]
Market to Book (t-1) -0.024 -0.028 0.004 -0.027 -0.024 0.010
[0.025] [0.026] [0.028] [0.025] [0.026] [0.029]
R&D Expenses (t-1) 0.507*** 0.494*** 0.396*** 0.510*** 0.507*** 0.407***
[0.068] [0.067] [0.062] [0.068] [0.068] [0.063]
Market Value (t-1) -0.001* -0.001 -0.000 -0.001 -0.001 -0.000
[0.000] [0.000] [0.000] [0.000] [0.000] [0.000]
CMO Equity Holdings (t-1) -0.006** -0.006** -0.004** -0.006** -0.006** -0.004**
[0.003] [0.003] [0.002] [0.003] [0.003] [0.002]
Observations 1,913 1,913 1,073 1,913 1,913 1,073

22
Conclusion
The mere presence of a CMO does not reduce either the Incidence or the Severity of MMM
CMO equity compensation increases the incidence and severity of MMM
In the years when MMM occurs, CMOs trade more shares and exercise more options
Results in contrast to dominant views in the marketing literature but in support of recent comparable work in accounting and financial economics