marketing data analysis with sas software - … data analysis with...marketing data analysis with...
TRANSCRIPT

\
\..
Marketing Data Analysis with SAS Software
Zdzislaw Piasta - Kielce University of Technology (Poland)
Introduction
The main goal of data analysis in market research is to gather information which links an organization or firm to its market. In market research data from both primary and secondary sources are analysed. Primary data are collected and recorded for the specific research needs of a particular firm or organization. Surveing using questionnaires is the most effective method for collecting primary marketing data. Secondary marketing data are collected for general purposes (census, government reports, statistical yearbooks).
The author has participated in market research that had been performed recently in some sectors of the Polish market. Some of the surveys have been conducted as part of a Polish/American· extension project. SAS software has been used for discovering market information, which is an important aid in decision making.
Analysis of data obtainable with surveys
Selected methods of primary marketing data analysis will be illustrated with data from a consumer survey for an American peanut butter. The survey has been conducted in two regions of Poland to determine the market need for this new product on the Polish market. The survey has been done around shopping areas. A sample of 113 shoppers has been interviewed. Respondents have been answering for 32 questions. The answers have been coded and used to create a SAS data set survey.
The SAS System offers a variety of procedures helpful in creating reports from surveys. The following statements explain how the TABULATE procedure has been used to produce reports from the peanut butter survey:
proc format; value gender l='female'
2='male' ; value educat l='primary'
2='secondary' 3= 'university;
value region l='GDANSK' 2=' OLSZTYN' ;
proc TABULATE data=survey format=7.; table gender educat, region all*(n, pctn*f=4.1) (income absrate relrate)*mean*f=8.2; class gender educat region; var income absrate relrate;
796
~ . - .. - --, -"~ .".'- --.:. '.,'"'

format gender gender. educat educate region region.; label educat='LEVEL OF EDUCATION'
income='INCOME PER PERSON (in thous. zloties)' absrate='ABSOLUTE RATE ON SCALE FROM 1 TO 4' relrate='RELATIVE RATE ON SCALE FROM 1 TO 5';
keylabel pctn='%'; run;
The variable RELRATE corresponds to the question: How would you rate the American peanut butter in comparison to other peanut butter on the market? Five possible responses have been included with this question: much better (5), better (4), same (3), worse (2), much worse (1). The variable RELRATE corresponds to the question: How do you rate the American peanut butter? which has five possible responses: like very much (4), like moderately (3), dislike slightly (2), dislike very much (1), no opinion (.). The results of simple analysis performed with the TABULATE procedure are shown in Output 1.
Output 1. Analysis of answers to selected questions in the peanut butter survey
INCOME PER ABSOLUTE RELATIVE
PERSON RATE ON RATE ON REGION (in SCALE SCALE
--------------- thous. FROM 1 FROM 1 GDANSK IOLSZTYN ALL zloties) TO 4 TO 5 -------+-------+------------+--------+--------+--------
N I N I N I % I MEAN I MEAN I MEAN -----------------+-------+-------+-------+----+--------+--------+--------
;:i;-----------1 301 421 72163.712374.471 3.041 3.85 -----------------+-------+-------+-------+----+--------+--------+--------male I 131 281 411 36•312486.261 3.151 3.73 -----------------+-------+-------+-------+----+--------+--------+--------LEVEL OF EDUCATION primary 7 2 9 8.0 1875.93 3.00 4.11 -----------------+-------+-------+-------+----+--------+--------+--------secondary I 221 131 35131.01 2218.501 3.361 3.86 -----------------+-------+-------+-------+----+--------+--------+--------university I 141 551 69161.11 2585.041 2.951 3.74
The results in Output 1 indicate that the American peanut butter is high rated by all groups of consumers specified in the table.
An important part of an analysis of data obtainable with surveys is a graphical presentation of results. Three-dimensional block charts are useful for illustrating similarities and differences among data. The blocks in a chart can be categorized by grouping and subgrouping variables. The following statements create a graph which shows mean relative rates of the American peanut butter in groups of consumers of the same gender and with the same level of education. The categories of the subgroup variable REGION identify segments which represent in each block proportions of respondents from Gdansk and Olsztyn, respectively.
797

goptions hsize=18 cm vsize=12 cm htext=O.42 cm hpos=80 vpos=4S device=amigl /*a user's modified divice similar to cgmmwwa */ gaccess='sasgastd>c:\seugi94\chart.cgm' gsfmode=replace ; patternl c=black v=empty; pattern2 c=black v=x2; legend frame label=('REGION:'); proc gchart data=sasuser.masloam format=4.2; block educat / type=mean
sumvar=relrate group=gender subgroup=region
discrete legend=legend noheading; format educat educate gender gender. region region.; label educat='LEVEL OF EDUCATION'; run; quit;
The produced graph is presented in Figure 1.
female
4.11 4.08 3.64
primary secondary university
lEVEL OF EDUCATION
I REGION: GDANSK ~ OLSZTYN I
Figure 1. Mean relative rates of the American peanut butter
The statements:
proc gchart data=survey; block relrate
/type=percent group=gender subgroup=region discrete legend=legend noheading; run;
produce the graph shown in Figure 2.
798

1.n% 0.88%
2.65% 16.81 % 21.24 % 20.35 %
muchwol'H same better much better
RATE IN COMPARISON TO OTHER PEANUT BUTTER
I REGION: c::::=J GDANSK ~ OLSZTYN I
Figure 2. A percentage of different rate categories for male and female in the peanut butter survey
The block chart in Figure 2 indicates that female rates of the American peanut butter are more dispersed in comparison to male rates. All negative rates are related with respondents from Olsztyn.
For successful promotion of a new product it is important to know what is the main source of consumer's information about new food products. The variable SOURCE takes on the value 1 when a consumer gets his information while shopping. Otherwise, if the main source of consumer's information is television, radio, national and local newspapers then the variable takes on the value O.
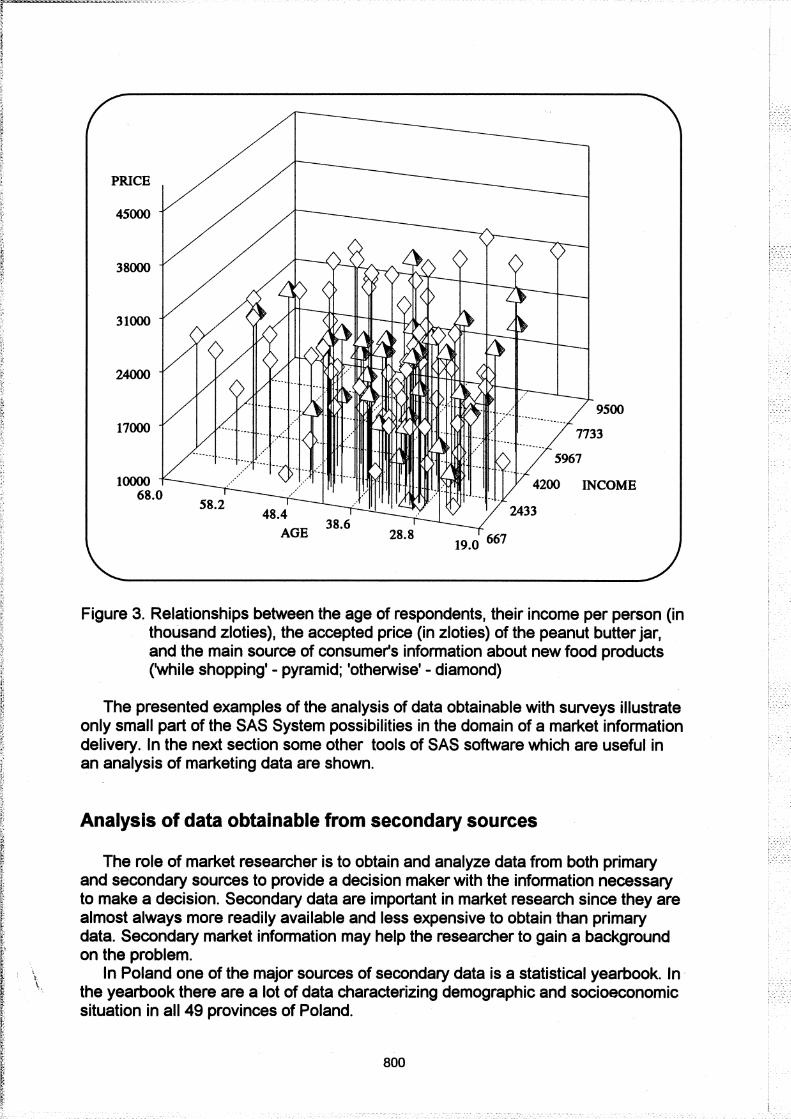
Figure 3 illustrates how the age of respondents, their income per person, and the accepted price for a smaller (340 g) jar of the peanut butter correlates with the variable SOURCE. The graph is created using the G3D procedure:
goptions hsize=20 cm vsize=15 em htext=O.42 cm hpos=80 vpos=45 device=cgmmwwa gaccess=' sasgastd>c: \seugi94\g3d.cgm' gsfmode=replace ; data survey; length shapeval $8.; set survey; if SOURCE=1 then shapeval='pyramid'; if SOURCE=O then shapeval='diamond'; proc g3d data=survey; scatter AGE*INCOME=PRICE /xticknum=6 yticknum=6 zticknum=6 shape=shapeval grid caxis=black; run;
The graph in Figure 3 shows that consumers obtaining their information about new food products from television, radio, national and local newspapers are ready to accept higher price for a jar of the American peanut butter. Also older respondents are ready to pay more for the peanut butter.
799
. . ,-. ~ - -... _. -.. --." -- _. ,,---
PRICE
45000
38000
31000
24000
17000
AGE
9500
7733
5967
INCOME
Figure 3. Relationships between the age of respondents, their income per person (in thousand zloties), the accepted price (in zloties) of the peanut butter jar, and the main source of consumer's information about new food products ('while shopping' - pyramid; 'otherwise' - diamond)
The presented examples of the analysis of data obtainable with surveys illustrate only small part of the SAS System possibilities in the domain of a market information delivery. In the next section some other tools of SAS software which are useful in an analysis of marketing data are shown.
Analysis of data obtainable from secondary sources
The role of market researcher is to obtain and analyze data from both primary and secondary sources to provide a decision maker with the information necessary to make a decision. Secondary data are important in market research since they are almost always more readily available and less expensive to obtain than primary data. Secondary market information may help the researcher to gain a background on the problem.
In Poland one of the major sources of secondary data is a statistical yearbook. In the yearbook there are a lot of data characterizing demographic and socioeconomic situation in all 49 provinces of Poland.
800

An example of an analysis of selected variables determining potential "richness" or "poverty" of a particular province is presented. Six variables are used in the analysis: URODZ - birth rate, BEZROB - unemployment rate, EMERENT - rate of penSioners, DZIETN - average number of children in a family, LOPSPOL - social welfare rate, STARSI - rate of persons, age 65 and more.
To explore relationships among these variables principal component analysis has been performed. Principal component analysis can be used for creating new agregated and uncorrelated variables. Each new variable accounts for the greatest possible variance in primary data. These synthetic variables are frequently useful in other analyses.
The input variables have been standardized across all elements of each particular variable X using the range of the variable as the divisor. The values Sl of the new variable S are computed as (see [1]):
Si=(~- MIN(X» / (MAX(X)-MIN(X». The variables obtained after standardization are denoted as SURODZ,
SBEZROB, SEMERENT, SDZIETN, SLOPS POL, SSTARSI, respectively. The covariance matrix has been used to compute the principal components, because the standardized variables take on the values on the same scale bounded by 0 and 1. Figure 4 shows the results obtained with SAS/INSIGHT software. The results indicate that the first two principal components generated from the covariance matrix explain over 70 percent of variance. Figure 4 shows also the first three eigenvectors
--------------------------------------------------------------, : Eigenyalues (CDU) I
~-----------------~----------------------------------- ________ J I Component E i genYa 1 ue : D i "erence : Proport ion ! Cumu 1 at i ye : I ................ , .... .. ...................... : ..... _ .................. ' ........................ oJ ........................ .
PCUI 0.1366 0.0322 ' 0.3998 I 0.3998 PCV2 o. 1043 0 .0406 0 .3055 i 0.7053 PCV3 0.0638 0.0364 0.1867 0.8920 PCU4 0.0273 0.0185 0.0800 0.9720 PCV5 0.0088 , 0.0081 0.0258 ! 0.9978 PCU6 I 0.0008 , . : 0 • 0022 ! 1 .0000 ___________ ~ ___________ ~ _________________________ L ___________ J
r---------------------------------------------------- I , EigenYeCtors (CDU) : , .. 'U~~"i'~'l'~""!'"'''' .. pcu·i· ........ -r ...... ·PCV·2· ........ ·r ...... pcua ............ : ................................... _ ....... ! ............................ _ ...................... 1. ............................... _._ ....................................................................... 1
I' SURODZ 0.3328 ; 0.4895 : -0.2003 SBEZROB 0 .4932 i 0 • 0837 0 • 3269
IISEMERENT -0.4540 : 0.2814 0.3351 SDZ IETN 0.2421 0.6829 -0.2122
I SLOPSPOL 0 • 3380 -0.0189 0 • 7788 I SSTMSI -0.5168 0.4555 0.2986 .
Figure 4. Results of principal component analysis
801
\
\,
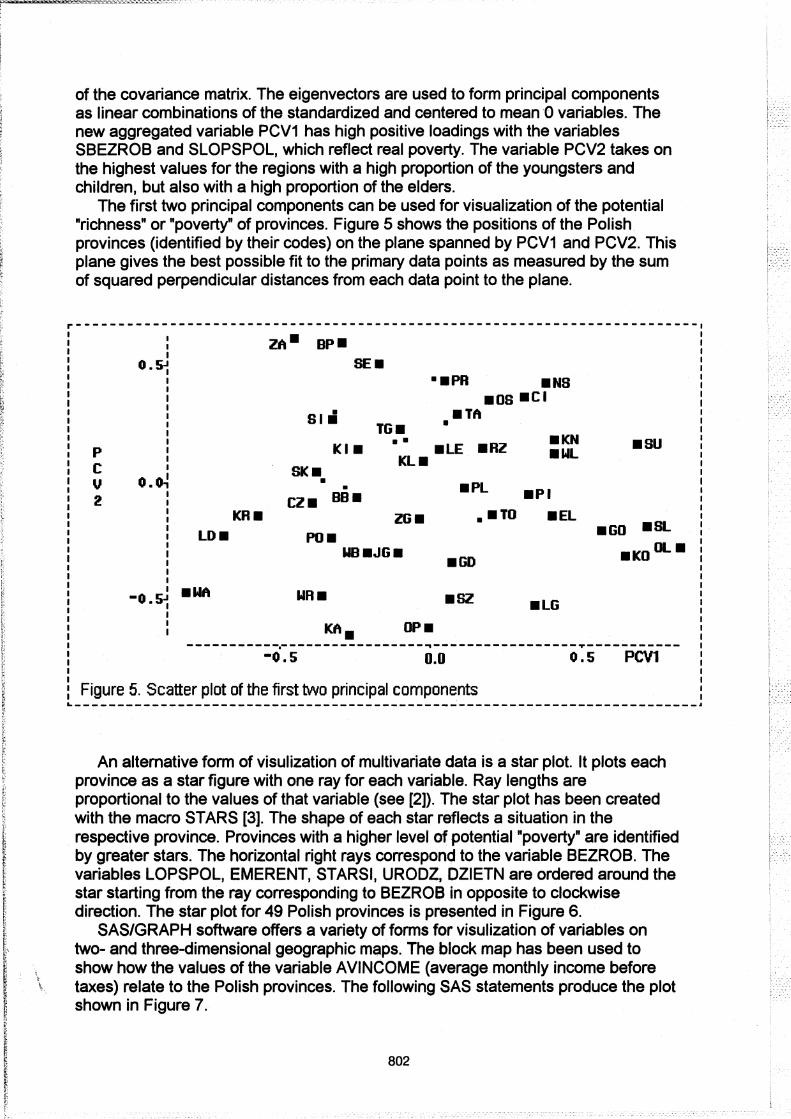
of the covariance matrix. The eigenvectors are used to form principal components as linear combinations of the standardized and centered to mean '0 variables. The new aggregated variable PCV1 has high positive loadings with the variables SBEZROB and SLOPSPOL, which reflect real poverty. The variable PCV2 takes on the highest values for the regions with a high proportion of the youngsters and children, but also with a high proportion of the elders.
The first two principal components can be used for visualization of the potential "richness" or "poverty" of provinces. Figure 5 shows the positions of the Polish provinces (identified by their codes) on the plane spanned by PCV1 and PCV2. This plane gives the best possible fit to the primary data points as measured by the sum of squared perpendicular distances from each data point to the plane.
r-------------------------------------------------------------------------I ZA· BP. I I
0.5.J SE. ·.PH .NS .OS .CI
SI_ .TA TG. •
KI. •• .lE .RZ .KH .so
P Kl. .wt C SK. U 0.0, • .Pl • 2 CZ. DB. .PI
ICA. ZG. • .TO .El LD. .GO .SL
PO. WO.JG.
.GO .KO OL •
-0.5~ .IM WR. .sz .lG
I I
KA. OP. I -----------.-----------------"'" -----------------.. ------------0.5 0.0 0.5 PCYl
Figure 5. Scatter plot of the first two principal components ~-------------------------------------------------------------------------,
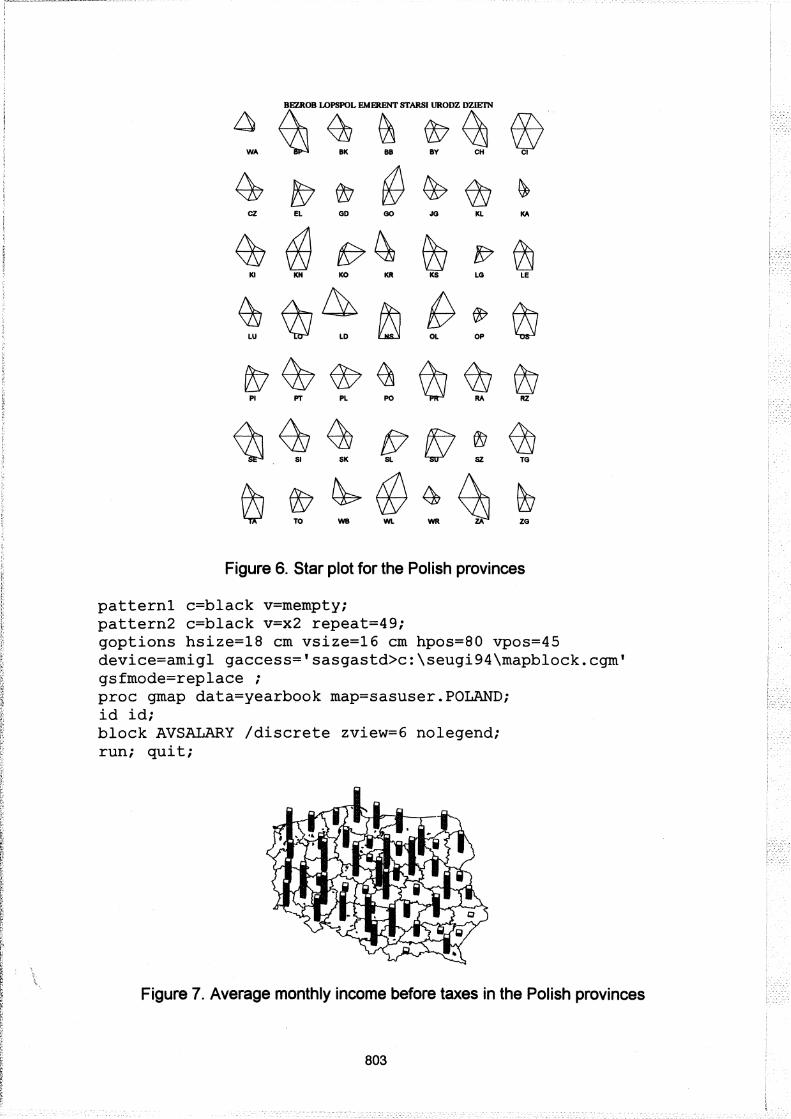
An altemative form of visulization of multivariate data is a star plot. It plots each province as a star figure with one ray for each variable. Ray lengths are proportional to the values of that variable (see [2]). The star plot has been created with the macro STARS [3]. The shape of each star reflects a situation in the respective province. Provinces with a higher level of potential "poverty" are identified by greater stars. The horizontal right rays correspond to the variable BEZROB. The variables LOPSPOL, EMERENT, STARSI, URODZ, DZIETN are ordered around the star starting from the ray corresponding to BEZROB in opposite to clockwise direction. The star plot for 49 Polish provinces is presented in Figure 6.
SAS/GRAPH software offers a variety of forms for visulization of variables on two- and three-dimensional geographic maps. The block map has been used to show how the values of the variable AVINCOME (average monthly income before taxes) relate to the Polish provinces. The following SAS statements produce the plot shown in Figure 7.
802
~ ~~1~"'~<S ® ~lS7®@~*~ ~ n 00 00 ~ ~ AA
~ ~ f:7~ ~ fV ~ ~ ~ ~ M Q ~ ~
~ \b~ ~ ~ ~ ~ ~~~~~~t? ~.~~ ~ty!~ ~~~~~~~
Figure 6. Star plot for the Polish provinces
patternl c=black v=mempty; pattern2 c=black v=x2 repeat=49; goptions hsize=18 cm vsize=16 em hpos=80 vpos=45 device=amigl gaccess='sasgastd>c:\seugi94\mapblock.cgm' gsfmode=replace ; proc gmap data=yearbook map=sasuser.POLAND; id id; block AVSALARY Idiscrete zview=6 nolegend; run; quit;
Figure 7. Average monthly income before taxes in the Polish provinces
803
~ - -. - -". _ ... _- -- -,- ----~: . - . - ", -" ".-.". "-"., :"". -,"-"--'- "--"- .--- -- ~ -
I , I .

The choropleth map has been used to show how the values of the variable AVRELPNS (relative average retiring pension before taxes) are associated with the Polish provinces. The following SAS statements produce the map shown in Figure 8.
patternl c=black v=m3nO; pattern2 c=black v=mlnO; pattern3 c=black v=e; pattern4 c=black v=mln90; patternS c=black v=m3n90; pattern6 c=black v=mSn90; goptions hsize=lS cm vsize=18 cm htext=O.42 cm hpos=80 vpos=4S device=amigl gaccess='sasgastd>c:\seugi94\mapchoro.cgm' gsfmode=replace ; proc gmap data=yearbook map=sasuser.POLAND; id id; choro AVRELPNS /levels=S; run; quit;
AVRELPNS ~ 0.88 E::J 0.96 C:J 1.04 IITIIIl 1.12 IlIIIIIJ 1.2 na 1.28
Figure 8. Average relative retiring pension before taxes in the Polish provinces
Summary
SAS software offers a variety of powerful analytical and graphical tools for tranforming primary and secondary marketing data into market information. Results of analyses of data obtainable with surveys are helpful in discovering behaviour patterns of clients and consumers. Results of analyses of secondary source data are useful in determining the strategy for a firm or organization. The SAS System delivers information in an efficient fashion and in a form which is relevant to market decisions.
804

Acknowledgements
I am grateful to Professor Bill Miller from the University of Georgia and to Dr. DeeVon Bailey for inspiration. Thanks are due to Dr. Stanislaw Pilarski from Olsztyn and Dr. Daniel Roszak from Gdansk for the supply of the data from the peanut butter survey.
This work was partially supported by the State Committee for Scientific Research (grant no. 8 S503 033 06) and by the internal grant of the Kielce University of Technology.
References
1. G. W. Milligan and M. C. Cooper, A study of variable standardization, Working Paper Series 87-63, College of Business, The Ohio State University, May 1987. 2.1. M. Chambers, W. S. Cleveland, B.Kleiner and P. A. Tukey, Graphical Methods for Data Analysis, Wadsworth, Belmont, 1983. 3. M. Friendly, SAS System for Statistical Graphics, First Edition, SAS Institute Inc., Cary, NC, USA, 1991.
Trademark citations -
SAS, SAS/GRAPH and SAS/INSIGHT are registered trademarks of SAS Institute Inc., Cary, NC, USA.
Any comments will be appreciated: Dr. Zdzislaw Piasta Kielce University of Technology 25-314 Kielce, AI. 1000-lecia P. P. 5 POLAND
e-mail: [email protected]
805
- - - - - - -- --- .----- --~ -~.--" ... - ~-~,~- -~ ... , ,,', ,- '-'~' .-..•.• -. ~--... ----.-. ...;~-~"~:-:-'.-"'--<-:.,,:-<-- .-.. _-
- - ,