market structure and liquidity on the tokyo stock … market structure and liquidity on the tokyo...
TRANSCRIPT

This PDF is a selection from an out-of-print volume from the National Bureauof Economic Research
Volume Title: The Industrial Organization and Regulation of the SecuritiesIndustry
Volume Author/Editor: Andrew W. Lo, editor
Volume Publisher: University of Chicago Press
Volume ISBN: 0-226-48847-0
Volume URL: http://www.nber.org/books/lo__96-1
Conference Date: January 19-22, 1994
Publication Date: January 1996
Chapter Title: Market Structure and Liquidity on the Tokyo Stock Exchange
Chapter Author: Bruce N. Lehmann, David M. Modest
Chapter URL: http://www.nber.org/chapters/c8108
Chapter pages in book: (p. 275 - 316)

9 Market Structure and Liquidity on the Tokyo Stock Exchange Bruce N. Lehmann and David M. Modest
Common sense and conventional economic reasoning suggest that liquid sec- ondary markets facilitate lower-cost capital formation than would otherwise occur. Broad common sense does not, however, provide a reliable guide to the specific market mechanisms-the nitty-gritty details of market microstruc- ture-that would produce the most desirable economic outcomes.
The demand for and supply of liquidity devolves from the willingness, in- deed the demand, of public investors to trade. However, their demands are seldom coordinated except by particular trading mechanisms, causing transient fluctuations in the demand for liquidity services and resulting in the fragmenta- tion of order flow over time. In most organized secondary markets, designated market makers like dealers and specialists serve as intermediaries between buyers and sellers who provide liquidity over short time intervals as part of their provision of intermediation services. Liquidity may ultimately be pro- vided by the willingness of investors to trade with one another, but designated market makers typically bridge temporal gaps in investor demands in most markets.'
Bruce N. Lehmann is professor of economics and finance at the Graduate School of Interna- tional Relations and Pacific Studies at the University of California, San Diego. David M. Modest is associate professor of finance at the Walter A. Haas School of Business Administration at the University of California, Berkeley.
The authors thank Kazuhisa Okamoto of Wells Fargo Nikko Investment Advisors, Pete Kyle of Duke University, and participants at the NBER conference for helpful comments and suggestions. They are grateful to Nikko Securities, the Nikko Research Center, and the Institute of Investment Technology for providing them with the data and with help in all phases of this investigation. The authors have achieved their present level of understanding of Tokyo Stock Exchange mechanisms through the patience of Yutaka Fujii, Takeshi Hirano, and Shunzo Kayanuma of the TSE, all of whom endured many persistent questions with unfailing good cheer. Tony Azuma and Hiroshi Koizumi helped the authors throughout the project, both by inquiring about the TSE mechanisms and by performing the calculations. The authors remain guilty of any remaining errors.
1. The former is commonly termed natural liquidity and the latter bridge liquidity.
275

276 Bruce N. Lehmann and David M. Modest
This is not the case on one of the largest and most active stock markets in the world: the Tokyo Stock Exchange (TSE). The designated intermediaries of the TSE are merely order clerks called saitori.’ The saitori clerks log limit orders in a public limit order book and match incoming market orders to the limit orders or to each other in accordance with strict rules based on price, time, and size priority. On the TSE, orders from the investor public, not from designated market makers, bridge temporal fluctuations in the demand for li- quidity services.
All continuous market mechanisms cope with temporary order imbalances that outstrip their capacity to supply liquidity, essentially by throwing sand in the gears. Since no designated market maker stands ready to absorb transient order flow variation on the TSE, its procedures provide for flagging possible occurrences of transient order imbalances and for routinely halting trade to attract orders when particular kinds of order imbalances occur. Such mecha- nisms always trade the benefits of attracting more liquidity to the marketplace against the cost of impeding the price discovery process and the immediacy of execution.
The Securities and Exchange Commission (SEC 1992) noted that it pro- posed the addition of a consolidated limit order book to the National Market System (NMS) in 1976. It went on to record that “commentators [like the ex- changes] asserted that a time and price preference for public limit orders would provide a major trading advantage for those orders, thereby creating a disincen- tive for the commitment of market making capital by dealers, and might even- tually force all trading into a fully automated trading system” (3). By contrast, many academics and practitioners believe that market structures should re- semble such consolidated public limit order books because they produce low- cost liquidity, essentially by providing open and equal access to market mak- ing. The TSE has many of these features, making it an interesting subject for a comparative study.
Financial economists, practitioners, and regulators are at present evaluating the relative fairness and efficiency of alternative market structures.i An empiri- cal appraisal of the TSE’s mechanisms would appear to be a useful contribution at this time. In this paper, we study the procedures designed to warn of and cope with transient order imbalances and their impact on the price discovery process.d
2. The order book officials (OBOs) of the Chicago Board Options Exchange play a similar role
3. The Market 2000 study is one major focus of this effort. 4. We also devote a little attention to the division of the trading day into two trading sessions
and the large tick sizes for some stocks. We ignore two important frictions: fixed commissions and the stamp tax. Commissions are sizable, just below 1 percent for one to five round lots and some- what above 0.5 percent for ten to thirty round lots of a stock selling for Y1,OOO. The stamp tax is 0.30 percent for customers and 0.12 percent for member firms. In so doing, we take the order placement strategies of investors as given and measure their impact given the constraints imposed by the market mechanism.
in that market.

277 Market Structure and Liquidity on the Tokyo Stock Exchange
The paper is laid out as follows. Section 9.1 describes the market-making mechanism, and section 9.2 provides an analytical description of the data. Sec- tion 9.3 reports on the efficacy of the TSE trading mechanisms. A brief conclu- sion rounds out the paper.
9.1 An Analytic Description of the Tokyo Stock Exchange
In this section, we first contrast the salient qualities of the TSE with those of exchanges in the United States like the New York Stock Exchange (NYSE). We then describe the structure of the market and its trading mechanisms in some detaiL5
9.1.1 Fragmentation and Transparency in U.S. and Japanese Equity Markets
One useful way to contrast equity trading mechanisms is in terms of frag- mentation and transparency. Fragmentation has two dimensions: time and space. We discussed temporal fragmentation in the introduction-the unex- pected variation in order flow over time. Spatial fragmentation refers to com- peting market mechanisms that might differ in trading opportunities, partici- pants, or the method of participation. Transparency refers to the extent to which the information disseminated by a trading venue provides a clear ex ante picture of trading opportunities and a clear ex post picture of comparative trad- ing performance. In order to contrast trading mechanisms in these dimensions, we must examine the particulars of order submission, exposure, execution, and reporting as well as those of competing mechanisms in the same securities.
Like the TSE, the NYSE is an order-driven market. However, it is notpurely order-driven: specialists act both as designated intermediaries and as desig- nated market makers who often supply liquidity when public orders are not available. Like the saitori, the specialist logs limit orders and either crosses incoming market orders, exposes them to the crowd, or marries them to public limit orders when possible. When order imbalances remain, specialists gener- ally first fill any such orders out of inventory. If order imbalances are unusually large, the specialist can temporarily halt trading with the approval of a floor official of the NYSE.6
The TSE mechanism presupposes that order imbalances might be transient or might signal the discovery of a new “equilibrium” price. Accordingly, it advertises the presence of imbalances through indicative quote dissemination and temporarily halts trade to expose pending orders to the public when the immediate execution of one or more orders would move prices “too much.”
5 . The basic structure of the TSE has been described well by others, including Amihud and Mendelson (1989), Lindsey and Schaede (l992), Hamao and Hasbrouck (1993), and Tokyo Stock Exchange (1989).
6. See Hasbrouck, Sofianos, and Sosebee (1993) for a recent detailed discussion of NYSE halt procedures. The TSE has similar provisions for halting trade when news has been released or is pending. Such halts occur infrequently, and trade is reopened by a single-price auction.

278 Bruce N. Lehmann and David M. Modest
Finding out whether such mechanisms are efficacious is one major motivation for this paper.
Spatial fragmentation is an important feature of equity trading in the United States. Numerous trading venues now provide different investors with different kinds of trading opportunities. Specialized venues exist for trading large blocks of stock on the upstairs market of the NYSE and for small retail orders through order flow purchases by third-market dealers like Madoff Securities. Several regional markets compete for order flow as third-market dealers by guaranteeing execution at or inside the NYSE spread. Several fourth-market mechanisms compete with the NYSE by letting institutions trade directly with one another without the intermediation services of an organized market or mar- ket makers. Examples include public single-price auctions like the Arizona Stock Exchange and crossing networks that use different NYSE prices or quotes during hours when the NYSE is open, like Posit and Instinet, or when it is closed, like Reuters' Crossing network.'
The TSE differs in this dimension as well. The vast majority of trading in equities listed on the TSE takes place on its physical or its electronic trading floor. Slightly fewer than one thousand stocks listed on the TSE are listed on regional exchanges in Japan, but volume off the TSE is small, and these ex- changes cannot engage in third-market-style competition because they have very similar trading structures.8 There is no separate structure for large and small, retail and institutional, or any other differentiation of order by size of trade, type of investor, or form of trading venue. The TSE is the largest highly consolidated equity trading mechanism in the world.9
Securities markets also differ in their levels of transparency. U.S. auction markets like the NYSE have routine trade reporting and dissemination proce- dures to ensure that trading results are broadcast widely. The TSE audit and reporting procedures resemble those of American exchanges; hence, the TSE differs little in ex post transparency.") As for ex ante transparency, American
7. Whether such fragmentation impairs liquidity and the process of price discovery or improves performance through competition rcmains an open question. Many of the underlying issues are complicated, including violation of price, size, and time priority across markets and the anonymity of trading on many trading venues.
8. The regional exchanges have nearly identical order-driven limit order books maintained by order clerks who do not act as market makers. Osaka is the largest regional exchange by far, largely because of its active index futures and options markets. The others are Fukuoka, Hiroshima, Ky- oto, Nagoya, Niigata, and Sapporo.
9. Other markets with comparable levels of automation like the Toronto Stock Exchange and the Paris Bourse have separate block trading facilities. The TSE does have a limited public block trading facility, which accounts for only a small fraction of trading. See section 9. I .2.
10. Major differences in ex post transparency exist between order-driven markets like the NYSE and the TSE and dealer markets like the Stock Exchange Automated Quotations (SEAQ) system in London, which does not enforce last-sale reporting. Ex post transparency is a public good, and the property rights to the information that a trade has occurred (and any associated informational externalities) are assigned to the trader in many dealer markets, including SEAQ. Traders seem to value anonymity-much of the volume of the Madrid Stock Exchange and Paris Bourse (both very transparent markets) has moved to SEAQ, particularly large block trades.

279 Market Structure and Liquidity on the Tokyo Stock Exchange
exchanges and the TSE both widely disseminate the best bid and offer in a stock. However, the TSE is less transparent than its American counterparts in the dissemination of quote depth, which is broadcast widely in the United States but not in Japan.”
However, the TSE provides for high levels of transparency in the head of- fices of its member firms. Every member has a small number of terminals (based loosely on annual trading volume) on which the consolidated limit or- der book of any listed stock can be viewed at any time. It lists the extant bids and offers and their aggregate size at each price, but this information can be neither stored nor rebroadcast. All traders can supply liquidity in the face of fragmentation of trades over time, since the TSE routinely flags potential order imbalances. However, only head-office traders of member firms (and others who talk to them) have this special access to the limit order book, and head- office brokers can and do routinely examine the limit order book when buying or selling stock for customers, particularly for large institutions.
To some extent, then, we can think of the TSE mechanism as approximating the information content of a consolidated electronic limit order book, at least from the viewpoint of member firms.’* In addition, the TSE mechanism adver- tises both potential order imbalances and temporary trading halts through the dissemination of indicative quotes as discussed below. Taken together, these features may be a close substitute for widespread dissemination of the elec- tronic book.I3
9.1.2 The Structure of the Tokyo Stock Exchange
There are 1,661 stocks listed on the TSE. Of these, 1,232 are in the so-called First Section, and 429 less active stocks are in the Second Section. The 151 most active First Section stocks are still traded on the trading fl00r.I~ The re- maining First Section and all of the Second Section stocks are traded electroni-
11. The information content of quote depth in the United States is not clear, since quotes are often only for nominal sizes. Member firms can broadcast the best bid and offer to their branches, but not all firms do so. Outside investors can generally get only more limited data like the high, low, open, and closing prices as well as the five most recent trade prices directly from vendors like Nihon Keizai Shimbun (Nikkei).
12. The conditional statement “to some extent” is critical here-a whole host of agency prob- lems are associated with interpreting broker-dealer observation of the limit order book as close to widespread dissemination of and open access to the book. This interpretation would surely be questioned by academics like Glosten (1994) and Black (1993) and practitioners, particularly fourth-market advocates like Steve Wunsch and the Arizona Stock Exchange.
13. Prior to the electronic book, the saitori would provide ready access to the limit order book to all trading clerks on the floor. While it is perhaps easy to understand why the TSE does not widely disseminate the electronic limit order book, the restriction of the number of screens at the head office is harder to understand. The TSE apparently views the current system as facilitating order processing and execution only and that widespread dissemination would facilitate market making by member firms, an undesirable outcome from the TSE’s viewpoint.
14. New Japan Railway Company was recently added to the list of floor-traded stocks.

280 Bruce N. Lehmann and David M. Modest
cally on the Computer-Assisted Order Routing and Execution System (CORES).'5
The trading rules for floor- and system-traded stocks are identical. Orders for less than three thousand shares for floor-traded stocks are usually submitted electronically, while larger orders are brought to saitori posts manually.lh Order entry is electronic for system-traded stocks. There is no odd-lot trading, and one thousand shares is a round lot for most stocks."
The TSE has two trading sessions per day. The morning session begins at 9:OO A.M. and ends at 11:OO A.M. Trading resumes at 12:30 P.M. and ends at 3:OO P.M. Most continuous trading markets begin trading sessions with a single-price auction. The TSE is no exception, starting each session with an auc- tion called the itayose. Continuous trading follows until the close of the session.
The itayose is based on standard auction market principles. Public market and limit orders are submitted in the twenty-five minutes before the open. The saitori clerks essentially search for a price that executes all market-on-open orders and roughly matches the residual supplies and demands expressed as limit orders.I8 The itayose is also used to reopen trade after a suspension by the president of the TSE.
Failure to meet these conditions results in a delayed open. In the event of a delayed open, the saitori issues a special quote (the tokubetsu kehai, described extensively below).19 Briefly, the purpose of this indicative quote is to attract sufficient orders from the public until the conditions required to open the stocks are met. The special quote adjustment process used in delayed opens is identical to the one described below (which is used in the continuous market), except that the saitori cumulates orders until the itayose requirements are met.
The TSE also permits market-on-close orders to be executed in a batch auc- tion. For such auctions, the requirement that at least one round lot of each limit
15. CORES is based on the Computer Assisted Trading System (CATS) of the Toronto Stock Exchange (a different TSE) but is operated somewhat differently. For example, the Toronto Stock Exchange has designated market makers.
16. These orders arrive via the Floor Order Routing and Execution System (FORES). 17. A round lot is one thousand shares for a stock with a par value of V50 and one hundred
shares for the small number of stocks with a par value of 8500 and for selected high-priced stocks. About one hundred securities fall into this latter category. Odd lots are traded off the exchange, but round lots must be traded on an exchange.
18. In order to open a stock, the saitori must execute (1 ) all market orders, (2) at least one limit order, (3) all limit orders that better the itayose price, (4) all limit orders on one side of the market at the itayose price, and (5) at least one round lot of each limit order on the other side of the market at the itayose price. Amihud and Mendelson (1989). Hasbrouck, Sofianos, and Sosebee (1993), and Lindsey and Schaede (1992) provide examples of the opening process. One difference between the TSE and the NYSE is that the specialist may participate in the open, but there is no designated market maker available to do so on the TSE. The requirement that a limit order participates in the TSE open replaces the possibility of specialist participation in the NYSE open.
19. The initial special quote is set equal to the prior close plus or minus the maximum price variation (see table 9. I ) in the direction of the order imbalance. The initial order imbalance at that price is calculated from the demand and supply curves based on the market and limit orders sub- mitted prior to the itayose. This order imbalance is reported as the size of the special quote on broker screens.

281 Market Structure and Liquidity on the Tokyo Stock Exchange
order on one side of the market must be executed at the itayose price is weak- ened. It is often difficult to execute market-on-close orders using this revised itayose mechanism because prices that would clear the market often exceed the maximum price variation between trades, and so such orders often go unexe- cuted. As a consequence, market-on-close orders are used much less frequently in Tokyo than in the United States.20
Following the itayose, the continuous auction market called the zaraba be- gins operation. The best unexecuted limit orders become the opening bid and offer. Limit orders remain on the book until they are executed or canceled or until the afternoon session ends. After the open, the saitori maintains the limit order book and marries incoming market orders with either limit orders or other incoming market orders.21 This process continues until a temporary trad- ing halt results from an order imbalance, the trading session ends, the president of the exchange suspends trading, or the daily price limit is hit. The latter two possibilities are extremely rare.
Virtually all trades are executed during the itayose and the zaraba. There is a very limited block trading facility and an unusual method for crossing trades. There are electronic bulletin boards on the floor on which member firms can publicly advertise large orders to potential counterparties. This limited form of sunshine trading essentially constitutes the public block trading mechanism of the TSE.Z2 Crossing trades can occur only if the same member firm represents both sides of the trade.23 Virtually all crossing trades are made with a corporate equity holder being both the buyer and the seller, and the member firm essen- tially serves as a dealer to facilitate the trade. The purpose of these trades is to change the book value of an equity position owned by that corporation on its balance sheet at fiscal year end.24
20. The TSE says there is relatively little demand for this service, an unsurprising outcome given the difficulties with the mechanism.
21. Saitori clerks also monitor the limit order book and control the execution process for system- traded stocks.
22. These advertisements are posted on the display above the trading floor and are not broadcast, although the floor brokers of member firms rapidly transmit this information to their home offices. Their use is sufficiently rare that all successful trades result in loud and widespread applause on the trading floor.
23. Strictly speaking, one customer cannot be both buyer and seller in the same transaction because of the portion of the Securities and Exchange Law that defines manipulative activity to be trading without an intent to transfer possession. Consequently, the member firm acts like a dealer and essentially executes two trades when crossing on the TSE. Since these trades must go through the limit order book, the member firm cannot cross the trade at the single market price if there are other orders on the book. Accordingly, member firms frequently cross trades on regional exchanges since their limit order books are often empty because most trading is consolidated on the TSE. In order to forestall manipulation (such as the illegal trading done in 1990 and 1991 to compensate customers for losses they incurred), large transactions in which one member firm acts as both buyer and seller must be executed at a price within a fixed limit of the last trade price on the TSE, irrespective of where the trade is executed. In addition, the member firm must report the purpose of the trade and the kind of customer to the exchange.
24. Lindsey and Schaede (1992) discuss the private crossings called onna-hen no baikai. Baikai do not pass through the saitori's order book but instead are treated as if they are matched by the

282 Bruce N. Lehmann and David M. Modest
Trading during the day is subject to a variety of price limits that are given in table 9.1. The maximum price variation and the daily price limit are both upper bounds on price changes. The daily price limit is the maximum amount that a price can change on a trading day relative to the closing price on the prior day. Trade is suspended whenever the daily price limits are hit, but trade can resume again by the submission of limit orders at admissible prices. These limits are wide; hence, trading is rarely suspended because of them. The maximum price variation describes the maximum price change from the previous trade that a single order is permitted to cause by executing it against limit orders on the book. Much of this paper is devoted to an analysis of the role played by the maximum price variation.
A neglected institutional feature of the TSE is the tick size or minimum price variation of stocks.zs In U.S. markets, the tick size is usually fixed at an eighth, although traders can split ticks in some circumstances. In contrast, tick sizes on the TSE depend on stock prices, as shown in table 9.1. A particularly interesting break point occurs at Y1,OOo: a Y l minimum tick for stocks selling below Y1,OOO and a Y 1 0 minimum tick for stocks selling above Y1,000.2h Since roughly one-third of the stocks on the TSE sell for more than Yl,OOO, the tick size is nearly 1 percent for many stocks, making stepping across the spread to buy immediacy quite expensive.*’
9.1.3 Order Imbalances and the Trading Mechanisms of the Tokyo Stock Exchange
The TSE needs a mechanism to deal with temporary order imbalances be- cause no designated market maker stands ready to meet fluctuations in the demand for liquidity. There are three components of the TSE system for coping with potential order imbalances: (1) advertising the possibility of a transient order imbalance; ( 2 ) halting trade when immediate execution of one order would move prices “too much”; and (3) providing for orderly quote changes on the path to a new “equilibrium” price when an order imbalance is created by more than one order. We devote the rest of this section to a comprehensive
customers themselves, with the member firm acting as consultant and certifying that the trade was consummated within exchange rules. Neither member firms nor their subsidiaries can be a buyer or seller in buikui. The price setting and reporting requirements resemble those for regular cross- ing trades.
25. Angel (1993) also notes the extreme tick-size change in percentage terms at Y1.000. 26. Few stocks sell above Y10.000 and only Nippon Telephone and Telegraph sells for more
than Y30.000. 27. We account for tick-size effects in much of our work by sorting stocks into price categories.
We report in passing that we have observed the standard trade-off between tick size and market depth. For example, average trade size is much larger in stocks with large tick sizes, reflecting the greater protection from informed traders afforded by larger spreads. See Lehmann and Modest (1994) for more details.

283 Market Structure and Liquidity on the Tokyo Stock Exchange
Table 9.1 Tick Size, Maximum Price Variation, and Daily Price Limits on the Tokyo Stock Exchange
Maximum Price Price Range Tick Size Variation Daily Price Limit
0 < YlOO Y l O l toY200 Y20 1 to Y500 Y501 toY1,000 Y1,OOl toY1,500 Y1,501 to Y2.000 Y2,001 to Y3.000 Y3,OOl to Y5.000 Y5,OOl toY10,OOO Y10,OOl to Y30,000
Y1 YI Y1 YI
Y10 Y10 YIO Y10 Y10
YlOO
K.5 Y5 Y5
Y10 Y20 Y30 Y40 Y50
YlOO Y200
Y30 Y50 Y80
YlOO Y200 Y300 W O O Y500
Y1.000 Y2,OOO
Source: Tokyo Stock Exchange, International Affairs Department, Tokyo Stock Exchange Fact Book 1994.
description of these procedures: the chui and tokubetsu kehai (warning and special quote) mechanisms.z8
Figure 9.1 describes the possible chain of events following the arrival of a market order. There are numerous eventualities given in figure 9.1, but the main possibilities are numbered (1) a regular trade occurs; ( 2 ) trading occurs at several prices at which warning quotes (chui kehai) are generally issued (i.e., the order walks up or down the book), but no trading halt occurs; (3) a warning quote trading halt occurs since the maximum price variation is exceeded; and (4) a special quote (tokubetsu kehai) trading halt occurs because another order arrived on the same side of the market as the pending order. The latter three possibilities are what we mean by advertising a potential imbalance, halting a trade because of one large order, and providing for discovery of a new “equilib- rium” price when a trading halt is caused by more than one large order. Note that it is usually possible to determine from the regular quotation screen which of these eventualities transpired.
When a market order arrives at the TSE, the basic initial outcomes are no trade and a regular trade. Two points of reference govern execution: the best limit orders on the book and the base price (i.e., the price of the most recent transaction). A regular trade occurs if all or part of the order can be filled at the current bid or offer.29 No trade occurs if (1) the difference between the best quote and the prior day’s closing price exceeds the daily price limit, an
28. Lindsey and Schaede ( I 992) describe the tokubetsu kehai mechanism in some detail. Hamao and Hasbrouck (1993) provide the most detailed account of both mechanisms we have seen, but the example they give of warning quote behavior in their table I seems incorrect.
29. The saitori could even issue a warning quote and halt trade if prices change only by bouncing between the bid and offer inside the maximum price variation bounds.

284 Bruce N. Lehmann and David M. Modest
Fig. 9.1 Possible events following the arrival of a market order
uncommon event due to the price limits shown in table 9.1; or ( 2 ) there is no quote available or the difference between the base price and the available quote exceeds the maximum price variation, in which case the saitori issues a warn- ing quote at the base price (or one tick above or below it).
The warning quote process generally follows a regular trade in two circum- stances. The first case arises if the size of the market order exceeds the depth at the quote so that continued execution of the order would cause the price to change from the base price. The second case occurs if there is no quote avail- able (that is, either there is no limit order on the books or one that, if executed, would cause the maximum variation to be exceeded). In both cases, the normal quotation screen indicates that a warning quote is pending, so that this informa- tion is widely available. Note that warning quotes do not give the size of the pending
30. The size of the pending order is displayed on the electronic limit order book.
285 Market Structure and Liquidity on the Tokyo Stock Exchange
Figure 9.2 traces the sequence of events following the issuance of a warning quote. It is useful to distinguish two cases: either there are or are not limit orders on the book large enough to fill the rest of the pending order without exceeding the maximum price variation. All or part of the pending order is usually executed at different prices against limit orders on the book if the maxi- mum price variation is not exceeded. In this case, warning quotes are generally issued as each new price is hit, as a sequence of trades and warning quotes appears on the normal quotation screen. The word “generally” covers two ex- ceptions: the saitori may exercise his discretion ( I ) to execute such trades with- out issuing warning quotes or ( 2 ) to delay execution. Nevertheless, the saitori usually permits semiautomatic execution and warning quote issuance within the maximum price variation limits.”
There are two primary ways in which the nonhalt portion of the warning quote process usually ends. The pending order is either completely or only partially filled. If the pending order is completely filled, the base price is changed to the last execution price, and the trading screen will register a return to normal quotes. If it is only partially filled, a warning quote is issued at the limit set by the maximum price variation, and trade is temporarily halted. There is no formal announcement of a temporary halt; the warning quote just sits on the normal quotation screen without being altered. Hence, this occur- rence can be discerned by many market participants.
There are other, less likely outcomes. An opposing order might arrive, trig- gering a normal conclusion of the warning quote process; an order from an- other member firm on the same side of the market might arrive, triggering a special quote; the pending order might be canceled, triggering a return to nor- mal quotes; or the trading session might end. These possibilities are much less likely because the saitori usually concludes the nonhalt portion of the warning quote process quickly.
If trade is halted, all or part of the pending order is available at the warning quote. The saitori rarely changes a warning quote at the maximum price varia- tion limit without the arrival of additional orders. Put differently, the TSE mechanism implicitly assumes that one order that may move prices substan- tially might well signify only a temporary order imbalance. Accordingly, the warning quote mechanism stops the price discovery process when the maxi- mum price variation limit is reached, inviting potential counterparties to hit the warning quote.
Consequently, large orders have something of sunshine flavor. Since the limit order book can be viewed at the head office of a member firm, traders placing large orders are likely to look at it beforehand. Submitting an order large enough to cause a warning quote trading halt guarantees partial execution
31. As is evident in the results given below, saitori clerks do not issue warning quotes in these circumstances a nontrivial fraction of the time. The word “semiautomatic” means that saitori clerks choose to do so most of the time, not that this procedure is programmed into CORES.

286 Bruce N. Lehmann and David M. Modest
L.( Return to ) (Altcmpr mFdl) Normnl Quater Order Remmndrr
Fig. 9.2 Warning quote behavior prior to reaching maximum price variation
of the order at predetermined prices and effectively holds an auction for any part of the remainder.
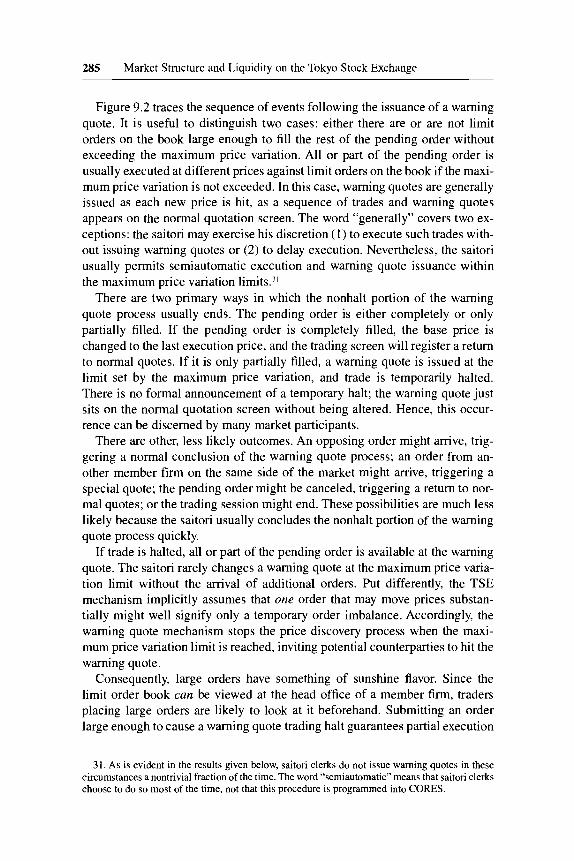
Figure 9.3 delimits the ways in which warning quote trading halts can end. The auction of the pending order concludes successfully if an opposing order arrives. All or part of the pending order is then filled, the base price changes, and the quotation screen returns to normal quotes. Any unfilled portion of ei- ther the pending market order or the opposing order if it was a market order is then treated as though it were a new market order, and the process begins anew.32 The market returns to normal quotes if the pending order is canceled, and the pending order is suspended if the trading session ends.33
Finally, the warning quote is converted into the other indicative quote-the special quote or tokubetsu kehai-if a market order arrives from another mem- ber firm on the same side of the market as the pending order. The issuance of a special quote is also widely disseminated on the regular quotation screen. As with the warning quote, a special quote can end if an opposing order arrives, the pending orders are canceled, or the trading session ends.
However, the mechanism provides for gradual quote adjustment past the
32. Note that a partial fill of the pending order still results in a return to normal quotes. The TSE mechanism presumes that the warning quote is a reasonable candidate for the "equilibrium price" if someone is willing to trade at that price, not requiring that trader to fill the entire pending order at that price.
33. The pending order is canceled if the afternoon session ends, and the last transaction price becomes the base pnce for the purpose of computing the daily price limit for the next day. The order becomes part of the afternoon itayose if it is pending at the conclusion of the morning session and is not subsequently canceled.
287 Market Structure and Liquidity on the Tokyo Stock Exchange
SPECIAL
&*) (Atten , Normal Quotes Order Kemamder
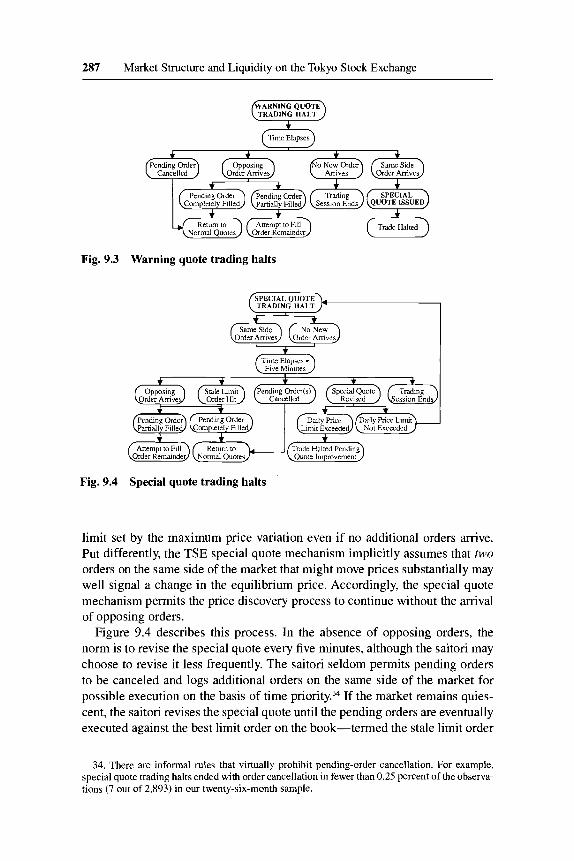
Fig. 9.3 Warning quote trading halts
Fig. 9.4 Special quote trading halts
limit set by the maximum price variation even if no additional orders arrive. Put differently, the TSE special quote mechanism implicitly assumes that mo orders on the same side of the market that might move prices substantially may well signal a change in the equilibrium price. Accordingly, the special quote mechanism permits the price discovery process to continue without the arrival of opposing orders.
Figure 9.4 describes this process. In the absence of opposing orders, the norm is to revise the special quote every five minutes, although the saitori may choose to revise it less frequently. The saitori seldom permits pending orders to be canceled and logs additional orders on the same side of the market for possible execution on the basis of time priority.34 If the market remains quies- cent, the saitori revises the special quote until the pending orders are eventually executed against the best limit order on the book-termed the stale limit order
34. There are informal rules that virtually prohibit pending-order cancellation. For example, special quote trading halts ended with order cancellation in fewer than 0.25 percent of the observa- tions (7 out of 2,893) in our twenty-six-month sample.

288 Bruce N. Lehmann and David M. Modest
in figure 9.4-if there is An exception occurs when special quote revi- sion would penetrate the daily price limit barrier, in which case trading is SUS-
pended pending the arrival of an order that can be executed inside the daily price limit.
Otherwise, a special quote trading halt ends in the same ways as a warning quote trading halt. If an opposing order arrives, all or part of the pending orders are filled, the base price changes, and the quotation screen returns to normal quotes. Any unfilled portion of either the pending orders or the opposing order, if it was a market order, is then treated as if it were a new market order, and the process begins anew.36 The market returns to normal quotes if the pending orders are canceled, and the pending orders are suspended if the trading ses- sion ends.”
As noted earlier, the TSE does not widely disseminate information about trading opportunities beyond the current best bid and offer to most participants. Instead, it disseminates two indicative quotes when market conditions suggest either an order imbalance or a change in the equilibrium price: the warning quote (chui kehai) and the special quote (tokubetsu kehai). The saitori tempo- rarily halts trade if continued execution of a single order would cause the price change to exceed the maximum price variation relative to the initial base price. A warning quote is converted to a special quote if an order from another mem- ber firm arrives on the same side of the market as the order that generated the warning quote. If no opposing orders arrive, the special quote is gradually re- vised until a new price is established by a completed transaction, which may be only a partial fill.
Finally, these procedures may not impede the trading process too much for two reasons. First, the maximum price variation bands for most stocks are be- tween 1 and 2 percent. Second, both chui and tokubetsu kehai trading halts end if an opposing order only partially fills any pending orders, even an order for only one round lot. Accordingly, prices can move substantially on relatively small volume despite these limitations on trading.
9.2 The TSE Data and Some Limitations on What Can Be Learned from It
Our data were compiled by the TSE and provided to us by Nikko Securities. We have twenty-six months of data: January 1, 1991, through November 30,
35. Note that the stale limit order can be canceled by the order submitter any time during the warning and special quote process until it is executed. Once again, the stale limit order need not completely fill the pending orders.
36. Execution of the pending orders proceeds according to time and size priority. Once again, the opposing order need not completely f i l l the pending orders.
37. In contrast with warning quotes, the prevailing special quote becomes the base price for the purpose of computing the daily price limit for the next day if a special quote is pending at the conclusion of the afternoon session.

289 Market Structure and Liquidity on the Tokyo Stock Exchange
1991, and February 1, 1992, through April 30, 1993.38 We have records of all (25,863,725) completed transactions on all TSE stocks and all quotes (includ- ing indicative quotes) for all system-traded stocks. We confine our attention to stocks traded on CORES since we are interested in quote behavior. We also limit our investigation to First Section stocks on the TSE, since Second Section stocks are much less actively traded, and, hence, the market for liquidity in these stocks is likely to differ substantially from that of the more active First Section stocks.
Our data on system-traded stocks are those that are widely available to mar- ket participants from member firms-that is, the data are in their broadcast form. Each record gives the best bid and offer if available, an indication of whether either quote was a warning or special quote, the trade size if a transac- tion took place, and a time stamp that records the time to the nearest minute.39 Buy and sell transactions are easily distinguished-virtually all trades take place at either the bid or offer.
From these data, we identified all trades that generated warning quotes. We consolidated these data into warning and special quote events-trade and quote sequences that can show how these mechanisms work in actual practice from the time a large order triggered indicative quote dissemination to the time of the return to normal quotes. We identified 722,217 such events in our twenty-six-month sample, an average of slightly less than 1.25 times per stock per day.
This procedure omits a large class of similar events-those in which saitori clerks permit a large trade to walk up or down the limit order book without issuing a warning quote. We call these regular multiple price change events because they appear as regular trades at different prices on the transaction re- cord. Accordingly, we searched for sequences of trades satisfying three crite- ria: all trades in the sequence were executed within the same minute at a mono- tone sequence of different prices on the same side of the market. We identified 154,582 such events that proved to be virtually identical to non-trading halt warning quote events in all details save for the lack of warning quote issu- an~e .~O Such events occur at an average rate of roughly 0.25 times per stock per day, making the overall occurrence of multiple price change events roughly 1.5 times per stock per day.
We are like most public investors-we do not have access to the limit order
38. The data for December 1991 and January 1992 were inexplicably lost. 39. Trades are time-stamped to the nearest second internally, but the broadcast data have this
coarser time stamp, making it hard to detect violations of time priority. The codes are 80 for a regular quote, 81 for a warning quote, 20 for a special quote, and 00 for no quote. The no-quote indicator implies that either there is no quote available or that any available quote is very far from the executable range.
40. For example, the saitori clerks let prices exceed the maximum price variation limit in 1.83 percent (13,208 out of 722,217) non-trading halt warning quote events. In regular multiple price change events, the saitori clerks permitted this limit to be exceeded in only 0.39 percent (601 out of 154,582) of the regular events in our twenty-six-month sample.

290 Bruce N. Lehmann and David M. Modest
book-and this limits what we can learn. We can only learn reduced-form facts from completed transactions, not structural observations on order- placement strategies and the supply of liquidity. Large orders may be placed only when the book indicates the market can absorb them, and small ones may be larger orders that are broken up. This observation has particular force here because we know that orders are systematically broken up and executed over time on the TSE, due to the absence of separate markets for large and small trade^.^'
One cannot be much more certain about the interpretation of completed transactions that end chui and tokubetsu kehai trading halts. Traders at member-firm head offices who end halts by hitting the warning or special quote know the pending order size(s) if they first consult the electronic limit order book.42 Their order-placement strategies presumably take this possibility into account. For example, suppose that such traders are risk neutral and that they play ~ompetitively.~' Then the order size they choose-the size of the com- pleted transaction-is set so that the warning or special quote is the expected value of the asset, given current information and the size of the pending order. One cannot simply assume that the warning or special quote measures the per- ceived marginal value of the stock, given a trade that size, because the order submitter might know the size of the pending order too, data we do not possess.@
What is at issue here is the interpretation of the results of completed transac- tions caused by market orders hitting regular and indicative quotes. We cannot hope to learn too much about the demand for immediacy in the form of market orders without observing the supply of liquidity in the form of limit 0rders.4~ Accordingly, we confine our attention to unconditional moments that could reasonably be measured by investors who had access only to the widely broad- cast information contained in our data. Even from this limited perspective, we can learn much about the TSE mechanisms.
41. Brokerage firms execute trades for large customers on an agency basis, and their traders routinely look at the limit order book when proceeding with trade execution. The absence of a block trading market means that we can draw no firm conclusions about how the TSE might function if such a market were introduced.
42. This is not merely an academic possibility-the TSE reports that proprietary trading by members firms accounts for 25 percent of all trading.
43. That is, they act like the limit order traders in Glosten's (1994) electronic limit order book. 44. Remember that warning and special quote trading halts end with the partial fill of any pend-
ing orders. Hence, letting Q, denote the size of the pending order, Q, the size of the order that hit the indicative quote, P, the price of the order that hit the indicative quote, and P, the price at some future point, a risk-neutral order submitter would choose Q, so that P, = E[P, I Q,,, Q,] f E[P, I Q,]. We might be able to make some progress by assuming that the pending order followed some sort of trading strategy whose properties we can infer from completed transactions, but such a model lies in the domain of future research.
45. We will try to obtain limit order data but are not hopeful that the TSE will permit such access.

291 Market Structure and Liquidity on the Tokyo Stock Exchange
9.3 The Efficacy of the TSE Market Mechaniqms
In this section, we first provide an overview of some of the unconditional regularities in our data. We then describe our main results-trade and quote behavior before, during, and after multiple price change events, particularly those during which warning andor special quotes were issued.
It is useful to first report some of the gross characteristics of our multiple price change events from the data. Table 9.2 foreshadows several of the conclu- sions that we draw from the more detailed results that follow. Nearly 85 percent of multiple price change events do not result in a trading halt. Of those that result in a trading halt, the vast majority end in a trade hitting the warning quote. Almost 80 percent of the multiple price change events and almost 90 percent of the trading halts take place in stocks selling below Y1,OOO (i.e., stocks with the small Y1 tick size) even though only two-thirds of stocks sell for less than Yl,000.46 Almost one-third of the multiple price change events take place within half an hour of the open of a stock (including delayed opens), a large number given that 15 percent to 20 percent of trade volume is typically at the open. We are unsurprised by the direction of these effects but find it striking that the percentages of total events in each of these categories is so large.
To conclude this brief detour, table 9.3 reports on a distinctive feature of the TSE: the division of the trading day into two trading sessions. Roughly a third of the multiple price change events in our sample occurred during the first half hour after trade in a stock opened. The majority of such events take place after the morning open, following the longer period of market c10sure.~’ Delayed opens account for about half of these events.
Call markets trade off the benefits of order consolidation against the costs of fragmented price discovery during the prior period of market closure. As Amihud and Mendelson (1989) have suggested, the long period of closure prior to the morning open (save for overnight trading in foreign markets) gener- ates subsequent order imbalances because of the absence of recent price dis- covery. However, the afternoon itayose follows the ninety-minute lunch break, a call market that benefits from the comparatively recent price discovery during the morning session.48 Afternoon order consolidation in a single-price auction is followed by low-cost trading (i.e., low bid-ask spreads) because subsequent
46. We surmise that this occurs because ( I ) 81 is a smaller fraction of the price (is., it is a smaller friction) and (2) Y10 stocks have greater quote depth because of the greater protection from informed traders (i.e., it is a larger friction).
47. There are 1,287 more multiple price change events following delayed morning opens com- pared with delayed afternoon opens. The largest component of this difference is that there are 1,207 more regular multiple price change events.
48. Amihud and Mendelson (1989) find evidence of excess volatility in their examination of open to open and close to close returns.

292 Bruce N. Lehmann and David M. Modest
Table 9.2 How Multiple Price Change Events End
Regular Warning Quote Events Ending
Change Without a With a Trading Special Quote Total Events Trading Halt Halt Trading Halts
Multiple Price
All multiple price 876,799 154,582 579,958 139,366 2,893 change events 100% 17.63% 66.14% 15.89% 0.33%
Multiple price change 870,208 154,582 579,958 133,135 2,532 events ending in a 99.25% 17.76% 66.65% 15.30% 0.29% trade
Multiple price change 696,716 100,829 47 1,2 I4 122,121 2,552 events in stocks 79.46% 14.47% 67.63% 17.53% 0.37% selling for <%I ,000
Multiple price change 282,411 59,084 172,847 49,076 1,404 events occumng 32.21% 29.92% 61.20% 17.38% 0.50% within 30 minutes of the morning or afternoon open (including delayed opens)
Note: The last three fractions in column 1 are percentages of the total number of events (i.e., 876,799), and the last four columns are percentages of the row totals.
order imbalances are typically more modest.49 Similarly, it is also unsurprising that delayed opens precede many of our multiple price change events.
Before proceeding, note one final idiosyncrasy of our presentation of these results: we did not report standard errors or other indicators of the precision of the estimates. As is readily apparent, the number of occurrences in each cell is so large that the computed standard errors are extremely small. Accordingly, we omitted standard errors and will report them only when we think there is any ambiguity.
9.3.1 The State of the Market before Multiple Price Change Events
The warning and special quote mechanisms were designed to cope with or- der imbalances, and so we first describe the state of the market prior to multiple price change events. The figures that follow compare volume and order imbal- ances in the thirty minutes prior to the event as well as the average size of the ten trades prior to the event with unconditional means for all trades in the twenty-six-month sample. We also reverse the question and employ logit mod-
49. See Lehmann and Modest (1994) for additional evidence on this point. More definitive observations require a model of the motives for trade to explain why demanders of immediacy in the morning session don’t shift their trades to the afternoon to exploit such cost differentials. In- formed traders probably would not shift trades in this fashion in a model where private information depreciates over time (i.e., becomes public) and does not vary too much over clock time.

Table 9.3 How Multiple Price Change Events around the Morning and Afternoon Opens End
Warning Quote Events Ending
Multiple Price Without a With a Trading Special Quote Total Change Events Trading Halt Halt Trading Halts
Regular
Multiple price change events occumng within 30 minutes of the morning or afternoon open (including delayed opens)
Multiple price change events occumng within 30 minutes of the morning open (excluding delayed opens)
Multiple price change events occurring within 30 minutes of the afternoon open (excluding delayed opens)
Multiple price change events occurring in stocks with morning opens delayed < 30 minutes
Multiple price change events occumng in stocks with afternoon opens delayed <30 minutes
Multiple price change events in stocks with morning and afternoon opens delayed >30 minutes
282,4 1 1 32.21%
86,613 30.67%
56,517 20.01%
63.48 1 22.48%
38,931 13.79%
36,869 13.06%
59,084 172,847 49,076 1.404 20.92% 6 1.20% 17.38% 0.50%
19,780 22.84%
10,819 19.14%
14,793 23.30%
7,337 18.85%
6,355 17.24%
5 1,374 15,014 59.3 1 % 17.33%
36.5 I 1 8,973 64.60% 15.88%
36,730 11,596 57.86% 18.27%
25,115 6,335 64.5 1 % 16.27%
23,117 7,158 62.70% 19.41%
445 0.51%
214 0.38%
362 0.68%
144 0.37%
239 0.65%
Noret The last three fractions in column 1 are percentages of the total number of events (i.e., 876,799), and the last four columns are percentages of the row totals.

294 Bruce N. Lehmann and David M. Modest
1. Al l -Trades
.”. ^nl 1 ‘ “ Y , Y Y I 3 . X m h a l r E v e n t s 2 . ~ 1 1 xulclple p r i c e C h a n g e Events
4 . salt E v e n t s
1 6 3 . 0 0 0 .
1 2 0 , 0 0 3
8 0 , 0 0 0
40,OC
%..- Size Decile
Fig. 9.5 Average volume in yen in the half hour prior to multiple price change events
els to see if trading halts are more likely in markets with greater prior order flow and order flow volatility.
Figures 9.5-9.7 describe the average state of the market prior to multiple price change events. Figure 9.5 presents average yen volume in the thirty prior minutes, figure 9.6 shows mean absolute yen order imbalance in the thirty prior minutes, and figure 9.7 shows the average size of the prior ten trades. Each figure sorts these variables into ten size decile~.~O The first row of each picture gives the mean value of these variables for all trades in our twenty-six month sample. The second, third, and fourth rows give the means for all multiple price change events, events that ended without a trading halt, and those that resulted in a trading halt, respectively.
Not surprisingly, traders submitting market orders that initiate multiple price change events do so when the market for liquidity in a stock is volatile or, put differently, when there is considerable uncertainty about the “equilibrium”
50. We divided stocks into size deciles only once, at the close of the last day of trade prior to our twenty-six-month sample. We did not do so periodically both because it would have been sometimes difficult (because timely data on the number of shares outstanding was in another data set) and because we thought that extensive sensitivity checking of the re-sorting procedure would have been exceedingly time consuming. We thought that our approach would sort stocks into reasonably homogeneous groups. We also produced figures that sorted on both size and price. The magnitudes differed (i.e., there were larger trades and volumes in high-priced stocks), but the shape of the pattern across size deciles was quite similar in these and the other figures, so we reported these simpler pictures to conserve space.

295 Market Structure and Liquidity on the Tokyo Stock Exchange
x Y1000 E v e n t Type: 1. A 1 1 T ~ d d e S 2 . All rultiple P ~ i c e Change E ~ e a t 5 3 . t i o n h a l t E v e n t s 4 . Ralt i Y e n t S
100,000
Fig. 9.6 Average absolute order imbalance in yen in the half hour prior to multiple price change events
price. Total volume and order imbalance in the half hour prior to these events are much larger than the corresponding unconditional means, especially in the medium and smaller size deciles. Figure 9.7 suggests that this is an increase in the number of trades, since traders tend to submit only slightly larger orders at these times.
In addition, larger volume, order imbalances, and trade sizes typically pre- cede events that end in trading halts. This effect is largest in the midrange of the size deciles. However, this contrast is not nearly as sharp as that between multiple price change events and regular trades.
We sharpened the focus on this contrast by fitting a binary logit model to predict whether a multiple price change event ends in a trading halt. We report results for a logit model below but also fitted normit and gompit models (i.e., those assuming cumulative normal and Gompertz distributions for the re- sponse probabilities, respectively). Fortunately, we found that the standardized coefficient estimates for each model were very ~imilar .~ ' We estimated these models only for events that took place more than thirty minutes after the i t a y o ~ e . ~ ~
5 I , For example, the ratios of probit to logit coefficients were very close to the usual empirical value of 1.6. We had planned to employ nonparametric estimators of the response probabilities had the logit models failed this robustness check.
52. We also fit logit and duration models to the subsample of events following delayed opens or in the first half hour after the morning or afternoon open. We do not include them because the

296 Bruce N. Lehmann and David M. Modest
Even: T p e : 1. A l l Trades 2 . ~ l l Multiple Price Change Events
1 3 N m h a l t E v e n t 3 x Y l O O O
Sire Decile
Fig. 9.7 change events
Average trade size in yen in the half hour prior to multiple price
We used the same sets of variables as indicators of the state of the market before the event in all cases.53 We employed the total yen volume of trade in each of eight time intervals: each of the first five minutes before the event and minutes six through ten, eleven through twenty, and twenty through thirty prior to the We also utilized measures of order imbalance over these same eight time intervals. The particular form these variables took was the logarithm of the absolute value of the ratio of signed volume to total volume over the relevant interval. Finally, we added eight size/price dummies.55
paper is already too long. Briefly, the logit models for this subset of trading halt versus nonhalt events have coefficients of the same sign and similar magnitude, save for some of the order imbal- ance coefficients. The logit models for chui kehai versus tokubetsu kehai trading halts generally failed to converge.
53. This list of variables is the one with which we started. We did some search to see if the data overwhelmingly supported more parsimonious models but abandoned the search for fear of data mining.
54. Volume for some time intervals was occasionally zero, particularly for one-minute intervals. If a variable was zero, we set its logarithm to zero (recall that volume is on the order of millions of yen per trade). We also ran most models in levels instead of logs and got very similar results. We reported the log models because of their relative scale independence.
55. We divided stocks into three price categories: under Yl,OOO, Y1,OOO to Y2,000, and over Y2,OOO. We divided stocks into three size groups: deciles one through three, four through seven, and eight through ten. We obtained nine size/price dummies as the product of these three price
297 Market Structure and Liquidity on the Tokyo Stock Exchange
Table 9.4 reports on the model for trading halts versus non-trading halts where an “event” is the occurrence of a trading halt. It provides the logit model coefficient estimates, their large sample standard errors, and the marginal sig- nificance level of the Wald x2 statistic (i.e., the square of the ratio of the coeffi- cient estimate to the large sample standard error). We also report scaled ver- sions of the coefficients to provide clearer indicators of the marginal effects of these variables. These marginal effects are given by the coefficients times the ratio of the average value of the logistic density to the standard deviation of the corresponding explanatory variable.56 We also report several measures of model fit: the rank correlation of the model predictions and outcomes, the raw scores for these variables, and a likelihood ratio test for the exclusion of the volume and imbalance variables from the
Trading halts generated by large market orders appear to be more common in two circumstances. First, halts occur more frequently if the large order was preceded by a period of relatively large order flow and low order flow volatility. The marginal order flow effects are consistent with the average effects re- corded in figures 9.5 through 9.7, but the marginal order imbalance effects differ from the unconditional means displayed in the figures. Second, halts are more common if order imbalances were a large fraction of volume on relatively low volume in the last five minutes before the submission of the large order.
The conditional and unconditional observations generally accord well with a simple intuition: traders have reason to fear the information content of large trades, particularly if they are primarily on one side of the market and represent a large fraction of recent volume. The behavior of traders submitting orders that cause trading halts is more difficult to characterize because we do not know from the trading record what fraction of the original order remained after the nonhalt portion of the trade was completed. We return to this issue below.
Finally, table 9.5 reveals that it is hard to predict whether a warning quote trading halt will be converted into a special quote trading halt by the arrival of an order on the same side of the market. In part, the estimates, particularly on prior volume, are more imprecise as reflected by the large standard errors: there are fewer events in the trading halt subsample, and special quote trading
and size dummies. We then omitted the dummy for the largest firms selling for below 81,000 SO
that the remaining eight sizdprice dummies were not collinear with the intercept. We estimated some models over finer size/price partitions and obtained qualitatively similar results.
56. The marginal effect of independent variable i on the probability of a positive outcome in event j in the logit model is A(x,’p)( 1 - A(x,’p)) p, where A(.) is the cumulative logistic distribu- tion function exp{ .}/( 1 + expc}), x, is the vector of observed independent variables prior to event j , p is the corresponding coefficient vector, and p, is its iIh element. For the logistic distribution, hG,’P)( 1 ~ A(x,’P)) is the density evaluated for eventj. We standardized by its average value.
57. An additional perspective on the fit of the model arises from consideration of how well the model with just an intercept and sizdprice dummies predicts trading halts. In the comparison of predicted probability and observed response, 43.5 percent of the pairs were concordant, 28.8 per- cent were discordant, and 27.7 percent were tied.

Table 9.4 Logit Analysis for Halt versus Nonhalt Events
A. Slope Coefficients
Logarithm of Absolute Scaled Order Logarithm of Y Volume Imbalance
Standard Error Coefficieot Standard Error Coefficient Variable for Minute(s) (scaled coefficient) (x’ probability) (scaled coefficient) (x’ probability)
1
2
3
4
5
6-10
11-20
2 1-30
-0.0069 (-0.0294) -0.0050
(-0.0208) -0.0037
(-0.01 52) -0.0022
(-0.0090) -0.0001
(-0.0004) 0.0014
(0.0056) 0.0055 (0.0 197) 0.0059
(0.021 7)
o.oO05 (<O.OOO 1)
0.0005 (<0.0001)
0.0005 (<O.Ooo 1)
0.0005 (<0.0001)
0.0005 (0.8484) 0.0006
(0.0126) 0.0006
(<0.0001) 0.0006
(<0.0001)
0.0288 (0.01 14) 0.0383
(0.0130) 0.0293
(0.0098) 0.0231
(0.0077) 0.0224
(0.0074) -0.0217
(-0.0120) -0.0118
(-0.0072) -0.0 105
(-0.0063)
0.0043 (<0.0001)
0.0049 (<0.0001)
0.0050 (<O.OOoI)
0.0052 (<0.0001)
0.00.52 (<0.0001)
0.0032 (<O.OooI)
0.0030 (<0.0001)
0.0030 (<0.0001)
B. Intercept and SizePrice Dummy Variable
Sizeffrice Probability of Category Coefficient Scaled Coefficient Standard Error Wald x 2
Intercept 1.408 0.0102 <0.0001 Size llprice 2 0.764 0.0577 0.0287 <0.0001 Size llprice 3 0.737 0.0166 0.0903 <O.o001 Size 2iprice 1 0.092 0.02.51 0.0089 <0.0001 Size 21price 2 0.890 0.1026 0.0204 <0.0001 Size 21price 3 0.395 0.03 15 0.0242 <0.0001 Size 3/price 1 0.378 0.0847 0.0106 <0.0001 Size 31price 2 1.258 0.1612 0.0212 <0.0001 Size 3lprice 3 0.642 0.0882 0.0162 <0.0001
C. Other Statistics
Observations ProbabilityResponse Correlation”
Total Halt Nonhalt Concordant Discordant Tied
737.5 17 116,425 62 1,092 58.0% 40.3% 1.7%
Rank correlation 0.589 LRT for model 1,459 - ~ ~ ( 2 5 ) ; p < 0.0001
”Correlation between predicted probabilities from the model and observed responses in the data

Table 9.5 Logit Analysis for Warning versus Special Quote Trading Halts
A. Slope Coefficients
Logarithm of Absolute Scaled Order Logarithm of Y Volume Imbalance
Variable for Coefficient Standard Error Coefficient Standard Error Minute(s) (scaled coefficient) (x’ probability) (scaled coefficient) (x’ probability)
1
2
3
4
5
6-10
11-20
21-30
-0.0036 (-0.0153) -0.01 60
(-0.0666) -0.0051
(-0.02 12) -0.0095
(-0.0393) -0.0027
( -0.0109) 0.0077
(0.03 10) 0.0000
(0.OOOl) 0.0197
(0.0733)
0.0034 (0.2874) 0.0035
0.0036 (0.1535) 0.0036
(0.0084) 0.0037
(0.4664) 0.0037 (0.0402) 0.0040
(0.9946) 0.0036
(<0.0001)
(<O.OOOl)
-0.0154 (-0.0065) -0.0099
(-0.0037) -0.0737
(-0.0270) -0.1166
( -0.04 15) -0.1411
(-0.05OO) -0.0820
(-0.0468) -0.0736
(-0.0455) -0.0701
(-0.0430)
0.0313 (0.6222) 0.0321
(0.7582) 0.0412 (0.0734) 0.0469
(0.0130) 0.05 15 (0.0062) 0.0268
(0.0022) 0.0240
(0.0022) 0.0245 (0.0043)
B. Intercept and SizePrice Dummy Variable
SizePrice Probability of Category Coefficient Scaled Coefficient Standard Error Wald x 2
Intercept Size Uprice 2 Size Uprice 3 Size 2/price 1 Size 2/price 2 Size 2/price 3 Size 3/price 1 Size 3/price 2 Size 3/price 3
3.6016 0.2420 1.2395 0.2916 0.1611 0.2750 0.5930 0.2330 0.5403
0
0.0148 0.0237 0.0804 0.0142 0.0206 0.1283 0.0195 0.0634
0.0627 0.1928 1.0048 0.0542 0.1330 0.1638 0.0734 0.1434 0.1219
<0.0001 0.2094 0.2174
<0.0001 0.2257 0.0932
<0.0001 0.1041
<0.0001
C. Other Statistics
Observations ProbabiIityResponse Correlations’
Total Special Ouote Warnine Ouote Concordant Discordant Tied
116.425 2.148 114.277 53.6% 36.7% 9.7% ~~
Rank correlation 0.585 LRT for model 127 - ~ ~ ( 2 5 ) ; p < O.OOo1
“Correlation between predicted probabilities from the model and observed responses in the data.

300 Bruce N. Lehmann and David M. Modest
halts (a “positive” occurrence in this model) are a very small fraction of trading halts. Nevertheless, several coefficients are significant at conventional levels and generally suggest somewhat counterintuitively that special quote trading halts are more common when prior volume and order imbalances in the last ten minutes were small. We return to this observation again
9.3.2 Trade and Quote Behavior during Multiple Price Change Events
We ask three questions of our data regarding trades and quotes during mul- tiple price change events. First, do traders submit different-size market orders when they generate warning and special quote trading halts than when they generate multiple price change events that result in no stoppage of trade? In addition, we measure how long warning and special quote trading halts last, both unconditionally and conditionally on the state of the market prior to the halt. Finally, we also ask whether trades of comparable size end warning quote and special quote trading halts. We answer these questions in turn.
Figure 9.8 compares the average size of all trades with the average volume of trade during nonhalt warning quote events and the nonhalt portion of warn- ing quote trading halts. As before, the data are sorted into size deciles. The first row gives the mean size of all trades in our twenty-six-month sample, and the second, third, and fourth rows display the average volume of trade concluded without a trading halt in all multiple price change events, all events that did not result in a trading halt, and those that did result in a trading halt, respec- tively. As expected, the volume of trade is large for both halt and nonhalt events as the market order walks up or down the limit order book.
Of substantial economic interest is the role played by the maximum price variation in the volume of trade completed in both halt and nonhalt events. The average size of trade completed prior to a trading halt is only slightly smaller than the mean for nonhalt events. This would appear to be a direct consequence of the structure of the TSE warning quote trading mechanism.
Two features of the trading mechanism make the equality of trade size in halt and nonhalt events a natural economic outcome. As we have emphasized, the maximum price variation sets a bound beyond which trade is halted. Sec- ond, an order large enough to generate a trading halt can be canceled at any time prior to conversion to a special quote. Hence, market orders large enough to cause a trading halt are identical ex ante to those that would not because of the possibility of order cancellation. Traders exposing limit orders inside the bounds set by the maximum price variation would naturally take this possibil- ity into account and, hence, would place orders equally attractive to those who would and those who would not place orders large enough to cause a trading
58. Once again, we consider the fit of a model with just an intercept and size/price dummies. In the comparison of predicted probability and observed response, 36.5 percent of the pairs were concordant, 26.3 percent were discordant, and 37.2 percent were tied.

301 Market Structure and Liquidity on the Tokyo Stock Exchange
Event T y p e : x Y l O O O 1. A l l TIddeS
30,000
2 5 , 0 0 0
20,000
15,000
10,000
2 . A l l Multiple P r i c e Change E v e n t s 3 . N m h d l t E v e n t s I . Halt iYe"t5
Fig. 9.8 Average volume in yen during multiple price change events prior to any trading halts
halt. Since liquidity inside the maximum price variation is identical ex ante, it should also be identical ex post.
How long do warning quote trading halts last? Unconditionally, figure 9.9 suggests the answer is, not very long. One-third of the warning quote trading halts last less than a minute, while almost half last between one and two mi- nutes, so that more than 80 percent of warning quote trading halts last less than two minutes. The brevity of these trading halts reflects success in attracting liquidity: 94 percent of the warning quote trading halts lasting less than two minutes ended with a trade.59
Figure 9.10 suggests that the special quote mechanism is subject to long and variable lags. Special quote trading halts last longer than warning quote trading halts-fewer than 5 percent last less than a minute and nearly a third last longer than fifteen minutes, an outcome one would expect, given the price discovery function of the special quote mechanism. This distinction also shows up below in the size of orders that end the two kinds of trading halts.
We are also interested in how long trading halts last as a function of the
59. When warning quotes are converted to special quotes by order arrival, the order generally arrives early in the warning quote trading halt-56.95 percent anive within the first minute and an additional 25.59 percent between the first and second minute of the initiation of a warning quote trading halt.

302 Bruce N. Lehmann and David M. Modest
Fig. 9.9 Average duration of warning quote trading halts
prior state of the market, and thus we fit duration models to our trading halt data. As with the logit models, we fit a number of parametric survival models under different distributional assumptions: exponential, Weibull, gamma, 10- gistic, and lognormal. Once again, the results were reasonably insensitive to the distributional specification. We report the results for the logistic model because this distribution is robust to large residuals, which arise in this applica- tion because of long thin tails in the distribution of warning and special quote trading halt durations.60
We chose the same indicators of the prior state of market liquidity as in the logit analysis-total yen volume and yen order imbalance over the same eight time intervals. For the case of special quote trading halts, we added one other predetermined variable: the duration of the prior warning quote trading halt. We reasoned that there would typically be much uncertainty as to whether the order generating the special quote represented transient liquidity demand or a transition to a new equilibrium price after a long warning quote trading halt.
60. Some distributions fit poorly because they could not track the asymmetry of the empirical survival distribution. The logistic model fit both this asymmetry and the long right tail reasonably well, so we chose not to fit nonparametric models.

303 Market Structure and Liquidity on the Tokyo Stock Exchange
2oooo
Fig. 9.10 Average duration of special quote trading halts
In the duration analysis of warning quotes, we treated three events as censor- ing normal “failures” (i.e., trades hitting the warning quote): conversion from a warning quote to a special quote, cancellation of the pending order, and the end of the trading session. Technically, it would be more appropriate to use a competing risks formulation of survival analysis to account for these distinct possible outcomes. However, the proportion of warning quote trading halts ending in a trade is so large (93.59 percent) that it seemed sensible to pool the three censoring variables into one composite indicator.61 We had no such prob- lem with special quote trading halts: 87.52 percent end in a normal “failure” (i.e., tradzs hitting the special quote), and the trading session ended almost all of the remaining halts (12.24 percent).62
Table 9.6 reports on the duration of warning quote trading halts as a function of prior volume and order imbalances. Warning quote trading halts last longer
61. Pending-order cancellations total 3.15 percent, conversion of the warning quote to a special quote accounts for 2.03 percent, and the end of the session represents 1.23 percent of warning quote trading halt conclusions.
62. AS we noted earlier, order cancellation concluded fewer than 0.25 percent of the special quote trading halts in our sample.

Table 9.6 Logistic Duration Analysis for Warning Quote Trading Halts
A. Slope Coefficients
Logarithm of Absolute Scaled Order Logarithm of Y Volume Imbalance
Variable for Standard Error Standard Error Minute(s) Coefficient (x2 probability) Coefficient ( x 2 probability)
1 -0.0113
2 -0.0095
3 -0.0079
4 -0.0077
5 -0.0070
6-1 0 -0.0099
11-20 -0.0108
2 1-30 -0.0100
0.0005 (<0.0001)
0.0005 (<0.000 1)
0.0005 (<O.OOo 1 )
0.0005 (<O.OOol)
0.0005 (<0.000 1)
0.0006 (<0.0001)
0.0006 (<0.0001)
0.0006 (<0.0001)
0.0 128
0.0113
0.0146
0.0091
0.0096
0.0118
0.0157
0.0141
0.0042 (0.0023) 0.0047
(0.01 64) 0.0048
(0.0024) 0.0049 (0.0650) 0.0049 (0.0530) 0.0032
(0.0002) 0.0030
(<0.0001) 0.0030
(<O.OOO 1)
B. Intercept and SizePrice Dummy Variable
SizePrice Category Coefficient Standard Error Probability of Wald x’
Intercept Size Uprice 2 Size Uprice 3 Size 2/price 1 Size 2/price 2 Size 2/price 3 Size 3/price 1 Size 3/price 2 Size 3/price 3
1.7697 0.1770 0.003 1
-0.0842 0.0446 0.0419
-0.1384 -0.0894 -0.0745
0.0111 0.0323 0.0925 0.0090 0.0223 0.0259 0.0106 0.0225 0.0167
<0.0001 <0.0001
0.9735 <0.0001
0.0455 0.1064
<0.0001 <0.0001 <0.0001
C. Other Statistics
Observations Scale Parameter
Total Regular Censored Coefficient Standard Error
116,424 108,856 7,568 0.67 15 0.0018
LRT for model 13,151 - ~ ~ ( 1 6 ) ; ~ < 0.0001

305 Market Structure and Liquidity on the Tokyo Stock Exchange
when prior order imbalances are a large fraction of volume and prior volume is low. This observation is intuitively sensible. Potential counterparties to a warning quote are inclined to be cautious since the submitter of the pending order is willing to risk exposure to the special quote mechanism. The fear of the information content of the pending order is likely to be greater when it is difficult to discern whether prior trades were information or liquidity moti- vated (i.e., small prior volume amid large relative order imbalances). That is, warning quote trading halts last longer when prior trades are less informative about the underlying “equilibrium” price.
Table 9.7 reports the corresponding results for the duration of special quote trading halts as a function of prior volume and order imbalances. As with the logit model for warning quote versus special quote trading halts, the coefficient estimates are more imprecise in large part because special quote trading halts are so uncommon. Nevertheless, like warning quote trading halts, special quote trading halts tend to last longer when prior volume is low and prior order im- balances are a large fraction of volume. An additional result is the expected one that special quote trading halts tend to last longer following long prior warning quote trading halts. We hesitate to interpret these results further in the absence of a model for the response of traders to the quote-revision process built into the tokubetsu kehai mechanism.h3
Sharper insights arise from the examination of the size of orders that end warning and special quote trading halts, displayed in figure 9.11. Orders that hit warning quotes are somewhat larger than regular trades but are dwarfed by the trades that hit special quotes. It is hard to provide a precise interpretation of this finding because we do not know the size of the orders pending at the end of trading halts; we only know that the volume of pending orders was at least as large as the trade quantity, but we do not know how much larger it might have been.
A trader who submits an order that generates a trading halt and leaves it pending risks losing control of order execution. If an order arrives on the same side of the market, that trader will almost certainly be unable to cancel the pending order. Other traders determine whether the pending order will be exe- cuted at the warning quote or whether the warning quote will be converted into a special quote, permitting continued price discovery. A trader who leaves an order pending at the warning quote presumably takes into account both this possibility and the possibility that some part of the order will be executed at the warning quote.
Accordingly, the small size of trades hitting warning quotes makes some economic sense. Warning quote trading halts stop the price discovery process, and thus traders hitting warning quotes should choose a trade size reflecting
63. By contrast, the model of Easley and O’Hara (1992) suggests that traders ought to be more confident that pending orders are not motivated by private information when they are pending for a long time. This loose reading of their model suggests that this coefficient ought to be negative.

Table 9.7 Logistic Duration Analysis for Special Quote Trading Halts
A. Slope Coefficients
Logarithm of Absolute Scaled Logarithm ofY Volume Order Imbalance
Variable for Standard Error Standard Error Minute( s) Coefficient (X I probability) Coefficient ( x 2 probability)
1
2
3
4
5
6-10
11-20
2 1-30
-0.0569
-0.0077
-0.0743
-0.0442
-0.0724
-0.0794
-0.0688
-0.0291
0.0405 (0.1549) 0.0403
(0.8435) 0.0414
(0.0724) 0.0419
(0.2915) 0.0426
(0.0893) 0.0449
(0.0772) 0.0502
(0.1697) 0.0446
(0.5 142)
-0.0348
0.6814
0.1140
-0.0620
-0.0099
0.1883
0.3929
0.2223
0.3962 (0.9307) 0.3467
(0.0494) 0.4852
(0.8142) 0.5357
(0.9089) 0.60 10
(0.9869) 0.2690
(0.4898) 0.2485
(0.1233) 0.2500
(0.3737)
B. Intercept and SizePrice Dummy Variable
SizePrice Category Coefficient Standard Error Probability of Wald x2
Intercept Size I/price 2 Size I/price 3 Size Z/price I Size 2/price 2 Size 2/price 3 Size 3/price 1 Size 3/price 2 Size 3/price 3
16.8071 0.9096 -0.8036 2.4719 - 12.7857 10.1927 - 1.3438 0.6823 -3.4204 1.6065 -2.6898 1.9561 -2.7005 0.8952
1.9280 1.8532 - I .7964 1.5017
C. Other Statistics
<0.0001 0.745 1 0.2097 0.0489 0.0332 0.1691 0.0021 0.2982 0.2448
Observations Warning Quote Trading Halt Duration
Total Regular Censored Coefficient Standard Error Probability
2,147 1,823 324 0.2457 0.0799 0.0022
LRT for model 1 15 - x2( 16); p < 0.000 1 Scale parameter 7.1639 Standard error 0.1435

307 Market Structure and Liquidity on the Tokyo Stock Exchange
x Y l O O O
50.000
40.000
30,000
20,000
Event T y p e : 1 A l l Trades 2 . ~ 1 1 Multiple Price Change Events 3 . Nonhalt E v e n t 5 4 . H a l t Events
Fig. 9.11 Average size of trades in yen that end warning and special quote trading halts
their valuation of the stock, given the pending-order submitter’s willingness to risk conversion to a special quote. This order size would tend to be decreasing in the size of the pending order. If the large size of orders ending special quotes is a reliable guide to the size of pending orders at warning quotes (an eventual- ity that we can only verify by studying the limit order book), traders hitting warning quotes would tend to submit small orders.
On this view, the large trades ending special quotes reflect the marginal deci- sions of traders who risk the price discovery process inherent in the special quote mechanism. Such traders lose control over the order and, in particular, the prices at which their orders will be executed. Moreover, traders initiating special quotes by joining pending orders choose to lose control over execution price. Hence, such traders are likely to be uninformed, and the confidence of potential counterparties is increasing in the size of the pending order. An unin- formed trader submitting a large order in this fashion will tend to pay a smaller adverse selection cost as a consequence. Put differently, this evidence is con- sistent with the pending orders during special quotes being somewhat like sun- shine trades.
9.3.3 The State of the Market after Multiple Price Change Events
Figures 9.12-9.14 describe the average state of the market following mul- tiple price change events. Figure 9.12 presents average yen volume in the sub- sequent thirty minutes, figure 9.13 shows mean absolute yen order imbalance
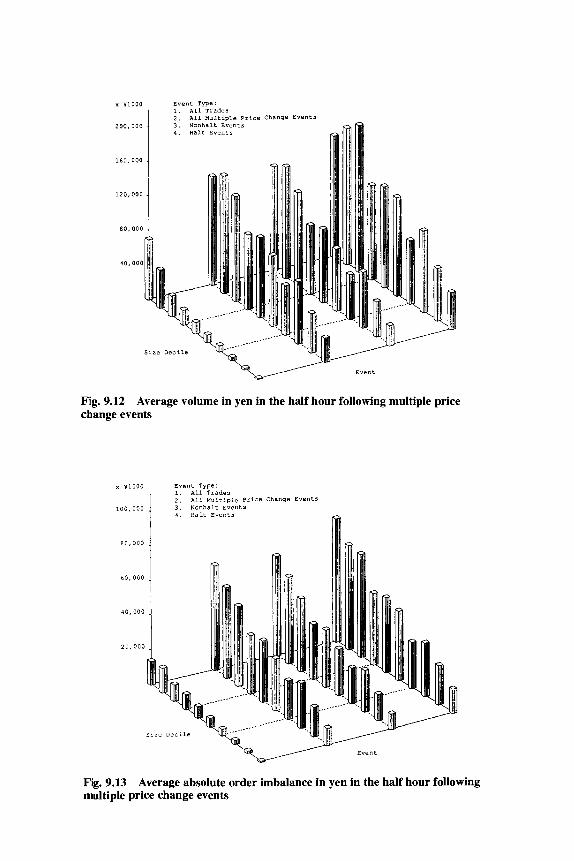
x YlOOO
200,000
160,000
120,000
80.000
40.00
Event Type: 1. A 1 1 Trade3 2 . ~ 1 1 Multiple ?=ice Change Events 3. Nonhalt Events 4. Halt Events
0
Size Decile
/
Fig. 9.12 Average volume in yen in the half hour following multiple price change events
x Y 1 0 0 0
1 0 0 , 0 0 0
8 0 . 0 0 0
60,000
40,000
20,OOC
Event Type: 1. All-Trades 2 . 3 . Nonhalt Events 4. Halt Events
~ l l Multiple ?rice Change Event3
Fig. 9.13 multiple price change events
Average absolute order imbalance in yen in the half hour following

309 Market Structure and Liquidity on the Tokyo Stock Exchange
x YlOOO E v e n t Type: 1. All Trades 2. ~ l l u u l t i p l e price Change w e n t 3
4 . n a i t Event3 12,000 1 3. N o n h a l t Events
I 10.000
Yj I S i z e Decile
6,000 il 4,000
2,000
Fig. 9.14 Average yen trade size in yen in the half hour following multiple price change events
for the same period, and figure 9.14 shows the average size of the subsequent ten trades. As before, each figure sorts these variables into ten size deciles. The first row of each picture gives the mean value of these variables for all trades in our twenty-six-month sample. The second, third, and fourth rows give the means for all multiple price change events, all events that ended with no stop- page of trade, and those that did result in a trading halt, respectively.
These figures look remarkably similar to the corresponding pictures describ- ing the prior state of the market (i.e., figures 9.5-9.7). Multiple price change events take place during periods of volatility in the market for liquidity in a stock. As before, total volume and order imbalance in the thirty minutes fol- lowing these events are substantially larger than the corresponding uncondi- tional means, especially in the medium and smaller size deciles. Figure 9.12 suggests that this is an increase in the number of trades, since traders tend to submit only slightly larger orders at these times. These effects are somewhat larger for events that resulted in trading halts, but the magnitude of this effect is small.
9.4 Conclusion
We have established several facts in these pages. Investors seldom trip the trading halt mechanisms of the TSE, and, when they do, they usually execute all or part of their pending order at the warning quote, a price they know in

310 Bruce N. Lehmann and David M. Modest
advance. Traders are more likely to trigger indicative quote dissemination and temporary trading halts when the market for liquidity is relatively volatile, par- ticularly around the morning open and after delayed opens. The volume of trading during nonhalt events is very similar to that during events that result in trading halts, a result that accords with similar economic intuition. Similarly, the trades that end warning quote trading halts are generally much smaller than those that end special quote trading halts, a result that is also intuitively plau- sible. What is perhaps surprising is not that these results accord with intuition, but rather that they conform to it so well.
Unfortunately, we can say little from a policy perspective. Order-placement strategies and the demand and supply of liquidity are surely endogenous to the trading mechanism. We simply cannot tell if these mechanisms perform as they do because they fulfill their intended roles or because investors have learned to put up with their idiosyncrasies. We can draw one firm conclusion-the TSE is a large market whose mechanisms rarely result in the interruption of trade.
References
Amihud, Yakov, and Haim Mendelson. 1989. Market Microstructure and Price Discov-
Angel, James J. 1993. Factors Affecting the Decision between Limit and Market Orders
Black, Fischer. 1993. Equilibrium Exchanges. Manuscript, Goldman, Sachs, and Co. Easley, David, and Maureen O’Hara. 1992. Time and the Process of Security Price
Adjustment. Journal of Finance 47577-605. Glosten, Lawrence R. 1994. Is the Electronic Open Limit Order Book Inevitable? Jour-
nal ofFinance 49:1127-61. Hamao, Yasushi, and Joel Hasbrouck. 1993. Securities Trading in the Absence of Deal-
ers: Trades and Quotes on the Tokyo Stock Exchange. Manuscript, Graduate School of Business, Columbia University.
Hasbrouck, Joel, George Sofianos, and Deborah Sosebee. 1993. New York Stock Ex- change Systems and Trading Procedures. New York Stock Exchange Working Paper
Lehmann, Bruce N., and David M. Modest. 1994. Trading and Liquidity on the Tokyo
Lindsey, Richard R., and Ulrike Schaede. 1992. Specialist vs. Saitori: Market Making
Securities and Exchange Commission. 1992. U.S. Equity Market Structure Study. Secu-
Tokyo Stock Exchange. 1989. The “Saitori” System of the Tokyo Stock Exchange.
ery of the Tokyo Stock Exchange. Japan and the World Economy 1:341-70.
on the Tokyo Stock Exchange. Georgetown University.
93-0 1.
Stock Exchange: A Bird’s-Eye View. Journal of Finance 49:951-84.
in New York and Tokyo. Financial Analysts Journal 48:48-57.
rities and Exchange Commission, 1524 SEC Docket, vol. 51, no. 18.
Manuscript.

311 Market Structure and Liquidity on the Tokyo Stock Exchange
COmment Kazuhisa Okamoto
The TSE implicitly assumes that numerous incoming orders in small lots are all scattered on the limit order book. This assumption is probably related to the fact that this mechanism was established in 1949, when about 70 percent of outstanding shares were owned by individual investors and only 10 percent and 5 percent were owned by financial institutions and corporations, respec- tively.
Current shareholder distribution looks very different; namely, individuals own only 24 percent, financial institutions own 41 percent, and corporations own 24 percent of outstanding shares. The 46 percent reduction in the share of individuals was absorbed by a combined increase in the share of financial institutions and corporations. In other words, mutual cross-holding of stocks among corporations and financial institutions has taken over holdings of indi- viduals over the last forty-four years.
During this period, buying and selling by investors have been orchestrated by large securities companies. Individuals bought and sold based on brokers’ recommendations. Investment trusts were generally owned by securities firms. With respect to cross-holdings, buyers and sellers agreed on the transaction in advance, and securities firms belonging to the same zaibatsu group crossed the transaction on the exchange. In the second half of the 1980s, there was a “bubble market” in which corporations and financial institutions traded stocks for realized profits with a very short-term investment horizon. Once again, large securities firms led the market, picking low-priced, large-capitalization issues for dealing purposes.
Until very recently, brokerage companies were the conductor of the market orchestra. Now that the bubble has burst, the market leaders are changing from cross-holdings and zaitech speculations to pension funds. The size of Japanese pension funds, which is already $1.6 trillion, is likely to double in the next ten years. Until only four years ago, the industry had been monopolized by commingled funds of life insurance companies and trust banks, and the assets were often used for cross-holding of friendly corporations. Investment advi- sory companies have been deregulated to manage pension funds only since 1990, but their proportion to the total is still a mere 2 percent. I think this is likely to change.
As market leaders change, characteristics of the need for liquidity in the market are likely to change. Previously, cross-holders looked for a total of investment returns and business returns, with more emphasis on the latter. Indi- viduals tend to look at individual stocks and not at a portfolio. Zaitech specula- tors aimed at realizing gains in a year to boost operating earnings. Pension funds, of course, are different. They assume a longer investment horizon, con-
Kazuhisa Okamoto is managing director in charge of Japan/Asia operations of Wells Fargo Nikko Investment Advisors.

312 Bruce N. Lehmann and David M. Modest
sider risks and returns, and seek diversification. They regard “investment value” to be the most important criteria for stock selection. With these changes evolving now, the question is, Is the current market mechanism good enough to support new liquidity needs?
I would like to point out a couple of barriers that institutional investors like ourselves are facing day to day. First of all, in Japan, all trades have to occur on the floor-there are no OTC crossings, no crossing networks, no upstairs, no internal crossings, and so forth. All trades are basically monopolized by the exchange. Second, important trade information is available only to stock exchange members and not to investors. Limit order book situation is available only at the headquarters of member brokers. Even while using the same Quick price-quotation systems, terminals at brokerage offices have ask and bid quotes but not the terminal at investors’ offices. Exchange members are monopolizing important trade information.
It is very difficult to get a membership on the stock exchange in Japan. Only securities companies, not individuals, are qualified to be a member, and corpo- rations must have a license from the Ministry of Finance to be a broker. The fact that the seat is so expensive is a good indication that there are some excess profits to be gained on the floor. Brokers often use monopolized information of the market to solicit orders from institutional investors. Whoever provides the most such information the fastest will get the deal. It can be considered as a tool to support fixed commissions.
These social costs reduce investment returns. Until recently, cross-holders, a dominant power in the market, did not consider investment return to be the most important criteria. Now, as pension funds gain importance in the market, investment return becomes significant. I think it is natural to assume that a mechanism closer to that of the United States will be developed as demand mounts. How fast may be a question, since the existing powers, who have been benefiting from the old regime, will try to slow the process as much as possible. However, it is impossible to stop or reverse the trend for rationality. Sooner or later, a “soft bang” is due. Furthermore, having such a rational trading mecha- nism, which functions better in the institutionalized market, is a prerequisite for a truly strong recovery of the Japanese stock market.
Authors’ Reply
As we noted at several points in the paper, we measured the performance of the warning and special quote mechanisms of the Tokyo Stock Exchange, tak- ing the order-placement strategies of investors as given. We realized that we could not measure the interaction between the trading mechanism and struc- tural characteristics of both the demand for liquidity in the form of market

313 Market Structure and Liquidity on the Tokyo Stock Exchange
orders and the supply of liquidity in the form of limit orders without consider- ably more information than that contained in the trade and quote record. We remained content to report reduced-form regularities.
As is commonplace, Kazuhisa Okamoto, along with Pete Kyle in his oral remarks at the conference, wished we had written a different paper. Okamoto asked, “What changes in the restrictions on investor access both to the trading mechanism and to information like the limit order book are appropriate in the new market for liquidity in common stocks on the TSE arising from the growth of institutional investors like pension funds?’ Kyle asked, “What interests are served by the existing market structure?”
Both discussants arrived at related conclusions-the existing market struc- ture serves the brokerage industry well by maintaining a profitable cartel, but future changes in the structure of the TSE are likely to parallel those that oc- curred in the United States during the last two decades, resulting in spatial fragmentation of the Japanese equity market. Both discussants thought that such changes were desirable, as they would reduce both the price of immediacy and the cost of equity capital.
We thought we would take this opportunity to speculate about these issues, to write, as it were, part of the introduction to the paper we did not prepare for this conference. In so doing, we find it useful to make distinctions that are somewhat different from those drawn by the discussants. In particular, we ask three related questions: how would the market for liquidity on the TSE change
1. if brokerage commissions were deregulated (as was done in the “May day” reform in the United States in 1975), leaving the remainder of the TSE structure intact?
2. if, in addition, investors were given direct access to the limit order books of the TSE both by becoming exchange members and through an analog of the DOT and SuperDOT systems of the NYSE (again leaving the remainder of the TSE structure intact)? and
3. if, in addition, the Ministry of Finance permitted widespread spatial frag- mentation to arise in the form of separate markets for large and small orders (like the upstairs market on the NYSE), of third-market-style competition by the regional exchanges with the TSE, and of the establishment of fourth-market venues like crossing networks?
We address each of these questions in turn. The answer to the first question seems surprisingly simple: from the per-
spective of institutional investors like pension funds, the answer is, not much. The commission structure already makes large orders substantially less expen- sive than small orders, and brokers already engage in widespread nonprice competition by aggressively “working” large orders. Brokers engage in propri- etary trading in ways that give t‘le orders of large customers favorable exposure in TSE limit order books. Small investors would be the primary beneficiaries
314 Bruce N. Lehmann and David M. Modest
of commission deregulation by itself. It is likely that institutional investor costs would fall substantially only if the other large explicit trading cost, the stamp tax on transactions, were reduced for nonbroker trades.'
The second question is considerably more complicated. In this hypothetical environment, the TSE would become a set of consolidated public limit order books. Market participants who incurred the costs of direct participation could then compete in the production of low-cost liquidity, since there would be open and equal access to market making.2 This market structure would resemble the open electronic limit order books studied in Glosten (1994) and might well have the twin virtues they possessed in his model-they represent the lowest- cost market structures that remain viable in the face of differentially in- formed traders.
Nevertheless, there is reason to think that large investors like pension funds would not reap substantial benefits from a thoroughgoing change along these lines.3 In such an environment, large passively managed pools like index funds and the passive portion of pension funds typically reduce the price of immedi- acy through securities lending and patient trading. However, the current system has a substitute for these low-cost suppliers of liquidity: proprietary trading by member firms on the TSE. Proprietary traders at the head offices of member firms have approximately open and equal access to the information in the limit order book. The price paid to finance proprietary trading by member firms is roughly equal to the rep0 rate, the marginal price that would be charged in securities lending. We certainly cannot tell if member firms supply the same quantity of liquidity services at these prices as would be supplied by potential market participants in a future consolidated public limit order book environ- ment, but this observation is surely suggestive.
In fact, proprietary trading by member firms accounts for 25 percent of trad- ing on the TSE, suggesting the supply of liquidity services to large customers might well be substantial to the extent that member firms do not simply front- run their customers. Member firms appear to do the opposite on the TSE- traders place orders that clear out existing orders ahead of their customer's order in the limit order book in order to make the customer order the best bid or offer. If the supply of Proprietary trading for these purposes is sufficiently elastic at the present time, institutional customers would probably see only modest changes in trading costs following such a reform. Put differently, it is far from obvious that brokers in the current market system break up orders and
I . Currently, securities companies pay a transaction tax of 0.12 percent while all other traders pay 0.30 percent.
2. Different investors would still confront different costs, if only in the differcntial stamp-tax levy referred to above.
3. Institutional investors would probably place some different trades in the new environment because they would then have direct access to the same trade information as brokers currently receive. In the present environment, investors can get information like the current best bid and offer or the contents of the limit order book only from brokers.

315 Market Structure and Liquidity on the Tokyo Stock Exchange
work trades any differently from the ways in which the customers would choose to do so if they had direct access to the limit order books on the TSE.4
At this time, the only clear answer to the third question is that it is hard to tell. That is, the jury is still out on the costs and benefits of spatial fragmenta- tion in American and European secondary markets. Widespread spatial frag- mentation reduces costs for some traders and increases costs for others in both direct and indirect waysJ For example, index funds like those run by Okamoto at Wells Fargo Nikko Investment Advisors would probably experience a sub- stantial reduction in trading costs as they would exploit opportunities to trade both in different venues and differently in existing trading venues as identifi- able informationless traders. Small traders would probably benefit as well for similar reasons.
By contrast, informed traders might well experience increased price impact costs to the extent that some uninformed traders can credibly identify them- selves and trade in separate markets. The associated reduction in the incentive to acquire and trade on private information might well diminish the equilib- rium efficiency of the price discovery process. Strategies to reduce the price impact of large block trades, such as the delay of last-sale reporting on SEAQ International, also lessen the short-run efficiency of the price discovery pro- cess. That is, consolidation of orders on one trading venue with widespread broadcasts of trading opportunities and ex post transparency in the form of immediate last-sale reporting clearly has some benefits, too.
Since we cannot predict the consequences of possible spatial fragmentation in Japanese markets, we consider the implications of the first two scenarios outlined above for the conclusions we drew in the paper. That is, suppose that the Ministry of Finance allowed both the initiation of the free commission era and widespread public access to the limit order books of the TSE. How would the chui and tokubetsu kehai mechanisms perform under this new market structure?
It is likely that all of our main conclusions would survive such substantial reforms. Brokers already aggressively work institutional orders in the existing environment, and institutional investors would probably find it optimal to fol- low similar order-placement strategies after the reforms. Accordingly, it is likely that the warning and special quote mechanisms would be tripped infre- quently by traders in the new environment and, when tripped, that the mecha- nisms would usually result in temporary trading haltsS6 In the new environ-
4. That is, existing member firms may already compete away most of the rents associated with restrictions on free entry into the market-making business. To be sure, the price of seats on the TSE is sufficiently high as to suggest that not all rents are competed away.
5. Another distinction between fragmented and consolidated markets is the elimination of time priority for limit orders across markets.
6. Similarly, the order-placement strategies followed by institutional investors in the new market environment would probably have most of the same characteristics as those documented in figures 9.5-9.14 and tables 9.2-9.7. Parenthetically, changing the tick size of stocks that sell for more
316 Bruce N. Lehmann and David M. Modest
ment, orders from the broader investor public would still bridge temporal fluctuations in the demand for liquidity services much as they do on the TSE at present. That is, these mechanisms would still serve their intended purpose of organizing liquidity in the presence of the temporal fragmentation of order flow.
Reference
Glosten, Lawrence R. 1994. Is the Electronic Open Limit Order Book Inevitable? Jour- nal of Finance 49:1127-61.
than V1,OOO to a smaller number than its current high level of 310 would probably eliminate many ofthe differences we observed in the behavior of stocks selling above and below theYl.000 barrier.