market strategy · huge liquidity along with bond buying program. as a first step indian government...
TRANSCRIPT

Market Strategy April 2020

Kotak Securities – Private Client Group Please see the Disclosure/Disclaimer on the last page For Private Circulation 2
Market Strategy May 2020
MARKET OUTLOOK FOR MAY 2020 The corona virus outbreak has quickly progressed to an economic shock as governments across the globe enact strict containment policies. Although the numbers of cases are slowing there is uncertainty over the lifting of lockdowns and path to normalcy. Global recession is a given with CY20 being a washout year followed by a smart recovery in CY21. As per latest IMF projections global GDP is likely to shrink by 3% in CY20 led by -5.9% de-growth in US and -7.5% in Euro Area. Based on current status of global lockdown economies may report very poor GDP numbers for June quarter. If the Covid-19 situation prolongs or there is a second wave of the pandemic then it will cause further slowdown.
Since the virus outbreak, major central banks have eased their monetary policies and governments have announced fiscal stimulus ranging from 0.3% to 20% of GDP. G-20 nations have pledged ~USD 8 trillion in fiscal support with central banks like Fed and ECB injecting huge liquidity along with bond buying program. As a first step Indian Government had announced USD 22 bn (Rs.1.7 trillion) stimulus package. As per a recent articles in Economic Times and Mint, NITI Aayog has proposed a massive fiscal stimulus of over Rs.10 trillion (i.e. 5% of GDP). Although India’s fiscal position is expected to deteriorate in the wake of tax shortfall and policy response to tackle impact of Covid-19 the government debt-to-GDP is manageable as compared to other major economies.
The Indian government has extended the current lockdown to May 3rd to control the spread of Covid-19 infection. Although activity would resume in many districts earmarked as green zone the continued rise of Covid-19 cases in industrial states like Maharashtra, Gujarat and few others would impact GDP growth. As per our latest projections we expect India’s FY21 GDP growth to be 0.4% (down from ~4.9% in FY20E). The YoY likely fall in GDP will be mainly due to de-growth in industrial activity (-3.6%) and within industrial activity it will be the sharp fall in manufacturing activity (-6.6%). In the short term consumption demand will likely hold up better in rural and semi-urban India than in urban India. Investment demand will weaken further given the inability and unwillingness of companies, governments and households to invest in capital intensive assets. Focus of companies and households would be to conserve cash while the government will face severe fiscal challenges. Demand for low-ticket discretionary items may revive faster than demand for large-ticket items.
We have cut our FY21-22E net profit estimates for the Nifty-50 Index stocks sharply in the past one month. We are now expecting FY20, FY21 & FY22 Nifty-50 earnings to grow by 5%, 5% & 27%, respectively. We see high downward risk to our FY21E with further downgrades in earnings of banks and oil & gas sectors but we see low risks to our FY22E net profits. As a base case for India, we expect the economy and corporate earnings to gradually recover from 2H-FY21 and broadly ‘normalize’ in FY22. After the recent run, Nifty-50 now trades at 19.6x FY20E, 18.7x FY21E and 14.7x FY22E. Near term valuations look stretched but on 2-3 year time horizon valuations look attractive. For long term investors valuations on other parameters like Market Cap/GDP and Price/Book Value looks attractive.
Keeping in mind that world is heading for a recession and markets could remain suppressed one should position their portfolios accordingly. The MSCI World Index now trades at 18.2x on a one year forward basis as compared to its 10 year peak of 17x. Valuations of MSCI World Index has gone up sharply from 13x in Mar’20 to above 18x mainly on account of the sharp downward revision in future earnings estimates. Valuation of MSCI World Index is now 20% above its 10 year average of 15x (on Fw basis). If we see another 5% cut in future estimates of Nifty-50 then it will trade closer to its peak forward valuations of above 19x. If investors have one year horizon then it is ideal to have a proper mix of cash and safer stocks in the portfolio. Long term investors with 2-3 year horizon should look to buy consistently on every decline.
Agarwal Amit, CFA
+91 22 6218 6439

Kotak Securities – Private Client Group Please see the Disclosure/Disclaimer on the last page For Private Circulation 3
Market Strategy May 2020
The intermittent falls in the market due to volatility and earnings downgrade could offer great opportunity to accumulate high quality large cap stocks.
In a slowdown it is ideal to stay put with mega/large cap stocks. The valuation gap between large caps and mid caps has narrowed which makes a case to be with large caps. Bigger companies have stronger balance sheets and economies of scale which helps them to sustain slowdown in a better way than mid and small cap companies. The impact on earnings could be higher for mid & small companies if the slow slowdown persists for longer time. We can expect activity in mid & small caps to pick up with a lag effect, may be in the second phase of next bull phase.
TOP INVESTMENT IDEAS Price Fair Mkt EPS
Rating (Rs) Value Upside cap. EPS (Rs) growth (%) P/E (X) P/B (X) RoE (%)
Company 30 Apr 20 (Rs) (%) (Rs bn) FY21E FY22E FY21E FY22E FY21E FY22E FY21E FY22E FY21E FY22E
Apollo Hospitals BUY 1,396 1,820 30.4 194 23.2 49.0 -1.9 111.8 60.3 28.5 5.3 4.8 8.9 17.4
Finolex Industries^ BUY 402 514 27.9 49 29.1 33.2 -3.1 14.0 13.8 12.1 1.6 1.5 12.6 13.1
ICICI Bank BUY 380 490 28.9 2,459 26.7 30.0 56.2 13.6 14.2 12.7 1.9 1.7 13.9 14.2
ITC BUY 181 255 40.9 2,240 11.3 12.5 -1.8 10.8 16.1 14.5 3.4 3.3 21.1 23.1
L&T BUY 897 1,270 41.6 1,259 62.5 79.0 -9.2 26.6 14.4 11.4 1.7 1.5 13.3 14.8
Mahanagar Gas ADD 966 1,300 34.6 96 84.0 89.4 9.4 6.5 11.5 10.8 2.9 2.5 27.2 25.2
Marico BUY 288 350 21.5 371 8.4 9.8 2.6 15.9 34.2 29.5 11.3 10.7 33.3 36.9
Source: Kotak Institutional Equities. For details refer to KIE India Daily report dated 30th April 2020; Note: Earnings season has started and KIE would be changing their earnings estimates, price targets and ratings of above companies as and when their results are out in near future.
Kotak Securities – Private Client Group Please see the Disclosure/Disclaimer on the last page For Private Circulation 4
Market Strategy May 2020
INTERNATIONAL EVENTS
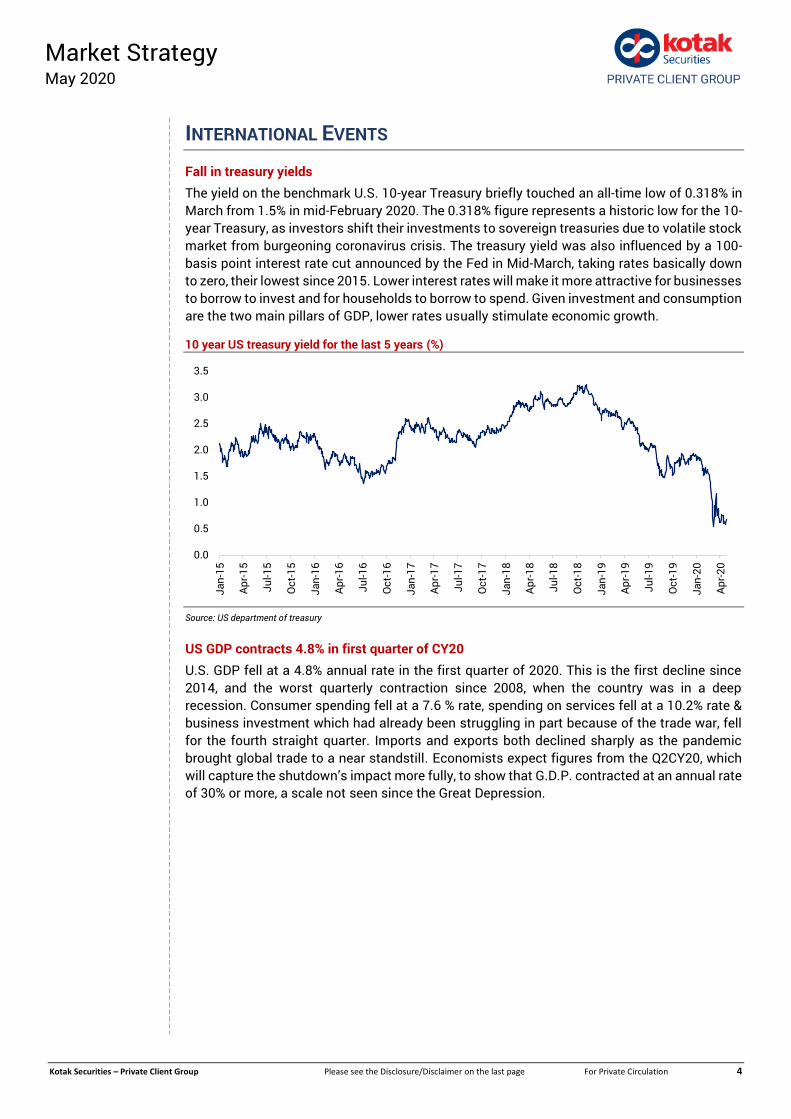
Fall in treasury yields The yield on the benchmark U.S. 10-year Treasury briefly touched an all-time low of 0.318% in March from 1.5% in mid-February 2020. The 0.318% figure represents a historic low for the 10-year Treasury, as investors shift their investments to sovereign treasuries due to volatile stock market from burgeoning coronavirus crisis. The treasury yield was also influenced by a 100-basis point interest rate cut announced by the Fed in Mid-March, taking rates basically down to zero, their lowest since 2015. Lower interest rates will make it more attractive for businesses to borrow to invest and for households to borrow to spend. Given investment and consumption are the two main pillars of GDP, lower rates usually stimulate economic growth.
10 year US treasury yield for the last 5 years (%)
Source: US department of treasury
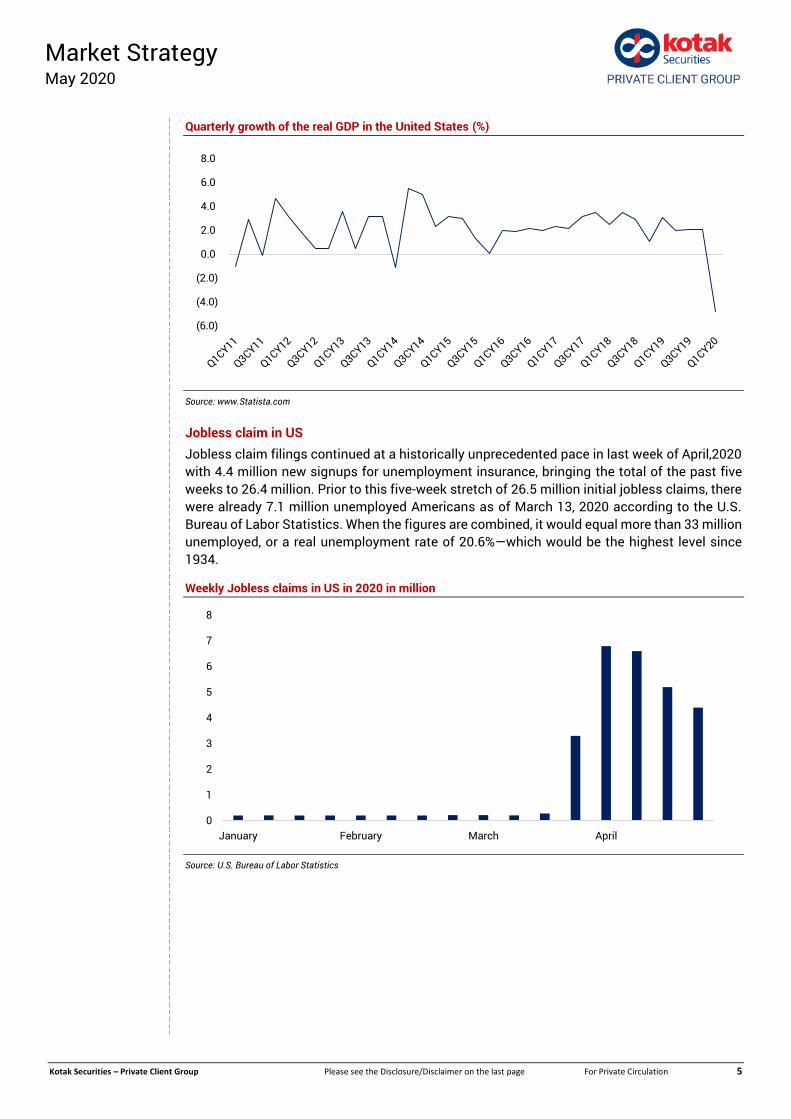
US GDP contracts 4.8% in first quarter of CY20 U.S. GDP fell at a 4.8% annual rate in the first quarter of 2020. This is the first decline since 2014, and the worst quarterly contraction since 2008, when the country was in a deep recession. Consumer spending fell at a 7.6 % rate, spending on services fell at a 10.2% rate & business investment which had already been struggling in part because of the trade war, fell for the fourth straight quarter. Imports and exports both declined sharply as the pandemic brought global trade to a near standstill. Economists expect figures from the Q2CY20, which will capture the shutdown’s impact more fully, to show that G.D.P. contracted at an annual rate of 30% or more, a scale not seen since the Great Depression.
0.0
0.5
1.0
1.5
2.0
2.5
3.0
3.5
Jan-
15
Apr-1
5
Jul-1
5
Oct
-15
Jan-
16
Apr-1
6
Jul-1
6
Oct
-16
Jan-
17
Apr-1
7
Jul-1
7
Oct
-17
Jan-
18
Apr-1
8
Jul-1
8
Oct
-18
Jan-
19
Apr-1
9
Jul-1
9
Oct
-19
Jan-
20
Apr-2
0
Kotak Securities – Private Client Group Please see the Disclosure/Disclaimer on the last page For Private Circulation 5
Market Strategy May 2020
Quarterly growth of the real GDP in the United States (%)
Source: www.Statista.com
Jobless claim in US Jobless claim filings continued at a historically unprecedented pace in last week of April,2020 with 4.4 million new signups for unemployment insurance, bringing the total of the past five weeks to 26.4 million. Prior to this five-week stretch of 26.5 million initial jobless claims, there were already 7.1 million unemployed Americans as of March 13, 2020 according to the U.S. Bureau of Labor Statistics. When the figures are combined, it would equal more than 33 million unemployed, or a real unemployment rate of 20.6%—which would be the highest level since 1934.
Weekly Jobless claims in US in 2020 in million
Source: U.S. Bureau of Labor Statistics
(6.0)
(4.0)
(2.0)
0.0
2.0
4.0
6.0
8.0
0
1
2
3
4
5
6
7
8
January February March April

Kotak Securities – Private Client Group Please see the Disclosure/Disclaimer on the last page For Private Circulation 6
Market Strategy May 2020
Situation in Europe Germany
On 17th April, German Health Minister Jens Spahn said that the coronavirus outbreak in Germany has become manageable, as the number of patients who have made a recovery has been higher than the number of new infections. On 15th April, Chancellor Angela Merkel said that Germany would take small steps out of lockdown with the partial reopening of shops and schools from May 4. While the economic minister mentioned that the German economy, which entered a recession in March would continue to face slowdown until the middle of the year. As confinement measures are taking their toll on the economy, almost a fifth of German companies are worried about insolvency spurred by the coronavirus fallout.
UK
UK on 16th April has extended its nationwide lockdown for at least another three weeks. The United Kingdom has the fifth-highest official death toll from COVID-19 in the world, after the United States, Italy, Spain and France. On 26th April, the death toll in Britain from the coronavirus outbreak neared 20,000. A review of the restrictions is due on May 7. Dominic Raab, UK foreign secretary, has warned the public that lockdown measures could last into June as ministers came under increasing pressure to set out a detailed plan to ease the stringent restrictions.
France
France currently has the fourth-highest number of confirmed coronavirus cases and third-most deaths in the world. The country’s health care system is consistently ranked among the best in the world, yet France has experienced shortages of hospital beds, masks, and other critical products. The number of covid19 patients getting admitted in hospitals in France has fallen daily for the last two weeks, while the number of sufferers in intensive care has declined for 19 consecutive days. The French economy, the euro zone's second biggest, is forecast to shrink 8% in 2020.France will reveal its plans to unwind a six-week-old coronavirus lockdown on Tuesday, 5th May.
Italy
Italy has been under the grip of the coronavirus crisis for over two months, facing not only health ramifications of the virus, but also the impending economic emergency. Italy will begin administering experimental coronavirus immunity tests on an initial 150,000 people nationwide in early May as part of its efforts to reopen after a long shutdown. In last week of April, 2020, Italy posted the fewest virus fatalities in almost six weeks as the government paved the way for a new stimulus package to revive an economy stalled by containment measures.
Chinese economy contracts 6.8% in Q1CY20 China’s first quarter GDP contracted by 6.8% in 2020 from a year ago as it took a huge hit from the coronavirus outbreak. While the headline GDP figure was not unexpected, the rest of the data did not bode well for the months ahead. Industrial production and retail sales fell 1.1% and 15.8% YoY in the month of March 2020. China’s economy is beginning to come back online again, with work restarting in many companies, but it faces headwinds ahead. As demand from the rest of the world tanks due to the worldwide spread of the virus from mid-March, China’s industrial production and exports could worsen in May/June 2020.
Kotak Securities – Private Client Group Please see the Disclosure/Disclaimer on the last page For Private Circulation 7
Market Strategy May 2020
China quarterly YOY GDP (%)
Source: National Bureau of Statistics of China
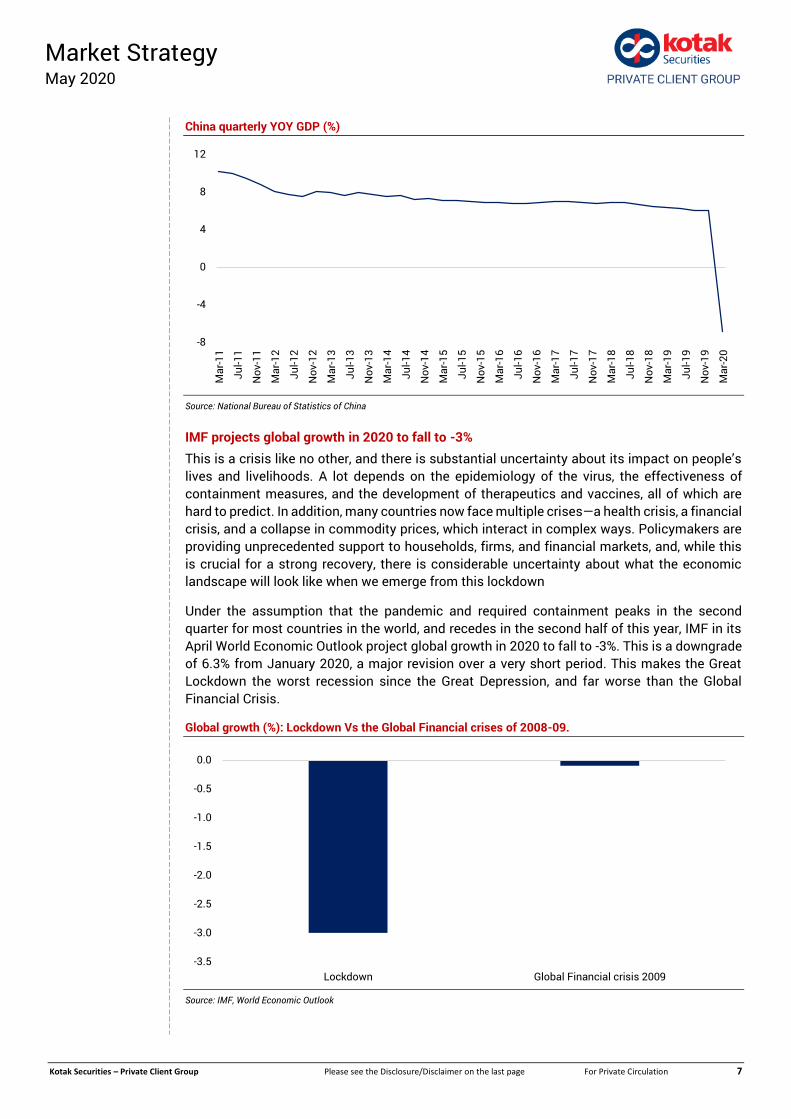
IMF projects global growth in 2020 to fall to -3% This is a crisis like no other, and there is substantial uncertainty about its impact on people’s lives and livelihoods. A lot depends on the epidemiology of the virus, the effectiveness of containment measures, and the development of therapeutics and vaccines, all of which are hard to predict. In addition, many countries now face multiple crises—a health crisis, a financial crisis, and a collapse in commodity prices, which interact in complex ways. Policymakers are providing unprecedented support to households, firms, and financial markets, and, while this is crucial for a strong recovery, there is considerable uncertainty about what the economic landscape will look like when we emerge from this lockdown
Under the assumption that the pandemic and required containment peaks in the second quarter for most countries in the world, and recedes in the second half of this year, IMF in its April World Economic Outlook project global growth in 2020 to fall to -3%. This is a downgrade of 6.3% from January 2020, a major revision over a very short period. This makes the Great Lockdown the worst recession since the Great Depression, and far worse than the Global Financial Crisis.
Global growth (%): Lockdown Vs the Global Financial crises of 2008-09.
Source: IMF, World Economic Outlook
-8
-4
0
4
8
12
Mar
-11
Jul-1
1
Nov
-11
Mar
-12
Jul-1
2
Nov
-12
Mar
-13
Jul-1
3
Nov
-13
Mar
-14
Jul-1
4
Nov
-14
Mar
-15
Jul-1
5
Nov
-15
Mar
-16
Jul-1
6
Nov
-16
Mar
-17
Jul-1
7
Nov
-17
Mar
-18
Jul-1
8
Nov
-18
Mar
-19
Jul-1
9
Nov
-19
Mar
-20
-3.5
-3.0
-2.5
-2.0
-1.5
-1.0
-0.5
0.0
Lockdown Global Financial crisis 2009

Kotak Securities – Private Client Group Please see the Disclosure/Disclaimer on the last page For Private Circulation 8
Market Strategy May 2020
Latest World Economic Outlook (growth %)
Country 2019 2020 2021
US 2.3 -5.9 4.7 Euro 1.2 -7.5 4.7 UK 1.4 -6.5 4.0 Japan 0.7 -5.2 3.0 Canada 1.6 -6.2 4.2 China 6.1 1.2 9.2 India 4.2 1.9 7.4 Asean 5 4.8 -0.6 7.8 Russia 1.3 5.5 3.5 Brazil 1.1 -5.3 2.9 Middle East 1.2 -2.8 4.0 Sub Saharan Africa 3.1 -1.6 4.1
Source: IMF, World Economic Outlook
Composite PMI slumps across the globe Private sector firms around the globe signaled an unprecedented decline in business activity in April,2020 with manufacturing and service sector companies registering marked contractions of output amid the outbreak of coronavirus disease 2019 (COVID-19). The COVID-19 outbreak dealt a blow to all the major economies of a ferocity not previously seen in recent history during April, 2020. The closely watched IHS Markit composite purchasing managers’ index (PMI) plunged to its lowest ever reading in April for US at 27.4, UK at 12.9, Japan at 27.8 and Eurozone at 13.5. The scale of the fall in the PMI adds to signs that the second quarter of CY20 will see a historically dramatic contraction of the global economy, and will add to worries about the ultimate cost of the fight against the pandemic.
Composite PMI for major economies is falling
Source: IHSMarkit
OPEC+ to cut oil production OPEC+ countries led by Saudi Arabia and Russia have agreed to reduce crude oil production by 9.7 mn barrels per day (b/d) during May-June 2020 amid the ongoing surplus in global oil markets due to large-scale impact on demand amid widespread lockdowns. The production cut will be tapered off to 7.7 mn b/d from July 2020 to December 2020 and further to 5.8 mn b/d from January 2021 to April 2022. Saudi Arabia, UAE and Kuwait have also volunteered to cut production more than their quotas to temporarily provide some balance to global oil markets. OPEC+ will review the extension of agreement in its meet during December 2021.
10.0
20.0
30.0
40.0
50.0
60.0
70.0 US Eurozone China India Japan UK
Kotak Securities – Private Client Group Please see the Disclosure/Disclaimer on the last page For Private Circulation 9
Market Strategy May 2020
Useful in the medium term
In our view, (1) OPEC+ decision to extend production cuts for a period of two years until April 2022 and (2) anticipated impact on oil production from other large producing countries like the US and Canada, may be instrumental in providing some balance to the global oil markets in the medium term. Global oil demand may recover back to normalcy, albeit gradually, once the large nations come out of ongoing lockdowns post a reasonable containment of Covid-19 outbreak. However, the global oil market may still remain in surplus for several months due to expected large build-up of oil inventories during 1HCY20, which will take time to draw down. We expect oil prices to remain muted before recovering gradually in the medium term, as supplies reduce meaningfully and demand returns to normalcy post lockdowns.
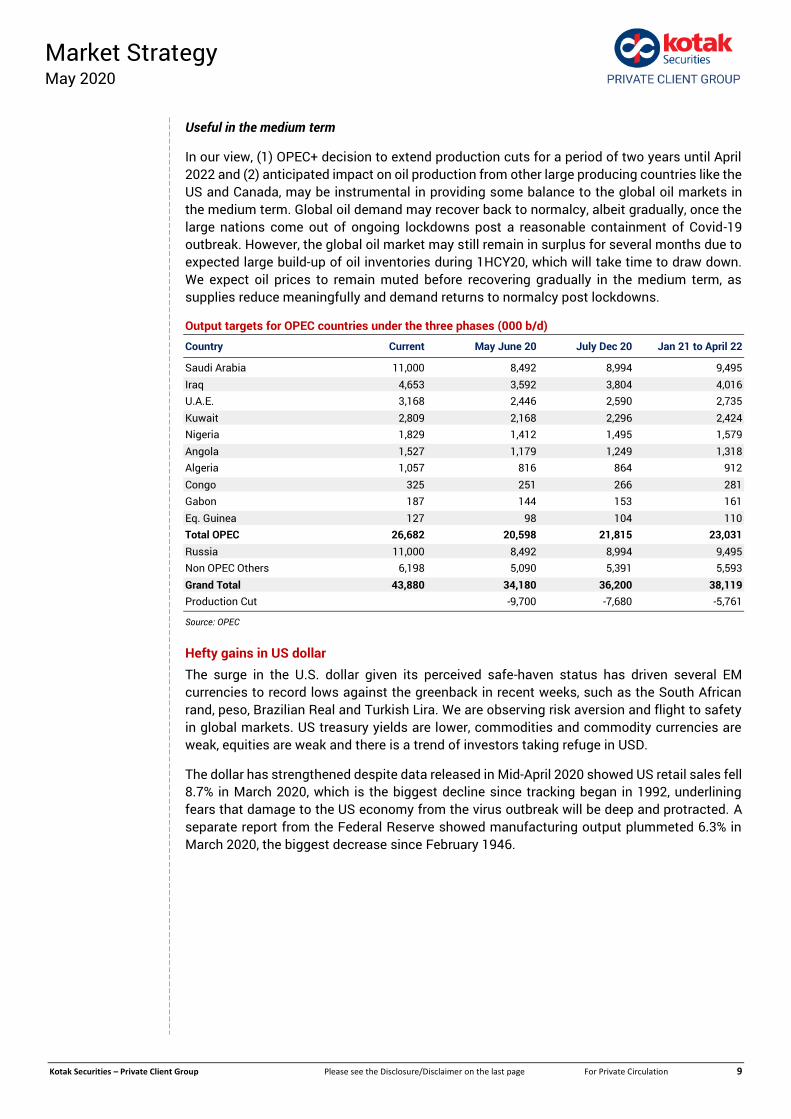
Output targets for OPEC countries under the three phases (000 b/d)
Country Current May June 20 July Dec 20 Jan 21 to April 22
Saudi Arabia 11,000 8,492 8,994 9,495 Iraq 4,653 3,592 3,804 4,016 U.A.E. 3,168 2,446 2,590 2,735 Kuwait 2,809 2,168 2,296 2,424 Nigeria 1,829 1,412 1,495 1,579 Angola 1,527 1,179 1,249 1,318 Algeria 1,057 816 864 912 Congo 325 251 266 281 Gabon 187 144 153 161 Eq. Guinea 127 98 104 110 Total OPEC 26,682 20,598 21,815 23,031 Russia 11,000 8,492 8,994 9,495 Non OPEC Others 6,198 5,090 5,391 5,593 Grand Total 43,880 34,180 36,200 38,119 Production Cut -9,700 -7,680 -5,761
Source: OPEC
Hefty gains in US dollar The surge in the U.S. dollar given its perceived safe-haven status has driven several EM currencies to record lows against the greenback in recent weeks, such as the South African rand, peso, Brazilian Real and Turkish Lira. We are observing risk aversion and flight to safety in global markets. US treasury yields are lower, commodities and commodity currencies are weak, equities are weak and there is a trend of investors taking refuge in USD.
The dollar has strengthened despite data released in Mid-April 2020 showed US retail sales fell 8.7% in March 2020, which is the biggest decline since tracking began in 1992, underlining fears that damage to the US economy from the virus outbreak will be deep and protracted. A separate report from the Federal Reserve showed manufacturing output plummeted 6.3% in March 2020, the biggest decrease since February 1946.
Kotak Securities – Private Client Group Please see the Disclosure/Disclaimer on the last page For Private Circulation 10
Market Strategy May 2020
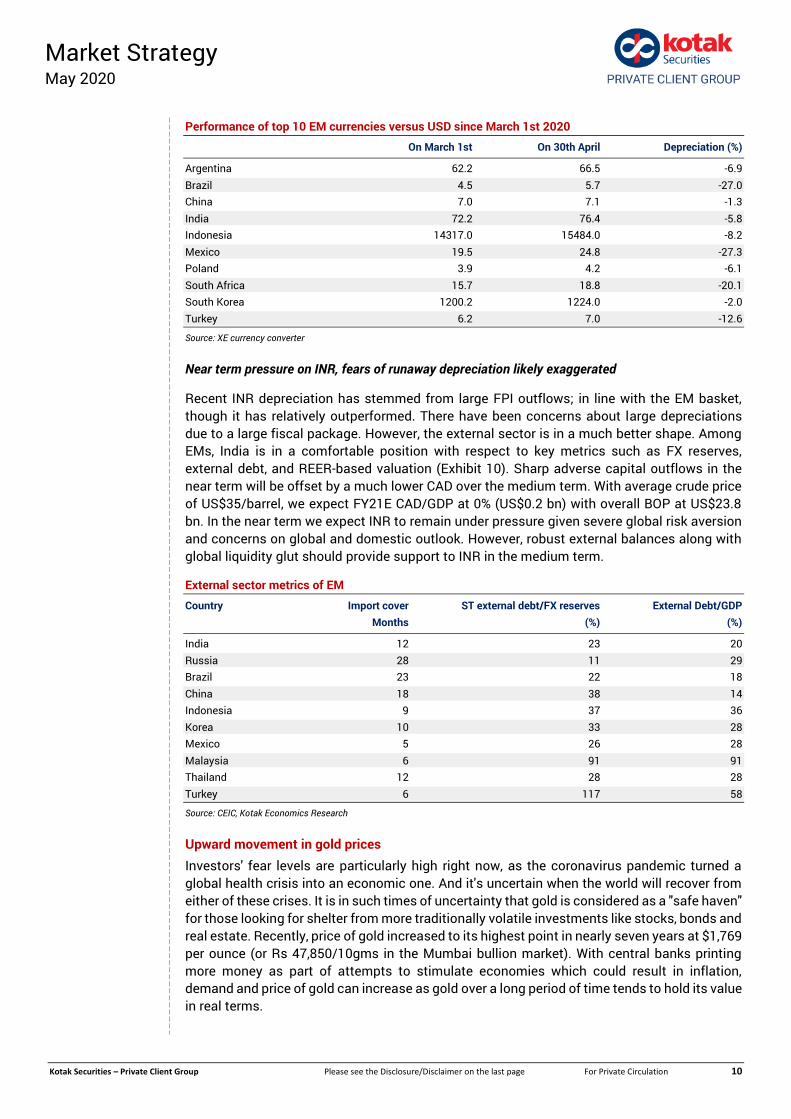
Performance of top 10 EM currencies versus USD since March 1st 2020
On March 1st On 30th April Depreciation (%)
Argentina 62.2 66.5 -6.9 Brazil 4.5 5.7 -27.0 China 7.0 7.1 -1.3 India 72.2 76.4 -5.8 Indonesia 14317.0 15484.0 -8.2 Mexico 19.5 24.8 -27.3 Poland 3.9 4.2 -6.1 South Africa 15.7 18.8 -20.1 South Korea 1200.2 1224.0 -2.0 Turkey 6.2 7.0 -12.6
Source: XE currency converter
Near term pressure on INR, fears of runaway depreciation likely exaggerated
Recent INR depreciation has stemmed from large FPI outflows; in line with the EM basket, though it has relatively outperformed. There have been concerns about large depreciations due to a large fiscal package. However, the external sector is in a much better shape. Among EMs, India is in a comfortable position with respect to key metrics such as FX reserves, external debt, and REER-based valuation (Exhibit 10). Sharp adverse capital outflows in the near term will be offset by a much lower CAD over the medium term. With average crude price of US$35/barrel, we expect FY21E CAD/GDP at 0% (US$0.2 bn) with overall BOP at US$23.8 bn. In the near term we expect INR to remain under pressure given severe global risk aversion and concerns on global and domestic outlook. However, robust external balances along with global liquidity glut should provide support to INR in the medium term.
External sector metrics of EM
Country Import cover ST external debt/FX reserves External Debt/GDP Months (%) (%)
India 12 23 20 Russia 28 11 29 Brazil 23 22 18 China 18 38 14 Indonesia 9 37 36 Korea 10 33 28 Mexico 5 26 28 Malaysia 6 91 91 Thailand 12 28 28 Turkey 6 117 58
Source: CEIC, Kotak Economics Research
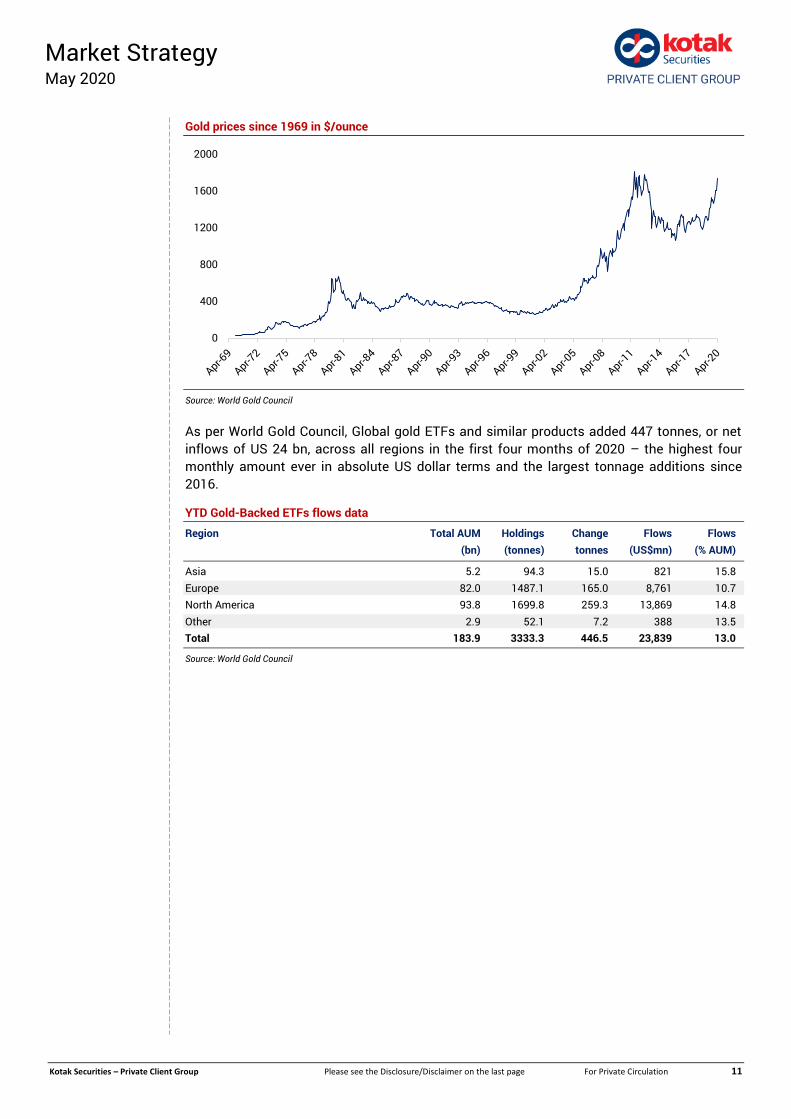
Upward movement in gold prices Investors' fear levels are particularly high right now, as the coronavirus pandemic turned a global health crisis into an economic one. And it's uncertain when the world will recover from either of these crises. It is in such times of uncertainty that gold is considered as a "safe haven" for those looking for shelter from more traditionally volatile investments like stocks, bonds and real estate. Recently, price of gold increased to its highest point in nearly seven years at $1,769 per ounce (or Rs 47,850/10gms in the Mumbai bullion market). With central banks printing more money as part of attempts to stimulate economies which could result in inflation, demand and price of gold can increase as gold over a long period of time tends to hold its value in real terms.
Kotak Securities – Private Client Group Please see the Disclosure/Disclaimer on the last page For Private Circulation 11
Market Strategy May 2020
Gold prices since 1969 in $/ounce
Source: World Gold Council
As per World Gold Council, Global gold ETFs and similar products added 447 tonnes, or net inflows of US 24 bn, across all regions in the first four months of 2020 – the highest four monthly amount ever in absolute US dollar terms and the largest tonnage additions since 2016.
YTD Gold-Backed ETFs flows data
Region Total AUM Holdings Change Flows Flows (bn) (tonnes) tonnes (US$mn) (% AUM)
Asia 5.2 94.3 15.0 821 15.8 Europe 82.0 1487.1 165.0 8,761 10.7 North America 93.8 1699.8 259.3 13,869 14.8 Other 2.9 52.1 7.2 388 13.5 Total 183.9 3333.3 446.5 23,839 13.0
Source: World Gold Council
0
400
800
1200
1600
2000

Kotak Securities – Private Client Group Please see the Disclosure/Disclaimer on the last page For Private Circulation 12
Market Strategy May 2020
DOMESTIC ECONOMY
February IIP growth at a 7-month high February IIP growth improved to 4.5% as against a growth of 2.1% in January amid favourable base effects despite falling momentum. Growth in the manufacturing sector improved to 3.2% (1.6% in January), mining to 10% (4.3% in January) and electricity to 8.1% (3.1% in January).
From the use-based classification side, production of capital goods and consumer durables contracted by -9.7% and -6.4%, respectively. Among the positives, growth in the intermediate goods segment was at 22.4% and the primary goods segment at 7.4%.
Sectoral Classification of IIP
Mining (%) Manufacturing (%) Electricity (%) General (%) 2018 2019 2020 2018 2019 2020 2018 2019 2020 2018 2019 2020
April 3.0 3.8 5.1 2.9 4.9 4.0 5.4 2.1 6.0 3.2 4.5 4.3 May 0.3 5.8 3.2 2.6 3.6 2.5 8.3 4.2 7.4 2.9 3.8 3.1 June 0.1 6.5 1.5 (0.7) 6.9 0.2 2.1 8.5 8.2 (0.3) 7.0 1.2 July 4.5 3.4 4.9 (0.1) 7.0 4.2 6.6 6.6 4.8 1.0 6.5 4.3 August 9.3 (0.6) 0.0 3.8 5.2 (1.7) 8.3 7.6 (0.9) 4.8 4.8 (1.4) September 7.6 0.1 (8.6) 3.8 4.8 (4.0) 3.4 8.2 (2.6) 4.1 4.1 (4.3) October (0.2) 7.3 (8.0) 2.0 8.2 (2.3) 3.2 10.8 (12.2) 1.8 1.8 (4.0) November 1.4 2.7 1.9 10.4 (0.7) 2.7 3.9 5.1 (5.0) 8.5 8.5 1.8 December 1.2 (1.0) 5.7 8.7 2.9 (0.7) 4.4 4.5 (0.1) 7.3 7.3 0.1 January 0.3 3.8 4.3 8.7 1.3 1.6 7.6 0.9 3.1 7.5 7.5 2.1 February (0.4) 2.2 10.0 8.4 (0.3) 3.2 4.5 1.3 8.1 6.9 6.9 4.5 March 3.1 0.8 5.7 0.1 5.9 2.2 5.3 5.3 Average 2.5 2.9 4.7 3.9 5.3 5.2 4.4 3.9
Source: CEIC, Kotak Institutional Equities
Uncertainty regarding the spread of Covid-19 and duration of lockdown weighs on growth Global economic activity has taken a strong hit owing to the lockdown imposed to contain the spread of Covid-19. Growth prospects for FY21 seem unfavorable given the increasing likelihood of a recession in the global economy, caused by the disruptions in global supply chains, travel and tourism, and lockdowns. While the global central banks and governments have taken prompt and coordinated actions, there is little evidence that they are able to mitigate the risks to the global economy.
On the domestic front, economic activity had started to improve before the outbreak of Covid-19, which is also reflected in the high frequency data. The lockdown imposed to contain the pandemic is however weighing on the growth prospects. The latest MPR report pointed out that private consumption is at serious risk from the pandemic, despite the improved Rabi prospects and the recent rise in food prices. The recent sharp fall in oil prices are also unlikely to offset the drag from the shutdown and loss of external demand. Given the uncertainty about the spread of Covid-19, the duration of the lockdown and the exit policy, the RBI has refrained from giving any growth projections. We however continue to believe that the RBI and the government would support the economy through comfortable liquidity, further rate cuts and additional transfers to tide through the lockdown period.

Kotak Securities – Private Client Group Please see the Disclosure/Disclaimer on the last page For Private Circulation 13
Market Strategy May 2020
Real GDP growth likely at 0.4% in FY21E; likely GVA loss of Rs14-27 TN due to lockdown We estimate nominal gross value added (GVA) losses ranging from Rs14-27 TN (7.8-15.2% of GVA) under various hypothetical scenarios of lockdowns. Using these estimates of GVA losses and assuming a central government relief and stimulus package of around 2.1% of GDP, we estimate real GDP growth of 0.4% as a base case (earlier 4.5%) and -6.3% as a bear case (earlier 3.7%) in FY21E. We factor in relief measures which cover for income/business losses through the lockdown and stimulus measures after the lockdown.
Potential loss for Indian Economy
Annual GVA Proportion of Scenario Lockdown time period loss (Rs tn) annual GVA (%)
Scenario 1 30 day lockdown (base case) 13.9 7.8 Scenario 2 45 day lockdown 18.3 10.3 Scenario 3 30 day lockdown + 15 day lockdown after a month 22.5 12.7 Scenario 4 45 day lockdown + 15 day lockdown after a month (bear case) 26.9 15.2
Source: ADB Input-Output tables (2017), Kotak Economics Research estimates
We estimate FY2021E GDP growth at 0.4%
Components FY14 FY15 FY16 FY17 FY18 FY19 FY20E FY21E
Real GVA 6.1 7.2 8.0 7.9 6.9 6.6 4.7 0.4 Agriculture and allied 5.6 (0.2) 0.6 6.3 5.0 2.9 3.7 2.9 Industry 3.8 7.0 9.6 7.7 5.9 6.9 1.4 (3.6) Mining 0.2 9.7 10.1 9.5 5.1 1.3 2.3 1.2 Manufacturing 5.0 7.9 13.1 7.9 5.9 6.9 0.4 (6.6) Electricity 4.2 7.2 4.7 10.0 8.6 7.0 4.2 3.9 Construction 2.7 4.3 3.6 6.1 5.6 8.7 2.3 (0.5) Services 7.7 9.8 9.4 8.4 8.1 7.5 6.9 1.9 Trade, hotel, transport, communication 6.5 9.4 10.2 7.7 7.8 6.9 5.2 (2.2) Financial, real estate, professional services 11.2 11.0 10.7 8.7 6.2 7.4 7.3 (2.0) Real GDP 6.4 7.4 8.0 8.2 7.2 6.8 4.9 0.4
Source: CEIC, Kotak Economics Research estimate
Government support required The government needs to provide relief and stimulus packages to avert recession, which could further weaken the country’s fiscal position. We pencil in GFD/GDP at 6.5% factoring in revenue slippages, stimulus measures, and expenditure savings. States would also need support given weak revenue positions. RBI would need to explore unconventional measures.
Extended Lockdown announced on 14th April
The Indian government has extended the current lockdown to May 3 to control the spread of Covid-19 infection. However, it may (1) ease the lockdown in unaffected districts slowly and (2) announce steps to re-open parts of manufacturing and services sectors over the next few days.
We expect the government’s decision to extend the lockdown beyond 3rd May to result in further downgrades to our FY21 GDP and FY21 earnings estimates. We would note that (1) growing uncertainty around the ‘reopening’ of the economy (complete, phased, erratic) and (2) lack of meaningful fiscal support from the government (so far) may pose further downgrade risks to our FY21 earnings estimates across sectors. However, we believe FY22E earnings numbers will be relatively unaffected except for the financial sector (credit costs will be high in FY22E too if bad loans were to spike in FY21).

Kotak Securities – Private Client Group Please see the Disclosure/Disclaimer on the last page For Private Circulation 14
Market Strategy May 2020
Measures by the government to fight Covid19
Relief measures announced Benefits Central Fiscal (Rs bn) govt fiscal impact Beneficiaries Remarks impact (% of (Rs bn) GDP)
Health infrastructure 150 78 0.0 Hospitals and testing Rs77.7 bn to spend immediately and facilities remaining over 1-4 years to build health
infrastructure for fighting Covid-19 Food security 450 800 mn individuals 5kgs of rice/wheat and 1 kg of pulses over
and above the existing food security rules PM-KISAN 160 87 mn farmers Rs2000 transferred to all farmers in April
(front loaded) NREGA 56 56 0.0 136 mn families Rs20 increase in base wages Senior citizens/widows/handicapped 30 30 0.0 30 mn individuals Rs500 each in two tranches over next three
months Women Jan Dhan accounts 310 310 0.1 204 mn individuals Rs500 each per month for next three
months Ujwala scheme 130 130 0.1 80 mn BPL families Free cylinders for next three months Organized sector - I 50 50 0.0 8 mn workers/ 0.4 mn firms 24% contribution due for PF for next 3
months to be borne by government; all firms with up to 100 employees and employees whose salary is <Rs15000/month
Organized sector - II 48 mn workers PF scheme regulation will be amended to allow non-refundable advance of 70% of outstanding or three months of wages, whichever is lower
Building and construction workers 310 35 mn workers Through building and other construction worker welfare fund
Women SHG group 68.5 mn households Rs2 mn collateral free loan compared to Rs1 mn earlier
District Mineral Funds 255 All states States to use this fund for medical testing/screening/prevention of Covid-19
Total resources from government 1901 654 0.3
Source: PIB, Kotak Economics Research estimates
Liquidity measures by RBI to boost transmission After cutting repo rate by 75 bps on March 27 to mitigate Covid 19 impact, the RBI announced a second list of liquidity and regulatory related measures to support the economy and the financial system. These measures include, (1) reverse repo rate cut of 25 bps to 3.75%, (2) reduction in LCR from 100% to 80%, (3) opening up of a special refinancing facility for AIFIs at the repo rate, and (4) TLTRO 2.0 targeted at NBFCs with 50% of the liquidity availed reserved for small and mid-sized NBFCs and MFIs. Through these measures, the RBI aims to incentivize banks to lend to the sectors strongly in need of liquidity after being impacted by Covid-19 related disruptions.
While these are steps in the right direction, we see limited efficacy just yet. For instance, even though investments made under TLTRO will be HTM and hence not subjected to market risk, the credit risk still remains. There is therefore a need for authorities to announce incentives in the form of credit guarantees to make this option more attractive. Meanwhile, RBI’s assertion of a reverse repo rate cut and its use as a liquidity tool may be partly effective in channelizing funds to the real economy. We expect banks which have SLR holding at the margin (including LCR required) to be helped by the RBI’s reduction in LCR. The refinancing facility made available to the AIFIs could ease financing constraints for the small and medium enterprises, and HFCs as they would have access to funds at a lower cost.
Kotak Securities – Private Client Group Please see the Disclosure/Disclaimer on the last page For Private Circulation 15
Market Strategy May 2020
Liquidity Measures by RBI
Category Liquidity Measure
TLTROs 2.0 Conduct targeted long-term repo operations (TLTRO 2.0) for an aggregate amount of Rs500 bn, to begin with, in tranches of appropriate sizes. Refinancing Facilities for All India Provide special refinance facilities for a total amount of Rs500 bn to NABARD, SIDBI and NHB to enable Financial Institutions (AIFIs) them to meet sectoral credit needs. Liquidity Adjustment Facility: Reduce the fixed rate reverse repo rate under the liquidity adjustment facility (LAF) by 25 bps from 4.0% to Fixed Rate Reverse Repo Rate 3.75% to encourage banks to deploy funds in productive sectors of the economy WMA "Increase the WMA limit of states by 60% (from 30%) till 30th September 2020,to provide greater comfort to the states for undertaking COVID-19 containment and mitigation efforts, and to plan their market borrowing programmes better"
Source: RBI, Kotak Economics Research
Corona Virus Update in India as on 30th April, 2020
Indicator Direction Comments
No of cases in India Upwards Number of cases continue to increase, however the growth has come down to 6.5% (doubling rate of 11days). Total number of active cases as on 30th April was ~35000.
State wise Mixed Some of the states are more heavily affected compared to other states. The mortality rate of Covid-19 varies significantly in different states. Maharashtra most impacted.
Traffic data Downwards All four cities show a significant decline in road traffic App usage data Mixed Sharp increase in the usage of Zoom app. Food delivery app usage has
gone down, but not too much. Electricity consumption Mixed Electricity consumption for several states is down 5% to 35%
compared to the same week in CY2019. This is an indication of slowing industrial activity. However, the reduction this week is lower than the reduction recorded last week.
Covid-19 mindshare Mixed Google searches for Coronavirus in India lower in past one week. MHFW website also being visited a lot
Discretionary spending Downwards Both bookmyshow.com and makemytrip.com websites have seen their alexa.com relative rank slip a lot in the last few weeks
Source: Kotak Institutional Equities, MHFW
Trade deficit lowers for March 2020 Trade deficit in March came in lower at US$9.8 bn as against US$9.9 bn in February and US$11 bn in March last year. March exports at US$21.4 bn implied a growth of -34.6% against US$32.7 bn in March 2019. The major commodities which contributed towards the decline in exports were oil meals -70%, meat, dairy and poultry products -45.5%, engineering goods -42.3%, gems and jewelry -41.1% and leather and leather products -36.8%. Meanwhile, imports witnessed fall of -28.7% to US$31.2 bn against US$43.7 bn in March 2019. The key sectors registering negative growth in March were pearls, precious and semi-precious stones -53.5%, machinery, electrical and non-electrical -31.7%, electronic goods -29.1%, coal, coke and briquettes, etc. -23.5% and petroleum, crude and products -15%. Weak domestic demand, low oil prices and covid-19 is estimated to improve the BOP situation of India.

Kotak Securities – Private Client Group Please see the Disclosure/Disclaimer on the last page For Private Circulation 16
Market Strategy May 2020
Foreign trade for India in US $ bn
Date Mar-20 Mar-19 Feb-20 YoY (%) MoM (%) FY20 FY19 YoY
Exports 21.4 32.7 27.6 (34.6) (22.6) 314.0 330.0 (4.8) Oil exports 2.5 3.6 3.4 (31.1) (27.0) 43.0 47.0 (8.7) Non - Oil exports 18.9 29.1 24.3 (35.0) (22.0) 271.0 283.0 (4.2) Imports 31.2 43.7 37.5 (28.7) (16.9) 474.0 514.0 (7.8) Oil imports 10.0 11.8 10.8 (15.0) (6.9) 130.0 141.0 (7.5) Non - Oil imports 21.2 31.9 26.7 (33.8) (20.9) 344.0 373.0 (7.9) Gold imports 1.2 3.3 2.4 (62.6) (48.0) 28.0 33.0 (14.2) Trade Balance (9.8) (11.0) (9.9) (160.0) (184.0)
Source: Bloomberg, Kotak Institutional Equities
FY21 GST collection target looks difficult Based on the monthly PIB release, total GST collection was at Rs976 bn for March 2020 (Rs1,054 bn in February 2020) and contraction of 8.4% over March 2019 of Rs 1066 bn. CGST collection was Rs192 bn, SGST was Rs256 bn, IGST at Rs445 bn and compensation cess was at Rs83 bn. Total gross GST collections for FY20 was at Rs 12.22 TN, higher than the revised target of Rs 11.26 TN.
GST collections for FY21BE are targeted at Rs13.4 TN; Rs6.9 TN for the central government and Rs6.5 TN for the state governments. This implies a required monthly run rate of Rs1.12 TN (a growth of around 9.7% over the FY20E run rate which is almost impossible to achieve given the current situation).
Monthly GST collection (Rs bn)
Month CGST SGST IGST Cess Total Filings (mn)
18-Jun 160 220 495 81 956 6.5 18-Jul 159 223 500 84 965 6.6 18-Aug 153 212 499 76 940 6.7 18-Sep 153 211 501 80 944 6.7 18-Oct 165 228 534 80 1,007 6.7 18-Nov 168 231 497 80 976 7.0 18-Dec 164 225 479 79 947 7.2 19-Jan 178 248 512 87 1,025 7.3 19-Feb 176 242 470 85 972 7.3 19-Mar 204 275 504 83 1,066 7.6 19-Apr 212 288 547 92 1,139 7.2 19-May 178 245 499 81 1,003 7.2 19-Jun 184 253 478 85 999 7.4 19-Jul 179 250 596 86 1,021 7.6 19-Aug 177 242 490 73 982 7.6 19-Sep 166 226 451 76 919 7.6 19-Oct 176 237 465 76 954 7.4 19-Nov 196 271 490 77 1,035 7.8 19-Dec 200 268 481 83 1,032 8.1 20-Jan 209 282 530 86 1,108 8.3 20-Feb 206 273 485 89 1,054 8.4 20-Mar 192 256 445 83 976 7.7
Source: Ministry of Finance, Kotak Institutional Equities

Kotak Securities – Private Client Group Please see the Disclosure/Disclaimer on the last page For Private Circulation 17
Market Strategy May 2020
CPI and WPI inflation move lower March CPI inflation moderated to 5.91% (Kotak: 5.93%) as against 6.58% in February amid favorable base effects and falling momentum. The softening was led by lower food inflation of 8.8%. However it remains above the RBI’s comfort zone of 4%. Even March WPI inflation moderated sharply to 1% as against 2.26% in February owing to fading momentum and favourable base effects. The moderation was led by lower food inflation of 4.9% (7.8% in February) and lower fuel inflation of -1.8% (3.4% in February).
While supply disruptions could keep the near-term headline inflation trajectory above 5%, we expect the MPC to focus on addressing the growth concerns. We expect the MPC to focus on the medium-term inflation trajectory, which looks more favorable and accordingly deliver the policy response given the significant risks to growth. We expect FY21 GDP growth at 0.4% and expect CPI inflation to trend towards 3.5% by March 2021 and average 4% in FY21 (4.8% in FY20). Overall, we expect WPI inflation to trend towards 2.5% by March 2021 and average 1.6% in FY21 (1.7% in FY20).We therefore restate our call of another 50 bps of repo rate cut along with focus on transmission of liquidity. We also believe that the MPC would continue to undertake unconventional measures to provide support to the economy and the financial markets.
CPI inflation likely to trend towards 3.5% and WPI inflation to 2.5% by March 2021
Source: CEIC, Kotak Economic Research
Probability skewed towards normal monsoon The Indian Meteorological Department (IMD) forecasts the southwest monsoon at 100% of Long Period Average (LPA) with a model error of (+/-) 5%. With the exception of last year, quantitatively, the IMD has generally overestimated the monsoon outcome over the past few years. The first estimate for southwest monsoon in FY20 was at 96% of LPA. By end of the season (June-September), monsoon was around 110% of LPA. Probability of a normal monsoon are skewed on the upside, the IMD has ascribed 9% probability of excess rainfall, 21% probability of above-normal monsoon, 41% probability of normal monsoon, 20% probability of below-normal monsoon, and 9% probability of deficient monsoon in FY21.We note that this is the first stage forecast and that the second stage forecast will be released either in the last week of May or the first week of June. The release will also have separate forecasts for the monthly (July and August) rainfall over the country as a whole and seasonal (June-September) rainfall over the four broad geographical regions of India.
The IMD’s forecast of normal rainfall will also provide comfort to the MPC in terms of inflation and explore various options to tackle the widening negative output gap.
-8
-4
0
4
8
12
Jul-1
3
Nov
-13
Mar
-14
Jul-1
4
Nov
-14
Mar
-15
Jul-1
5
Nov
-15
Mar
-16
Jul-1
6
Nov
-16
Mar
-17
Jul-1
7
Nov
-17
Mar
-18
Jul-1
8
Nov
-18
Mar
-19
Jul-1
9
Nov
-19
Mar
-20
Jul-2
0
Nov
-20
Mar
-21
CPI (%) WPI (%)
3.5
2.5

Kotak Securities – Private Client Group Please see the Disclosure/Disclaimer on the last page For Private Circulation 18
Market Strategy May 2020
Probability of normal rainfall skewed towards the positive side (%)
Source: IMD, Kotak Economics Research
SIP inflows remain strong Systematic investment plans (SIP) of mutual funds registered its highest ever inflow of Rs 86.4 bn in March 2020 despite Covid19, uncertainty, slowdown in economic activity and market volatility. We feel strong SIP inflow figures are a positive indication that investors continue to put faith in the long term prospects of Indian Markets. However, we need to monitor the flows of next few months to see if flows continue post the lockdown scenario.
Monthly SIP contribution
(Rs bn) FY20 FY19 FY18 FY17
Total 1,001 927 672 439 March 86.41 80.55 71.19 43.35 February 85.13 80.95 64.25 40.5 January 85.32 80.64 66.44 40.95 December 85.18 80.22 62.22 39.73 November 82.73 79.85 58.93 38.84 October 82.46 79.85 56.21 34.34 September 82.63 77.27 55.16 36.98 August 82.31 76.58 52.06 34.97 July 83.24 75.54 49.47 33.34 Jun 81.22 75.54 47.44 33.1 May 81.83 73.04 45.84 31.89 April 82.38 66.9 42.69 31.22
Source: AMFI
0
10
20
30
40
50
Deficient (less than90)
Below Normal (90 to96)
Normal (96 to 104) Above Normal (104to 110)
Excess (more than110)
Probability - IMD Climatological probability

Kotak Securities – Private Client Group Please see the Disclosure/Disclaimer on the last page For Private Circulation 19
Market Strategy May 2020
SECTORAL SNIPPETS
Covid-19 has led to a widespread deterioration in the credit quality of India Inc. As per rating agencies have done some work on mapping sectors in terms of higi-risk, medium-risk and low-risk. The high-risk sectors such as aviation, tourism, hotels, microfinance and jems & jewellery face severe business disruption over the immediate term and where recovery is more likely to be prolonged. The medium-risk sectors such as automobiles, auto-ancillaries, construction, consumer durables and power face lower degree of business disruption and credit risks. The Low-risk sectors like agri-products, FMCG, telecom and education are unlikely to face material business disruption.
Some of the manufacturing and services categories may face a permanent loss of demand due to inactivity. Sectors like cement, steel, construction equipment, export items could fall in this category. In certain sectors like consumer durables, cars, two wheelers, fashion retailing and discretionary items there could be demand postponement. In certain service sectors like rail, aviation, logistics, real estate, entertainment, restaurants and hotels the loss in permanent demand is more likely due to lockdown.
Automobile and Components Auto sector volumes declined sharply across segments in FY2020 led by (1) inventory correction by OEMs, (2) price increase due to BS-VI transition amidst weak economic scenario and (3) impact of coronavirus pandemic during the month of March 2020. The absence of a visible stimulus in most segments, weak freight rates, weak retail demand, the rise in prices owing to transition to BS-VI (~10 to 15% for CVs and ~5-10% for 2W) and muted rural sentiment will be key headwinds for the sector.
The absence of strong rural demand alongside a sharp rise in prices of 2W on transition to BS-VI will drive down volumes. High water reservoir levels and the expectation of normal monsoon will push demand for tractors. Weak retail demand will continue to pressure passenger cars.
We expect overall auto volumes to remain muted in FY21E. Tepid freight rates and 10-15% increases in prices on transition to BS-VI will lead to a ~5-10% yoy decline in CVs during FY21E. A hike in average 2W prices and weak rural sentiment will lead to muted 2W volumes. We are yet to bake in the full impact of Covid-19 on overall auto volumes but one can expect a downward revision to our forecasts.
Banks and diversified financials With the Covid-19 pandemic leading to lower GDP growth for FY21, we see further downsides to our loan growth estimates and believe that low single digit growth cannot be ruled out. Nearly all engines of growth have stalled and lenders are likely to remain cautious in the interim. The relationship between nominal growth to loan growth has been at <1x in the past decade. Loan growth demand is likely to be led by negative outcomes such as worsening working capital cycles, moratoriums/restructuring or slower pre-payments. Post the Covid-19 episode, we see all lending institutions to scale back risk taking capabilities as the scars of the previous corporate NPL cycle is still fresh. Housing loans and loans to NBFCs have supported bank credit growth in the past few years.
Banks are reluctant to lend to the NBFC and MFI segment as can be seen from the poor response to the TLTRO 2 auction. The funds are available under TLTRO at the repo rate of 4.4%, still banks are showing risk-aversion. Within the BFSI space the impact on banks will be lesser than NBFC and the recovery will also be faster in them. Within NBFCs, housing finance and gold loan companies may be better placed. Asset management and broking will remain weak, life and general insurance may fare better.

Kotak Securities – Private Client Group Please see the Disclosure/Disclaimer on the last page For Private Circulation 20
Market Strategy May 2020
Life and General Insurance Private life insurers reported 40% yoy decline in individual APE in March 2020 as the business was practically shut for crucial parts the month. Lower volumes will bring down operating leverage and impact quarterly VNB margins. This, coupled with a large negative investment variance reflecting equity MTM hit, leads KIE to cut their FY20 EV estimates by 2-5%. We expect Covid-19-related disruptions to continue for the next quarter with an increase in demand for protection products over the next few months providing some support. General insurance companies reported 10% yoy decline in premiums (ex-crop) in March 2020 on the back of Covid-19-related disruptions in the last two weeks of the month. Motor and health segments declined 7% and 5% yoy, respectively; retail health was muted at 4% yoy. Most major private players slowed down (down 16% yoy) while standalone health insurers reported strong growth in premium (up 8% yoy). Post Covid-19, health insurance will likely report strong growth over the next few quarters. Standalone health insurers are placed in a sweet sport to capture incremental growth opportunities although business for private players will likely revive in FY21E.
Consumer Staples Potential ramifications of Covid-19 are tough to predict with any degree of accuracy. Even as it is tough to say how the outbreak curve shapes up in India and what the government response at various points in the curve is, the fear curve among people will likely be quite similar to what countries with larger outbreaks have already seen. ST impact is likely to be materially negative for retail, QSR and non-essential consumer products, while being positive for essential consumer products. LT impact could be a permanent change in consumer behavior on a couple of fronts – personal/home hygiene habits and e-commerce adoption. Another important variable in the earnings growth equation is the raw materials basket. Slower global economic growth could mean base RMs (crude, crude derivatives and at some point, even agri commodities) remain under pressure
IT services FY21 outlook is hazy for IT sector as economic consequences of Covid-19 filter through deceleration/ decline in global IT spending and consequently revenues of IT services companies. We expect revenue decline for our coverage universe in FY21. Despite the weak outlook, IT services stocks offer value and reasonable returns on normalized multiples.
IT services stock trade like cyclical stock, with the multiple for stock contingent on the rate of change in growth. We establish through multiple for industry leaders (TCS and Infosys) in the range of 13-14X, mid-cycle multiple at 16-18X and peak cycle at 19-22X. The multiple for the next set of large companies i.e. HCLT, Wipro and Tech Mahindra will be at a discount to sector leaders (~30% discount). Any stock that is available at trough multiple after baking in conservative estimates (revenue decline and margin compression) does become interesting. IT services stocks have bounced back from recent lows to the extent of 15%. Any correction in the stocks can be used as a buying opportunity.
Oil and Gas We expect crude prices to remain muted in the near term as persisting surplus, due to (1) meaningful impact on demand from widespread lockdowns and (2) less-than-required curtailment in production, may test limits of global storage/logistics capacity over the next few months. The recovery in prices may also be gradual as overall oil demand as well as global inventories take time to revert to normalcy, even as supplies remain curtailed for long post recent agreements and amid lower prices.

Kotak Securities – Private Client Group Please see the Disclosure/Disclaimer on the last page For Private Circulation 21
Market Strategy May 2020
Metals and Mining Strict quarantine measures and slower economic activity across the globe are driving steel demand destruction. Supply, on the other side, is facing relatively lower disruption creating inventory and margin pressure. We expect Rs3,000-3,500/ton (8-10%) price correction in domestic steel prices when transactions resume in May 2020 and 5-10% yoy volume decline in FY21E. We factor the same and cut FY21/22E earnings of our ferrous coverage; recommend companies with limited overseas exposure and capex commitments.
Cement Cement plants have been permitted to restart production from April 20, 2020; however, we expect only a gradual pick-up in utilization and normalcy only post monsoon in CY20E. Demand destruction in the near term, labor shortage and upcoming monsoons suggest that utilization of cement producers would take 3-4 months to return to pre-Covid levels. Margins would suffer from negative operating leverage due to lower volumes; however, we expect deflation in variable costs (raw material – slag, fly ash, gypsum, pet coke and diesel) and stable prices to offset margin pressure in CY20E.
Aviation Sharply lower capacity and utilization coupled with low fares will significantly impact revenues of airlines in 4QFY20 and 1QFY21. The airline industry will bear significant losses on account of sharply lower revenues during the said period. Losses will also get magnified as with the exception of fuel, most other costs are fixed in nature. While most airlines have announced cost-cutting measures such as headcount and employee cost rationalization, these companies will still have to contend with other fixed costs such as lease rentals and other corporate expenses. Companies’ ability to manage fixed costs will be the key to survive the event. Indigo’s sufficient cash buffer (Rs94 bn as of December 2019) should be enough to weather this storm, though other airlines will need external support in the form of interest payment moratoriums and lower taxation on crude and other imports.
Electric Utilities Indian distribution utilities have consumption-leaning revenue model, wherein payment for power is largely dependent on actual consumption (with a low capacity charge). On the other hand, cost for distribution, transmission and generation capacities is largely fixed (76%), leading to a sharp deterioration in financials for distribution utilities in times of a weak economic environment.
The 17% drop in power demand under the current lockdown, will further expose the weakness in the business model of distribution utilities (variable revenues versus fixed cost), leading to a further spike in outstanding dues that have risen to Rs866 bn in January 2020 (from Rs419 bn in January 2019). While lots of utilities operate under the cost-plus tariff mechanism (not volume-linked), we will likely continue to see a receivables build-up and lower cash generation. Weakness in demand will impact merchant/un-contracted capacities of players such as JSW Energy and CESC.
Real Estate We expect housing sales to remain sluggish through most of FY21E. Real estate sales have already been sluggish and the current lockdown will compound the challenges in this sector. Customer sentiment will likely change, driving lower demand for housing credit. Additionally, the pace of new residential launches is expected to decline, thereby further reducing the demand for housing loans.
In Q3FY20, commercial real estate in India (Top-7 cities) witnessed new supply of 18 mn sq. ft contributed across cities and outstripping absorption of 12 mn sq. ft. Vacancy across key

Kotak Securities – Private Client Group Please see the Disclosure/Disclaimer on the last page For Private Circulation 22
Market Strategy May 2020
cities stood at 13% (as of Dec 2019) from 12% in Sep’19. Mumbai and Bengaluru saw steady absorption of new stock while NCR saw a decline in absorption. Emerging markets of Hyderabad and Pune too saw a decline in absorption in Q3FY20 even as they maintained single-digit vacancy. Capital yields across cities remain attractive at ~8-10%.
Telecommunication Services OpenSignal expanded its city-level coverage to 48 cities in the April 2020 report versus 42 in the previous edition. Vodafone Idea (VIL) has improved the most in terms of city ranks on various parameters. It emerged as the leader in LTE download speeds in the latest iteration of OpenSignal’s biannual mobile network experience findings for India. As VIL inches closer to complete network integration, strength of the combined spectrum assets has started showing up in VIL’s focus (Quad A/B) markets. Bharti closed the gap versus Jio further on LTE availability and offers the best combination of LTE availability and download speeds, in our view. Jio continues to be the LTE network availability leader in all the 48 cities covered with Bharti being the #2 and VIL the #3 in all.

Kotak Securities – Private Client Group Please see the Disclosure/Disclaimer on the last page For Private Circulation 23
Market Strategy May 2020
MSCI World Index: Fw PE chart
Source: Bloomberg & Kotak Securities – Private Client Group
MSCI India Premium over MSCI EM (on 1 Yr Fw PE basis)
Source: Bloomberg & Kotak Securities – Private Client Group
One Yr Fw PE chart: Nifty-50 Vs Mid Cap 100 Index
Source: Bloomberg & Kotak Securities – Private Client Group
9.0
11.0
13.0
15.0
17.0
19.0
Mar
-10
Aug-
10
Jan-
11
Jun-
11
Nov
-11
Apr-1
2
Sep-
12
Feb-
13
Jul-1
3
Dec-
13
May
-14
Oct
-14
Mar
-15
Aug-
15
Jan-
16
Jun-
16
Nov
-16
Apr-1
7
Sep-
17
Feb-
18
Jul-1
8
Dec-
18
May
-19
Oct
-19
Mar
-20
MSCI World Fw PE 10 Yr Avg
10%
20%
30%
40%
50%
60%
70%
80%
Mar
-10
Aug-
10
Jan-
11
Jun-
11
Nov
-11
Apr-1
2
Sep-
12
Feb-
13
Jul-1
3
Dec-
13
May
-14
Oct
-14
Mar
-15
Aug-
15
Jan-
16
Jun-
16
Nov
-16
Apr-1
7
Sep-
17
Feb-
18
Jul-1
8
Dec-
18
May
-19
Oct
-19
Mar
-20
4.0
8.0
12.0
16.0
20.0
24.0
28.0
Aug-
07
Feb-
08
Aug-
08
Feb-
09
Aug-
09
Feb-
10
Aug-
10
Feb-
11
Aug-
11
Feb-
12
Aug-
12
Feb-
13
Aug-
13
Feb-
14
Aug-
14
Feb-
15
Aug-
15
Feb-
16
Aug-
16
Feb-
17
Aug-
17
Feb-
18
Aug-
18
Feb-
19
Aug-
19
Feb-
20
Nifty Mid Cap 100 Nifty 50
Based on Bloomberg consensus
estimates the MSCI World Index now
trades at 18.2x on a one year forward
basis as compared to its previous 10
year peaks of 17x.
Based on Bloomberg consensus
estimates MSCI EM & MSCI India trade
at 12.7x & 16.6x, respectively on Fw
basis. Valuation premium of MSCI
India over MSCI EM works to 31% as
compared to 10 year avg. of 42%.
Based on Bloomberg consensus
estimates Nifty Mid Cap Fw PE is just
10% below Nifty-50 Fw PE. Consensus
estimates face huge downward risk post
Q4 result season.
Kotak Securities – Private Client Group Please see the Disclosure/Disclaimer on the last page For Private Circulation 24
Market Strategy May 2020
APOLLO HOSPITAL LTD
CMP: Rs.1396 Fair Value: Rs.1820 Market Cap: Rs.194 bn
KIE expects Apollo Hospitals (APHS) to benefit from an improving maturity profile, even as the near-term outlook is challenging given lower volume of international and domestic travel patients, as well as deferment in OPD footfalls and elective surgeries, though, KIE expects a full demand recovery in 2HFY21.
KIE expects APHS to face significant pressure in near-term earnings on account of COVID-19, with the impact likely at multiple levels: 1) Decline in international patient volumes; 2) Decline in outpatient visits; 3) Deferment of elective cases; and 4)Shift in ordering patterns could hurt SAP growth.
As per KIE estimates, 60-65% of costs in hospitals are fixed in nature; consequently lower utilization will lead to material decline in EBITDA margin. KIE believes the impact will likely be transitory, and expects recovery in operations from 2QFY21 with normalization of business in 2HFY2.
The pace of recovery depends on resumption of international travel, particularly, from the Indian sub-continent, Middle East and South East Asian regions. KIE has cut EBITDA estimates for FY20 by 8% and FY21 by 18%. KIE EBITDA estimates for FY22E are largely unchanged, though deleveraging and margin expansion at new units will likely be delayed by 12 months.
KIE has upgraded the stock to BUY with revised fair value of Rs1,820.
Note: The above is brief note on the company, based on the research report and update available (dated: 20th March 2020) on our website at:
https://www.kotaksecurities.com/research_report/recommendation/indiadaily.html

Kotak Securities – Private Client Group Please see the Disclosure/Disclaimer on the last page For Private Circulation 25
Market Strategy May 2020
FINOLEX INDUSTRIES LTD
CMP: Rs.402 Fair Value: Rs.514 Market Cap: Rs.49 bn
Finolex Industries Ltd (FIL) manufactures and sells PVC pipes, fittings and PVC resin. It is a major player in terms of market share in agriculture pipes segment and is a leading player in PVC resin business in India. FIL has strong distribution network with over 700 dealers and 18,000+ retail touch points across country.
FIL had announced temporary shutdown of its plants and offices on account of lockdown due to COVID-19. The company believes that it may not take longer time to ramp-up its facilities once lockdown is over.
FIL has sufficient inventory (in terms of raw material and finished goods) which can take care of demand post lockdown.
The management had earlier given positive demand outlook in the longer run in PVC pipes business and targeted 10-11% in agri segment and 15-20% in non agri in FY21. We believe that the achievement of guidance would depend upon tenure of lockdown due to COVID-19 and impact on its business.
We believe that, FIL would be a major beneficiary from government’s focus on irrigation, providing piped water to all by 2024 and improvement in rural consumption in the long term.
We maintain Buy on the stock with revised target price of Rs 514, valuing the stock at 16x (vs 18x earlier) forward PE, as we have factored in the increased risk related to demand slowdown.
Note: The above is brief note on the company, based on the research report and update available (dated: 16th April 2020) on our website at:
https://www.kotaksecurities.com/research_report/recommendation/indiadaily.html

Kotak Securities – Private Client Group Please see the Disclosure/Disclaimer on the last page For Private Circulation 26
Market Strategy May 2020
ICICI BANK
CMP: Rs.380 Fair Value: Rs.490 Market Cap: Rs.2459 bn
A strong liability profile, better asset mix, slower growth and healthy CAR could make ICICI Bank well positioned to come through this challenging period with relatively lower degree of stress.
One of the key advantages for the bank has been the focus in stabilizing the balance sheet in recent years with less focus on gaining market share. This has resulted in slower loan growth in recent years and greater emphasis towards improving the quality of the loan mix.
KIE believes that the entry point into this exogenous shock is better as compared to the previous ones: (1) a loan mix that has a higher share of housing loans and lower share of lending to riskier segments like SME (<5%) and unsecured loans (personal loans and credit cards at ~10%), (2) the bank has reported a much slower loan growth (3) the liability profile has been strong and (4) capital adequacy levels are quite comfortable to handle stress.
KIE has reduced estimates by 16-20% for FY21-22 to factor (1) lower loan growth, (2) lower fee income growth and (3) higher provisions for bad loans. KIE has increased holding company discount to 25% from 10% earlier. KIE finds a combination of (1) inexpensive valuations and (2) a comparatively better-positioned balance sheet that could enable the bank to recover from this event faster than its peers.
KIE has a BUY rating on the bank and with a fair value of Rs. 490. At revised fair value, KIE is valuing the bank at 1.8x book and 13x March 2022E EPS for RoEs moving closer to 15%.
Note: The above is brief note on the company, based on the research report and update available (dated: 8th April 2020) on our website at:
https://www.kotaksecurities.com/research_report/recommendation/indiadaily.html
Kotak Securities – Private Client Group Please see the Disclosure/Disclaimer on the last page For Private Circulation 27
Market Strategy May 2020
ITC LTD
CMP: Rs.181 Fair Value: Rs.255 Market Cap: Rs. 2240 bn
Post Covid19, KIE is building in a volume decline of 8% for the cigarette business in FY21E versus assumption of 1% growth earlier.
KIE believe that tobacco business would continue to generate hefty (even if gradually declining) cash flows for a fairly long period of time.
ITC's cigarette business now trades at an implied post-tax FCF yield of close to 12% despite the stock rallying nearly 30% from its recent lows.
KIE has also cut estimates for the hotels business quite sharply and reduced revenue forecasts for the FMCG business by around 10%.KIE's revised EPS forecasts for FY21E and FY22E stand at Rs11.3, and Rs12.5.
On the company's part, it has announced step-up in dividend payout ratio, which is a welcome step, but KIE believes a lot more can be done.
At CMP, ITC's cigarette business now trades at an implied PE of 8X. KIE value the cigarette business at 15X of an FCF yield of around 7% to arrive at a fair value of Rs255/share. Reiterate BUY.
Note: The above is brief note on the company, based on the research report and update available (dated: 15th April 2020) on our website at:
https://www.kotaksecurities.com/research_report/recommendation/indiadaily.html

Kotak Securities – Private Client Group Please see the Disclosure/Disclaimer on the last page For Private Circulation 28
Market Strategy May 2020
LARSEN & TOUBRO LTD
CMP: Rs.897 Fair Value: Rs.1270 Market Cap: Rs.1259 bn
The last decade saw key challengers to L&T outgrow the healthy low-teens sectoral business CAGR without generating any FCF. The current pause in ordering may see the aggressors reassessing their bidding criteria. This may boost L&T’s PAT margin and free cash flow profile, which stands out among peers.
L&T has been able to grow its core E&C revenues at a healthy 12% CAGR in tandem with it maintaining a healthy balance sheet. This is commendable considering the stagnation in private-corporate capex over such period and volatile ordering from government.
During FY13-19 period, L&T has generated Rs140 bn of cash surplus over the past seven years or 10X of aggregate competition.
L&T has operated at healthy ~22% average pre-tax RoCE over the past decade.
KIE notes good possibility of L&T maintaining its current margin and potentially seeing margin expansion from its current low levels. Even at static margin, the high business returns for L&T’s EPC business would aid a faster growth in PAT versus a potential 12% growth in revenues.
L&T order backlog provides growth visibility of 3 years. Its strong order backlog and benign valuations on trailing earnings comfort.
Our revised fair value of Rs1,270 bakes in a 9% cut in earnings. The lower 15X earnings multiple factors in a 13% decadal PAT CAGR against the historical 12% revenue CAGR.
Note: The above is brief note on the company, based on the research report and update available (dated: 25th March 2020) on our website at:
https://www.kotaksecurities.com/research_report/recommendation/indiadaily.html

Kotak Securities – Private Client Group Please see the Disclosure/Disclaimer on the last page For Private Circulation 29
Market Strategy May 2020
MAHANAGAR GAS LTD
CMP: Rs.966 Fair Value: Rs.1300 Market Cap: Rs.96 bn
MGL's CNG and PNG volume growth recovered from lows of 2QFY20 in Q3FY20. Also, company's gross margins on CNG and domestic PNG have jumped from end-December due to reduction in gas price from PMT fields post expiry of its contract. KIE assumes modest growth in volumes and higher per-unit margins. MGL’s volumes grew 3% yoy to 3.05 mcm/d in Q3FY20, recovering from a weak print of 1.3% growth in Q2FY20, which was impacted by intermittent supply disruptions. Gross margins moderated 5% qoq to Rs13.9/scm in Q3FY20, as higher margins for CNG and domestic PNG segment post a decline in domestic gas price, were perhaps offset by lower margins on I&C PNG volumes amid qoq increase in long-term as well as spot LNG prices. Unit EBITDA margins declined 7% qoq to Rs9.2/scm, with operating costs remaining under control.
Slower volume growth and progressive changes in regulations to enable competition remain a cause of concern.
KIE's EPS estimate is Rs76.8 in FY20, Rs84 in FY21, Rs89.4 in FY22 and factoring in (1) higher unit EBITDA margins amid reset of PMT gas price, lower LNG prices and expected decline in domestic gas price.
KIE's DCF-based fair value is Rs.1,300 reflecting higher unit margins and roll-forward of DCF model. KIE retains ADD rating on the stock as it find valuations reasonable in the context of (1) input cost tailwind, (2) high FCF/dividend yield and (3) healthy return ratios.
Note: The above is brief note on the company, based on the research report and update available (dated: 10th February 2020) on our website at:
https://www.kotaksecurities.com/research_report/recommendation/indiadaily.html

Kotak Securities – Private Client Group Please see the Disclosure/Disclaimer on the last page For Private Circulation 30
Market Strategy May 2020
MARICO LTD
CMP: Rs.288 Fair Value: Rs.350 Market Cap: Rs.371 bn
The recent weakness in volumes (-1%/-2% in 2Q/3Q) is entirely due to weak macro; Parachute has gained market share in coconut hair oils despite Dabur being extremely aggressive.
Copra price inflation is modest and expected to moderate further in 2HFY21; management expects Copra inflation at 2-3% for FY21E.
VAHO's growth was impacted by underperformance in the mid and premium segments and a challenging demand environment. Marico intends to tackle the former through a combination of brand renovation (Hair & Care) and aggression in the market place for volume share.
Management is confident of high single digit growth in Saffola. Further, RM prices have completely receded after 20-25% inflation in Dec-19 and Jan-20.
We expect some short-term pressure on sales in domestic as well as international business on account of the immediate and derivative impacts of Covid-19. We reduce our revenue growth forecast for FY21E to 0.7% (from 8.7%) and increase FY22E revenue growth to 13.4% (from 10%).
We keep faith in the management's ability to tackle challenges and expect the stock to rerate over the next 6-12 months. Upgrade to BUY from ADD with a revised FV of Rs350/share.
Note: The above is brief note on the company, based on the research report and update available (dated: 23rd March 2020) on our website at:
https://www.kotaksecurities.com/research_report/recommendation/indiadaily.html

Kotak Securities – Private Client Group Please see the Disclosure/Disclaimer on the last page For Private Circulation 31
Market Strategy May 2020
RATING SCALE (KOTAK SECURITIES – PRIVATE CLIENT GROUP) / KOTAK INSTITUTIONAL EQUITIES Definitions of ratings BUY – We expect the stock to deliver more than 15% returns over the next 12 months ADD – We expect the stock to deliver 5% - 15% returns over the next 12 months REDUCE – We expect the stock to deliver -5% - +5% returns over the next 12 months SELL – We expect the stock to deliver < -5% returns over the next 12 months NR – Not Rated. Kotak Securities is not assigning any rating or price target to the stock. The report has been prepared for information purposes only. SUBSCRIBE – We advise investor to subscribe to the IPO. RS – Rating Suspended. Kotak Securities has suspended the investment rating and price target for this stock, either because there is not a Sufficient fundamental basis for determining, or there are legal, regulatory or policy constraints around publishing, an investment rating or target. The previous investment rating and price target, if any, are no longer in effect for this stock and should not be relied upon. NA – Not Available or Not Applicable. The information is not available for display or is not applicable NM – Not Meaningful. The information is not meaningful and is therefore excluded. NOTE – Our target prices are with a 12-month perspective. Returns stated in the rating scale are our internal benchmark.
FUNDAMENTAL RESEARCH TEAM (PRIVATE CLIENT GROUP) Rusmik Oza Arun Agarwal Amit Agarwal, CFA Krishna Nain Head of Research Auto & Auto Ancillary Transportation, Paints, FMCG M&A, Corporate actions [email protected] [email protected] [email protected] [email protected] +91 22 6218 6441 +91 22 6218 6443 +91 22 6218 6439 +91 22 6218 7907
Sanjeev Zarbade Jatin Damania Purvi Shah Priyesh Babariya Cap. Goods & Cons. Durables Metals & Mining, Midcap Pharmaceuticals Research Associate [email protected] [email protected] [email protected] [email protected] +91 22 6218 6424 +91 22 6218 6440 +91 22 6218 6432 +91 22 6218 6433
Sumit Pokharna Pankaj Kumar Deval Shah K. Kathirvelu Oil and Gas, Information Tech Midcap Research Associate Support Executive [email protected] [email protected] [email protected] [email protected] +91 22 6218 6438 +91 22 6218 6434 +91 22 6218 6425 +91 22 6218 6427
TECHNICAL RESEARCH TEAM (PRIVATE CLIENT GROUP) Shrikant Chouhan Amol Athawale Siddhesh Jain [email protected] [email protected] Research Associate +91 22 6218 5408 +91 20 6620 3350 [email protected] +91 22 62185498
DERIVATIVES RESEARCH TEAM (PRIVATE CLIENT GROUP) Sahaj Agrawal Malay Gandhi Prashanth Lalu Prasenjit Biswas, CMT, CFTe [email protected] [email protected] [email protected] [email protected] +91 79 6607 2231 +91 22 6218 6420 +91 22 6218 5497 +91 33 6625 9810

Kotak Securities – Private Client Group Please see the Disclosure/Disclaimer on the last page For Private Circulation 32
Market Strategy May 2020
Disclosure/Disclaimer (Private Client Group) Kotak Securities Limited established in 1994, is a subsidiary of Kotak Mahindra Bank Limited. Kotak Securities is one of India's largest brokerage and distribution house. Kotak Securities Limited is a corporate trading and clearing member of BSE Limited (BSE), National Stock Exchange of India Limited (NSE), Metropolitan Stock Exchange of India Limited (MSE), National Commodity and Derivatives Exchange (NCDEX) and Multi Commodity Exchange (MCX). Our businesses include stock broking, services rendered in connection with distribution of primary market issues and financial products like mutual funds and fixed deposits, depository services and Portfolio Management. Kotak Securities Limited is also a depository participant with National Securities Depository Limited (NSDL) and Central Depository Services (India) Limited (CDSL). Kotak Securities Limited is also registered with Insurance Regulatory and Development Authority as Corporate Agent for Kotak Mahindra Old Mutual Life Insurance Limited and is also a Mutual Fund Advisor registered with Association of Mutual Funds in India (AMFI). We are registered as a Research Analyst under SEBI (Research Analyst) Regulations, 2014. We hereby declare that our activities were neither suspended nor we have defaulted with any stock exchange authority with whom we are registered in last five years. However SEBI, Exchanges and Depositories have conducted the routine inspection and based on their observations have issued advise/warning/deficiency letters/ or levied minor penalty on KSL for certain operational deviations. We have not been debarred from doing business by any Stock Exchange / SEBI or any other authorities; nor has our certificate of registration been cancelled by SEBI at any point of time. We offer our research services to clients as well as our prospects. This document is not for public distribution and has been furnished to you solely for your information and must not be reproduced or redistributed to any other person. Persons into whose possession this document may come are required to observe these restrictions. This material is for the personal information of the authorized recipient, and we are not soliciting any action based upon it. This report is not to be construed as an offer to sell or the solicitation of an offer to buy any security in any jurisdiction where such an offer or solicitation would be illegal. It is for the general information of clients of Kotak Securities Ltd. It does not constitute a personal recommendation or take into account the particular investment objectives, financial situations, or needs of individual clients. We have reviewed the report, and in so far as it includes current or historical information, it is believed to be reliable though its accuracy or completeness cannot be guaranteed. Neither Kotak Securities Limited, nor any person connected with it, accepts any liability arising from the use of this document. The recipients of this material should rely on their own investigations and take their own professional advice. Price and value of the investments referred to in this material may go up or down. Past performance is not a guide for future performance. Certain transactions -including those involving futures, options and other derivatives as well as non-investment grade securities - involve substantial risk and are not suitable for all investors. Reports based on technical analysis centers on studying charts of a stock's price movement and trading volume, as opposed to focusing on a company's fundamentals and as such, may not match with a report on a company's fundamentals. Opinions expressed are our current opinions as of the date appearing on this material only. While we endeavor to update on a reasonable basis the information discussed in this material, there may be regulatory, compliance or other reasons that prevent us from doing so. Prospective investors and others are cautioned that any forward-looking statements are not predictions and may be subject to change without notice. Our proprietary trading and investment businesses may make investment decisions that are inconsistent with the recommendations expressed herein. Kotak Securities Limited has two independent equity research groups: Institutional Equities and Private Client Group. This report has been prepared by the Private Client Group. We and our affiliates/associates, officers, directors, and employees, Research Analyst(including relatives) worldwide may: (a) from time to time, have long or short positions in, and buy or sell the securities thereof, of company (ies) mentioned herein or (b) be engaged in any other transaction involving such securities and earn brokerage or other compensation or act as a market maker in the financial instruments of the subject company/company (ies) discussed herein or act as advisor or lender / borrower to such company (ies) or have other potential/material conflict of interest with respect to any recommendation and related information and opinions at the time of publication of Research Report or at the time of public appearance. Kotak Securities Limited (KSL) may have proprietary long/short position in the above mentioned scrip(s) and therefore may be considered as interested. The views provided herein are general in nature and does not consider risk appetite or investment objective of particular investor; readers are requested to take independent professional advice before investing. This should not be construed as invitation or solicitation to do business with KSL. Kotak Securities Limited is also a Portfolio Manager. Portfolio Management Team (PMS) takes its investment decisions independent of the PCG research and accordingly PMS may have positions contrary to the PCG research recommendation. Kotak Securities Limited does not provide any promise or assurance of favourable view for a particular industry or sector or business group in any manner. The investor is requested to take into consideration all the risk factors including their financial condition, suitability to risk return profile and take professional advice before investing. The analyst for this report certifies that all of the views expressed in this report accurately reflect his or her personal views about the subject company or companies and its or their securities, and no part of his or her compensation was, is or will be, directly or indirectly related to specific recommendations or views expressed in this report. No part of this material may be duplicated in any form and/or redistributed without Kotak Securities' prior written consent. Details of Associates are available on www.kotak.com 1. “Note that the research analysts contributing to the research report may not be registered/qualified as research analysts with FINRA; and 2. Such research analysts may not be associated persons of Kotak Mahindra Inc and therefore, may not be subject to NASD Rule 2711 restrictions on communications
with a subject company, public appearances and trading securities held by a research analyst account Any U.S. recipients of the research who wish to effect transactions in any security covered by the report should do so with or through Kotak Mahindra Inc. (Member FINRA/SIPC) and (ii) any transactions in the securities covered by the research by U.S. recipients must be effected only through Kotak Mahindra Inc. (Member FINRA/SIPC) at 369 Lexington Avenue 28th Floor NY NY 10017 USA (Tel:+1 212-600-8850). Kotak Securities Limited and its non US affiliates may, to the extent permissible under applicable laws, have acted on or used this research to the extent that it relates to non US issuers, prior to or immediately following its publication. This material should not be construed as an offer to sell or the solicitation of an offer to buy any security in any jurisdiction where such an offer or solicitation would be illegal. This research report and its respective contents do not constitute an offer or invitation to purchase or subscribe for any securities or solicitation of any investments or investment services. Accordingly, any brokerage and investment services including the products and services described are not available to or intended for Canadian persons or US persons.” Research Analyst has served as an officer, director or employee of subject company(ies): No We or our associates may have received compensation from the subject company(ies) in the past 12 months. We or our associates have managed or co-managed public offering of securities for the subject company(ies) in the past 12 months: No We or our associates may have received compensation for investment banking or merchant banking or brokerage services from the subject company(ies) in the past 12 months. We or our associates may have received any compensation for products or services other than investment banking or merchant banking or brokerage services from the subject company(ies) in the past 12 months. We or our associates may have received compensation or other benefits from the subject company(ies) or third party in connection with the research report. Our associates may have financial interest in the subject company(ies). Research Analyst or his/her relative's financial interest in the subject company(ies): No Kotak Securities Limited has financial interest in the subject company(ies) at the end of the month immediately preceding the date of publication of Research Report:: Apollo Hospital, ICICI Bank, Marico, MGL - Yes Nature of financial interest is holding of equity shares or derivatives of the subject company. Our associates may have actual/beneficial ownership of 1% or more securities of the subject company(ies) at the end of the month immediately preceding the date of publication of Research Report. Research Analyst or his/her relatives has actual/beneficial ownership of 1% or more securities of the subject company(ies) at the end of the month immediately preceding the date of publication of Research Report: No.

Kotak Securities – Private Client Group Please see the Disclosure/Disclaimer on the last page For Private Circulation 33
Market Strategy May 2020
Kotak Securities Limited has actual/beneficial ownership of 1% or more securities of the subject company(ies) at the end of the month immediately preceding the date of publication of Research Report: No Subject company(ies) may have been client during twelve months preceding the date of distribution of the research report. "A graph of daily closing prices of securities is available at https://www.nseindia.com/ChartApp/install/charts/mainpage.jsp and http://economictimes.indiatimes.com/markets/stocks/stock-quotes. (Choose a company from the list on the browser and select the "three years" icon in the price chart)." Kotak Securities Limited. Registered Office: 27 BKC, C 27, G Block, Bandra Kurla Complex, Bandra (E), Mumbai 400051. CIN: U99999MH1994PLC134051, Telephone No.: +22 43360000, Fax No.: +22 67132430. Website: www.kotak.com/www.kotaksecurities.com. Correspondence Address: Infinity IT Park, Bldg. No 21, Opp. Film City Road, A K Vaidya Marg, Malad (East), Mumbai 400097. Telephone No: 42856825. SEBI Registration No: INZ000200137 (Member ID: NSE-08081; BSE-673; MSE-1024; MCX-56285; NCDEX-1262), AMFI ARN 0164, PMS INP000000258 and Research Analyst INH000000586. NSDL/CDSL: IN-DP-NSDL-23-97. Our research should not be considered as an advertisement or advice, professional or otherwise. The investor is requested to take into consideration all the risk factors including their financial condition, suitability to risk return profile and the like and take professional advice before investing. Investments in securities market are subject to market risks, read all the related documents carefully before investing. Derivatives are a sophisticated investment device. The investor is requested to take into consideration all the risk factors before actually trading in derivative contracts. Compliance Officer Details: Mr. Manoj Agarwal. Call: 022 - 4285 8484, or Email: [email protected]. In case you require any clarification or have any concern, kindly write to us at below email ids: Level 1: For Trading related queries, contact our customer service at '[email protected]' and for demat account related queries contact us at
[email protected] or call us on: Toll free numbers 18002099191 / 1860 266 9191
Level 2: If you do not receive a satisfactory response at Level 1 within 3 working days, you may write to us at [email protected] or call us on 022-42858445 and if you feel you are still unheard, write to our customer service HOD at [email protected] or call us on 022-42858208.
Level 3: If you still have not received a satisfactory response at Level 2 within 3 working days, you may contact our Compliance Officer (Mr. Manoj Agarwal) at [email protected] or call on 91- (022) 4285 8484.
Level 4: If you have not received a satisfactory response at Level 3 within 7 working days, you may also approach Managing Director / CEO (Mr. Jaideep Hansraj) at [email protected] or call on 91-(022) 4285 8301.