market sizing segmentation report final redacted vs
TRANSCRIPT

CRE Software Due Diligence Report to GI Partners 1CONFIDENTIAL AND PROPRIETARY
Commercial Real Estate Software Market –
Sizing and Segmentation Report
May 5, 2015
www.frontlinepartners.net www.lionpointgroup.com

CRE Software Due Diligence Report to GI Partners 2CONFIDENTIAL AND PROPRIETARYCRE Software Due Diligence Report to GI Partners 2CONFIDENTIAL AND PROPRIETARYCRE Software Market Sizing & Segmentation Report 2CONFIDENTIAL AND PROPRIETARY
Table of Contents
CRE Software Market Sizing & Segmentation (Top Down Approach) 3
CRE Software Market Sizing (Bottom Up Approach)
Reconciliation with other CRE Market Sizing Estimates14
CRE Software Market Sizing and Segmentation Report

CRE Software Due Diligence Report to GI Partners 3CONFIDENTIAL AND PROPRIETARYCRE Software Due Diligence Report to GI Partners 3CONFIDENTIAL AND PROPRIETARYCRE Software Due Diligence Report to GI Partners 3CONFIDENTIAL AND PROPRIETARY 3Summary of RE Fund Manager Market Validation Interviews CONFIDENTIAL &PROPRIETARYCRE Software Due Diligence Report to GI Partners 3CONFIDENTIAL AND PROPRIETARYCRE Software Due Diligence Report to GI Partners 3CONFIDENTIAL AND PROPRIETARYCRE Software Due Diligence Report to GI Partners 3CONFIDENTIAL AND PROPRIETARY
CRE Software Market Sizing and Segmentation Analysis
(Top Down Approach)

CRE Software Due Diligence Report to GI Partners 4CONFIDENTIAL AND PROPRIETARYCRE Software Due Diligence Report to GI Partners 4CONFIDENTIAL AND PROPRIETARYCRE Software Market Sizing & Segmentation Report 4CONFIDENTIAL AND PROPRIETARY
Real Estate Market Segmentation
ResidentialDevelopment/Construction
Owner/Operators
PropertyServices
InstitutionalInvestment
CorporateReal Estate
Homebuilders
Multi-Family Housing
Senior Housing
Student Housing
Military Housing
Master Plan Communities
Land Development
Commercial Construction
Multi-Family Construction
Specialty
Office
Retail
Industrial
Hospitality
Healthcare
Mixed Use
Property Management
Facility Management
Energy
Telco
Brokerage
Equity Investment
Opportunity Funds
Pension Funds
Debt Investment
Lenders / Banks
I-Banks
Insurance
Retail Users
Large Block
Industrial
Health
Higher Education
Government
Land Owners
Markets
Real Estate Market SegmentationSix key market segments define the real estate industry

CRE Software Due Diligence Report to GI Partners 5CONFIDENTIAL AND PROPRIETARYCRE Software Due Diligence Report to GI Partners 5CONFIDENTIAL AND PROPRIETARYCRE Software Market Sizing & Segmentation Report 5CONFIDENTIAL AND PROPRIETARY
Real Estate Market Segmentation
ResidentialDevelopment/Construction
Owner/Operators
PropertyServices
InstitutionalInvestment
CorporateReal Estate
Homebuilders
Multi-Family Housing
Senior Housing
Student Housing
Military Housing
Master Plan Communities
Land Development
Commercial Construction
Multi-Family Construction
Specialty
Office
Retail
Industrial
Hospitality
Healthcare
Mixed Use
Property Management
Facility Management
Energy
Telco
Brokerage
Equity Investment
Opportunity Funds
Pension Funds
Debt Investment
Lenders / Banks
I-Banks
Insurance
Retail Users
Large Block
Industrial
Health
Higher Education
Government
Land Owners
Markets
Real Estate Market SegmentationWe are predominantly focusing on three key sub-segments: Owner/Operator - Residential (excluding homebuilding), Owner-Operator - Commercial; Institutional Investment – Equity (funds / institutional investors)
Focus of our Report is on these three segments (excluding homebuilding / CRE Lending / Servicing)
CRE Software Due Diligence Report to GI Partners 6CONFIDENTIAL AND PROPRIETARYCRE Software Due Diligence Report to GI Partners 6CONFIDENTIAL AND PROPRIETARYCRE Software Market Sizing & Segmentation Report 6CONFIDENTIAL AND PROPRIETARY
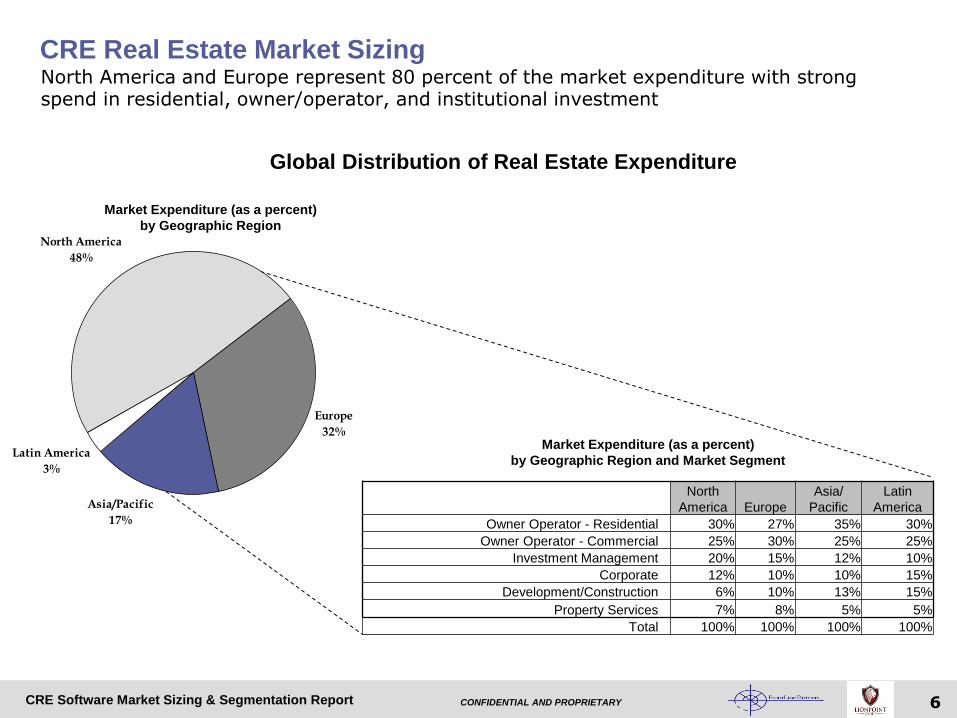
CRE Real Estate Market SizingNorth America and Europe represent 80 percent of the market expenditure with strong spend in residential, owner/operator, and institutional investment
Global Distribution of Real Estate Expenditure
Market Expenditure (as a percent)
by Geographic Region
Market Expenditure (as a percent)
by Geographic Region and Market Segment
North
America Europe
Asia/
Pacific
Latin
America
Owner Operator - Residential 30% 27% 35% 30%
Owner Operator - Commercial 25% 30% 25% 25%
Investment Management 20% 15% 12% 10%
Corporate 12% 10% 10% 15%
Development/Construction 6% 10% 13% 15%
Property Services 7% 8% 5% 5%
Total 100% 100% 100% 100%
North America
48%
Europe
32%
Asia/Pacific
17%
Latin America
3%

CRE Software Due Diligence Report to GI Partners 7CONFIDENTIAL AND PROPRIETARYCRE Software Due Diligence Report to GI Partners 7CONFIDENTIAL AND PROPRIETARYCRE Software Market Sizing & Segmentation Report 7CONFIDENTIAL AND PROPRIETARY
CRE Software Market Sizing / US Spend PotentialIn 2015, an estimated $19.9 billion was spent on software and services in the real estate market with slightly more than half of that spend ($11.1B) occurring in the U.S.
North America
48%
Europe
32%
Asia/Pacific
17%
Latin America
3%
Global Real Estate Technology Expenditure
North America 0.8%
Europe 0.6%
Asia/Pacific 0.5%
Latin America 0.2%
Real Estate Technology Spend
as a Percentage of RevenueReal Estate US Technology Spend
as a Percentage of Revenue
Real Estate Technology Spend
By Geographic Region
Market Segment
2015 TechnologyExpenditure ($,BN)
ExpenditurePropensity (1)
OwnerOperator
(Commercial)$3.18
Institutional Investment(Equity)-(2)
$3.82
Leading Buyer
Leading Buyer
Property Services
$0.81On-timeBuyer
Corporate
Owner Operator
(Residential)
$1.35LaggingBuyer
Development/Construction
$1.39On-Time
Buyer
$0.56LaggingBuyer
(1) Expenditure Propensity used to slope relative technology spend by segment,
(2) Institutional Investment allocated 65% - Equity, 35% Debt/Bonds

CRE Software Due Diligence Report to GI Partners 8CONFIDENTIAL AND PROPRIETARYCRE Software Due Diligence Report to GI Partners 8CONFIDENTIAL AND PROPRIETARYCRE Software Market Sizing & Segmentation Report 8CONFIDENTIAL AND PROPRIETARY
Customer Market SegmentationSelect sub-segments of the institutional investment, owner/operator, and corporate real estate markets are most attracted to real estate ownership, management and investment solution set (s)
Real Estate Market Segmentation Drilldown
Owner/Operator(Resi/Commercial)
Private Public
Corporate
Retail Users Large Block Industrial Health Higher Ed Government Land Owners
Institutional Investment
Lender/Servicer Investor
Debt Derivatives MezzanineFixed Income or Equity Securities
Real Estate
Primary Market
SecondaryMarket
Mortgages BondsLines of Credit
Direct Indirect
CommercialNon-
Commercial
OfficeMulti-FamilyRetail Hospitality Industrial
Residential
Owner/operator

CRE Software Due Diligence Report to GI Partners 9CONFIDENTIAL AND PROPRIETARYCRE Software Due Diligence Report to GI Partners 9CONFIDENTIAL AND PROPRIETARYCRE Software Market Sizing & Segmentation Report 9CONFIDENTIAL AND PROPRIETARY
Market Segmentation DescriptionEach player in the market segment provides unique services to the market place
Market Segmentation Key Functional Description
Primary Market Segmentation
Corporate Real Estate
Owner/ Operator
Institutional Investment
SecondarySegmentation
Lender/ Servicer(Debt)
Investor (Equity)
Private
Public
Build, occupy, and manage buildings to meet specific business requirements
Key Real Estate Market Description
Originate and lends money to real estate investors and developers. Some lenders service
and other sell that right.Invest direct / pooled capital into real estate
through funds or JVs. The capital comes from pension funds, institutional, and private investors.
Invest pooled capital into real estate through the purchase of assets. The capital comes from
private equity and institutional investors.
Invest pooled capital into real estate through the purchase of assets. The capital comes from
public markets and institutional investors.

CRE Software Due Diligence Report to GI Partners 10CONFIDENTIAL AND PROPRIETARYCRE Software Due Diligence Report to GI Partners 10CONFIDENTIAL AND PROPRIETARYCRE Software Market Sizing & Segmentation Report 10CONFIDENTIAL AND PROPRIETARY
Segmentation Trends AnalysisWith the increase in available capital and market recovery, many players are positioning to take advantage of the market recovery / upswing and investors need for alternative investments.
Market SegmentationTrends Analysis
Primary Market Segmentation
Corporate Real Estate
Owner/ Operator
Institutional Investment
SecondarySegmentation
Lender/ Servicer(Debt)
Investor –Direct/ Funds
(Equity)
Private
Public
Large real estate holders becoming targets for acquisition to release capital tied up in
asset base
KeyTrends
Creating more flexible finance vehicles
Dramatic growth in institutional real estate, and fund managers, seeking geographic expansion / cross-border investments
Moving towards a funds management model and getting closer to institutional investors
Mergers of public REITs, geographic expansion, usage of
joint venture funding with institutional investors
NominalGrowth
Growth Trend
NominalGrowth
High Growth
High Growth
Nominal Growth

CRE Software Due Diligence Report to GI Partners 11CONFIDENTIAL AND PROPRIETARYCRE Software Due Diligence Report to GI Partners 11CONFIDENTIAL AND PROPRIETARYCRE Software Market Sizing & Segmentation Report 11CONFIDENTIAL AND PROPRIETARY
Examples of Market PlayersDue to fund / JV ownership structures, a number of large institutional investors (in form of investment
managers / funds, or via direct investments) also play a critical role in the asset and investment/ fund
management functions for the ownership of commercial real estate.
Market Player - Segmentation and Size
Primary Market Segmentation
Corporate Real Estate
Owner/ Operator
Investment Management
SecondarySegmentation
InstitutionalInvestor (Equity)
Private
Public
Wal-Mart, Kroger, Washington Mutual, Safeway, Bank of
America, US Postal Service
Tier 1 Market Player Players
ING, Prudential, TIAA-CREF, Principal Real Estate
Hines REIT, Inc.Behringer Harvard REIT I,
Inc.
Simon Property, ProLogis, Public Storage, General
Growth, Boston Properties, Ventas
Universities, School Districts, State
Government Departments
Tier 2 Market Player Players
AEW Capital, Colony Capital, Apollo Real Estate, Starwood
Capital, Beacon Capital
Dividend Capital Trust, Inc.G REIT, Inc.
St Joe, Camden Property, Essex, BRE Properties,
Brandywine
1000’s of Corporations
Tier 3 Market Player Players
Hart Realty Group, Campbell Group, Rothschild Realty,
TimberVest
Desert Capital REIT, Inc., DiamondRock Hospitality ,
Company
Winthrop, Lodgian, Associated Estates, RedLion Hotels, American Land Lease
Lender / Servicer (Debt)
Wachova, Wells Fargo, Prudential
Guggenheim, Northwestern Mutual, TIAA-CREF
NorthMarq Capital, NCB, PPM Finance

CRE Software Due Diligence Report to GI Partners 12CONFIDENTIAL AND PROPRIETARYCRE Software Due Diligence Report to GI Partners 12CONFIDENTIAL AND PROPRIETARYCRE Software Market Sizing & Segmentation Report 12CONFIDENTIAL AND PROPRIETARY
Opportunity Market Size – US Market IT Spend Potential43% of the total US technology expenditure for CRE software in targeted segments comes from public
REITs, while institutional investment equity investors and private owner/operators collectively comprise an
additional 43% of Target Market in the U.S.
Market Segmentation Sizing – US Applied Example
Primary Market Segmentation
Retail Users, Large Block, Industrial, Health, Higher Education, Government,
Land Owners
Corporate Real Estate
Owner/ Operator
Institutional Investment
SecondarySegmentation
Lender /Servicer (Debt)
Investor (Equity)
Private
Public
Market Players and Magic Targets
Banks, Life Insurance, Finance, CMBS/CDO Issuers, REITS
Opportunity Funds, I-BanksInsurance, Pension Funds
Private REITS, Private Equity, REOCs
Public (Listed) REITS
Percentage of Market
35%
65%
35%
65%
100%
US Market IT Spend Potential
$0.73BN
$1.35BN
$2.45BN
$4.55BN
$1.38BN
$295 $812 $177 ($,BN) 2015 US Market Size
$2.08 $7.00 $1.38 ($,BN) 2015 US IT Spend
Note: Owner Operators include Residential / Commercial;
Broken out as follows:
Residential: $443.1B US Market Size, $3.82B US IT Spend
Commercial: $369.3B US Market Size, $3.19B US IT Spend

CRE Software Due Diligence Report to GI Partners 13CONFIDENTIAL AND PROPRIETARYCRE Software Due Diligence Report to GI Partners 13CONFIDENTIAL AND PROPRIETARYCRE Software Market Sizing & Segmentation Report 13CONFIDENTIAL AND PROPRIETARY
U.S. Market Player Segmentation and SizeThe US markets are relatively concentrated at top two tiers, which accounts for more than 75 percent of the total technology potential spend.
U.S. Market Player - Segmentation and Size
Note: (1) The opportunity fit represents the high value functions for each market player which represents more than 90 percent of the overall functional value, so the technology spend has not been adjusted or weighted.
Primary Market Segmentation
Corporate Real Estate
SecondarySegmentation
Investor –Direct/ Fund
(Equity) -65%
Private – 35%
Public – 65%
Sq FT >10M
Tier 1 Market Player Attributes
>$50BN Invested in Real Estate Assets
>$2BN Invested in Real Estate Assets
Market Cap >$5BN
Sq FT 1M - <10M
Tier 2 Market Player Attributes
$5BN - <$50BN Invested in Real
Estate Assets
$0.5BN - <$2BN Invested in Real Estate
Assets
Market Cap $0.50BN - <$5BN
Sq FT < 1M
Tier 3 Market Player Attributes
< $5BN Invested in Real Estate Assets
< $2BN Invested in Real Estate Assets
Market Cap < $0.50BN
Lender/Servicing (Debt)-35%
Annual Originations> than $5BN
Annual Originations$1BN - > $5BN
Annual Originations< $1BN
Owner/ Operator
InstitutionalInvestment
Primary / Secondary Spend Potential
TIER 1 TOTAL $3.60 BN TIER 2 TOTAL $2.72BN TIER 3 TOTAL $2.03BN
50%
$690
% of Mark’t($MM)
10%
$135
40%
$980
20%
$910
10%
$73
30%
$414
% of Market ($MM)
53%
$715
25%
$613
50%
$2,275
70%
$511
20%
$276
% of Market($MM)
37%
$500
35%
$857
30%
$1,365
20%
$146

CRE Software Due Diligence Report to GI Partners 14CONFIDENTIAL AND PROPRIETARYCRE Software Due Diligence Report to GI Partners 14CONFIDENTIAL AND PROPRIETARYCRE Software Due Diligence Report to GI Partners 14CONFIDENTIAL AND PROPRIETARY 14Summary of RE Fund Manager Market Validation Interviews CONFIDENTIAL &PROPRIETARYCRE Software Due Diligence Report to GI Partners 14CONFIDENTIAL AND PROPRIETARYCRE Software Due Diligence Report to GI Partners 14CONFIDENTIAL AND PROPRIETARYCRE Software Due Diligence Report to GI Partners 14CONFIDENTIAL AND PROPRIETARY
CRE Software Market Sizing and Segmentation Analysis
(Bottoms Up Approach)
• US Commercial Real Estate Inventory – driven off CoStar US inventory

CRE Software Due Diligence Report to GI Partners 15CONFIDENTIAL AND PROPRIETARYCRE Software Due Diligence Report to GI Partners 15CONFIDENTIAL AND PROPRIETARYCRE Software Market Sizing & Segmentation Report 15CONFIDENTIAL AND PROPRIETARY
Market Sizing / Segmentation - US National Office
Breakout by building class (1)
Class A 17,090 3,266,252,671 191,120 12.3% $28.68
Class B 193,114 4,867,596,268 25,206 11.5% $20.26
Class C 293,448 2,333,491,683 7,952 8.0% $16.55
Grand Totals 503,652 10,467,540,622 20,783 10.5% $22.65
Market Segment # Bldgs.Total RBA
(SF)Avg. Bldg. Size
(SF)Vacancy Rate
(%)Avg. Rent/SF/YR
CBD 42,188 2,427,769,004 57,546 10.2% $29.03
Suburban 461,464 8,039,591,618 17,422 11.2% $21.22
Grand Totals 503,652 10,467,340,622 20,783 10.9% $22.65
Market Segment # Bldgs.Total RBA
(SF)Avg. Bldg. Size
(SF)Vacancy Rate
(%)Avg. Rent/SF/YR
US National Office Market – Breakout by CBD vs Suburban
(1) Source: Co Star Group National Office Report – Year End 2014

CRE Software Due Diligence Report to GI Partners 16CONFIDENTIAL AND PROPRIETARYCRE Software Due Diligence Report to GI Partners 16CONFIDENTIAL AND PROPRIETARYCRE Software Market Sizing & Segmentation Report 16CONFIDENTIAL AND PROPRIETARY
Market Sizing and Segmentation - US National Retail Market
Breakout by product type (1)
General Retail 873,991 6,290,193,298 7,197 4.2% $15.83
Mall 1,353 1,092,392,766 807,386 5.7% $16.20
Power Center 1,981 875,333,303 441,864 4.7% $16.48
Shopping Center 93,733 4,225,532,816 45,080 9.3% $14.19
Market Segment #Bldgs.Total RBA
(SF)Avg. Bldg. Size
(SF)Vacancy Rate
(%)Avg. Rent/SF/YR
Specialty Center 426 93,191,643 218,760 6.2% $15.63
Grand Totals 971,484 12,576,643,826 12,946 6.1% $14.90
(1) Source: Costar Group National Retail Report – Year End 2014

CRE Software Due Diligence Report to GI Partners 17CONFIDENTIAL AND PROPRIETARYCRE Software Due Diligence Report to GI Partners 17CONFIDENTIAL AND PROPRIETARYCRE Software Market Sizing & Segmentation Report 17CONFIDENTIAL AND PROPRIETARY
Market Sizing and Segmentation - US National Industrial Market
Flex 90,389 2,268,784,744 25,100 9.9% $11.05
Warehouse 532,757 18,877,445,127 35,433 6.9% $4.80
Grand Totals 623,146 21,146,229,871 33,934 7.2% $5.50
Market Segment #Bldgs.Total RBA
(SF)Avg. Bldg. Size
(SF)Vacancy Rate
(%)Avg. Rent/SF/YR
(1) Source: Costar Group National Industry Report - Year End 2014
Breakout by product type (1)

CRE Software Due Diligence Report to GI Partners 18CONFIDENTIAL AND PROPRIETARYCRE Software Due Diligence Report to GI Partners 18CONFIDENTIAL AND PROPRIETARYCRE Software Market Sizing & Segmentation Report 18CONFIDENTIAL AND PROPRIETARY
IT Spend Potential – US Commercial Real Estate Estimate
Office
Retail
Industry
Total
Market Segment
503,652
971,484
623,146
3,098,282
#Bldgs.
1,467,340,622
12,576,643,826
21,146,229,871
44,190,214,319
Total RBA(SF)
$22.65
$14.90
$5.50
$12.24
Avg Rent/SF/YR
$237,085
$187,392
$116,304
$540,781
Gross Potential Annual Revenues
($MM)
Adjustments (Conservative Reductions)
100% Class C Office 293,448 2,333,491,683 $16.55
100% General Retail 873,991 6,290,193,298 $15.53
Net Potential / Addressable Market - US Commercial Real Estate
< 38,619>
< 99,574>
$ 402,588
Assumed IT Spend (Software Only – US Market) – 0.8% of Revenues $ 3.221 B
Calculated IT Spend (Software Only – US Market) – 0.8% of Revenues
Nominal Difference between two FrontLine approaches (Top Down,
Bottom Up)
$ 3.180 B