market share response when consumers seek variety fred m
TRANSCRIPT
Market Share Response When Consumers Seek Variety
Fred M. Feinberg; Barbara E. Kahn; Leigh McAlister
Journal of Marketing Research, Vol. 29, No. 2. (May, 1992), pp. 227-237.
Stable URL:
http://links.jstor.org/sici?sici=0022-2437%28199205%2929%3A2%3C227%3AMSRWCS%3E2.0.CO%3B2-O
Journal of Marketing Research is currently published by American Marketing Association.
Your use of the JSTOR archive indicates your acceptance of JSTOR's Terms and Conditions of Use, available athttp://www.jstor.org/about/terms.html. JSTOR's Terms and Conditions of Use provides, in part, that unless you have obtainedprior permission, you may not download an entire issue of a journal or multiple copies of articles, and you may use content inthe JSTOR archive only for your personal, non-commercial use.
Please contact the publisher regarding any further use of this work. Publisher contact information may be obtained athttp://www.jstor.org/journals/ama.html.
Each copy of any part of a JSTOR transmission must contain the same copyright notice that appears on the screen or printedpage of such transmission.
JSTOR is an independent not-for-profit organization dedicated to and preserving a digital archive of scholarly journals. Formore information regarding JSTOR, please contact [email protected].
http://www.jstor.orgTue Mar 27 19:34:50 2007

FRED M. FEINBERG, BARBARA E. KAHN, and LEIGH McALISTER*
Using a model of consumer variety-seeking, the authors study the long-term mar- ket share implications of changes in variety-seeking intensity, brand preferences, and pairwise similarities between brands. Those analytically derived guidelines are examined in three-brand and five-brand markets through simulation. The least pre- ferred brand is found generally to gain market share as variety-seeking intensifies whereas the most preferred brand tends to lose share. If two brands are perceived as having become more similar without a change in overall preferences, the re- positioned brands are likely to lose market share while uninvolved brands gain share. If two brands are perceived as having become more similar in a way that increases overall preference for those repositioned brands, they should gain market share while uninvolved brands lose it. A behavioral experiment provides preliminary em-
pirical support for some of the findings.
Market Share Response When Consumers Seek
Variety
In noting that their subjects chose self-reported favor- ite soft drinks only about half the time, Bass, Pessemier, and Lehmann (1972) suggested variety-seeking as an im- portant determinant of consumer behavior. Since that time, research has focused on describing consumer variety-seeking behavior (Jeuland 1978; McAlister 1979, 1982; McAlister and Pessemier 1982; Givon 1984; Lattin 1987; Bawa 1990), on describing product classes in which va- riety-seeking occurs (Kahn, Kalwani, and Momson 1986, 1988), and on describing relationships between brands
*Fred M. Feinberg is Assistant Professor, Fuqua School of Busi- ness, Duke University. Barbara E. Kahn is the Stephen M. Peck Term Associate Professor of Marketing, The Wharton School, University of Pennsylvania. Leigh McAlister is Associate Professor, College of Business Administration, University of Texas, Austin.
The authors thank the Fuqua School Business Associates Fund, the UCLA Academic Senate, The Wharton School Faculty Research Fund, and the University of Texas Business School's Faculty Academic De- velopment and Research Committee for financial support. They also thank Wes Hutchinson, Mike Houston, and two anonymous JMR re-viewers for helpful comments made on previous drafts of the manu- script.
that consumers select for variety (Lattin and McAlister 1985). We move beyond description to start the process of prescribing action for managers. Our approach is to characterize the ways in which market share is likely to respond as managers exert influence on consumer vari- ety-seeking intensity, brand positioning, or brand pref- erences in variety-seeking product classes.
We begin by describing a probabilistic model of con- sumer variety-seeking in which the selection made on the last choice occasion is assumed to influence the se- lection made on the present choice occasion. The model suggests that the pattern of influence is determined by the degree of variety-seeking intensity, brand prefer- ences, and painvise brand similarities. We show ana-lytically the effects of changing those managerially con- trollable variables on market share in a two-brand market. Two-brand findings are extended to multibrand markets through simulation. We further support the analytical findings in a laboratory experiment.
MODELING FRAMEWORK
We begin with Lattin and McAlister's (1985) first-or- der Markov model in which transition probabilities are expressed as functions of variables subject to managerial
Journal of Marketing Research Vol. XXIX (May 1992), 227-37

JOURNAL OF MARKETING RESEARCH, MAY 1992
influence: variety-seeking intensity,' brand preference,2 and brand positioning. We extend their focus on tran- sition probabilities by solving the model for steady-state probabilities. Those steady-state probabilities (which are themselves functions of variety-seeking intensity, brand preference, and brand positioning) are interpreted as ex- pected market shares for a homogeneous population of individuals at a given point in time. By considering ex- pected changes in market share associated with changes in the managerially influenceable variables, one devel- ops insight about the market share impact of such changes in a variety-seeking product class.
Simply stated, Lattin and McAlister's (1985) model holds that selection on one choice occasion affects pref- erences on the next choice occasion. Having just con-sumed a particular bundle of features (i.e., a brand), a variety seeker is less attracted to those features when making the next choice; therefore, brands composed of different features become relatively more desirable.
All analyses refer to a consumer choice set consisting of n brands, denoted {B,). The transition probability, aji, defined as the probability of consuming brand i (B,) di- rectly after the consumption of B, (i.e., reflecting current conditional preference for Bi) is given by
= ( I T ; - VS,,)/( 1 - VS,)
where:
U, = the value to the consumer of BJ's unique fea- tures,
Sv = the value to the consumer of all features shared by brands Bi and B, (by definition, S,, = Sji and S,, = IT,; for notational convenience, define S,, = 2$kj),
nj = the consumer's unconditional preference for B,, representing the total value to that consumer of all features (unique and shared) provided by Bj (without loss of generality, those values are scaled so that C,IT, = 1; by assumption, IT, = U, + Ckf& for any j),
V = a discount factor indicating the variety-seeking intensity of the consumer; 0 5 V 5 1 (if the consumer devalues recently consumed features
'Variety-seeking has been influenced managerially, for example, by a brand's encouragement that consumers switch for a "change of pacen (see Kahn, Kalwani, and Morrison 1988). For example, Neutrogena advertises that consumers take a vacation from their regular brand (to avoid buildup) and use Neutrogena.
'The 'least preferred brand" is the acceptable brand to which the consumer assigns the lowest unconditional preference. Similarly, the 'most preferred brand" is the acceptable brand to which the consumer assigns the most unconditional preference. In discussing the effect of some action on two brands, we use the terms "more preferred brand" and "less preferred brand" to reflect those brands' relative uncondi- tional preference value.
completely, indicating a high desire for variety, then V = 1; if the consumer ignores recently consumed features, i.e., shows zero-order be- havior, then V = O), and
Xj = the expected steady-state market share for B, re- sulting from the Markov model.
The unconditional preference share for Bj, IT,, is dis- tinct from X,, the steady-state market share for B, implied by the first-order Markov choice process. The uncon- ditional preference, IT,, is identical to the probability of choosing B, had no previous selection influenced the cur- rent one (i.e., in the absence of any variety-seeking be-havior, implying V = 0.) The steady-state market share, X,, is a long-run choice probability and reflects the im- pact of both past choices and individual variety-seeking behavior.
In the preceding framework, we assume that no fea- ture is shared by more than two brands, an assumption that allows changes in Sv to be investigated indepen- dently of changes in any other pairwise similarity mea- sure. If it were the case that brands Bl , B,, and B, had a common feature, a change in S,, arising from a change in that common feature would imply a change in S,, and S2, as well; for parsimony in analysis, we avoid that pos- sibility., There is some empirical evidence (Batsell and Polking 1985) suggesting that models considering only pairwise similarity measures can fit data well.
EFFECTS OF MANAGERIAL VARIABLES ON STEADY-STATE MARKET SHARES
We focus on the ways in which variety-seeking inten- sity (V), brand preferences (IT,), and brand positioning (So and U,) might affect steady-state market shares (X,). Our approach is to develop a closed-form expression for the steady-state market share in the Lattin-McAlister model, examining the derivatives of that expression with respect to V, U,, and Sv. As V does not represent a brand feature, studying changes in V is relatively straightfor- ward in that it involves no rescaling of the model's other parameters. Investigating the other derivatives, how- ever, is more subtle, as one must precisely specify how changes in unique features or interbrand similarity can effect changes in other feature-parameters. Specifically, as mentioned in the definition of the {q),feature values are scaled so that unconditional preferences sum to one. Hence, any change in the value of one feature will re- quire that the values of other features also be changed so that the unconditional preferences resulting from those rescaled values still sum to one.
'This assumption could be relaxed by specifying a mapping be-tween features and {S,,}. Implications of repositioning then would be investigated by considering the derivative of steady-state market shares with respect to a feature value, rather than with respect to S,,. Though such maps and derivatives can be formulated, their added complexity so obscures the intuition sought that their investigation is left for fu- ture research.

MARKET SHARE RESPONSE
In considering a pure4 preference change (dX,/aUj), we assume that a change in the value of a brand's unique feature is counterbalanced by an opposite change in the value of all other features (that brand's shared features and all features of all other brands). In particular, anal- ogous to the effects of changes in utility on choice prob- abilities in Luce's (1959) model derived from his choice axiom, we assume that other features share in this op- posite change in proportion to their value. Such a change might be brought about by a brand's advertising empha- sizing either a truly new feature or one that is unique to it, perhaps as Listerine did when it chose the ad slogan "Listerine Kills Germs"; such a campaign focuses atten- tion on one of the brand's unique features without ex- plicitly encouraging variety-seeking in and of itself. In considering a pure repositioning change (aX,/aS,, with n 's constant), we assume that the change in the value of S,, is completely compensated for by changes in Ui and U,. This type of repositioning might occur if con- sumers' inability to distinguish between Coke and Pepsi in a blind taste test leads consumers to view Coke and Pepsi as more similar without changing underlying pref- erences for those two brands. Finally, we consider con- current preference change and repositioning (aX,/aS,). In that case, the change in the value of the shared feature Sij is absorbed proportionally by all other features. This type of repositioning might come about, for example, with a change in season. Preference for coffee's and tea's attribute "warmth" may increase in winter months, mak- ing the two beverages both more attractive and more similar.
Being a discrete-time market share model, the Lattin- McAlister model specifies market shares on a period-by- period basis; the original Lattin-McAlister article fo- cused on the transition probabilities {a,,) necessary to specify such changes. Steady-state solutions allow as-sessment of long-run strategic effects once transients have subsided; because Markov models tend to converge geo- metrically to their steady state,5 these transients fade quickly. That being the case, we here analyze steady- state solutions.
Specifying transition probabilities, as in equation 1, allows explicit solution for steady-state market shares. This solution is presented in the Appendix for choice sets with an arbitrary number of brands. Because the linear algebra involved in the general solution overshadows the
4Though we refer to dX,/dU, as a "pure preference change," some second-order repositioning may be involved. According to Tversky (1977), the similarity of two brands may be driven by their relative overall prominence as well as by the value of their shared features. In that case, an increase in the value of U, would make the brand seem less similar to all other brands. We assume that this second- order effect on similarity is negligible.
'We measured this convergence for the simulation presented sub- sequently. The difference between equilibrium share and share esti- mated on a given iteration decreased on average by 41% with each iteration.
model's implications, we begin by considering a two- brand choice set. In an attempt to extend the results from the two-brand choice set to larger choice sets, we apply the precise solution of the model as given in the Ap- pendix to a simulation study, using a wide range of pa- rameter values for a three-brand and for a five-brand choice set.
TWO-BRAND CASE
In this section, we examine the implications of seek- ing variety between two brands. Though the structure of such a model may appear simple, many implications for choice sets of arbitrary size are foreshadowed. Given two brands B, and B, with transition probabilities ajias de-fined previously, we solve for the steady-state choice probability for Bi (see Cinlar 1975). The probabilistic definition of the model parameters implies
To understand how changes in managerially influ-enceable variables affect market share, we need to com- pute aX,/aV, aX,/aU,, aX,/aS,, with n's constant (pure repositioning), and aX,/aSi,. Given the functional form of X,, it happens that
is a divisor of all such derivatives in the two-brand case. Because f (-) is always positive, we simplify notation by including its contribution to the signs of these derivatives peripherally. Also, for expositional simplicity, we as- sume throughout that the brands are numbered in de- scending order of preference share (e.g., n12 n,).
Changing Variety-Seeking Intensity
Through investigating the market share implications of changing V, we are essentially asking whether a brand ought to try to intensify or dampen a consumer's desire for variety. The change in the less preferred brand's market share brought about by changing V, aX,/aV, is given by
Because (n2 - IT,)5 0 and (1 - v2s12)r (1 - VS,,) 2 (1 - VS,,),, aX,/aV will be positive whenever S12 < n1n2. That is, no matter what the current level of vari- ety-seeking intensity, if the less preferred brand derives less than a proportional amount of its value from shared features, it will definitely be helped by variety seeking.6 In situations with intense variety-seeking (i.e., V near l) , the less preferred brand can derive almost all of its value from shared features (i.e., S12 near IT,) and still
6By saying B, derives less than a proportional amount of its value from features shared with B,, we mean that B, derives less than m2 of its value from features shared with B2, or SI2 < rIm2.
expect to benefit from increasing variety-seeking inten- sity. In this two-brand case, we can infer that the more preferred of the brands will generally lose market share as variety-seeking intensifies. Analogous implications were drawn by Givon (1984) from a model simpler than the Lattin-McAlister model, ignoring similarity among brands.
Changing Preferences
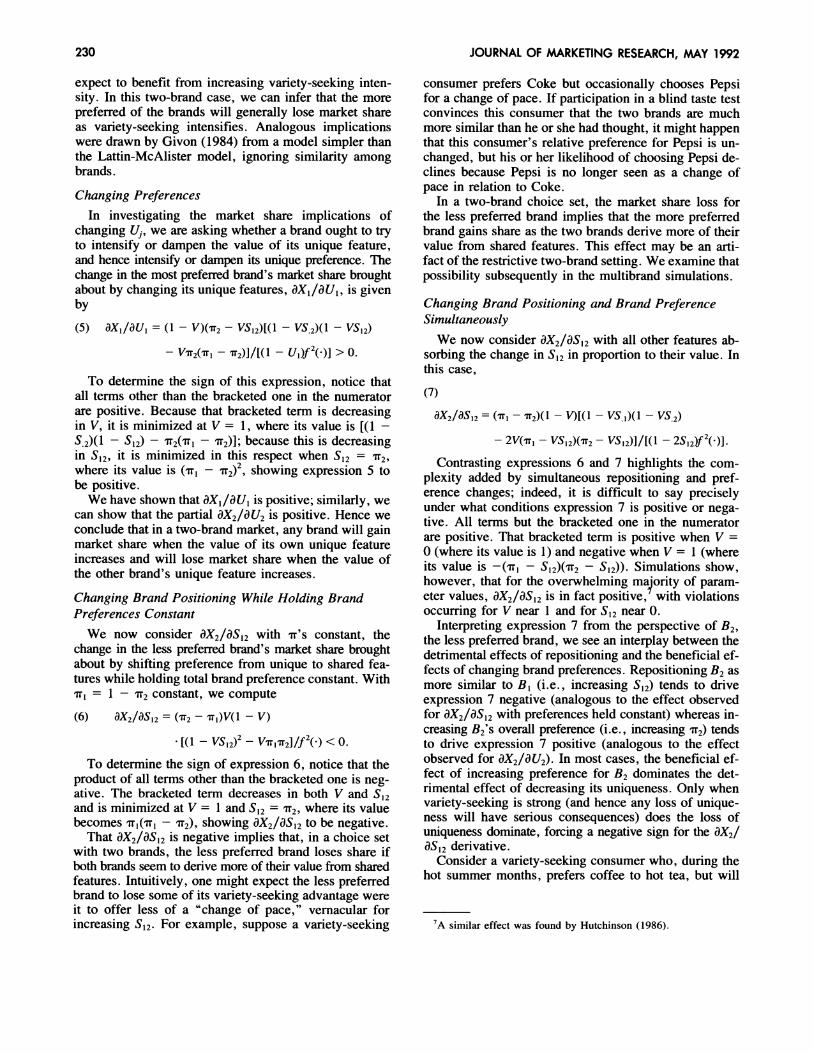
In investigating the market share implications of changing Uj, we are asking whether a brand ought to try to intensify or dampen the value of its unique feature, and hence intensify or dampen its unique preference. The change in the most preferred brand's market share brought about by changing its unique features, dXl/dU,, is given by
( 5 ) axl/au,= (1 - V)(.rr~- VS12)[(1- VS.,)(l - VS12)
To determine the sign of this expression, notice that all terms other than the bracketed one in the numerator are positive. Because that bracketed term is decreasing in V, it is minimized at V = 1, where its value is [(I -S.,)(l - S12)- IT,(IT,- IT,)]; because this is decreasing in SI2, it is minimized in this respect when S12 = IT,, where its value is (IT, - IT,),, showing expression 5 to be positive.
We have shown that aX,/aU, is positive; similarly, we can show that the partial dX2/dU2 is positive. Hence we conclude that in a two-brand market, any brand will gain market share when the value of its own unique feature increases and will lose market share when the value of the other brand's unique feature increases.
Changing Brand Positioning While Holding Brand Preferences Constant
We now consider aX,/aS,, with IT'S constant, the change in the less preferred brand's market share brought about by shifting preference from unique to shared fea- tures while holding total brand preference constant. With IT^ = 1 - IT, constant, we compute
To determine the sign of expression 6, notice that the product of all terms other than the bracketed one is neg- ative. The bracketed term decreases in both V and S,, and is minimized at V = 1 and S12 = IT,, where its value becomes IT,(IT, - IT,), showing aX,/aS,, to be negative.
That aX,/dS,, is negative implies that, in a choice set with two brands, the less preferred brand loses share if both brands seem to derive more of their value from shared features. Intuitively, one might expect the less preferred brand to lose some of its variety-seeking advantage were it to offer less of a "change of pace," vernacular for increasing S,,. For example, suppose a variety-seeking
JOURNAL OF MARKETING RESEARCH, MAY 1992
consumer prefers Coke but occasionally chooses Pepsi for a change of pace. If participation in a blind taste test convinces this consumer that the two brands are much more similar than he or she had thought, it might happen that this consumer's relative preference for Pepsi is un- changed, but his or her likelihood of choosing Pepsi de- clines because Pepsi is no longer seen as a change of pace in relation to Coke.
In a two-brand choice set, the market share loss for the less preferred brand implies that the more preferred brand gains share as the two brands derive more of their value from shared features. This effect may be an arti- fact of the restrictive two-brand setting. We examine that possibility subsequently in the multibrand simulations.
Changing Brand Positioning and Brand Preference Simultaneously
We now consider aX,/aS,, with all other features ab- sorbing the change in S,, in proportion to their value. In this case,
Contrasting expressions 6 and 7 highlights the com- plexity added by simultaneous repositioning and pref- erence changes; indeed, it is difficult to say precisely under what conditions expression 7 is positive or nega- tive. All terms but the bracketed one in the numerator are positive. That bracketed term is positive when V = 0 (where its value is 1) and negative when V = 1 (where its value is -(nl - S12)(7r2- S12)). Simulations show, however, that for the overwhelming ma'ority of param- eter values, dX2/BS12 is in fact positive) with violations occurring for V near 1 and for S,, near 0.
Interpreting expression 7 from the perspective of B,, the less preferred brand, we see an interplay between the detrimental effects of repositioning and the beneficial ef- fects of changing brand preferences. Repositioning B, as more similar to B, (i.e., increasing S,,) tends to drive expression 7 negative (analogous to the effect observed for aX,/dS,, with preferences held constant) whereas in- creasing B2's overall preference (i.e., increasing IT,) tends to drive expression 7 positive (analogous to the effect observed for aX2/aU2). In most cases, the beneficial ef- fect of increasing preference for B, dominates the det- rimental effect of decreasing its uniqueness. Only when variety-seeking is strong (and hence any loss of unique- ness will have serious consequences) does the loss of uniqueness dominate, forcing a negative sign for the ax2/ as,,derivative.
Consider a variety-seeking consumer who, during the hot summer months, prefers coffee to hot tea, but will
'A similar effect was found by Hutchinson (1986).

MARKET SHARE RESPONSE
occasionally drink hot tea as a change of pace. During bitterly cold winter months, the value the consumer places on having a warming drink may increase dramatically, increasing the consumer's relative preference for hot tea. If so, we would expect choice share for hot tea to in- crease.
The typically positive sign for aX,/aS,, dictates a typ- ically negative sign for aX,/dS,,. However, were there other uninvolved brands to donate share to both B , and B,, it might happen that the more preferred brand would also gain share as the value of a shared feature increased. We examine that possibility subsequently in the multi- brand simulations.
Summary
For the case in which there are only two relevant brands, we find that, as variety-seeking intensifies, the less pre- ferred brand generally gains share from the more pre- ferred brand. Increasing the value of a shared feature will hurt the less preferred brand if preferences are held constant but it will tend to help the less preferred brand if that brand's relative preference increases. Finally, in- creasing the value of a brand's unique feature always benefits that brand.
MORE THAN TWO BRANDS
Introducing a third brand into the analysis allows an important step toward generality by making it possible to study how a change in two brands' similarity affects a third, uninvolved brand. However, introducing the third brand tends to complicate the analysis. In the Appendix, we solve for steady-state market shares in the general n-brand case and present closed-form solutions for the derivatives of interest (aX/dV, aX/dU,, dX/aS, with preferences held constant, dX/dS,). Unfortunately, those solutions are less amenable to analytical interpretation than their two-brand counterparts. We therefore use sim- ulation techniques to explore the model's implications.
Simulation
The signs of market share derivatives in the two-brand case can serve as benchmarks in predicting the analo- gous signs for markets with more brands. To determine the extent to which predictions garnered from the two- brand analysis fail to hold as more brands are consid- ered, we simulate both a three-brand and a five-brand choice set. For each choice set, feature values are se- lected randomly and all Uiand Sij are scaled so that brand preferences sum to one. The S,'s are free parameters for distinct i and j (Sii is always ni), constrained only in that 0 5 Sjj5 min{n,, IT,} and Ek,,S,, 5 T,.Because no one scheme for choosing {S,) could amply exemplify the range of possibilities afforded by including interbrand similarity in the model, we use three different similarity conditions, each describing a way in which the brands in a particular type of market might relate to one an- other.
No similarity S , = 0 Similarity proportional to
preference s ,= a,aJ Similarities selected randomly S, E (0, min{a,, a,))
The first scenario mirrors markets in which each brand is seen as essentially unique from the others. The second scenario, motivated by the critical S,, = IT,IT, condition in the two-brand case, describes what might be termed "average overlap," where interbrand similarity is pro- portional to brand preference. The third scenario, which defines the Sg terms randomly,' is where one might es- pecially anticipate exceptions to systematic trends ap- parent in the other similarity conditions.
We try to answer the following questions through sim- ulation: As variety-seeking intensifies, what can be ex- pected to happen to the least and most preferred brands (dX,/aV and aX,/aV, where brands are numbered in de- creasing order of preference share, i.e., IT, r IT,r . . . 2 IT,)? If two brands are repositioned with no preference change, what will happen to those brands (aXi/dS, and dX,/aS,, with IT'S constant) and to an uninvolved brand (dXk/aSij with IT'S constant)? Finally, if two brands are repositioned and preferences change, what will happen to the involved brands (aX,/aS, and aXj/aSij) and to an uninvolved brand (aX,/aS,)?
To address those issues, we simulated 10,000 cases within each of the three simulation scenarios for the three-brand case and 10,000 within each scenario for the five- brand case. A value for V was selected randomly for each run, and the precise solutions for steady-state mar- ket shares and for the necessary derivatives (given in the Appendix) were calculated. That procedure allowed cal- culation of the proportion of times a brand was affected by any of the four parametric changes discussed previ- ously as predicted by the two-brand case. Table 1 sum-marizes these results.
Each entry in Table 1 signifies the proportion of times the statement defined by the row is true for the condition defined by the column.' For example, the .7109 in the third column of the fifth row signifies that in approxi-
'Generation of the a, and S,, parameters used in a single round of the random similarities simulation began with an n-by-n uniformly distributed random matrix. This matrix was added to its transpose to ensure symmetry. Were diagonal entries then replaced by row sums and taken as proportional to brand preference values, this procedure would offer insufficient variation in the values of the resulting a,'s; elements of the symmetric matrix were therefore first taken to the power 2n to amplify variability. Diagonal entries were then replaced by row sums and the entire matrix rescaled by dividing by the sum of those diagonal entries. Thus, off-diagonal entries represent the val- ues of shared features (S,,)and diagonal entries represent the values of brand preferences (a,), with all appropriate summation constraints satisfied.
'For statements 2 through 4, each of which makes claims about the signs of several derivatives simultaneously, the listed numbers rep- resent averages across all relevant derivatives (e.g., for statement 3b, there are three such derivatives for n = 3 and 10 for n = 5). Post-analysis shows that the simulation covered the parameter space well (U,, S,], V), seven parameters for n = 3 and 16 for n = 5 .

232 JOURNAL OF MARKETING RESEARCH, MAY 1992
Table 1 SIMULATION RESULTS: PROPORTIONS OF CASES IN WHICH STATEMENT SUGGESTED BY THE TWO-BRAND ANALYSIS
WAS CORRECT FOR THREE BRANDS AND FOR FIVE BRANDS (10,000 PER CELL)
Similarin,
None Proportional Random
Statement lsuaaested bv two-brand analvsis) 3-brand 5-brand 3-brand 5-brand 3-brand 5-brand
1 . Increasing variety-seeking intensity a. Helps the least preferred brand b. Hurts the most preferred brand
2. Increasing a brand's unique features helps that brand 3. If two brands begin to share more features (with
preferences held constant), sharing a. Hurts less preferred brand b. Helps more preferred brand c . Helps uninvolved brand
4. If two brands begin to share more features (with preferences changing), sharing a. Helps less preferred brand b. Hurts more preferred brand c . Hurts uninvolved brand
mately 71% of the simulated cases in which three brands seems to be a particularly strong determinant. Table 1 were specified as being proportionally similar to one an- indicates that statement 3b, that the more preferred brand other (Sij = nirj), the more preferred of the two feature- is helped by sharing more features (no preference change), sharing brands had an increase in market share when it is largely variable. Examining the results from the sim- began to derive even more if its value from that shared ulation, we find that this statement tends to be true when feature. V is low, when there is a large preference differential
In general we see that the statements suggested by the between the two brands, and when there is substantial two-brand analysis hold up very well for different pat- overlap between the two brands. Because it is more dif- terns of interbrand similarity and for larger choice sets. ficult to gain a significant preference advantage when The most nearly equivocal statements are those about the preference is spread over numerous brands, the state- more preferred of two feature-sharing brands. This find- ment is less likely to hold in markets with a larger num- ing makes sense when we consider that a more preferred ber of brands, an observation supported by comparing brand in a five-brand choice set may actually have a the three-brand to the five-brand results. The very few smaller unconditional preference value than a less pre- cases in which statements 3a and 3c were violated in- ferred brand in a two- or three-brand choice set. In es- volved minuscule effects, arising from three-brand mar- sence, as choice sets become larger, all brands can be- kets in which the most preferred brand had all but sub- have like less preferred brands. sumed both less preferred brands.
Looking more closely at the table, we see that only The statement most sensitive to the number of brands statement 2 (that any brand benefits from an increase in in the market is 4b, that the more preferred brand is hurt its unique features) proves true across the board. The by sharing more features (with preferences changing). other results (particularly in the "nonen and "propor- Though it was the case that, with two brands, the more tional" conditions), though broadly consistent with their preferred brand was likely to be hurt by such increased more "black and white" two-brand analogues, highlight sharing, one might reason that, because both of the brands the inability to offer direct proof of signs of key deriv- involved have a preference increase, both the less pre- atives as one considers larger choice sets. The simulation ferred and the more preferred brand would benefit. In does, however, allow the examination and classification the simulation, the statement tends to hold when there of violations of the two-brand results to provide deeper is rather strong variety-seeking (V near 1) and when there insights into the phenomena in question. is a small preference differential between the brands. As
Statements l a and lb (variety-seeking helps less pre- one moves from a three-brand to a five-brand market, ferred brands and hurts more preferred ones) hold true the shrinking of preference differentials implies that the fairly consistently, even in the "randomn similarity con- most preferred brand is less likely to be penalized, and dition. Violations occur predominantly when S,j exceeds so may benefit from increased preference for shared fea- 'Ki'Kj. tures; again, this effect is borne out by comparing three-
Violations are more frequent for the third and fourth brand and five-brand results. Finally, statements 4a and statements, where the impact of interbrand similarity 4c are verified for the vast majority of cases, the few

MARKET SHARE RESPONSE
exceptions being when V is near 1, when there is a small preference differential between the two repositioning brands, and when the two brands share few features.
It is instructive to compare the results for three brands with those for five brands. Variations in the proportion of time a statement was correct are found primarily for statements 3b and 4b. Such variations can be explained when one considers that, for two brands, the listed state- ments always hold or nearly always hold. Moving to three brands, and then to five, we see that the average pref- erence of brands in the choice set decreases, from 1/2 to 1 /3 to 1 /5. Thus, if one randomly chooses two brands to test whether a particular statement holds, those two brands are both more likely to exhibit behavior expected of less preferred brands. This explains why statements 3b and 4b, which make claims about the fate of more preferred brands based on how they fare in a two-brand choice set, are ever more strongly violated as one con- siders larger choice sets.'' It appears, then, that whether the more preferred of two interacting brands suffers the same fate as the less preferred has less to do with the fact that it is the more preferred per se than it does with how large its preference is in relation to that of other brands in the choice set.
Summary
Analysis of the simulation data in the three-brand and five-brand cases is largely consistent with the analytical findings in the two-brand case. In particular, as before, we find that increased variety-seeking generally helps the least preferred brand and hurts the most preferred brand. Further, increasing the value of a brand's unique feature always helps that brand. Differences from the two-brand case emerge when we consider the effects of reposition- ing. As we move toward the five-brand case, the pre- dicted more preferred brand effects cease to hold. We suggest that this change occurs because, as choice sets become large, any brand can behave like less preferred brands. The implication is that for reasonably large choice sets, increased similarity hurts the repositioned brands if there is no concomitant preference change, but helps re- positioned brands if the increased similarity occurs along with an increased preference for repositioned brands.
Extending the examples presented previously, we could illustrate repositioning with no preference change by suggesting that Coke's and Pepsi's unchanged prefer- ences but increased similarity resulting from being found indistinguishable in a blind taste test might drive down choice share for both Coke and Pepsi, while increasing choice share for distinctive 7-Up. However, the increase in similarity between coffee and hot tea, driven by the
''Such distributional arguments help explain why statements 3a and 3c, which were violated in the three-brand case, were not violated in the five-brand case; no doubt more simulation would eventually have turned up such violations, as a three-brand choice set is but a restricted example of a five-brand one in which the two least preferred brands have negligible preference.
increased preference for warm drinks in bitterly cold months, might drive up choice share for both of those hot beverages at the expense of chilled drinks.
These findings refer to expected changes in market share across a homogeneous population of individuals. In the next section, a preliminary empirical examination of the results, we use the findings as hypotheses for the be- havior of a market as a whole. It is true that, if con-sumers have different r-distributions, the expected mar- ket shares calculated in the aggregate may not equal the aggregate of homogeneous segment-level expected mar- ket shares. However, Momson, Massy, and Silverman (1971) show that when individual consumers' behaviors are in equilibrium, the two measures of expected aggre- gate share are equal. Furthermore, they also show that even when individuals' behaviors are not in equilibrium, the two measures are very close. Given those findings and given that differences between the two measures of expected aggregate share bias against our hypotheses, we offer a test of our findings at the aggregate level.
AN EXPERIMENT
As a test of our analytical findings, we designed a between-subjects interactive computer experiment in which subjects chose among three hypothetical brands of shampoo, each described by its attributes (cf. Kahn and Louie 1990). Two factors were manipulated, brand- switching motivation and perceptions of interbrand sim- ilarity. Crossing two levels of switching motivation (variety-seeking and zero-order behaviors) with two sim- ilarity configurations yields four experimental cells. The subjects, approximately eight per cell, completed the ex- periment as part of a class assignment.
Method
The experiment had four phases. Several weeks prior to the rest of the experiment, subjects were asked to fill out a questionnaire on brand-switching behavior and re- sponse to promotions for several product categories. Re- sponses guided the assignment of subjects to the variety- seeking and zero-order cells.
The last three phases of data collection occurred dur- ing a single sitting. In the first of these phases, subjects were given general instructions, a supposed "Research Report from Harvard University" (to encourage the brand- switching manipulation), and descriptions of three brands of shampoo (to encourage the similarity configuration manipulation). To finish this phase, subjects were pre- sented "Consumer Reports" evaluations of brands to en- courage preference homogeneity and then asked to in- dicate their personal preference for each brand by assigning a number from 1 to 100.
In the second of these three phases, subjects were asked to make a series of choices among the three brands. In the last phase, subjects answered questions about sham- poo use and indicated their beliefs about residue buildup and brand dissimilarity.

JOURNAL OF MARKETING RESEARCH, MAY 1992
The brand-switching motivation embedded in the "Re- search Reportn was designed to reinforce self-reported variety-seeking tendencies. Subjects assigned to the va- riety-seeking cells were told that recent research con-firmed that using the same shampoo over and over leaves a residue buildup on the hair follicle that could be avoided by switching among shampoos. Subjects assigned to the zero-order cells were told that recent research disproved the buildup theory and that choices therefore should be made on each occasion independently from past history.
The similarity configuration manipulation attempted to position B, and B, as sharing more features in one condition than in the other. That was done by holding the attribute descriptions of B, and B, constant across the two conditions while changing the descriptions of B, so that it shared no features with either B, or B, in one con- dition but did share some features with Bl in the other condition."
Subjects made 40 choices. Distraction tasks separated some choice occasions and brands were randomly reor- dered after each choice. The subjects were told that the shampoos were available in one-use-size containers and that only one could be chosen at a time to control for inventory effects.
Hypotheses
Using the experimental data, we tested findings about the impact of variety-seeking intensity and pure reposi- tioning (without preference changes) suggested by the model.
HI: Increasing variety-seeking intensity (a) helps the least preferred brand and (b) hurts the most preferred brand.
HS: Holding preferences constant, if two brands begin to share more features, (a) the less preferred of the two is hurt, (b) the more preferred of the two is helped, and (c) the uninvolved brand is helped.
Note that HI, and HI, suggest a main effect for brand- switching motivation. B, should have a higher market share among variety-seekers than among zero-order sub- jects. The opposite should hold for Bl . H,,, H,,, and H,, suggest interactions between brand-switching motivation and similarity configuration. l 2
Manipulation Checks
The effectiveness of the brand-switching motivation is demonstrated in the fact that the variety-seekers report believing more strongly that buildup of shampoo residue
"The brands' actual attribute descriptions and other details of the ex rimental manipulations are available from the authors.
'We must examine interactions to test the hypotheses because the similarity configuration manipulation may affect choice shares for subjects independently of the hypothesized variety-seeking effect (e.g., Huber, Payne, and Puto 1982; Tversky and Sattath 1979). To control for these non-variety-seeking effects, we contrast the difference in choice shares across similarity configurations for the zero-order sub- jects with the difference in choice shares across similarity configu- rations for the variety-seeking subjects.
increases with repeated use of the same shampoo ( p < .05). Variety-seekers also switch more often ( p < .01) and have shorter runs than do zero-order subjects ( p < .05). Finally, the average value of the Lattin and McAlister (1985) variety-seeking parameter is larger among vari- ety-seekers than among zero-order subjects ( p < .01).
To test the similarity configuration manipulation, we checked that B, and B, were seen as more dissimilar in the configuration designed for them to be more similar ( p < .001). Finally, critical for this test of pure repo- sitioning, we found no significant differences among preferences across experimental cells.
Results
We found that, across all subjects, the average pref- erence score was 78 for B,, 73 for B,, and 69 for B,. H,,, then, states that the least preferred brand, B,, will have a larger choice share among the variety-seeking group than among the zero-order group, whereas HI, makes the opposite claim about the most preferred brand, B,. Both predictions are borne out at the .001 level as shown in the first three rows of Table 2.
H,, (less preferred brand hurt by sharing) suggests that B2's loss in choice share in moving from sharing no fea- tures to sharing some features should be more negative among variety-seekers than among zero-order subjects. The last seven rows of Table 2 show that this expectation holds at the .001 level. H,, (more preferred brand helped by sharing) suggests that Bl's gain in choice share in moving from sharing no features to sharing some fea- tures should be more positive among variety-seekers than among zero-order subjects. The last seven rows of Table 2 show that this expectation does not hold. The effect goes in the wrong direction but is not significant. Fi- nally, H,, (other brands sharing more features is better) suggests that B,'s gain in choice share in moving from the configuration in which B, and B, share no features to the configuration in which they share some features should be more positive among variety-seekers than among zero-order subjects. The last seven rows of Table 2 show that this expectation does hold at the .001 level.
In summary, analysis of market share shifts across brand-switching motivation groups provides strong evi- dence that less preferred brands are helped and more pre- ferred brands are hurt by variety-seeking. Additionally, interaction effects suggest that, when preferences are held constant, the less preferred brand of two feature-sharing brands is hurt when shared features increase, whereas the uninvolved brand is helped. l3
"We do not find that the more preferred of the two feature-sharing brands is helped when shared features increase. Given that the sim- ulation suggested that such a brand would be helped only in cases in which it had a large preference advantage, this is not surprising. B,'s average preference rating was 78 and B2's was 73. We conjecture that this preference advantage was not sufficient to allow B, to benefit from the increase in shared features.

MARKET SHARE RESPONSE
Table 2 OBSERVED MARKET SHARES IN DIFFERENT EXPERIMENTAL CELLS
B, Main effects: whole sample
Zero-order subjects .56 Variety-seeking subjects .38 Significance of difference p < ,001
Interactions Zero-order subjects
B, and B, share no features .54 B, and B, share some features .58 Change .04
Variety-seeking subjects B, and B, share no features .38 B, and B, share some features .38 Change 0
Significance of interaction p > .33
SUMMARY, CONCLUSIONS, AND DIRECTIONS FOR FUTURE RESEARCH
The focus of our article is the development of guide- lines for managerial action in a variety-seeking product class. We begin with a first-order Markov model of con- sumer variety-seeking behavior and solve it for steady- state probabilities. Interpreting those probabilities as ex- pected market shares, we consider the way those shares might be affected as certain variables under managerial influence are changed. We find, perhaps unsurprisingly, that increasing the unique features of a brand and thus increasing that brand's preference increases its market share. This result suggests that market share will in- crease if a brand can successfully communicate that it has a preferred unique feature-for example, "Listerine Kills Germsn or "Charmin is Squeezably Soft."
More interestingly, we find that increasing con-sumers' desire for variety is likely to increase the market share of the least preferred brand and decrease the mar- ket share of most preferred one. This finding suggests that a less preferred brand should encourage consumers to switch for a change of pace, perhaps as in Neutro- gena's campaign advising consumers to "take a vacation from their regular shampoo."
In addition, if brand preferences are held constant, re- positioning a brand to appear more similar to some other brand is likely to lead to a loss in market share for re- positioned brands and a gain in market share for unin- volved brands. An example might be Coke's and Pepsi's loss of market share to 7-Up caused by Coke and Pepsi being indistinguishable in a blind taste test.14
When brand preferences change during repositioning, the findings reverse. In colder climates and colder sea- sons the desirability of the warmth provided by coffee
14Another example might be 7-Up's positioning itself as the 'un- cola." In that strategy, 7-Up is positioning itself as the uninvolved brand and is attempting to make its competitors, Pepsi and Coke, appear more similar.
B, B,
.29 .15
.29 .34 n.s. p < .001
.20 .26
.34 .08
.14 -.21
.31 .31
.26 .36 -.05 .05
p < ,001 p < .001
and hot tea will make those drinks both more similar and more desirable than they would be in warmer climates and warmer seasons.
To tailor the guidelines developed here into a partic- ular market strategy requires that one consider the costs associated with influencing the market parameters (va- riety-seeking intensity, brand positioning, and brand preferences). Further, one would need to specify the par- ticular way in which one planned to influence market parameters. In practice, an advertising campaign in-tended to manipulate a single such parameter might in- duce an unwanted or detrimental second-order effect. For instance, a campaign advocating that consumers actively seek out variety might cause consumers, in the process, to reexamine their perceptions of how unique the ad- vertised brand really is in relation to its competitors, or to focus on desirable attributes the advertised brand lacks. Though we do not attempt any parallel development of advertising themes, product reformulations, or distribu- tion channels (etc.), we acknowledge that such a detailed specification is critical to achieving the predicted changes in market shares. We pose this question of implemen- tation as a direction for future research.
Neither do we consider the question of likely com-petitive response. However, as our model does account for the effects of altering one brand's strategy on all other brands, it might be nested into a larger, game-theoretic model to consider the competitive ramifications of such effects. Finally, more empirical verification of the im- plications is warranted. We present some preliminary findings of a laboratory experiment that confirm the va- riety-seeking intensity and pure repositioning implica- tions, but clearly real-world empirical verification would be useful.
"Another example might be diet soft drinks pointing out that they are sweetened with NutraSweet. That type of advertising serves not only to make diet soft drinks appear more similar, but also increases preference for those brands.

JOURNAL OF MARKETING RESEARCH, MAY 1992
Since Bass, Pessemier, and Lehmann (1972) called at- tention to consumer variety-seeking behavior, many studies have been devoted to describing consumers who seek variety, product classes in which variety is sought, and relationships among brands chosen for variety. With its limitations noted, we offer our methodology as taking a step beyond description toward prescribing managerial action.
APPENDIX
Calculating Steady-State Market Shares
Given A = [a,,] for 1 5 {i j} 5 n and aji = (ni - VSil)/l - VS,), we have the standard Markov formulation, X = XA, where X is the row vector of steady-state probabilities (market shares). This gives way to the redundant system 0 = X(A -I),which can be made invertible by realizing that market shares must sum to one. This gives the system (see Cinlar 1975)
(Al) XA* = e, = ( 0 0 . . . 0 l ) ,
where A* is just (A - I) with its last column replaced by ones. The solution to equation A1 is therefore given by:
Calculating Derivatives of Steady-State Market Shares
To calculate the derivative of [XI with respect to any model parameter, we compute aX/aq for q = V, St,, or U,. As XA* = en, we can take derivatives as follows:
Solving for aX/aq, we obtain
We see that, to calculate aX/aq for any model parameter of interest, the only information needed beyond the matrix A* is aA*/aq, easily assembled from the elements a(a,,)/aq.
Changing V
We merely need the individual entries a(a,,)/aV:
Changing Preferences
We need only calculate a(a,,)/aU,, as there is no preferred numbering scheme for the brands, and no generality is lost by differentiating with respect to U, (as opposed to U, for any k). Following the rescaling rule that a change in the value of a brand's unique feature is counterbalanced by an opposite change in the value of all other features (that brand's shared features and all features of all other brands), we note that increasing the value of U, requires that each of the other features be re- scaled; we opt to do this rescaling so that the ratio of a rescaled feature's old value to its new value is constant. Recalling that
the n,'s are constrained to sum to 1, we have that for q other than U,, aq/aU, = -q/(1 - U,), whereas aU,/aU, = 1. This allows us to compute the required matrix elements:
-aj,/(l - VS,)(l - U,) for i > 1, j > 1 (1 - aIi)/(l - VS,.)(l - U,) for i = 1, j > 1
-aji(l - V)/(1 - VS,)(l - U,) for i > 1,j = 1 (1 - aJi)(l - V)/(l - VS,,)(l - U,) for i = 1,j = 1.
Changing S , With T'S Held Constant
Without loss of generality, we choose two brands, Bl and B,, with which to carry out our analysis. Because only Si2is changing, none of the n, change for any j , and of the U, only U, and U2 change their value in that they each decrease by the amount by which S12increases. Calculation of the matrix of derivatives therefore is straightforward, as a,, is entirely in- dependent of s,,for j greater than 2:
0 f o r j > 2 V(aji - 1)/(1 - VS,) f o r ( i j ) = (1,2)or(2,1)
Vaji/(l - VSj) otherwise.
Changing SijWith T'S Changing
As above, we choose two brands, B, and B,, with which to carry out our analysis. In this case, however, the values of all features must be rescaled proportionally to counterbalance a change in SI2, as described above. The resulting derivatives are:
('48) aa,,/aS12 =
-2a,,/(l - VS,)(l - 2S12) for i > 2, j > 2 (1 - 2aji)/(l - VS,)(l - 2S12) for i 5 2, j > 2
-2aji(l - V)/(l - VS,)(l - 2SI2) for i > 2, j 5 2 (1 - 2a,,)(l - V)/(l - VS,)(l - 2SI2) for i 5 2, j 5 2.
REFERENCES Bass, Frank M., Edgar A. Pessemier, and Donald R. Lehmann
(1972), "An Experimental Study of Relationships Between Attitudes, Brand Preference, and Choice," Behavioral Sci- ence, 17 (November), 532-41.
Batsell, Richard R. and John C. Polking (1985), "A New Class of Market Share Models," Marketing Science, 4 (Summer), 177-98.
Bawa, Kapil (1990), "Modelling Inertia and Variety-Seeking Tendencies in Brand Choice Behavior," Marketing Science, 9 (Summer), 263-78.
Cinlar, Erhan (1975), Introduction to Stochastic Processes. Englewood Cliffs, NJ: Prentice-Hall, Inc.
Givon, Moshe (1984), "Variety-Seeking Through Brand Switching," Marketing Science, 3 (Winter), 1-22.
Huber, Joel, John Payne, and Chris Puto (1982), "Adding Asymmetrically Dominated Alternatives," Journal of Con- sumer Research, 9 (June), 90-8.
Hutchinson, J. Wesley (1986), "Discrete Attribute Models of Brand Switching," Marketing Science, 5 (Fall), 350-7 1.
Jeuland, Abel P. (1978), "Brand Preferences Over Time: A Partially Deterministic Operationalization of the Notion of Variety-Seeking," in Research Frontiers in Marketing: Dia-

--
MARKET SHARE RESPONSE
logues and Directions, No. 43, AMA 1978 Educators' Pro- ceedings, Subhash Jain, ed. Chicago: American Marketing Association.
Kahn, Barbara E., Manohar U. Kalwani, and Donald G. Mor-rison (1986), "Measuring Variety-Seeking and Reinforce- ment Behaviors Using Panel Data," Journal of Marketing Research, 23 (May), 89-100.
,and -(1988), "Niching Versus Change- of-Pace Brands: Using Purchase Frequencies and Penetra- tion Rates to Infer Brand Positionings," Journal of Mar- keting Research, 25 (November), 384-90.
and Therese A. Louie (1990), "The Effects of Re- traction of Price Promotions on Brand Choice Behavior for Variety-Seeking and Last-Purchase Loyal Consumers," Journal of Marketing Research, 27 (August), 279-89.
Lattin, James M. (1987), "A Model of Balanced Choice Be- havior," Marketing Science, 6 (Winter), 48-65.
and Leigh McAlister (1985), "Using a Variety-Seek- ing Model to Identify Substitute and Complementary Re- lationships Among Competing Products," Journal of Mar- keting Research, 22 (August), 141-50.
Luce, R. Duncan (1959), Individual Choice Behavior: A The- oretical Analysis. New York: John Wiley & Sons, Inc.
McAlister, Leigh (1979), "Choosing Multiple Items From a Product Class," Journal of Consumer Research, 6 (Decem- ber), 213-24.
(1982), "A Dynamic Attribute Satiation Model of Va- riety-Seeking Behavior," Journal of Consumer Research, 9 (September), 141 -50.
and Edgar A. Pessemier (1982), "Variety-Seeking Be- havior: An Interdisciplinary Review," Journal of Consumer Research, 9 (December), 3 1 1-22.
Morrison, Donald G., William F. Massy, and Fred N. Sil- verman (1971), "The Effects of Nonhomogeneous Popula- tions on Markov Steady-State Probabilities," Journal of the American Statistical Association, 66 (June), 268-74.
Tversky, Amos (1977), "Features of Similarity," Psycholog-ical Review, 84 (4), 327-52.
and Shmuel Sattath (1 979), "Preference Trees," Psy-chological Review, 86 (6), 542-73.
Reprint No. IMR292106
AMERICAN MARKETING ASSOCIATION
REPRINT AND PERMISSION POLICIES AND PROCEDURES FOR JOURNAL ARTICLES
The American Marketing Association is eager to serve you in the sharing of the valuable information found in AMA's journal articles.
REPRINTS If you wish to order REPRINTS of any article, write to the American Marketing Association Publications Group, 250 S. Wacker Dr.,Chicago, IL 60606 USA. Call (312) 993-9517 or Fax (312) 993-7540.
The prices below apply to each title ordered. Multiple titles may be combined to reach the minimum order amount of $15.Each reproduction will be provided with an attached cover. ORDERS INCLUDING SHIPPING AND HANDLING CHARGES MUST BE PREPAID by check (in U.S. funds or equivalent) or major credit card. No refunds or exchanges.
REPRINT PRICES (minimum order is $15)
1-5* reproductions of the same article $7.50each + $2 for U.S. Shipping or $3 for International or an assortment of articles & Handling Air S & H
6-14* $6 " + $4 or $6
15-49 reproductions of the same article $5 " + $6 or $9
50- 149 $3 " + $8 or $15
150-500 $2 " + $12 or $30
> 500 call for quote
* Please add $5 per article for articles more than 15 years old.
An order of less than 50 copies also may be obtained from University Microfilms International, 300N. Zeeb Road, Ann Arbor, MI 48106.Articles are priced prepaid at $10.75 plus $2.25 for each additional copy of the same article. Those who have a standing account with UMI pay $8.75per article plus $2.25for each additional copy of the same article.
PERMISSIONS AMA would be proud to grant PERMISSION FOR THE REPRODUCTION of copyrighted materials. To obtain permission Mto reproduce multiple copies from AMA publications, contact the AMA Publications Group. Under the "fair use" provision of the Copyright Law, effective January, 1978,anyone may make a photocopy of a copyrighted work for his or her own use m m without seeking permission. M K E T N G To secure permisvion to reproduce one's own works in quantity, please contact the AMA Publications Group. A$OCIATm