market response of mergers and … · for jaguar-land rover for us $2.3 billion and hindalco...
TRANSCRIPT

Academy of Accounting and Financial Studies Journal Volume 22, Number 2, 2018
1 1528-2635-22-2-141
MARKET RESPONSE OF MERGERS AND
ACQUISITIONS’ ANNOUNCEMENT AND ITS
PREDICTIVE ABILITY IN FORECASTING POST
MERGER LONG TERM PERFORMANCE OF THE
ACQUIRING COMPANY
Amarjeet Kaur Malhotra, Ansal University
Ajay Kumar Chauhan, Institute of Management Technology, Ghaziabad
ABSTRACT
This paper attempts to analyse the market response of mergers and acquisitions
announcement and its ability to forecast the post-merger performance of the acquiring company.
The present study is an analytical and exploratory kind of research, where event study approach
has been used to analyse market response of mergers and acquisition announcements. The long
term performance of the acquiring companies in post-merger period is compared with the type of
market response. The study concludes that the market response cannot be considered as the
signal of future performance of acquiring company. The market response just indicates that the
decision making of investors is not rational and depends upon many behavioral aspects. For the
first time, efforts are undertaken to test the rationality of the market responses in predicting the
post-merger performance of the acquiring companies.
Keywords: Corporate Restructuring, Financial Engineering, Merger & Acquisitions, Leveraged
Buyouts, Strategic Alliances.
INTRODUCTION
Over the last decade or so, there has been frenetic activity within the corporate sector in
the area of corporate restructuring. Corporate restructuring refers to change in the ownership,
business mix and asset mix alliances with a view to enhance shareholder value. Hence corporate
restructuring may involve ownership restructuring, business restructuring and assets
restructuring. A company can affect ownership restructuring through merger and acquisition,
leveraged buyouts; buy back of shares, spin-off joint ventures and strategic alliances. Business
restructuring involves the reorganization of business units or divisions. It includes diversification
into new businesses, outsourcing, divestment brand acquisition, etc. Asset restructuring involves
the acquisition or sale of assets and their ownership structure. In all forms of restructurings, a
central purpose is to better align the interests of managers and shareholders.
Ramachandran (2006) defined the key principle behind a merger or acquisition is to
create value over and above that of the sum of the two companies. It is understood that two
companies together are more valuable than two separate business entities. Perry and Herd (2004)
emphasize the critical role of strategic planning when using M&As to uplift an organization.
They suggest that in 1990s, companies shifted the focus for undertaking M&As from a cost
saving perspective to using M&As as a strategic vehicle for corporate growth. Jemison and
Sitkins (1986) extended justification for acquisitions by concluding that: Particularly for ‘core’

Academy of Accounting and Financial Studies Journal Volume 22, Number 2, 2018
2 1528-2635-22-2-141
acquisitions, to exploit economies of scale or scope, as well as transferring skill (either to the
buyer or to the acquired firm) to add value. Fruhan, (1979) also identified various ways to
enhance value like: Ability to command premium product prices, achieving reduced or lower
than average cost structure, achieving reduced or lower than average capital intensity, ability to
obtain debt at lower than normal cost, ability to obtain equity at lower than normal cost,
designing more efficient capital structure, acquiring firms via the exchange of an overvalued
equity, selling overvalued equity and purchasing undervalued equities.
Now, if we talk from take over perspective, Porter (1987) outlined three necessary tests a
firm had to pass to make it an interesting take-over prospect. He called these “the attractiveness
test” (which means the industry structure must be or have the potential to be, profitable), the
“cost-of-entry test” (which means the cost of entry does not trade off all future profits) and the
“betteroff” test (which means the new unit must gain a competitive advantage as a result of the
acquisition or the corporation does). All the three tests are important though, but it is the third
test that is the most important one. Some kind of advantage must be gained as a result of the
acquisition. Porter cites the transfer of skills to the buyer as a major reason for purchasing
another firm- he also points out that this can be a one-off transfer, in which case the firm can be
divested once all can be learnt has been, or a continuous process, in which case the competitive
advantage is increasing.
MERGERS AND ACQUISITION-A RECENT SNAPSHOT IN INDIAN CONTEXT
In India, the mergers and acquisitions scenario changed in mid-2000. As reported by
Price Water House Coopers, the value of M&A deals announced in the first six months of 2005
was $6.9 billion, compared to $2.9 billion in the first half of 2004 and more than the $5.2 billion
in the whole of 2004. But, corporate India is still counting costs of restructuring, a study done by
S. Vaidya Nathan suggests that not even a single company has restructured itself in a way that
could rekindle investor interest and improve valuations substantively. Ghosh (2001) concluded in
his study that financial success of a merger would be considered based upon the benchmark
chosen. Gordon, Roger (2003) provides the theoretical underpinnings for re-examining the
interests of shareholders. Rajkumar (2008) in a study of post-merger corporate performance of
Indian companies has stated that post-merger operating and financial performance of the
acquiring companies show no improvement when compared to pre-merger values.
Indian companies, sensing attractive opportunities outside the country are also venturing
abroad. Tata Steel acquiring Dutch steel giant Chorus for US $12.1 billion, Tata Motors going
for Jaguar-Land Rover for US $2.3 billion and Hindalco acquiring Atlanta based Novelis for 6
billion US dollar are some of the recent examples. Mergers and acquisitions (M&A) in the
country slumped to their worst in the first half of 2009 as a liquidity crunch and mismatched
valuations marred buying plans of Indian companies. This may be seen from the global
slowdown perspective hit in 2008. United States of America (USA) proved to be the most
preferred destination for Indian acquirers, with seven of the 31 outbound targets located in that
country, followed by the United Kingdom (UK) with three deals. Eight of the 34 inbound deals
were acquired by US-based companies, followed by five deals by French firms and four by
German firms.
Indian outbound deals, which were valued at US $0.7 billion in 2000-2001, increased to
US $4.3 billion in 2005, and further crossed US $15 billion-mark in 2006. In fact, 2006 will be
remembered in India's corporate history as a year when Indian companies covered a lot of new
grounds. They went shopping across the globe and acquired a number of strategically significant

Academy of Accounting and Financial Studies Journal Volume 22, Number 2, 2018
3 1528-2635-22-2-141
companies. This comprised 60% of the total mergers and acquisitions (M&A) activity in India in
2006. And almost 99% of acquisitions were made with cash payments.
Table 1
TOP 10 ACQUISITIONS MADE BY INDIAN COMPANIES WORLDWIDE
Acquirer Target Company Country Targeted Deal Value($ m1) Industry
Tata Steel Corus Group plc UK 12,000 Steel
Hindalco Novelis Canada 5,982 Steel
Tata Motors Jaguar-Land Rover UK 2300 Automobile
Videocon Daewoo Electronics
Corp. Korea 729 Electronics
Dr.Reddy's Labs Betapharm Germany 597 Pharmaceutical
Suzlon Energy Hansen Group Belgium 565 Energy
HPCL Kenya Petroleum
Refinery Ltd. Kenya 500 Oil and Gas
Ranbaxy Labs Terapia SA Romania 324 Pharmaceutical
Tata Steel Natsteel Singapore 293 Steel
Videocon Thomson SA France 290 Electronics
VSNL Teleglobe Canada 239 Telecom
The rest of the paper is organised as follows. The following section reviews the related
literature, Section 3 provides the research objectives, section 4 discusses the methodology and
sample selection and section 5 presents the empirical results. Section 6 summarizes and
concludes.
LITERATURE REVIEW
Corporate restructuring has enabled thousands of organizations around the world to
respond more quickly and effectively to new opportunities and unexpected pressures, thereby re-
establishing their competitive advantage. A study done by J. Fred Weston and Samual C. Weaver
in 1994 shows that around 50% mergers are successful in terms of creation of values for
shareholders. In an exhaustive study, Agrawal (1992), testing Jensen and Ruback's (1983)
findings, determined that the efficient market hypothesis, which suggests that M&A should be
profitable for shareholders, remains unresolved, finding that acquiring-firm shareholders actually
lost approximately 10% of their market value in the five years post-merger, rather than gaining.
Anslinger and Copeland (1996) studied returns to shareholders in unrelated acquisition covering
the period from 1985 to 1995 and they found that in two third cases companies were failed to
earn their cost of acquisition.
Holthausen (1998) said that various studies have shown that mergers have failure rates of
more than 50%. One recent study found that 83% of all mergers fail to create value and half
actually destroy value. This is an abysmal record. What is particularly amazing is that in polling
the boards of the companies involved in those same mergers, over 80% of the board members
thought their acquisitions had created value.
Moeller, Schlingemann and Stulz (2005) analysed a large sample of 12,023 acquisitions
and their announcement returns over the period of 1980 to 2001. They found that the average
dollar change in wealth of acquiring firm shareholders was negative around the time of
announcement. After observing the overall returns, they examine the acquisition performance of
smaller firms. They found that smaller firms do more profitable acquisitions while larger

Academy of Accounting and Financial Studies Journal Volume 22, Number 2, 2018
4 1528-2635-22-2-141
companies do deals that cause their shareholders to lose money. During their sample period
small firms earned $9 billion.
Acquiring firm’ shareholders may suffer from overpayment, while target-firm
shareholders may benefit in the short term, (Jensen and Ruback 1983; Lajoux and Weston 1998;
Rau and Vermaelen 1998). Paul A Pautler (2003) evaluated whether a particular merger
enhanced shareholders value vis-à-vis industry benchmark. The paper also studied whether the
goals and objectives of the executives were achieved after the merger. The survey focused some
large transnational mergers happened during the period 1995-2000. The modus operandi was
through a questionnaire responded by some senior executives, involved in the deal. The study
also stated that the financial performance post-merger improves in 35-55% of the cases. Deals in
post 1995 period had a higher success rate than deals of early 1990s. The paper also discusses the
factors and pre-requisites which will most likely result in a more successful merger.
In 1992, Aggarwal, Jaffe and Mandelkar studied post-merger performance of the
companies from a different perspective. They adjusted data for size effect and beta weighted
market return and found that shareholders of the acquiring firms experienced a wealth loss of
about 10% over the period of five years following the merger completion. The study done on 40
Indian companies showed that restructuring through mergers failed to improve the performance
of a company, positively. Evidences and several studies suggests that Intense competition, rapid
technological change, major corporate accounting scandals and rising stock market volatility
have increased the burden on managers to deliver superior performance and value for their
shareholders. In the modern "winner takes all" economy, companies that fail to meet this
challenge will face the certain loss of their independence, if not extinction.
Thus, A few studies have been conducted in Indian context to judge the market reaction
on account of mergers and acquisitions. Indian studies mostly dominated to accounting based
study only. The scholars reported positive as well as negative abnormal return in short run period
such as (Pandey, 2001; Mishra & Goel, 2005; Malhotra & Zhu, 2006; Anand & Singh, 2008;
Kumar & Panneerselvam, 2009; Kashiramka & Rao, 2012; Kumar, Kumar & Deisting 2013,
Rani, Yadav & Jain 2013, etc.). But, there is no study available in the existing literature which
tried to test the rationality of the market responses in predicting the post-merger performance of
the acquiring companies
OBJECTIVES OF THE STUDY
The main objective of the research study is to analyse the predictive ability of the market
response of mergers and acquisitions at the time of announcements on the long term performance
of acquiring company in post-merger period. The secondary objectives of the research study
were as follows:
1. To analyse the post-merger performance of the acquiring companies.
2. To analyse the market response of the investors in predicting long term performance of the acquiring companies
in post-merger period.
HYPOTHESIS
H1: There is no significant change in operating performance of the company, post-merger compared to
pre- merger performance.
H0: m1=m2; H1=m1=/ (is not equal to)m2 i.e., m1<m2 or m1>m2

Academy of Accounting and Financial Studies Journal Volume 22, Number 2, 2018
5 1528-2635-22-2-141
Where m1 is the sample mean of pre-merger operating performance of the acquiring and target
company and m2 is the sample mean of post-merger operating performance
H2: The market response of the investors is a significant signal for the long term performance of the
acquiring companies in post-merger period
RESEARCH METHODOLOGY
The study carried out in this project is an Analytical and Exploratory kind of research in
which an attempt has been made to explore as much information as possible about the impact of
corporate restructuring on the selected organizations. This is a company specific research work
rather than an industry specific. All deals that fulfil certain conditions have been included in the
study. The final sample consists of 12 Indian companies. For the purpose of this study the stock
exchange announcement of the merger has been taken as event date (Day zero). In order to
conduct an event study daily adjusted closing price of data of all selected companies has been
used as proxy for market return and the data has been collected from prowess database. The daily
stock returns has been calculated as follows: 𝑅𝑖=𝑃𝑖.𝑡𝑃𝑖,−1−1.
Short-Term Event Study
Fama et al (1969) is the first to use event study methodology for calculating the abnormal
return. Abnormal return is crucial to judge the impact of an event as it isolates the effect of the
event from other general market movement. A substantial feature of the event study is the choice
of appropriate normal market model, Brown and warner (1985) indicate that the market model is
the standard for evaluating returns around the announcement and provides good results.
Abnormal return is the difference between actual returns and expected returns, expected returns
is calculated by using market model: 𝐴𝑅𝑖= 𝑅𝑖𝑡− 𝐸 (𝑅𝑖,) 𝐸 (𝑅𝑖,)=𝛼𝑖+𝛽𝑖 𝑅𝑀,𝑡+ 𝜀𝑖,𝑇. 𝐴𝑅𝑖: is the
abnormal return 𝑅𝑖: is the actual return, 𝐸 (𝑅𝑖,) is the expected return in absence of the event. α
and ß coefficient is calculated by OLS over a window period of (-120,-21). 𝑅𝑀: is the Market
return by using market index by observing at the time of t during the event window. Then the
cumulative abnormal return is 𝐶𝐴𝑅𝑖, 1, 𝑇2=Σ𝐴𝑅𝑖,2𝑡=𝑇1. The CAAR for the event window is
calculated (𝑇1,2 )=1𝑁 Σ𝐶𝐴𝑅𝑁𝐼=1 𝑖 (𝑇1,𝑇2 ).
The analysis of abnormal return over several windows captures the information regarding
the market reactions to the mergers announcement effect before the announcement date (effects
of insider trading or rumours), at the event date (merger effect) and the post–announcement
period (temporary pressure on prices and probable post-announcement correction).
Sample Plan
This research sample unit comprises following Indian companies, which had followed the
practice of corporate restructuring after undergoing merger and acquisition.
1. Tata Steel–Chorus
2. Hindalco Industries–Novelis
3. Dr Reddy–Betapharm
4. ONGC–Imperial Energy
5. Suzlon Enery-Repower Syatems
6. VSNL–Teleglobe
7. Tata Chemicals–General Chemicals Industrial Products Inc.

Academy of Accounting and Financial Studies Journal Volume 22, Number 2, 2018
6 1528-2635-22-2-141
8. United Spirits–Whyte and Mackay
9. Mahindra and Mahindra–Ssangyong
10. Tata motors–Jaguar and land rover
11. Tata coffee–Eight O Clock
12. Videocon and Thomson SA
Sample Size
Sample size comprises above-mentioned 12 Indian companies. These companies are
selected because ample financial information is available for last three years before corporate
structuring was done.
Data Collection
The data for this study is collected from CMIE Prowess Database. Secondary data is
collected from the websites of different companies, Annual General Reports of companies,
Journals and magazines of different corporate houses apart from SEBI's website. CMIE Prowess
will also be referred to and 3 years Operational efficiency will be compared for the pre and post-
merger period for each of the sample companies for the following financial areas.
1. Profitability Ratios
2. Liquidity and Solvency Ratios
3. Management efficiency ratios
DATA ANALYSIS AND INTERPRETATION
This section describes the results and interpretation of the data analysis done in the
research study. Event Study Approach is used to analyse the market response of the investors to
the merger and acquisitions announcements. The strategic objectives of the various mergers and
acquisitions are identified and finally the long term performance of the acquirer company is
analysed and compared with the prediction of the market at the time of announcement.
Event Study approach is based on the fundamental idea that changes in the stock prices
represent the discounted value of the firm’s future stream of profits. Hence, when observing a
stock market reaction to the announcement of a particular event (e.g. a merger), the change in the
equity value of a firm affected by this event can then be taken as a measure of the (discounted)
additional profits that they are expected to accrue as a consequence of the event.
Hindalco–Novelis Merger
Hindalco entered into an agreement to acquire the Canadian company Novelis for an all
cash deal of US $6 billion which would make the combined entity the world's largest rolled-
aluminum producer. Novelis at the time of acquisition was the world's largest producer of rolled
aluminum and recycler of aluminum cans. The acquisition was completed on 15 May 2007. This
bid in 2007 was the largest Indian investment in North America and the second-largest overseas
investment after Tata Steel Europe's purchase of Corus two weeks earlier. The stocks fell by
13% reducing the market cap by US $600 million. The shareholders criticised the deal for the
premium paid to acquire Novelis.

Academy of Accounting and Financial Studies Journal Volume 22, Number 2, 2018
7 1528-2635-22-2-141
Table 2
HINDALCO–NOVELIS MERGER
Acquiring
Company
Acquired
Company
Announcement
Date
Event date CAR CAAR Remark
Hindalco Novelis 9th
Feb 2007 15th
May 2007 -7.354 -0.141 Negative Response
As shown in Table 2, it is found that the market response to this merger is negative. This
is due to the perception among the investors that Hindalco paid huge premium to Novelis, which
may affect the future profitability of the Hindalco and its financial performance may come down
in future. Following table shows the post-merger performance of Hindalco:
Table 3
POST MERGER EFFECT IN CASE OF HINDALCO–NOVELIS MERGER
Post-Merger performance of Hindalco
Year 2008 2009 2010 2011 2012
PAT 2,623.80 348.83 4,351.85 2879 3558
EPS 21.38 2.05 22.74 12.59 17.42
Average Stock Price 178.2 69.25 154.18 192 112
Ex-Post analysis is done by checking the profitability of the acquiring company on an
annual basis after the acquisition is completed. The analysis of the same is shown in Table 3.
Here the acquisition was completed on 15th
May 2007. Hence, above table gives the PAT and
EPS of Hindalco for 5 years from 2007 onwards. CAAR shows that market has negative
perception. The profitability does not have a clear trend as it depends more on the commodity
prices. As the profitability does not show a clear trend we can say that we fail to reject event
study approach analysis for this case.
Dr Reddy–Betapharm
Dr. Reddy’s and 3i, Europe’s leading private equity house together announced that they
have entered into an agreement providing for the strategic investment by Dr. Reddy’s to acquire
100% of Betapharm Group, for a total enterprise value of €480 million in cash. Betapharm
Group is the fourth-largest generic pharmaceuticals company in Germany.
Table 4
DR REDDY–BETAPHARM MERGER
Acquiring
Company
Acquired
Company
Announcement
Date
Event date CAR CAAR Remark
Dr Reddy Betapharm 16th
Feb 2006 4th
March 2006 19.531 0.375 Positive Response
As shown in the results it is found that market response to this merger is positive for this
case.
Table 5 shows the post-merger performance of Dr Reddy. Ex-Post analysis is done by
checking the profitability of the acquiring company on an annual basis after the acquisition is
completed. Here the acquisition was completed on 4th March 2006. Hence, above table gives the
PAT and EPS of Dr Reddy for 5 years from 2006 onwards. CAAR shows that market has
positive perception. In terms of profitability over a period of 5 years the company has improved
on returns provided. Based on the correlation CAAR between the profitability we can say that
event study approach analysis passes for this case.

Academy of Accounting and Financial Studies Journal Volume 22, Number 2, 2018
8 1528-2635-22-2-141
Table 5
POST MERGER EFFECT IN CASE OF DR REDDY–BETAPHARM MERGER
Post-Merger Performance of Dr Reddy
Year 2007 2008 2009 2010 2011
PAT 965.53 437.3 -917 351 998
EPS 56.88 25.41 0 18.95 57.21
Average Stock Price 644.61 543.6 405.8 1181 1537
ONGC and Imperial Energy
On August 26th
, 2008 ONGC made announcement of acquiring Imperial Energy (UK).
The deal was finally completed on 3rd
September, 2009. ONGC acquired 100% stake in Imperial
Energy. The total value of the deal was $2.58 billion. It was ONGC’s biggest overseas
acquisition till date.
Table 6
ONGC–IMPERIAL ENERGY MERGER
Acquiring
Company
Acquired
Company
Announcement
Date
Event date CAR CAAR Remark
ONGC
Imperial
Energy
26th
Aug 2008 3th
Sep 2009 -14.335 -0.281 Negative
Response
Below Table 7 gives the PAT and EPS of ONGC for 5 years from 2009. Also table shows
the monthly average return for 1-5 years after the deal was completed.
Table 7
POST-MERGER EFFECT IN ONGC–IMPERIAL ENERGY MERGER
Post-Merger Performance of ONGC
Year 2009 2010 2011 2012 2013
PAT 16,126.32 16,767.56 18,924.00 25,122.92 20,925.70
EPS 75.40 78.39 22.12 29.36 24.46
Average Returns 0.00298677 0.004755061 0.000340648 0.001911149 0.025074687
Since the CAR and CAAR values are negative, we had expected that the profitability of
the company and the average returns to decline. But, for this company we cannot conclude
whether the profitability or the average returns have declined. This is because other events have
affected the market sentiments of the company. ONGC has acquired a lot of company between
the duration of 2008 and 2012. Hence, for this model to be successful, we would have to
analyses the impact of each of those acquisitions before coming to any sort of conclusion. Also,
ONGC in November 2012 has announced of acquiring ConocoPhillips in Kazakhstan for $5
billion–its biggest acquisition till date. Such an event has also affected the price of the shares in
after the date of announcement.
With respect to Imperial Energy, ONGC regretted the decision of acquiring this company
in 2011-2012. There were a few reasons for the same, some of which are mentioned below:
1. The oil prices declined rapidly in 2011-2012
2. The oil fields on which ONGC acquired Imperial Energy were estimated to produce 80000 barrels per day
(BPD). This was later revised to 45000 BPD. Currently it produces 15000 BPD.

Academy of Accounting and Financial Studies Journal Volume 22, Number 2, 2018
9 1528-2635-22-2-141
3. ONGC ran into trouble with the Government of UK over poor operational results, unpaid salaries, legal
confrontations with staff and outsourcing of valuable contracts to foreign companies resulting in a warning
that future projects in UK involving ONGC depended on better results from this current project.
4. New investment aimed at boosting production has not materialised causing production levels to drop below
targets.
So just considering the ONGC and Imperial Energy acquisition, we can say that the market
sentiment was right regarding this deal as CAR and CAAR were negative. But, in order to fully
justify this model we need to take into consideration other events as well. Hence, in this case we
can say that the model does not give a clear picture about the performance of the company.
Suzlon Energy and Repower Systems
Suzlon Energy on 9th
February 2007 announced its intention to take over Repower
Systems in Germany for $1.6 billion. The deal was finally completed on 15th
December, 2008 as
shown in Table 8.
Table 8
SUZLON ENERGY AND REPOWER SYSTEMS MERGER
Acquiring Company Acquired
Company
Announcement
Date Event date CAR CAAR Remark
Suzlon Energy Repower
Systems 9
th Feb 2007 15
th Dec 2008 -2.567 -0.0503 Negative Response
Table 9
POST MERGER EFFECT IN SUZLON ENERGY AND REPOWER SYSTEMS MERGER
Post-Merger Performance of Suzlon Energy
Year 2008 2009 2010 2011 2012
PAT 1,416.88 -469.27 -1,414.09 -185.66 -505.38
EPS 9.47 -3.13 -9.08 -1.04 -2.84
Average Returns 0.021758447 0.004909457 0.002734645 -0.012391677 -0.002497234
Above Table 9 gives the PAT and EPS of Suzlon for 5 years from 2008. From the above
tables, we expect the profitability and the average returns to be negative as CAR and CAAR is
negative and we are not disappointed. The profitability of the company, PAT and EPS, has
declined on a continuous basis. The monthly average returns also have declined continuously.
Hence, for this acquisition, we can safely say that the model has correctly predicted the market
sentiments.
Tata-Corus Acquisition
On October 20, 2006 the board of directors of Anglo-Dutch steelmaker Corus accepted a
$7.6 billion takeover bid from Tata Steel, the Indian steel company, at 455 pence per share of
Corus. The following months saw a lot of negotiations from both sides of the deal. Tata Steel's
bid to acquire Corus Group was challenged by CSN, the Brazilian steel maker. Finally, on
January 30, 2007, Tata Steel purchased a 100% stake in the Corus Group at 608 pence per share
in an all cash deal, cumulatively valued at US $12.04 billion. The deal is the largest Indian
takeover of a foreign company and made Tata Steel the world's fifth-largest steel group.

Academy of Accounting and Financial Studies Journal Volume 22, Number 2, 2018
10 1528-2635-22-2-141
Table 10
TATA–CORUS ACQUISITION
Acquiring
Company
Acquired
Company
Announcement
Date Event date CAR CAAR Remark
Tata Corus 20th
Oct 2006 30th
Jan 2007 -16.6603 -0.3332 Negative Response
Table 11
POST ACQUISITION EFFECT IN TATA–CORUS ACQUISITION
Post-Merger Performance of Tata
Year 2008 2009 2010 2011 2012
PAT 12,321.76 4,849.24 -2,120.84 8,856.05 4,948.52
EPS 168.51 64.94 -24.44 92.39 50.95
Average daily Return -0.0103 -0.0078 -0.0039 -0.0031 0.0134
The analysis in above Table 11 shows that the returns were negative for at least four
years before they became positive in the fifth year. Also, they are constantly increasing year after
year. Hence, we can say that the effect of acquisition is present for the duration of five years, but
with reduced strength every subsequent year. Therefore, the calculated negative CAAR
correlates successfully with the wealth creation of Tata Steel. The analysis above shows that both
PAT and EPS were decreasing for at least four years apart from one odd case in 2011 where the
production of steel in Europe picked speed at that time. Because of that, the values went up.
Anyways, we can still say that the calculated negative CAAR correlates successfully with the
profitability of Tata Steel. Therefore, the calculated negative CAAR correlates successfully with
both the wealth creation and the profitability of Tata Steel.
VSNL–Teleglobe Acquisition
Table 12
VSNL - TELEGLOBE ACQUISITION
Acquiring
Company
Acquired
Company
Announcement
Date Event date CAR CAAR Remark
VSNL Teleglobe 25th
July 2005 13th
Feb 2006 -28.9201 -0.5784 Negative Response
Table 13
POST ACQUISITION EFFECT IN VSNL–TELEGLOBE ACQUISITION
Post-Merger Performance of VSNL
Year 2007 2008 2009 2010 2011
PAT 468.56 304.46 515.95 483.18 162.56
EPS 16.44 10.68 18.1 16.95 5.7
Average daily Return -0.0123 0.0005 -0.0062 -0.0124 -0.0049
Videsh Sanchar Nigam Limited, (VSNL), the leading provider of international
communication solutions, announced on February 13, 2006 the completion of its acquisition of
Teleglobe International Holdings Ltd. Earlier it announced on July 25, 2005 that it was acquiring
Teleglobe International Holdings, a provider of wholesale voice, data, internet protocol and
mobile signaling services in a US $239 million deal. The acquisition value included the price of
$4.5 per share payable to shareholders of Teleglobe and the assumed debt. The acquisition was
to be carried out through the amalgamation of Teleglobe with the company's subsidiary in
Bermuda. It was subject to the approval of Teleglobe's shareholders and government approvals
in various countries.
Academy of Accounting and Financial Studies Journal Volume 22, Number 2, 2018
11 1528-2635-22-2-141
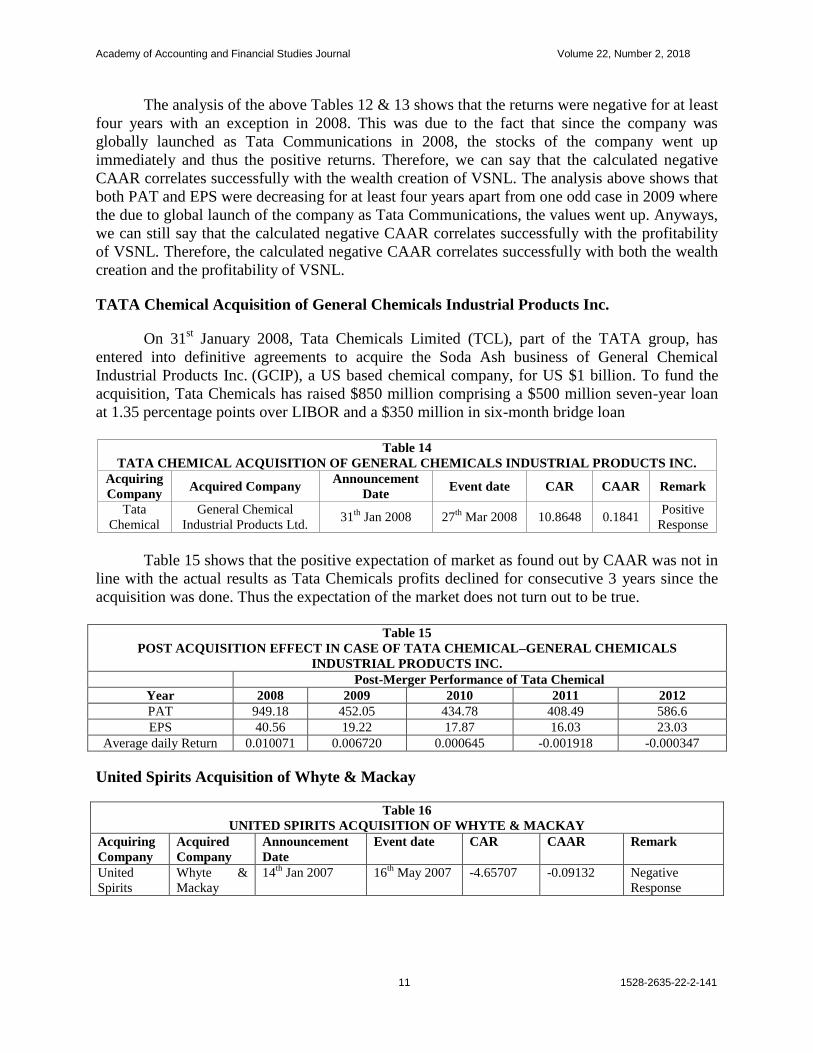
The analysis of the above Tables 12 & 13 shows that the returns were negative for at least
four years with an exception in 2008. This was due to the fact that since the company was
globally launched as Tata Communications in 2008, the stocks of the company went up
immediately and thus the positive returns. Therefore, we can say that the calculated negative
CAAR correlates successfully with the wealth creation of VSNL. The analysis above shows that
both PAT and EPS were decreasing for at least four years apart from one odd case in 2009 where
the due to global launch of the company as Tata Communications, the values went up. Anyways,
we can still say that the calculated negative CAAR correlates successfully with the profitability
of VSNL. Therefore, the calculated negative CAAR correlates successfully with both the wealth
creation and the profitability of VSNL.
TATA Chemical Acquisition of General Chemicals Industrial Products Inc.
On 31st January 2008, Tata Chemicals Limited (TCL), part of the TATA group, has
entered into definitive agreements to acquire the Soda Ash business of General Chemical
Industrial Products Inc. (GCIP), a US based chemical company, for US $1 billion. To fund the
acquisition, Tata Chemicals has raised $850 million comprising a $500 million seven-year loan
at 1.35 percentage points over LIBOR and a $350 million in six-month bridge loan
Table 14
TATA CHEMICAL ACQUISITION OF GENERAL CHEMICALS INDUSTRIAL PRODUCTS INC.
Acquiring
Company Acquired Company
Announcement
Date Event date CAR CAAR Remark
Tata
Chemical
General Chemical
Industrial Products Ltd. 31
th Jan 2008 27
th Mar 2008 10.8648 0.1841
Positive
Response
Table 15 shows that the positive expectation of market as found out by CAAR was not in
line with the actual results as Tata Chemicals profits declined for consecutive 3 years since the
acquisition was done. Thus the expectation of the market does not turn out to be true.
Table 15
POST ACQUISITION EFFECT IN CASE OF TATA CHEMICAL–GENERAL CHEMICALS
INDUSTRIAL PRODUCTS INC.
Post-Merger Performance of Tata Chemical
Year 2008 2009 2010 2011 2012
PAT 949.18 452.05 434.78 408.49 586.6
EPS 40.56 19.22 17.87 16.03 23.03
Average daily Return 0.010071 0.006720 0.000645 -0.001918 -0.000347
United Spirits Acquisition of Whyte & Mackay
Table 16
UNITED SPIRITS ACQUISITION OF WHYTE & MACKAY
Acquiring
Company
Acquired
Company
Announcement
Date
Event date CAR CAAR Remark
United
Spirits
Whyte &
Mackay
14th
Jan 2007 16th
May 2007 -4.65707 -0.09132 Negative
Response
Academy of Accounting and Financial Studies Journal Volume 22, Number 2, 2018
12 1528-2635-22-2-141
On 14th
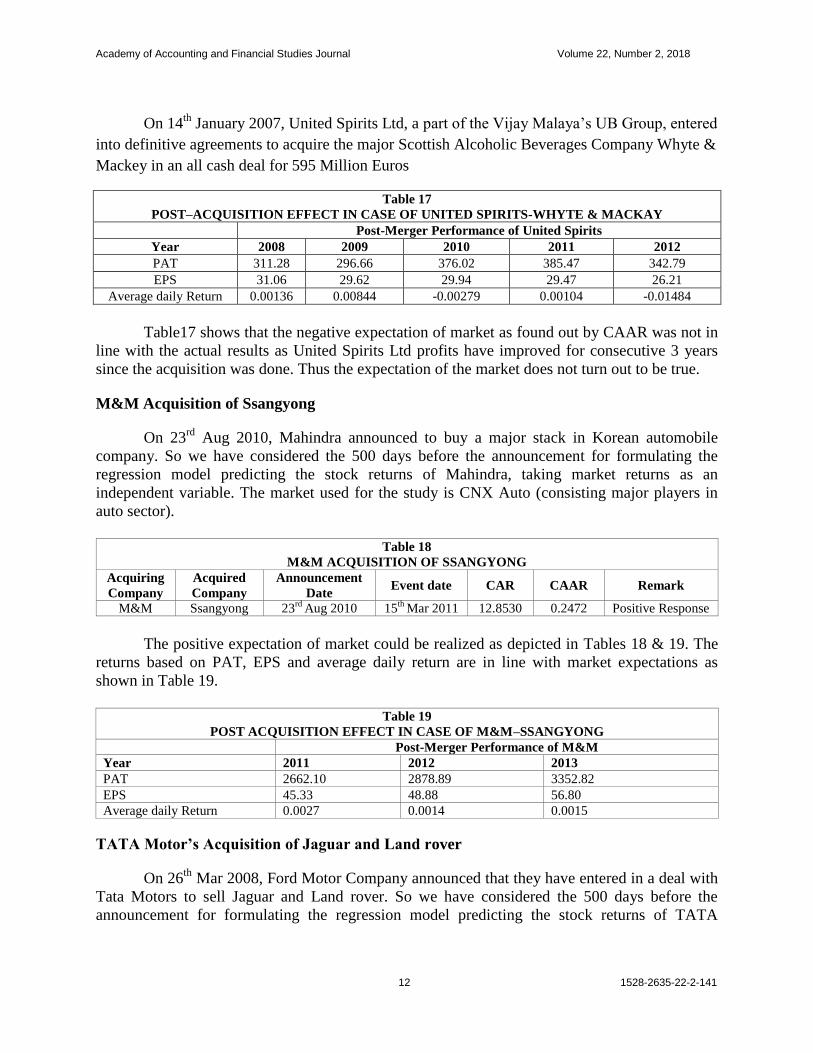
January 2007, United Spirits Ltd, a part of the Vijay Malaya’s UB Group, entered
into definitive agreements to acquire the major Scottish Alcoholic Beverages Company Whyte &
Mackey in an all cash deal for 595 Million Euros
Table 17
POST–ACQUISITION EFFECT IN CASE OF UNITED SPIRITS-WHYTE & MACKAY
Post-Merger Performance of United Spirits
Year 2008 2009 2010 2011 2012
PAT 311.28 296.66 376.02 385.47 342.79
EPS 31.06 29.62 29.94 29.47 26.21
Average daily Return 0.00136 0.00844 -0.00279 0.00104 -0.01484
Table17 shows that the negative expectation of market as found out by CAAR was not in
line with the actual results as United Spirits Ltd profits have improved for consecutive 3 years
since the acquisition was done. Thus the expectation of the market does not turn out to be true.
M&M Acquisition of Ssangyong
On 23rd
Aug 2010, Mahindra announced to buy a major stack in Korean automobile
company. So we have considered the 500 days before the announcement for formulating the
regression model predicting the stock returns of Mahindra, taking market returns as an
independent variable. The market used for the study is CNX Auto (consisting major players in
auto sector).
Table 18
M&M ACQUISITION OF SSANGYONG
Acquiring
Company
Acquired
Company
Announcement
Date Event date CAR CAAR Remark
M&M Ssangyong 23rd
Aug 2010 15th
Mar 2011 12.8530 0.2472 Positive Response
The positive expectation of market could be realized as depicted in Tables 18 & 19. The
returns based on PAT, EPS and average daily return are in line with market expectations as
shown in Table 19.
Table 19
POST ACQUISITION EFFECT IN CASE OF M&M–SSANGYONG
Post-Merger Performance of M&M
Year 2011 2012 2013
PAT 2662.10 2878.89 3352.82
EPS 45.33 48.88 56.80
Average daily Return 0.0027 0.0014 0.0015
TATA Motor’s Acquisition of Jaguar and Land rover
On 26th
Mar 2008, Ford Motor Company announced that they have entered in a deal with
Tata Motors to sell Jaguar and Land rover. So we have considered the 500 days before the
announcement for formulating the regression model predicting the stock returns of TATA

Academy of Accounting and Financial Studies Journal Volume 22, Number 2, 2018
13 1528-2635-22-2-141
Motors, taking market returns as an independent variable. The market used for the study is CNX
Auto (consisting major players in auto sector).
Table 20
TATA MOTOR’S ACQUISITION OF JAGUAR AND LAND ROVER
Acquiring
Company
Acquired Company Announcement
Date
Event date CAR CAAR Remark
Tata
Motors
Jaguar and Land Rover 26th
Mar 2008 2nd
June 2008 -18.9853 -0.3651 Negative
Response
Table 21
POST-ACQUISITION EFFECT IN CASE OF TATA MOTOR’S- JAGUAR AND LAND ROVER
Post-Merger Performance of Tata Motors
Year 2009 2010 2011 2012 2013
PAT 1013.76 2829.54 1811.82 1242.23 301.81
EPS 22.70 42.37 30.28 3.90 0.93
Average daily Return -0.003164 0.01217 0.002933 -0.007607 0.002291
As per Table 21, the data of PAT and average daily returns do not show any trend. The
EPS data is in sync with the proposition of the study. Overall nothing can be concluded from the
data. We are failed to reject the proposition.
Tata Coffee Acquisition of Eight O’ Clock, USA
This acquisition transformed Tata Coffee from a regional player to global player and
helped established a global footprint in retail segment. The deal was announced on 25th June
2006 and was completed by 31st July 2006. The deal value was $220 million and was a pure
cash deal financed by mainly equity and partly by non-recourse debt.
Table 22
TATA COFFEE ACQUISITION OF EIGHT O’ CLOCK
Acquiring
Company
Acquired
Company
Announcement
Date
Event date CAR CAAR Remark
Tata Coffee Eight O` Clock 25th
June 2006 31st July 2006 -13.4350 -0.2742 Negative Response
Table 23
POST-ACQUISITION EFFECT IN CASE OF TATA COFFEE-EIGHT O’ CLOCK
Post-Merger Performance of Tata Coffee
Year 2007 2008 2009 2010 2011
PAT (Rs. Cr.) 20.23 24.68 18.64 31.99 55.08
EPS (Rs.) 9.73 12.02 8.96 15.88 27.84
Average daily Return -0.002254 -0.001350 0.02222 0.003586 -0.005809
To check whether this trend (of -ve daily returns) holds true in future, daily returns for 1-
month period (after a year of deal completion) were calculated for next 5 years as shown in
Table 23. The average daily returns for next 5 years for the same 1-month period (of August) are
negative for first 2 years and then gets positive but declines in next year and becomes positive
again in 5th
year. We calculate the PAT & EPS for subsequent 5 years after deal completion to
check the impact of deal on shareholder wealth creation. The increasing trend in PAT & EPS
contradicts the effect of negative CAAR. Thus, based on mixed pattern of average daily returns

Academy of Accounting and Financial Studies Journal Volume 22, Number 2, 2018
14 1528-2635-22-2-141
and increasing PAT/EPS, we can say that Event Study approach is not able to predict future
financial performance of the company.
Videocon Acquisition of Thomson SA, France
On 29th
June 2005, Videocon acquired French giant, Thomson SA’s Colour Picture Tube
(CPT) business in a debt free deal of € 240 million. It was an almost cash less deal with
Thomson investing back € 225 million in Videocon Industries’ oil & gas business and € 15
million in Videocon International. The deal was intended to provide Videocon with backward
integration and manufacturing ability in low-cost countries like Poland, Mexico, China & Italy.
Table 24
VIDEOCON ACQUISITION OF THOMSON SA, FRANCE
Acquiring
Company
Acquired
Company
Announcement
Date
Event date CAR CAAR Remark
Videocon Thomson SA 25th
June 2006 29th
June 2005 -27.8379 -0.5681 Negative Response
Table 25
POST ACQUISITION EFFECT IN CASE OF VIDEOCON-THOMSON SA, FRANCE
Post-Merger Performance of Videocon
Year 2006 2007 2008 2009 2010
PAT (Rs. Cr.) 818.5 855.22 854.3 400.66 744.69
EPS (Rs.) 36.4 37.9 36.9 16.93 19.45
Average daily Return -0.003131 -0.000231 -0.02699 -0.006263 -0.003247
To check whether this trend (of -ve daily returns) holds true in future, daily returns for 1-
month period (after a year of deal completion) were calculated for next 5 years as shown in
Table 25. The average daily returns for 1-month period (of October) for subsequent 5 years are
mostly consistent with negative CAAR. To check the deal impact on shareholders’ wealth
creation, we check the PAT & EPS values for subsequent 5 years after deal completion. The near
flat and then decreasing PAT/EPS confirms the financial performance predicted by negative
CAAR. Thus Event Study approach is able to predict the future performance of the company
with good correlation.
Table 26
OVERALL RESULTS OF EVENT STUDY ANALYSIS
Company +ve CAR +ve Profitability -ve CAR -ve Profitability Theory (Pass/Fail)
Hindalco Yes No trend Fail to Reject
Dr Reddy Yes Yes Pass
ONGC Yes No trend Fail to Reject
Suzlon Yes Yes Pass
M&M Yes Yes Pass
TATA Motors Yes No trend Fail to reject
TATA Chem Yes Yes Fails
United Spirits Yes Yes Fails
Tata Coffee Yes No Fails
Videocon Yes Yes Pass
Tata Steel Yes Yes Pass
VSNL Yes Yes Pass
Event Study Result Pass Fail Couldn’t Reject
No of Companies 6 3 3

Academy of Accounting and Financial Studies Journal Volume 22, Number 2, 2018
15 1528-2635-22-2-141
CONCLUSION
The overall results show that such a theory is not perfectly accurate for long term. With
little higher number of examples when the theory succeeded in predicting the long term future of
the M&A, compared to the theory failing, we can say that the event study approach cannot be
very surely applied to the predict the long term effect of any M&A on the company’s
performance. The study concludes that the market response cannot be considered as the signal of
future performance of acquiring company. The market response just indicates that the decision
making of investors is not rational and depends upon many behavioral aspects. For the first time,
efforts are undertaken to test the rationality of the market responses in predicting the post-merger
performance of the acquiring companies by using event study approach. In this study, only
twelve mergers were studied, the same approach may be used in future studies for a bigger data
base for more reliable results.
REFERENCES
Binder, J. (1998). The event study methodology since 1969. Review of Quantitative Finance and Accounting, 11(2),
111-137.
Chakrabati, R. (2008). Do Indian acquisitions create value? ICRA Bulletin, Money and Finance, 4(1) 61-73.
Corrado C.J. (1969). A nonparametric test for abnormal security price performance in event studies. Journal of
Financial Economics, 23(2), 385-395.
Cybo O.A. & Murgia, M. (2000). Mergers and shareholder wealth in European banking. Journal of Banking &
Finance, 24(6), 831-859.
DePamphilis, D. (2014). Mergers, acquisitions, and other restructuring activities (Fifth Edition). Elsevier.
Franks, J., Harris, R. & Titman, S. (1991). The post-merger share-price performance of acquiring firms. Journal of
Financial Economics, 29(1), 81-96.
Holthausen, R.W. & Larcker, D.F. (1998). The financial performance of reverse leveraged buyouts. Journal of
Financial Economics, 47(1), 123-123.
Houston, J.F., James, C.M. & Ryngaert, M.D. (2001). Where do merger gains come from? Bank mergers from the
perspective of insiders and outsiders. Journal of Financial Economics, 60(2), 285-331.
Jemison, D.B. & Sitkin, S.B. (1986). Corporate acquisitions: A process perspective. The Academy of Management
Review, 11(1), 145-163
Jensen, M.C. & Ruback, R.S. (1983). The market for corporate control: The scientific evidence. Journal of
Financial Economics, 11, 5-50.
Kashiramka, S. & Rao, N.M. (2013). Shareholders wealth effects of mergers & acquisitions in different deal activity
periods in India. European Journal of Business and Management, 5(4), 116-129.
Kumar, B.R. & Panneerselvam, S. (2009). Mergers, acquisitions and wealth creation: a comparative study in the
Indian context. IIMB Management Review, 21(3), 222-224.
Malhotra, S. & Zhu, P. (2006). Shareholder Benefits and Firm Performance: an Empirical Analysis of International
Acquisitions by Firms from a Developing Economy. Retrieved from https://papers.ssrn.com /sol3/papers.
cfm?abstract_id=934968.
Mishra, A. & Goel, R. (2005). Return to shareholders from mergers: The case of RIL and RPL merger. IIMB
Management Review, 17(3), 31-45.
Moelle, S.B., Schlingemann, F.P. & Stulz, R.M. (2005). Wealth destruction on a massive scale? A study of
acquiring-firm returns in the recent merger wave. The Journal of Finance, 60(2), 757-782.
Mohan, T.R. (2005). Bank consolidation: Issues and evidence. Economic and political weekly, 40(12), 1151-1161.
Pandey, A. (2001). Takeover announcements, open offers and shareholders' returns in target firms. Vikalpa, 26(3),
19-30.
Perry, J.S. & Herd, T.J. (2004). Merger & acquisitions: Reducing M & A risk through improved due diligence,
Strategy and Leadership, 32(2), 12-19.
Ramachandran, S. (2006). Merger & acquisitions: Your Survival Kit. Retrieved from http://www.rediff.com/
getahead/2006/aug/10merg.htm.

Academy of Accounting and Financial Studies Journal Volume 22, Number 2, 2018
16 1528-2635-22-2-141
Rani, N. (2012). Impact of merger and acquisitions on returns to shareholders of acquiring firms: Indian economy in
perspective. Journal of Financial Management and Analysis, 1-24.
Rani, N., Yadav, S.S. & Jain, P.K. (2013). Market response to the announcement of mergers and acquisitions: An
empirical study from India vision. The Journal of Business Perspective, 17(1), 1-16.
Singh, M.A. (2008). Impact of merger announcement on shareholder's wealth: Evidence from Indian private sector
banks. Vikalpa, 33(1), 35-53.