market outlook december 2016
TRANSCRIPT

Market Outlook
December
2016
1

EQUITY
MARKETS
2
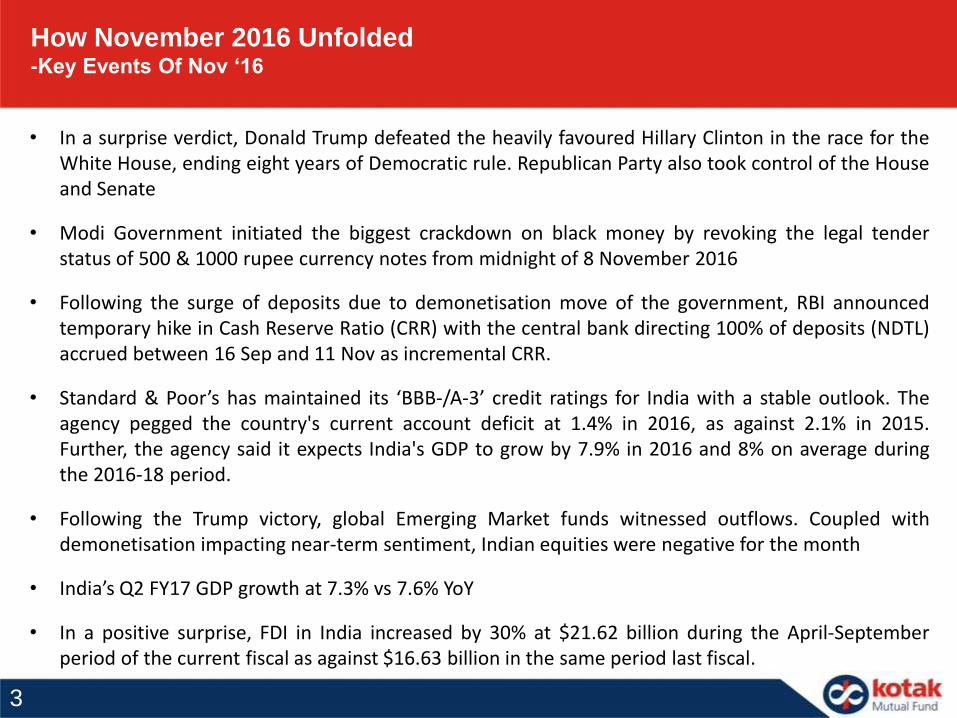
How November 2016 Unfolded -Key Events Of Nov ‘16
• In a surprise verdict, Donald Trump defeated the heavily favoured Hillary Clinton in the race for theWhite House, ending eight years of Democratic rule. Republican Party also took control of the Houseand Senate
• Modi Government initiated the biggest crackdown on black money by revoking the legal tenderstatus of 500 & 1000 rupee currency notes from midnight of 8 November 2016
• Following the surge of deposits due to demonetisation move of the government, RBI announcedtemporary hike in Cash Reserve Ratio (CRR) with the central bank directing 100% of deposits (NDTL)accrued between 16 Sep and 11 Nov as incremental CRR.
• Standard & Poor’s has maintained its ‘BBB-/A-3’ credit ratings for India with a stable outlook. Theagency pegged the country's current account deficit at 1.4% in 2016, as against 2.1% in 2015.Further, the agency said it expects India's GDP to grow by 7.9% in 2016 and 8% on average duringthe 2016-18 period.
• Following the Trump victory, global Emerging Market funds witnessed outflows. Coupled withdemonetisation impacting near-term sentiment, Indian equities were negative for the month
• India’s Q2 FY17 GDP growth at 7.3% vs 7.6% YoY
• In a positive surprise, FDI in India increased by 30% at $21.62 billion during the April-Septemberperiod of the current fiscal as against $16.63 billion in the same period last fiscal.
3

Why Was Demonetization Done?
Total Bank notes in circulation rose
by 40% in last 5 years
Shadow economy for India >23% of
GDP which corrodes
economy and stokes Inflation
Circulation of Rs. 500 rose by 76% and Rs. 1000 by
109%
Source: World Bank 2007 estimate, Ministry of Finance Press release 4
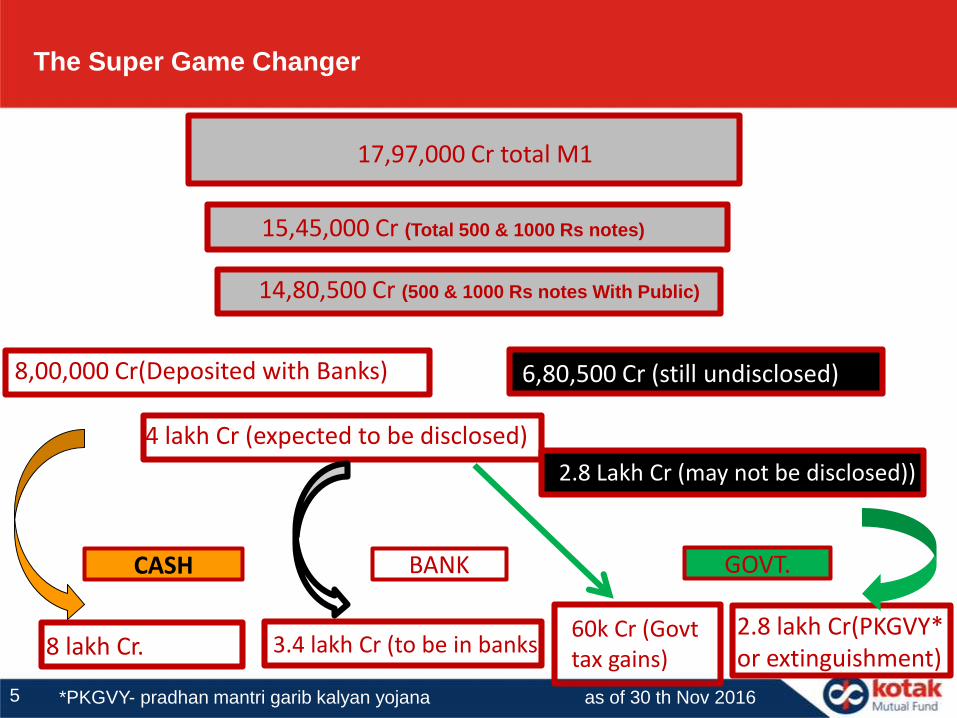
The Super Game Changer
17,97,000 Cr total M1
15,45,000 Cr (Total 500 & 1000 Rs notes)
14,80,500 Cr (500 & 1000 Rs notes With Public)
8,00,000 Cr(Deposited with Banks) 6,80,500 Cr (still undisclosed)
4 lakh Cr (expected to be disclosed)
2.8 Lakh Cr (may not be disclosed))
CASH BANK GOVT.
8 lakh Cr. 60k Cr (Govttax gains)
3.4 lakh Cr (to be in banks 2.8 lakh Cr(PKGVY* or extinguishment)
5 *PKGVY- pradhan mantri garib kalyan yojana as of 30 th Nov 2016
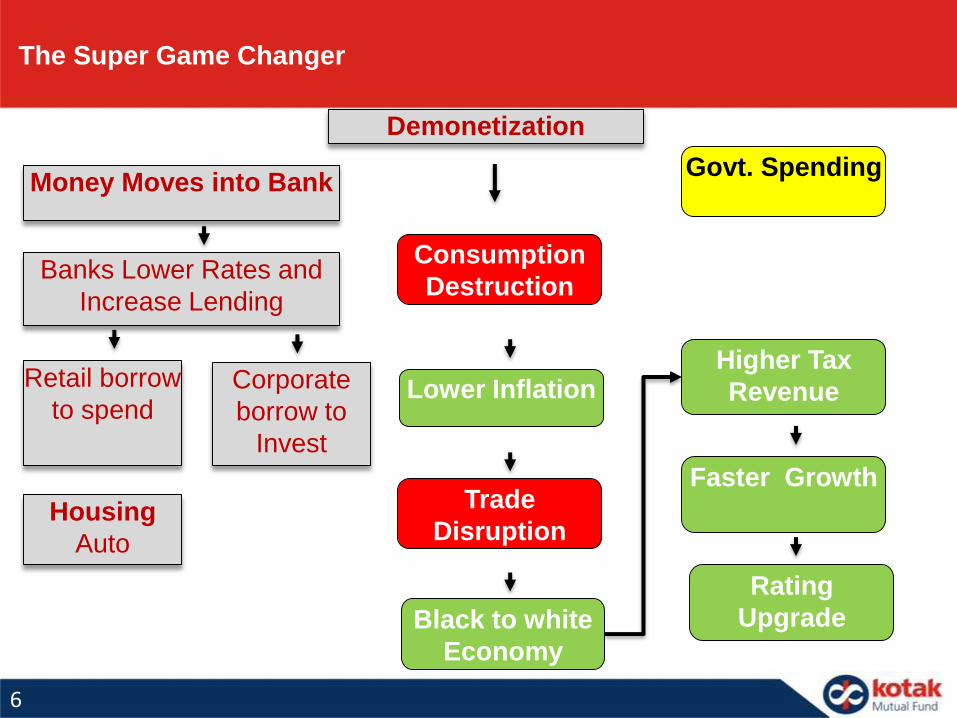
Demonetization
Money Moves into Bank
Banks Lower Rates and
Increase Lending
Retail borrow
to spend
Housing
Auto
Corporate
borrow to
Invest
Consumption
Destruction
Lower Inflation
Black to white
Economy
Trade
Disruption
Higher Tax
Revenue
Faster Growth
Rating
Upgrade
Govt. Spending
The Super Game Changer
6
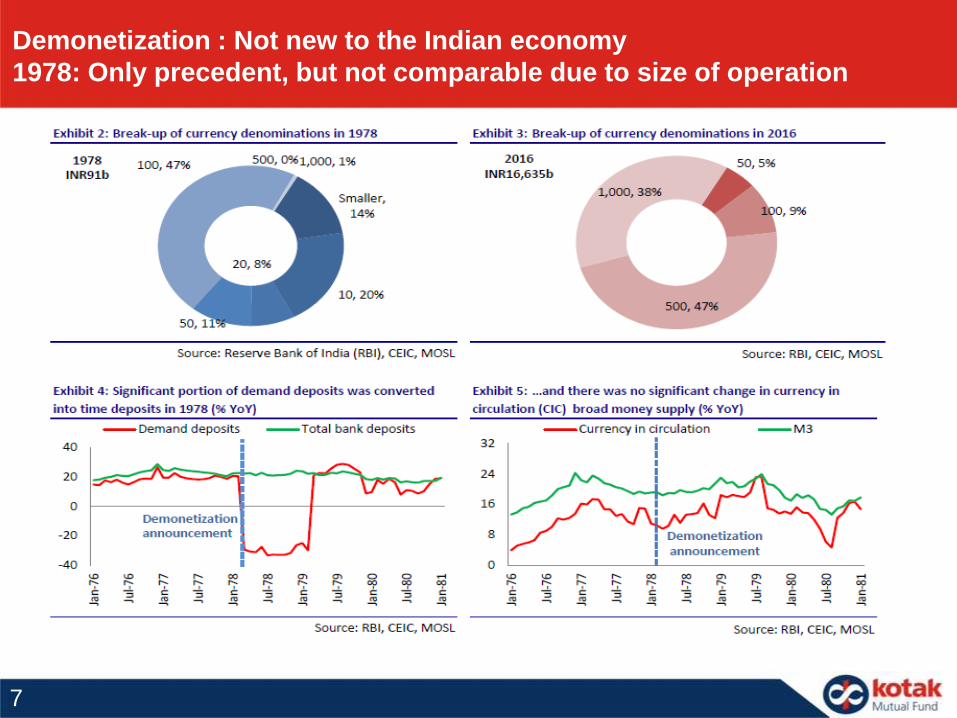
Demonetization : Not new to the Indian economy
1978: Only precedent, but not comparable due to size of operation
7
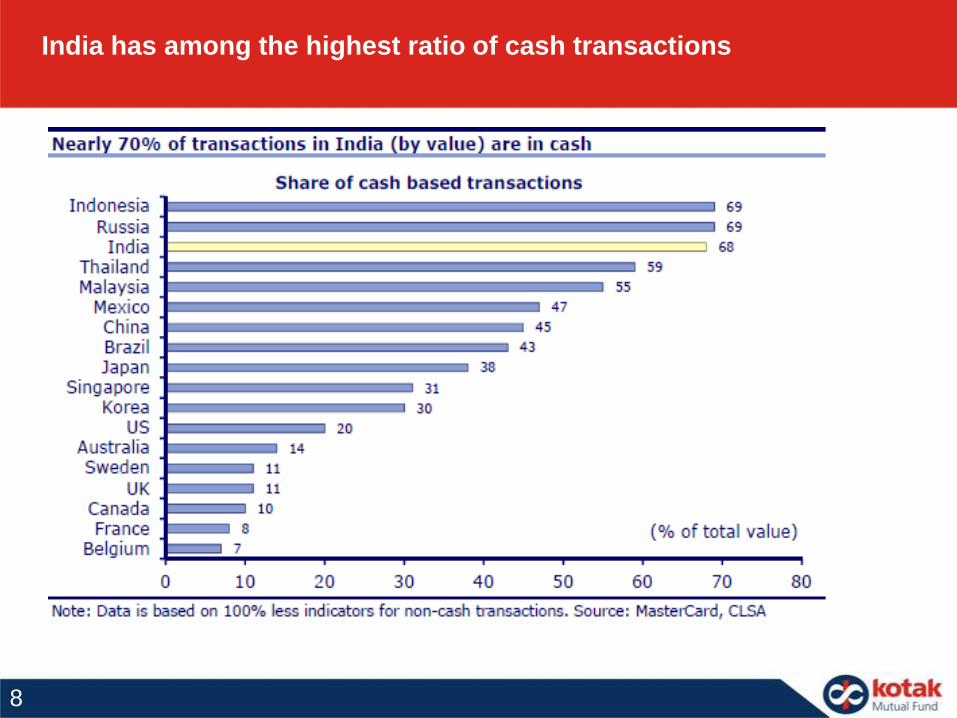
India has among the highest ratio of cash transactions
8
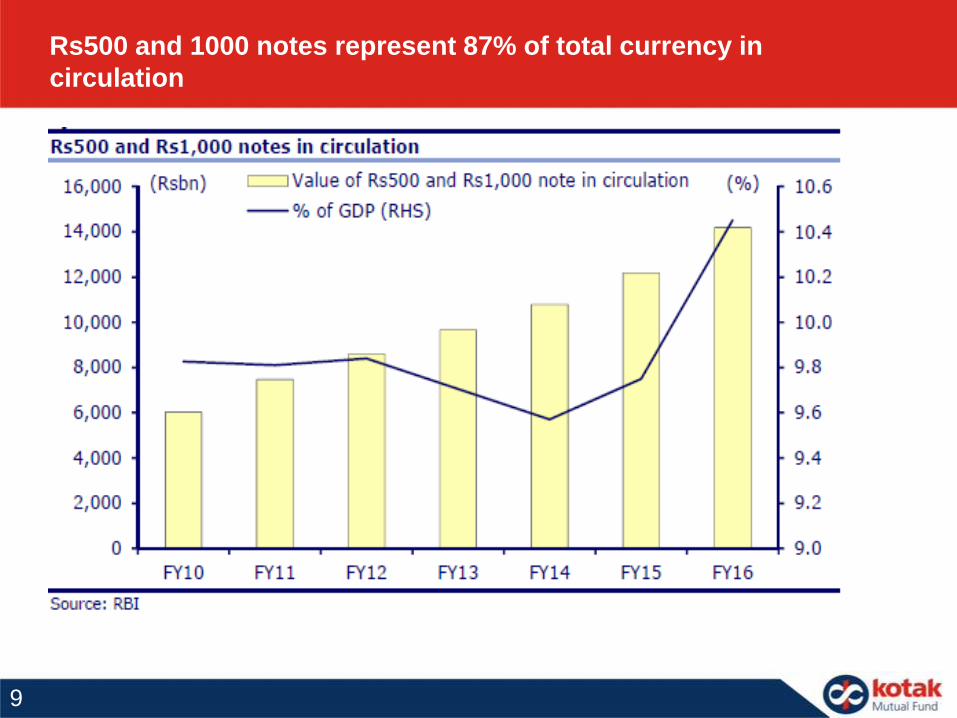
Rs500 and 1000 notes represent 87% of total currency in
circulation
9
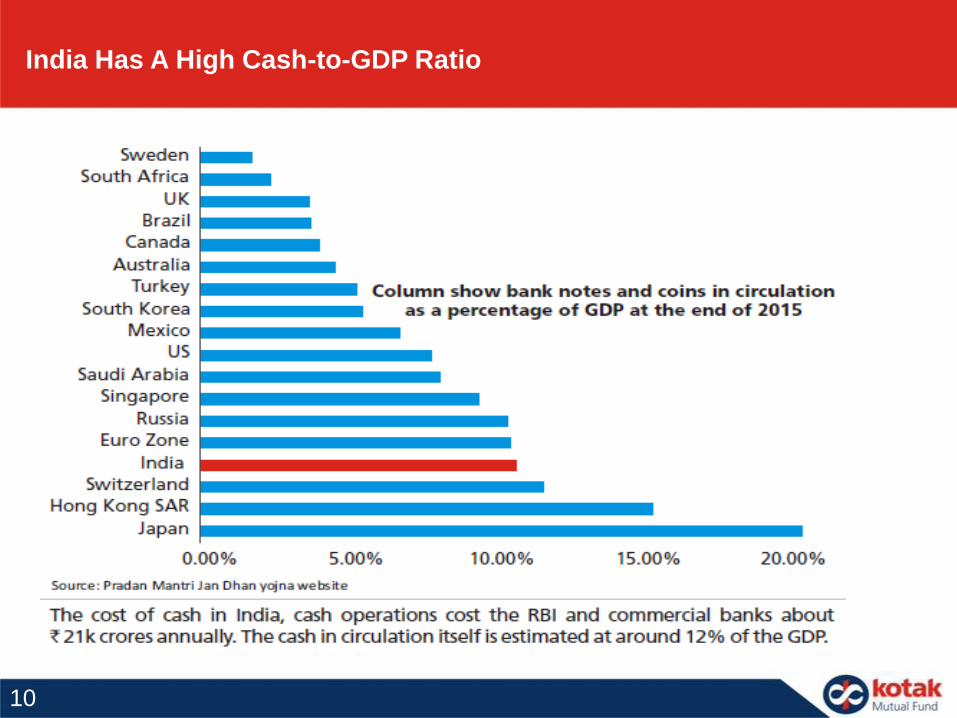
India Has A High Cash-to-GDP Ratio
10
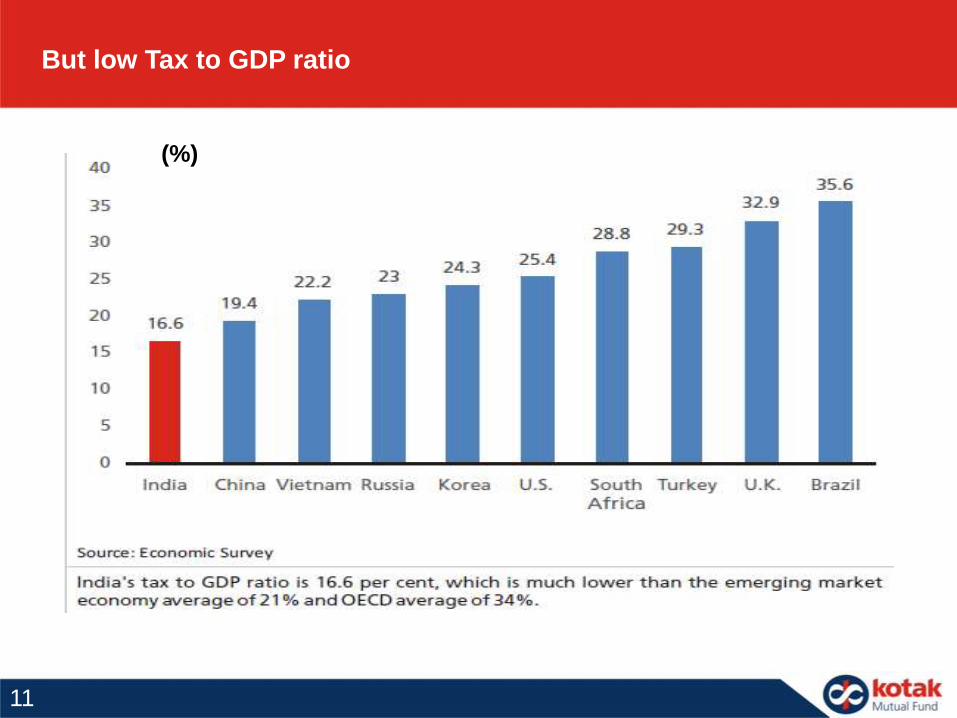
But low Tax to GDP ratio
(%)
11
Impact of Demonetization on GDP growth
12

Immediate Economic Impact
• In the near term the economy could go through a period of transition on account of these measures together with the implementation of GST
• Property prices and gold may come down as most unaccounted wealth is invested in these
• In the short term there could be a negative impact on consumption demand; This could have a bearing on GDP growth in H2FY17
• Banks with higher branch presence would benefit with higher CASA / deposit growth
• With changing business models of SMEs and property prices going down asset quality pressures may mount in certain segments
• Upcoming state level elections may also get impacted as cash will no longer be king
In summary, since money supply would decline temporarily, we could see some deflationary tendencies lowering real demand
1313
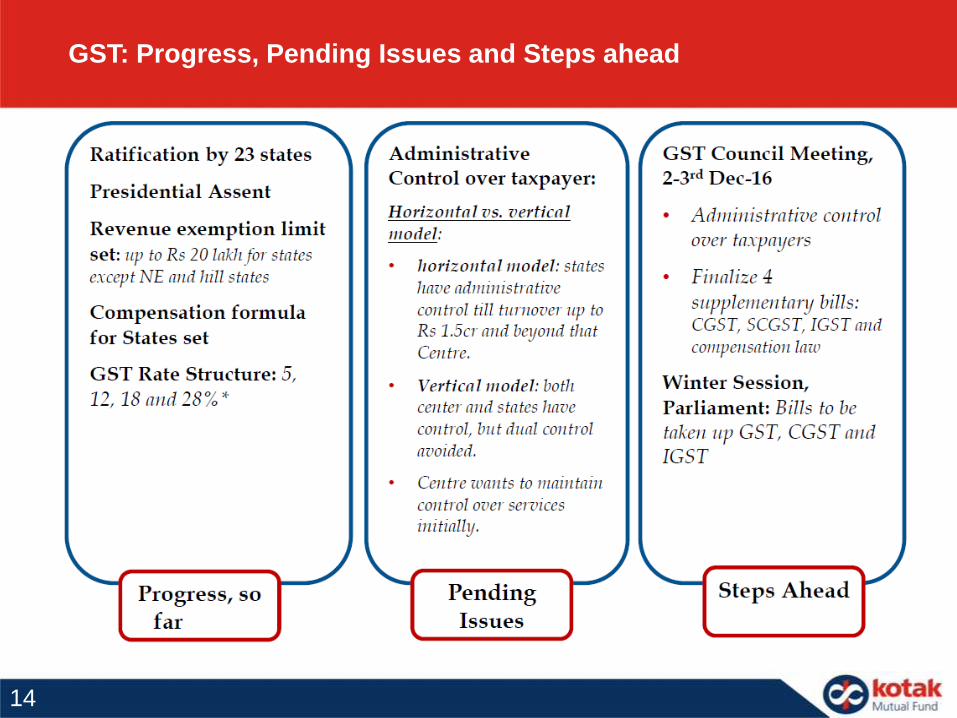
GST: Progress, Pending Issues and Steps ahead
14

• Winter Session of parliament commenced on 16th Nov and will continue until 16th December with a total of 22 sittings
• Additionally, it has been announced that the Government will present the Union Budget on 1st Feb-16
Winter Session Of Parliament
15
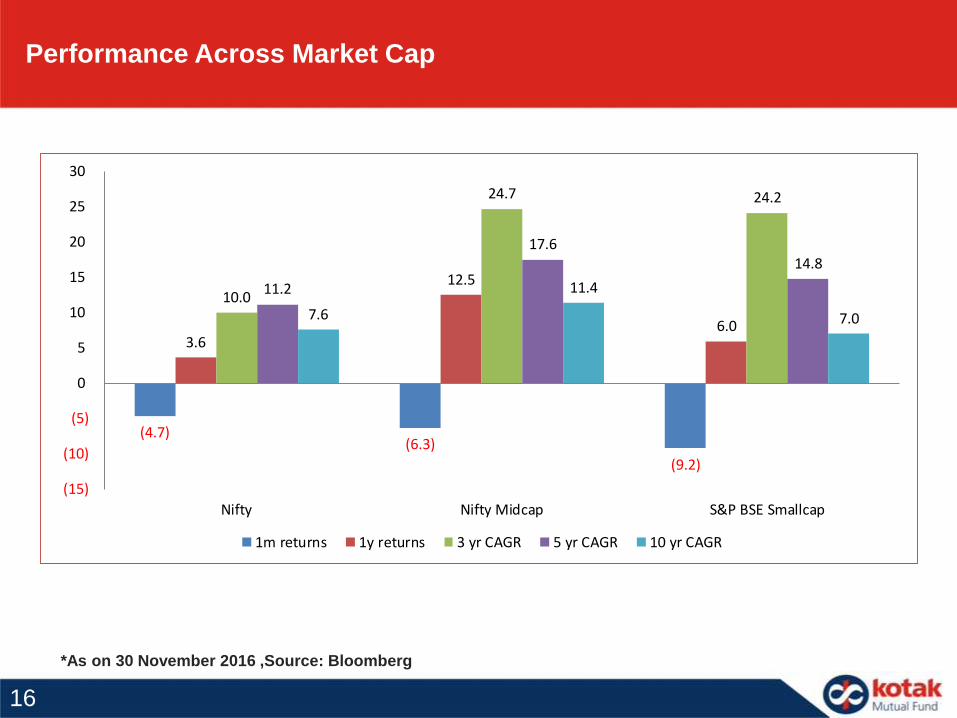
*As on 30 November 2016 ,Source: Bloomberg
Performance Across Market Cap
(4.7)(6.3)
(9.2)
3.6
12.5
6.0
10.0
24.7 24.2
11.2
17.6 14.8
7.6
11.4
7.0
(15)
(10)
(5)
0
5
10
15
20
25
30
Nifty Nifty Midcap S&P BSE Smallcap
1m returns 1y returns 3 yr CAGR 5 yr CAGR 10 yr CAGR
16
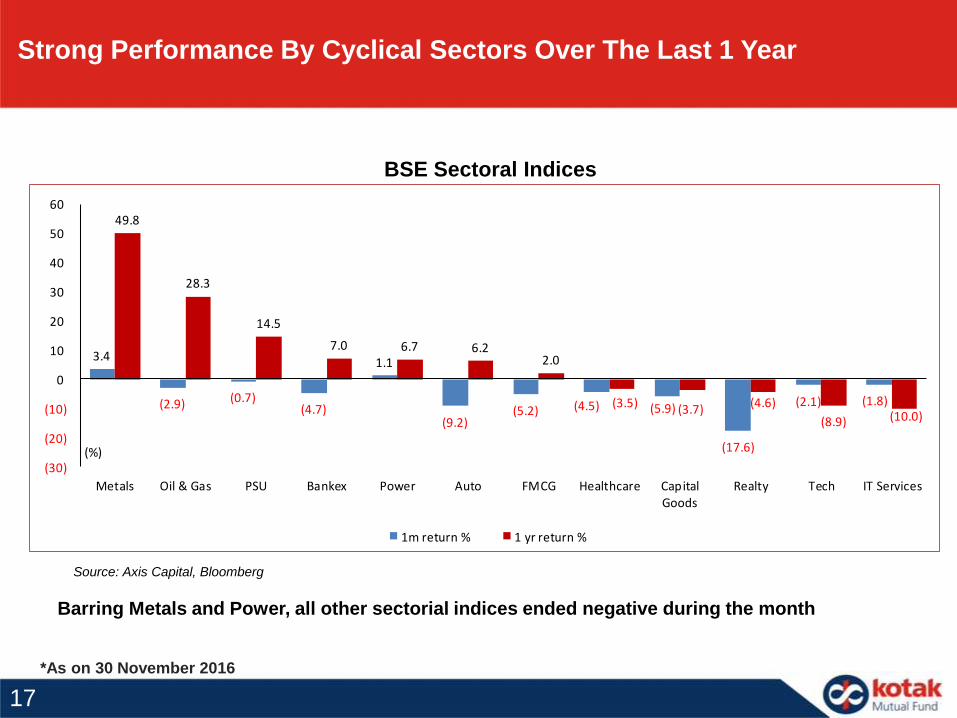
*As on 30 November 2016
Barring Metals and Power, all other sectorial indices ended negative during the month
Source: Axis Capital, Bloomberg
BSE Sectoral Indices
3.4
(2.9) (0.7)(4.7)
1.1
(9.2)(5.2) (4.5) (5.9)
(17.6)
(2.1) (1.8)
49.8
28.3
14.5
7.0 6.7 6.2 2.0
(3.5) (3.7) (4.6)
(8.9) (10.0)
(30)
(20)
(10)
0
10
20
30
40
50
60
Metals Oil & Gas PSU Bankex Power Auto FMCG Healthcare CapitalGoods
Realty Tech IT Services
(%)
1m return % 1 yr return %
Strong Performance By Cyclical Sectors Over The Last 1 Year
17

Volatility in Markets in the Short Term
Volatility may affect Equities, Debt, Real Estate etc. in the near term as
momentum swings from end to end
1918

0
10
20
30
40
50
60
70
Auto BFSI Engg FMCG IT Metals Oil Pharma Power Telecom Sensex
0
10
20
30
40
50
60
Auto BFSI Engg FMCG IT Services Metals Oil & Gas Pharma Power Telecom Sensex
-1 SD +1 SD Current Max Min
Top Quartile
Current
Lower Quartile
Min
Max
IT and Power are at lower end of valuations, other sectors have seen some moderation in
valuation
Source: Axis Capital, Bloomberg Note: * Since April-2005
Sensex sectoral long-term valuation snapshot: Forward PE*
Stock Picking Will Be Critical As Sectors Are At Higher End Of Fair Value
*As on 30 November 2016
19
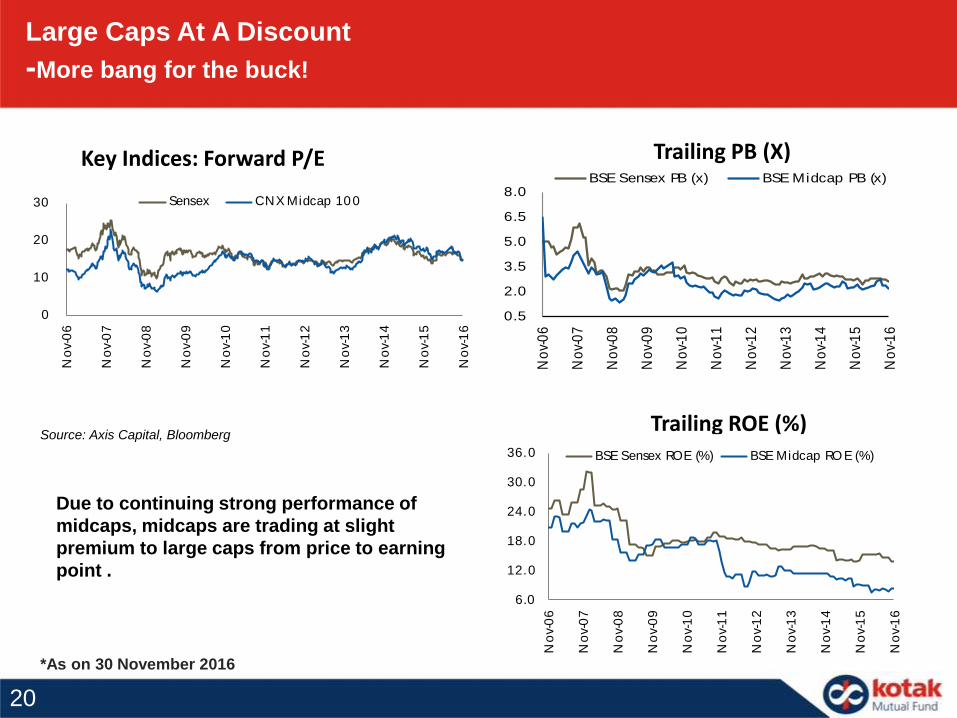
*As on 30 November 2016
Due to continuing strong performance of
midcaps, midcaps are trading at slight
premium to large caps from price to earning
point .
Source: Axis Capital, Bloomberg
Key Indices: Forward P/E
Large Caps At A Discount
-More bang for the buck!
Trailing ROE (%)
0.5
2.0
3.5
5.0
6.5
8.0
No
v-0
6
No
v-0
7
No
v-0
8
No
v-0
9
No
v-1
0
No
v-1
1
No
v-1
2
No
v-1
3
No
v-1
4
No
v-1
5
No
v-1
6
BSE Sensex PB (x) BSE Midcap PB (x)
6.0
12.0
18.0
24.0
30.0
36.0
No
v-0
6
No
v-0
7
No
v-0
8
No
v-0
9
No
v-1
0
No
v-1
1
No
v-1
2
No
v-1
3
No
v-1
4
No
v-1
5
No
v-1
6
BSE Sensex ROE (%) BSE Midcap RO E (%)
Trailing PB (X)
0
10
20
30
No
v-0
6
No
v-0
7
No
v-0
8
No
v-0
9
No
v-1
0
No
v-1
1
No
v-1
2
No
v-1
3
No
v-1
4
No
v-1
5
No
v-1
6
Sensex CNX Midcap 100
20

Indian Markets Middle Of Pack In Terms Of 1yr Return
Source: Bloomberg. Performance data
(13.3)
(12.8)
(8.2)
(7.3)
(6.7)
(3.2)
(0.4)
0.5
1.7
3.6
3.6
6.5
7.9
11.1
15.8
17.8
35.2
(0.6)
0.2
0.9
5.1
(0.4)
(3.2)
(1.2)
2.9
3.2
(0.6)
(4.7)
(2.6)
5.4
(0.5)
(5.0)
4.9
(6.1)
(20) (10) 0 10 20 30 40
EURO (Euro Stoxx 50)
Swiss (SMI)
France (CACS 40)
Japan (Nikkei 225)
Germany (DAX)
Malaysia (KLCI - FTSE)
Korea (Kospi)
China (HSCEI)
Singapore (Straits)
HK (HSI)
India (Nifty)
UK (FTSE 100)
US (Dow Jones)
Taiwan (TSWE)
Indonesia (JCI)
Russia (MICEX)
Brazil (IBOV)
1M 1Yr
21
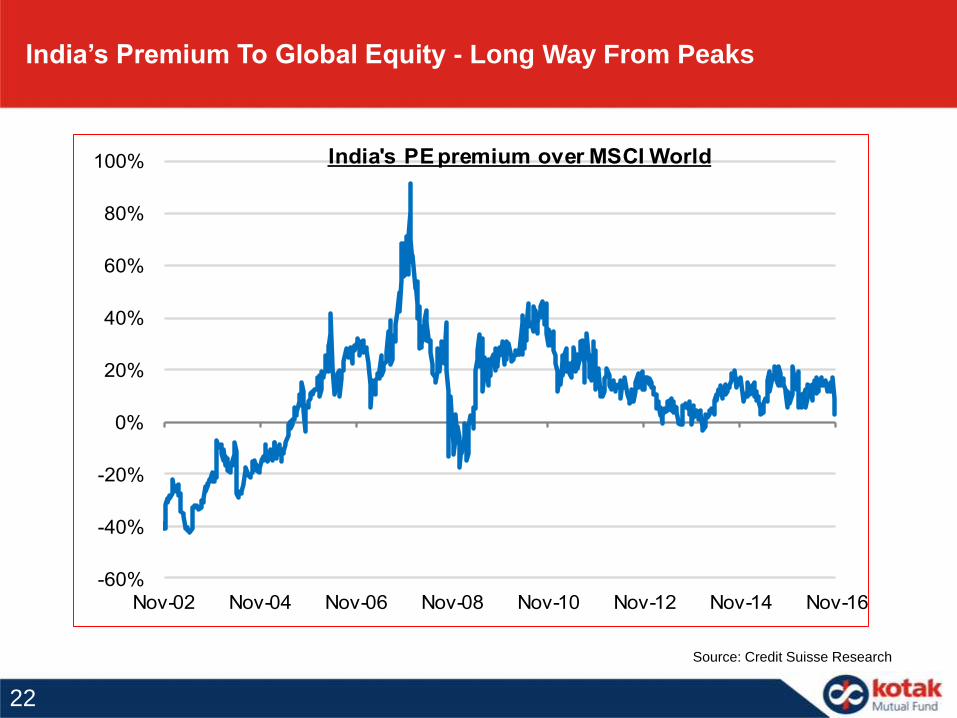
India’s Premium To Global Equity - Long Way From Peaks
Source: Credit Suisse Research
-60%
-40%
-20%
0%
20%
40%
60%
80%
100%
Nov-02 Nov-04 Nov-06 Nov-08 Nov-10 Nov-12 Nov-14 Nov-16
India's PE premium over MSCI World
22
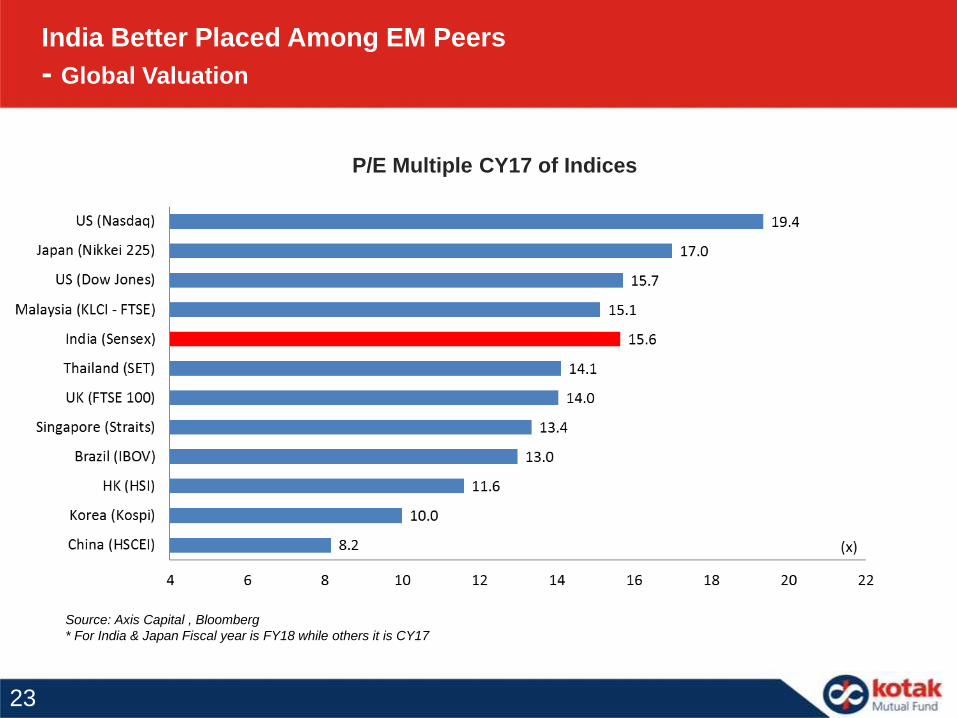
P/E Multiple CY17 of Indices
Source: Axis Capital , Bloomberg
* For India & Japan Fiscal year is FY18 while others it is CY17
India Better Placed Among EM Peers
- Global Valuation
23
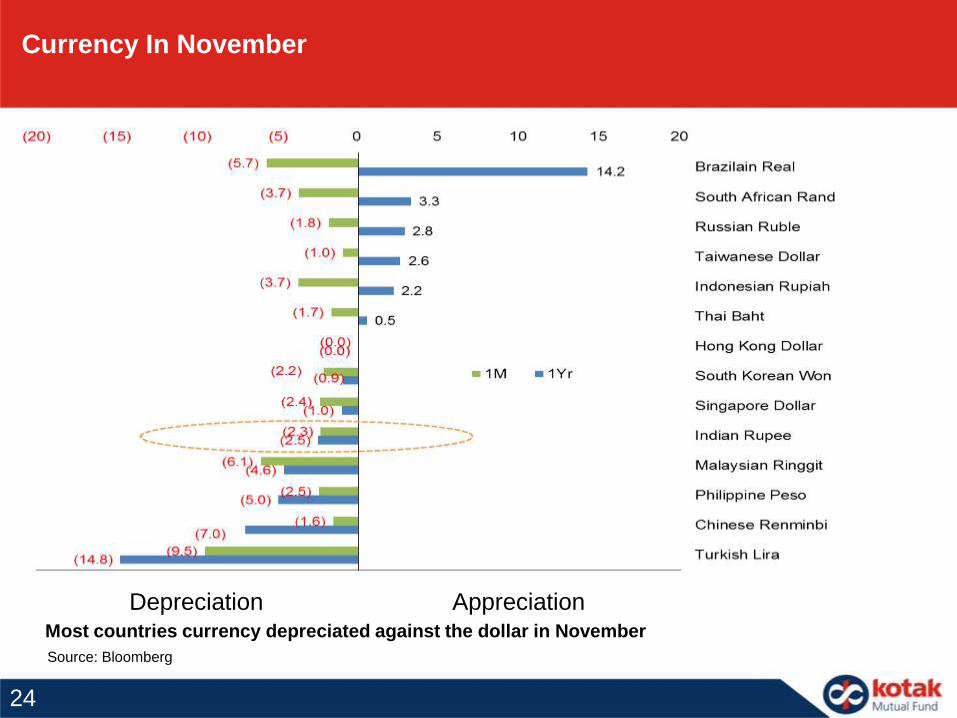
Currency In November
Most countries currency depreciated against the dollar in November
Source: Bloomberg
Depreciation Appreciation
24
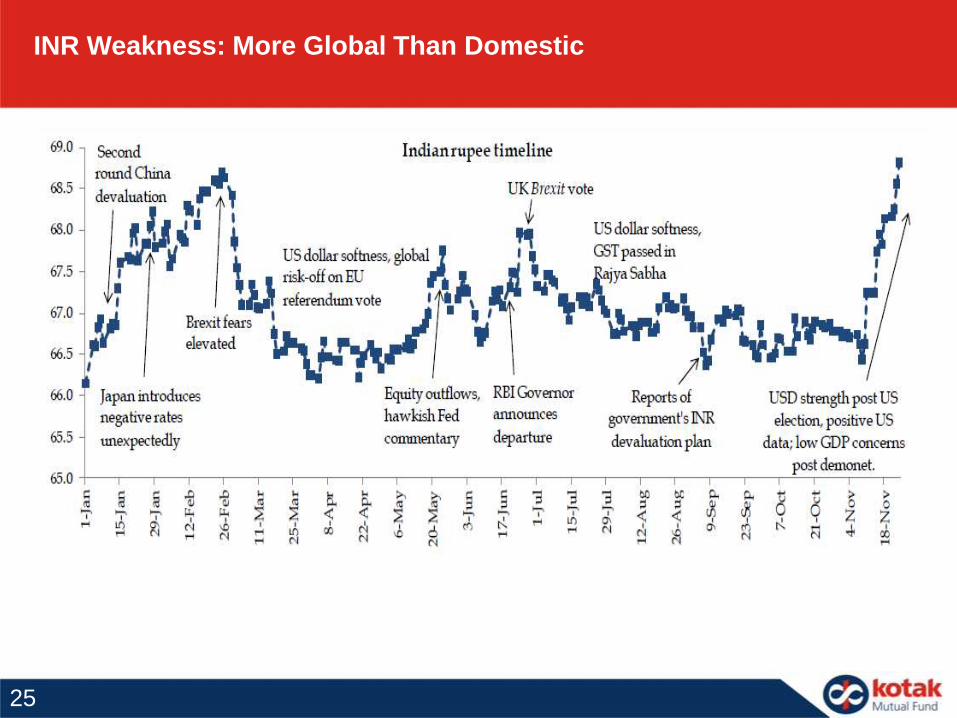
INR Weakness: More Global Than Domestic
25
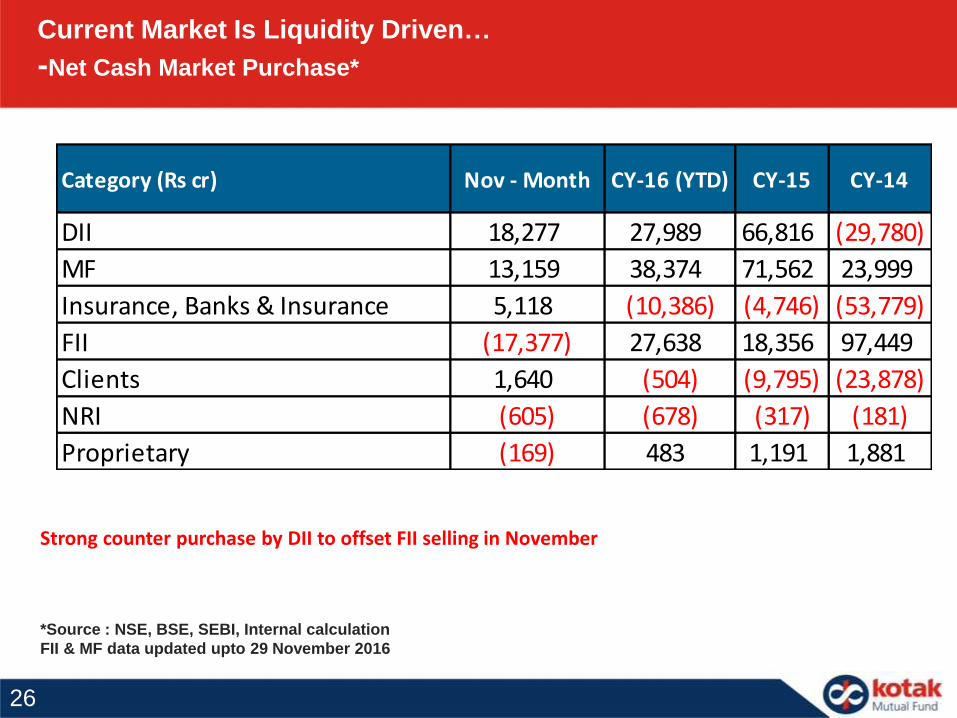
*Source : NSE, BSE, SEBI, Internal calculation
FII & MF data updated upto 29 November 2016
Strong counter purchase by DII to offset FII selling in November
Current Market Is Liquidity Driven…
-Net Cash Market Purchase*
Category (Rs cr) Nov - Month CY-16 (YTD) CY-15 CY-14
DII 18,277 27,989 66,816 (29,780)
MF 13,159 38,374 71,562 23,999
Insurance, Banks & Insurance 5,118 (10,386) (4,746) (53,779)
FII (17,377) 27,638 18,356 97,449
Clients 1,640 (504) (9,795) (23,878)
NRI (605) (678) (317) (181)
Proprietary (169) 483 1,191 1,881
26
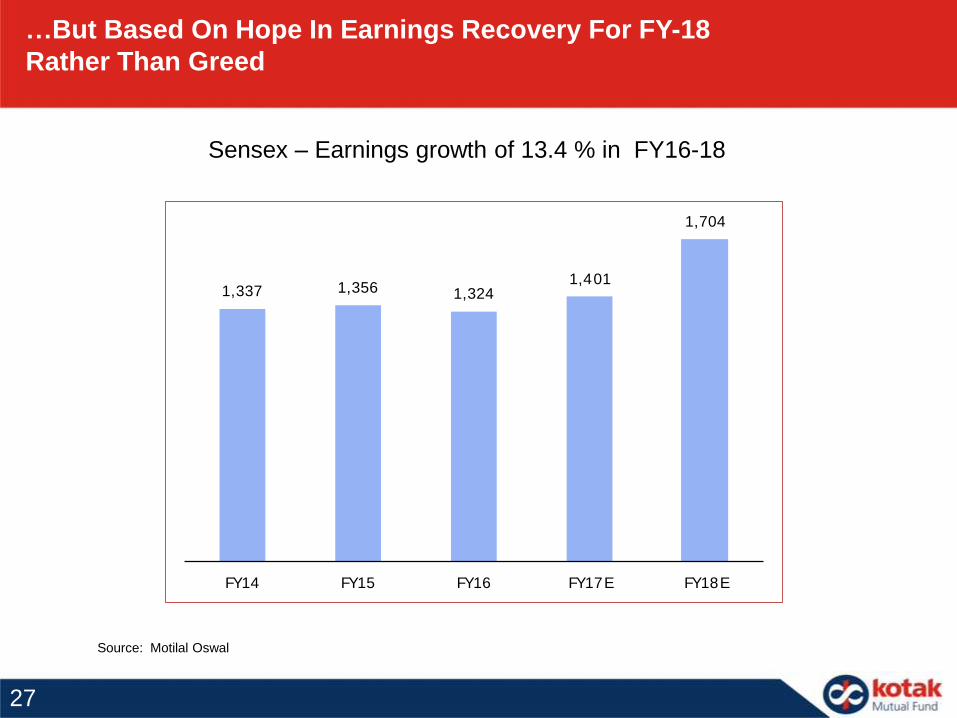
…But Based On Hope In Earnings Recovery For FY-18
Rather Than Greed
Sensex – Earnings growth of 13.4 % in FY16-18
Source: Motilal Oswal
1,337 1,356 1,3241,401
1,704
FY14 FY15 FY16 FY17E FY18E
27
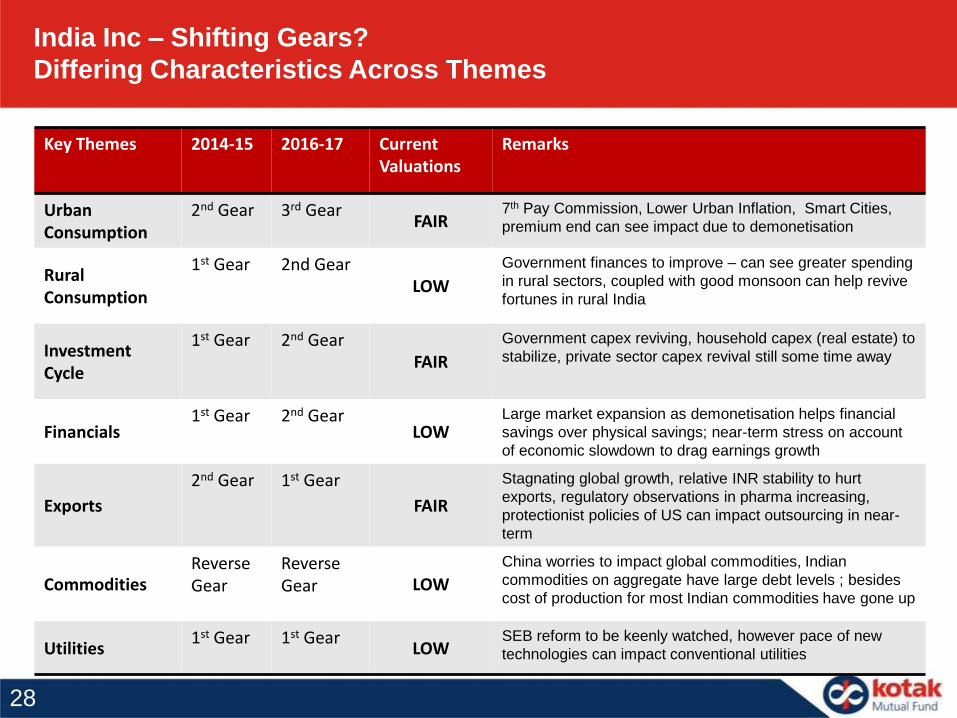
India Inc – Shifting Gears?
Differing Characteristics Across Themes
Key Themes 2014-15 2016-17 Current Valuations
Remarks
Urban Consumption
2nd Gear 3rd GearFAIR
7th Pay Commission, Lower Urban Inflation, Smart Cities,
premium end can see impact due to demonetisation
Rural Consumption
1st Gear 2nd GearLOW
Government finances to improve – can see greater spending
in rural sectors, coupled with good monsoon can help revive
fortunes in rural India
Investment Cycle
1st Gear 2nd GearFAIR
Government capex reviving, household capex (real estate) to
stabilize, private sector capex revival still some time away
Financials1st Gear 2nd Gear
LOWLarge market expansion as demonetisation helps financial
savings over physical savings; near-term stress on account
of economic slowdown to drag earnings growth
Exports
2nd Gear 1st Gear
FAIR
Stagnating global growth, relative INR stability to hurt
exports, regulatory observations in pharma increasing,
protectionist policies of US can impact outsourcing in near-
term
CommoditiesReverseGear
Reverse Gear LOW
China worries to impact global commodities, Indian
commodities on aggregate have large debt levels ; besides
cost of production for most Indian commodities have gone up
Utilities1st Gear 1st Gear
LOWSEB reform to be keenly watched, however pace of new
technologies can impact conventional utilities
28
Earnings Will Recover In FY 18 Because Of
Interest Rate Cut
Neutral liquidity resulting in better transmission
Govt. spending 46% of net tax revenue on interest
payments with Debt/GDP of 65%
Capacity Utilisation
Low capacity utilization
Decline in new investment intentions
Exports Recovering
Make in India
Government Spending
Infrastructure
7th Pay Commission
Improved finances due to demonetisation
2929
Flows
Sentiment
Fundamentals
There Is Triveni Sangam In Equity Market
Improving Ease of Doing Business, GST, FDI flows, Monsoon, Liquidity
Mutual Funds
Private Insurance
Cos
Retail & HNIs
FIIs
LIC
Banks,
EPFO,
NPS and
Private PF Trust
• Fiscal
Prudence
• GDP Growth
• FDI
• Reforms
• Demographic
dividend
• Stable Polity
3030
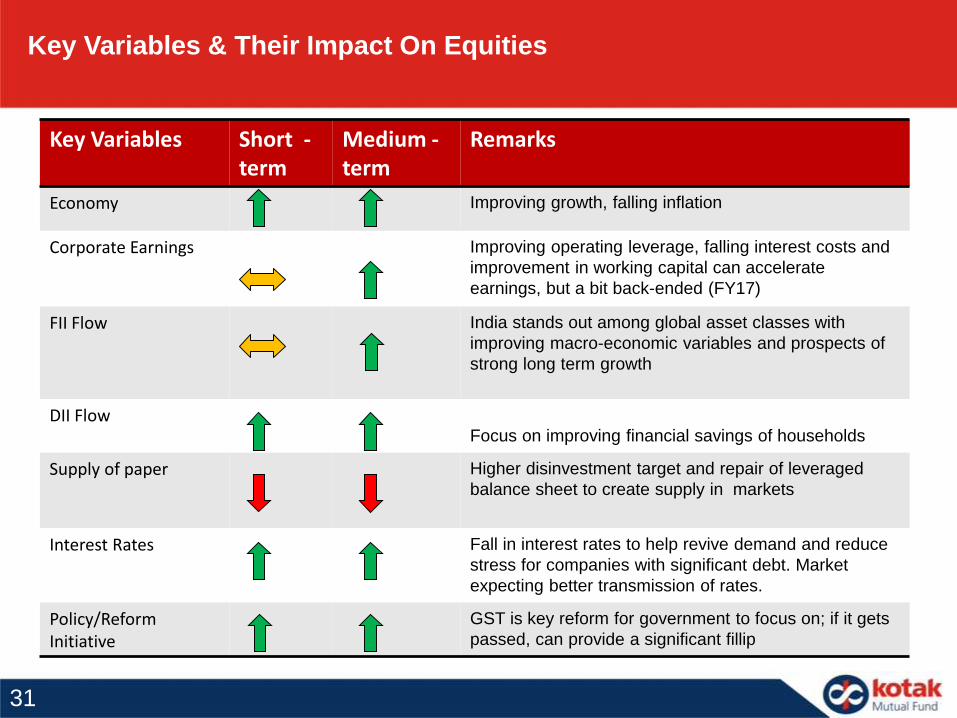
Key Variables & Their Impact On Equities
Key Variables Short -term
Medium -term
Remarks
Economy Improving growth, falling inflation
Corporate Earnings Improving operating leverage, falling interest costs and
improvement in working capital can accelerate
earnings, but a bit back-ended (FY17)
FII Flow India stands out among global asset classes with
improving macro-economic variables and prospects of
strong long term growth
DII FlowFocus on improving financial savings of households
Supply of paper Higher disinvestment target and repair of leveraged
balance sheet to create supply in markets
Interest Rates Fall in interest rates to help revive demand and reduce
stress for companies with significant debt. Market
expecting better transmission of rates.
Policy/Reform Initiative
GST is key reform for government to focus on; if it gets
passed, can provide a significant fillip
31
What Next?– Upcoming drivers and draggers
• GST Bill
• The Govt. is targeting GST roll out by April 1,2017. Most Corporates are not prepared from
infrastructure point view till Mid of FY 18. Will the roll out be deferred ?
• Demonitisation effects on following high frequency indicators
• Rabi crop sowing
• Wholesale prices of essential commodities
• Property registrations
• Consumption indicators like auto sales, durables sales etc
• 3QFY17 corporate earnings to be closely watched
3232
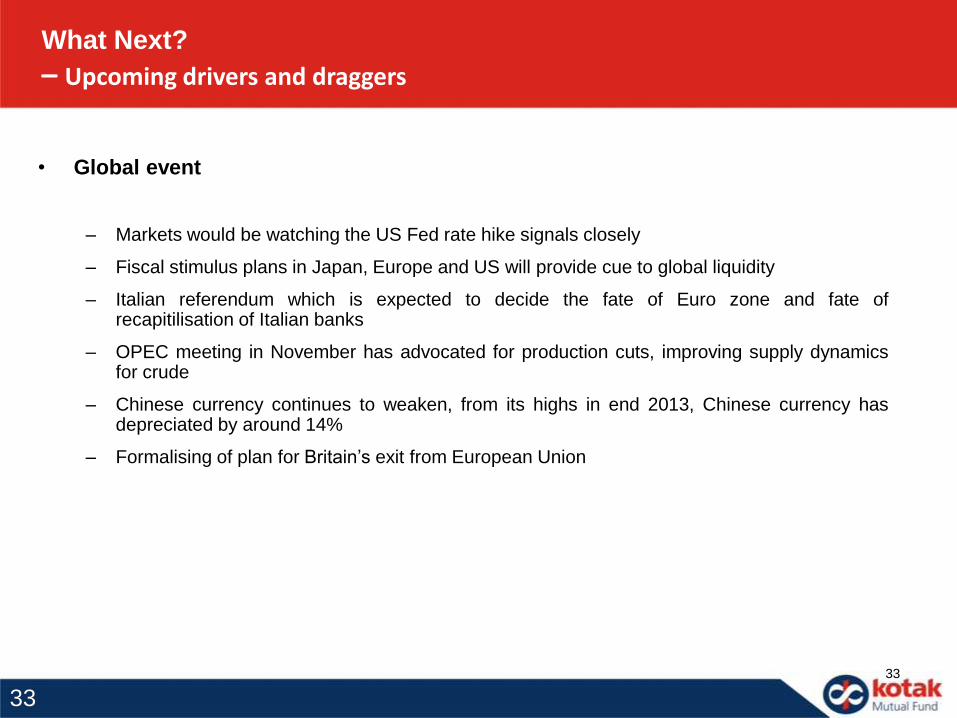
What Next?
– Upcoming drivers and draggers
• Global event
– Markets would be watching the US Fed rate hike signals closely
– Fiscal stimulus plans in Japan, Europe and US will provide cue to global liquidity
– Italian referendum which is expected to decide the fate of Euro zone and fate ofrecapitilisation of Italian banks
– OPEC meeting in November has advocated for production cuts, improving supply dynamicsfor crude
– Chinese currency continues to weaken, from its highs in end 2013, Chinese currency hasdepreciated by around 14%
– Formalising of plan for Britain’s exit from European Union
33
3333

SECTOR & THEMATIC
STANCE
34
Demonetization – Sector-wise Impact
Sector Short term impact Long term impact
Financials Banks Marginally negative- With low credit growth
opportunities higher deposit accretion may
impact NIMs negatively in ST as the credit-
deposit ratio falls; Credit growth is likely to
decline in the near term; Banks may book
higher treasury profits on the back of falling
yields
Positive - Banks will benefit with improving low cost deposit
base (though it remains to be seen how much would remain
within the system. Falling yields is a long term structural
positive for the sector. In the event that the government
utilises RBI's surplus for recapitalisation of PSU banks (still
no clarity on whether it can be used) it would be a positive
NBFCS Negative - Most of NBFCs have a large part of
their collections in cash and hence collection
efficiency would get impacted and there could
be a rise in near term overdues (RBI has given
forbearance for NPL recognition); Near term
impact on loan growth would be negative as
disbursements have slowed down
Negative - Housing finance companies my see pressure of
slump in real estate and lower prices which could be a long
term impact of demonetisation resulting in lower growth. In
this regard Loan against property (LAP) portfolios of NBFCs
could see an impact in terms of growth and NPLs; With
decline in resale prices of used vehicles, loan growth in
some segments could be impacted
MFIs/SFBs Negative - On the back lower collection
efficiency and lower disbursements impacting
growth. Small Finance Banks (SFBs) are better
placed as they can collect dues in the old notes
by virtue of them being a bank
Neutral - Collection efficiency is likely to improve over time
as new currency comes into circulation. The loans being
smaller in ticket size and largely linked to livelihood
generation we do not anticipate a long term asset quality
issue.
35
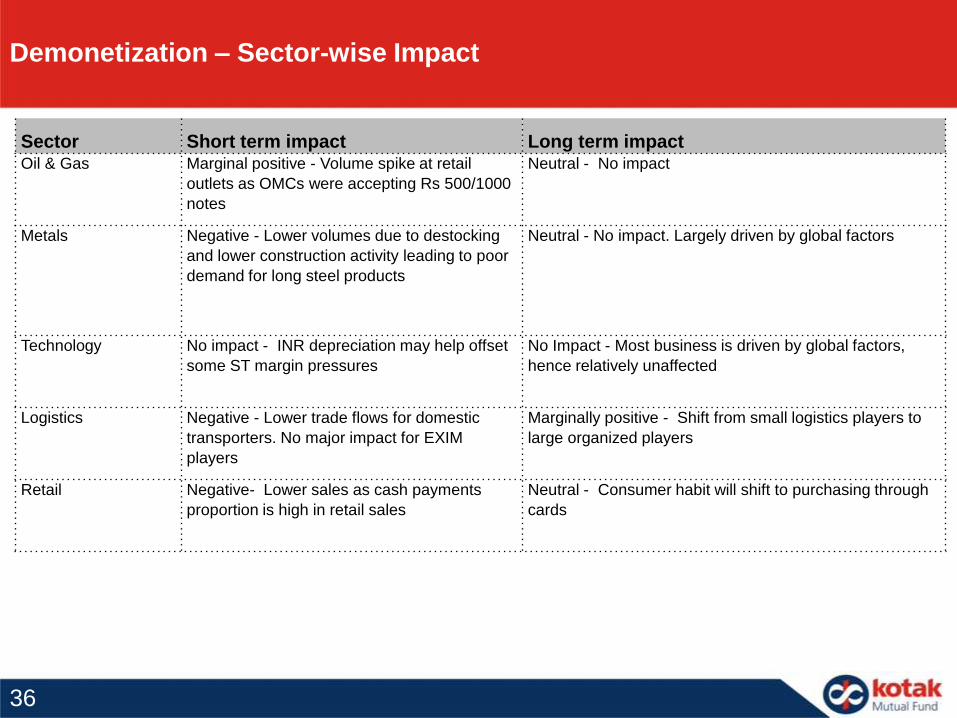
Demonetization – Sector-wise Impact
Sector Short term impact Long term impact Oil & Gas Marginal positive - Volume spike at retail
outlets as OMCs were accepting Rs 500/1000
notes
Neutral - No impact
Metals Negative - Lower volumes due to destocking
and lower construction activity leading to poor
demand for long steel products
Neutral - No impact. Largely driven by global factors
Technology No impact - INR depreciation may help offset
some ST margin pressures
No Impact - Most business is driven by global factors,
hence relatively unaffected
Logistics Negative - Lower trade flows for domestic
transporters. No major impact for EXIM
players
Marginally positive - Shift from small logistics players to
large organized players
Retail Negative- Lower sales as cash payments
proportion is high in retail sales
Neutral - Consumer habit will shift to purchasing through
cards
36
Demonetization – Sector-wise Impact
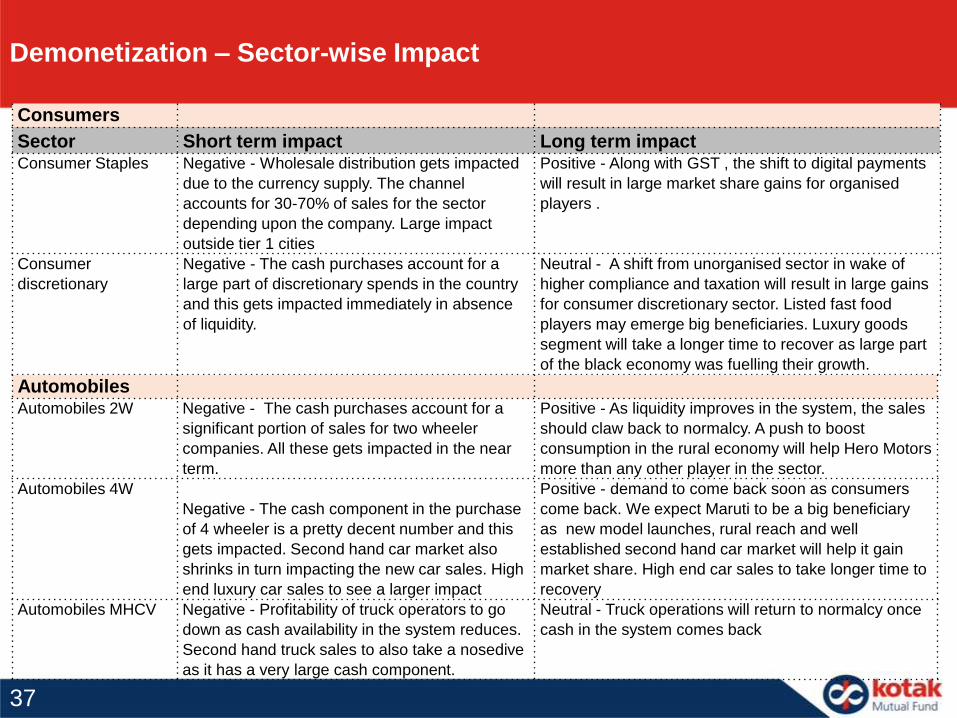
Consumers
Sector Short term impact Long term impact Consumer Staples Negative - Wholesale distribution gets impacted
due to the currency supply. The channel
accounts for 30-70% of sales for the sector
depending upon the company. Large impact
outside tier 1 cities
Positive - Along with GST , the shift to digital payments
will result in large market share gains for organised
players .
Consumer
discretionary
Negative - The cash purchases account for a
large part of discretionary spends in the country
and this gets impacted immediately in absence
of liquidity.
Neutral - A shift from unorganised sector in wake of
higher compliance and taxation will result in large gains
for consumer discretionary sector. Listed fast food
players may emerge big beneficiaries. Luxury goods
segment will take a longer time to recover as large part
of the black economy was fuelling their growth.
AutomobilesAutomobiles 2W Negative - The cash purchases account for a
significant portion of sales for two wheeler
companies. All these gets impacted in the near
term.
Positive - As liquidity improves in the system, the sales
should claw back to normalcy. A push to boost
consumption in the rural economy will help Hero Motors
more than any other player in the sector.
Automobiles 4W
Negative - The cash component in the purchase
of 4 wheeler is a pretty decent number and this
gets impacted. Second hand car market also
shrinks in turn impacting the new car sales. High
end luxury car sales to see a larger impact
Positive - demand to come back soon as consumers
come back. We expect Maruti to be a big beneficiary
as new model launches, rural reach and well
established second hand car market will help it gain
market share. High end car sales to take longer time to
recovery
Automobiles MHCV Negative - Profitability of truck operators to go
down as cash availability in the system reduces.
Second hand truck sales to also take a nosedive
as it has a very large cash component.
Neutral - Truck operations will return to normalcy once
cash in the system comes back
37
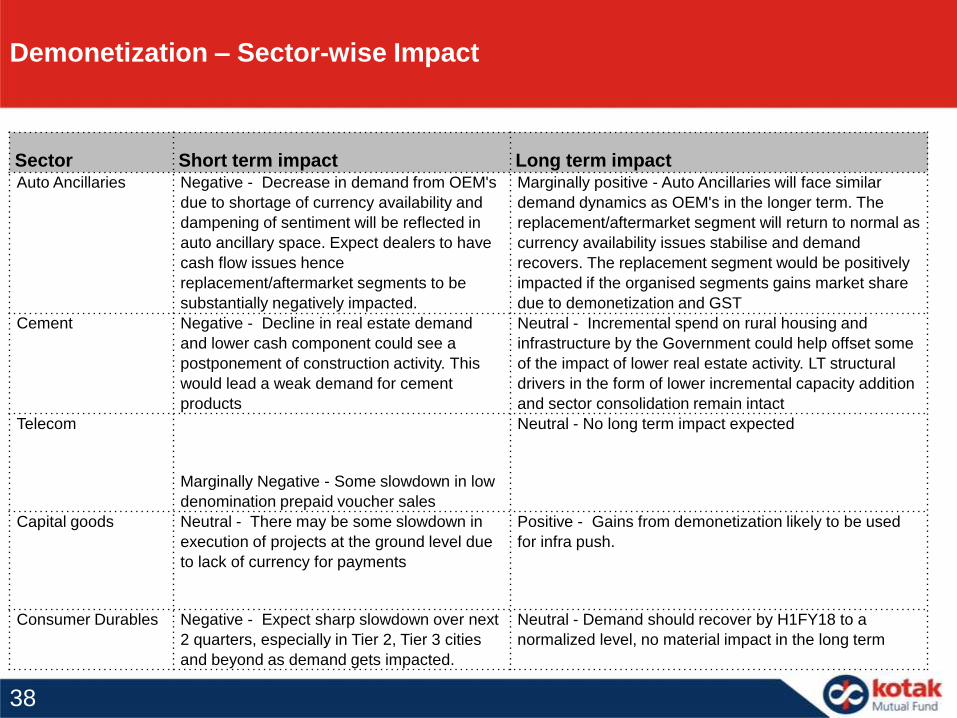
Demonetization – Sector-wise Impact
Sector Short term impact Long term impact Auto Ancillaries Negative - Decrease in demand from OEM's
due to shortage of currency availability and
dampening of sentiment will be reflected in
auto ancillary space. Expect dealers to have
cash flow issues hence
replacement/aftermarket segments to be
substantially negatively impacted.
Marginally positive - Auto Ancillaries will face similar
demand dynamics as OEM's in the longer term. The
replacement/aftermarket segment will return to normal as
currency availability issues stabilise and demand
recovers. The replacement segment would be positively
impacted if the organised segments gains market share
due to demonetization and GST
Cement Negative - Decline in real estate demand
and lower cash component could see a
postponement of construction activity. This
would lead a weak demand for cement
products
Neutral - Incremental spend on rural housing and
infrastructure by the Government could help offset some
of the impact of lower real estate activity. LT structural
drivers in the form of lower incremental capacity addition
and sector consolidation remain intact
Telecom
Marginally Negative - Some slowdown in low
denomination prepaid voucher sales
Neutral - No long term impact expected
Capital goods Neutral - There may be some slowdown in
execution of projects at the ground level due
to lack of currency for payments
Positive - Gains from demonetization likely to be used
for infra push.
Consumer Durables Negative - Expect sharp slowdown over next
2 quarters, especially in Tier 2, Tier 3 cities
and beyond as demand gets impacted.
Neutral - Demand should recover by H1FY18 to a
normalized level, no material impact in the long term
38
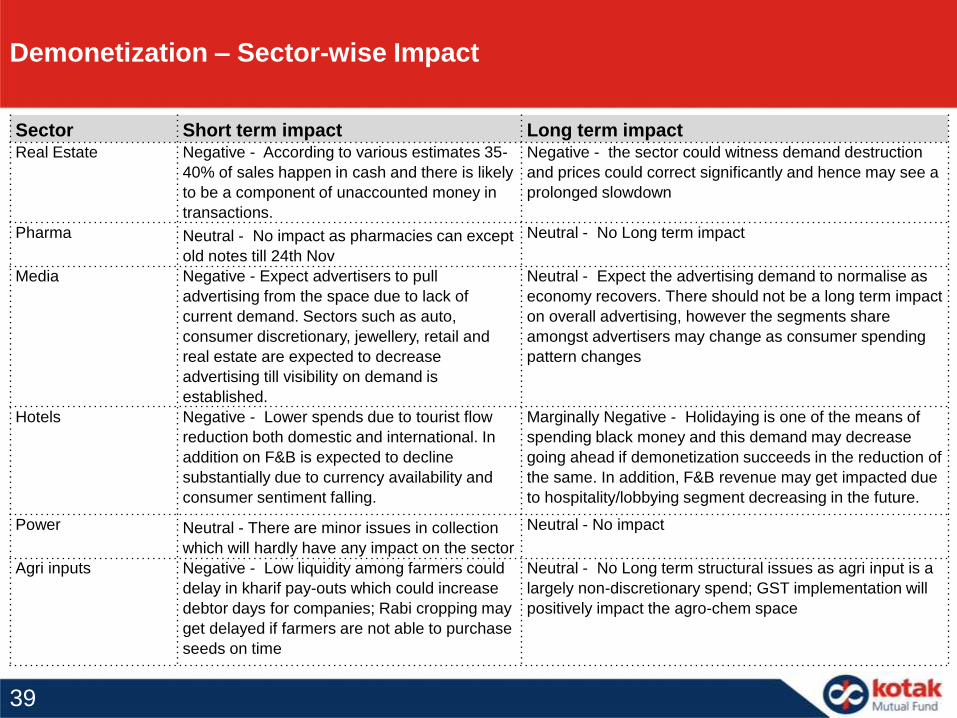
Demonetization – Sector-wise Impact
Sector Short term impact Long term impact Real Estate Negative - According to various estimates 35-
40% of sales happen in cash and there is likely
to be a component of unaccounted money in
transactions.
Negative - the sector could witness demand destruction
and prices could correct significantly and hence may see a
prolonged slowdown
Pharma Neutral - No impact as pharmacies can except
old notes till 24th Nov
Neutral - No Long term impact
Media Negative - Expect advertisers to pull
advertising from the space due to lack of
current demand. Sectors such as auto,
consumer discretionary, jewellery, retail and
real estate are expected to decrease
advertising till visibility on demand is
established.
Neutral - Expect the advertising demand to normalise as
economy recovers. There should not be a long term impact
on overall advertising, however the segments share
amongst advertisers may change as consumer spending
pattern changes
Hotels Negative - Lower spends due to tourist flow
reduction both domestic and international. In
addition on F&B is expected to decline
substantially due to currency availability and
consumer sentiment falling.
Marginally Negative - Holidaying is one of the means of
spending black money and this demand may decrease
going ahead if demonetization succeeds in the reduction of
the same. In addition, F&B revenue may get impacted due
to hospitality/lobbying segment decreasing in the future.
Power Neutral - There are minor issues in collection
which will hardly have any impact on the sector
Neutral - No impact
Agri inputs Negative - Low liquidity among farmers could
delay in kharif pay-outs which could increase
debtor days for companies; Rabi cropping may
get delayed if farmers are not able to purchase
seeds on time
Neutral - No Long term structural issues as agri input is a
largely non-discretionary spend; GST implementation will
positively impact the agro-chem space
39
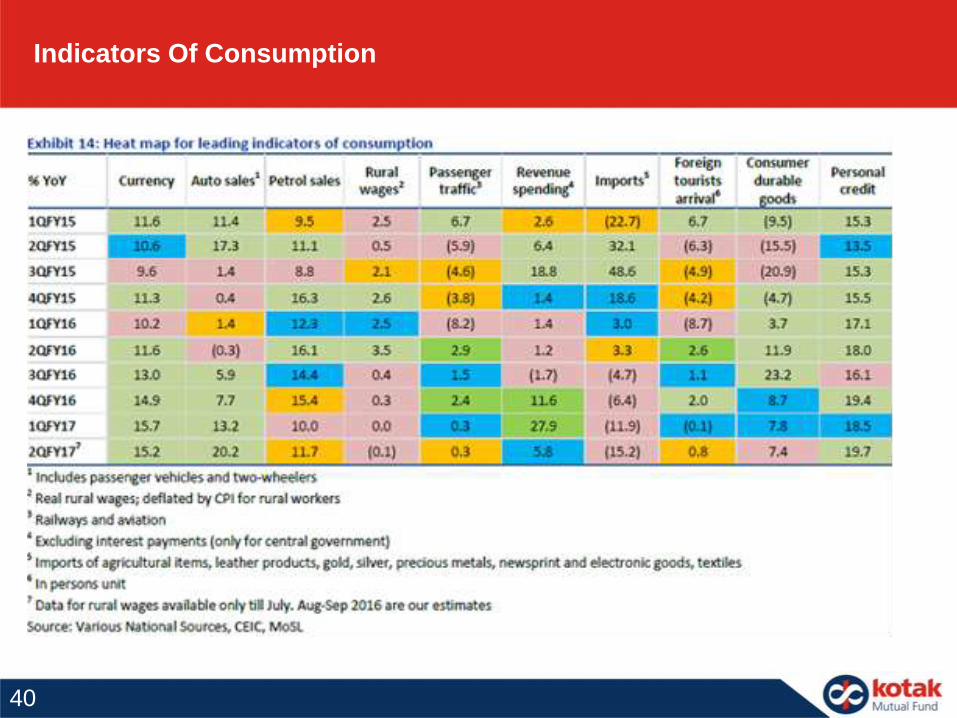
Indicators Of Consumption
40
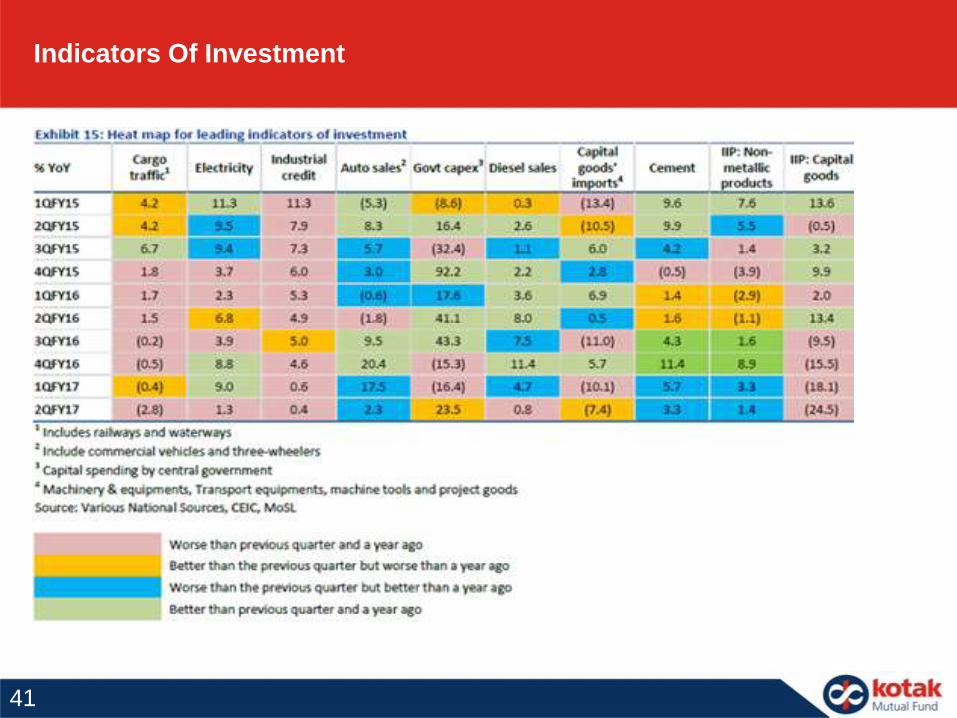
Indicators Of Investment
41
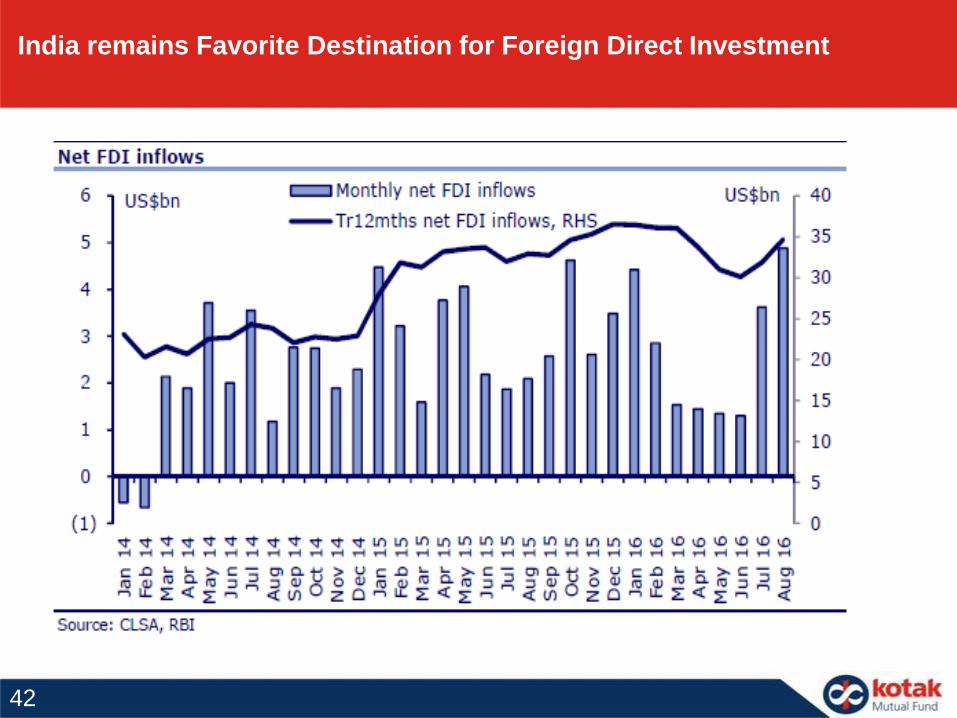
India remains Favorite Destination for Foreign Direct Investment
42
-10% -5% 0% 5% 10% 15% 20% 25%
Construction
Business Services
IT
Telecom
Trade
Transportation
Financials
Mining
Misc. Services
Education
Restaurants
Trading
Manufacturing
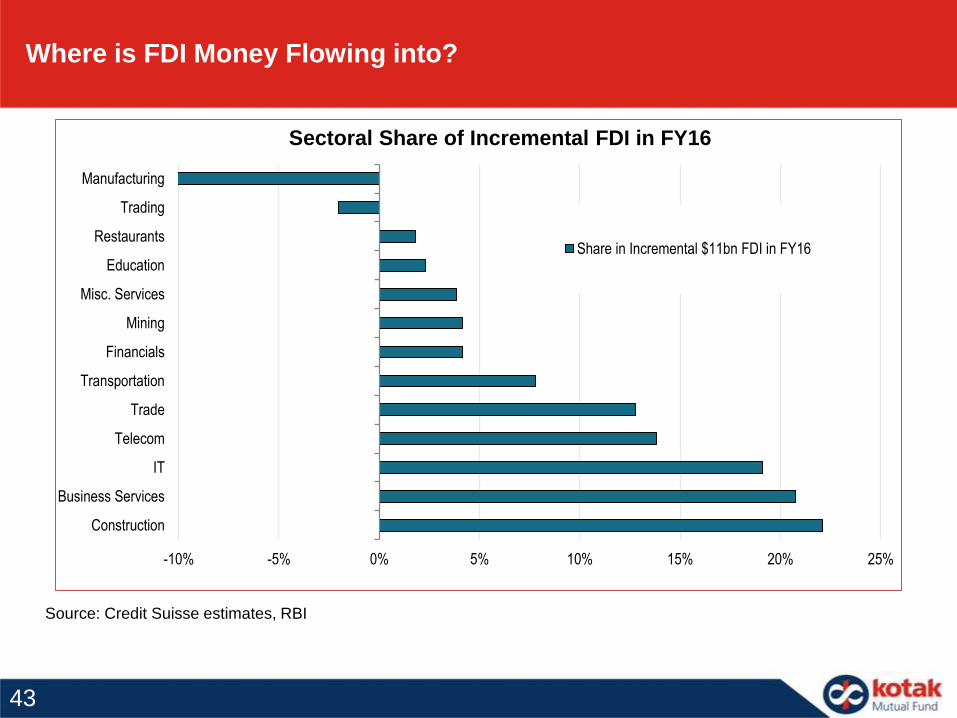
Share in Incremental $11bn FDI in FY16
Sectoral Share of Incremental FDI in FY16
Where is FDI Money Flowing into?
Source: Credit Suisse estimates, RBI
43
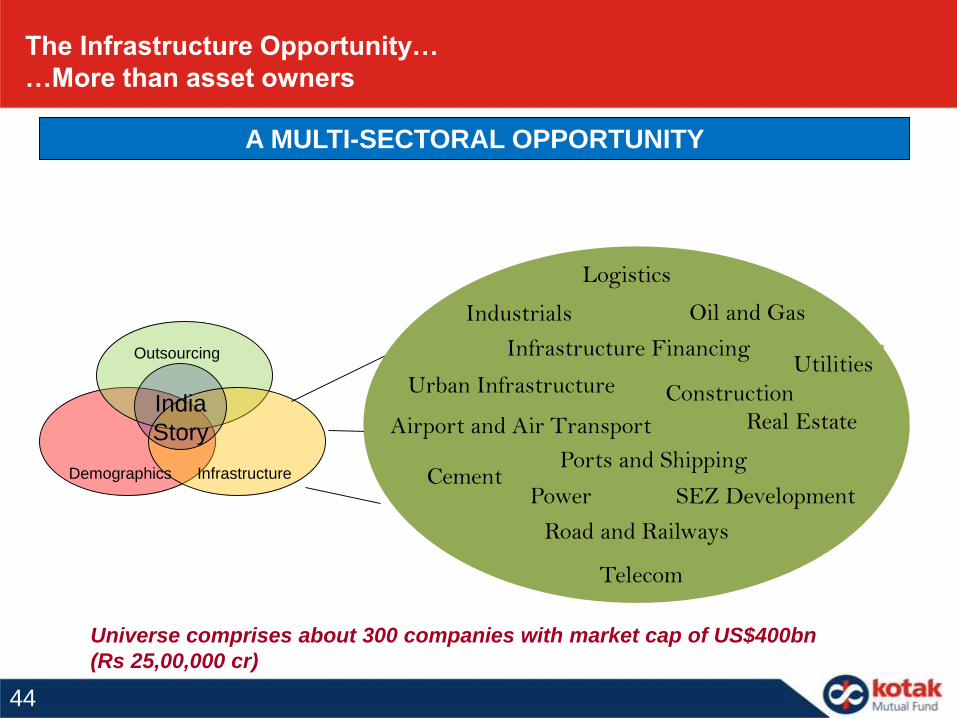
The Infrastructure Opportunity…
…More than asset owners
Demographics
Outsourcing
Infrastructure
India
Story
Universe comprises about 300 companies with market cap of US$400bn
(Rs 25,00,000 cr)
Airport and Air Transport
Cement
Industrials
Infrastructure Financing
Logistics
Oil and Gas
Ports and Shipping
Power
Real Estate
SEZ Development
Road and Railways
Telecom
UtilitiesUrban Infrastructure Construction
A MULTI-SECTORAL OPPORTUNITY
44
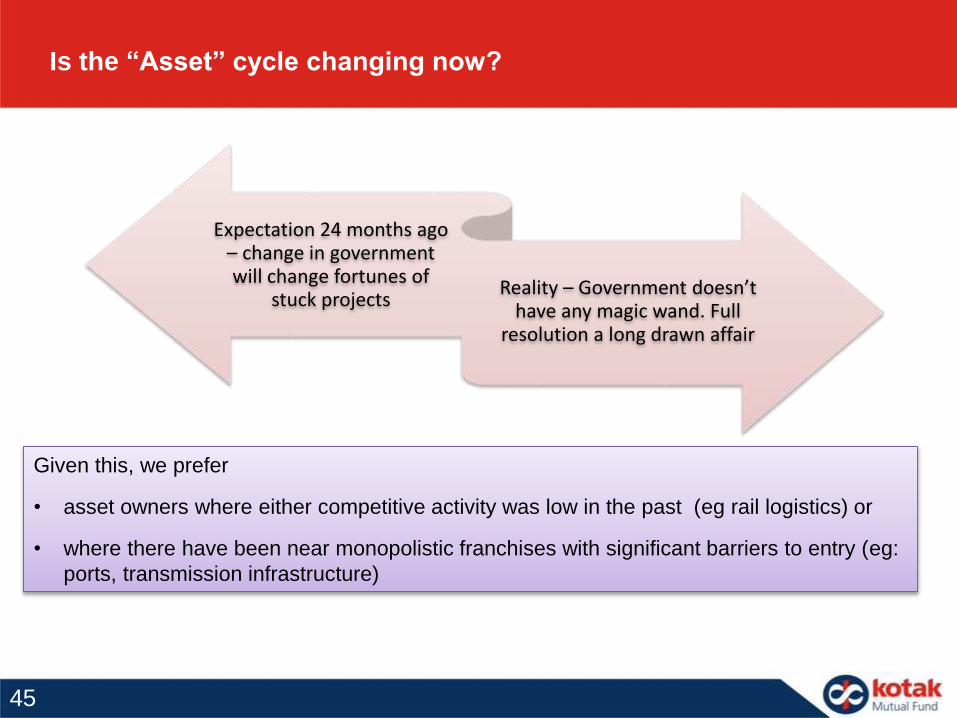
Is the “Asset” cycle changing now?
Expectation 24 months ago – change in governmentwill change fortunes of
stuck projectsReality – Government doesn’t
have any magic wand. Full resolution a long drawn affair
Given this, we prefer
• asset owners where either competitive activity was low in the past (eg rail logistics) or
• where there have been near monopolistic franchises with significant barriers to entry (eg:
ports, transmission infrastructure)
45

Better cost structure now
• Commodity costs – potentially account for 50-80% of any project
• with global commodities down 25-50%, theoretically government can
implement far more projects even with limited financial resources
• Interest costs – Fall in interest rates helps improve viability of new projects
Better fiscal health of government
Government focusing on reviving investment cycle
Comeback in rural housing can also provide support to overall investment cycle
Growth is already picking up and the evidence is visible in Roads, T&D, Railways, Defense, Power sector
“Going with the flow” – where all the action is
46
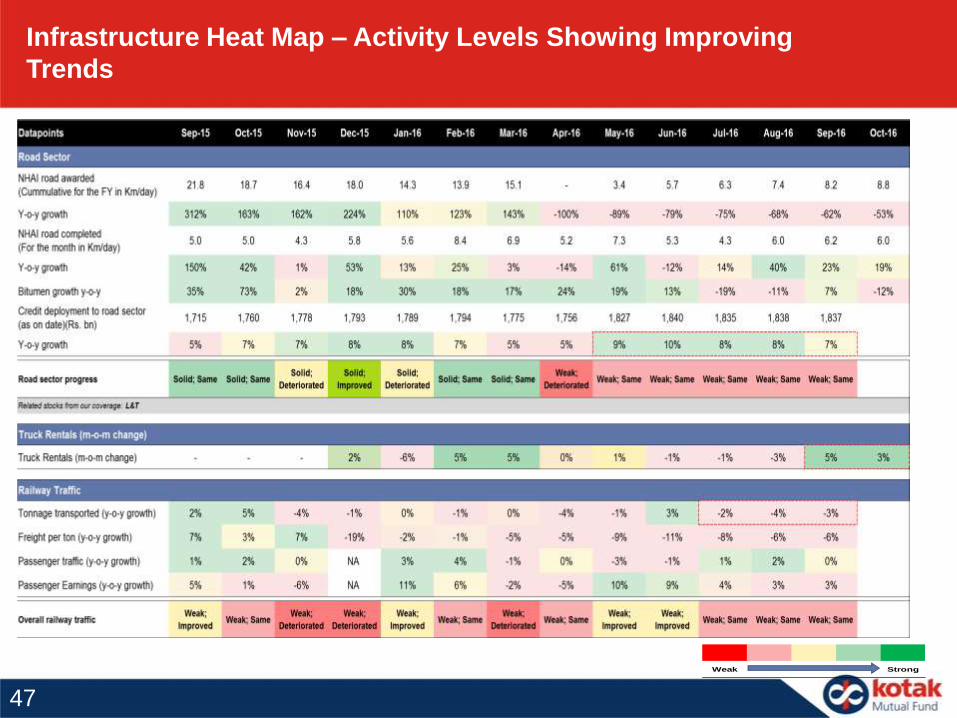
Infrastructure Heat Map – Activity Levels Showing Improving
Trends
Weak Strong
47
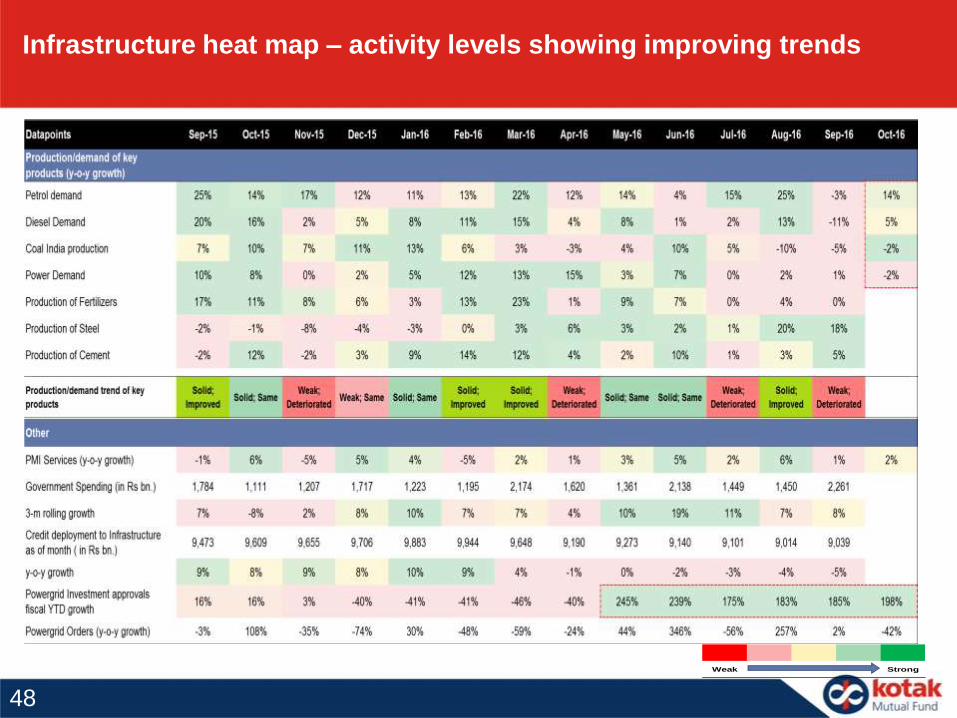
Infrastructure heat map – activity levels showing improving trends
Weak Strong
48
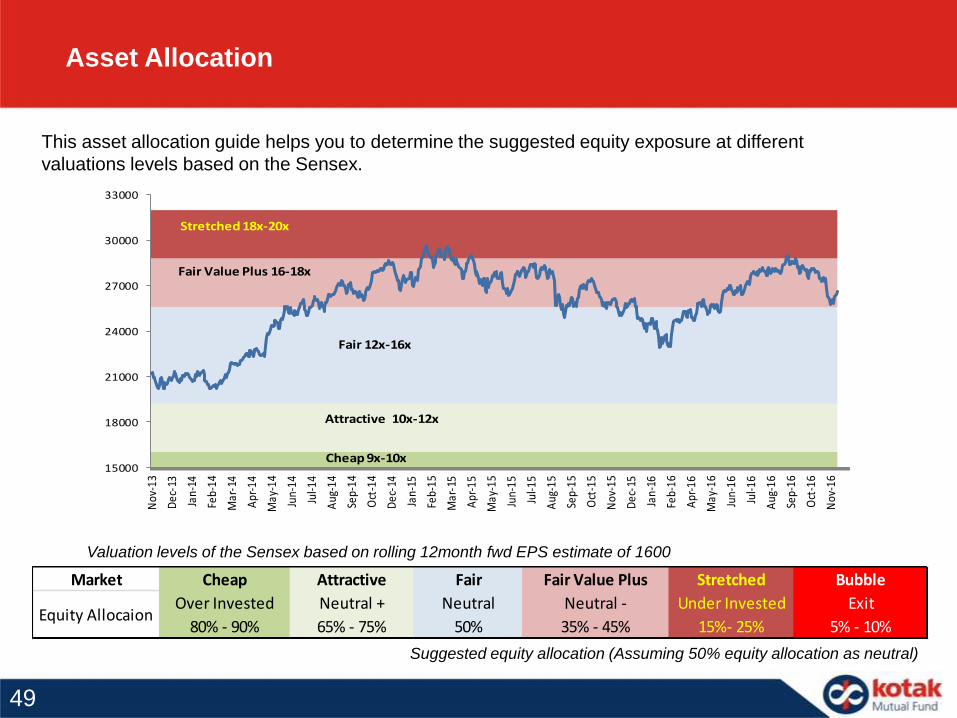
Asset Allocation
This asset allocation guide helps you to determine the suggested equity exposure at different
valuations levels based on the Sensex.
Valuation levels of the Sensex based on rolling 12month fwd EPS estimate of 1600
Suggested equity allocation (Assuming 50% equity allocation as neutral)
Market Cheap Attractive Fair Fair Value Plus Stretched Bubble
Over Invested Neutral + Neutral Neutral - Under Invested Exit
80% - 90% 65% - 75% 50% 35% - 45% 15%- 25% 5% - 10%Equity Allocaion
15000
18000
21000
24000
27000
30000
33000
Nov
-13
Dec
-13
Jan-
14
Feb-
14
Mar
-14
Apr
-14
May
-14
Jun-
14
Jul-1
4
Aug
-14
Sep-
14
Oct
-14
Dec
-14
Jan-
15
Feb-
15
Mar
-15
Apr
-15
May
-15
Jun-
15
Jul-1
5
Aug
-15
Sep-
15
Oct
-15
Nov
-15
Dec
-15
Jan-
16
Feb-
16
Apr
-16
May
-16
Jun-
16
Jul-1
6
Aug
-16
Sep-
16
Oct
-16
Nov
-16
Cheap 9x-10x
Attractive 10x-12x
Fair 12x-16x
Fair Value Plus 16-18x
Stretched 18x-20x
49
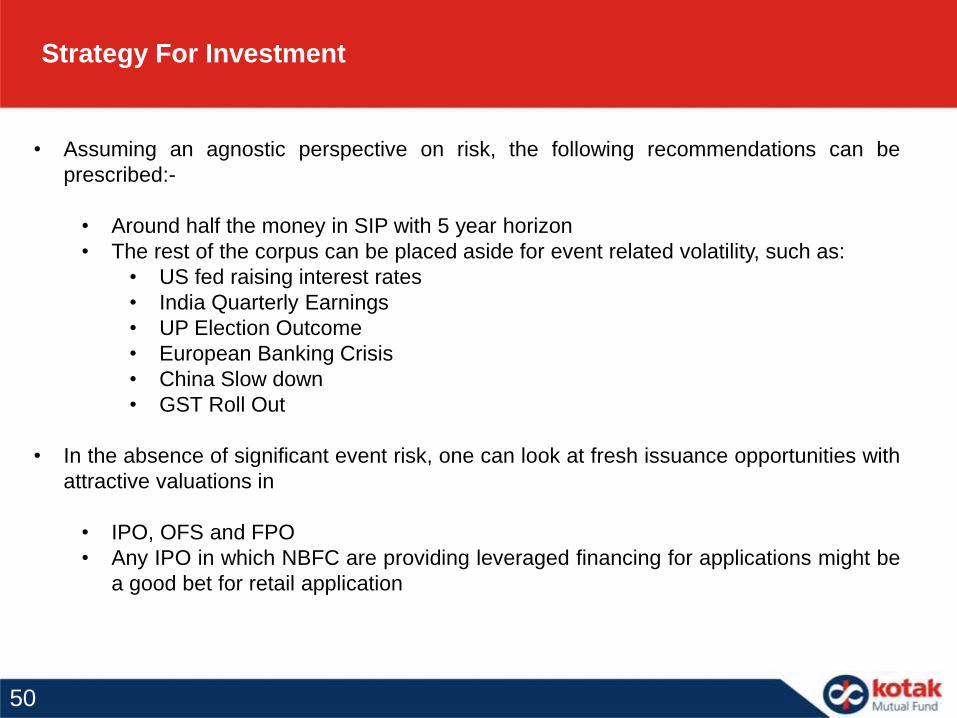
Strategy For Investment
• Assuming an agnostic perspective on risk, the following recommendations can be
prescribed:-
• Around half the money in SIP with 5 year horizon
• The rest of the corpus can be placed aside for event related volatility, such as:
• US fed raising interest rates
• India Quarterly Earnings
• UP Election Outcome
• European Banking Crisis
• China Slow down
• GST Roll Out
• In the absence of significant event risk, one can look at fresh issuance opportunities with
attractive valuations in
• IPO, OFS and FPO
• Any IPO in which NBFC are providing leveraged financing for applications might be
a good bet for retail application
50

Key Recommendations
Key theme Remarks
Large Cap – play on buying sectoral leaders that
benefit from improving investment climate
Kotak50
Diversified/Multicap – focus on sectors that are
likely to benefit the most across market cap
Kotak Select Focus
Infrastructure revival – “True-to-label” fund –
recent thrust of government to revive the
infrastructure theme
Kotak Infrastructure &
Economic Reforms Fund
Through SIP in Midcap oriented scheme Kotak Emerging Equities Fund
Thematic opportunity through PMS Kotak Pharma PMS
We recommend investors to invest through SIP with a 5 years horizon.
51
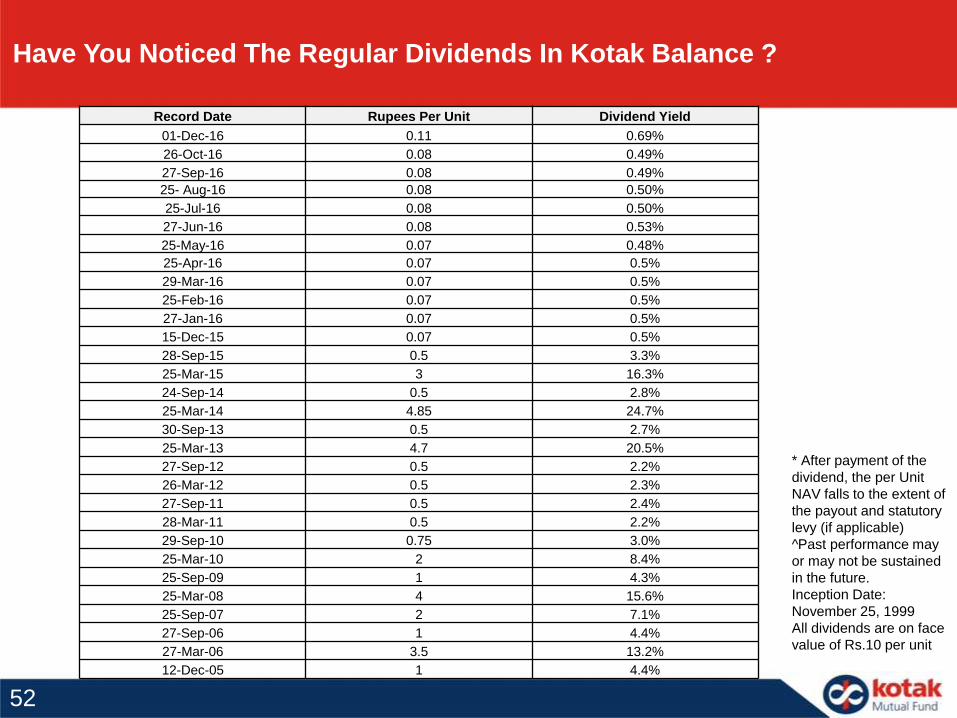
Record Date Rupees Per Unit Dividend Yield
01-Dec-16 0.11 0.69%
26-Oct-16 0.08 0.49%
27-Sep-16 0.08 0.49%
25- Aug-16 0.08 0.50%
25-Jul-16 0.08 0.50%
27-Jun-16 0.08 0.53%
25-May-16 0.07 0.48%
25-Apr-16 0.07 0.5%
29-Mar-16 0.07 0.5%
25-Feb-16 0.07 0.5%
27-Jan-16 0.07 0.5%
15-Dec-15 0.07 0.5%
28-Sep-15 0.5 3.3%
25-Mar-15 3 16.3%
24-Sep-14 0.5 2.8%
25-Mar-14 4.85 24.7%
30-Sep-13 0.5 2.7%
25-Mar-13 4.7 20.5%
27-Sep-12 0.5 2.2%
26-Mar-12 0.5 2.3%
27-Sep-11 0.5 2.4%
28-Mar-11 0.5 2.2%
29-Sep-10 0.75 3.0%
25-Mar-10 2 8.4%
25-Sep-09 1 4.3%
25-Mar-08 4 15.6%
25-Sep-07 2 7.1%
27-Sep-06 1 4.4%
27-Mar-06 3.5 13.2%
12-Dec-05 1 4.4%
Have You Noticed The Regular Dividends In Kotak Balance ?
* After payment of the
dividend, the per Unit
NAV falls to the extent of
the payout and statutory
levy (if applicable)
^Past performance may
or may not be sustained
in the future.
Inception Date:
November 25, 1999
All dividends are on face
value of Rs.10 per unit
52

DEBT
MARKETS
53

Market Outlook
December
2016
54

How November 2016 Unfolded-Key Events Of The Month
• GDP rose 7.3% in the quarter ended September, higher than the 7.1% in the previous one, as consumption
improved but investment slumped. The economy had expanded by 7.6% during the same period last year.
• India's fiscal deficit during the seven months, from April to October, was 79.3% of the budgeted target for the
financial year, compared to 74% last year.
• Taking the nation by surprise, PM Narendra Modi announced demonetisation of Rs 1000 and Rs 500 notes,
making these notes invalid in a major assault on black money, fake currency and corruption.
• The RBI has asked all banks to maintain 100% of incremental CRR on incremental NDTL from the week
starting 16th September to November 11. The move is aimed at absorbing part of surplus liquidity following the
demonetisation move
• The Organisation of the Petroleum Exporting Countries(OPEC) reached an agreement to cut their
production of oil at a meeting in Vienna in an effort to raise crude oil prices. The cartel will now cut production
by 1.2 million barrels per day, which accounts for nearly 1.3% of the entire world's daily oil production. Crude Oil
prices in November increased to $50.32/barrel (4.18% MoM)
• Retail inflation dipped to 4.2 % in October compared with 4.39 % in September, while wholesale inflation also
came down to 3.39 % in October as against 3.57 % in the previous month.
55

How November 2016 Unfolded-Key Events Of The Month
• India's eight core industries, which have a weight of 37.90 %in the Index of Industrial Production
(IIP), grew by 6.6 percent in October 2016 as compared to the same month of the previous year.
• Exports stood at $23.5 billion in October when compared to $21.4 billion in October 2015, aided by
an increase in two key categories — gems and jewellery and engineering goods. Imports grew 8.11 %
to $33.6 billion from $31.1 billion in the year-ago period, widening the trade deficit for October 2016 to
$10.1 billion from $9.69 billion, YoY
• Federal Reserve released minutes from its November meeting which showed that policy makers
agreed an interest-rate increase may be appropriate relatively soon
• Donald Trump stunned the world by defeating heavily favoured Hillary Clinton in the race for the
White House, ending eight years of Democratic rule
• As President-elect Donald Trump said that America will quit the Trans-Pacific Partnership (TPP) on
his first day in office, China which is opposed to the trade deal, began pushing for the proposed FTAAP
calling it critical to long-term prosperity of the region.
56
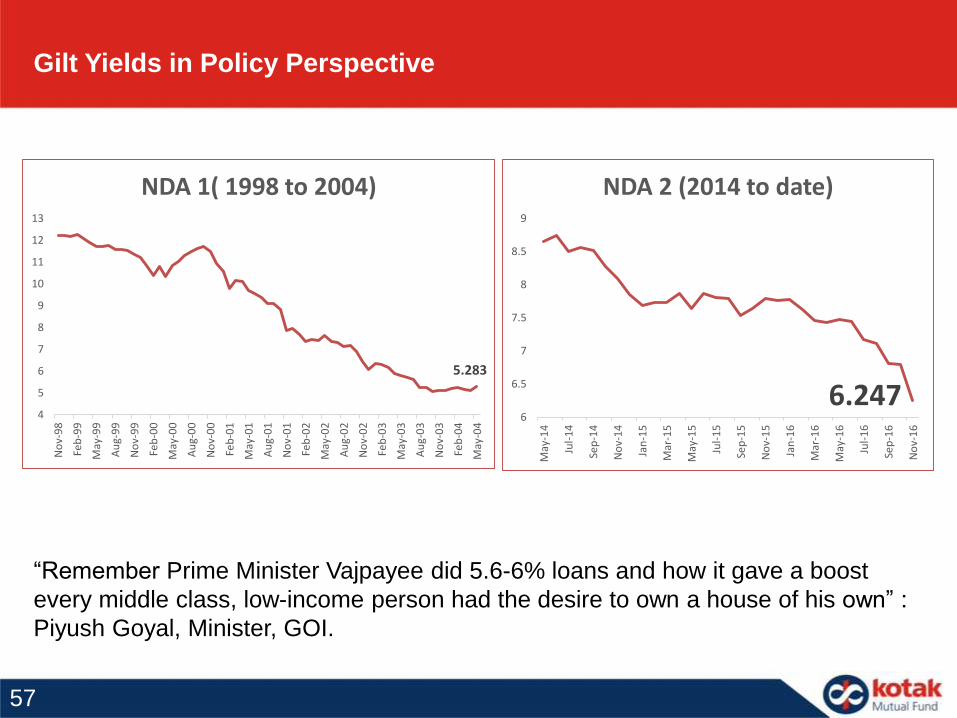
Gilt Yields in Policy Perspective
5.283
4
5
6
7
8
9
10
11
12
13
No
v-9
8
Feb
-99
May
-99
Au
g-9
9
No
v-9
9
Feb
-00
May
-00
Au
g-0
0
No
v-0
0
Feb
-01
May
-01
Au
g-0
1
No
v-0
1
Feb
-02
May
-02
Au
g-0
2
No
v-0
2
Feb
-03
May
-03
Au
g-0
3
No
v-0
3
Feb
-04
May
-04
NDA 1( 1998 to 2004)
6.2476
6.5
7
7.5
8
8.5
9
May
-14
Jul-
14
Sep
-14
No
v-1
4
Jan
-15
Mar
-15
May
-15
Jul-
15
Sep
-15
No
v-1
5
Jan
-16
Mar
-16
May
-16
Jul-
16
Sep
-16
No
v-1
6
NDA 2 (2014 to date)
“Remember Prime Minister Vajpayee did 5.6-6% loans and how it gave a boost
every middle class, low-income person had the desire to own a house of his own” :
Piyush Goyal, Minister, GOI.
57
(In %)
What happened in November?
US 10 Year Yields
From 1.85
to 2.40
India 10 Year Yields
From 6.82
to 6.10
What made India 10 year yield move downward , when global yields were rising?
Demonetization
Rise in Bank
Deposit
GDP Slowdo
wn
Dis-inflationary
pressure
Bullish Debt
Market
Spike in Gilt Demand Rate cut needed to support Growth
Gives space for rate cut
58
6.24
6
6.2
6.4
6.6
6.8
7
7.2
7.4
7.6
7.8
8
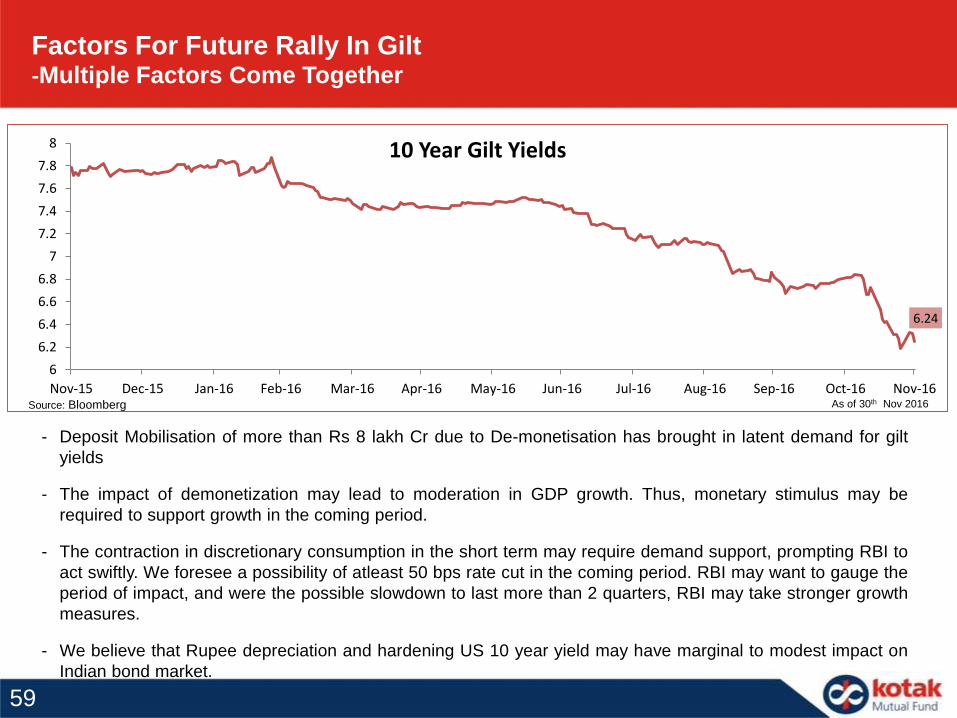
Nov-15 Dec-15 Jan-16 Feb-16 Mar-16 Apr-16 May-16 Jun-16 Jul-16 Aug-16 Sep-16 Oct-16 Nov-16
10 Year Gilt Yields
- Deposit Mobilisation of more than Rs 8 lakh Cr due to De-monetisation has brought in latent demand for gilt
yields
- The impact of demonetization may lead to moderation in GDP growth. Thus, monetary stimulus may be
required to support growth in the coming period.
- The contraction in discretionary consumption in the short term may require demand support, prompting RBI to
act swiftly. We foresee a possibility of atleast 50 bps rate cut in the coming period. RBI may want to gauge the
period of impact, and were the possible slowdown to last more than 2 quarters, RBI may take stronger growth
measures.
- We believe that Rupee depreciation and hardening US 10 year yield may have marginal to modest impact on
Indian bond market.
Factors For Future Rally In Gilt-Multiple Factors Come Together
Source: Bloomberg As of 30th Nov 2016
59

Inflation Moderated
Source: MOSPI
• CPI inflation softened to a 14-month low 4.2% in October 2016 from the revised 4.4% in September 2016
benefitting from lower inflation for food & beverages, housing and fuel & light, which offset the impact of
higher prints for pan, tobacco & intoxicants, clothing & footwear and miscellaneous items.
• Core-CPI inflation rose mildly to 4.94% in October 2016, the highest print in eight months, from 4.88% in
September 2016 .As a result, the gap between core-CPI inflation and headline CPI inflation widened in the
just concluded month.
4.20%
4.94%
0.00%
2.00%
4.00%
6.00%
8.00%
10.00%
12.00%
Jul-
12
Au
g-1
2
Sep
-12
Oct
-12
No
v-1
2D
ec-
12
Jan
-13
Feb
-13
Mar
-13
Ap
r-1
3M
ay-1
3
Jun
-13
Jul-
13
Au
g-1
3
Sep
-13
Oct
-13
No
v-1
3D
ec-
13
Jan
-14
Feb
-14
Mar
-14
Ap
r-1
4M
ay-1
4
Jun
-14
Jul-
14
Au
g-1
4
Sep
-14
Oct
-14
No
v-1
4D
ec-
14
Jan
-15
Feb
-15
Mar
-15
Ap
r-1
5M
ay-1
5
Jun
-15
Jul-
15
Au
g-1
5
Sep
-15
Oct
-15
No
v-1
5D
ec-
15
Jan
-16
Feb
-16
Mar
-16
Ap
r-1
6M
ay-1
6
Jun
-16
Jul-
16
Au
g-1
6
Sep
-16
Oct
-16
CPI Core CPI
60
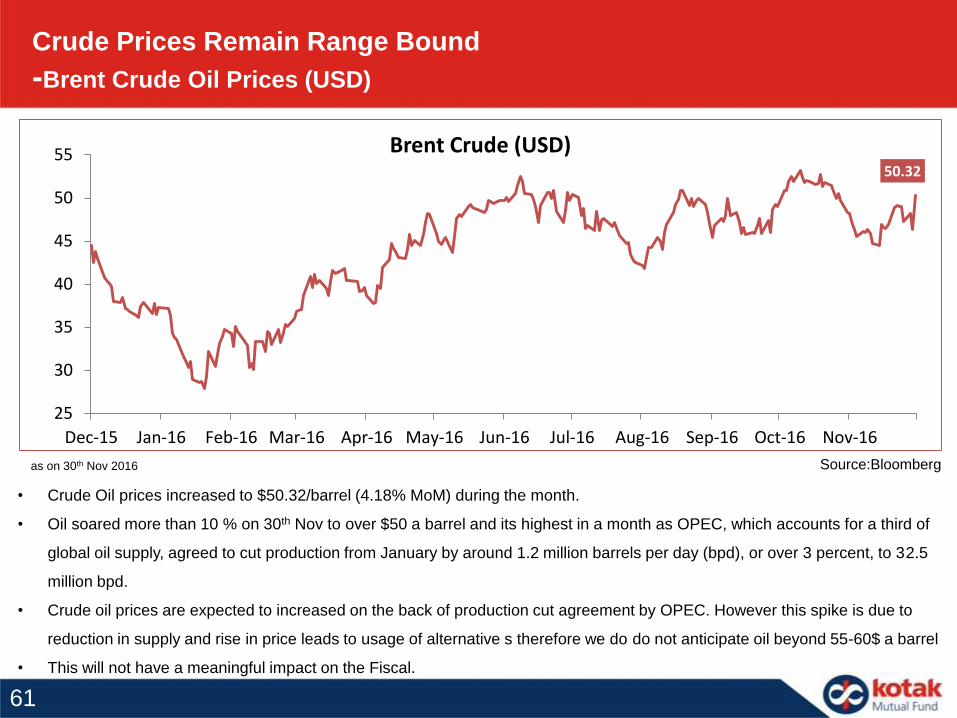
Crude Prices Remain Range Bound
-Brent Crude Oil Prices (USD)
Source:Bloombergas on 30th Nov 2016
• Crude Oil prices increased to $50.32/barrel (4.18% MoM) during the month.
• Oil soared more than 10 % on 30th Nov to over $50 a barrel and its highest in a month as OPEC, which accounts for a third of
global oil supply, agreed to cut production from January by around 1.2 million barrels per day (bpd), or over 3 percent, to 32.5
million bpd.
• Crude oil prices are expected to increased on the back of production cut agreement by OPEC. However this spike is due to
reduction in supply and rise in price leads to usage of alternative s therefore we do do not anticipate oil beyond 55-60$ a barrel
• This will not have a meaningful impact on the Fiscal.
50.32
25
30
35
40
45
50
55
Dec-15 Jan-16 Feb-16 Mar-16 Apr-16 May-16 Jun-16 Jul-16 Aug-16 Sep-16 Oct-16 Nov-16
Brent Crude (USD)
61
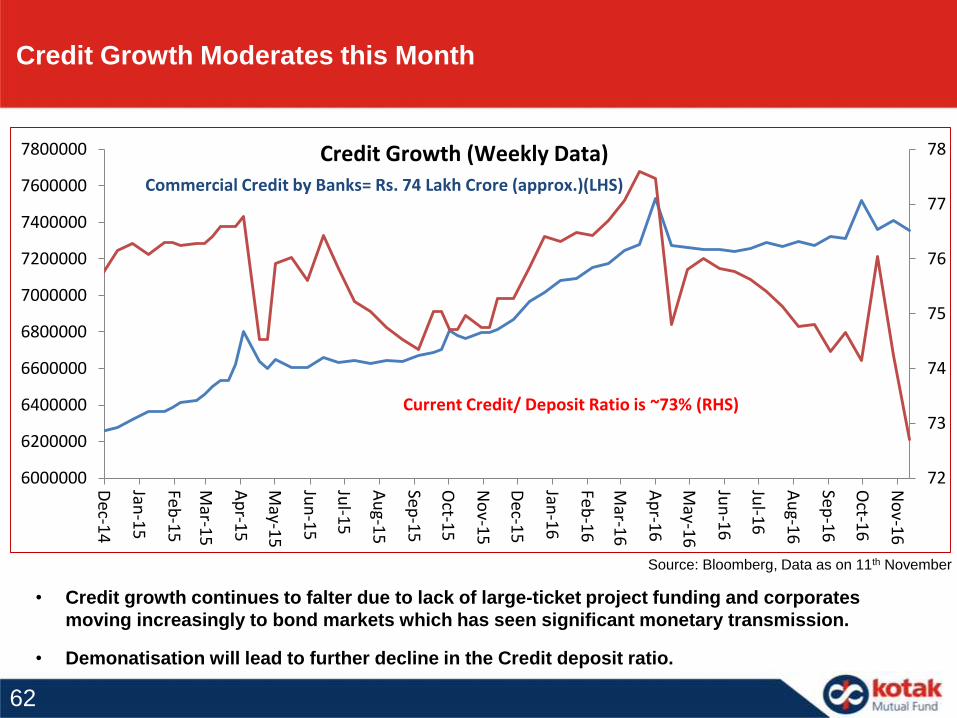
• Credit growth continues to falter due to lack of large-ticket project funding and corporates
moving increasingly to bond markets which has seen significant monetary transmission.
• Demonatisation will lead to further decline in the Credit deposit ratio.
Credit Growth Moderates this Month
Source: Bloomberg, Data as on 11th November
72
73
74
75
76
77
78
6000000
6200000
6400000
6600000
6800000
7000000
7200000
7400000
7600000
7800000
Dec-1
4
Jan-1
5
Feb-1
5
Mar-1
5
Ap
r-15
May-1
5
Jun
-15
Jul-1
5
Au
g-15
Sep-1
5
Oct-1
5
No
v-15
Dec-1
5
Jan-1
6
Feb-1
6
Mar-1
6
Ap
r-16
May-1
6
Jun
-16
Jul-1
6
Au
g-16
Sep-1
6
Oct-1
6
No
v-16
Credit Growth (Weekly Data)Commercial Credit by Banks= Rs. 74 Lakh Crore (approx.)(LHS)
Current Credit/ Deposit Ratio is ~73% (RHS)
62
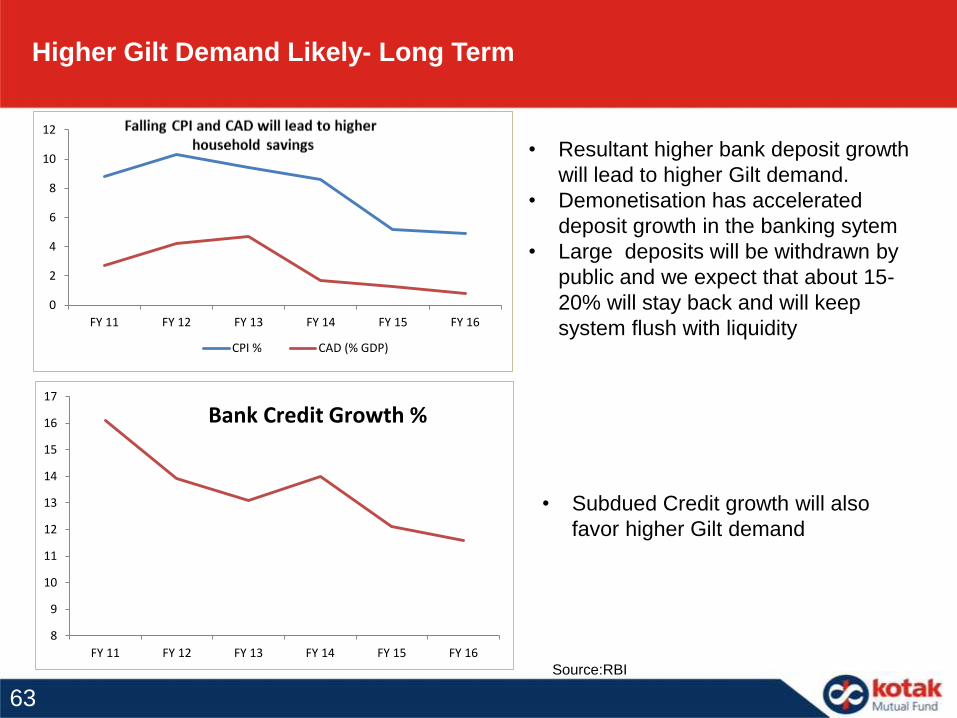
• Resultant higher bank deposit growth
will lead to higher Gilt demand.
• Demonetisation has accelerated
deposit growth in the banking sytem
• Large deposits will be withdrawn by
public and we expect that about 15-
20% will stay back and will keep
system flush with liquidity
Higher Gilt Demand Likely- Long Term
• Subdued Credit growth will also
favor higher Gilt demand
Source:RBI
8
9
10
11
12
13
14
15
16
17
FY 11 FY 12 FY 13 FY 14 FY 15 FY 16
Bank Credit Growth %
0
2
4
6
8
10
12
FY 11 FY 12 FY 13 FY 14 FY 15 FY 16
CPI % CAD (% GDP)
63
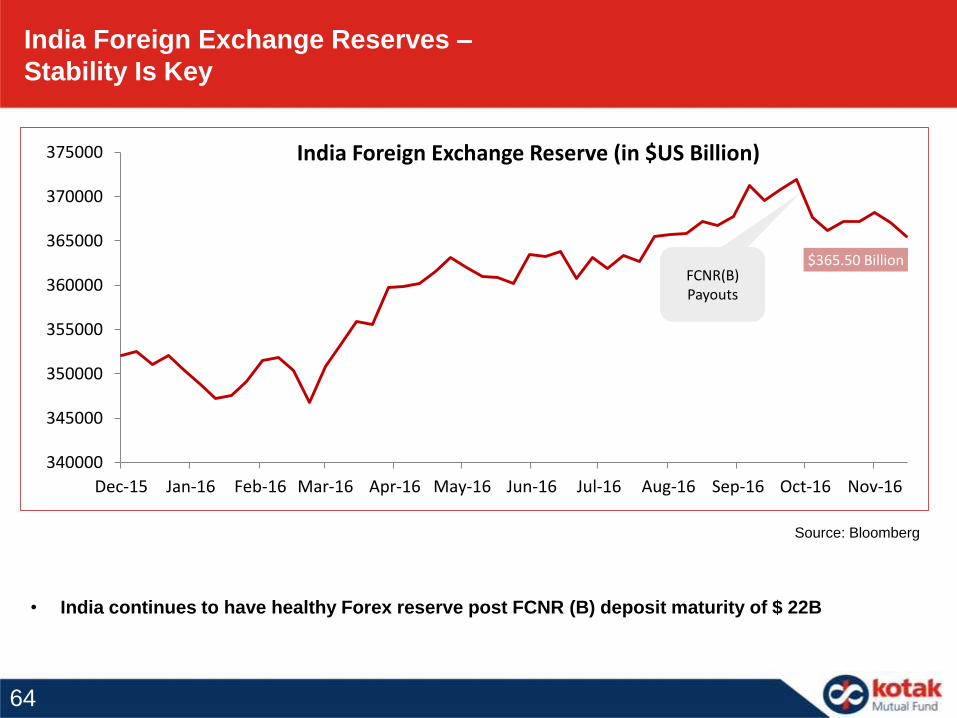
India Foreign Exchange Reserves –
Stability Is Key
• India continues to have healthy Forex reserve post FCNR (B) deposit maturity of $ 22B
Source: Bloomberg
$365.50 Billion
340000
345000
350000
355000
360000
365000
370000
375000
Dec-15 Jan-16 Feb-16 Mar-16 Apr-16 May-16 Jun-16 Jul-16 Aug-16 Sep-16 Oct-16 Nov-16
India Foreign Exchange Reserve (in $US Billion)
FCNR(B) Payouts
64
-4000
-3000
-2000
-1000
0
1000
2000
3000
4000
5000
6000
Jan
-10
Ap
r-1
0
Jul-
10
Oct
-10
Jan
-11
Ap
r-1
1
Jul-
11
Oct
-11
Jan
-12
Ap
r-1
2
Jul-
12
Oct
-12
Jan
-13
Ap
r-1
3
Jul-
13
Oct
-13
Jan
-14
Ap
r-1
4
Jul-
14
Oct
-14
Jan
-15
Ap
r-1
5
Jul-
15
Oct
-15
Jan
-16
Ap
r-1
6
Jul-
16
Oct
-16
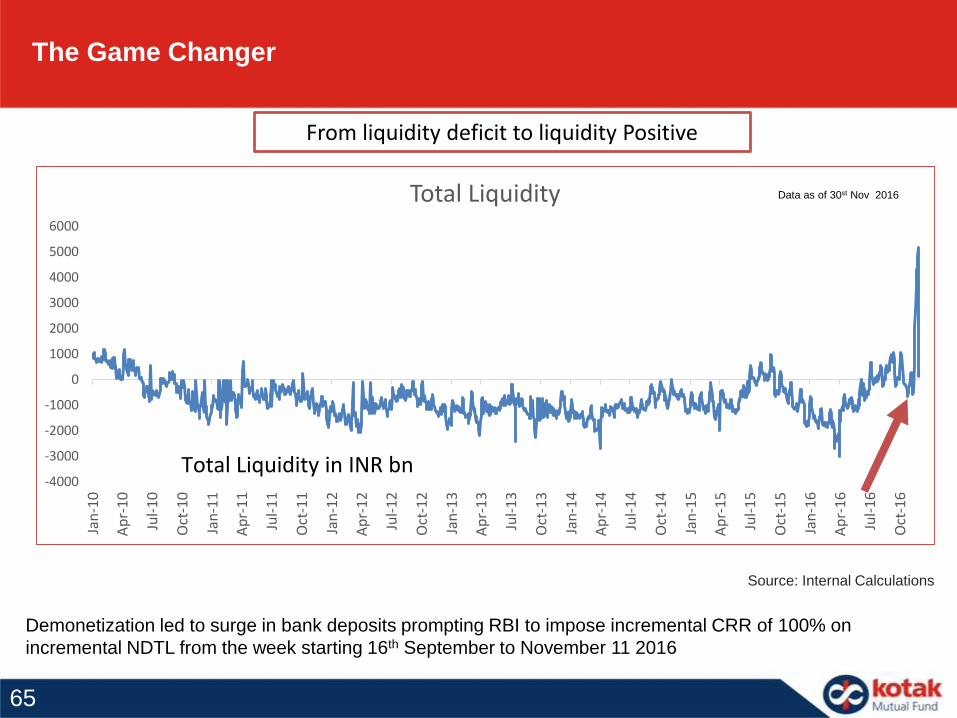
Total Liquidity
Total Liquidity in INR bn
The Game Changer
From liquidity deficit to liquidity Positive
Source: Internal Calculations
Demonetization led to surge in bank deposits prompting RBI to impose incremental CRR of 100% on
incremental NDTL from the week starting 16th September to November 11 2016
Data as of 30st Nov 2016
65

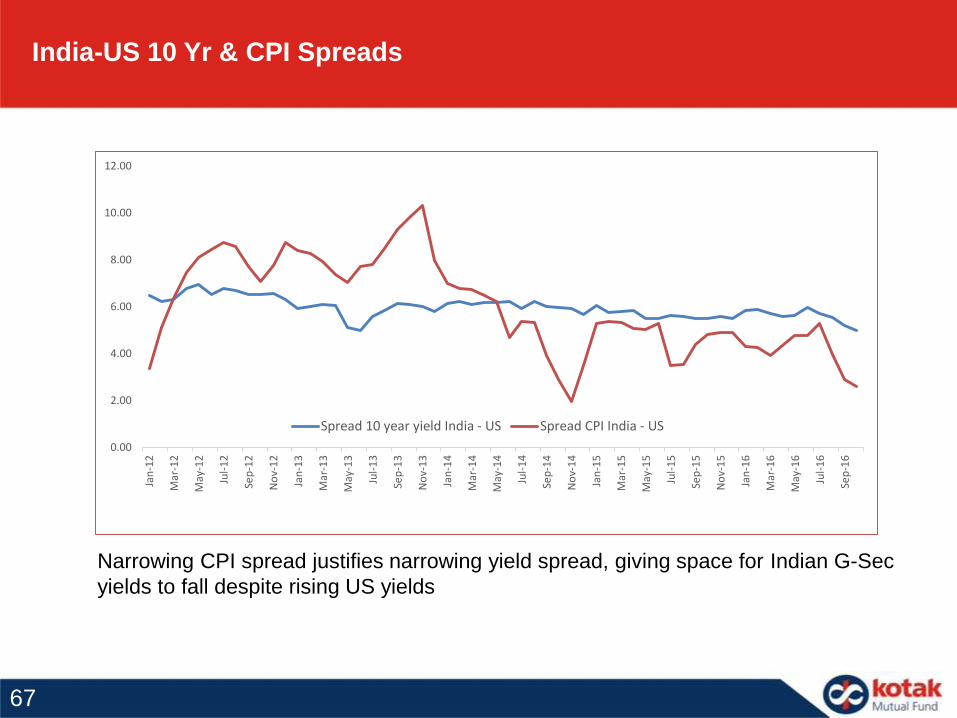
India-US 10 Yr Gilt
As foretold the spreads are compressing
66
0.00
2.00
4.00
6.00
8.00
10.00
12.00
Jan
-12
Mar
-12
May
-12
Jul-
12
Sep
-12
No
v-1
2
Jan
-13
Mar
-13
May
-13
Jul-
13
Sep
-13
No
v-1
3
Jan
-14
Mar
-14
May
-14
Jul-
14
Sep
-14
No
v-1
4
Jan
-15
Mar
-15
May
-15
Jul-
15
Sep
-15
No
v-1
5
Jan
-16
Mar
-16
May
-16
Jul-
16
Sep
-16
Spread 10 year yield India - US Spread CPI India - US
India-US 10 Yr & CPI Spreads
Narrowing CPI spread justifies narrowing yield spread, giving space for Indian G-Sec
yields to fall despite rising US yields
67
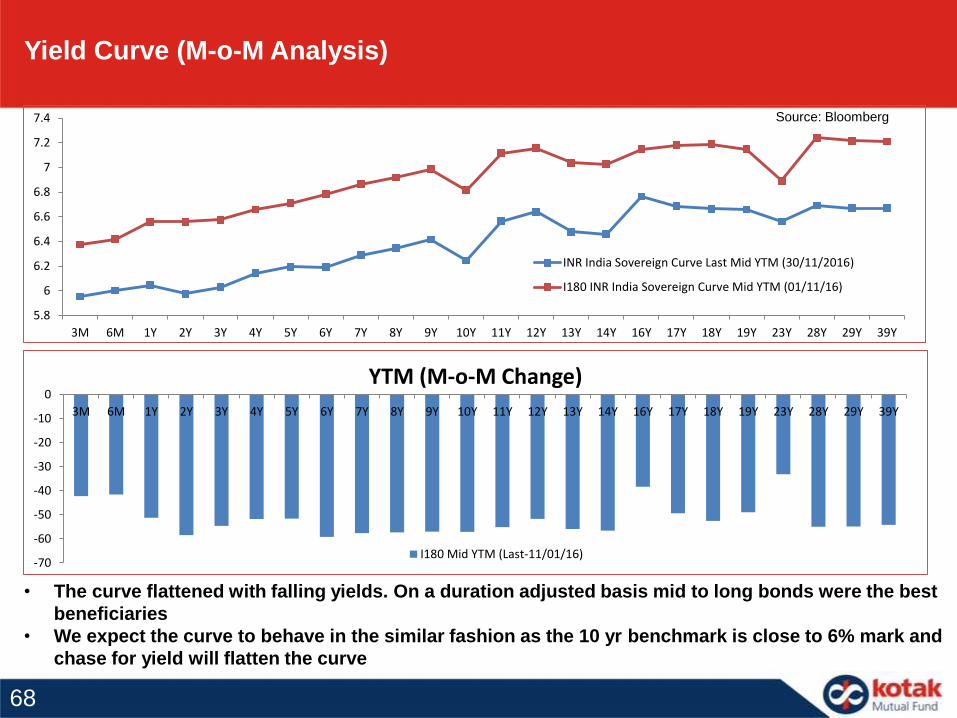
Yield Curve (M-o-M Analysis)
• The curve flattened with falling yields. On a duration adjusted basis mid to long bonds were the best
beneficiaries
• We expect the curve to behave in the similar fashion as the 10 yr benchmark is close to 6% mark and
chase for yield will flatten the curve
Source: Bloomberg
5.8
6
6.2
6.4
6.6
6.8
7
7.2
7.4
3M 6M 1Y 2Y 3Y 4Y 5Y 6Y 7Y 8Y 9Y 10Y 11Y 12Y 13Y 14Y 16Y 17Y 18Y 19Y 23Y 28Y 29Y 39Y
INR India Sovereign Curve Last Mid YTM (30/11/2016)
I180 INR India Sovereign Curve Mid YTM (01/11/16)
-70
-60
-50
-40
-30
-20
-10
0
3M 6M 1Y 2Y 3Y 4Y 5Y 6Y 7Y 8Y 9Y 10Y 11Y 12Y 13Y 14Y 16Y 17Y 18Y 19Y 23Y 28Y 29Y 39Y
YTM (M-o-M Change)
I180 Mid YTM (Last-11/01/16)
68
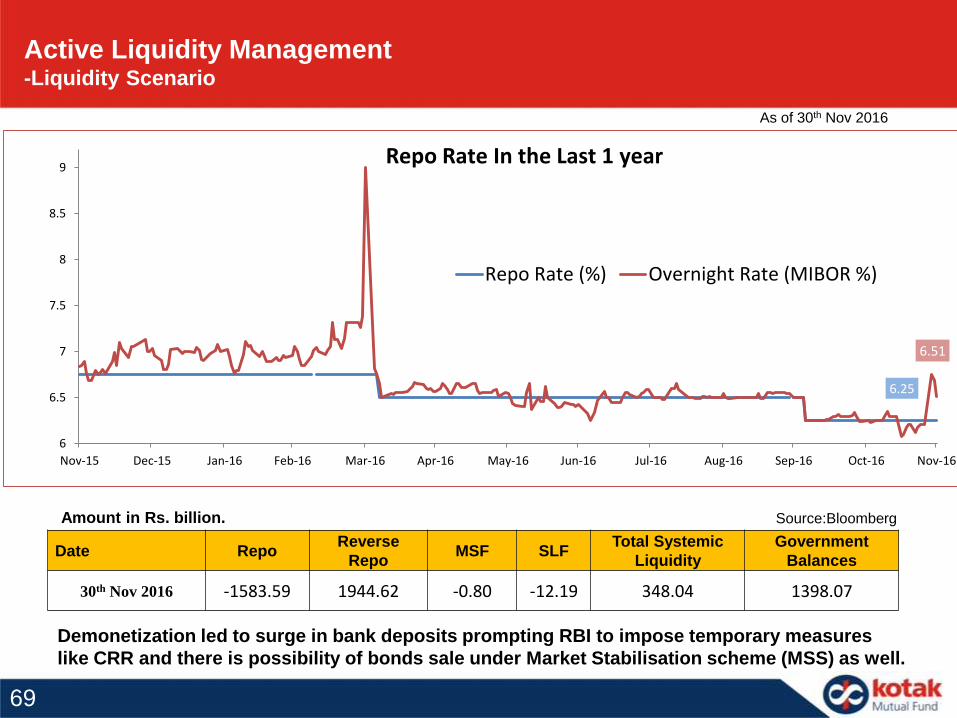
Demonetization led to surge in bank deposits prompting RBI to impose temporary measures
like CRR and there is possibility of bonds sale under Market Stabilisation scheme (MSS) as well.
Source:Bloomberg
Date RepoReverse
RepoMSF SLF
Total Systemic
Liquidity
Government
Balances
30th Nov 2016 -1583.59 1944.62 -0.80 -12.19 348.04 1398.07
Amount in Rs. billion.
Active Liquidity Management-Liquidity Scenario
As of 30th Nov 2016
6.25
6.51
6
6.5
7
7.5
8
8.5
9
Nov-15 Dec-15 Jan-16 Feb-16 Mar-16 Apr-16 May-16 Jun-16 Jul-16 Aug-16 Sep-16 Oct-16 Nov-16
Repo Rate (%) Overnight Rate (MIBOR %)
Repo Rate In the Last 1 year
69
-0.5
0
0.5
1
1.5
2
2.5
3
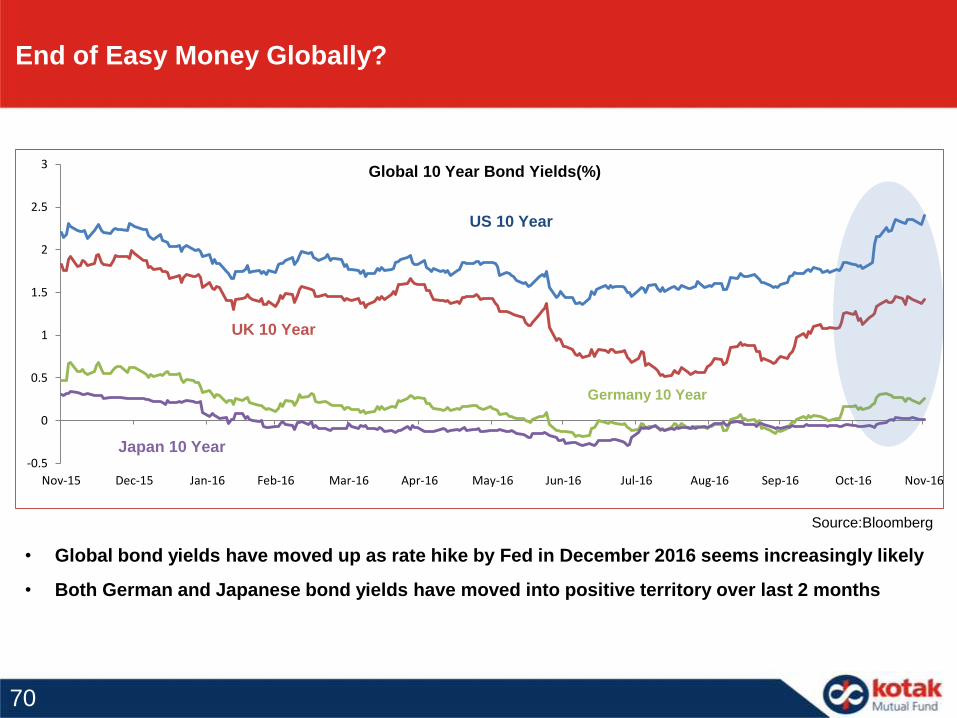
Nov-15 Dec-15 Jan-16 Feb-16 Mar-16 Apr-16 May-16 Jun-16 Jul-16 Aug-16 Sep-16 Oct-16 Nov-16
US 10 Year
UK 10 Year
Germany 10 Year
Japan 10 Year
Global 10 Year Bond Yields(%)
Source:Bloomberg
End of Easy Money Globally?
• Global bond yields have moved up as rate hike by Fed in December 2016 seems increasingly likely
• Both German and Japanese bond yields have moved into positive territory over last 2 months
70
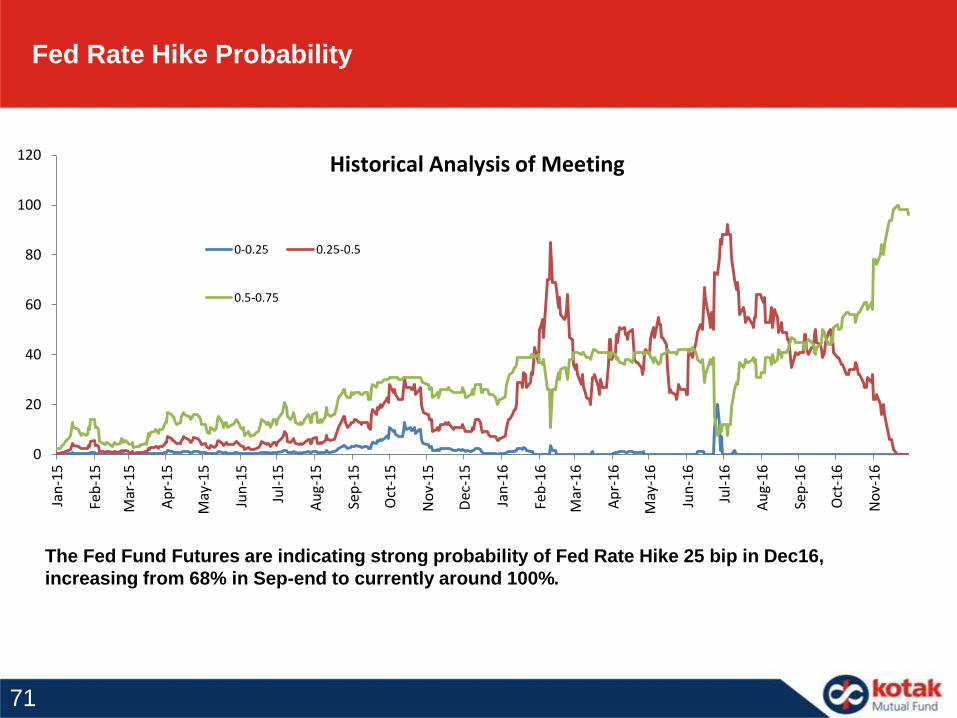
Fed Rate Hike Probability
The Fed Fund Futures are indicating strong probability of Fed Rate Hike 25 bip in Dec16,
increasing from 68% in Sep-end to currently around 100%.
0
20
40
60
80
100
120
Jan
-15
Feb
-15
Mar
-15
Ap
r-1
5
May
-15
Jun
-15
Jul-
15
Au
g-1
5
Sep
-15
Oct
-15
No
v-1
5
Dec
-15
Jan
-16
Feb
-16
Mar
-16
Ap
r-1
6
May
-16
Jun
-16
Jul-
16
Au
g-1
6
Sep
-16
Oct
-16
No
v-1
6
0-0.25 0.25-0.5
0.5-0.75
Historical Analysis of Meeting
71
-2
0
2
4
6
8
10
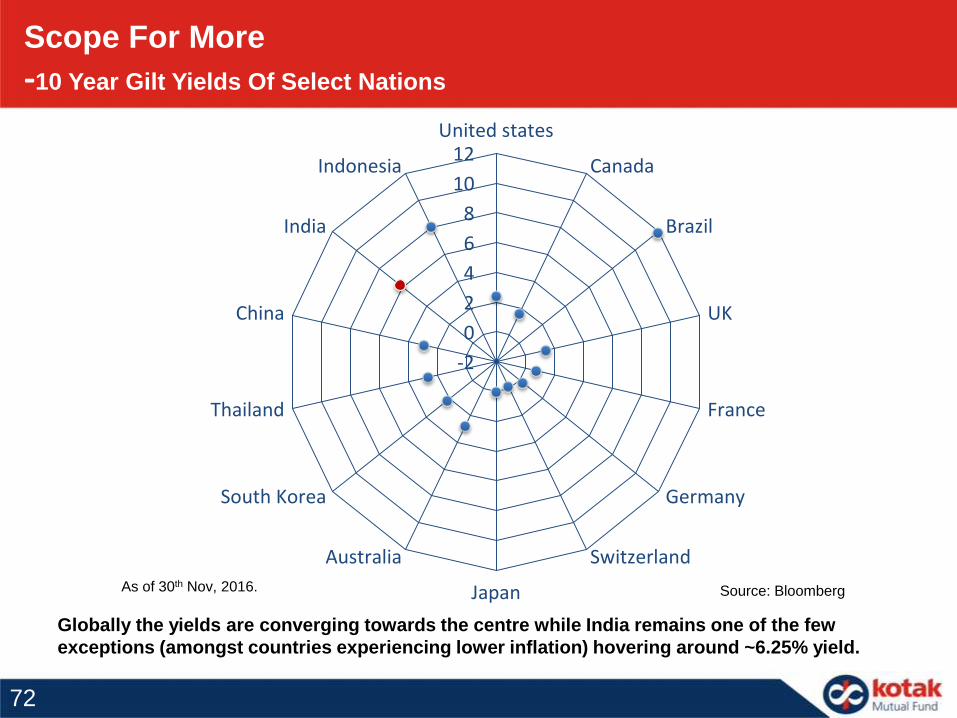
12United states
Canada
Brazil
UK
France
Germany
Switzerland
Japan
Australia
South Korea
Thailand
China
India
Indonesia
Source: Bloomberg
Scope For More
-10 Year Gilt Yields Of Select Nations
As of 30th Nov, 2016.
Globally the yields are converging towards the centre while India remains one of the few
exceptions (amongst countries experiencing lower inflation) hovering around ~6.25% yield.
72
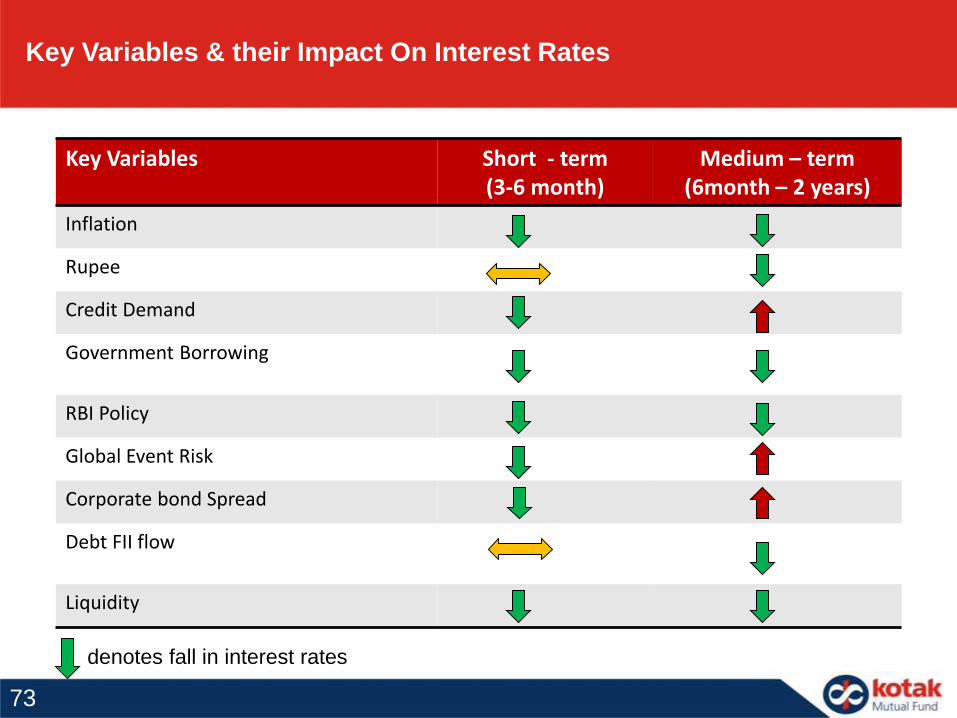
Key Variables & their Impact On Interest Rates
Key Variables Short - term (3-6 month)
Medium – term (6month – 2 years)
Inflation
Rupee
Credit Demand
Government Borrowing
RBI Policy
Global Event Risk
Corporate bond Spread
Debt FII flow
Liquidity
denotes fall in interest rates
73
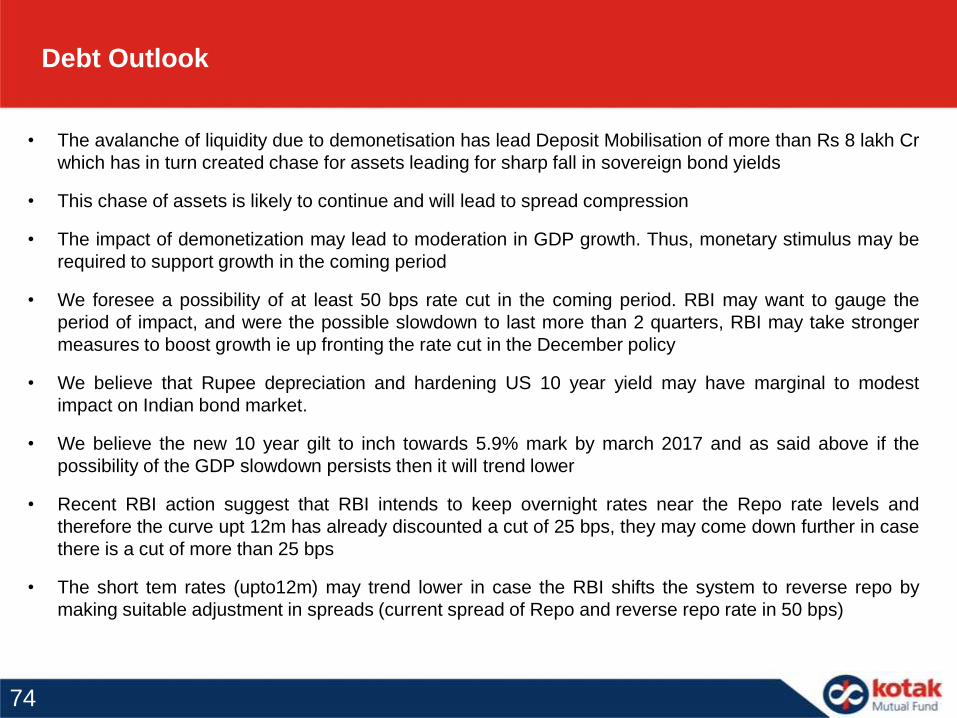
Debt Outlook
• The avalanche of liquidity due to demonetisation has lead Deposit Mobilisation of more than Rs 8 lakh Cr
which has in turn created chase for assets leading for sharp fall in sovereign bond yields
• This chase of assets is likely to continue and will lead to spread compression
• The impact of demonetization may lead to moderation in GDP growth. Thus, monetary stimulus may be
required to support growth in the coming period
• We foresee a possibility of at least 50 bps rate cut in the coming period. RBI may want to gauge the
period of impact, and were the possible slowdown to last more than 2 quarters, RBI may take stronger
measures to boost growth ie up fronting the rate cut in the December policy
• We believe that Rupee depreciation and hardening US 10 year yield may have marginal to modest
impact on Indian bond market.
• We believe the new 10 year gilt to inch towards 5.9% mark by march 2017 and as said above if the
possibility of the GDP slowdown persists then it will trend lower
• Recent RBI action suggest that RBI intends to keep overnight rates near the Repo rate levels and
therefore the curve upt 12m has already discounted a cut of 25 bps, they may come down further in case
there is a cut of more than 25 bps
• The short tem rates (upto12m) may trend lower in case the RBI shifts the system to reverse repo by
making suitable adjustment in spreads (current spread of Repo and reverse repo rate in 50 bps)
74
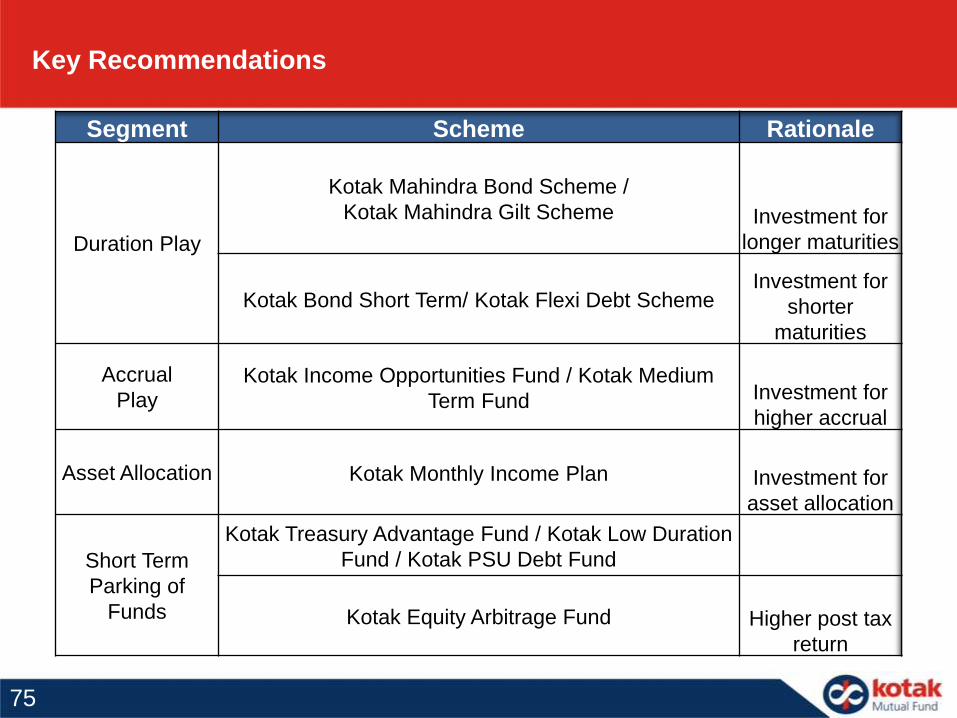
Key Recommendations
Segment Scheme Rationale
Duration Play
Kotak Mahindra Bond Scheme /
Kotak Mahindra Gilt Scheme Investment for
longer maturities
Kotak Bond Short Term/ Kotak Flexi Debt SchemeInvestment for
shorter
maturities
Accrual
PlayKotak Income Opportunities Fund / Kotak Medium
Term Fund Investment for
higher accrual
Asset Allocation Kotak Monthly Income Plan Investment for
asset allocation
Short Term
Parking of
Funds
Kotak Treasury Advantage Fund / Kotak Low Duration
Fund / Kotak PSU Debt Fund
Kotak Equity Arbitrage Fund Higher post tax
return
75
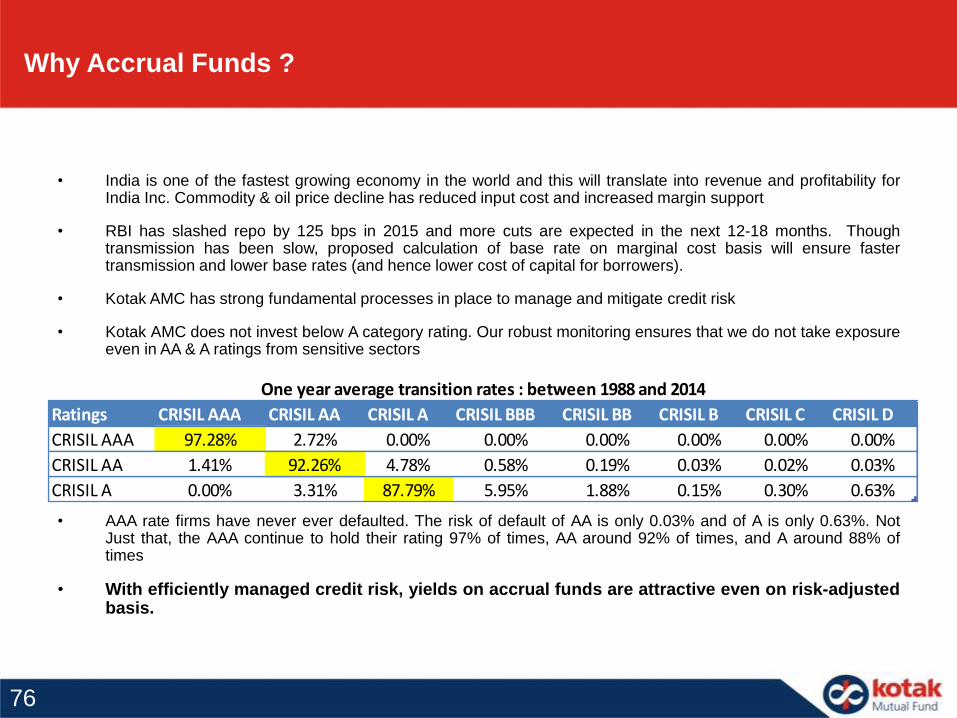
Why Accrual Funds ?
• India is one of the fastest growing economy in the world and this will translate into revenue and profitability forIndia Inc. Commodity & oil price decline has reduced input cost and increased margin support
• RBI has slashed repo by 125 bps in 2015 and more cuts are expected in the next 12-18 months. Thoughtransmission has been slow, proposed calculation of base rate on marginal cost basis will ensure fastertransmission and lower base rates (and hence lower cost of capital for borrowers).
• Kotak AMC has strong fundamental processes in place to manage and mitigate credit risk
• Kotak AMC does not invest below A category rating. Our robust monitoring ensures that we do not take exposureeven in AA & A ratings from sensitive sectors
• AAA rate firms have never ever defaulted. The risk of default of AA is only 0.03% and of A is only 0.63%. NotJust that, the AAA continue to hold their rating 97% of times, AA around 92% of times, and A around 88% oftimes
• With efficiently managed credit risk, yields on accrual funds are attractive even on risk-adjustedbasis.
Ratings CRISIL AAA CRISIL AA CRISIL A CRISIL BBB CRISIL BB CRISIL B CRISIL C CRISIL D
CRISIL AAA 97.28% 2.72% 0.00% 0.00% 0.00% 0.00% 0.00% 0.00%
CRISIL AA 1.41% 92.26% 4.78% 0.58% 0.19% 0.03% 0.02% 0.03%
CRISIL A 0.00% 3.31% 87.79% 5.95% 1.88% 0.15% 0.30% 0.63%
One year average transition rates : between 1988 and 2014
76
Story in Accruals
• Accruals generate performance by purchasing high yielding assets
• The market is currently tilted towards the buyers
• Corporates have alternative in NBFCs for funding. But such corporates would need to provide high
collateral in keeping with the RBI guidelines regarding loan against shares.
• Thus, creditable and quality corporates has to shell out high rates to attract capital
• Retail Investors can consider accrual funds like Kotak Income Opportunities / Kotak Medium term to
gain from the potential high yields in the market.
77
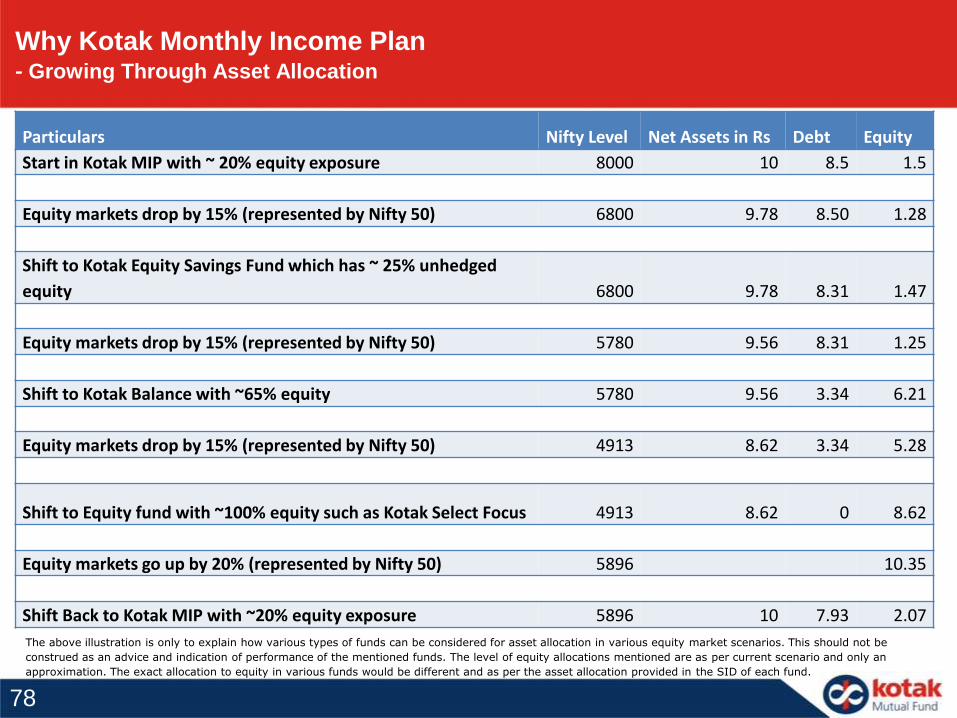
Particulars Nifty Level Net Assets in Rs Debt Equity
Start in Kotak MIP with ~ 20% equity exposure 8000 10 8.5 1.5
Equity markets drop by 15% (represented by Nifty 50) 6800 9.78 8.50 1.28
Shift to Kotak Equity Savings Fund which has ~ 25% unhedged
equity 6800 9.78 8.31 1.47
Equity markets drop by 15% (represented by Nifty 50) 5780 9.56 8.31 1.25
Shift to Kotak Balance with ~65% equity 5780 9.56 3.34 6.21
Equity markets drop by 15% (represented by Nifty 50) 4913 8.62 3.34 5.28
Shift to Equity fund with ~100% equity such as Kotak Select Focus 4913 8.62 0 8.62
Equity markets go up by 20% (represented by Nifty 50) 5896 10.35
Shift Back to Kotak MIP with ~20% equity exposure 5896 10 7.93 2.07
Why Kotak Monthly Income Plan- Growing Through Asset Allocation
The above illustration is only to explain how various types of funds can be considered for asset allocation in various equity market scenarios. This should not be
construed as an advice and indication of performance of the mentioned funds. The level of equity allocations mentioned are as per current scenario and only an
approximation. The exact allocation to equity in various funds would be different and as per the asset allocation provided in the SID of each fund.
78
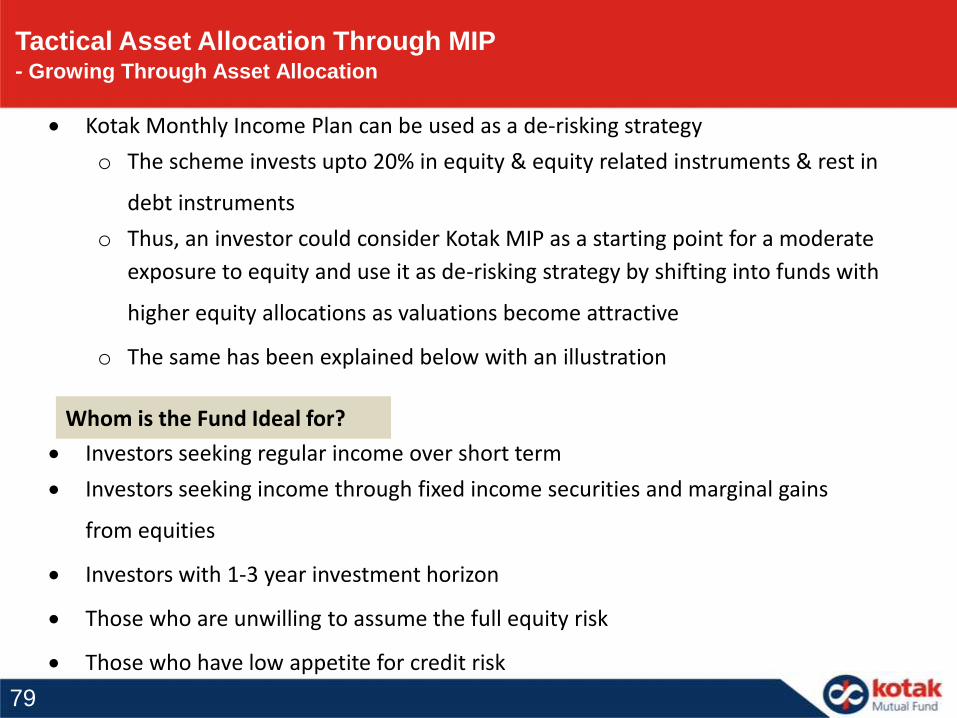
Tactical Asset Allocation Through MIP- Growing Through Asset Allocation
Kotak Monthly Income Plan can be used as a de-risking strategy
o The scheme invests upto 20% in equity & equity related instruments & rest in
debt instruments
o Thus, an investor could consider Kotak MIP as a starting point for a moderate
exposure to equity and use it as de-risking strategy by shifting into funds with
higher equity allocations as valuations become attractive
o The same has been explained below with an illustration
Whom is the Fund Ideal for?
Investors seeking regular income over short term
Investors seeking income through fixed income securities and marginal gains
from equities
Investors with 1-3 year investment horizon
Those who are unwilling to assume the full equity risk
Those who have low appetite for credit risk
79
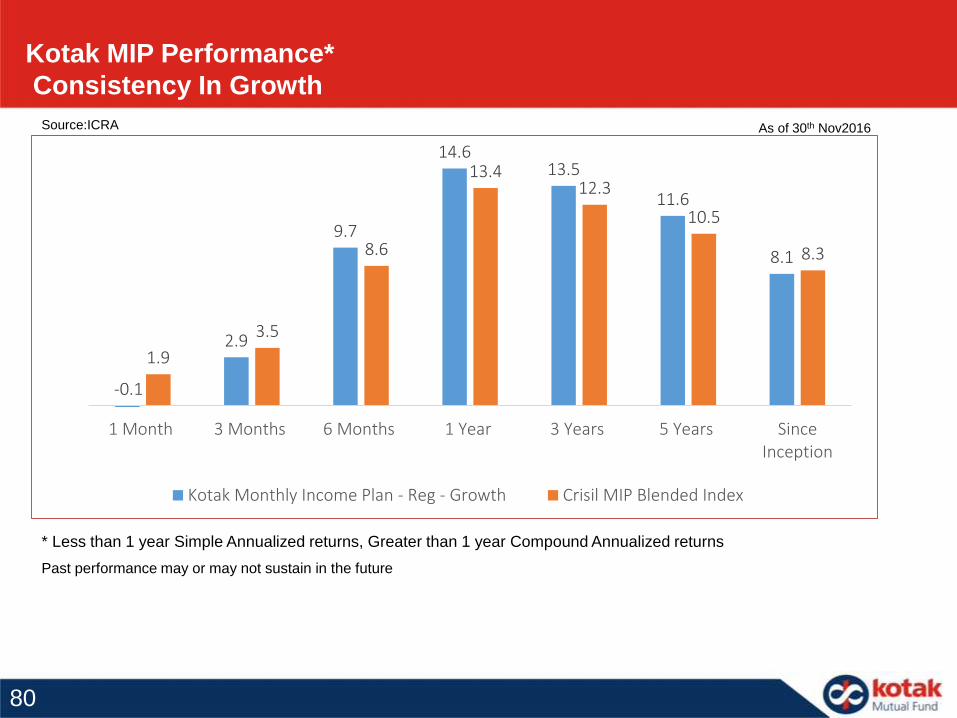
-0.1
2.9
9.7
14.613.5
11.6
8.1
1.9
3.5
8.6
13.412.3
10.5
8.3
1 Month 3 Months 6 Months 1 Year 3 Years 5 Years SinceInception
Kotak Monthly Income Plan - Reg - Growth Crisil MIP Blended Index
Kotak MIP Performance*
Consistency In Growth
As of 30th Nov2016Source:ICRA
* Less than 1 year Simple Annualized returns, Greater than 1 year Compound Annualized returns
Past performance may or may not sustain in the future
80
Scheme Inception date is 02/12/2003. Fund Managed by Mr. Devender Singhal & Mr. Abhishek Bisen.
^Past performance may or may not be sustained in future. *All payouts during the period have been reinvested in the units of the scheme at the
then prevailing NAV. Returns <= 1 year: Absolute; Returns > 1 year: CAGR (Compounded Annualised Growth Rate). N.A stands for data not
available. Note: Point to Point (PTP) Returns in INR shows the value of 10,000/- investment made at inception. Source: ICRA MFI Explorer.
Classification of schemes in short term & long term is based on the average maturity of the scheme. # Name of Scheme Benchmark. ## Name of
Additional Benchmark. Please refer page no. 66 for top 3 and bottom 3 schemes managed by Mr. Abhishek Bisen & Mr. Devender Singhal.
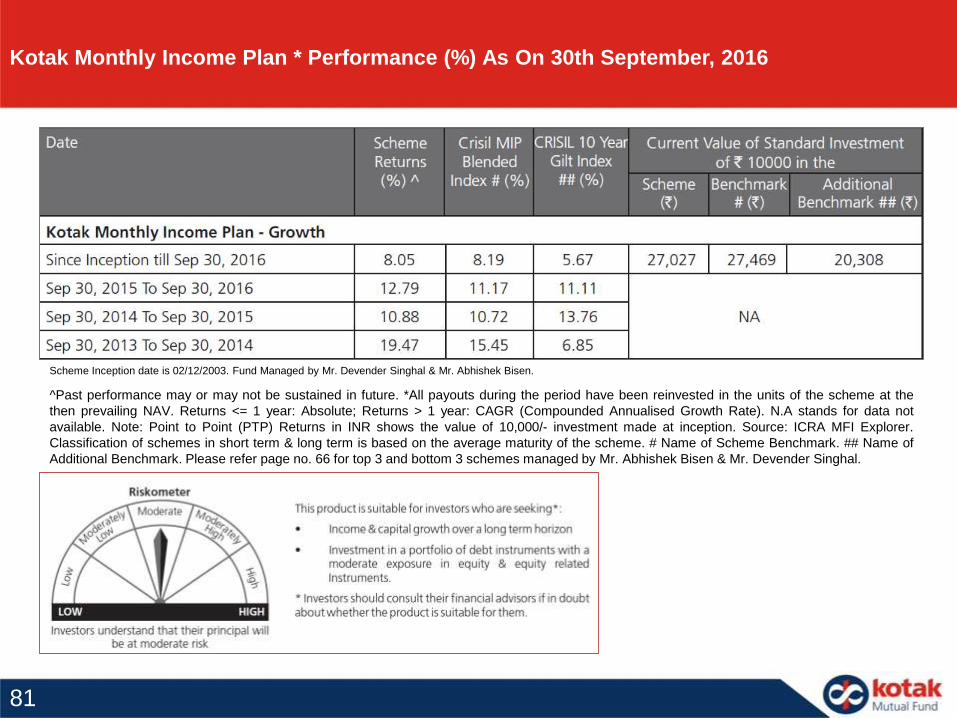
Kotak Monthly Income Plan * Performance (%) As On 30th September, 2016
81
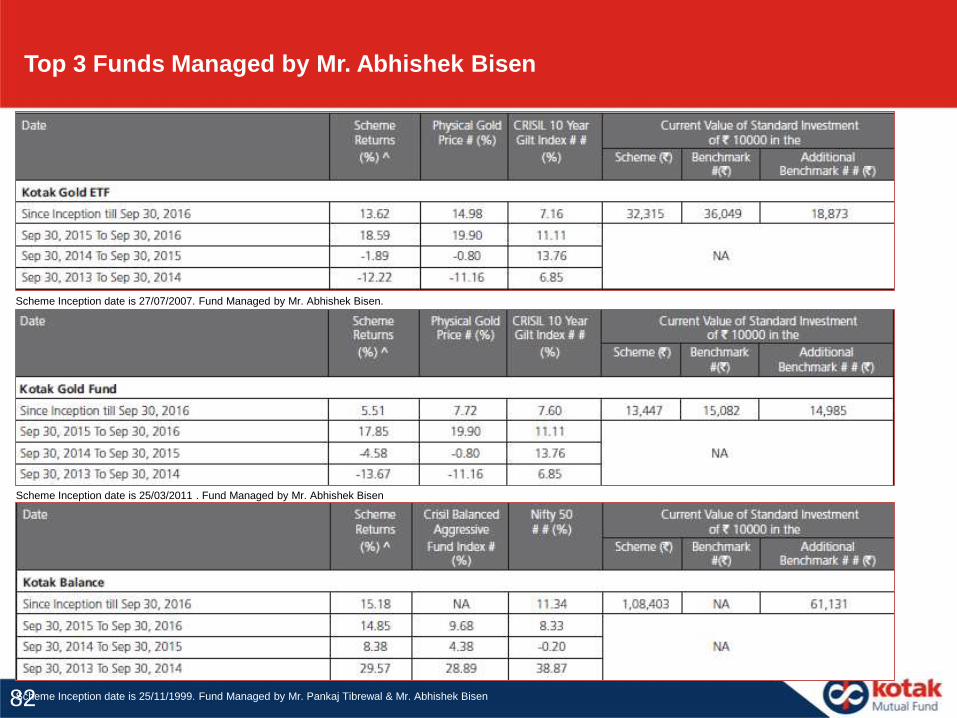
Top 3 Funds Managed by Mr. Abhishek Bisen
Scheme Inception date is 27/07/2007. Fund Managed by Mr. Abhishek Bisen.
Scheme Inception date is 25/03/2011 . Fund Managed by Mr. Abhishek Bisen
Scheme Inception date is 25/11/1999. Fund Managed by Mr. Pankaj Tibrewal & Mr. Abhishek Bisen82
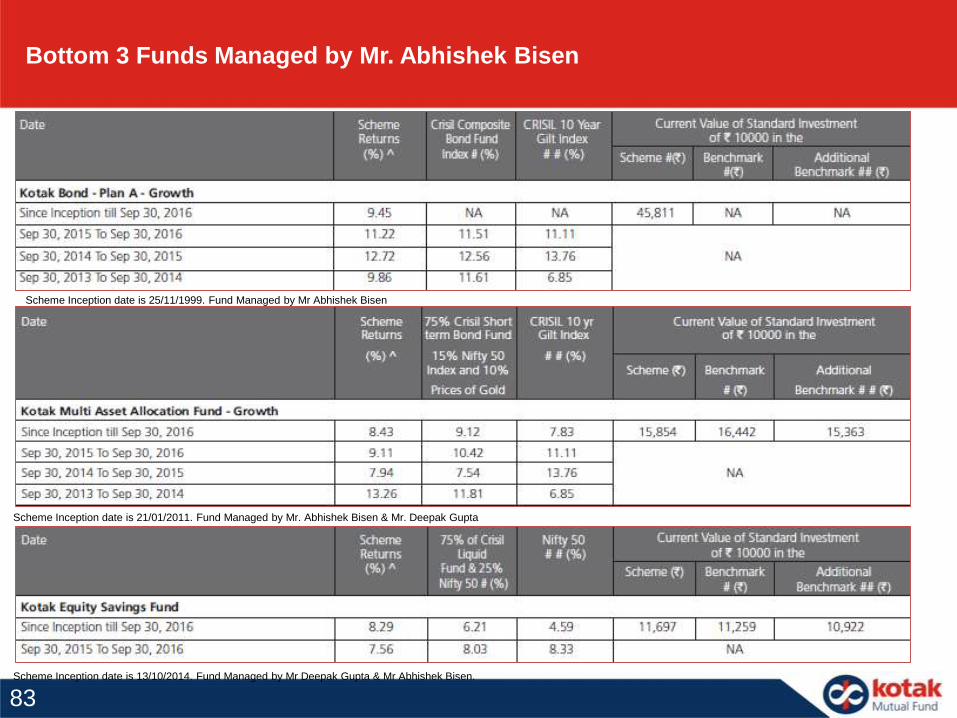
Bottom 3 Funds Managed by Mr. Abhishek Bisen
Scheme Inception date is 25/11/1999. Fund Managed by Mr Abhishek Bisen
Scheme Inception date is 21/01/2011. Fund Managed by Mr. Abhishek Bisen & Mr. Deepak Gupta
Scheme Inception date is 13/10/2014. Fund Managed by Mr Deepak Gupta & Mr Abhishek Bisen.
83
The information contained in this (document) is extracted from different public sources. Allreasonable care has been taken to ensure that the information contained herein is notmisleading or untrue at the time of publication. This is for the information of the person towhom it is provided without any liability whatsoever on the part of Kotak Mahindra AssetManagement Co Ltd or any associated companies or any employee thereof.We are notsoliciting any action based on this material and is for general information only. Mutual Fundinvestments are subject to market risks, read all scheme related documents carefully.
DISCLAIMERS & RISK FACTORS
About the scheme:
84
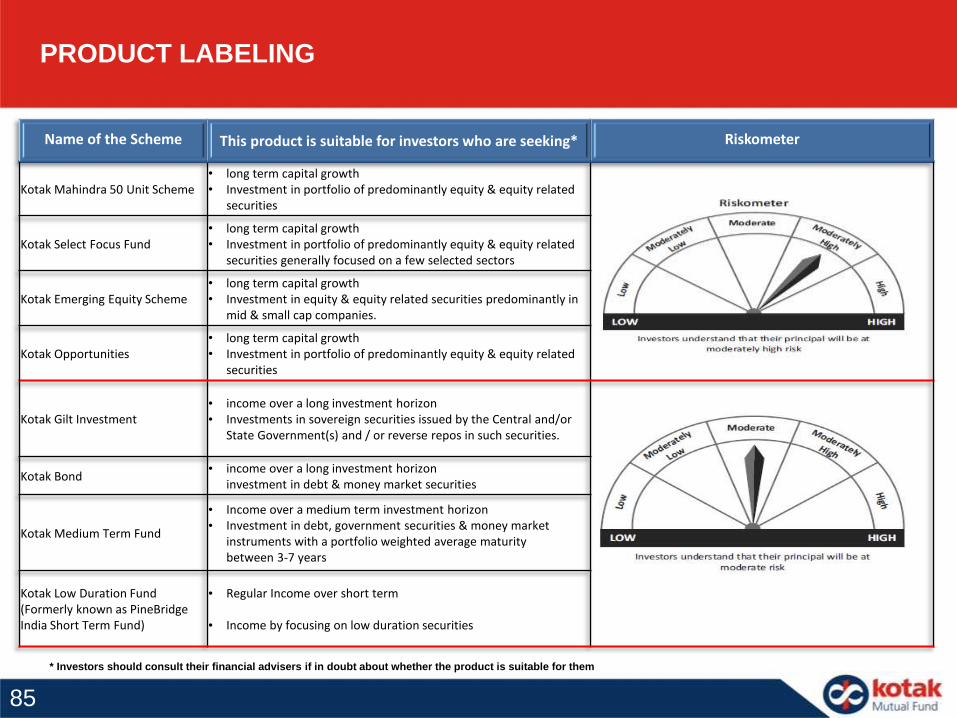
Name of the Scheme This product is suitable for investors who are seeking* Riskometer
Kotak Mahindra 50 Unit Scheme• long term capital growth• Investment in portfolio of predominantly equity & equity related
securities
Kotak Select Focus Fund • long term capital growth• Investment in portfolio of predominantly equity & equity related
securities generally focused on a few selected sectors
Kotak Emerging Equity Scheme• long term capital growth• Investment in equity & equity related securities predominantly in
mid & small cap companies.
Kotak Opportunities• long term capital growth• Investment in portfolio of predominantly equity & equity related
securities
Kotak Gilt Investment• income over a long investment horizon• Investments in sovereign securities issued by the Central and/or
State Government(s) and / or reverse repos in such securities.
Kotak Bond• income over a long investment horizon
investment in debt & money market securities
Kotak Medium Term Fund
• Income over a medium term investment horizon• Investment in debt, government securities & money market
instruments with a portfolio weighted average maturitybetween 3-7 years
Kotak Low Duration Fund (Formerly known as PineBridgeIndia Short Term Fund)
• Regular Income over short term
• Income by focusing on low duration securities
* Investors should consult their financial advisers if in doubt about whether the product is suitable for them
PRODUCT LABELING
85
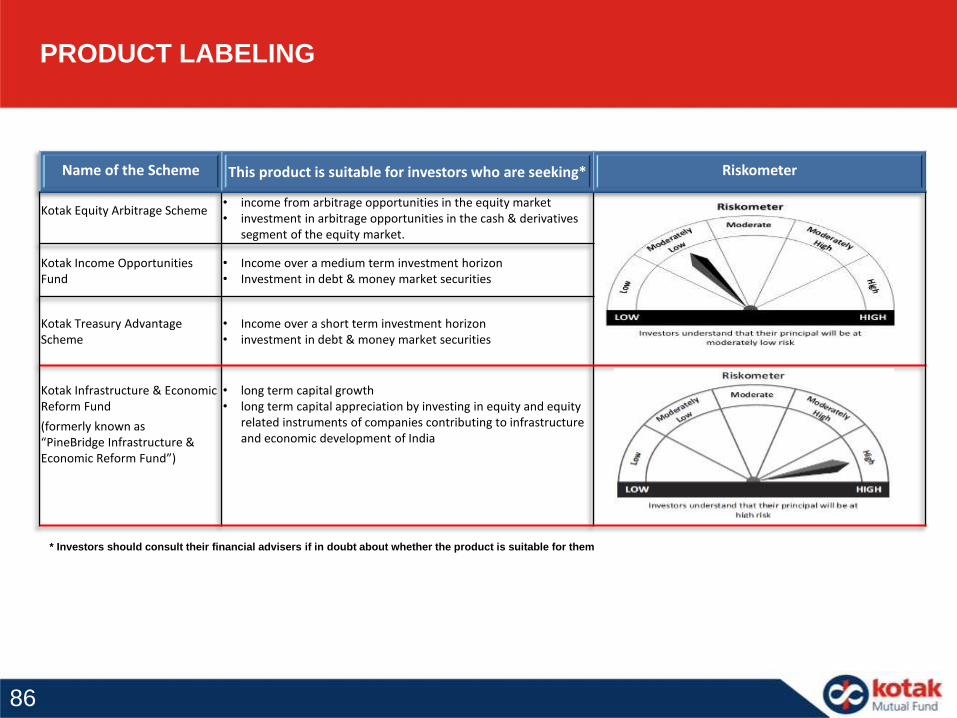
Name of the Scheme This product is suitable for investors who are seeking* Riskometer
Kotak Equity Arbitrage Scheme• income from arbitrage opportunities in the equity market• investment in arbitrage opportunities in the cash & derivatives
segment of the equity market.
Kotak Income Opportunities Fund
• Income over a medium term investment horizon• Investment in debt & money market securities
Kotak Treasury Advantage Scheme
• Income over a short term investment horizon• investment in debt & money market securities
Kotak Infrastructure & Economic Reform Fund
(formerly known as “PineBridge Infrastructure & Economic Reform Fund”)
• long term capital growth• long term capital appreciation by investing in equity and equity
related instruments of companies contributing to infrastructure and economic development of India
* Investors should consult their financial advisers if in doubt about whether the product is suitable for them
PRODUCT LABELING
86