market models of phev diffusion - university of michigan · market models of phev diffusion walter...
TRANSCRIPT

Market Models of PHEV Diffusion
Walter McManusThe Extramundane EconomistUMTRI: Automotive Analysis

The race to clean vehicles• Market and regulatory factors driving the shift
to clean vehicles– Regulation– Market
• Consumers• Competition
• Current situation of the Big Six automakers– Sales units, retail revenue, & variable profits
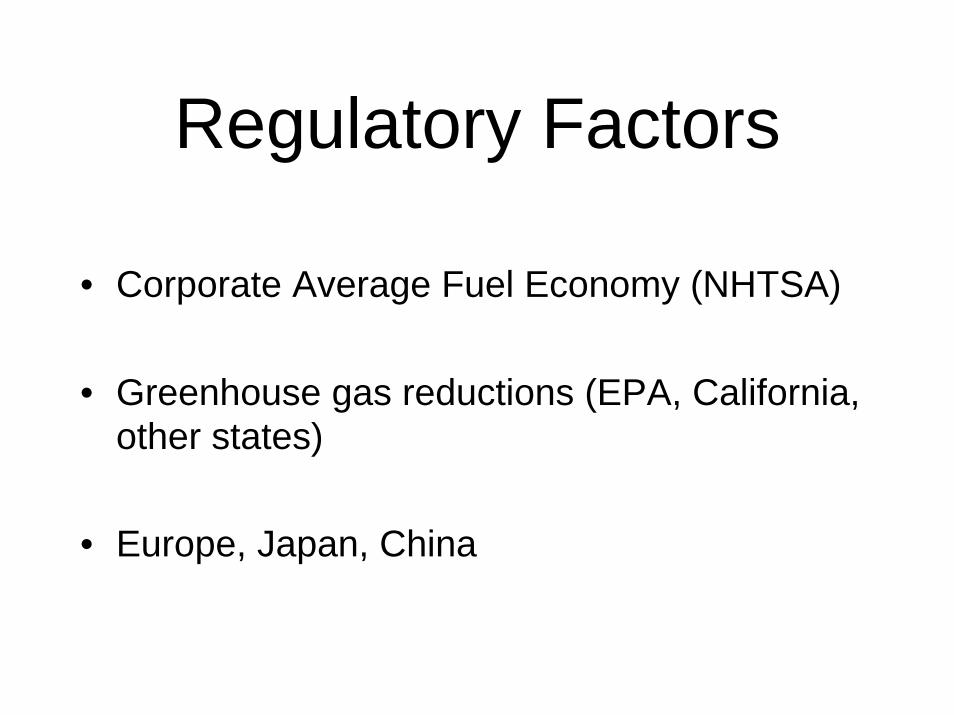
Regulatory Factors
• Corporate Average Fuel Economy (NHTSA)
• Greenhouse gas reductions (EPA, California, other states)
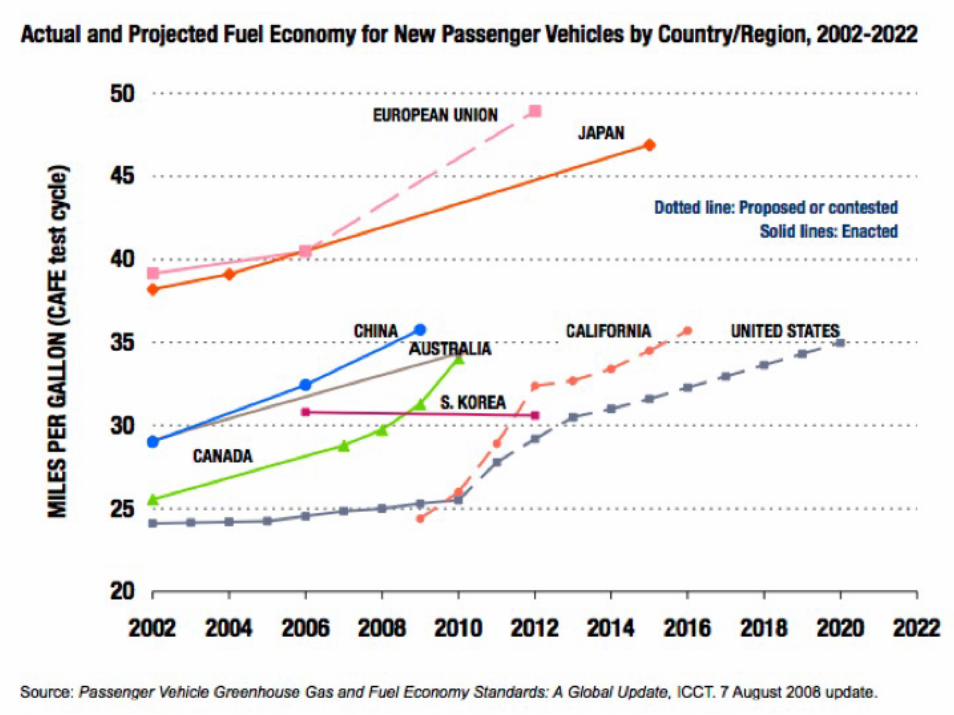
• Europe, Japan, China

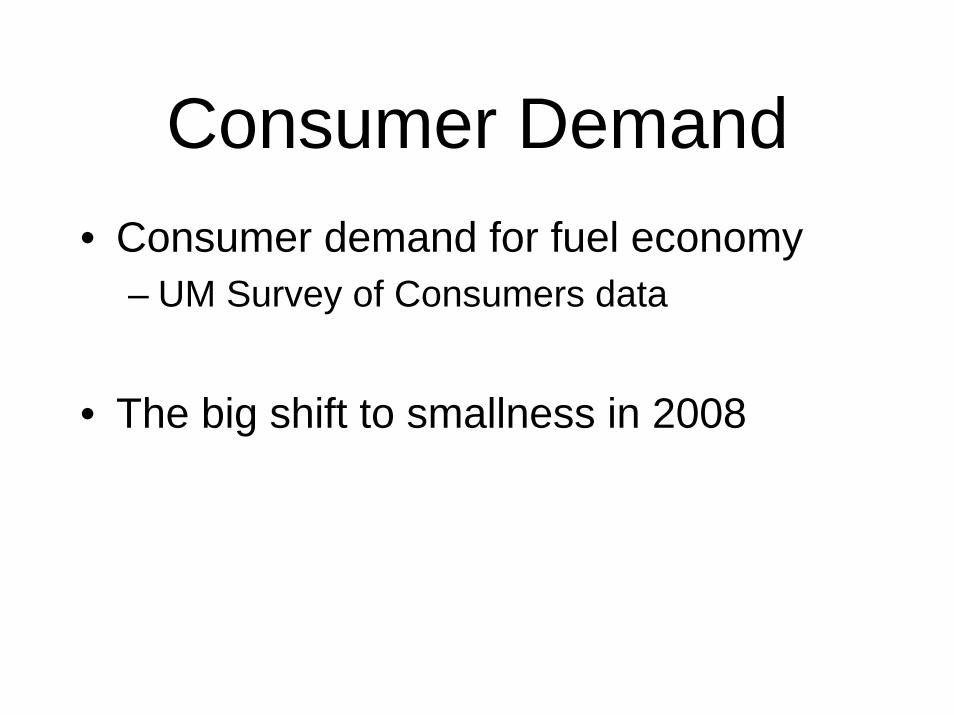
Consumer Demand• Consumer demand for fuel economy
– UM Survey of Consumers data
• The big shift to smallness in 2008

Market Factor:The Link Between Rising Fuel Prices and Falling Truck Prices
96
98
100
102
104
106
108
110
112
Jan-98 Jan-99 Jan-00 Jan-01 Jan-02 Jan-03 Jan-04 Jan-05 Jan-06 Jan-07 Jan-08
(CPI
New
Tru
cks)
/ (C
PI N
ew C
ars)
40
55
70
85
100
115
130
145
160
RE
VE
RSE
D S
CA
LE
(CPI
Fue
l) / (
CPI
All)
CPI New Truck / CPI New Car
CPI Unleaded Regular / CPI All Items
Source: Consumer Price Index - All Urban Consumers, U.S. Bureau of Labor Statistics & Calculations by author.
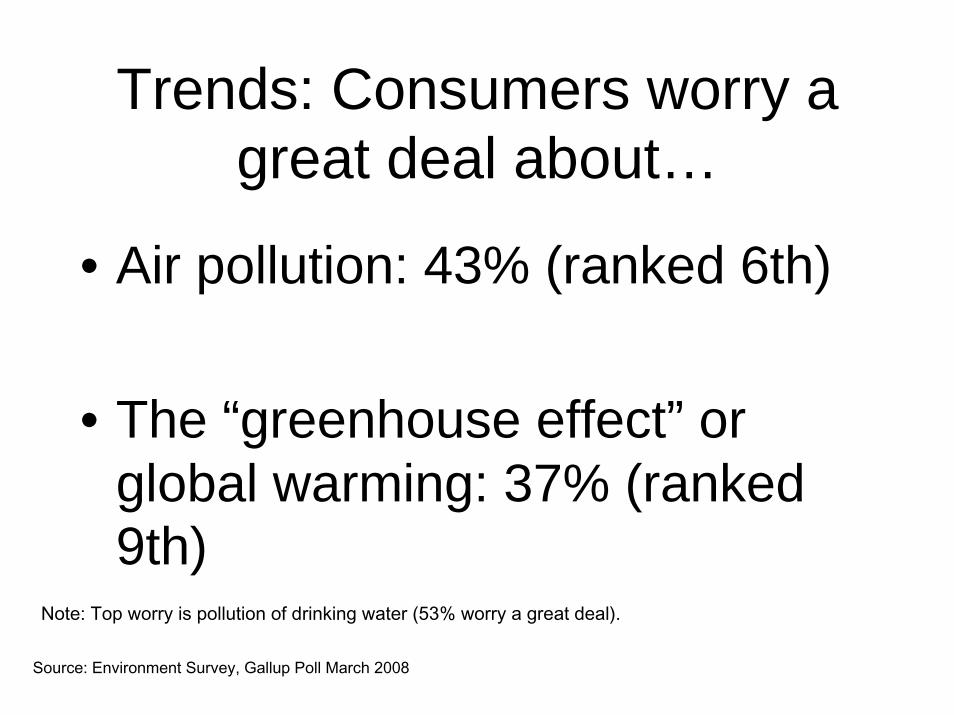
Trends: Consumers worry a great deal about…
• Air pollution: 43% (ranked 6th)
• The “greenhouse effect” or global warming: 37% (ranked 9th)
Source: Environment Survey, Gallup Poll March 2008
Note: Top worry is pollution of drinking water (53% worry a great deal).
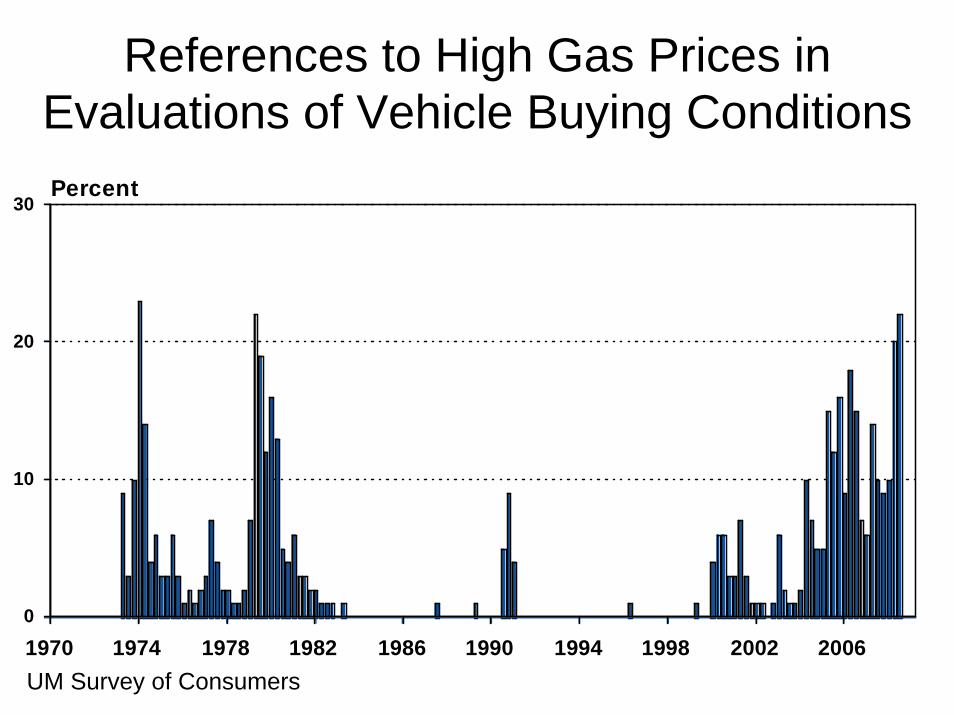
References to High Gas Prices in Evaluations of Vehicle Buying Conditions
0
10
20
30
1970 1974 1978 1982 1986 1990 1994 1998 2002 2006
Percent
UM Survey of Consumers
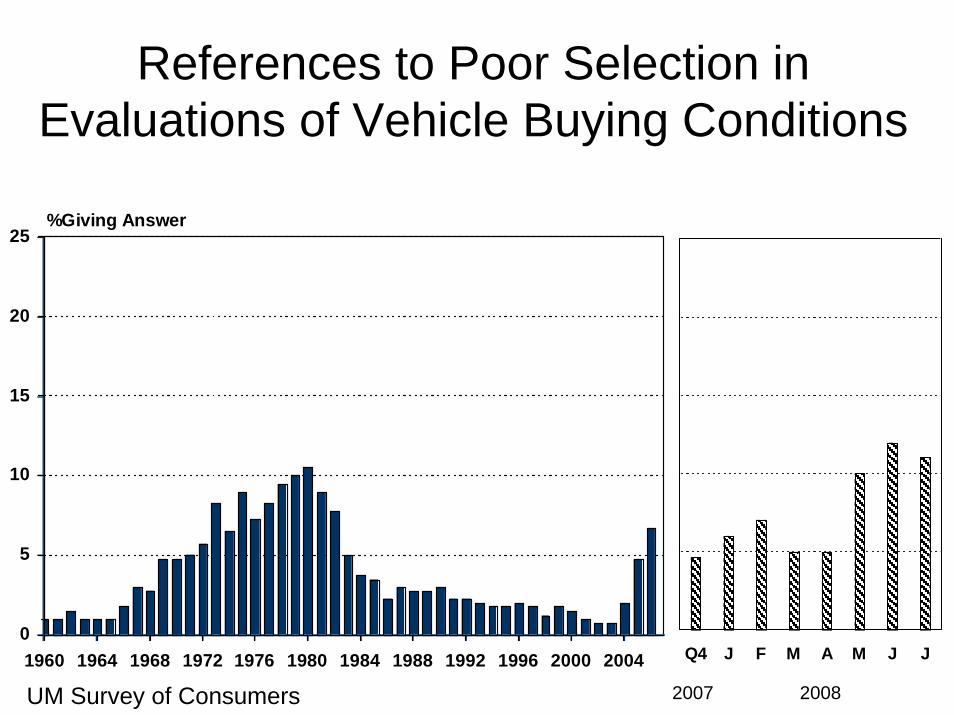
References to Poor Selection in Evaluations of Vehicle Buying Conditions
0
5
10
15
20
25
1960 1964 1968 1972 1976 1980 1984 1988 1992 1996 2000 2004
%Giving Answer
Q4 J F M A M J J
2007 2008UM Survey of Consumers

Competition• Trends in technology adoption in vehicle
market• Vehicle models by automaker 2007-09
– EPA Clean Vehicles data• Emerging technologies
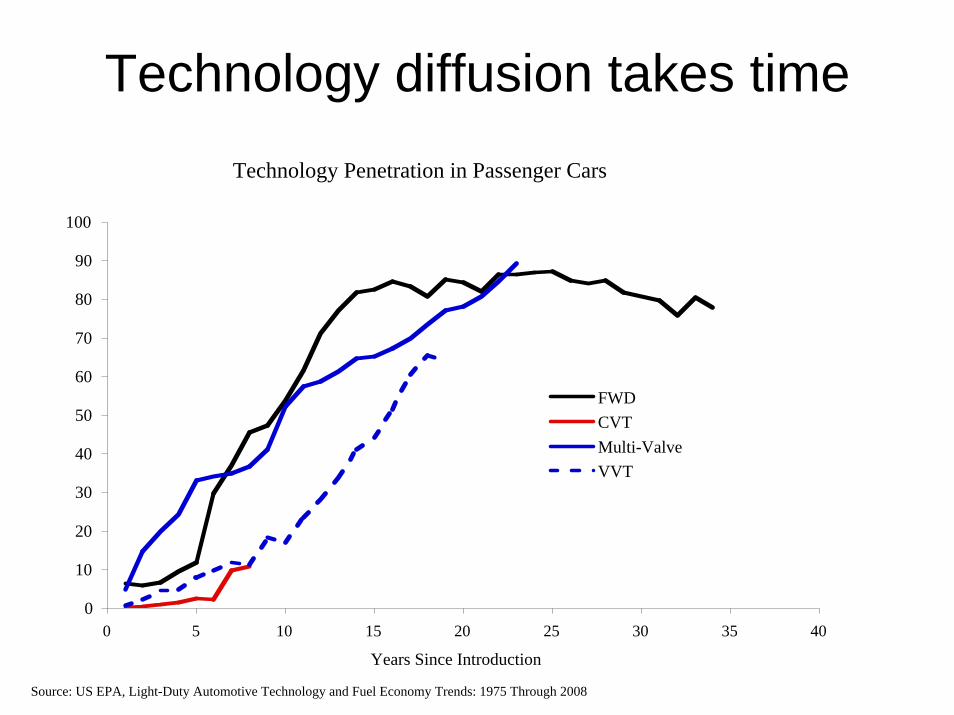
Technology diffusion takes time Technology Penetration in Passenger Cars
0
10
20
30
40
50
60
70
80
90
100
0 5 10 15 20 25 30 35 40
Years Since Introduction
FWDCVTMulti-ValveVVT
Source: US EPA, Light-Duty Automotive Technology and Fuel Economy Trends: 1975 Through 2008
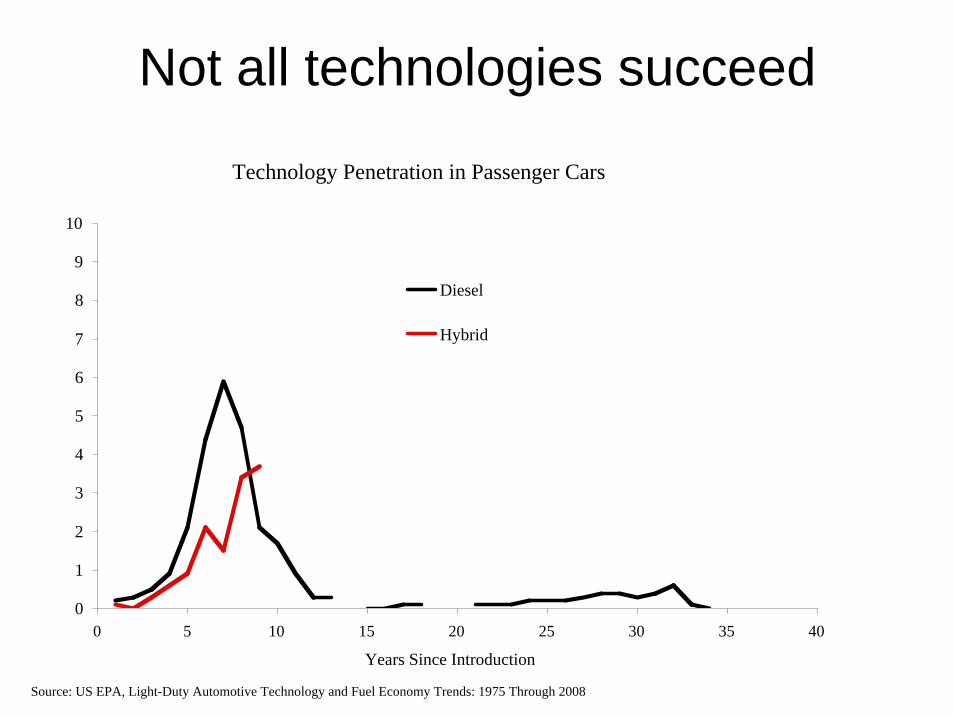
Not all technologies succeed
Technology Penetration in Passenger Cars
0
1
2
3
4
5
6
7
8
9
10
0 5 10 15 20 25 30 35 40
Years Since Introduction
Diesel
Hybrid
Source: US EPA, Light-Duty Automotive Technology and Fuel Economy Trends: 1975 Through 2008
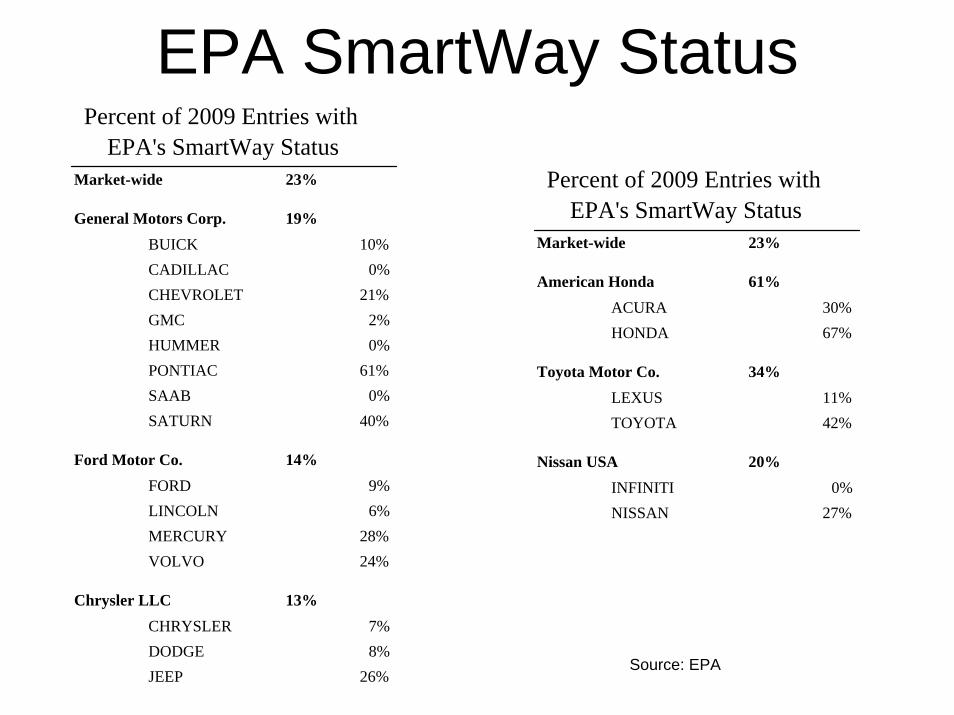
EPA SmartWay Status
Market-wide 23%
American Honda 61%ACURA 30%HONDA 67%
Toyota Motor Co. 34%LEXUS 11%TOYOTA 42%
Nissan USA 20%INFINITI 0%NISSAN 27%
Percent of 2009 Entries with EPA's SmartWay Status
Market-wide 23%
General Motors Corp. 19%BUICK 10%CADILLAC 0%CHEVROLET 21%GMC 2%HUMMER 0%PONTIAC 61%SAAB 0%SATURN 40%
Ford Motor Co. 14%FORD 9%LINCOLN 6%MERCURY 28%VOLVO 24%
Chrysler LLC 13%CHRYSLER 7%DODGE 8%JEEP 26%
Percent of 2009 Entries with EPA's SmartWay Status
Source: EPA
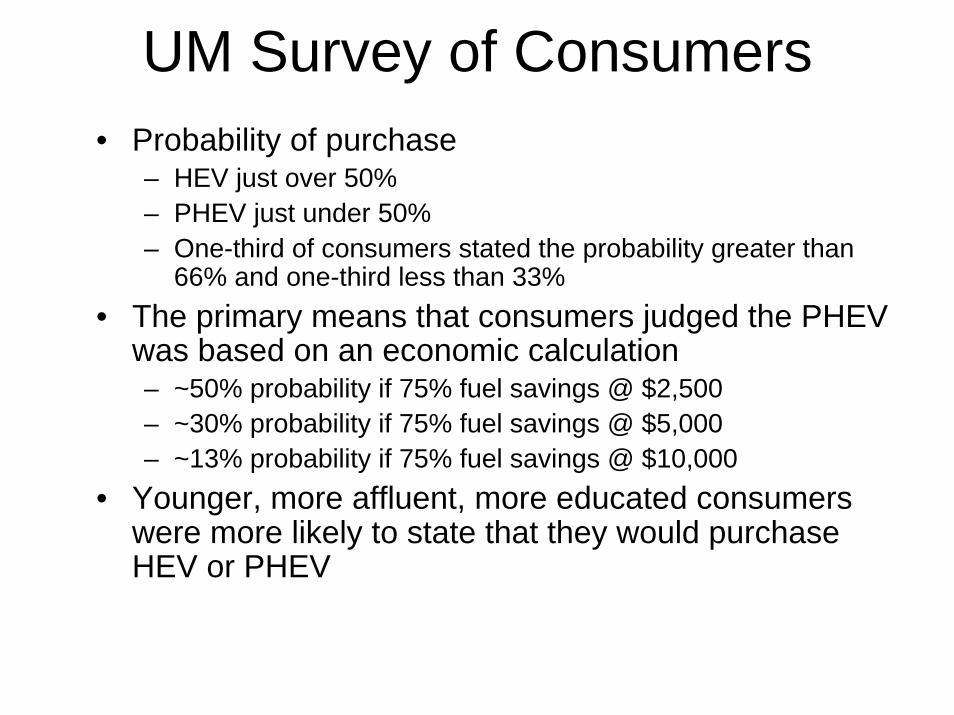
UM Survey of Consumers• Probability of purchase
– HEV just over 50%– PHEV just under 50%– One-third of consumers stated the probability greater than
66% and one-third less than 33%• The primary means that consumers judged the PHEV
was based on an economic calculation– ~50% probability if 75% fuel savings @ $2,500– ~30% probability if 75% fuel savings @ $5,000– ~13% probability if 75% fuel savings @ $10,000
• Younger, more affluent, more educated consumers were more likely to state that they would purchase HEV or PHEV
Models of Adoption
• Aggregate models• Agent-based models• Micro-simulation models ---->
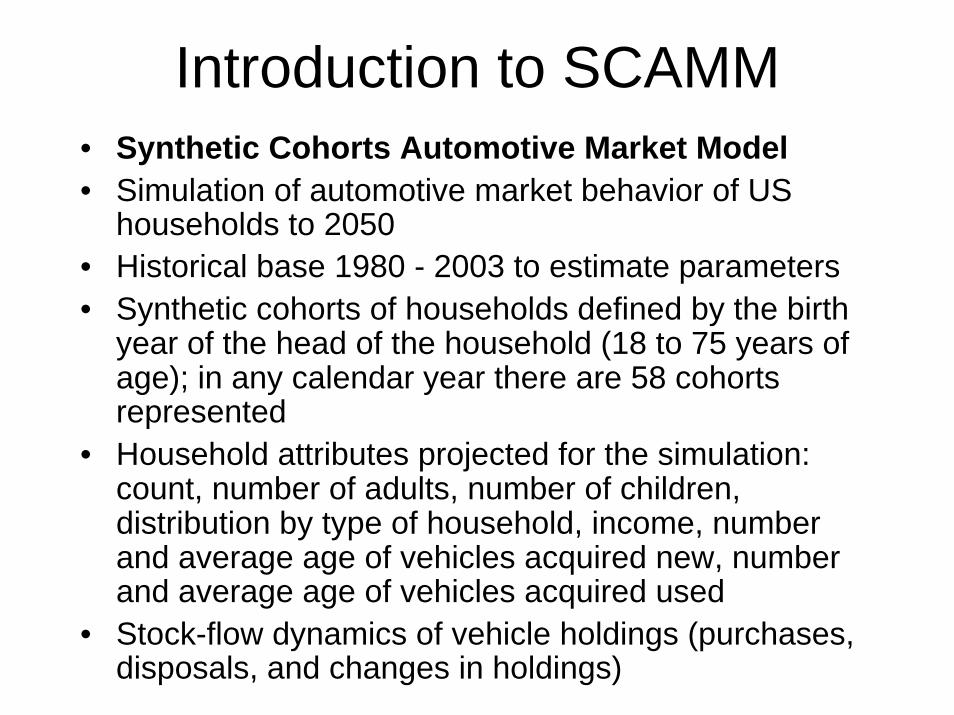
Introduction to SCAMM• Synthetic Cohorts Automotive Market Model• Simulation of automotive market behavior of US
households to 2050• Historical base 1980 - 2003 to estimate parameters• Synthetic cohorts of households defined by the birth
year of the head of the household (18 to 75 years of age); in any calendar year there are 58 cohorts represented
• Household attributes projected for the simulation:count, number of adults, number of children, distribution by type of household, income, numberand average age of vehicles acquired new, number and average age of vehicles acquired used
• Stock-flow dynamics of vehicle holdings (purchases,disposals, and changes in holdings)

SCAMM
N1
A1
H
σ
p
q (A1/V1)
V2
φγ
(1-φ)γ
μ+δμ+δ μ+δ

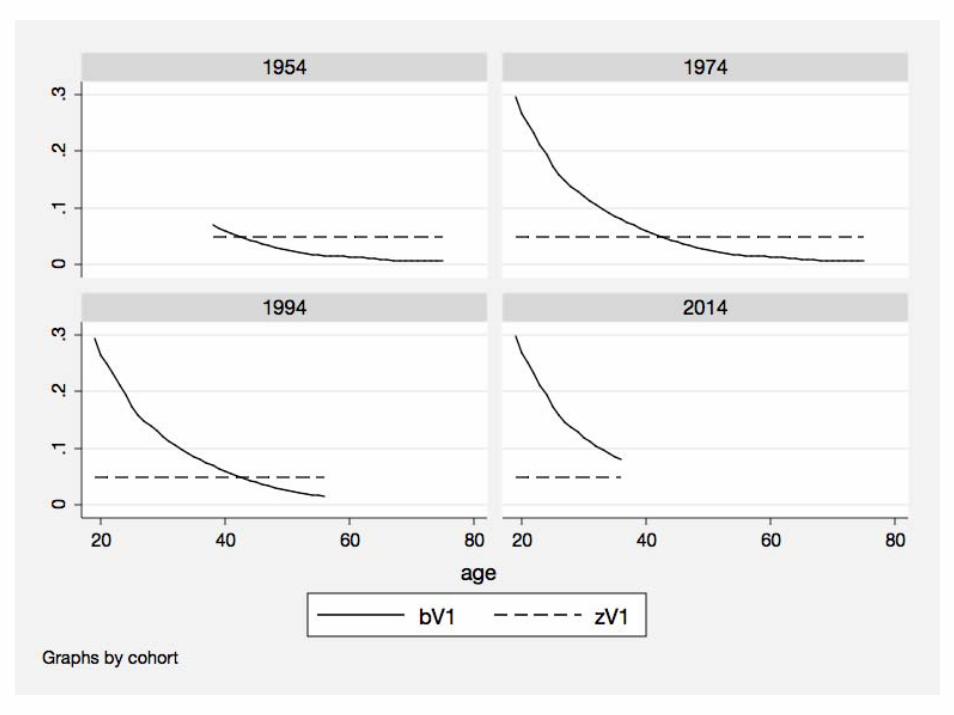
The mathematics of SCAMM
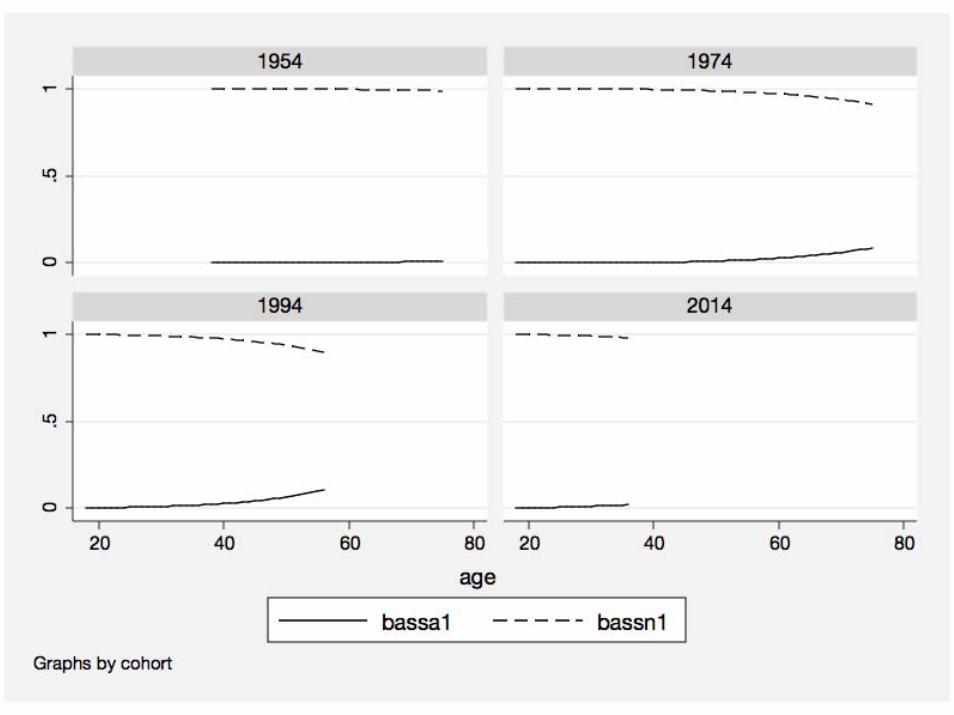
• The Bass model is applied to each cohort with explicit accounting for the impacts of births and deaths on diffusion (Centrone et al. 2007* presented this model and applied it to cellular phone markets.)
• Three equations describe the system:– V(t) = N(t) + A(t)– N(t) = N(t-1) + σM(t-1) - ( δ - p - q[ A(t-1)/V(t-1)] )N(t-1)– A(t) = A(t-1) - δA(t-1) + ( δ - p - q[ A(t-1)/V(t-1)] )N(t-1)
• In shares (a=A/V, n=N/V)– a(t) = a(t-1) + m[ p + (q - p - σ)a - qa2 ]
* Dentrone, F., Goia, A., Salinelli, E., Demographic processes in a model of innovation diffusion with a dynamic market, Technological Forecasting & Social Change 74 (2007) 247 - 266
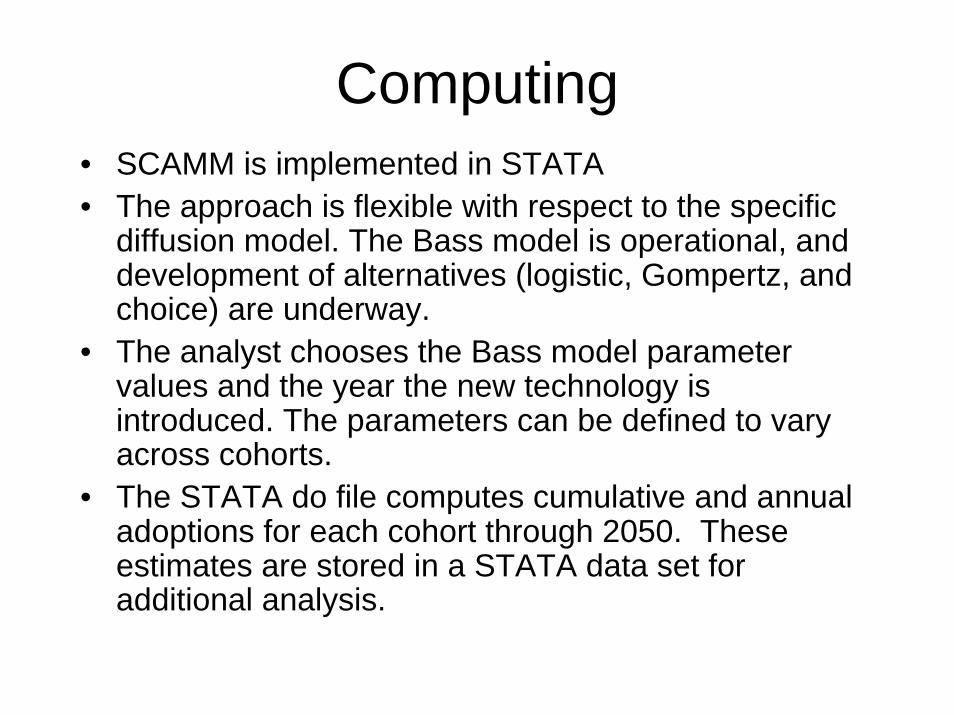
Computing• SCAMM is implemented in STATA• The approach is flexible with respect to the specific
diffusion model. The Bass model is operational, and development of alternatives (logistic, Gompertz, and choice) are underway.
• The analyst chooses the Bass model parameter values and the year the new technology is introduced. The parameters can be defined to vary across cohorts.
• The STATA do file computes cumulative and annual adoptions for each cohort through 2050. These estimates are stored in a STATA data set for additional analysis.

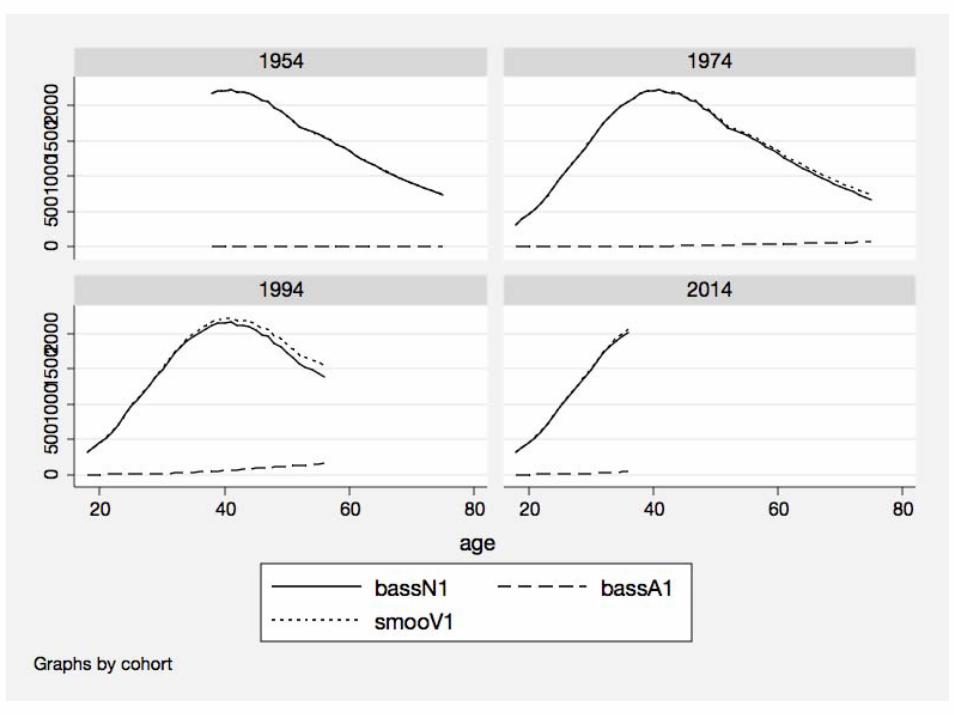
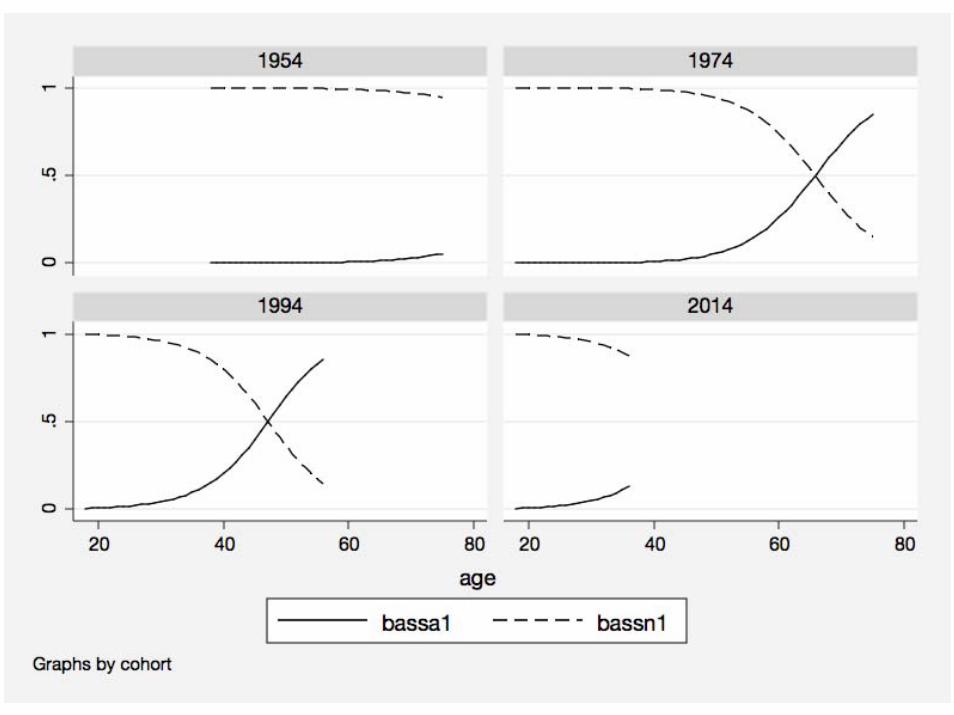
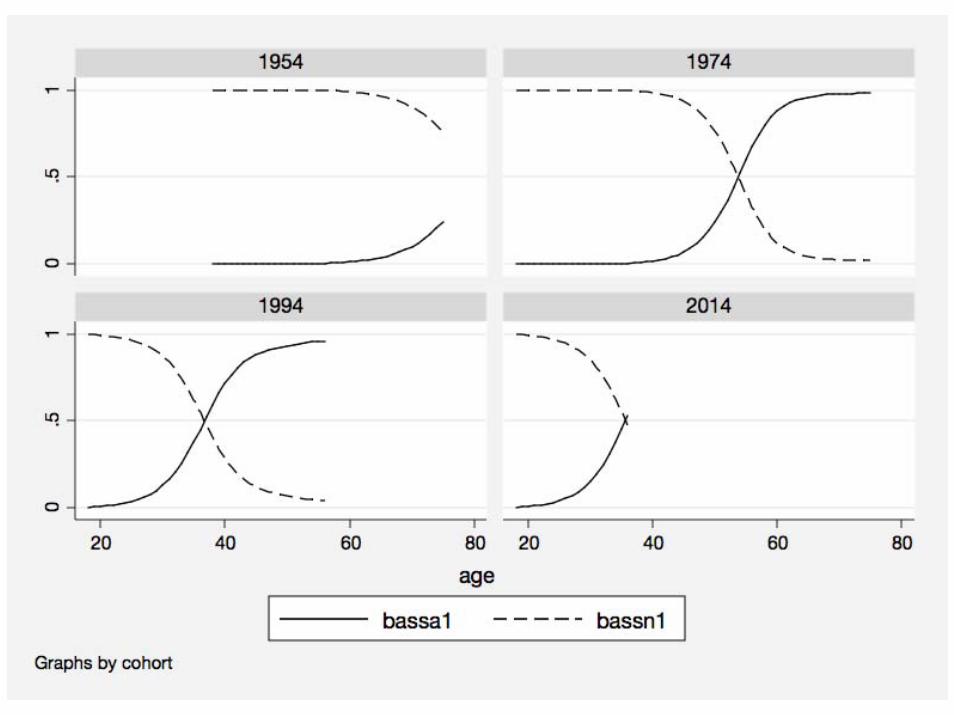
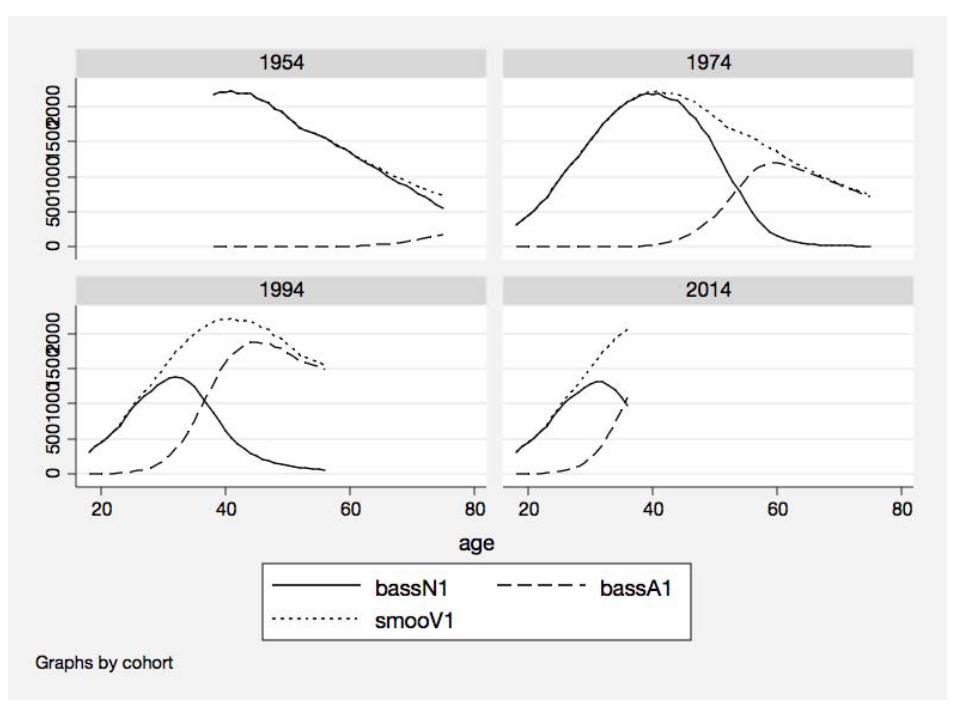
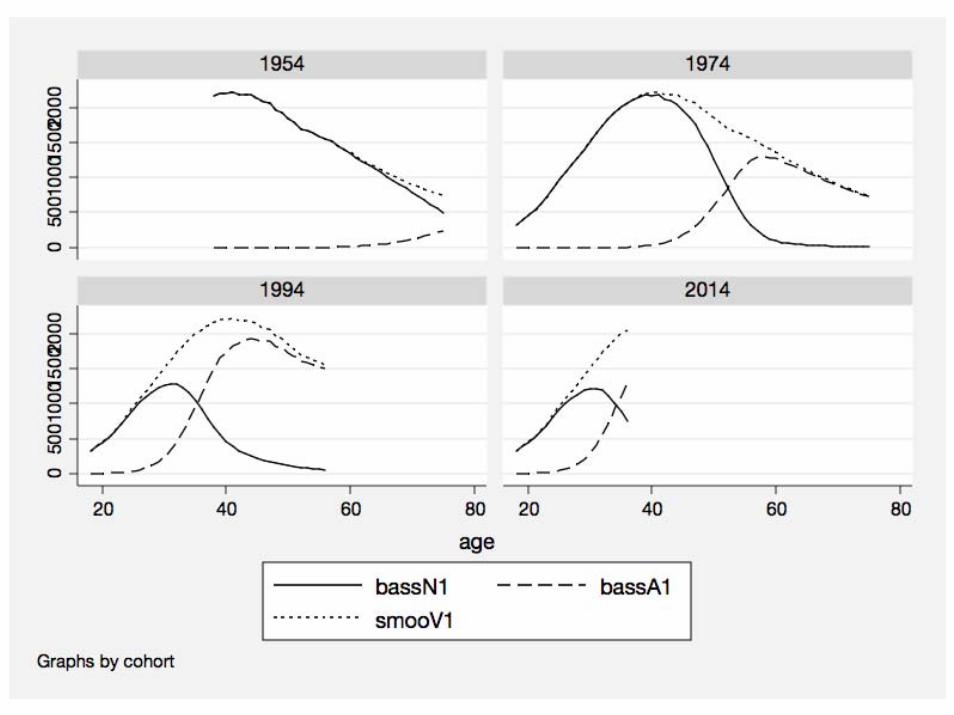
Growth, Replacements, and Acquisitions
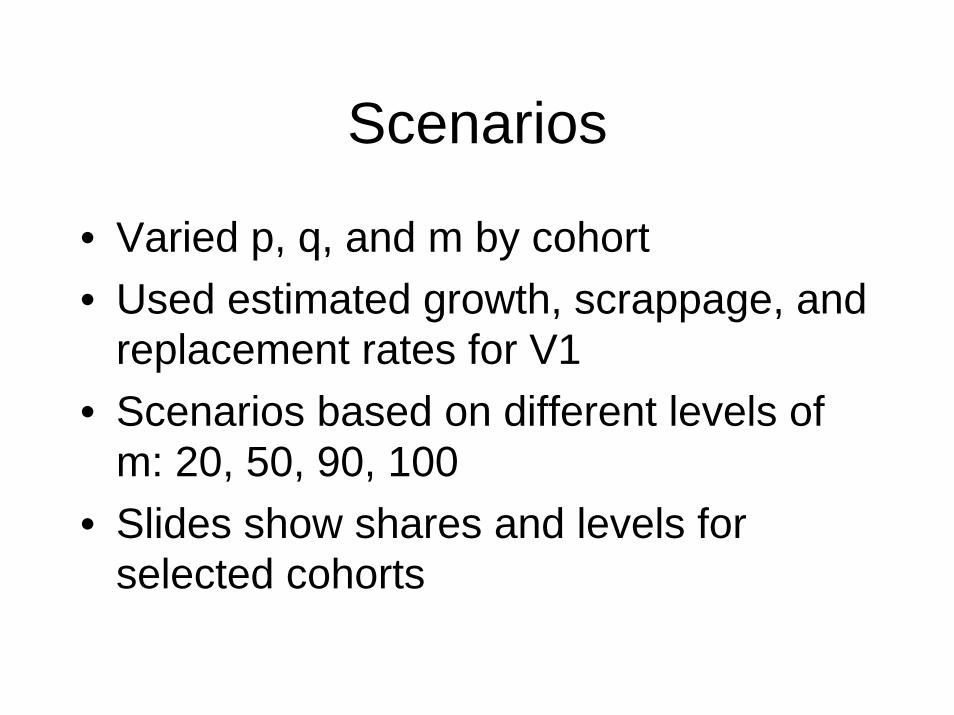
Scenarios
• Varied p, q, and m by cohort• Used estimated growth, scrappage, and
replacement rates for V1• Scenarios based on different levels of
m: 20, 50, 90, 100• Slides show shares and levels for
selected cohorts

Constant Parameters

Constant Parameters


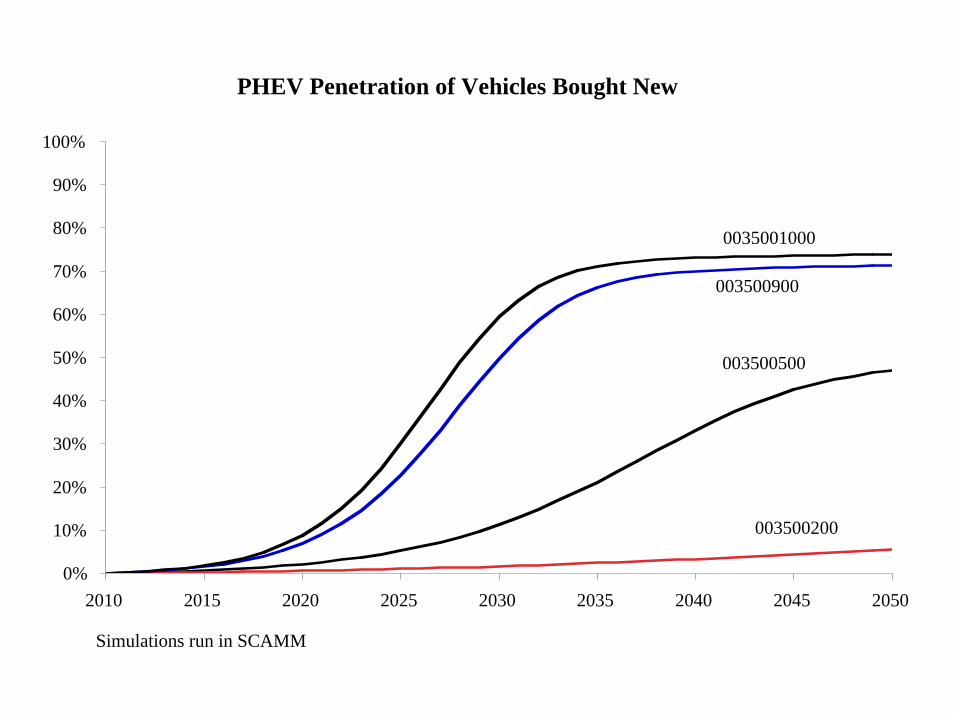
PHEV Penetration of Vehicles Bought New
0%
10%
20%
30%
40%
50%
60%
70%
80%
90%
100%
2010 2015 2020 2025 2030 2035 2040 2045 2050
Simulations run in SCAMM
003500900
003500200
003500500
0035001000
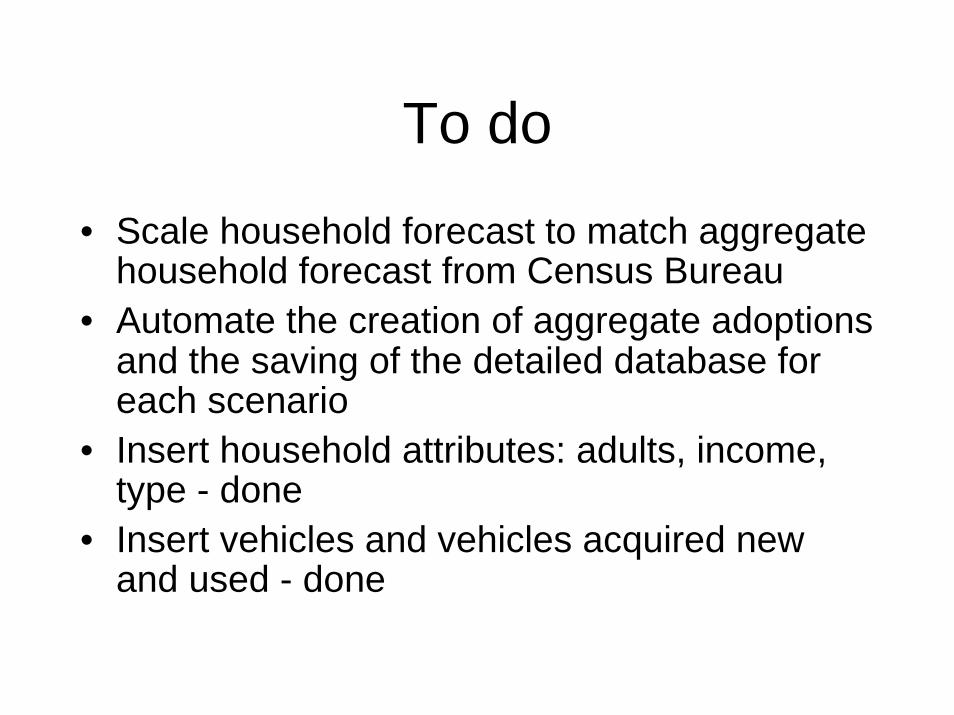
To do
• Scale household forecast to match aggregate household forecast from Census Bureau
• Automate the creation of aggregate adoptions and the saving of the detailed database for each scenario
• Insert household attributes: adults, income,type - done
• Insert vehicles and vehicles acquired new and used - done
Next Steps• Define additional scenarios to examine the sensitivity
of PHEV diffusion to a range of economic and demographic influences.
• Examine the link between the Bass parameters to income, price, fuel costs, and demographics.
• Incorporate findings from the survey.– Use the likelihood of purchase as an estimate of the
maximum penetration– Compare the sensitivity to price and fuel savings shown in
the survey to empirical estimates.• Use the detailed STATA output to flesh out the
diffusion forecast.