market manipulation and innovation - fmaconferences.org · market manipulation and innovation ......
TRANSCRIPT

Market Manipulation and Innovation
Douglas Cumming York University - Schulich School of Business
4700 Keele Street, Toronto, Ontario M3J 1P3, Canada
Shan Ji Capital Markets CRC Limited (CMCRC)
3/55 Harrington St, Sydney, NSW 2000, Australia
Rejo Peter York University - Schulich School of Business
4700 Keele Street, Toronto, Ontario M3J 1P3, Canada
First Draft: December 1, 2015
This Draft: January 17, 2017
Acknowledgments: We thank the seminar participants at Capital Markets CRC, SKEMA Business School, and York University for helpful comments and suggestions. All errors are our own. Douglas Cumming gratefully acknowledges the Social Science Research and Humanities Council of Canada for financial support. Rejo Peter gratefully acknowledges the support of Capital Markets CRC (CMCRC) and Michael Aitken for the opportunity to visit CMCRC throughout 2015 to work on this project.

Market Manipulation and Innovation
Abstract
End-of-day price manipulation is associated short-termism of the firm’s orientation, long-term
harm to a firm’s equity values, and commensurate reduced incentives for employees to innovate.
Insider trading, by contrast, enables innovators to achieve exacerbated profits from innovation.
Based on a comprehensive sample of all trading days and suspected end-of-day and insider trading
events for all stocks from proprietary surveillance data from 9 countries over the years 2003-2010,
we find evidence consistent with these real impacts of market manipulation on innovation.
Keywords: Market Manipulation; End-of-Day Dislocation, Insider Trading; Patents; Innovation; Intellectual Property Rights; Law and finance
JEL Classification: G14; G18; O30

1. Introduction
Pretty much without exception, financial market misconduct is viewed as being very costly
to financial markets, and hence is an active area of scholarly study. Research on the consequences
of financial market misconduct can be categorized into four types of papers: (1) managerial
consequences such as salaries, termination, and jail terms (Karpoff et al., 2008a; Bereskin et al.,
2014; Aharony et al., 2015), (2) stock market participation at the country level (La Porta at el.,
1997, 1998, 2002, 2006) and individual level (Giannetti and Wang, 2014), (3) consequences in
terms funds under management such as for hedge funds (Bollen and Pool, 2009) and mutual funds
(Chapman et al., 2013), and (4) share price declines and legal penalties (Karpoff et al., 2008b;
Karpoff and Lou, 2010; Dyck et al., 2010, 2014; Vismara et al., 2015). In this paper, we extend
this line of literature by examining a fifth category not previously studied in the literature: the
effect of financial market misconduct on innovation. We examine whether there is a link between
financial market misconduct and firm patenting in a number of countries around the world.
Financial market misconduct comes in a variety of forms. Two of the most commonly
observed (and hence commonly studied) forms of manipulation include insider trading (Allen and
Gale, 1992; Allen and Gorton, 1992; Meulbrook, 1992; Bebchuk and Fershtman, 1994; Agrawal
and Cooper, 2015; Bernilie et al., 2015; Aitken et al., 2015b) and end-of-day manipulation
(Atanasov et al., 2015; Aitken et al., 2015a). It is well known that when there is information only
known by insiders then insiders can trade in advance of public dissemination of the information
for short-term profit at the expense of the counterparties in the trade and at the expense of the long-
term value to the firm. It is perhaps somewhat less well known that there are massive incentives

to manipulate closing price by ramping up end of day trading to push the closing price to an
artificial level. End-of-day prices are used to determine the expiration value of derivative
instruments and directors’ options, price of seasoned equity issues, evaluate broker performance,
compute net asset values of mutual funds, and compute stock indices (Aitken et al., 2015).1
In theory, there are different perspectives on whether or not market manipulation should
enhance or mitigate innovation. On one hand, the presence of market manipulation is associated
short-termism of the firm’s orientation which is inconsistent with a long-term managerial focus on
innovation. Also, market manipulation imposes long-term harm to a firm’s equity values, and
commensurate reduced incentives for employees to innovate. Ferreira et al. (2014) find that public
firms have fewer incentives to explore radical new innovations because the rapid incorporation of
good news into market prices creates incentives for short-termist behavior. Market manipulation
may be yet another reason for why public firms innovate less and have more incentives for short-
termist behavior. On the other hand, manipulation may enhance the gains to insiders from
innovation, which would in turn increase the incentives for managers to innovate. In net, therefore,
predictions on a link between market manipulation and innovation are ambiguous in theory, and
one must therefore look to data to ascertain the validity of a connection between manipulation and
innovation.
In this paper, we empirically study the link between market manipulation and innovation
by assembling a sample of 131,129 firm-year observations across 9 countries (Australia, Canada,
1 See also Aggarwal and Wu (2006), Allen and Gale, (1992), Allen and Gorton (1992), Merrick et al. (2005), O'Hara (2001), O’Hara and Mendiola (2003), Peng and Röell (2009), Pirrong (1999, 2004), and Röell (1993).

China, India, Japan, New Zealand, Singapore, Sweden, and the United States) spanning the years
2003-2010. It is widely regarded that insider trading is hard to prove as trading before information
announcements may be attributable to market anticipation. Similarly, end-of-day dislocation may
not always be attributable to manipulation and instead arise through unusual volatility and end-of-
day market activity. Our empirical measures of insider trading and end-of-day manipulation are
based on surveillance data of suspected insider trading and suspected end-of-day dislocation
derived from alerts (computer algorithms that send messages to surveillance authorities). The
advantages of these measures are that they avoid delays in enforcement, and that they are uniform
without bias from differences in enforcement across firms and countries and over time. Also,
suspected problems with a firm can be equally harmful to a firm as litigated problems in respect
of focusing management on short-termism, hurting equity values, and diverting attention away
from innovative activities.
The data examined in this paper indicate that end-of-day dislocation mitigates patents, and
we argue that this evidence is consistent with the notion that manipulation is associated with short-
termism of the firm’s orientation, long-term harm to a firm’s equity values, and commensurate
reduced incentives for employees to innovate. The economic significance of this effect is greater
when dislocation occurs on days when dislocation is more likely to be attributable to manipulation
such as end of month, quarter and year. The data indicate that end-of-day dislocation has a
pronounced negative impact on patenting, even after controlling for other market efficiency
variables such as liquidity, among other things. The economic significance is such that the
presence of end-of-day dislocation mitigates subsequent year’s patenting by 7.3%. Estimated

differently, a 1-standard deviation increase in the number of dislocation events in one year is
associated with a 1.9% reduction in patenting in the subsequent year.
In contrast to the negative impact of dislocation on patents, information leakage has no
effect on lower quality patents, but does have a positive impact on higher quality patents. The
intuition behind this result is that insiders make use of superior information to profit from
innovation. It is very similar in spirit to evidence from Agrawal and Cooper (2015) and Atanasov
et al. (2015) who show that insider trading around the times of scandals and market manipulation
is common and used to enhance profits to insiders. In particular, we find that the economic
significance is such that the presence information leakage cases increases subsequent year’s patent
citations by 5.1%. Estimated differently, a 1-standard deviation increase in the number of number
of information leakage cases in one year is associated with a 1.65 % increase in patent citations in
the subsequent year. Interestingly, the strong positive association between insider trading and
patents is only observed in non-crisis times and for higher quality patents. The intuition is as
follows. At any time there is the negative impact of misconduct on innovation due to short termism
and poor managerial focus. For information leakage, however, there is a counter force of profiting
more if you are an insider. In bad economic times, the ability to illegally profit as an insider is
reduced and the risk of being caught is greater because regulators are especially diligent in crisis
periods. Overall, the effect of short-termism associated with information leakage is stronger than
the latter effect of expected profits during crisis periods.
The link between market manipulation and patenting brings into focus related literatures -
market microstructure, financial misconduct and regulation, and innovation. To this end, there are

two papers that are most closely related to ours. First, Levine et al. (2015) examine whether or not
insider trading enforcement affects subsequent innovation, and find a strong positive link based on
a sample of 94 countries from 1976 to 2006. Second, Fang et al. (2014) show that there is a
negative relationship between liquidity and innovation due to increased exposure to hostile
takeovers and a higher presence of institutional investors who do not actively gather information
or monitor. Fan et al.’s evidence is taken from a sample of U.S. firms over the years 1994-2005.
Our analyses are distinct from these papers in a number of ways. First, in the Levine et al.
paper the sample covers a period where there is variation in whether or not insider trading laws
were enforced, and the enforcement of insider trading laws is the central variable of interest. By
contrast, in our more recent sample there is no variation in whether or not inside trading laws were
enforced, but there is variation in enforcement pertaining to a broader set of ways in which stocks
may be manipulated. We find such variation to have a positive effect on manipulation, consistent
with Levine et al.
Second, we examine whether or not there were actual events of apparent manipulation
based on alerts (computer algorithms) examining historical microstructure data. To this end, our
paper is distinct from the Fang et al. study which relates liquidity to innovation, that work does not
examine whether or not a stock was manipulated, such as through insider trading or end-of-day
manipulation. Surprisingly, unlike Fang et al. literature that shows a negative relation between
patenting and liquidity, we observe a robust and significantly positive effect of liquidity on
patenting, including in the U.S. subsample and applying the same patent data source as in prior
papers but for more recent years. This new finding suggests that the relation between liquidity and

patenting is not stable over time. Our data indicate that the positive effect of liquidity on
innovation, however, is mitigated by the presence of end-of-day dislocation, which implies that
more nuanced market microstructure relationships explain innovation than previously
documented.
The data examined herein also confirm the importance of country-level factors such as
intellectual property rights across countries that encourage patenting, and firm specific variables
like age and capital expenditures affect innovation. Our findings are robust to numerous
robustness checks such as including/excluding the U.S. and the financial crisis years, patent
applications versus patent grants, different liquidity deciles, propensity score matching analyses,
difference-in-differences tests for firms with and without dislocation, among other things.
Our evidence has a number of important policy implications. Manipulation is common in
society, and there are significant expenditures across countries to detect securities fraud (Jackson
and Roe, 2009). Our evidence suggests that there are significant externalities to manipulation,
including a marked reduction in innovation. In view of these externalities, our findings imply that
expenditures on the enforcement of securities regulations around the world may be more important
than previously considered.
This paper is organized as follows. Section 2 presents the data. Section 3 provides
univariate tests of the relation between market manipulation and patents. Multivariate analyses
are presented in section 4. Limitations and extensions are discussed in section 5. The last section

offers concluding remarks. Additional robustness tests are provided in the Appendices as well as
an accompanying Online Appendix.
2. Data and variable construction
2.1 Sample selection and data sources
The study covers 11 stock exchanges from nine countries during the period 2003 to 2010.
The sample comprises Australia (Australian stock exchange), Canada (TSX Ventures), China
(Shanghai stock exchange), India (Bombay stock exchange and National Stock exchange of India),
Japan (Tokyo stock exchange), New Zealand (New Zealand stock exchange), Singapore
(Singapore stock exchange), Sweden (Stockholm stock exchange) and United States (NASDAQ
and NYSE).
Patent data is obtained from the EPO’s Worldwide Patent Statistical Database (PATSTAT)
which includes patent data on 90 million patent documents from over 100 patent offices around
the world. The PATSTAT database is published biannually and we use the 2014 Autumn edition.
The database provides information on first publication and grant date, citation links, technological
classifications, applicant and inventor identification for each patent application. The patent data is
augmented using the ECOOM-EUROSTAT-EPO PATSTAT Person Augmented Table (EEE-
PPAT) that provides sector codes and harmonized company names for each of the patent
applications (Plessis et al., 2009; Magerman et al., 2009; Peeters et al., 2009). The manipulation
data is obtained from SMARTS Group Inc, and Capital Markets Cooperative Research Centre

(CMCRC). The SMARTS Group Inc, provides market surveillance products to over 40 stock
exchanges around the world. Firm level data is obtained from Datastream.
Table 1 provides the definition and source of variables used in the study.
[TABLE I ABOUT HERE]
2.2 Measuring innovation
Two measures of patenting activity are used in the study – the number of patent
applications made by a firm in a year and the number of citations received by these patents. The
number of patent applications is a measure of the quantity or productivity of innovation while the
number of citations received is a measure of the relative importance or quality of innovation.
We use the logarithm of one plus the number of patent applications in the year t+1,
INNOV_PAT(t+1), as the main dependent variable in the study. We use the logarithm of number
of patents because the patent data are right skewed with the 75th percentile of the number of patents
equal to zero. We add one to the number of patents before taking the logarithm to ensure that we
don’t have missing values for firms with 0 patents. The application date of patents is used instead
of grant date because the application date is closer to the actual date of innovation.
The second measure of innovation, INNOV_CITE(t+1), is the natural logarithm of one
plus the number of citations received for patents filed in the year t+1. The number of citations

received has been adjusted for truncation bias based on the methodology developed by Hall et al.
(2001, 2005). We implemented the following procedure to adjust for the truncation bias in
citations: (1) For each cohort of patents applied for between 1991 and 2002, we obtain the citation
lag of the patents using 12 years of actual citation data. To illustrate, for patents applied in 1991
(Cohort 1), we measure the number of citations received in each year from 1991 (citation lag of 0)
to 2002 (citation lag of 11). Similarly, for patents applied in 2002 (Cohort 12), we measure the
number of citations received in each year from 2002 (citation lag of 0) to 2013 (citation lag of 11).
(2) Then, for each major IPC technology classification of patents, k, in each of the Cohorts, we
obtain the citation lag distribution, W, as the proportion of citations received with lags of 0 to 11
years to the total number of citations received. Subsequently, we compute the cumulative share of
citations received with lags of 0 to 11 within each technology classification of patents. We average
the cumulative share of citations across the 12 Cohorts. (3) Finally, for patent citations received
between 2003 and 2010, we divide the actual citations received by the average cumulative share
of citations using the formula:
∑
Where Wsk is the average share of citations received with lag s, within technology classification k.
As part of robustness checks, we also used two alternative measures for the number of
patent applications – the number of patents applied for and eventually granted
(INNOV_PAT_GRNT) as well as the number of patents applied for and eventually granted that
has been adjusted for truncation bias (INNOV_PAT_GRNT_ADJ). Using only patent applications
that have been eventually granted introduces truncation bias because there is a lag between patent
application and the grant date of the patent. We correct for this truncation bias by using the grant
lag distribution, based on the methodology of Hall, Jaffe, and Trajtenberg (2001, 2005). We
compute the grant lag distribution for patents filed and granted between 1991 and 2002. The
truncation adjusted patents is then computed using:
∑
Where Ws is the application-grant lag distribution computed as the percentage of patents applied
for in any year that has been granted in s year.
Using patents as measure of innovation has its disadvantages. By using the number of
patents we ignore differences between industries with regards to the intensity and duration of
patents. We control for this by including industry and firm level controls for patent data. Using
number of patent application also ignores how efficient the firms are at converting their innovative
inputs (R&D expenditures and intangible inputs) to innovative outputs.
2.3 Measuring manipulation
We use two measures of manipulation – End of day price dislocation (EOD) and
Information leakage (Infoleakage) alerts computed by the CMCRC and SMARTS surveillance
staff.
An EOD price alert is created by looking at the price change between the last trade price
(Pt) and last available trade price 15 minutes before the continuous trading period ends (Pt-15). For
securities exchanges that have closing auction, the close price at auction is used (Pauction). A price
movement is dislocated if it is four standard deviations away from the mean price change during
the past 100 trading days benchmarking period. To be considered as dislocation of EOD price case,
at least 50% of the price dislocation has to revert at open on the next trading day. Hence, the price
movement between the last trade price (Pt) and the next day opening price (Pt+1), and between last
trade price (Pt) and last available trade price 15 minutes before the continuous trading period ends
(Pt-15) has to be bigger than 50%. (Pauction or Pt - Pt+1)/(Pauction or Pt - Pt-15 ) ≥50%.
To measure the Infoleakage alert, CMCRC and SMARTS first examined all news releases
from the exchanges themselves. CMCRC and SMARTS measured the return to the security in the
six days prior to the announcement up to the two days after the announcement. They double
checked the Thompson Reuters News Network to ensure that they did not miss any important news
announcements. They consider only news events that have no companion news announcements
that could explain price movements in the six days before and the two days after the relevant
announcement that could explain the price movement. For each news announcement, a price
movement is abnormal if it is three standard deviations away from the mean abnormal return
during the 250-day benchmarking period ending at 10 days before the news release. To be included
in our sample, the stock must have at least 150 days’ trading activities. A one-factor market model
based on the market index for each exchange is used to calculate daily abnormal returns. To be
included in the final data set as a suspected information leakage case, the CAR around each event
over the period [t-6, t+2] must be three standard deviations away from the normal nine-day CAR
for each individual stock. Once the suspected information leakage case is defined, abnormal profit
per case is calculated as the trading-volume-multiple abnormal returns from six days before to the
day before the news announcement. SMARTS surveillance staff independently examined the data

to distinguish between market anticipation and suspected insider trading; since SMARTS includes
as insider trading only large movements that are three-standard-deviation changes, the possibility
that insider trades could be viewed as market anticipation is mitigated.
2.4 Measuring control variables
The main control variables used in the study are obtained from Datastream. The control
variables are measured at the end of the fiscal year t. We control for the profitability of the firm,
using the return on assets, ROA(t), measured as the income before extraordinary items divided by
book value of total assets; asset tangibility, PPETA(t), measured as the property, plant, and
equipment expenditure divided by book value of total assets; leverage, LEV(t), measured as book
value of debt divided by book value of total assets; investment in fixed assets, CAPEXTA(t),
measured as Capital expenditures scaled by book value of total assets; firm age,
LN_FIRM_AGE(t), measured as natural logarithm of one plus firm i’s age, approximated by the
number of years listed on Datastream. Liquidity of the firm, Liquidity(t), is computed as the natural
logarithm of the inverse of the AMIHUD measure of illiquidity. AMIHUD is computed as follows:
1 | |
Where Aiy is the AMIHUD measure of firm i in year y. Rit and Dvolit are daily return and daily
dollar trading volume for stock i on day t. Diy is the number of days with available ratio in year y.
A higher AMIHUD value indicates higher level of illiquidity. Hence, we use the logarithm of the
inverse of AMIHUD as the measure of liquidity.

The summary statistics of the main variables used in the study are provided in Table II.
[TABLE II ABOUT HERE]
3. Univariate Tests
Table III presents univariate comparison of means tests and shows the comparison of the
percentage change in patent applications [patent citations] for firms that experienced manipulation
versus those that have not experienced end-of-day dislocation or information leakage over the
period from t-1 to t+1, where t is the year in which there was manipulation. The non-manipulation
sample in Table III is any firm-year observation where the EOD dummy or where information
leakage dummy is equal to zero. Panel A shows the results for patent application. Panel B shows
the results for patent citations. We separate the tests into regimes with high versus low intellectual
property rights (where 5 is the cutoff, to account for very weak legal environments).
The data indicate that that prior to dislocation events, firms in low IPR environments that
have experienced dislocation have significantly less pronounced changes in patent applications
[patent citations] by -0.24%[0.57%] relative to those that have not experienced dislocation events
where the change was 4.57% [4.46%] and these differences are statistically significant at the 1%
level. These differences are not statistically significant for firms in high IPR environments.
[TABLE III ABOUT HERE]

Table III also presents the univariate comparison tests for firms that have and have not
experienced information leakage events. The data indicate that firms in low IPR environments
that have experienced information leakage have a greater percentage increase in patent
applications of 8.65% relative to those that have not at 2.99% , and these differences are significant
at the 1% level; however, there is not a significant difference in patent citations among these firms
in low IPR environments. Firms in high IPR environments that have experienced information
leakage have a greater percentage increase in patent applications [patent citations] of 4.25%
[21.89%] relative to those that have not at 0.43% [6.18%], and these differences are significant at
the 1% level.
Overall, the univariate tests are consistent with the view that the impact of dislocation on
patents is strongly negative and statistically significant, particularly in low IPR regimes. However,
the impact of information leakage on patents is strongly positive and significant, and this effect is
significant in both low and high IPR regimes. These effects are depicted graphically in Figures I,
I.A and II.B.
[FIGURES I AND II ABOUT HERE]
4. Multivariate tests
4.1. Base Model Specifications

Tables IV and V present the baseline regression estimates with pooled OLS and random
effects, respectively.2 Table V differs from Table IV in that the use of random effects enables the
inclusion of country level institutional indices that do not vary over time. The results from the
three regression models in Table IV and five regression models in Table V are quite consistent and
not sensitive to the inclusions of different sets of right-hand-side variables.
[TABLES IV AND V ABOUT HERE]
Tables IV and V indicate that the end-of-day dummy variable for the first year in which
there was dislocation is statistically insignificant in all of the specifications, but the end-of-day
subsequent dummy variable is negative and significant at least at the 5% level of significance in
all of the specifications. The economic significance is such that firms that have experienced end-
of-day dislocation have lower patents by 3.5% in the most conservative estimate (Table V – Panel
A, Model 3), and by 7.7% in the least conservative estimate (Table V – Panel A, Model 4).
Similarly, following end-of-day dislocation firms lower their citations by 15.4% in the most
conservative estimate (Table V – Panel B, Model 5) and by 25.1% in the least conservative
estimate (Table V – Panel B, Model 1). As an alternative specification in which we use a count of
the number of dislocation cases (Table IV Model 2 and Table V Model 2), we see that a 1-standard
deviation increase in the number of dislocation cases is associated with a 1.5% reduction in the
number of patents in the most conservative estimate (Table IV – Panel A, Model 2) and a 1.9%
reduction in the number of patents in the least conservative estimate (Table V – Panel A, Model
2 In addition to the Pooled OLS and Random Effects model, we used a Poisson model with the number of patent applications and the number of patent citations as the main dependent variable. We find similar results using either firm fixed effects or industry fixed effects Poisson models.

2). Similarly, a 1-standard deviation increase in the number of dislocation cases is associated with
a 5.9% reduction (Table IV - Panel B, Model 2) in the number of citations in the least conservative
estimate and a 6.4% reduction in the number of citations in the least conservative estimate (Table
V – Panel B, Model 2)
A 1-standard deviation increase in liquidity is associated with a 46% increase in number of
patents and a 78.6% increase in the number of citations in the subsequent period (Table V Model
1, and the other Models 2-5 are very similar). This finding is in contrast to the Fang et al. (2014)
results in the U.S., but that study was based on a U.S. only sample from an earlier time period
1994-2005, while our sample is based on 9 countries over 2003-2010. In Appendix A, we study
the U.S. only sample with 2003-2005 and the same data as Feng et al. (2014), and find results
consistent with Tables IV and V with a positive effect of liquidity on innovation. Also, these
results indicate that the relation between liquidity and patenting is perhaps not completely stable
over time. Also, Fang at al. do not examine whether or not a stock was manipulated, such as
through insider trading or end-of-day manipulation. Appendix B performs further robustness tests
of the relation between liquidity and innovation with propensity score matched analyses, and
shows a consistent and positive effect of liquidity on innovation for 3 out of four tests: nearest-
neighbor matching for the change in number of patents, four nearest-neighbor matching for the
change in the number of patents, and four nearest-neighbor matching for the change in the natural
log of number of patents; the nearest neighbor matching for the change in the number of patents
without logs shows a positive but statistically insignificant effect of liquidity on patents.

Further, note Table V – Panel A (Panel B) Model 5 shows that the interaction between
liquidity and end-of-day dislocation is statistically significant at the 1% level, and the positive
association between liquidity and number of patents (number of citations) is less pronounced by
8.7% (26.4%) for firms that have experienced end-of-day dislocation. These new findings in
Tables IV and V indicate that the positive effect of liquidity on innovation is mitigated by the
presence of end-of-day dislocation. Overall, the data indicate that the relation between liquidity
and innovation may be more nuanced by other market microstructure factors, and the changes in
microstructure factors over time could account for at least part of the changes in the relation
between liquidity and innovation over time.
Some of the other control variables in Tables IV and V are significant in ways that we
might expect. Most notably, a 1-standard deviation increase in the IPR index is associated with a
47.8% increase in number of patents (Table V – Panel A, Models 4 and 5 and a 66% increase in
the number of citations in the subsequent period (Table V – Panel B, Models 4 and 5), which is
consistent with a large literature documenting the importance of IPR in spurring innovation (e.g.,
Branstetter et al., 2006; Blind, 2012). As a related matter at the country level, a 1-standard
deviation increase in the Enforcement Index (La Porta et al., 1998) is associated with a 56.1%
increase in the number of patents (Table V – Panel A, Model 3) and a 50.5% increase in the number
of citations in the subsequent period (Table V – Panel B, Model 3).
Some of the firm-specific control variables are statistically significant as well. The data
indicate that a 1-standard deviation increase in ROA is associated with a 2.3% decrease in number
of patent in the subsequent period (Table V Model 1, and Models 2-5 are similar). A 1-standard
deviation increase in leverage is associated with a 2.2% increase in number of patents in the
subsequent period (Table V Model 4, but this effect is insignificant in the Models 1 and 2). A 1-
standard deviation increase in capital expenditures over assets is associated with a 2.1% decrease
in number of patents in the subsequent period (Table V Model 1, and Models 2-5 are similar). A
1-standard deviation increase in market/book is associated with a 2.5% decrease in number of
patents in the subsequent period (Table V Model 1, and Models 2-5 are similar). And finally, a 1-
standard deviation increase in natural logarithm of the Firm age is associated with a 47.5% increase
in number of patents in the subsequent period (Table V Model 1, and Models 2-5 are similar).
4.2. Robustness Checks
The remaining regressions tables and appendices present further robustness checks to
account for other subsamples of the data, measurement issues, endogeneity, and regression model
specifications, which are as follows. To maintain conciseness, we present only the results
considering the number of patents, INNOV_PAT, as the main dependent variable. In Table VI
Panel A, Model (1) shows the results with the non-US subsample, and the data and results are
consistent with the full sample results reported in Table IV and Table V, with the economic
significance of EOD manipulation slightly more pronounced. Model (2) excludes the global
financial crisis period August 2007 to December 2008, and the findings are consistent. Model (3)
includes the global financial crisis period only, and the impact of EOD manipulation on patents is
stronger (almost twice as large as the non-financial crisis period). Models (4), (5), and (6) show a
negative effect of EOD manipulation on patents for the subset of applied and granted patents,
including adjustments for truncation bias, and winsorizing, respectively.

The information leakage variable for suspected insider trading is negative and statistically
significant in Table VI Model (3) for the crisis years only, consistent with Levine et al. (2015) that
insider trading is a detriment to innovation. But these results are not stable for information leakage
in Models (4) and (5) in Table VI Panel A, which shows a positive and significant effect for applied
and granted patents, and applied and granted patents adjusted for truncation bias. These results
imply that insiders have a pronounced incentive to encourage innovation if they can engage in
insider trading and reap exacerbated benefits from such innovation. In particular, we find that the
economic significance is such that the presence of information leakage increases subsequent year’s
patent citations by 5.1% (Table 5 Panel B Model 2) to 6.4% (Table 5 Panel B Model 1). Also, the
economic significance is such that the presence of leakage cases increases subsequent year’s patent
citations by 5.1%. Estimated differently, a 1-standard deviation increase in the number of number
of information leakage cases in one year is associated with a 1.65 % increase in patent citations in
the subsequent year (Table 5 Panel B Model 2). This effect is slightly different in magnitude in
Table 6 Panel B for patents that have been applied for and granted and adjusted for truncation bias:
the presence of information leakage increases subsequent year’s patents by 5.16% (Model 1) to
5.19% (Model 2). Table 6 Panel B Model 3 shows that the economic significance is such that the
presence of information leakage increases subsequent year’s patents applied for and granted by
6.51%.
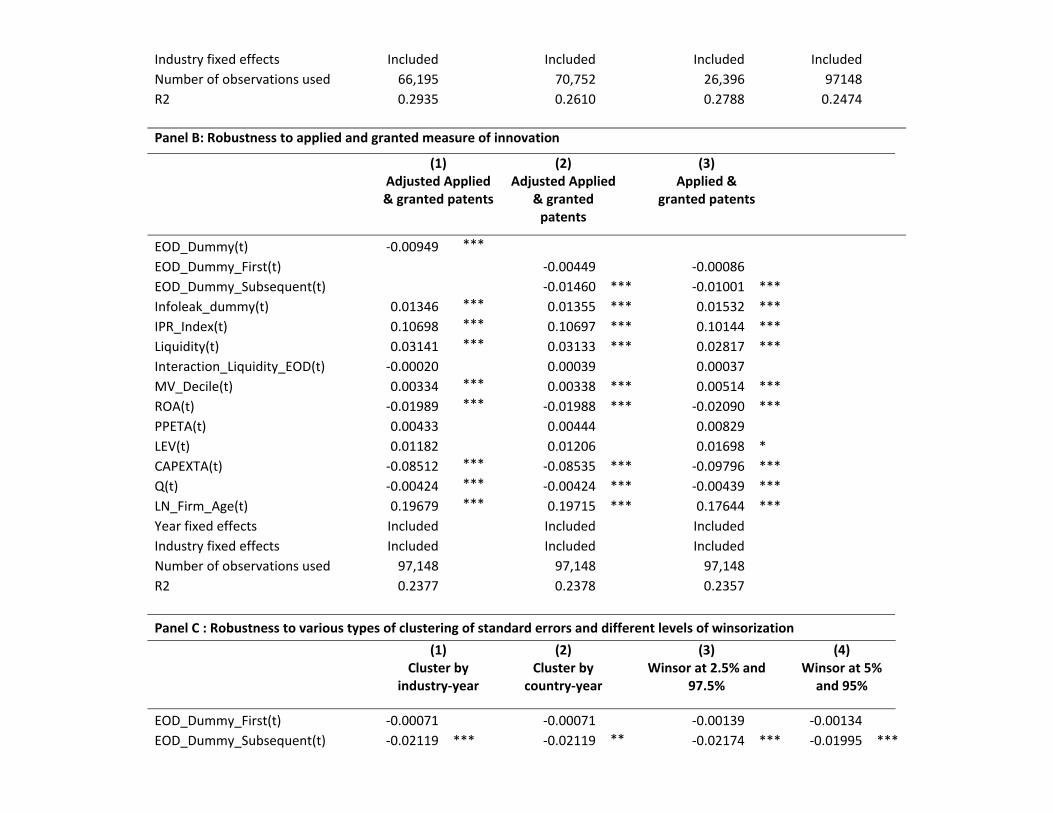
Table VI Panel B shows stability of the negative effect of EOD manipulation on patenting
for different types of clustering (Petersen, 2009) by industry-year and country-year in Models (1)
and (2), respectively. Models (3) and (4) show similar stability of this main result with different
winsorizing at 2.5%/97.5%, and 5%/95%, respectively.
The other control variables in Table VI Panels A and B are statistically significant in ways
that are consistent with the Tables IV and V results. Liquidity and the intellectual property rights
index are positively and significantly related to liquidity at the 1% level in all of Models (1) – (6).
Likewise, the other firm-specific variables are consistent with the findings reported earlier.
[TABLE VI ABOUT HERE]
Table VII shows the results for different liquidity deciles. The data indicate that EOD
manipulation has a strong statistically significant negative effect on innovation in Models (1) and
(2) for the top 10th and 20th liquidity deciles, but not the bottom 80th and 90th deciles in Models (3)
and (4), respectively. The other control variables, including liquidity, are significant in ways
indicated above for Models (1) and (2). But in Models (3) and (4) the other control variables are
largely insignificant, except for the IPR index and Liquidity in Model (3).
Unlike EOD manipulation, information leakage has a statistically insignificant negative
effect on innovation in Models (1) and (2) for the top 10th and 20th liquidity deciles, and a strong
and statistically significant effect on innovation for the bottom 80th and 90th deciles, respectively.
In short, for the most liquid stocks, EOD manipulation is harmful to innovation, while
liquidity helps promote innovation. For the least liquid stocks, by contrast, insider trading has a
pronounced negative effect on innovation, and this effect is the only relevant factor for the bottom
liquidity decile.
[TABLE VII ABOUT HERE]
Table VIII shows the results for the days on which EOD dislocation is more likely to be
association with manipulation – namely the end of the month days, where manipulators have a
pronounced incentive to push up the price for reasons of compensation and option expiration. The
data indicate that the effect of EOD manipulation is stronger when end-of-month days are
considered. Also, the data shows that the impact of EOD manipulation is statistically significant
regardless of whether or not the other manipulation days are included in or excluded from the
sample.
[TABLE VIII ABOUT HERE]
Table IX reports a 2SLS test of the impact of EOD manipulation and information leakage
on innovation. The instrument used is the lagged patents in the industry, with the intuition that
some industries may be subjected to different levels of manipulation. We show that the first stage
results for the determinants of manipulation are sensitive to the inclusion/exclusion of the liquidity
variable: lagged industry patents and liquidity are positively correlated. However, the statistical
and economic significance of the second stage results for the effect of EOD patents are not
materially affected by the specification of the first stage model. The economic significance in the
second stage estimate for EOD manipulation on patents is stronger than before, with a 1-standard
deviation change in predicted EOD manipulation reducing future patenting by 37.9%. As before,
with the 2SLS results there is no significant effect of information leakage on patents.
[TABLE IX ABOUT HERE]
Table X reports the results with propensity score matching. The data show a consistent
and negative effect of EOD manipulation on innovation for 4 out of four tests in Models (1) and
(2): nearest-neighbor matching for the change in number of patents (with and without logs), and
four nearest-neighbor matching for the change in the number of patents (with and without logs).
For the information leakage results in Table X, the effect is insignificant for the change in the
number of patents in Model (3), but negative and significant for the change in the natural log of
the number of patents in Model (4).
[TABLE X ABOUT HERE]
5. Limitations and Extensions
This paper focused on two types of manipulation: EOD manipulation and information
leakage / suspected insider trading. There are many other types of manipulations, such as wash
trades, option backdating, accounting fraud, among others (see Cumming et al., 2015, for a
survey). We are unable to ascertain these different types of manipulation in this sample for each
of the countries and years in the data. Future research with different data could shed more light
on this question of whether other types of manipulation have a stronger impact on manipulation.

This paper focused on 9 countries (Australia, Canada, China, India, Japan, New Zealand,
Singapore, Sweden, and the United States) over 2003-2010. We showed the sensitivity of prior
results on liquidity and innovation depends on the time period chosen. While we showed the
robustness of our results to different subsets of the data by country and time period, future research
may very well uncover new insights with different and more expansive data.
6. Conclusion
This paper studied the impact of suspected market manipulation, including end-of-day
manipulation and insider trading around information leakage events, on the number of patents and
the number of citations, based on a sample of 9 countries spanning the years 2003-2010. The data
indicate that end-of-day dislocation mitigates number of patents and the number of citations
received by patents due to the associated short-termism of the firm’s orientation, long-term harm
to a firm’s equity values, and commensurate reduced incentives for employees to innovate. Our
findings are robust to numerous robustness checks on subsamples of the data, propensity score
matching analyses, difference-in-differences tests for firms with and without dislocation, among
other things.
Unlike prior literature that shows a negative relation between patenting and liquidity, we
observe a robust and significantly positive effect of liquidity on patenting. The positive effect of
liquidity on innovation, however, is mitigated by the presence of end-of-day dislocation. The data
also confirm the importance of country-level factors such as intellectual property rights across
countries that encourage patenting.
Finally, unlike the negative effects of end-of-day manipulation on patents, we find an
opposite positive effect of information leakage on patents for higher quality patents, and
particularly in non-crisis periods. Insiders have in some cases pronounced incentives to engage in
insider trading associated with announcement of innovations. Future research could examine
specific cases in more detail, among other extensions related to those that we discussed in this
paper.
References Agrawal, A., Cooper, T., 2015. Insider trading before accounting scandals. Journal of Corporate Finance, Aggarwal, R.K., Wu, G., 2006. Stock market manipulations. Journal of Business 79, 1915-1953. Allen, F., Gale, D., 1992. Stock-price manipulation. Review of Financial Studies 5, 503-529. Allen, F., Gorton, G., 1992. Stock price manipulation, market microstructure and asymmetric information. European Economic Review 36, 624-630. Aharony, J., Liu, C., Yawson, A., 2015. Corporate litigation and executive turnover, Journal of Corporate Finance, this issue. Aitken, M., D.J. Cumming, D.J., and F. Zhan, 2015. “Exchange Trading Rules, Surveillance, and Suspected Insider Trading” Journal of Corporate Finance, 34, 311-330. Aitken, M., Cumming, D.J., and F. Zhan, 2015. “High Frequency Trading and End-of-Day Price Dislocation” Journal of Banking and Finance, 59, 330-349. Allen, F., Gale, D., 1992. Stock-price manipulation. Review of Financial Studies 5, 503-529. Allen, F., Gorton, G., 1992. Stock price manipulation, market microstructure and asymmetric information. European Economic Review 36, 624-630.

Atanasov, V., Davies, R. J., and Merrick Jr., J. J., 2015. Financial Intermediaries in the Midst of Market Manipulation: Did they protect the fool or help the Knave? Journal of Corporate Finance, Bebchuk, L.A., and C. Fershtman, 1994. Insider Trading and the Managerial Choice among Risky Projects, Journal of Financial and Quantitative Analysis 29, 1-14. Bernile, G., Sulaeman, J., and Wang, Q., 2015. Institutional trading during a wave of corporate scnadals: ‘Perfect Payday’? Journal of Corporate Finance, Bereskin, F., Campbell II, T., Kedia, S., 2014. Philanthropy, corporate culture, and misconduct, Working Paper, University of Delaware. Blind, K. 2012. The influence of regulations on innovation: A quantitative assessment for OECD countries, Research Policy, 41(2): 391-400. Bollen, N.P.B., and V. K. Pool, 2009. Do hedge fund managers misreport returns? Evidence from the pooled distribution, Journal of Finance, 64, 2257-2288. Branstetter, L.G., Fisman, R., & Foley, C. F. 2006. Do stronger intellectual property rights increase international technology transfer? Empirical evidence from US firm-level panel data, Quarterly Journal of Economics, 121(1): 321-349 Cumming, D.J., B. Dannhauser, and S. Johan, 2015. “Financial Market Misconduct and Agency Conflicts: A Synthesis and Future Directions” Journal of Corporate Finance, 34, 150-168 Cumming, D.J., S.A. Johan, and D. Li, 2011. “Exchange Trading Rules and Stock Market Liquidity” Journal of Financial Economics 99(3), 651-671. Du Plessis, M., Van Looy, B., Song, X & Magerman, T., 2009. “Data Production Methods for Harmonized Patent Indicators: Assignee sector allocation” EUROSTAT Working Paper and Studies, Luxembourg. Dyck, A., Morse, A., Zingales, L., 2010. Who blows the whistle on corporate fraud? Journal of Finance 65, 2063-2253. Dyck, A., Morse, A., Zingales, L., 2014. How pervasive is corporate fraud? Working Paper, University of Chicago. Fang, V.W., Tian, X., Tice, S., 2014. Does Stock Liquidity Enhance or Impede Firm Innovation? The Journal of Finance 69, 2085-2125. Ferreira, D., Manso, G., Silva, A., 2014. Incentives to innovate and the decision to go public or private. Review of Financial Studies 27, 256–300. Giannetti, M., Wang, T.Y., 2014. Corporate scandals and household stock market participation, Working Paper, Stockholm School of Economics and University of Minnesota.

Hall, B.H., Jaffe, A.B., Trajtenberg, M., 2001. The NBER Patent Citation Data File: Lessons, Insights and Methodological Tools. National Bureau of Economic Research. Hall, B.H., Jaffe, A.B., Trajtenberg, M., 2005. Market Value and Patent Citations. RAND Journal of economics, 16-38. Jackson, H.E., Roe, M.J., 2009. Public and private enforcement of securities laws: resource-based evidence. Journal of Financial Economics 93, 207-238. Jarrow, R.A., 1994. Derivative security markets, market manipulation and option pricing theory. Journal of Financial and Quantitative Analysis 29, 241-261. Karpoff, J., Koester, A., Lee, D.S., Martin, G.S., 2012. A critical analysis of databases used in financial misconduct research. Mays Business School Research Paper No. 2012-73. Karpoff, J., Lee, D.S., Martin, G.S., 2008a. The consequences to managers for cooking the books. Journal of Financial Economics 88, 193-215. Karpoff, J.M., Lee, D.S., Martin, G.S., 2008b. The consequences to managers for financial misrepresentation. Journal of Financial Economics 85, 66-101. Karpoff, J.M., Lou, X., 2010. Short sellers and financial misconduct. Journal of Finance 65, 1879-1913. La Porta, R., Lopez-de-Silanes, F., Shleifer, A., 2006. What works in securities laws? Journal of Finance 61, 1-32. La Porta, R., Lopez-de-Silanes, F., Shleifer, A., Vishny, R., 1997. Legal determinants of external finance. Journal of Finance 52, 1131–1150. La Porta, R., Lopez-de-Silanes, F., Shleifer, A., Vishny, R., 1998. Law and finance. Journal of Political Economy 106, 1113–1155. La Porta, R., Lopez-de-Silanes, F., Shleifer, A., Vishny, R., 2002. Investor protection and corporate valuation. Journal of Finance 57, 1147–1170. Levine, R., C. Lin, and L. Wei, 2015. “Insider Trading and Innovation,” Working Paper, University of California, Berkeley. Magerman T, Grouwels J., Song X. & Van Looy B., 2009. “Data Production Methods for Harmonized Patent Indicators: Patentee Name Harmonization” EUROSTAT Working Paper and Studies, Luxembourg. Merrick, J.J. Jr., Naik, N.Y., Yadav P.K., 2005. Strategic trading behavior and price distortion in a manipulated market: anatomy of a squeeze. Journal of Financial Economics 77, 171-218.

Meulbroek, L.K., 1992. An empirical analysis of illegal insider trading, Journal of Finance 47, 1661-1699. Ni, S.X., Pearson, N.D., Poteshman, A.M., 2005. Stock price clustering on option expiration dates. Journal of Financial Economics 78, 49-87. O’Hara, M., 2001. Overview: market structure issues in market liquidity, in Market Liquidity: Proceedings of a Workshop Held at the BIS, BIS Papers, No. 2, April, Basel, 1-8. O'Hara, M., Mendiola, A.M., 2003. Taking stock in stock markets: the changing governance of exchanges. Unpublished working paper. Cornell University, NY. Peng, L., and Röell, A., 2009. Managerial incentives and stock price manipulation, CEPR Discussion Paper No. DP7442. Peeters B., Song X., Callaert J., Grouwels J., Van Looy B., 2009. “Harmonizing harmonized patentee names: an exploratory assessment of top patentees” EUROSTAT working paper and Studies, Luxembourg. Pirrong, S.C., 1993. Manipulation of the commodity futures market delivery process. Journal of Business 15, 335-370. Pirrong, S.C., 1995a. The self-regulation of commodity exchanges: the case of market manipulation. Journal of Law and Economics 38, 141-206. Pirrong, S.C., 1995b. Mixed manipulation strategies in commodity futures markets. Journal of Futures Markets 15, 13-38. Röell, A., 1992. “Comparing the performance of stock exchange trading systems,” In: J. Fingleton and D. Schoenmaker, (Eds.), The Internationalisation of Capital Markets and the Regulatory Response. Kluwer, Amsterdam. Vismara, S., Paleari, S., Signori, A., 2015. Changes in underwriters' selection of comparable firms pre- and post-IPO: same bank, same company, different peers. Journal of Corporate Finance, Wang, T., Winton, A., Yu, X. 2010. Corporate fraud and business conditions: Evidence from IPOs, Journal of Finance 65, 2255‐2292.

Table I Variable definitions
Variable Definition Data source
INNOV_PAT(t+1) Natural logarithm of one plus firm i’s total number of patents filed in year t+1.
PATSTAT
INNOV_CITE(t+1) Natural logarithm of one plus firm i’s total number of citations received for patents filed in year t+1. The number of citations has been adjusted for truncation bias using the citation lag distribution.
PATSTAT
INNOV_PAT_GRNT(t+1) Natural logarithm of one plus firm i’s total number of patents filed and eventually granted in the year t+1
PATSTAT
INNOV_PAT_GRNT_ADJ(t+1) Natural logarithm of one plus firm i’s total number of patents filed and eventually granted in the year t+1, which has been adjusted for truncation bias using the grant lag distribution.
PATSTAT
Average_industry-year_patents(t-1) The average INNOV_PAT(t-1) for an industry within each country, in the year t.
PATSTAT
CHANGE_NUM_PAT Change in number of patents computed as firm i’s total number of patents filed in the year t+1 minus firm i’s total number of patents filed in the year t-1
PATSTAT
CHANGE_LN_PAT Natural logarithm one plus firm i’s total number of patents filed in the year t+1 minus the natural logarithm of one plus firm i’s total number of patents filed in the year t-1.
PATSTAT
EOD_Dummy Indicates if a firm i has experienced end-of-day (EOD) dislocation in year t
CMCRC and SMARTS surveillance staff constructed the dislocation of EOD price case by looking at the price change between the last trade price (Pt) and last available trade price 15 minutes before the continuous trading period ends (Pt-15). For securities exchanges that have closing auction, the close price at auction is used (Pauction). A price movement is dislocated if it is four standard deviations away from the mean price change during the past 100 trading days benchmarking period. To be considered as dislocation of EOD price case, at least 50% of the price dislocation has to revert at open on the next trading day. Hence, the price
CMCRC

movement between the last trade price (Pt) and the next day opening price (Pt+1), and between last trade price (Pt) and last available trade price 15 minutes before the continuous trading period ends (Pt-15) has to be bigger than 50%. (Pauction or Pt - Pt+1)/( Pauction orPt - Pt-15 ) ≥50%. Source: Capital Markets Cooperative Research Centre (CMCRC) and SMARTS, Inc.
EOD_Dummy_First(t) Indicates if a firm i has experienced end-of-day (EOD) dislocation in year t, under the condition that firm i never previously experienced EOD dislocation until year t.
CMCRC
EOD_Dummy_Subsequent(t) Indicates if a firm i has experienced any EOD price dislocation in year t, under the condition that it was manipulated before year t.
CMCRC
Num_EOD_Cases_First(t) Number of times a firm has had EOD price dislocation in year t, under the condition that firm i was never previously experienced EOD price dislocation until year t.
CMCRC
Num_EOD_Cases_Subsequent(t) Number of times in year t firm has experienced EOD price dislocation, under the condition that it experienced EOD price dislocation before year t.
CMCRC
EOD_Dummy_Positive(t) Indicates if a firm i has experienced more positive EOD price dislocations than negative price dislocations in year t.
CMCRC
Infoleak_Dummy(t) Indicates if a firm i has experienced information leakage in year t.
CMCRC and SMARTS surveillance staff constructed this variable. CMCRC and SMARTS first examined all news releases from the exchanges themselves. CMCRC and SMARTS measured the return to the security in the six days prior to the announcement up to the two days after the announcement. They double checked the Thompson Reuters News Network to ensure that they did not miss any important news announcements. They consider only news events that have no companion news announcements that could explain price movements in the six days before and the two days after the relevant announcement that could explain the price movement. For each news announcement, a price movement is abnormal if it is three standard deviations away from the mean abnormal return during the 250-day benchmarking period ending at 10 days before the news release. To be included in our sample, the stock must have at least 150 days’
CMCRC

trading activities. A one-factor market model based on the market index for each exchange is used to calculate daily abnormal returns. To be included in the final data set as a suspected information leakage case, the CAR around each event over the period [t-6, t+2] must be three standard deviations away from the normal nine-day CAR for each individual stock. Once the suspected information leakage case is defined, abnormal profit per case is calculated as the trading-volume-multiple abnormal returns from six days before to the day before the news announcement. SMARTS surveillance staff independently examined the data to distinguish between market anticipation and suspected insider trading; since SMARTS includes as insider trading only large movements that are three-standard-deviation changes, the possibility that insider trades could be viewed as market anticipation is mitigated.
Num_Infoleak_Cases(t) Number of times a firm has experienced information leakage in year t.
CMCRC
Strong(Weak)_EOD_First(t) Indicates if a firm i has experienced any EOD price dislocation in year t during the days more likely to experience manipulation (except on days more likely to experience manipulation), under the condition that firm i never previously experienced EOD dislocation until year t. Manipulation is considered more common during the last three trading days of a month.
CMCRC
Strong(Weak)_EOD_Subsequent(t) Indicates if a firm i has experienced any EOD price dislocation in year t during the days more likely to experience manipulation (except on days more likely to experience manipulation), under the condition that it was manipulated before year t. Manipulation is considered more common during the last three trading days of a month.
CMCRC
Strong(Weak)_Infoleak_First(t) Indicates if a firm i has experienced any information leakage in year t during the days more likely to experience manipulation (except on days more likely to experience manipulation), under the condition firm i never previously experienced information leakage until year t. Manipulation is considered more common during the last three trading days of a month.
CMCRC
Strong(Weak)_Infoleak_Subsequent(t) Indicates if a firm i has experienced any information leakage in year t during the days more likely to experience manipulation (except on days more
CMCRC

likely to experience manipulation), under the condition that it was manipulated before year t. Manipulation is considered more common during the last three trading days of a month.
Liquidity(t) Denotes the natural logarithm of the inverse of the AMIHUD illiquidity variable. The AMIHUD illiquidity variable is computed as:
1 | |
Where Aiy is the AMIHUD measure of firm i in year y. Rit and Dvolit are daily return and daily dollar trading volume for stock i on day t. Diy is the number od days with available ratio in year y. A higher AMIHUD value indicates higher level of illiquidity. Hence, the logarithm of the inverse of AMIHUD would be a measure of liquidity rather than illiquidity.
Datastream
MV_Decile(t) Market value decile variable takes the value of 1 to 10 based on the market value decile to which the firm i belongs, within each country-year grouping, at the end of year t.
Datastream
ROA(t) Return on assets defined as the Income before extraordinary items divided by book value of total assets, measured at the end of fiscal year t.
Datastream
RDTA(t) Research and development expenditures divided by book value of total assets measured at the end of fiscal year t, set to zero if missing.
Datastream
PPETA(t) Property, plant & equipment divided by book value of total assets measured at the end of fiscal year t
Datastream
LEV(t) Firm i’s leverage ratio, defined as book value of debt divided by book value of total assets measured at the end of fiscal year t.
Datastream
CAPEXTA(t) Capital expenditures scaled by book value of total assets measured at the end of fiscal year t.
Datastream
Q(t) Firm i’s market-to-book ratio during fiscal year t, calculated as the market value of equity plus book value of debt divided by book value of assets.
Datastream
LN_Firm_Age(t) Natural logarithm of one plus firm i’s age, approximated by the number of years listed on Datastream.
Datastream
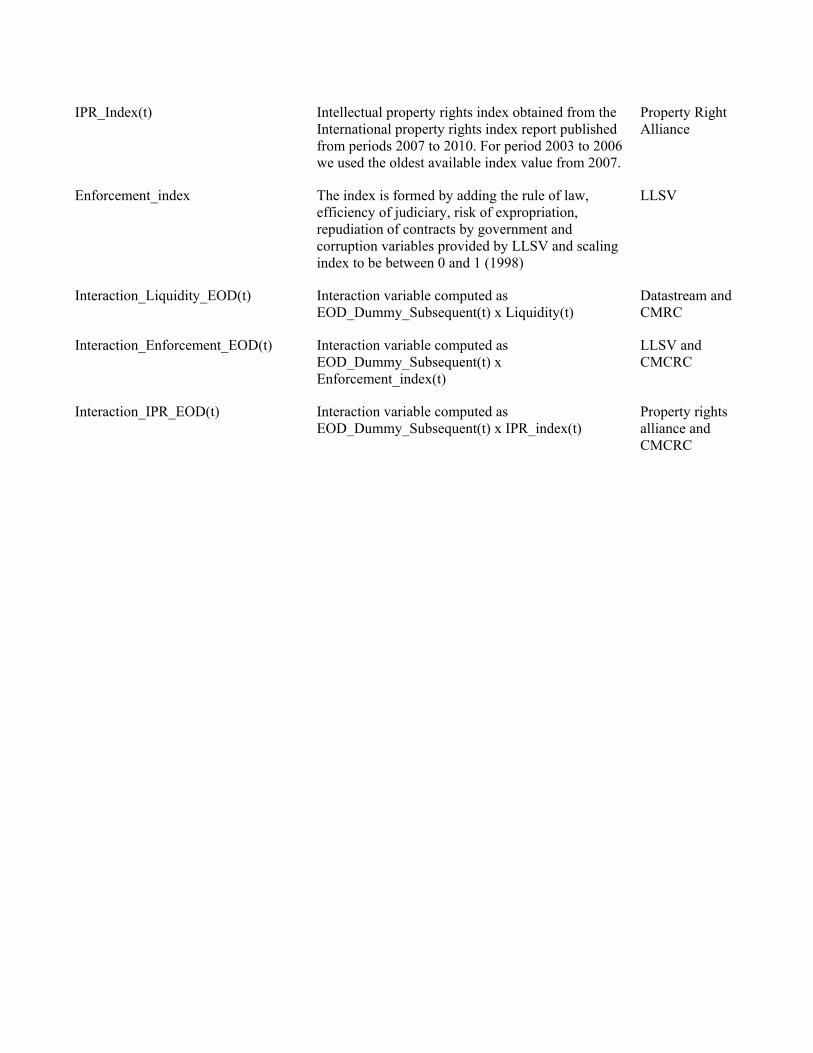
IPR_Index(t) Intellectual property rights index obtained from the International property rights index report published from periods 2007 to 2010. For period 2003 to 2006 we used the oldest available index value from 2007.
Property Right Alliance
Enforcement_index The index is formed by adding the rule of law, efficiency of judiciary, risk of expropriation, repudiation of contracts by government and corruption variables provided by LLSV and scaling index to be between 0 and 1 (1998)
LLSV
Interaction_Liquidity_EOD(t) Interaction variable computed as EOD_Dummy_Subsequent(t) x Liquidity(t)
Datastream and CMRC
Interaction_Enforcement_EOD(t) Interaction variable computed as EOD_Dummy_Subsequent(t) x Enforcement_index(t)
LLSV and CMCRC
Interaction_IPR_EOD(t) Interaction variable computed as EOD_Dummy_Subsequent(t) x IPR_index(t)
Property rights alliance and CMCRC
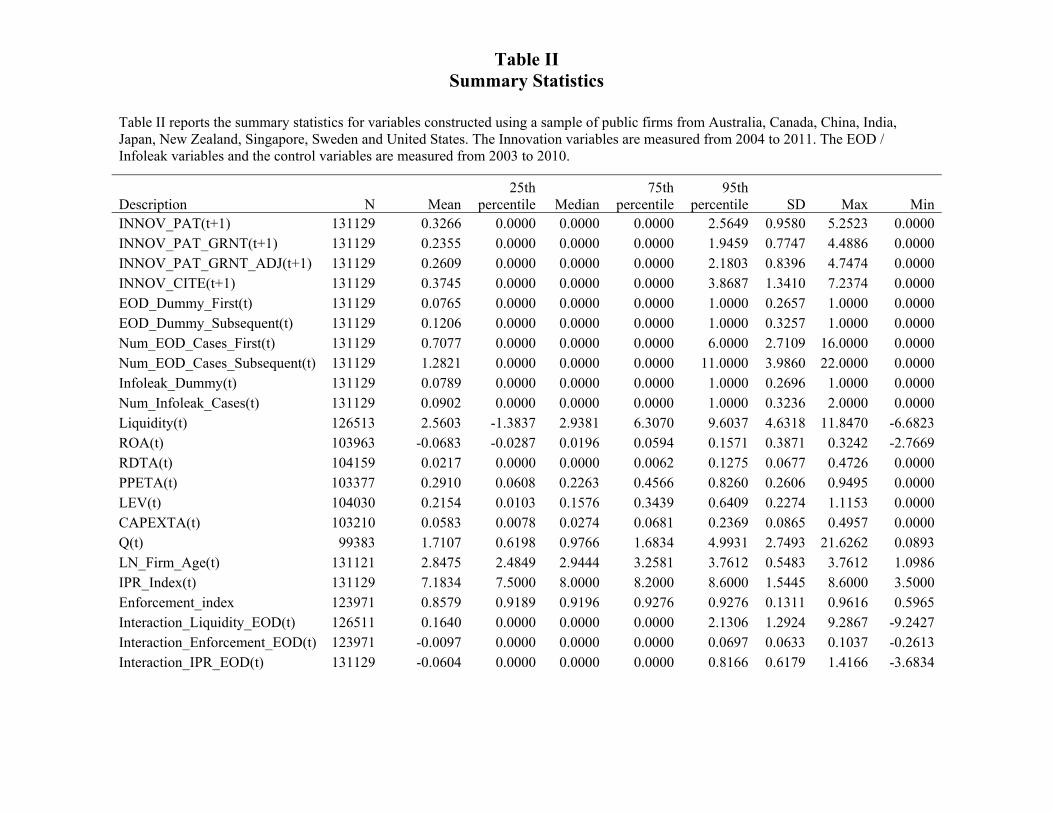
Table II Summary Statistics
Table II reports the summary statistics for variables constructed using a sample of public firms from Australia, Canada, China, India, Japan, New Zealand, Singapore, Sweden and United States. The Innovation variables are measured from 2004 to 2011. The EOD / Infoleak variables and the control variables are measured from 2003 to 2010.
Description N Mean 25th
percentile Median 75th
percentile 95th
percentile SD Max Min INNOV_PAT(t+1) 131129 0.3266 0.0000 0.0000 0.0000 2.5649 0.9580 5.2523 0.0000 INNOV_PAT_GRNT(t+1) 131129 0.2355 0.0000 0.0000 0.0000 1.9459 0.7747 4.4886 0.0000 INNOV_PAT_GRNT_ADJ(t+1) 131129 0.2609 0.0000 0.0000 0.0000 2.1803 0.8396 4.7474 0.0000 INNOV_CITE(t+1) 131129 0.3745 0.0000 0.0000 0.0000 3.8687 1.3410 7.2374 0.0000 EOD_Dummy_First(t) 131129 0.0765 0.0000 0.0000 0.0000 1.0000 0.2657 1.0000 0.0000 EOD_Dummy_Subsequent(t) 131129 0.1206 0.0000 0.0000 0.0000 1.0000 0.3257 1.0000 0.0000 Num_EOD_Cases_First(t) 131129 0.7077 0.0000 0.0000 0.0000 6.0000 2.7109 16.0000 0.0000 Num_EOD_Cases_Subsequent(t) 131129 1.2821 0.0000 0.0000 0.0000 11.0000 3.9860 22.0000 0.0000 Infoleak_Dummy(t) 131129 0.0789 0.0000 0.0000 0.0000 1.0000 0.2696 1.0000 0.0000 Num_Infoleak_Cases(t) 131129 0.0902 0.0000 0.0000 0.0000 1.0000 0.3236 2.0000 0.0000 Liquidity(t) 126513 2.5603 -1.3837 2.9381 6.3070 9.6037 4.6318 11.8470 -6.6823 ROA(t) 103963 -0.0683 -0.0287 0.0196 0.0594 0.1571 0.3871 0.3242 -2.7669 RDTA(t) 104159 0.0217 0.0000 0.0000 0.0062 0.1275 0.0677 0.4726 0.0000 PPETA(t) 103377 0.2910 0.0608 0.2263 0.4566 0.8260 0.2606 0.9495 0.0000 LEV(t) 104030 0.2154 0.0103 0.1576 0.3439 0.6409 0.2274 1.1153 0.0000 CAPEXTA(t) 103210 0.0583 0.0078 0.0274 0.0681 0.2369 0.0865 0.4957 0.0000 Q(t) 99383 1.7107 0.6198 0.9766 1.6834 4.9931 2.7493 21.6262 0.0893 LN_Firm_Age(t) 131121 2.8475 2.4849 2.9444 3.2581 3.7612 0.5483 3.7612 1.0986 IPR_Index(t) 131129 7.1834 7.5000 8.0000 8.2000 8.6000 1.5445 8.6000 3.5000 Enforcement_index 123971 0.8579 0.9189 0.9196 0.9276 0.9276 0.1311 0.9616 0.5965 Interaction_Liquidity_EOD(t) 126511 0.1640 0.0000 0.0000 0.0000 2.1306 1.2924 9.2867 -9.2427 Interaction_Enforcement_EOD(t) 123971 -0.0097 0.0000 0.0000 0.0000 0.0697 0.0633 0.1037 -0.2613 Interaction_IPR_EOD(t) 131129 -0.0604 0.0000 0.0000 0.0000 0.8166 0.6179 1.4166 -3.6834

Table III
Comparison of percentage change in Number of patent applications
Table 3 compares the percentage change in number of patents between t‐1 and t+1, for both firms that have experienced end of day price manipulation (information leakage) and those that have not experienced end of day price manipulation (information leakage). The sample has been split into High IPR and Low IPR, where High IPR are observations with an IPR index value over 5 and Low IPR are observations with an IPR index value less than 5. ***(**)(*) denotes significance at the 1%(5%)(10%) two‐tailed level.
End of Day Manipulation Information Leakage
% change in the number of patent applications % change in the number of patent applications
N
Low IPR firms
N High IPR firms
N All
firms N
Low IPR firms
N High IPR firms
N All
firms
Panel A: Number of patents applications
Firms that have been manipulated [A]
6,020 ‐0.2438 19,826 0.1131 25,846 0.0300 946 8.6446 9,404 4.2493 10,350 4.6510
Firms that have not been manipulated [B]
15,711 4.5722 89,572 0.9030 105,283 1.4506 20,785 2.9920 99,994 0.4317 120,779 0.8723
Difference [A] ‐ [B]
‐4.8160
‐0.7899
‐1.4206 5.6527
3.8176
3.7787
*** ** *** *** ***
Panel B: Number of patents citations
Firms that have been manipulated [A]
6,020 0.5653 19,826 7.2946 25,846 5.7272 946 2.6729 9,404 21.8940 10,350 20.1372
Firms that have not been manipulated [B]
15,711 4.4594 89,572 7.5816 105,283 7.5116 20785 3.4129 99,994 6.1787 120,779 5.7027
Difference [A] ‐ [B] ‐3.8941 ‐0.2870 ‐1.7844 ‐0.7400 15.7153 14.4344
** *** ***

Table IV Pooled OLS Specification
Table IV Panel A [B] reports Pooled OLS regression results of the model INNOV_PAT(i,t+1) [INNOV_CITE(i,t+1)] = a + b1*EOD_Dummy_First(i, t) + b2*EOD_Dummy_Subsequent(i,t) + c*Infoleak_Dummy(i,t) + c'Controls + YR(t) + Firm(i) + error(i,t). ). INNOV_PAT(i,t+1) is the natural logarithm of one plus firm i’s total number of patents filed in year t+1. INNOV_CITE(i,t+1) is the natural logarithm of one plus firm i’s total number of citations received for patents filed in year t+1, which has been adjusted for truncation bias using the citation lag distribution. EOD_Dummy_First [EOD_Dummy_Subsequent] indicates if a firm i has experienced end‐of‐day (EOD) dislocation in year t, under the condition that firm i never previously experienced [has previously experienced] EOD dislocation. Infoleak_Dummy indicates if a firm i has experienced information leakage in year t. Similary, Num_EOD_Cases_First, Num_EOD_Cases_Subsequent and Num_Infoleak_cases measures the number of times a firm i has experienced EOD or Information leakage in year t. EOD_Dummy_Positive(t) indicates if a firm i has experienced more positive EOD price dislocations than negative price dislocations in year t. Liquidity(t) is the natural logarithm of the inverse of the AMIHUD illiquidity variable. Interaction_Liquidity_EOD(t) interacts the Liquidity(t) and EOD_Dummy_Subsequent variables. Intellectual property rights index, IPR_Index(t), is the intellectual property rights index obtained from the International property rights index report. Market value decile to which firm i belongs within each country‐year (MV_Decile(t)), Return on Assets (ROA(t)), Property plant and equity to total assets (PPTA(t)), leverage measured as the book value of debt to book value of assets (LEV(t)), Capital expenditure to total assets (CAPEXTA(t)), Tobins Q (Q(t)) and natural logarithm of one plus firm i’s age, approximated by the number of years listed on Datastream (LN_Firm_Age(t)) are used as controls in all the models. No time invariant variables or interactions of time invariant variables are included in this model. Year fixed effects YR(i) and firm fixed effects Firm(i) are included in all the regressions. Coefficient estimates are shown. The standard errors are clustered by firm. ***(**)(*) denotes significance at the 1%(5%)(10%) two‐tailed level.
Panel A: Innovation measured by INNOV_PAT(i, t+1)
(1) (2) (3) (4)
EOD_Dummy(t) ‐0.00803 ** EOD_Dummy_First(t) 0.00380 ‐ 0.00365 EOD_Dummy_Subsequent(t) ‐0.01742 *** ‐ ‐0.01328 ***
EOD_Dummy_Positive(t) ‐0.00120 ‐0.00368 ‐0.00145 Infoleak_dummy(t) ‐0.00640 ‐0.00622 ‐ ‐0.00624 Num_EOD_Cases_First(t) ‐ 0.00061 ‐ Num_EOD_Cases_Subsequent(t) ‐ ‐0.00122 *** ‐ Num_Infoleak_cases(t) ‐ ‐0.00372 ‐ Liquidity(t) 0.01235 *** 0.08598 *** 0.08624 *** 0.01266 ***
Interaction_Liquidity_EOD (t) ‐ ‐ ‐0.00267 **
IPR_index(t) 0.08491 *** 0.01228 *** 0.01218 *** 0.08594 ***
MV_Decile(t) 0.00246 * 0.00258 * 0.00259 * 0.00256 *
ROA(t) ‐0.00468 ‐0.00483 ‐0.00482 ‐0.00498 PPETA(t) 0.00530 0.00547 0.00535 0.00537 LEV(t) 0.02556 ** 0.02618 ** 0.02599 ** 0.02637 **
CAPEXTA(t) ‐0.03452 ** ‐0.03519 ** ‐0.03475 ** ‐0.03553 **
Q(t) ‐0.00132 * ‐0.00135 * ‐0.00134 * ‐0.00136 *
Year and Firm fixed effects Included Included Included Included Sector fixed effects Included Included Included Included
Number of observations used 97148
97,148
97,148
97148
Adjusted R2 0.9106 0.9106 0.9106 0.9106
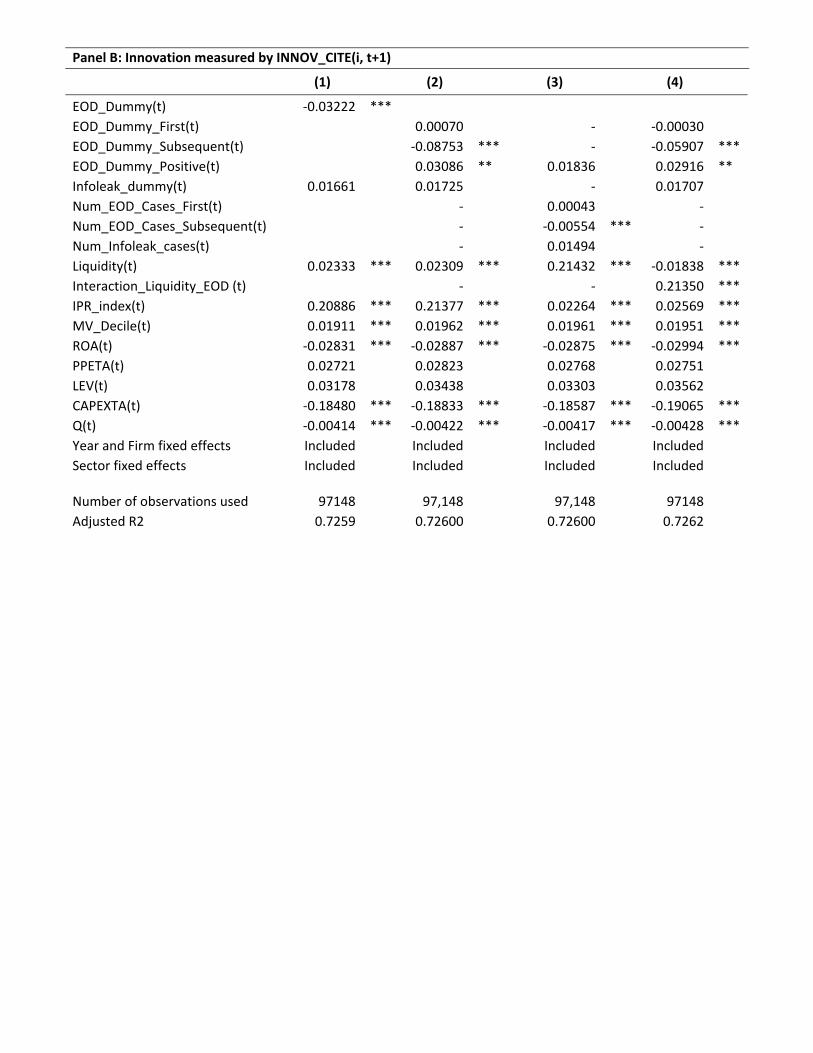
Panel B: Innovation measured by INNOV_CITE(i, t+1)
(1) (2) (3) (4)
EOD_Dummy(t) ‐0.03222 *** EOD_Dummy_First(t) 0.00070 ‐ ‐0.00030 EOD_Dummy_Subsequent(t) ‐0.08753 *** ‐ ‐0.05907 ***
EOD_Dummy_Positive(t) 0.03086 ** 0.01836 0.02916 **
Infoleak_dummy(t) 0.01661 0.01725 ‐ 0.01707 Num_EOD_Cases_First(t) ‐ 0.00043 ‐ Num_EOD_Cases_Subsequent(t) ‐ ‐0.00554 *** ‐ Num_Infoleak_cases(t) ‐ 0.01494 ‐ Liquidity(t) 0.02333 *** 0.02309 *** 0.21432 *** ‐0.01838 ***
Interaction_Liquidity_EOD (t) ‐ ‐ 0.21350 ***
IPR_index(t) 0.20886 *** 0.21377 *** 0.02264 *** 0.02569 ***
MV_Decile(t) 0.01911 *** 0.01962 *** 0.01961 *** 0.01951 ***
ROA(t) ‐0.02831 *** ‐0.02887 *** ‐0.02875 *** ‐0.02994 ***
PPETA(t) 0.02721 0.02823 0.02768 0.02751 LEV(t) 0.03178 0.03438 0.03303 0.03562 CAPEXTA(t) ‐0.18480 *** ‐0.18833 *** ‐0.18587 *** ‐0.19065 ***
Q(t) ‐0.00414 *** ‐0.00422 *** ‐0.00417 *** ‐0.00428 ***
Year and Firm fixed effects Included Included Included Included Sector fixed effects Included Included Included Included
Number of observations used 97148
97,148
97,148
97148
Adjusted R2 0.7259 0.72600 0.72600 0.7262
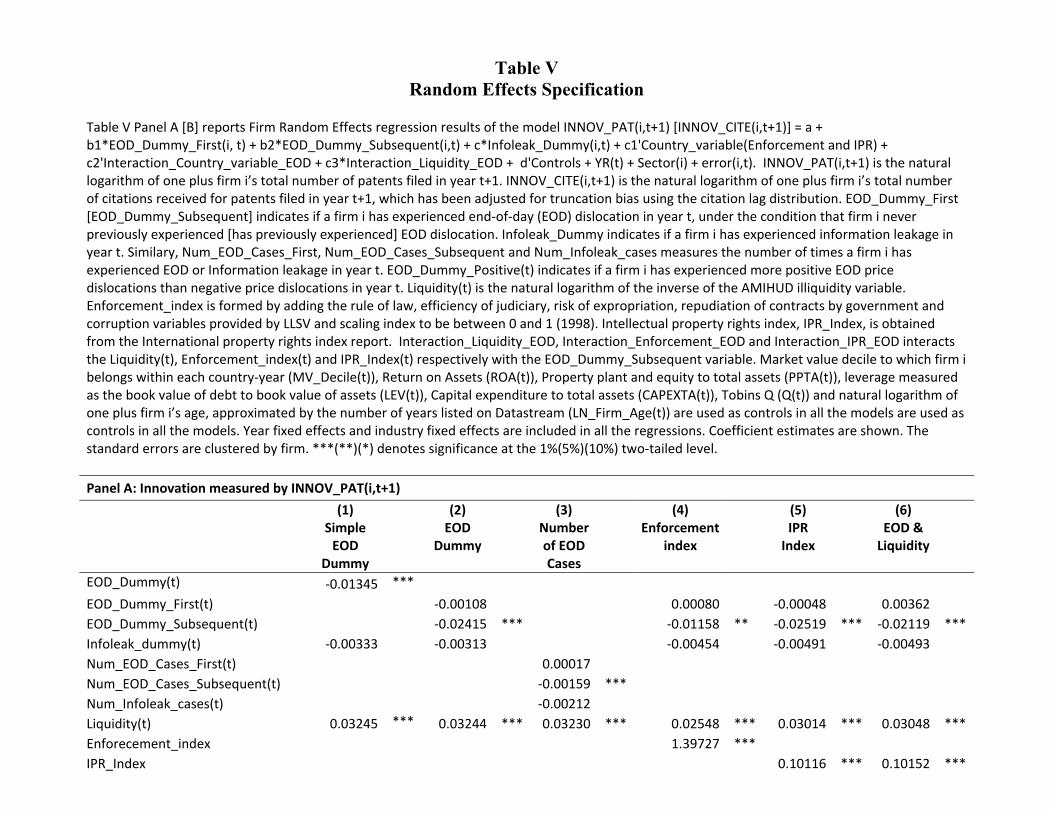
Table V Random Effects Specification
Table V Panel A [B] reports Firm Random Effects regression results of the model INNOV_PAT(i,t+1) [INNOV_CITE(i,t+1)] = a + b1*EOD_Dummy_First(i, t) + b2*EOD_Dummy_Subsequent(i,t) + c*Infoleak_Dummy(i,t) + c1'Country_variable(Enforcement and IPR) + c2'Interaction_Country_variable_EOD + c3*Interaction_Liquidity_EOD + d'Controls + YR(t) + Sector(i) + error(i,t). INNOV_PAT(i,t+1) is the natural logarithm of one plus firm i’s total number of patents filed in year t+1. INNOV_CITE(i,t+1) is the natural logarithm of one plus firm i’s total number of citations received for patents filed in year t+1, which has been adjusted for truncation bias using the citation lag distribution. EOD_Dummy_First [EOD_Dummy_Subsequent] indicates if a firm i has experienced end‐of‐day (EOD) dislocation in year t, under the condition that firm i never previously experienced [has previously experienced] EOD dislocation. Infoleak_Dummy indicates if a firm i has experienced information leakage in year t. Similary, Num_EOD_Cases_First, Num_EOD_Cases_Subsequent and Num_Infoleak_cases measures the number of times a firm i has experienced EOD or Information leakage in year t. EOD_Dummy_Positive(t) indicates if a firm i has experienced more positive EOD price dislocations than negative price dislocations in year t. Liquidity(t) is the natural logarithm of the inverse of the AMIHUD illiquidity variable. Enforcement_index is formed by adding the rule of law, efficiency of judiciary, risk of expropriation, repudiation of contracts by government and corruption variables provided by LLSV and scaling index to be between 0 and 1 (1998). Intellectual property rights index, IPR_Index, is obtained from the International property rights index report. Interaction_Liquidity_EOD, Interaction_Enforcement_EOD and Interaction_IPR_EOD interacts the Liquidity(t), Enforcement_index(t) and IPR_Index(t) respectively with the EOD_Dummy_Subsequent variable. Market value decile to which firm i belongs within each country‐year (MV_Decile(t)), Return on Assets (ROA(t)), Property plant and equity to total assets (PPTA(t)), leverage measured as the book value of debt to book value of assets (LEV(t)), Capital expenditure to total assets (CAPEXTA(t)), Tobins Q (Q(t)) and natural logarithm of one plus firm i’s age, approximated by the number of years listed on Datastream (LN_Firm_Age(t)) are used as controls in all the models are used as controls in all the models. Year fixed effects and industry fixed effects are included in all the regressions. Coefficient estimates are shown. The standard errors are clustered by firm. ***(**)(*) denotes significance at the 1%(5%)(10%) two‐tailed level.
Panel A: Innovation measured by INNOV_PAT(i,t+1)
(1) Simple EOD
Dummy
(2) EOD
Dummy
(3) Number of EOD Cases
(4) Enforcement
index
(5) IPR Index
(6) EOD & Liquidity
EOD_Dummy(t) ‐0.01345 ***
EOD_Dummy_First(t) ‐0.00108 0.00080 ‐0.00048 0.00362 EOD_Dummy_Subsequent(t) ‐0.02415 *** ‐0.01158 ** ‐0.02519 *** ‐0.02119 ***
Infoleak_dummy(t) ‐0.00333
‐0.00313 ‐0.00454 ‐0.00491 ‐0.00493 Num_EOD_Cases_First(t) 0.00017 Num_EOD_Cases_Subsequent(t) ‐0.00159 *** Num_Infoleak_cases(t) ‐0.00212 Liquidity(t) 0.03245 *** 0.03244 *** 0.03230 *** 0.02548 *** 0.03014 *** 0.03048 ***
Enforecement_index 1.39727 *** IPR_Index 0.10116 *** 0.10152 ***
Interaction_Enforcement_EOD 0.03676 * Interaction_IPR_EOD 0.00159 Interaction_Liquidity_EOD ‐0.00266 **
MV_Decile(t) 0.00236 * 0.00246 * 0.00242 * 0.00579 *** 0.00461 *** ***
ROA(t) ‐0.01919 *** ‐0.01930 *** ‐0.01929 *** ‐0.01656 *** ‐0.01923 *** 0.00458 ***
PPETA(t) ‐0.00199
‐0.00182 ‐0.00191 0.01521 * 0.00904 ‐0.01938 LEV(t) 0.01463
0.01526 0.01498 0.02433 ** 0.03146 *** 0.00890 ***
CAPEXTA(t) ‐0.07966 *** ‐0.08043 *** ‐0.07995 *** ‐0.05881 *** ‐0.07135 *** 0.03156 ***
Q(t) ‐0.00298 *** ‐0.00300 *** ‐0.00297 *** ‐0.00395 *** ‐0.00389 *** ‐0.07175 ***
LN_Firm_Age(t) 0.28193 *** 0.28267 *** 0.28291 *** 0.27571 *** 0.26254 *** ‐0.00390 ***
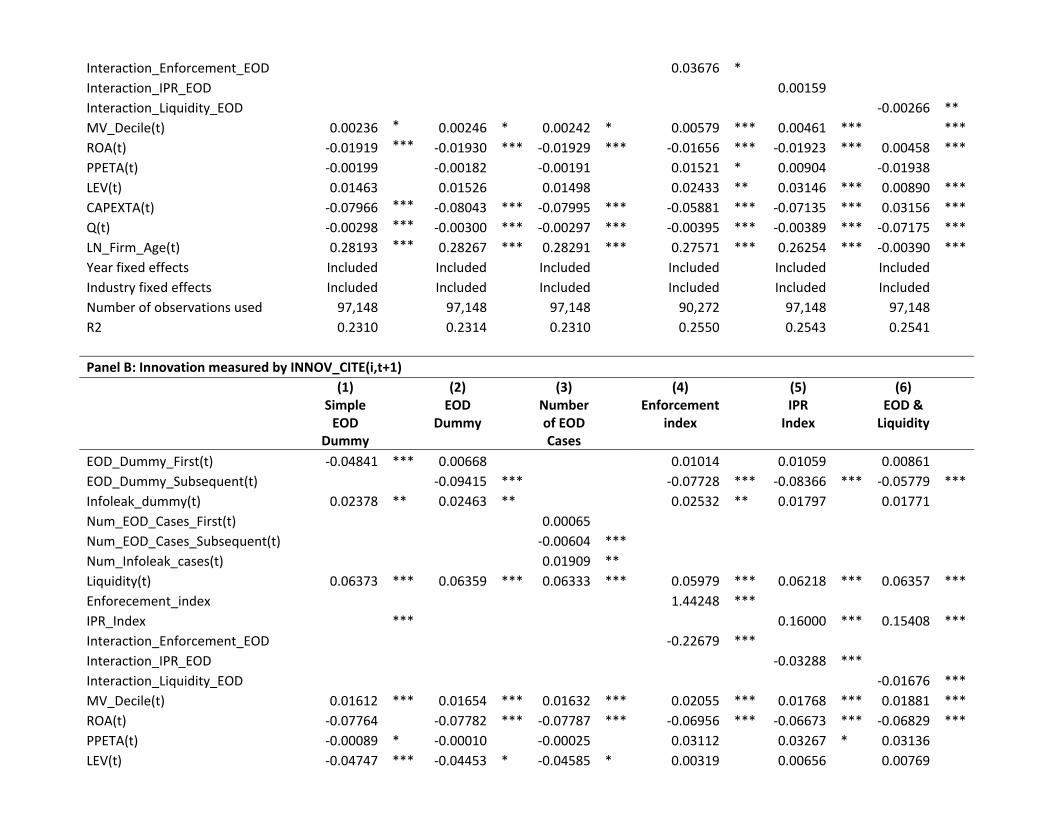
Year fixed effects Included Included Included Included Included Included Industry fixed effects Included Included Included Included Included Included Number of observations used 97,148 97,148 97,148 90,272 97,148 97,148 R2 0.2310 0.2314 0.2310 0.2550 0.2543 0.2541
Panel B: Innovation measured by INNOV_CITE(i,t+1)
(1) Simple EOD
Dummy
(2) EOD
Dummy
(3) Number of EOD Cases
(4) Enforcement
index
(5) IPR Index
(6) EOD & Liquidity
EOD_Dummy_First(t) ‐0.04841 *** 0.00668 0.01014 0.01059 0.00861 EOD_Dummy_Subsequent(t) ‐0.09415 *** ‐0.07728 *** ‐0.08366 *** ‐0.05779 ***
Infoleak_dummy(t) 0.02378 ** 0.02463 ** 0.02532 ** 0.01797 0.01771 Num_EOD_Cases_First(t) 0.00065 Num_EOD_Cases_Subsequent(t) ‐0.00604 *** Num_Infoleak_cases(t) 0.01909 ** Liquidity(t) 0.06373 *** 0.06359 *** 0.06333 *** 0.05979 *** 0.06218 *** 0.06357 ***
Enforecement_index 1.44248 *** IPR_Index *** 0.16000 *** 0.15408 ***
Interaction_Enforcement_EOD ‐0.22679 *** Interaction_IPR_EOD ‐0.03288 *** Interaction_Liquidity_EOD ‐0.01676 ***
MV_Decile(t) 0.01612 *** 0.01654 *** 0.01632 *** 0.02055 *** 0.01768 *** 0.01881 ***
ROA(t) ‐0.07764 ‐0.07782 *** ‐0.07787 *** ‐0.06956 *** ‐0.06673 *** ‐0.06829 ***
PPETA(t) ‐0.00089 * ‐0.00010 ‐0.00025 0.03112 0.03267 * 0.03136 LEV(t) ‐0.04747 *** ‐0.04453 * ‐0.04585 * 0.00319 0.00656 0.00769
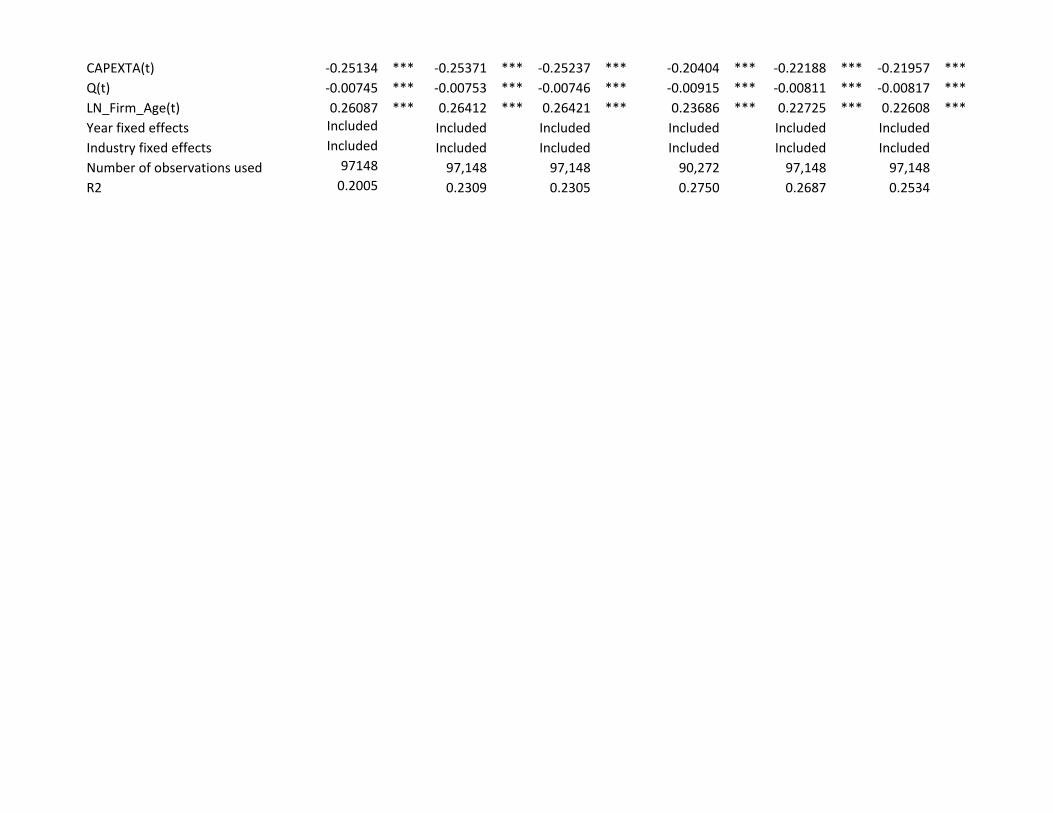
CAPEXTA(t) ‐0.25134 *** ‐0.25371 *** ‐0.25237 *** ‐0.20404 *** ‐0.22188 *** ‐0.21957 ***
Q(t) ‐0.00745 *** ‐0.00753 *** ‐0.00746 *** ‐0.00915 *** ‐0.00811 *** ‐0.00817 ***
LN_Firm_Age(t) 0.26087 *** 0.26412 *** 0.26421 *** 0.23686 *** 0.22725 *** 0.22608 ***
Year fixed effects Included Included Included Included Included Included Industry fixed effects Included Included Included Included Included Included Number of observations used 97148 97,148 97,148 90,272 97,148 97,148 R2 0.2005 0.2309 0.2305 0.2750 0.2687 0.2534

Table VI Robustness checks
Table VI reports various robustness check regression results of the Firm Random Effects model INNOV_PAT(i,t+1) = a + b1*EOD_Dummy_First(i, t) + b2*EOD_Dummy_Subsequent(i,t) + c*Infoleak_Dummy(i,t) + c1'IPR_Index + d1*Liquidity + d2*Interaction_Liquidity_EOD + e'Controls + YR(t) + Industry(i) + error(i,t). Year fixed effects YR(i) and Industry(i) fixed effects are included in all the regressions. Coefficient estimates are shown. The standard errors are clustered by firm. ***(**)(*) denotes significance at the 1%(5%)(10%) two‐tailed level. In Panel A: Model (1) excludes US observations from the sample. Model (2) excludes the financial crisis years of 2007 & 2008. Model (3) includes only the financial crisis year observations. Model (4) uses variables without any winsorization. In Panel B: Model (1) and (2) uses Patent application that are eventually granted which has been adjusted for truncation bias as the dependent variable. Model (3) uses Patent applications that are eventually granted as the dependent variable. In Panel C: Model (1) clusters the standard errors by industry‐year. Model (2) clusters the standard errors by country‐year. Model (3) winsorizes the variables at 2.5% and 97.5%. Model (4) winsorizes the variables at 5% and 95%.
Panel A: Robustness to Non‐Us observations, exclusion of crisis years, only crisis years, other measures of innovation and no winsorization
(1) Non‐US
(2) Excludes Crisis
years
(3) Only crisis
years
(4) Without
winsorization
EOD_Dummy_First(t) 0.00048 ‐0.00253 ‐0.02384 *** 0.00048 EOD_Dummy_Subsequent(t) ‐0.02105 *** ‐0.02430 *** ‐0.05051 *** ‐0.01978 ***
Infoleak_dummy(t) ‐0.00339 ‐0.00286 ‐0.01769 ** ‐0.00498 IPR_Index(t) 0.11904 *** 0.10969 *** 0.09817 *** 0.10256 ***
Liquidity(t) 0.03236 *** 0.03587 *** 0.05556 *** 0.02982 ***
Interaction_Liquidity_EOD(t) ‐0.00336 ** ‐0.00224 ‐0.00535 ** ‐0.00200 MV_Decile(t) 0.00060 0.00451 *** 0.01706 *** 0.00281 **
ROA(t) ‐0.01983 *** ‐0.02518 *** ‐0.04814 *** ‐0.00001 PPETA(t) 0.00927 0.00549 0.02132 0.00764 LEV(t) 0.03307 *** 0.03960 *** ‐0.04294 ** 0.00006 CAPEXTA(t) ‐0.07043 *** ‐0.09071 *** ‐0.02307 ‐0.00060 Q(t) ‐0.00354 *** ‐0.00520 *** ‐0.00610 *** 0.00000 ***
LN_Firm_Age(t) 0.37413 *** 0.25431 *** 0.24447 *** 0.28811 ***
Year fixed effects Included Included Included Included
Industry fixed effects Included Included Included Included Number of observations used 66,195 70,752 26,396 97148 R2 0.2935 0.2610 0.2788 0.2474
Panel B: Robustness to applied and granted measure of innovation
(1) Adjusted Applied & granted patents
(2) Adjusted Applied
& granted patents
(3) Applied &
granted patents
EOD_Dummy(t) ‐0.00949 ***
EOD_Dummy_First(t) ‐0.00449 ‐0.00086 EOD_Dummy_Subsequent(t)
‐0.01460 *** ‐0.01001 ***
Infoleak_dummy(t) 0.01346 *** 0.01355 *** 0.01532 *** IPR_Index(t) 0.10698 *** 0.10697 *** 0.10144 *** Liquidity(t) 0.03141 *** 0.03133 *** 0.02817 *** Interaction_Liquidity_EOD(t) ‐0.00020
0.00039 0.00037
MV_Decile(t) 0.00334 *** 0.00338 *** 0.00514 ***
ROA(t) ‐0.01989 *** ‐0.01988 *** ‐0.02090 ***
PPETA(t) 0.00433
0.00444 0.00829 LEV(t) 0.01182
0.01206 0.01698 *
CAPEXTA(t) ‐0.08512 *** ‐0.08535 *** ‐0.09796 *** Q(t) ‐0.00424 *** ‐0.00424 *** ‐0.00439 *** LN_Firm_Age(t) 0.19679 *** 0.19715 *** 0.17644 *** Year fixed effects Included Included Included Industry fixed effects Included Included Included Number of observations used 97,148 97,148 97,148 R2 0.2377 0.2378 0.2357
Panel C : Robustness to various types of clustering of standard errors and different levels of winsorization
(1) Cluster by
industry‐year
(2) Cluster by
country‐year
(3) Winsor at 2.5% and
97.5%
(4) Winsor at 5%
and 95%
EOD_Dummy_First(t) ‐0.00071 ‐0.00071 ‐0.00139 ‐0.00134 EOD_Dummy_Subsequent(t) ‐0.02119 *** ‐0.02119 ** ‐0.02174 *** ‐0.01995 ***

Infoleak_dummy(t) ‐0.00493 ‐0.00493 ‐0.00484 ‐0.00423 IPR_Index(t) 0.10152 *** 0.10152 *** 0.09500 *** 0.07961 ***
Liquidity(t) 0.03048 *** 0.03048 *** 0.03010 *** 0.02810 ***
Interaction_Liquidity_EOD(t) ‐0.00266 ‐0.00266 ‐0.00234 ** ‐0.00158 MV_Decile(t) 0.00458 *** 0.00458 0.00422 *** 0.00296 ***
ROA(t) ‐0.01938 *** ‐0.01938 *** ‐0.02761 *** ‐0.04117 ***
PPETA(t) 0.00890 0.00890 0.00439 ‐0.00010 LEV(t) 0.03156 *** 0.03156 * 0.03268 *** 0.01929 *
CAPEXTA(t) ‐0.07175 *** ‐0.07175 *** ‐0.07849 *** ‐0.07916 ***
Q(t) ‐0.00390 *** ‐0.00390 *** ‐0.00692 *** ‐0.00766 ***
LN_Firm_Age(t) 0.26229 *** 0.26229 *** 0.22041 *** 0.16339 ***
Year fixed effects Included Included Included Included Industry fixed effects Included Included Included Included Number of observations used 97,148 97,148 97,148 97,148 R2 0.2541 0.2541 0.2596 0.2611

Table VII
Liquidity Deciles
Table VII reports the Firm Random Effects regression results of the model INNOV_PAT(i,t+1) = a + b1*EOD_Dummy_First(i, t) + b2*EOD_Dummy_Subsequent(i,t) + c*Infoleak_Dummy(i,t) + c1'IPR_Index +d1*Liquidity + e'Controls + YR(t) + Industry(i) + error(i,t), for the 10th, 20th, 80th and 90th deciles of the Liquidity(t) measure. Year fixed effects YR(i) and Industry(i) fixed effects are included in all the regressions. Coefficient estimates are shown. The standard errors are clustered by firm. ***(**)(*) denotes significance at the 1%(5%)(10%) two-tailed level.
(1) Top 10th Decile of Liquidity
(2) Top 20th Decile of Liquidity
(3) Bottom 80th
Decile of Liquidity
(4) Bottom 90th
Decile of Liquidity
EOD_Dummy_First(t) -0.00004
-0.00776
-0.01061
0.02004
EOD_Dummy_Subsequent(t) -0.05043 *** -0.03836 *** 0.00001
-0.00236
Infoleak_dummy(t) -0.00795
-0.00640
-0.01753 *** -0.02460 ***
IPR_Index 0.14863 *** 0.13150 *** 0.01050 ** 0.00508
Liquidity(t) 0.10636 *** 0.08290 *** 0.00314 * -0.00103
MV_Decile(t) 0.03925 *** 0.02642 *** -0.00109
-0.00121
ROA(t) 0.06544
0.02360
-0.00150
-0.00339
PPETA(t) 0.13913
0.12528 ** -0.00572
0.00283
LEV(t) 0.08000
0.00050
-0.00559
-0.00268
CAPEXTA(t) -0.11891
-0.05173
-0.01386
-0.01844
Q(t) -0.02638 ** -0.02499 *** -0.00001
-0.00024
LN_Firm_Age(t) 0.43894 *** 0.36686 *** 0.00454
0.00900
Year fixed effects Included
Included
Included
Included
Industry fixed effects Included
Included
Included
Included
Number of observations used 11,817
23,572
13,244
6,042
R2 0.3685
0.3331
0.0155
0.0236
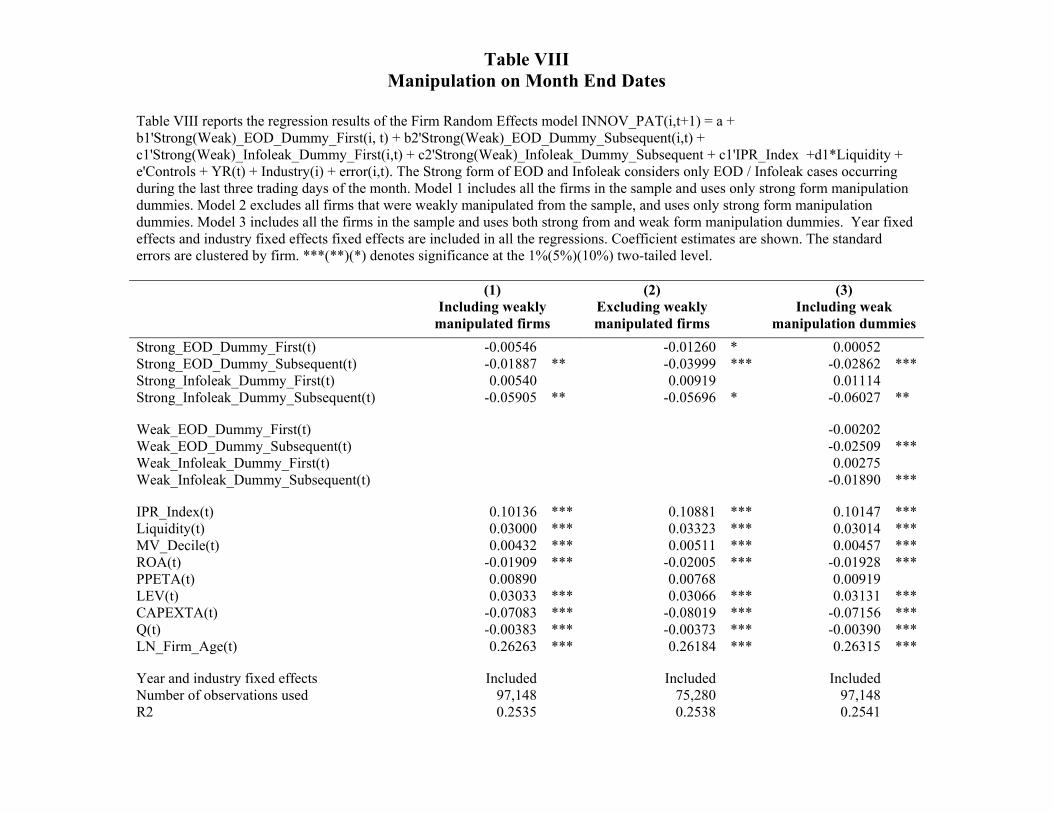
Table VIII Manipulation on Month End Dates
Table VIII reports the regression results of the Firm Random Effects model INNOV_PAT(i,t+1) = a + b1'Strong(Weak)_EOD_Dummy_First(i, t) + b2'Strong(Weak)_EOD_Dummy_Subsequent(i,t) + c1'Strong(Weak)_Infoleak_Dummy_First(i,t) + c2'Strong(Weak)_Infoleak_Dummy_Subsequent + c1'IPR_Index +d1*Liquidity + e'Controls + YR(t) + Industry(i) + error(i,t). The Strong form of EOD and Infoleak considers only EOD / Infoleak cases occurring during the last three trading days of the month. Model 1 includes all the firms in the sample and uses only strong form manipulation dummies. Model 2 excludes all firms that were weakly manipulated from the sample, and uses only strong form manipulation dummies. Model 3 includes all the firms in the sample and uses both strong from and weak form manipulation dummies. Year fixed effects and industry fixed effects fixed effects are included in all the regressions. Coefficient estimates are shown. The standard errors are clustered by firm. ***(**)(*) denotes significance at the 1%(5%)(10%) two-tailed level.
(1)
Including weakly manipulated firms
(2) Excluding weakly manipulated firms
(3)
Including weak manipulation dummies
Strong_EOD_Dummy_First(t) -0.00546 -0.01260 * 0.00052
Strong_EOD_Dummy_Subsequent(t) -0.01887 ** -0.03999 *** -0.02862 *** Strong_Infoleak_Dummy_First(t) 0.00540 0.00919 0.01114
Strong_Infoleak_Dummy_Subsequent(t) -0.05905 ** -0.05696 * -0.06027 **
Weak_EOD_Dummy_First(t) -0.00202
Weak_EOD_Dummy_Subsequent(t) -0.02509 *** Weak_Infoleak_Dummy_First(t) 0.00275
Weak_Infoleak_Dummy_Subsequent(t) -0.01890 ***
IPR_Index(t) 0.10136 *** 0.10881 *** 0.10147 *** Liquidity(t) 0.03000 *** 0.03323 *** 0.03014 *** MV_Decile(t) 0.00432 *** 0.00511 *** 0.00457 *** ROA(t) -0.01909 *** -0.02005 *** -0.01928 *** PPETA(t) 0.00890 0.00768 0.00919
LEV(t) 0.03033 *** 0.03066 *** 0.03131 *** CAPEXTA(t) -0.07083 *** -0.08019 *** -0.07156 *** Q(t) -0.00383 *** -0.00373 *** -0.00390 *** LN_Firm_Age(t) 0.26263 *** 0.26184 *** 0.26315 ***
Year and industry fixed effects Included Included Included Number of observations used 97,148 75,280 97,148 R2 0.2535 0.2538 0.2541
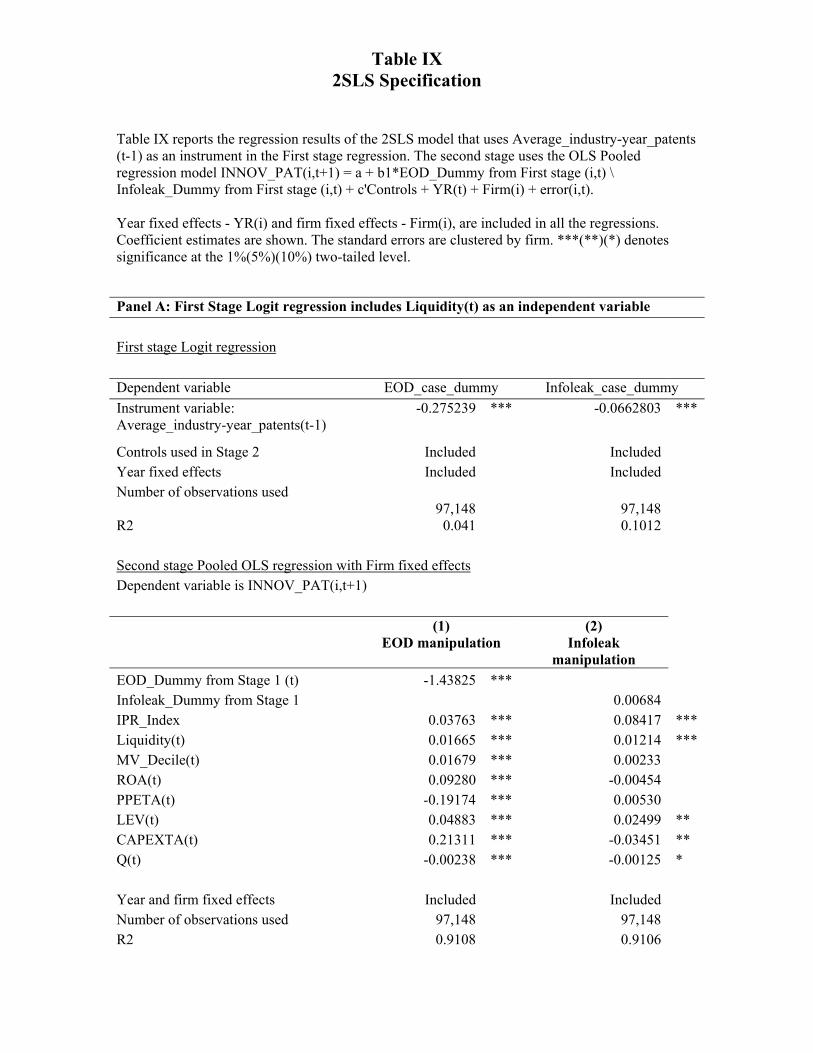
Table IX 2SLS Specification
Table IX reports the regression results of the 2SLS model that uses Average_industry-year_patents (t-1) as an instrument in the First stage regression. The second stage uses the OLS Pooled regression model INNOV_PAT(i,t+1) = a + b1*EOD_Dummy from First stage (i,t) \ Infoleak_Dummy from First stage (i,t) + c'Controls + YR(t) + Firm(i) + error(i,t). Year fixed effects - YR(i) and firm fixed effects - Firm(i), are included in all the regressions. Coefficient estimates are shown. The standard errors are clustered by firm. ***(**)(*) denotes significance at the 1%(5%)(10%) two-tailed level.
Panel A: First Stage Logit regression includes Liquidity(t) as an independent variable
First stage Logit regression
Dependent variable EOD_case_dummy Infoleak_case_dummy
Instrument variable: Average_industry-year_patents(t-1)
-0.275239 *** -0.0662803 ***
Controls used in Stage 2 Included
Included
Year fixed effects Included
Included
Number of observations used 97,148
97,148
R2 0.041
0.1012
Second stage Pooled OLS regression with Firm fixed effects
Dependent variable is INNOV_PAT(i,t+1)
(1)
EOD manipulation (2)
Infoleak manipulation
EOD_Dummy from Stage 1 (t) -1.43825 *** Infoleak_Dummy from Stage 1 0.00684 IPR_Index 0.03763 *** 0.08417 *** Liquidity(t) 0.01665 *** 0.01214 *** MV_Decile(t) 0.01679 *** 0.00233 ROA(t) 0.09280 *** -0.00454 PPETA(t) -0.19174 *** 0.00530 LEV(t) 0.04883 *** 0.02499 ** CAPEXTA(t) 0.21311 *** -0.03451 ** Q(t) -0.00238 *** -0.00125 *
Year and firm fixed effects Included Included Number of observations used 97,148 97,148 R2 0.9108 0.9106

Panel B: First Stage Logit regression includes Liquidity(t) as an independent variable
First stage Logit regression
Dependent variable EOD_case_dummy Infoleak_case_dummy
Instrument variable: Average_industry-year_patents(t-1)
-0.20863 *** 0.34556 ***
Controls used in Stage 2 Included
Included
Year fixed effects Included
Included
Number of observations used 98,075
98,075
R2 0.0408
0.0698
Second stage
Dependent variable is INNOV_PAT(I,t+1)
(1) EOD manipulation
(2) Infoleak
manipulation
EOD_Dummy from Stage 1 (t) -1.21643 *** Infoleak_Dummy from Stage 1 0.12211 IPR_Index(t) 0.04315 *** 0.08339 *** Liquidity(t) 0.01168 *** 0.01215 *** MV_Decile(t) 0.01857 *** 0.00110 ROA(t) 0.08201 *** -0.00619 PPETA(t) -0.16593 *** 0.00649 LEV(t) 0.05086 *** 0.01938 CAPEXTA(t) 0.16219 *** -0.02722 * Q(t) -0.00312 *** -0.00079 Year and Firm fixed effects Included Included Number of observations used 97,148 97,148 R2 0.9107 0.9106

Table X Propensity scoring matching analysis
Table X Panel A [Panel B] reports the Propensity score matching analysis using nearest and four nearest matching methods for estimating the treatment effect of manipulation on innovation. First, the propensity scores for treatment (EOD or Infoleak manipulation) are computed using Probit regression of the model EOD_Dummy(t)/Infoleak_Dummy(t) = a + b*INNOV_PAT(t-1) + c*IPR_Index(t) + d*Enforcement_index(t) + e*Liquidity(t) + f'Controls. In Panel B, we exclude Liquidity(t) as an independent variable in this Probit regression. Next, the nearest (four-nearest) neighbour propensity scoring methods match, within each country-industry-year strata, manipulated firms with control firms having the nearest (four nearest) propensity scores as the manipulated firms. Both the propensity score matching methods discard treatment observations whose propensity score is higher than the maximum or less than the minimum propensity score of the controls. The nearest (four nearest) neighbour matching method matches without (with) replacement. Finally, the Average Treatment effect on the Treated (ATT) is the average difference between the manipulated and control firms of the change in the number (logarithm of number) of patents in year after and before the manipulation.
Panel A: Probit regression includes Liquidity(t) as an independent variable
Probit regression
Dependent variable EOD_Dummy(t) Infoleak_Dummy(t)
INNOV_PAT(t-1) -0.02231 *** -0.02803 *** IPR_Index(t) 0.15828 *** -0.15098 *** Enforcement_index(t) -4.79175 *** 1.44600 *** Liquidity(t) 0.03028 *** 0.11987 *** MV_Decile(t) 0.03205 *** -0.01251 *** ROA(t) 0.24070 *** -0.01572
PPETA(t) -0.47437 *** -0.04168
LEV(t) -0.05950 ** 0.23043 *** CAPEXTA(t) 0.32205 *** 0.11448
Q(t) 0.00130 -0.02262 *** LN_Firm_Age(t) -0.14729 *** -0.02305 * Constant 2.54262 *** -1.76371 *** Year and Firm fixed effects Not Included Not Included Industry fixed effects Not Included Not Included Number of observations used 90,272 90,272 R2 0.0945 0.0945
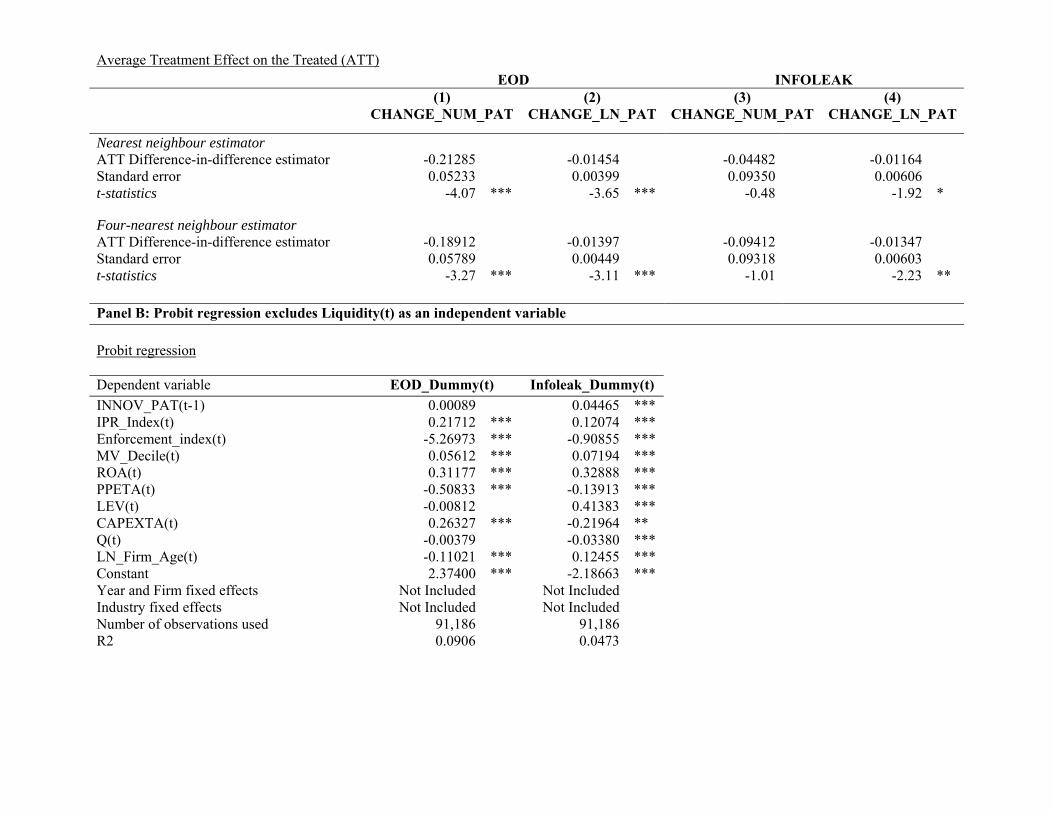
Average Treatment Effect on the Treated (ATT)
EOD INFOLEAK
(1) CHANGE_NUM_PAT
(2) CHANGE_LN_PAT
(3) CHANGE_NUM_PAT
(4) CHANGE_LN_PAT
Nearest neighbour estimator ATT Difference-in-difference estimator -0.21285 -0.01454 -0.04482 -0.01164 Standard error 0.05233 0.00399 0.09350 0.00606 t-statistics -4.07 *** -3.65 *** -0.48 -1.92 * Four-nearest neighbour estimator ATT Difference-in-difference estimator -0.18912 -0.01397 -0.09412 -0.01347 Standard error 0.05789 0.00449 0.09318 0.00603 t-statistics -3.27 *** -3.11 *** -1.01 -2.23 ** Panel B: Probit regression excludes Liquidity(t) as an independent variable
Probit regression
Dependent variable EOD_Dummy(t) Infoleak_Dummy(t)
INNOV_PAT(t-1) 0.00089 0.04465 *** IPR_Index(t) 0.21712 *** 0.12074 *** Enforcement_index(t) -5.26973 *** -0.90855 *** MV_Decile(t) 0.05612 *** 0.07194 *** ROA(t) 0.31177 *** 0.32888 *** PPETA(t) -0.50833 *** -0.13913 *** LEV(t) -0.00812 0.41383 *** CAPEXTA(t) 0.26327 *** -0.21964 ** Q(t) -0.00379 -0.03380 *** LN_Firm_Age(t) -0.11021 *** 0.12455 *** Constant 2.37400 *** -2.18663 *** Year and Firm fixed effects Not Included Not Included Industry fixed effects Not Included Not Included Number of observations used 91,186 91,186 R2 0.0906 0.0473
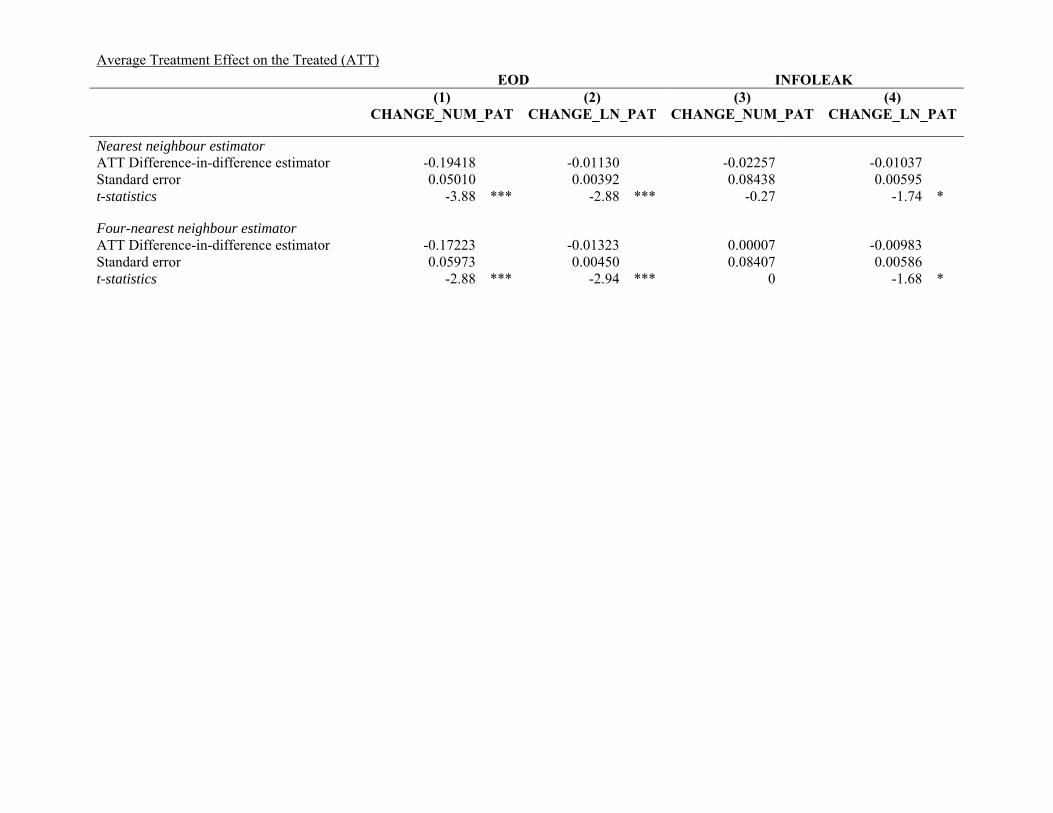
Average Treatment Effect on the Treated (ATT)
EOD INFOLEAK
(1) CHANGE_NUM_PAT
(2) CHANGE_LN_PAT
(3) CHANGE_NUM_PAT
(4) CHANGE_LN_PAT
Nearest neighbour estimator ATT Difference-in-difference estimator -0.19418 -0.01130 -0.02257 -0.01037 Standard error 0.05010 0.00392 0.08438 0.00595 t-statistics -3.88 *** -2.88 *** -0.27 -1.74 * Four-nearest neighbour estimator ATT Difference-in-difference estimator -0.17223 -0.01323 0.00007 -0.00983 Standard error 0.05973 0.00450 0.08407 0.00586 t-statistics -2.88 *** -2.94 *** 0 -1.68 *
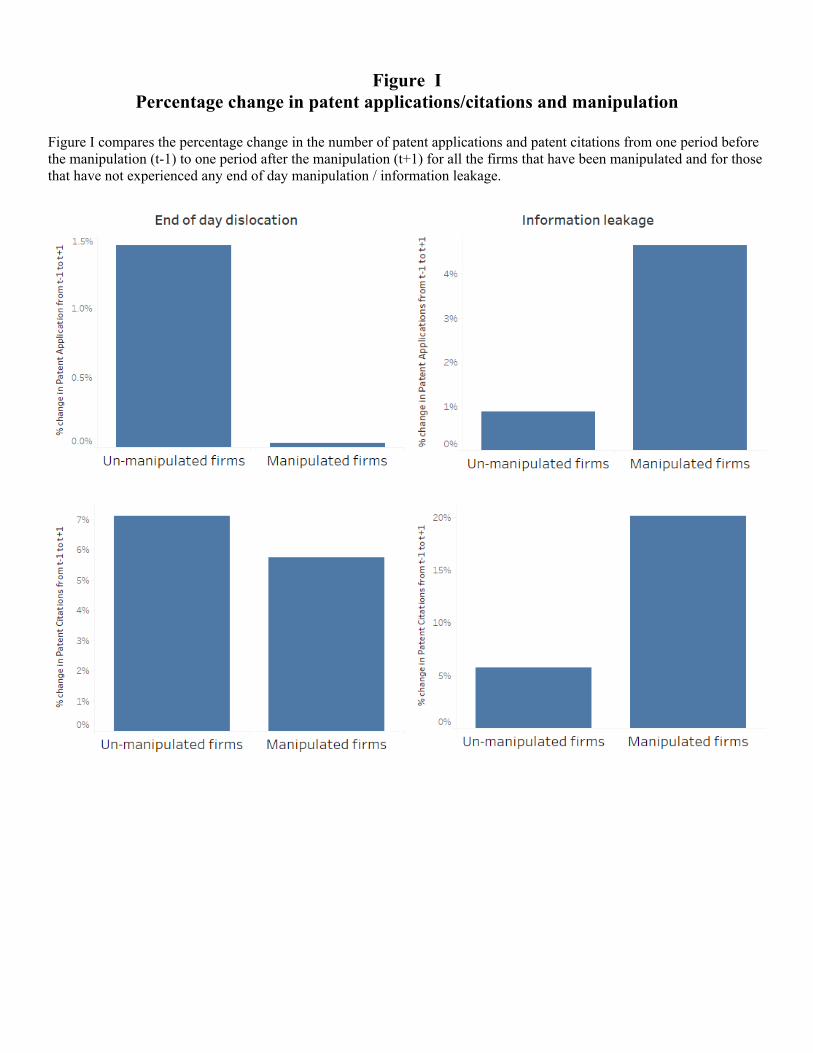
Figure I
Percentage change in patent applications/citations and manipulation
Figure I compares the percentage change in the number of patent applications and patent citations from one period before the manipulation (t-1) to one period after the manipulation (t+1) for all the firms that have been manipulated and for those that have not experienced any end of day manipulation / information leakage.
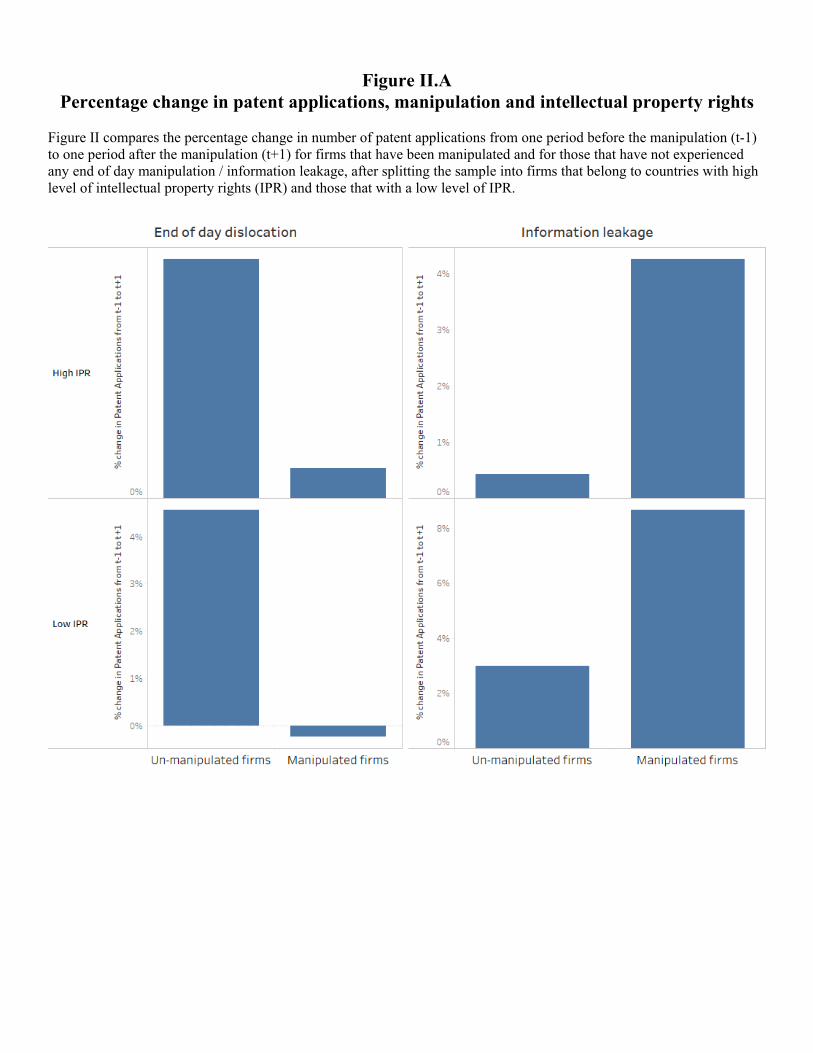
Figure II.A
Percentage change in patent applications, manipulation and intellectual property rights Figure II compares the percentage change in number of patent applications from one period before the manipulation (t-1) to one period after the manipulation (t+1) for firms that have been manipulated and for those that have not experienced any end of day manipulation / information leakage, after splitting the sample into firms that belong to countries with high level of intellectual property rights (IPR) and those that with a low level of IPR.
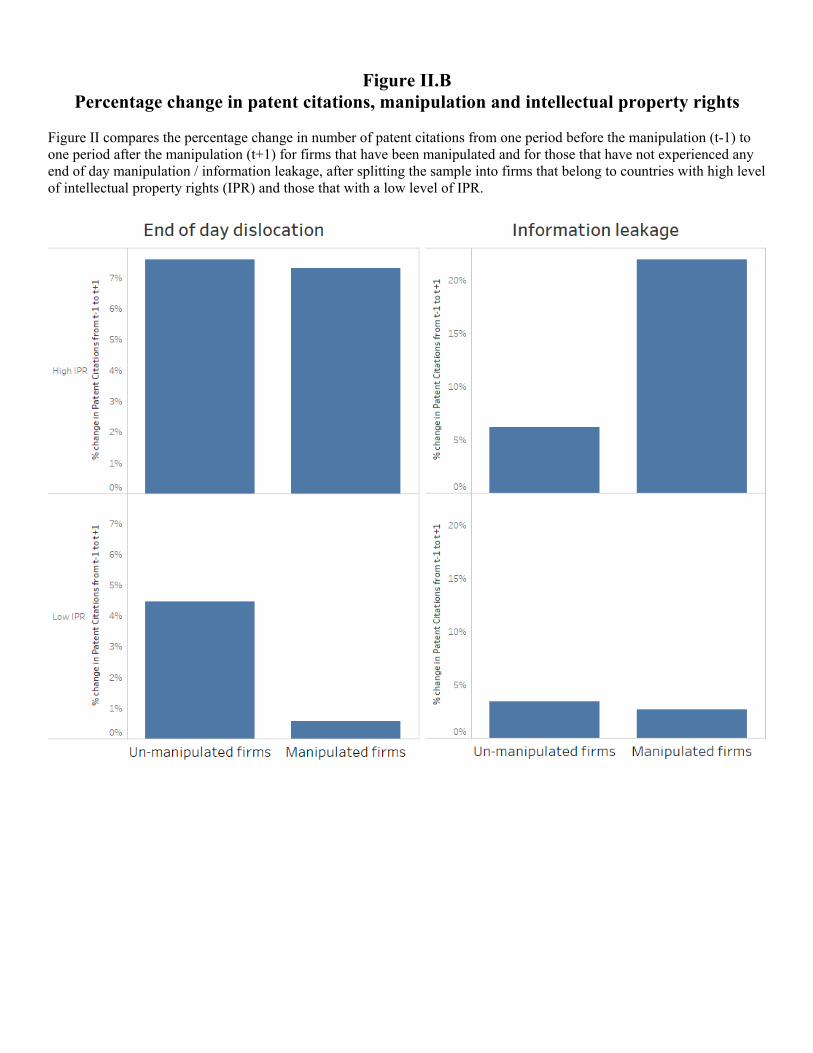
Figure II.B
Percentage change in patent citations, manipulation and intellectual property rights Figure II compares the percentage change in number of patent citations from one period before the manipulation (t-1) to one period after the manipulation (t+1) for firms that have been manipulated and for those that have not experienced any end of day manipulation / information leakage, after splitting the sample into firms that belong to countries with high level of intellectual property rights (IPR) and those that with a low level of IPR.
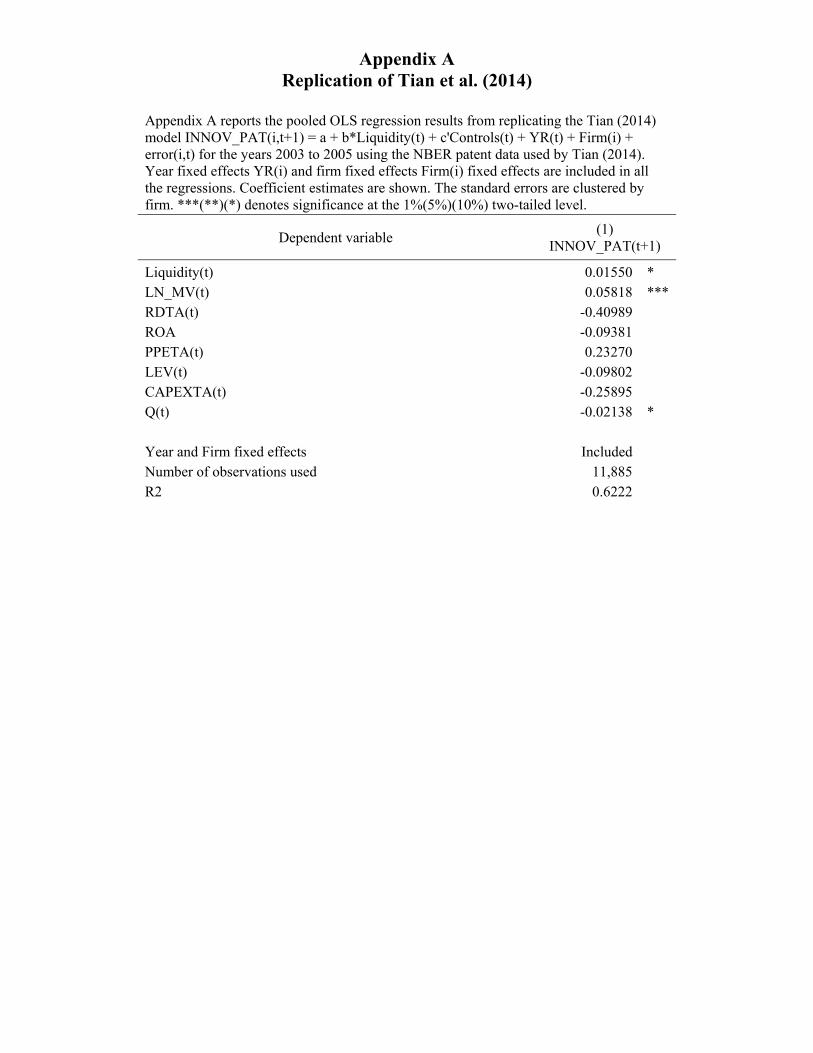
Appendix A Replication of Tian et al. (2014)
Appendix A reports the pooled OLS regression results from replicating the Tian (2014) model INNOV_PAT(i,t+1) = a + b*Liquidity(t) + c'Controls(t) + YR(t) + Firm(i) + error(i,t) for the years 2003 to 2005 using the NBER patent data used by Tian (2014). Year fixed effects YR(i) and firm fixed effects Firm(i) fixed effects are included in all the regressions. Coefficient estimates are shown. The standard errors are clustered by firm. ***(**)(*) denotes significance at the 1%(5%)(10%) two-tailed level.
Dependent variable (1)
INNOV_PAT(t+1)
Liquidity(t) 0.01550 * LN_MV(t) 0.05818 *** RDTA(t) -0.40989 ROA -0.09381 PPETA(t) 0.23270 LEV(t) -0.09802 CAPEXTA(t) -0.25895 Q(t) -0.02138 *
Year and Firm fixed effects Included Number of observations used 11,885 R2 0.6222
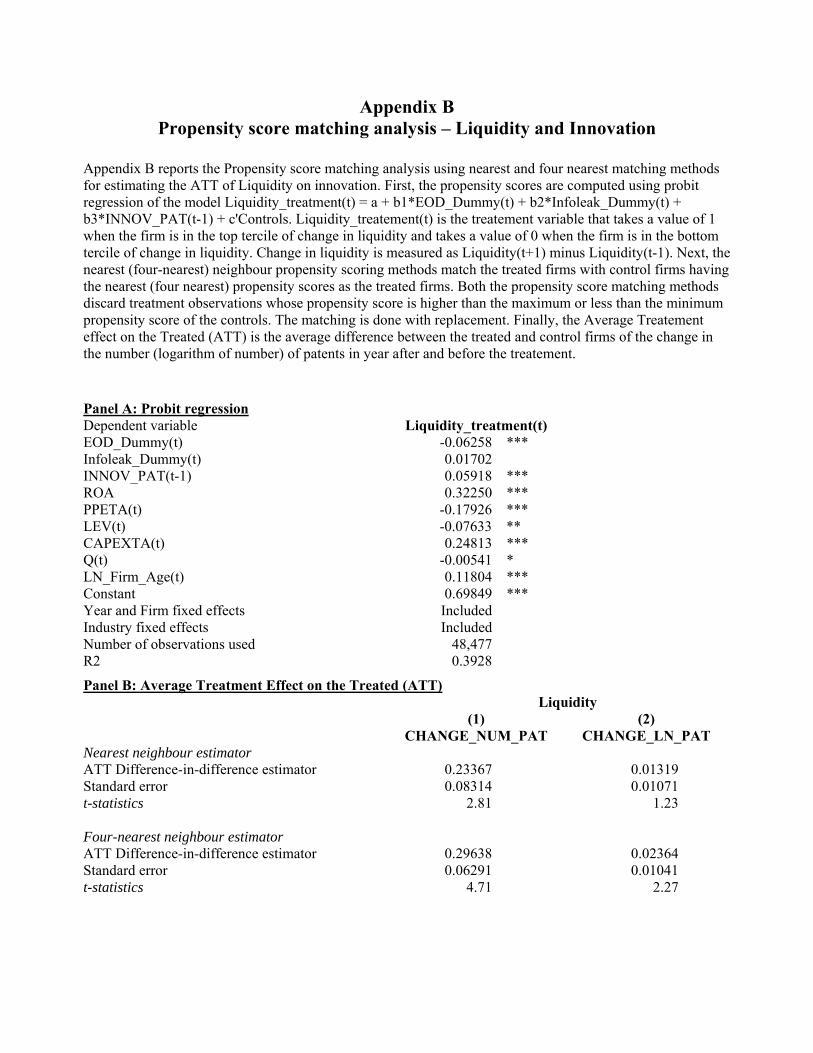
Appendix B Propensity score matching analysis – Liquidity and Innovation
Appendix B reports the Propensity score matching analysis using nearest and four nearest matching methods for estimating the ATT of Liquidity on innovation. First, the propensity scores are computed using probit regression of the model Liquidity_treatment(t) = a + b1*EOD_Dummy(t) + b2*Infoleak_Dummy(t) + b3*INNOV_PAT(t-1) + c'Controls. Liquidity_treatement(t) is the treatement variable that takes a value of 1 when the firm is in the top tercile of change in liquidity and takes a value of 0 when the firm is in the bottom tercile of change in liquidity. Change in liquidity is measured as Liquidity(t+1) minus Liquidity(t-1). Next, the nearest (four-nearest) neighbour propensity scoring methods match the treated firms with control firms having the nearest (four nearest) propensity scores as the treated firms. Both the propensity score matching methods discard treatment observations whose propensity score is higher than the maximum or less than the minimum propensity score of the controls. The matching is done with replacement. Finally, the Average Treatement effect on the Treated (ATT) is the average difference between the treated and control firms of the change in the number (logarithm of number) of patents in year after and before the treatement.
Panel A: Probit regression
Dependent variable Liquidity_treatment(t)
EOD_Dummy(t) -0.06258 ***
Infoleak_Dummy(t) 0.01702
INNOV_PAT(t-1) 0.05918 ***
ROA 0.32250 ***
PPETA(t) -0.17926 ***
LEV(t) -0.07633 **
CAPEXTA(t) 0.24813 ***
Q(t) -0.00541 *
LN_Firm_Age(t) 0.11804 ***
Constant 0.69849 ***
Year and Firm fixed effects Included Industry fixed effects Included Number of observations used 48,477 R2 0.3928
Panel B: Average Treatment Effect on the Treated (ATT) Liquidity
(1)
CHANGE_NUM_PAT (2)
CHANGE_LN_PAT Nearest neighbour estimator ATT Difference-in-difference estimator 0.23367 0.01319 Standard error 0.08314 0.01071 t-statistics 2.81 1.23 Four-nearest neighbour estimator ATT Difference-in-difference estimator 0.29638 0.02364 Standard error 0.06291 0.01041 t-statistics 4.71 2.27

57
ONLINE APPENDIX
In this Online Appendix we show robustness to the subset of firms that only have a patent
(Table A.I), the subset of firms excluding China (Table A.II), and the subset of financial crisis
versus non-crisis period.
Table A.I indicates that end-of-day manipulation negatively affects patents in all
robustness checks. Information leakage negatively patents applied for, but positively affects
patents applied for and granted, suggesting that insiders take advantage of superior knowledge
when then apply for a high quality patent.
Table A.II shows that the results are consistent with the exclusion of China from the
sample.
Table A.III shows that the results for end of day manipulation are robust in the
subsamples including and excluding the crisis years. Table A.III also shows that the results for
information leakage hold in the non-crisis period but not in the crisis period. The intuition is as
follows. At any time there is the negative impact of end-of-day manipulation and information
leakage on innovation due to short termism and poor focus for both types of manipulation. For
information leakage, however, there is a counter force of profiting more if you are an insider. In
bad economic times that counter force is less profitable for insiders, and the risk of being caught
is greater because regulators are especially diligent in crisis periods. As such, the former effect
of short-termism associated with information leakage is stronger than the latter effect of expected
profits during crisis periods.

58
Table A.I Only patenting firms
Table A.I Panel A [B] reports Firm Random Effects regression results, that includes only firms with at least one patent, of the model INNOV_PAT(i,t+1) [INNOV_CITE(i,t+1)] = a + b1*EOD_Dummy_First(i, t) + b2*EOD_Dummy_Subsequent(i,t) + c*Infoleak_Dummy(i,t) + c1'Country_variable(Enforcement and IPR) + c2'Interaction_Country_variable_EOD + c3*Interaction_Liquidity_EOD + d'Controls + YR(t) + Sector(i) + error(i,t). INNOV_PAT(i,t+1) is the natural logarithm of one plus firm i’s total number of patents filed in year t+1. INNOV_CITE(i,t+1) is the natural logarithm of one plus firm i’s total number of citations received for patents filed in year t+1, which has been adjusted for truncation bias using the citation lag distribution. EOD_Dummy_First [EOD_Dummy_Subsequent] indicates if a firm i has experienced end‐of‐day (EOD) dislocation in year t, under the condition that firm i never previously experienced [has previously experienced] EOD dislocation. Infoleak_Dummy indicates if a firm i has experienced information leakage in year t. Similarly, Num_EOD_Cases_First, Num_EOD_Cases_Subsequent and Num_Infoleak_cases measures the number of times a firm i has experienced EOD or Information leakage in year t. EOD_Dummy_Positive(t) indicates if a firm i has experienced more positive EOD price dislocations than negative price dislocations in year t. Liquidity(t) is the natural logarithm of the inverse of the AMIHUD illiquidity variable. Enforcement_index is formed by adding the rule of law, efficiency of judiciary, risk of expropriation, repudiation of contracts by government and corruption variables provided by LLSV and scaling index to be between 0 and 1 (1998). Intellectual property rights index, IPR_Index, is obtained from the International property rights index report. Interaction_Liquidity_EOD, Interaction_Enforcement_EOD and Interaction_IPR_EOD interacts the Liquidity(t), Enforcement_index(t) and IPR_Index(t) respectively with the EOD_Dummy_Subsequent variable. Market value decile to which firm i belongs within each country‐year (MV_Decile(t)), Return on Assets (ROA(t)), Property plant and equity to total assets (PPTA(t)), leverage measured as the book value of debt to book value of assets (LEV(t)), Capital expenditure to total assets (CAPEXTA(t)), Tobins Q (Q(t)) and natural logarithm of one plus firm i’s age, approximated by the number of years listed on Datastream (LN_Firm_Age(t)) are used as controls in all the models are used as controls in all the models. Year fixed effects and industry fixed effects are included in all the regressions. Coefficient estimates are shown. The standard errors are clustered by firm. ***(**)(*) denotes significance at the 1%(5%)(10%) two‐tailed level.
Panel A: Innovation measured by INNOV_PAT(i,t+1)
(1) Simple EOD Dummy
(2)
EOD Dummy
(3)
Number of EOD / Infoleak cases
EOD_Dummy(t) ‐0.03751 ***
EOD_Dummy_First(t) ‐0.00698 EOD_Dummy_Subsequent(t) ‐0.06540 *** Infoleak_dummy(t) ‐0.01393 Num_EOD_Cases_First(t) ‐0.00007 Num_EOD_Cases_Subsequent(t) ‐0.00480 ***
Num_Infoleak_cases(t) ‐0.01347 ‐0.00856 Liquidity(t) 0.07656 *** 0.07624 *** 0.07603 ***
IPR_Index 0.19115 *** 0.19251 *** 0.19211 ***
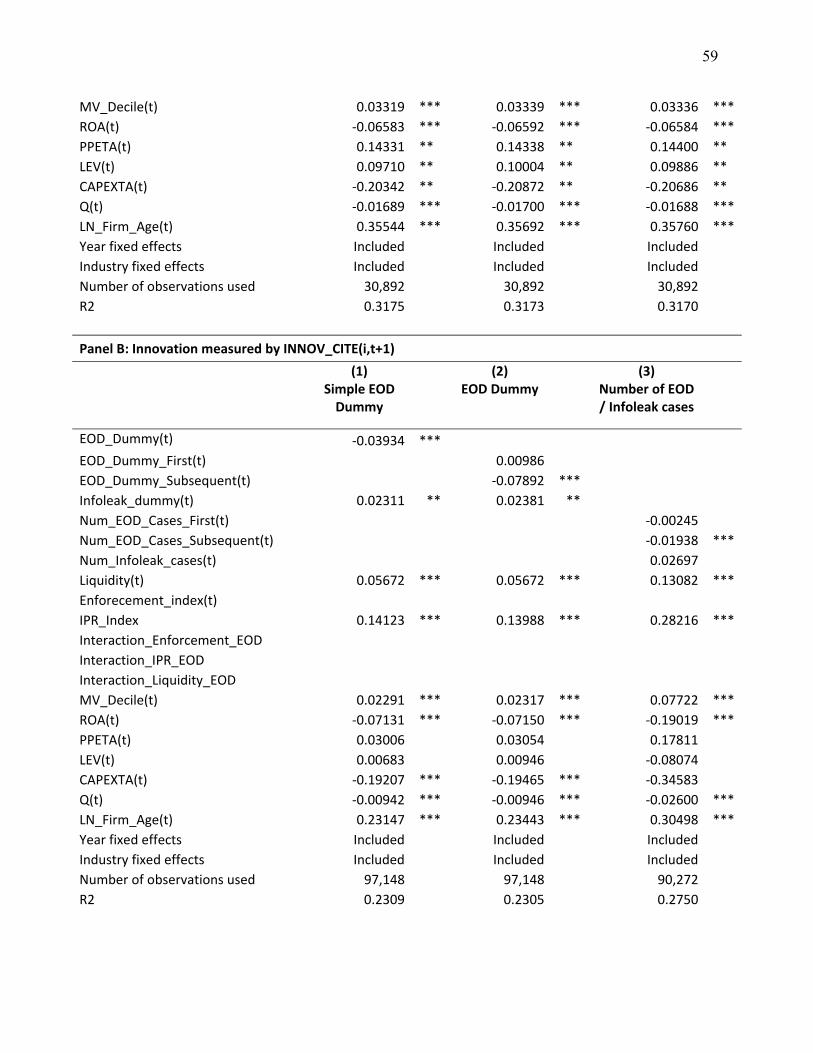
59
MV_Decile(t) 0.03319 *** 0.03339 *** 0.03336 ***
ROA(t) ‐0.06583 *** ‐0.06592 *** ‐0.06584 ***
PPETA(t) 0.14331 ** 0.14338 ** 0.14400 **
LEV(t) 0.09710 ** 0.10004 ** 0.09886 **
CAPEXTA(t) ‐0.20342 ** ‐0.20872 ** ‐0.20686 **
Q(t) ‐0.01689 *** ‐0.01700 *** ‐0.01688 ***
LN_Firm_Age(t) 0.35544 *** 0.35692 *** 0.35760 ***
Year fixed effects Included Included Included Industry fixed effects Included Included Included Number of observations used 30,892 30,892 30,892 R2 0.3175 0.3173 0.3170
Panel B: Innovation measured by INNOV_CITE(i,t+1)
(1) Simple EOD Dummy
(2)
EOD Dummy
(3)
Number of EOD / Infoleak cases
EOD_Dummy(t) ‐0.03934 *** EOD_Dummy_First(t) 0.00986 EOD_Dummy_Subsequent(t) ‐0.07892 *** Infoleak_dummy(t) 0.02311 ** 0.02381 **
Num_EOD_Cases_First(t) ‐0.00245
Num_EOD_Cases_Subsequent(t) ‐0.01938 ***
Num_Infoleak_cases(t) 0.02697 Liquidity(t) 0.05672 *** 0.05672 *** 0.13082 ***
Enforecement_index(t) IPR_Index 0.14123 *** 0.13988 *** 0.28216 ***
Interaction_Enforcement_EOD Interaction_IPR_EOD Interaction_Liquidity_EOD MV_Decile(t) 0.02291 *** 0.02317 *** 0.07722 ***
ROA(t) ‐0.07131 *** ‐0.07150 *** ‐0.19019 ***
PPETA(t) 0.03006 0.03054 0.17811 LEV(t) 0.00683 0.00946 ‐0.08074 CAPEXTA(t) ‐0.19207 *** ‐0.19465 *** ‐0.34583 Q(t) ‐0.00942 *** ‐0.00946 *** ‐0.02600 ***
LN_Firm_Age(t) 0.23147 *** 0.23443 *** 0.30498 ***
Year fixed effects Included Included Included Industry fixed effects Included Included Included Number of observations used 97,148 97,148 90,272 R2 0.2309 0.2305 0.2750

60
Table A.II Excluding China
Table A.II Panel A [B] reports Firm Random Effects regression results, excluding China, of the model INNOV_PAT(i,t+1) [INNOV_CITE(i,t+1)] = a + b1*EOD_Dummy_First(i, t) + b2*EOD_Dummy_Subsequent(i,t) + c*Infoleak_Dummy(i,t) + c1'Country_variable(Enforcement and IPR) + c2'Interaction_Country_variable_EOD + c3*Interaction_Liquidity_EOD + d'Controls + YR(t) + Sector(i) + error(i,t). INNOV_PAT(i,t+1) is the natural logarithm of one plus firm i’s total number of patents filed in year t+1. INNOV_CITE(i,t+1) is the natural logarithm of one plus firm i’s total number of citations received for patents filed in year t+1, which has been adjusted for truncation bias using the citation lag distribution. EOD_Dummy_First [EOD_Dummy_Subsequent] indicates if a firm i has experienced end‐of‐day (EOD) dislocation in year t, under the condition that firm i never previously experienced [has previously experienced] EOD dislocation. Infoleak_Dummy indicates if a firm i has experienced information leakage in year t. Similarly, Num_EOD_Cases_First, Num_EOD_Cases_Subsequent and Num_Infoleak_cases measures the number of times a firm i has experienced EOD or Information leakage in year t. EOD_Dummy_Positive(t) indicates if a firm i has experienced more positive EOD price dislocations than negative price dislocations in year t. Liquidity(t) is the natural logarithm of the inverse of the AMIHUD illiquidity variable. Enforcement_index is formed by adding the rule of law, efficiency of judiciary, risk of expropriation, repudiation of contracts by government and corruption variables provided by LLSV and scaling index to be between 0 and 1 (1998). Intellectual property rights index, IPR_Index, is obtained from the International property rights index report. Interaction_Liquidity_EOD, Interaction_Enforcement_EOD and Interaction_IPR_EOD interacts the Liquidity(t), Enforcement_index(t) and IPR_Index(t) respectively with the EOD_Dummy_Subsequent variable. Market value decile to which firm i belongs within each country‐year (MV_Decile(t)), Return on Assets (ROA(t)), Property plant and equity to total assets (PPTA(t)), leverage measured as the book value of debt to book value of assets (LEV(t)), Capital expenditure to total assets (CAPEXTA(t)), Tobins Q (Q(t)) and natural logarithm of one plus firm i’s age, approximated by the number of years listed on Datastream (LN_Firm_Age(t)) are used as controls in all the models are used as controls in all the models. Year fixed effects and industry fixed effects are included in all the regressions. Coefficient estimates are shown. The standard errors are clustered by firm. ***(**)(*) denotes significance at the 1%(5%)(10%) two‐tailed level.
Panel A: Innovation measured by INNOV_PAT(i,t+1)
(1) Simple EOD Dummy
(2)
EOD Dummy
(3)
Number of EOD / Infoleak cases
EOD_Dummy(t) ‐0.00930 ***
EOD_Dummy_First(t) 0.00107 EOD_Dummy_Subsequent(t) ‐0.01796 *** Infoleak_dummy(t) ‐0.00616 ‐0.00601 Num_EOD_Cases_First(t) 0.00047 Num_EOD_Cases_Subsequent(t) ‐0.00126 ***
Num_Infoleak_cases(t) ‐0.00365 Liquidity(t) 0.02414 *** 0.02413 *** 0.02398 ***
Enforecement_index IPR_Index 0.08775 *** 0.08822 *** 0.08841 ***
Interaction_Enforcement_EOD

61
Interaction_IPR_EOD Interaction_Liquidity_EOD MV_Decile(t) 0.00680 *** 0.00686 *** 0.00686 ***
ROA(t) ‐0.01865 *** ‐0.01872 *** ‐0.01871 ***
PPETA(t) 0.01283 0.01296 0.01288 LEV(t) 0.02487 ** 0.02554 ** 0.02536 **
CAPEXTA(t) ‐0.05726 *** ‐0.05785 *** ‐0.05741 ***
Q(t) ‐0.00415 *** ‐0.00416 *** ‐0.00414 ***
LN_Firm_Age(t) 0.30249 *** 0.30305 *** 0.30333 ***
Year fixed effects Included Included Included Industry fixed effects Included Included Included Number of observations used 90,272 90,272 90,272 R2 0.2507 0.2509 0.2507
Panel B: Innovation measured by INNOV_CITE(i,t+1) (1)
Simple EOD Dummy
(2)
EOD Dummy
(3)
Number of EOD / Infoleak cases
EOD_Dummy(t) ‐0.03934 *** EOD_Dummy_First(t) 0.00986 EOD_Dummy_Subsequent(t) ‐0.07892 ***
Infoleak_dummy(t) 0.02311 ** 0.02381 **
Num_EOD_Cases_First(t) 0.00136 Num_EOD_Cases_Subsequent(t) ‐0.00494 ***
Num_Infoleak_cases(t) 0.01951 **
Liquidity(t) 0.05672 *** 0.05672 *** 0.05634 ***
Enforecement_index IPR_Index 0.14123 *** 0.13988 *** 0.14123 ***
Interaction_Enforcement_EOD Interaction_IPR_EOD Interaction_Liquidity_EOD MV_Decile(t) 0.02291 *** 0.02317 *** 0.02305 ***
ROA(t) ‐0.07131 *** ‐0.07150 *** ‐0.07148 ***
PPETA(t) 0.03006 0.03054 0.03059 LEV(t) 0.00683 0.00946 0.00856 CAPEXTA(t) ‐0.19207 *** ‐0.19465 *** ‐0.19302 ***
Q(t) ‐0.00942 *** ‐0.00946 *** ‐0.00941 ***
LN_Firm_Age(t) 0.23147 *** 0.23443 *** 0.23476 ***
Year fixed effects Included Included Included Industry fixed effects Included Included Included Number of observations used 90,272 90,272 90,272 R2 0.2309 0.2305 0.2750
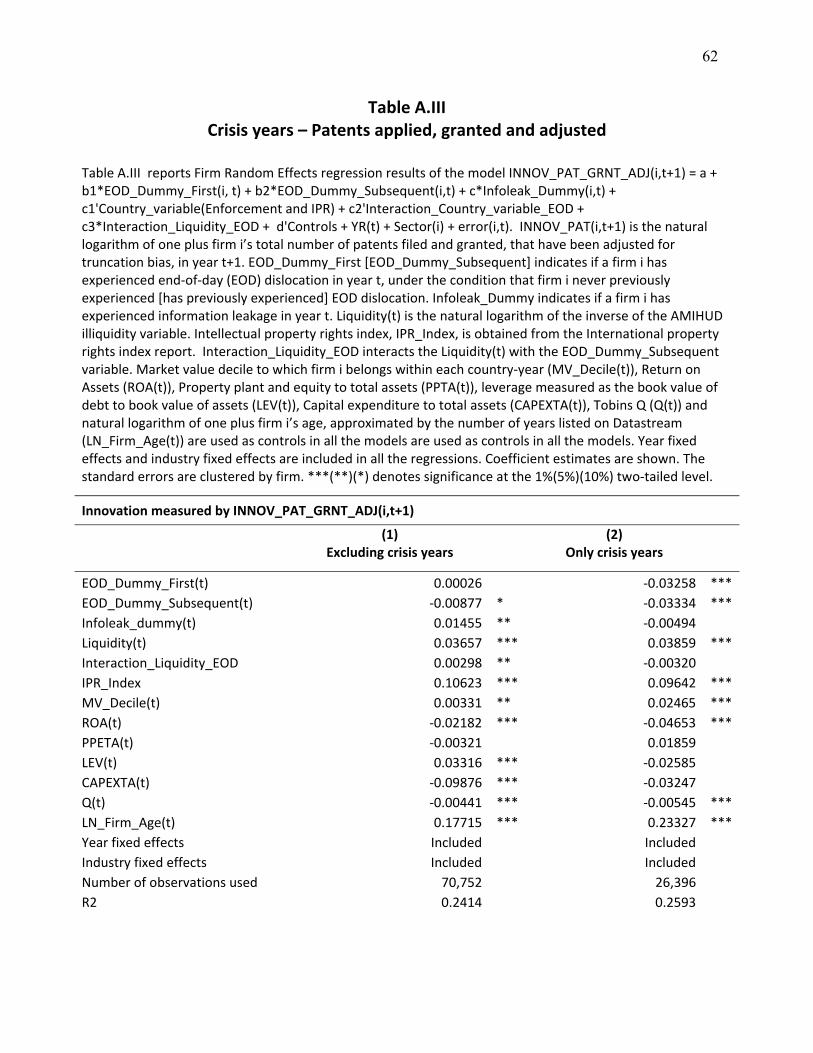
62
Table A.III Crisis years – Patents applied, granted and adjusted
Table A.III reports Firm Random Effects regression results of the model INNOV_PAT_GRNT_ADJ(i,t+1) = a + b1*EOD_Dummy_First(i, t) + b2*EOD_Dummy_Subsequent(i,t) + c*Infoleak_Dummy(i,t) + c1'Country_variable(Enforcement and IPR) + c2'Interaction_Country_variable_EOD + c3*Interaction_Liquidity_EOD + d'Controls + YR(t) + Sector(i) + error(i,t). INNOV_PAT(i,t+1) is the natural logarithm of one plus firm i’s total number of patents filed and granted, that have been adjusted for truncation bias, in year t+1. EOD_Dummy_First [EOD_Dummy_Subsequent] indicates if a firm i has experienced end‐of‐day (EOD) dislocation in year t, under the condition that firm i never previously experienced [has previously experienced] EOD dislocation. Infoleak_Dummy indicates if a firm i has experienced information leakage in year t. Liquidity(t) is the natural logarithm of the inverse of the AMIHUD illiquidity variable. Intellectual property rights index, IPR_Index, is obtained from the International property rights index report. Interaction_Liquidity_EOD interacts the Liquidity(t) with the EOD_Dummy_Subsequent variable. Market value decile to which firm i belongs within each country‐year (MV_Decile(t)), Return on Assets (ROA(t)), Property plant and equity to total assets (PPTA(t)), leverage measured as the book value of debt to book value of assets (LEV(t)), Capital expenditure to total assets (CAPEXTA(t)), Tobins Q (Q(t)) and natural logarithm of one plus firm i’s age, approximated by the number of years listed on Datastream (LN_Firm_Age(t)) are used as controls in all the models are used as controls in all the models. Year fixed effects and industry fixed effects are included in all the regressions. Coefficient estimates are shown. The standard errors are clustered by firm. ***(**)(*) denotes significance at the 1%(5%)(10%) two‐tailed level.
Innovation measured by INNOV_PAT_GRNT_ADJ(i,t+1)
(1) Excluding crisis years
(2)
Only crisis years
EOD_Dummy_First(t) 0.00026 ‐0.03258 ***
EOD_Dummy_Subsequent(t) ‐0.00877 * ‐0.03334 ***
Infoleak_dummy(t) 0.01455 ** ‐0.00494 Liquidity(t) 0.03657 *** 0.03859 ***
Interaction_Liquidity_EOD 0.00298 ** ‐0.00320 IPR_Index 0.10623 *** 0.09642 ***
MV_Decile(t) 0.00331 ** 0.02465 ***
ROA(t) ‐0.02182 *** ‐0.04653 ***
PPETA(t) ‐0.00321 0.01859 LEV(t) 0.03316 *** ‐0.02585 CAPEXTA(t) ‐0.09876 *** ‐0.03247 Q(t) ‐0.00441 *** ‐0.00545 ***
LN_Firm_Age(t) 0.17715 *** 0.23327 ***
Year fixed effects Included Included Industry fixed effects Included Included Number of observations used 70,752 26,396 R2 0.2414 0.2593