market liberalization and its relationship with
TRANSCRIPT


MARKET LIBERALIZATION AND ITS RELATIONSHIP WITH
MARKET LIBERALIZATION AND ITS RELATIONSHIP WITH MARKET STRUCTURE, CONDUCT AND PERFORMANCE OF THE FOOD PROCESSING INDUSTRY IN ASEAN ECONOMIES
Editors Tengku Mohd Ariff Tengku Ahmad
Mad Nasir Shamsudin
APEC Agricultural Technical Cooperation Working Group
April 2008
Malaysian Agricultural Research & Development
Institute (MARDI)

ATC 01/2006T Printed by: Malaysian Agricultural Research & Development Institute P.O. Box 12301 General Post Office 50774 Kuala Lumpur Malaysia Ph: + 6 03 8943 7332 Fax: + 6 03 8948 6799 Website: www.mardi.gov.my Produced for APEC Secretariat 35 Heng Mui Keng Terrace Singapore 119616 Tel: (65) 67756012 Fax: (65) 67756013 Email: [email protected] Website: www.apec.org © 2008 APEC Secretariat APEC#208-AT-01.2

i
Table of Contents
Page No
1 Market Liberalization and Its Relationship with Market Structure, Conduct and Performance of the Food Processing Industry in ASEAN Economies by Tengku Mohd Ariff Tengku Ahmad and Mad Nasir Shamsudin
1
2 Market Liberalization and Its Relationship with Market Structure, Conduct and Performance of the Food Processing Industry in Brunei by Haji Anjah @ Amzah bin Haji Abdul Rahman
80
3 Market Liberalization and Its Relationship with Market Structure, Conduct and Performance of the Food Processing Industry in Indonesia by Adrian D. Lubis, Yati Nuryati, Arief Adang and Erwidodo
104
4 Market Liberalization and Its Relationship with Market Structure, Conduct and Performance of the Food Processing Industry in Malaysia by Abu Kasim Ali and Chubashini Suntharalingam
169
5 Market Liberalization and Its Relationship with Market Structure, Conduct and Performance of The Food Processing Industry in Thailand by Boonjit Titapiwatanakun
229
6 Market Liberalization and Its Relationship with Market Structure, Conduct And Performance of the Food Processing Industry in The Philippines by Minda C. Mangabat
279
7 Market Liberalization and Its Relationship with Market Structure, Conduct and Performance of the Food Processing Industry in Viet Nam by Pham Quang Dieu
411

2
Market Liberalization and Its Relationship with Market Structure, Conduct and Performance of the Food Processing Industry in ASEAN Economies by Tengku Mohd Ariff Tengku Ahmad and Mad Nasir Shamsudin
Table of Contents Page 1. Introduction 6 2. Theoretical Framework and Methodology 7 2.1 Market Structure, Conduct and Performance Paradigm 7 2.1.1 Market Structure 7 2.1.2 Market Conduct 8 2.1.3 Market Performance 10 2.2 Conceptual Framework for S-C-P Paradigm 10 2.3 Empirical Evidence on S-C-P Paradigm 13 2.4 Measurement of S-C-P Indicators 20 2.4.1 Measures of Market Structure 20 2.4.1.1 Absolute Concentration Measures 22 2.4.1.2 Relative Concentration Measures 23 2.4.2 Measure of Market Conduct 25 2.4.2.1 Advertising Intensity 25 2.4.3 Measures of Market Performance 26 2.4.3.1 Rate of Return on Assets after Tax 27 2.4.3.2 Rate of Return on Stockholders’ Equity after tax 27 2.4.3.3 Sales Ratio: Return on Sales after Tax 27 2.4.4 Endogenousity of S-C-P Model (Optional) 28 2.4.4.1 Model Specification 28 3 Status of the ASEAN Food Processing Industry 30 3.1 Performance 30 3.2 Drivers for Growth 33 3.2.1 Demand-side Drivers 33 3.2.1.1 Population and Income Growth 33 3.2.1.2 Changing Patterns of Food Consumption 33 3.2.1.3 Urbanization 34 3.2.1.4 Global Demand 35 3.2.2 Supply-side Drivers 35 3.2.2.1 Industrialization Policy 35 3.2.2.2 Foreign Direct Investment 35 4 Industry Structure 36 5 Issues and Challenges 37 6 The Trade Liberalization Environment 38 6.1 The World Trade Organization (WTO) 39 6.1.1 The UR Agreements and Outcomes 39 6.2 The ASEAN Free Trade Area (AFTA) 41 6.3 Asia –Pacific Economic Cooperation Forum (APEC) 42 7 The Impacts of Trade Liberalization: Structure, Conduct and
Performance 43
7.1 The Fruit and Vegetable Based Industrial Cluster: Processed 43
3
Mango of the Philippines and Processed Fruits and Vegetables of Thailand
7.1.2 Market Structure 43 7.1.3 Market Conduct 45 7.1.4 Market Performance 45 7.2 The Fish and Seafood Based Industrial Cluster: Processed Tuna of
the Philippines, Seafood Industry of Thailand and Fish Products of Indonesia
46
7.2.1 Market Structure 46 7.2.2 Market Conduct 48 7.2.3 Market Performance 48 7.3 The Flour Industry Cluster: Indonesia and Thailand 50 7.3.1 Market Structure 50 7.4 The Soy-Sauce Industry Cluster: Philippines and Indonesia 54 7.4.1 Market Structure 54 7.4.2 Market Conduct 55 7.4.3 Market Performance 55 7.5 The Rice Milling Industry Cluster; Thailand and Vietnam 57 7.5.1 Market Structure 57 7.5.2 Market performance 58 7.6 Carageenan – The Case of The Philippines 60 7.6.1 Market Structure 60 7.6.2 Market Conduct 60 7.6.3 Market Performance 61 7.7 Desiccated Coconut - The Case of The Philippines 62 7.7.1 Market Structure 62 7.7.2 Market Conduct 63 7.7.3 Market Performance 64 7.8 Sauces, Dressings and Condiments – The Case of Malaysia 65 7.8.1 Market Structure 65 7.8.1.1 Concentration ratio 65 7.8.2 Market Conduct 65 7.8.2.1 Promotions 65 7.8.2.2 Advertising 66 7.8.2.3 New product development 66 7.8.3 Market Performance 66 7.8.3.1 Return on Sales (ROS) 66 7.8.3.2 Return on Asset 67 7.9 Sweet and Savory Snacks – the case of Malaysia 67 7.10 Salient features 69 8 Meeting The Challenge of The Trade Liberalization: the Policy
Response 70
9 References 73 10 Lessons Learnt 78 11 Next Steps 79

4
List of Tables
Table 3.1: Contribution of the Agricultural Sector to GDP (%), Selected ASEAN Countries, 1990 - 2005
31
Table 3.2: Contribution of Food Processing Industry to GDP (%) 32 Table 3.3: Growth of Output (Value-added) of Food Processing Industry (%)
32
Table 3.4: Structure of the Food Processing Industry in Selected ASEAN Economies, 2005
36
Table 3.5: The main elements of the Agreement on Agriculture of the WTO 40 Table 7.1: Thai canned fruit and vegetable processors, concentration ratios, and HHI
44
Table 7.2: Number of canned fruit and vegetable processors, Thailand 44 Table 7.3: Rate of return on sales (ROS) after tax of mango processing firms Philippines, 1997-2005
45
Table 7.4: Average net profit of canned fruit and vegetable processors, Thailand
46
Table 7.5: Thai sea food processors, concentration rations, and HHI 47 Table 7.6: Market performance measures of tuna canneries, Philippines, 1997-2005
49
Table 7.7: Thai average net profit sea food processors (firms), and total processors
50
Table 7.8: Thai number of establishment of flour mills, average principal revenue of firm and market share by size of firms
52
Table 7.9: Thai average net profit of flour mills by size and total net profit of all flour mills
52
Table 7.10: Thai flour mills, concentration ratios, and HHI 53 Table 7.11: Market performance measures of soy sauce manufacturers, Philippines
56
Table 7.12: Thai number of establishment of rice mills, concentration rations, and HHI
57
Table 7.13: Concentration in the rice industry, Vietnam 58 Table 7.14: Thai number of establishment of rice mills, average principal revenue of firm and market share by size of firms
59
Table 7.15: Thai average net profit of rice mills by size and total net profit of all rice mills
59
Table 7.16: Advertising-sales ratio of desiccators, Philippines, 1998-2005 61 Table 7.17: Market performance measures of seaweed/ carageenan processors, Philippines, 1997-2005
62
Table 7.18: Advertising-sales ratio of desiccators, Philippines, 1998-2005 63 Table 7.19: Market performance measures of desiccators, Philippines, 1998-2005
64
Table 7.20: Performance of sauces producer: Return on sales 67 Table 7.21: Performance of sauces producer: Return on Asset (ROA) 67 Table 7.22: Four Largest Companies’ Market Shares in Malaysia’s Sweet and Savory Snacks Segment 2001-2005 (%)
68
Table 7.23 : Performance of sauces producer: Return on Asset (ROA) 69
5
List of Figures
Figure 2.1: A Model of Structure-Conduct-Performance Paradigm 12 Figure 2.2: Indicators for Market Structure, Conduct and Performance 21 Figure 2.3: Lorenz Curve and Gini Coefficient 23 Figure 3.1: Changing patterns of food consumption as income rises 34 Figure 7.1: Concentration ratios of mango processing firms, Philippines 43 Figure 7.2: Concentration ratios of tuna canneries, Philippines, 1997-2005 46 Figure 7.3: Concentration Ratio of Fish Processing Industry, Indonesia, 1995 to 2005
47
Figure 7.4: Market concentration ratio of flour industry, Indonesia 50 Figure 7.5: Concentration ratios of soy sauce manufacturers, Philippines, 1999-2005
54
Figure 7.6: Concentration Ratio of the Soy-Sauce Industry, Indonesia 55 Figure 7.7 : ROA for soy sauce industry in Indonesia 56 Figure 7.8: Concentration ratios of carageenan processors, Philippines 60 Figure 7.9: Concentration ratios of desiccators, Philippines, 1998-2005 63 Figure 7.10: Four Largest Companies’ Market Shares in Malaysia’s Sauces, Dressings and Condiments Segment 2001-2005 (%)
65
Figure 7.11: Four Largest Companies’ Market Shares in Malaysia’s Sweet and Savory Snacks Segment 2001-2005 (%)
68

6
1. Introduction Literature had shown that trade liberalization in general enhanced total economic welfare and made societies better off. From the Ricardo days of the 19th century, when the theory and concept of comparative advantage was initially first conceived by British Economist David Ricardo, there were no short of evidences showing that there were gains to be made from freer trade. A fairly comprehensive literature survey by Havrylyshyn (1990) followed by another survey by Jayanthakumara (2002) on impacts of trade liberalization on manufacturing in developing countries in most cases showed that economies practicing relatively more liberal trade policies were doing better in terms of export performance, productivity and economic growth as compared to that less liberal ones. It was argued that trade liberalization opens up markets and promote export through the “natural” workings of comparative advantage. By exposing domestic markets to foreign competition past studies showed evidences of “domestic price disciplining” and the removal of excess profits of domestic firms with market power operating in oligopolistic markets (referred to as the “import discipline hypothesis”). The intensifying of competition removed inefficiencies which would in turn increase productivity (Vendoorn’s Law).
However, it was also known that in a number of cases that “unmanaged” liberalization could result in large foreign firms establishing themselves as oligopolies or even monopolies in the newly liberalized market. With market dominance, these firms could behave against competitive market principles such as engaging in anticompetitive practices. If this happens, new entry barriers emerged and erected in the industry, there-by again distorting markets. In contrast to developed economies where the legal infrastructure is adequately developed to tackle such issues, many developing economies do not have such a framework. As such, post liberalization developments in these economies can undermine what trade liberalization was intended for in the first place.
The above points to the need for trade liberalization initiatives and its effects on the local markets, especially in developing economies to be thoroughly understood to enable the respective governments to be productively engaged in developing the required “foundation infrastructure” to counter the negative development that may evolve subsequent to liberalization.
The other more important case in point is the issue of existing small and medium market players (SMEs), who were operating competitively among themselves, albeit under protection, before liberalization, which most likely would be squeezed out of business by the new big foreign firms or through the flooding of cheaper import substitutes. While this development is inevitable in moving towards freer trade, it is also important that domestic players also benefit from the liberalization measures, failing which social discontent may result.1
In most developing countries, SMEs accounted for more than 90 percent of manufacturing companies although they contributed to less than 20 percent of the total 1 This point had been extensive argued by Stigligtz (2002)
7
output. The threat of cheaper imports and bigger foreign or even domestic companies establishing themselves and exercising their market power through monopolistic practices are very real in more liberalized environment. Through an industrial organization study using the structure, conduct and performance analysis, this study aims to investigate and uncover the developments that took place in this on-going market liberalization process that is taking place in this region as well examine its implications from the economic and socio-economic dimensions to the developing country members of ASEAN. The specific objectives were
• To assess the structure and conduct of selected processed food market in APEC member economies,
• To determine the market performance of the selected processed food in the APEC members economics, and
• To recommend the policies and strategies in order to increase market efficiency of the processed in APEC member economies.
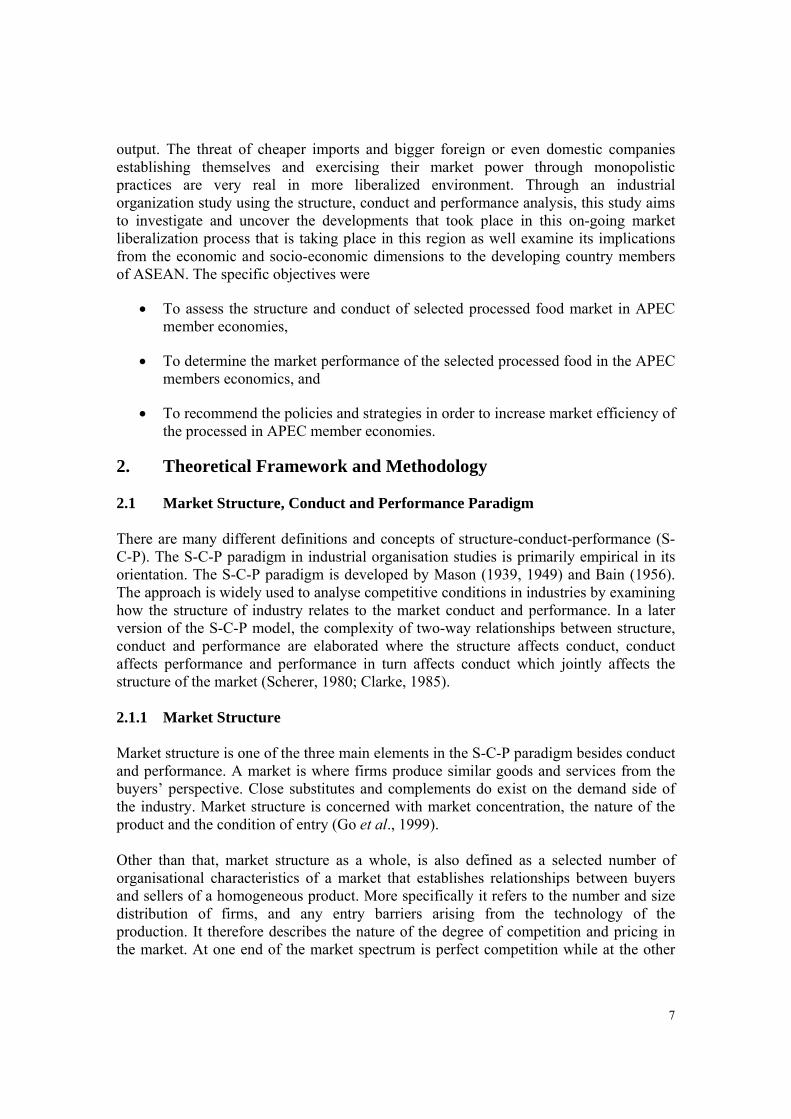
2. Theoretical Framework and Methodology 2.1 Market Structure, Conduct and Performance Paradigm There are many different definitions and concepts of structure-conduct-performance (S-C-P). The S-C-P paradigm in industrial organisation studies is primarily empirical in its orientation. The S-C-P paradigm is developed by Mason (1939, 1949) and Bain (1956). The approach is widely used to analyse competitive conditions in industries by examining how the structure of industry relates to the market conduct and performance. In a later version of the S-C-P model, the complexity of two-way relationships between structure, conduct and performance are elaborated where the structure affects conduct, conduct affects performance and performance in turn affects conduct which jointly affects the structure of the market (Scherer, 1980; Clarke, 1985). 2.1.1 Market Structure Market structure is one of the three main elements in the S-C-P paradigm besides conduct and performance. A market is where firms produce similar goods and services from the buyers’ perspective. Close substitutes and complements do exist on the demand side of the industry. Market structure is concerned with market concentration, the nature of the product and the condition of entry (Go et al., 1999). Other than that, market structure as a whole, is also defined as a selected number of organisational characteristics of a market that establishes relationships between buyers and sellers of a homogeneous product. More specifically it refers to the number and size distribution of firms, and any entry barriers arising from the technology of the production. It therefore describes the nature of the degree of competition and pricing in the market. At one end of the market spectrum is perfect competition while at the other

8
extreme end is pure monopoly. Market structures between these two represent varying degrees of imperfect competition (Rugayah, 1993a). Competition is defined as existing markets where enterprises are allowed to grow with unconditional freedom (Reid, 1987). Sosnick (1958) and Scherer (1980) also stated that current emphasis of competition policies generally focuses on “workable competition” rather than the perfect competition of theoretical microeconomics. The S-C-P approach postulates that as market structure deviates away from the paradigm of perfect competition, the extent of competitiveness of the market will decrease and consequently a decline in market efficiency will take place (Scarborough and Kydd, 1992; Scott, 1995). Concentration of establishment in the hands of a few firms in an industry is generally criticised on the grounds of competition loss. A market is said to be more concentrated when there are fewer number of firms in production or the more unequal the distribution of market shares. The higher the concentration level in an industry, the higher would be the degree of monopoly and absence of competition. Nonetheless, high concentration brings greater innovation and technological change and thus the benefits associated with it may perhaps be sufficient to offset the adverse monopoly effects of high concentration (Goldschmid et al., 1974). Competitive market and low concentration of an industry indicate low market power held by firms. According to Alvorado (1988), market power refers to the condition where the providers of a service can consistently charge a price above those that would be established by competitive market. The author also mentioned the market power as the concentration of resources in the hands of a single producer or an insufficient numbers of producers. It enables a firm to set price above marginal cost. Dessalegn et al. (1998) mentioned that market concentration refers to the number and relative size distribution of buyers or sellers in a market. He also indicated the existence of some degree of positive relationship between market concentration and gross marketing margin. 2.1.2 Market Conduct Market conduct is defined as the pattern of behaviour that firms follow in adopting or adjusting to the market in which they operate to achieve well-defined goal or goals (Barthwal, 1984). Meanwhile, according to Suter and Henneberry (1996), conduct in markets also refers to the coordination of decision making in order to determine what prices to charge, what outputs to produce, what product designs to offer, and what actual or potential competitors to discourage. This behavioural conduct forms a link between structure and performance. On the other hand, there is another definition on conduct where it refers to the behaviour of firms under a given set of circumstances and is normally determined by the structural characteristics of industry. It involves policy objectives, pricing objective, research and

9
development, and marketing strategies such as advertising and product differentiation (Lipczynski and Wilson, 2001). Bain (1968) in his studies examined three main barriers identified as economies of scale, absolute capital requirements and product differentiation. He construed entry barrier as the extent to which established firms can elevate their selling prices above minimal average costs of production and distribution without inducing potential entrants to enter an industry. He argued that the three entry barriers are stable and long term. However he did not imply that these barriers should be regarded as permanent. Stigler (1964) defined barrier to entry as a cost of production which must be borne by a firm which seeks to enter an industry but is not borne by firms already in the in the industry. In a situation where established and the entrant firms faced the same cost and demand conditions in a market, no barrier to entry exists. Product differentiation plays a dual role. It not only raises the height of the entry barrier but also directly influences the character of competition among established firms (Comanor and Wilson, 1970). Advertising, promotional activities and variation in the physical characteristics of products are the most obvious types of product differentiation. In the case of advertising, it is not only influenced by product and market characteristics but also depends on the policies pursued by individual firms. Differences in advertising reflected both structural and behavioural differences between industries. Comanor and Wilson (1974) in another study identified three ways in which advertising can create an advantage for incumbents. These three channels are: (i) contributing to an absolute cost advantage of existing firms; (ii) possibly exhibiting economies of scale; and (iii) increasing the capital costs of entry. High prevailing levels of advertising create additional costs for new entrants. Because of buyer loyalty, more advertising messages per prospective customer must be supplied to induce brand switching as compared with repeat buying. In addition, the effect of advertising on firms’ revenues is subject to economies of scale. This result from the increasing effectiveness of advertising message per unit output and also from the decreasing costs for each advertising message purchased. Thus, an entrant will suffer an additional cost disadvantage if they at a relatively small scale firm. Finally, if economies of scale exist either in production or in advertising, the need to obtain funds for advertising will give rise to capital requirements over and above those needed for physical plant and equipment. This investment does not generally create tangible assets which can be resold in the event of failure; hence the required rate of return on such capital will be high. While barriers discourage market entry, there are conditions that encourage and attract new business entities to enter markets. Size and expected growth of the market have been found to be significant determinants of entry (Baldwin, 1995). Barriers to entry limit competition by preventing market entry of new firms and often increase the profits of incumbent firms in the market place. Thus, barriers to entry sometimes lead to monopoly conditions. The importance of barriers in deterring entry of competitors into markets however, varies by products and industries.

10
2.1.3 Market Performance Market performance as defined by Bain (1968) is the composite end result which firms, in any market arrive at, in pursuing whatever lines of conduct they espouse. Performance in the most general sense is an evaluation of an industry’s contribution as a whole to economic welfare. In practical terms, the empirical literature has commonly indicated performance by measures of profitability (Cubbin, 1988). Not only does it serve as an indicator of market performance, profitability also shows the possible existence of market power. Caves (1982) defined market performance as the appraisal of how far the economic results of an industry’s behaviour fall short of the best possible contribution it could make to achieve the goals which consist of efficiency, progress, full employment and equitability. Phillips (1976) pointed out that there are severe limitations of performance flowing from structure. However he made a strong case that performance itself can lead back to changes in conduct and structure. Causal links between concentration and profitability are seen through the effects of concentration on anticipated rival’s reaction. As sellers become fewer, the more is the likelihood that the leading firms will recognise their common interest in curtailing price competition in favour of higher prices. The more concentrated the industry, the more each firm will anticipate that the others will respond to a price cut by increasing their output. Thus, this will cause the demand curve facing each firm to be less elastic, resulting in a higher optimal excess of price over marginal costs as well as profitability. Rugayah (1993a) reaffirmed that high concentration is associated with high price-cost margin. 2.2 Conceptual Framework for S-C-P Paradigm A widely accepted conceptual framework in industrial organisation studies holds that structural conditions determine the behaviour (conduct) and subsequent performance of a firm (Bain, 1959). In an economy unfettered by structural imperfection of output, profit rates across industries should fall to some equilibrium rate reflecting the risk-adjusted marginal efficiency of capital (Scherer and Ross, 1990). In the presence of structural imperfections however, inter-industry variations in profitability abound because entry barriers prevent new competitions and expanded output. In similar vein, industry structure theory in the strategy literature maintains that competitive advantages and inter-firm differences in efficiency cannot persist over a long time period unless structural imperfections are present (Porter, 1980; Teece et al., 1997). Porter (1986) also noted these strong industry effects on a selection of business level strategies. A large body of research in corporate business portfolio studies concurred to point out the importance of industry structure variables in explaining performance. To assess market structure, conduct and performance, and to properly understand the roles of the each element, Waldman and Jensen (2001), linked together those elements and attributes which have direct relationships. In perfectly competitive markets, an

11
atomistic market structure results in efficient economic performance with price equals to marginal cost, inefficient firms driven from the market, and long-run economic profits equal to zero. With a monopolistic market structure, economic performance is poor where, price exceeds marginal cost, inefficient firms can survive in the long run, and economic profits are greater than zero. The S-C-P paradigm extends the structure-conduct-performance relationship to oligopoly. Figure 2.1 depicts the structure-conduct-performance paradigm. The authors identified five components as the bases of the S-C-P framework. The components consist of basic market condition, market structure, market conduct, market performance and finally government policies. The thicker (bold) arrows on the diagram show the primary relationships where: basic market conditions determine market structure; market structure determines conduct; and conducts determines performance. In addition, government policies have direct impact on structure, conduct and performance. The S-C-P paradigm advocates active government involvements in industry to ensure that competition prevails. Meanwhile, the thin arrows on the diagram shows the feedback effects of conduct on structure and feedback effects of performance on conduct and market structure. Another older conceptual framework developed by Scherer (1980) also contains basic condition, market structure, conduct and performance as the main components. The only difference is he did not include government policies in his model. The author mentioned that performance in particular industries or markets is said to depend upon conduct of sellers and buyers while, conduct depends in turn upon the structure of the relevant markets. Market structure and conduct are also deemed to be influenced by various basic conditions. Primarily, the author was concerned with relationships or tendencies involving a causal flow from market structure and basic condition to conduct and performance. There are also feedback effects from conduct to basic condition and market structure; market structure to basic condition. However, he did not mention about feedback effects from performance.

12
Note: direct effect feedback effect
Figure 2.1: A Model of Structure-Conduct-Performance Paradigm
Source: Waldman and Jensen (2001)
Basic Market Conditions Demand Conditions Supply Conditions Price elasticity Technology Substitutes Raw materials Market growth Unionisation Type of good Product durability Method of purchase Location
Market Structure Number of sellers and buyers Product differentiation Barriers to entry and exits Vertical integration Diversification Cost structures
Conduct Pricing strategies Product strategies Advertising Research and development Plant investment Collusion Mergers Legal strategies
Performance Allocative efficiency Production efficiency Rate of technological advance Quality and service Equity
Government Policies Antitrust policy Regulation Taxes and subsidies Trade and regulations Price controls Wage regulations Investment incentives Employment incentives Macroeconomic policies

13
2.3 Empirical Evidence on S-C-P Paradigm The concentration-profits relationship plays a central role in the S-C-P paradigm. The existence of a small number of firms in an industry is said to facilitate collusion, which in turn results in higher profits. A significant number of industrial organization studies have analysed the linkage between market concentration and return on equity (ROE), with the latter being used as the indicator of profitability. The pioneer of S-C-P paradigm, Bain (1951) stated that the average profit rate of firms in oligopolistic industries of high concentration tends to be significantly larger than that of firms in less concentrated oligopolies or in industries of atomistic nature. Bain (1951) tested the concentration hypothesis on 42 US manufacturing industries between 1936 and 1940. Profits were measured as return on equity, while concentration was measured by calculating the concentration ratio for the eight largest firms in each of the industries sampled. The author found that in industries with eight-firm concentration ratio (CR8) of more than 70 percent, profits were significantly higher than those with CR8 less than 70 percent. He split the sample of industries into two based on initial levels of concentration with the cut off point defined at 70 percent. In another study, Bain (1956) examined the influence of barriers to entry on profit rates of the leading firms in a sample of oligopolistic industries for the periods 1936-40 and 1947-57. He observed that seller concentration is necessary but not sufficient condition for higher profit rates. He also stated that seller concentration alone is not an adequate indicator of the probable incidence of extremes of excess profits and monopolistic output restriction. The concurrent influence of the condition of entry should clearly be taken into account. Adelman (1951) criticised that Lorenz Curve and Gini coefficient emphasise too much on fractions and percentages. They neglected the absolute number aspect of structure to an uncalled for and undesirable degree. In another study, Blair (1956) mentioned that a decline in the number of sellers in a market could be associated with a decline in Gini coefficient since it would leave the remaining firms more equal in size as the departing firms were all quite small. Therefore, changes in structure over time would not be depicted properly. Meanwhile, Rao and Ramakrishnan (1972) used Gini ratio as their measurement as it has the intrinsic merit of considering all possible differences. However the trapezoidal area under the Lorenz curve has its limitation as the trapezoidal area overestimates the area under the Lorenz curve, which means it underestimates the Gini ratio. Dorfman and Steiner (1954) developed a model of the relationship between market structure and advertising. The authors suggested a positive link between market power and advertising where, as the Lerner Index of market power increases, the advertising to the sales ratio also increases. They also stated that the advertising to sales ratio is directly related to the price-cost margin, inversely related to the price elasticity of demand and directly related to the advertising elasticity of demand.

14
Mann (1966) analysed the performance rates of 30 industries for linkages to seller concentration and barrier to entry. He found that seller concentration and barrier to entry have independent influence on profit rates of industries. The industries with concentration values of 70 percent and above have higher profit rates. However, according to a study by Chandrasekaran (1982), it was found that difference in profit rates between the substantial and moderate to low barrier classes is less than one half of the difference between the very high and the substantial barrier categories. Besides that, the combined effect of seller concentration and barriers to entry reveals that monopoly advantages exist in those industries which are highly concentrated and have high barriers to entry. In another research, Kilpatrick (1967) empirically studied the correlations between the top four, top eight and top twenty firm concentration ratios plus some variants and industry profit rates. In the similarity of correlation coefficients found, he concluded that the results provided much evidence that the particular choice is not crucial and that an economist can use an ordinary concentration ratio in a cross-sectional study without being concerned that a different choice would have altered his conclusion appreciably. Later in another study, Mcfetridge (1973) analysed the relationship between market structure and performance and he found o the positive significant effect of concentration with the square of Herfindahl-Hirschman Index (HHI) to be the preferred measure of concentration on profitability. Rhodes and Cleaver (1973) conducted an extensive research on the concentration and performance relationship using 405 census industries. Four firm concentration values were computed and used as a dummy variable dichotomised at several values while the aggregate price-cost margin were used as performance figure. They used additional explanatory variables such as industry growth, and profit ratios. One of the major findings was the statistical significance of the concentration dummy variable at the 1 percent level regardless of the breakpoint being used. They concluded that since the significant CR4 dummy variable is interpreted in such a way that the intercept or average margins in industries above that level are greater than in industries below that level and since this relationship was found throughout a wide range of potential critical values, it would seem to suggest the existence of a basic linear relationship. Their study was strictly an analysis of the concentration-performance relationship at the industry level. In order to overcome the problem of diversity of operations, Miller (1967) introduced a measure of corporate diversity as additional explanatory variable in his model. It measured the ratio of employment of all firms, irrespective of industry groups in that industry. Miller found that concentration is a significant explanatory variable of performance. The relationship is seen to be linear and continuous. House (1973) examined whether a continuous relationship exists between performance and concentration and whether barriers to entry exert independence on performance in addition to concentration in Kenyan industries using linear function. Performance was measured by profitability defined as the difference between average price and average cost, expressed as a percentage of average prices while the concentration index CR3 was derived from the percentage employment of each industry attributable to the largest three

15
establishments. Meanwhile, capital requirement was used as a proxy for barriers to entry. The results indicated that there was a positive relationship between profitability and concentration. Industry export production found to be inversely related to profitability although the co-efficient was not significant. Gan and Tham (1977) in a study on Malaysian manufacturing industries during 1968-1971, examined the impact of certain structural variables on the profitability performances of 42 manufacturing industries. The author showed a positive relationship between concentration and profitability although it was not statistically significant. Among others, they used 8-establishment concentration ratio (CR8), capital output ratio, minimum efficient scale (MES), effective protection rate, and foreign direct investments as the structural variables. In determining the relationship between concentration and barriers to entry, the authors used minimum efficient scale, absolute capital requirement and product differentiation as the variables for CR8 function, whereby the barriers to entry, which indicated by the three variables above, were found to be jointly significant at a 5 percent level. Gan (1978) in another paper used price-cost margin (PCM) as averages and 4-establishment concentration ratio (CR4) to replace the CR8 in his previous study. Capital output ration was again used as a control for effects of capital intensity. Gan’s results seem to support the concentration-performance hypothesis, with a critical concentration level of 85 percent, which is higher than that found by Bain in the US (70 percent) and much higher than the 40-50 percent levels in Kenya. Lall (1979) analysed the inter-relationship between the 4-establishment concentration (CR4) and various structural features of market using a sample of 46 industries in Malaysia. It dealt with the impact of multinational corporations (MNC) on the market structure. From his list of determinants of market structure tested on CR4 using ordinary least-square (OLS) regression, foreign presence emerged as the strongest influence on concentration. Lall’s results on the structure of Malaysian industries confirm most of the relationships found in industrialised countries if foreign presence is ignored. Economies of scale and capital intensity were found to have strong positive relationships with concentration; advertising also has a positive effect and is generally efficient. In another study, Lindsey (1977) investigated the level of market concentration at 2-digit level of industry aggregation using two sets of 3-establishment concentration ratios, one using value added and the other using employment figures. Although both measures appeared to be dependable at Spearman rank correlation of 0.765, value added concentration was considered to be superior since it was more depictive of the economic power arising from the use of modern large scale technology in a small market. The two sets of concentration ratios nevertheless gave a similar picture of the overall structure of the Philippines manufacturing industry. Using OLS regression the author indicated that minimum efficient plant size is directly associated with concentration, whereby the smaller the plant size that can operate efficiently, the larger is the number of plants that can potentially exist in the industry. Industry growth was found positively related though

16
not significant to concentration. Meanwhile industry growth was also found to be an important determinant of the level of concentration. Buxton et al. (1984) studied the effect of concentration on advertising and the influence of product and market characteristics as well as direction on causality. The authors used two-stage least-square (TSLS) regression on the model to allow the possibility of a simultaneous relation between advertising and concentration. They found that an increase in concentration ratio leads to a substantial increase in the advertising intensity thus the greater are sales to consumers. The return on sales also has significant positive effects on advertising, but the effects of durability and sales growth are insignificant. Kohls and Uhl (1985) suggested that four firms, concentration ration of less than or equal to 33percent is generally indicative of a competitive market structure, while a concentration ratio between 33percent and 50percent, and more than 50percent may indicate weak and strongly oligopoly market structures, respectively. However, the CR4 is best regarded as a “rule of thumb.” Blomstrom (1986) constructed regression models to explain inter-industry variation in the level of concentration which was measured by HHI and CR4, as a function of different combinations of market size, market growth, economies of scale, capital intensity, advertising intensity and the share of foreign ownership in Mexican manufacturing industries. Linear estimation of the function found that foreign presence raises concentration, market size is positively and statistically significant, and economies of scale also significantly raise concentration as well as capital intensity. However, advertising has a significant negative impact on the level of seller concentration. The HHI was also applied in the study by Cotterill (1986). The study used Herfindahl index as a concentration measure, outperformed the 4-firm concentration ratio and marginally outperformed market share as a predictor of its price level. His results showed that the profits of leading firms in concentrated markets may be due to market share-related cost efficiencies or market power. In previous studies, Phillips (1976) had criticised the concentration ratio because it ignores size inequalities between the leading group and all other firms. He claimed that the relationship between concentration ratio and firm number is viable and ambiguous. Although CR and HHI measures have their limitations they normally tend to correlate highly with one another (Davies, 1979; Kwoka, 1981) Rajan (1986) in his study on the relationship between product diversification and firm performance, used profitability and growth measures to measure firms’ performance rate. The profitability ratios were return to equity (ROE) and return on total capital (ROC) while, the growth measurement was done by using sales growth rate and earnings per share growth rate. His sample covered the ten largest firms in each of the 25 largest industries in the United States. Overall the author found that the results pointed to the characteristics by varying levels of depth and breath in diversity.

17
Petrochilos (1988) in his case study on the market structure in Greece adopted S-C-P framework to examine the determinant of concentration. OLS regression were carried out using the 5-firm concentration ratio (CR5) as the dependent variable with product differentiation, foreign presence, capital intensity, cost advantage ratio, market size and growth in value added in each industry as determinants of concentration in the study. The results indicated that there were significant positive relationships between foreign presence and capital intensity to the level of concentration. Even so, advertising, market size and market growth showed the opposite results. Connor and Peterson (1992) used regression analysis to estimate the relationships between market structure and the pricing performance of manufactured food products. They found that the three principal determinants of price-cost margin variation, in order of their impacts, are advertising intensity, elasticity of demand and concentration. However, they also indicated that the elasticity of demand plays a larger role than market concentration in determining price differences. In another study, Rugayah (1993b) measured the level of market concentration in thirty-one major Malaysian manufacturing industries between 1978-1986 using various measurements of concentration which included HHI, entropy (H), redundancy measure (RED), 4-firm concentration ratio (CR4) and the marginal seller concentration (MCR8) indices. She found that HHI is highly correlated with H and CR4. Although CR4 ratio is considered to be a crude measure of concentration, it expresses approximately the same information content as Herfindahl and entropy. In the same study, Rugayah (1993b) also attempted to examine the factors that influenced the level of seller concentration in the Malaysian manufacturing sector using OLS estimates by taking HHI as a dependent variable. She used scale economies, minimum capital requirement, advertising intensity, industry, foreign investment, capital intensity, vertical integration, total export and import to sales as the explanatory variables. The findings show Malaysian manufacturing industries are generally concentrated with CR4 exceeded 40 percent in eighteen industries. Variation in concentration can be explained by scale economies, competing exports and imports, capital intensity, foreign investment as well as vertical integration. Large firms are found to have a significant impact on concentration and in addition, high intensities of advertising and exports appear to de-concentrate the market. Dickson (1994) also worked out a formal method for incorporating the HHI into an aggregate industry cost function. The author considered the effect of concentration on cost efficiency but the aggregate procedure required the assumption of equally sized firms. Azzam (1997) in another way measured market power by separating the relative strengths of market power effects and cost efficiency effects associated with higher concentration. The findings show that while the market has borne a cost because of increased buyer concentration, the benefits it has reaped therefore are large enough to offsets the costs. This represents one empirical confirmation of the long view regarding the trade-off between market power and cost efficiency from increased concentration.

18
Kambhampati (1996) used a standard three-equation model and included a lag structure in the equations, rejecting the belief that each variable influences the other variables at once in analysing the S-C-P relationships. She argued that lagged conduct and both lagged and current performance affect structure. Structure is influenced by the actions of both incumbents and potential entrants. Incumbents can influence structure more quickly than potential entrants, who are in the process of raising capital to finance their decision to enter and produce. She specified the CR4, advertising and profits margin as the dependent variable for structure, conduct and performance equation respectively. TSLS regression was used to construct coefficient estimates for each of exogenous and endogenous variables. McGivern and Tvorik (1997) used economic rates of return as determinants of organisational factors and economic performance. The model of financial ratios was analysed using quantitative analysis to construct a correlation matrix, regression analysis and covariate ANOVA analysis. Rates of return on sales (ROS) and return on invested capital (ROIC) represented economic factors while, rates of return on assets (ROA) and returns on investment (ROI) were used as variables for organisational factors. The determinant of the model was found to be highly correlated and exhibited a strong influence on firm performance variance. Results were highly correlated and presented a framework that partitioned the economic contribution of the factors of performance. James and Hatten (1994), in another way, also adopted ROA and return on equity (ROE) as their fundamental or basic measures of performance in their paper on banking industry. Vlachvei and Oustapassidis (1998) investigated S-C-P relationships for the food and beverage manufacturing industry in Greece using cross-sectional data. Three-stage least-square (3SLS) method was used to estimate the parameters of the profitability, concentration and advertising model for a sample of 38 four-digit industries in 1994. They found that profitability is determined by advertising, which in turn, is affected by both profitability and concentration, while the latter is determined by economies of scales. Go et al. (1999) conducted an econometric analysis of the linkages between industrial structure and price-cost margin (PCM) performance. The study tested whether variations in industry PCM are explained by concentration, capital-output ratio, industry growth rate, import and export share, and degree of foreign participation in the four-digit Philippines manufacturing industries in 1986. A series of multiple regression equations were employed to relate the PCM to the previously mentioned explanatory variables. It was found that there are positive relationship between sellers’ concentration, capital intensity, degree of foreign participant and the PCM. Industry growth rate may either increase or decrease while imports and exports found to lower the PCM. Waldman and Jensen (2001) mentioned that a common denominator is necessary in order to make comparisons across industries or even across firms that produce a variety of products. Using price as a basis makes sense only for several given products. One possible common denominator is costs. Lerner index is theoretically appealing because it directly measures the increase of price above marginal cost. However, the Lerner index is

19
difficult to estimate because data are lacking on firms’ marginal costs. The authors suggested four different measures as proxy for the Lerner index: excess return on sales, profit rate, price-cost margin and Tobin’s Q. de Ven (2001) examined the implications of measuring inequality for distributions that are subject to general limits. He found that the Gini coefficient satisfies all the standard principles that characterise a useful measure of inequality under the consumption of distribution non-negativity. An adjustment to the Gini coefficient based upon a stated definition of perfect inequality was suggested by the author, which produces a statistic that satisfies all of the principles to which an inequality measure is subject for any general distributional limits. Azzam and Rosenbaum (2001) developed a model that identifies the concentration related market power market efficiency components of price. It also creates a link between firm differential efficiency and market concentration. They found that rising market power raises price while rising efficiency lowers the price. Hence overall, increases in concentration increase price. Their result also shows that concentration is an increasing function of the variance in costs across firms in an industry. The greater the cost variance, the more will the larger firms benefit at the expense of smaller firms and the higher the market concentration. Bhattacharya (2002) used a partial adjustment model, a cross-sectional analysis of a sample of Malaysian manufacturing industries between 1986 and 1996 to analyse the determinants of changes in industry concentration over time. Domestic factors such as advertising intensity, capital intensity and market size that influence competition were found to be significant in explaining the level of concentration. In considering variable rate of adjustment of concentration, an increase in labour productivity of large firms and high entry rates were found to be significant for faster adjustment towards equilibrium level in this study. Delorme et al. (2002) in their study used a simultaneous equation framework to examine the relationship between structure, conduct and performance in the US manufacturing industry in 1982, 1987 and 1992. Lag structures were applied to signify that S-C-P elements did not affect one another contemporaneously. By using TSLS regression, it was found that concentration does not depend on current industry profitability, though profitability depends on concentration. Besides that, advertising also seems to have no effect on profitability. Based from the literature reviewed, many studies have been devoted towards determining the relationships among market structure, conduct and performance. Among the previous related studies, most of them used popular absolute CR and HHI to examine the market structure. Advertising, capital intensity as well as research and development (R&D) expenditure are used as market variables in determining market conduct. Meanwhile, profitability ratios such as return on asset (ROA) and return on shareholder’s equity (ROE) and sales ratio are used to represent the market performance. Econometric modelling and regression analysis are often used to assess the linkages and relationships

20
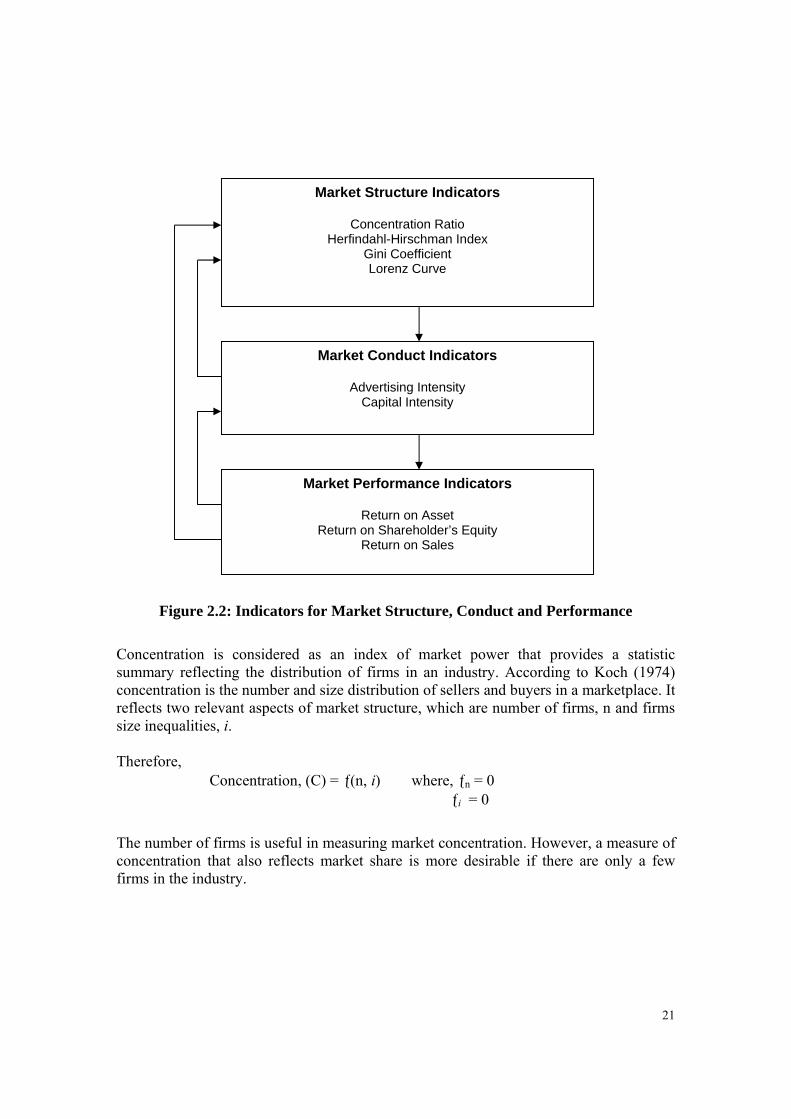
of market structure, conduct and performance (S-C-P). Thus, the method is appropriate to be applied in this study. 2.4 Measurement of S-C-P Indicators Three types of methodological tools are normally used to examine the structure, conduct and performance (S-C-P) of an industry, i.e. the measures of market structure, measure of conduct and measures of performance. Conceptually, Figure 2.2 sorts out the indicators for each measure used in the evaluation. Market structure is measured by concentration ratio (CR), the Herfindahl-Hirschman index (HHI) and Gini coefficient (GC) in order to find the levels of concentration and inequality in the industry. This is followed by measurement on market conduct using advertising intensity and capital intensity. The market performances is measured using rate of return on asset (ROA), return on shareholder’s equity (ROE) and return on sales or also known as sales ratio (SR). Correlation is used to find the degree of association between the market variables. in order to examine whether causal relationships exist among the structure, conduct and performance in the industry as shown by the arrows in Figure 2.2, regression analysis is carried out to study the S-C-P model. 2.4.1 Measures of Market Structure The market structure indicators are used to show the characteristics of an industry, which include level of market concentration, competitiveness, and market power as well as entry barriers in the industry. Market structure can be empirically measured by using the absolute concentration measures and the relative concentration measures. The absolute concentration indicators included are concentration ratio and the Herfindahl-Hirschman index. Meanwhile, the Gini coefficient and Lorenz curve are utilised as indicators of relative concentration. Concentration, as an element of industrial structure within the context of S-C-P paradigm is an important indicator of the extent of the centralisation of economic activity and power, both within markets and within the whole economy. Seller concentration is regarded as a significant aspect of market structure because of its hypothesised relationship to market power and especially, to behaviour (conduct) and performance.
21
Figure 2.2: Indicators for Market Structure, Conduct and Performance
Concentration is considered as an index of market power that provides a statistic summary reflecting the distribution of firms in an industry. According to Koch (1974) concentration is the number and size distribution of sellers and buyers in a marketplace. It reflects two relevant aspects of market structure, which are number of firms, n and firms size inequalities, i. Therefore, Concentration, (C) = ƒ(n, i) where, ƒn = 0 ƒi = 0
The number of firms is useful in measuring market concentration. However, a measure of concentration that also reflects market share is more desirable if there are only a few firms in the industry.
Market Structure Indicators
Concentration Ratio Herfindahl-Hirschman Index
Gini Coefficient Lorenz Curve
Market Conduct Indicators
Advertising Intensity Capital Intensity
Market Performance Indicators
Return on Asset Return on Shareholder’s Equity
Return on Sales

22
2.4.1.1 Absolute Concentration Measures
i) Concentration Ratio Concentration ratio (CR) is the cumulative share of the k largest firms in the market, where typical values of k are 4, 8, 12, 16 and 20. Thus, the four-firm concentration ratio (CR4) is the sum of market shares of the four largest firms in the industry to the total market share. The most common measure of market size is sales, although concentration ratios could be also calculated using other measures of size such as value added, employment or assets.
Concentration ratios have the advantage of being relatively easy to understand. It ranges from a value of zero percent for a perfectly competitive industry to a value of 100 percent of market share, for a monopoly. Thus, if CR4 fall in the quartiles of 75–100 percent, the industry is considered as highly concentrated, moderately concentrated if in quartile 50–75 percent, slightly concentrated if 25–50 percent, and atomistic if in the quartile of 0–25 percent. Let CRk represents the concentration ratio. Therefore,
k CRk = ∑ Si k = 4,8,…20 i=1
where,
Si = the market share of firm I, belonging to the k largest firms. ii) Herfindahl-Hirschman Index The Herfindahl-Hirschman Index (HHI) is more complex and contains additional information about the size of the largest firms. It will change, if there are shifts in market shares between the largest firms. The HHI can be calculated as follows: k
HHI = ∑ ( Xi / T )2 i=1 where, k = number of firms in the market; Xi = the sales volume of firms I; T = total market share The HHI is a measure of dispersion. It takes into account the number and shares of all the firms producing for the market. The higher the value index, the less likely the industry

23
will exhibit competitive behaviour and become more inequal in firms sizes. As suggested by Hirschman (1964), the HHI can determine market structures by dividing them into three categories, which are;
1. HHI less than 1000 = concentrated 2. 1000 < HHI < 1800 = moderately concentrated 3. HHI more than 1800 = highly concentrated.
Besides that, the United States Department of Justice and the Federal Trade Commission, also use the HHI range as the framework for measuring market competitiveness under the Horizontal Merger Guidelines 1997 Revised. 2.4.1.2 Relative Concentration Measures i) Lorenz Curve and Gini Coefficient Lorenz curve is the graphic technique for summarising the information in a concentration table. It shows as a continuous function the percentage of total industry sales accounted for by any given fraction of the total firm population, with the firms ranked in order of market share or size (cumulated from smallest to largest). Lorenz curve is also characterised numerically by means of the Gini coefficient (GC), which measures the departure between the Lorenz curve actually observed and the curve that would appear if all firms had equal market shares or sales. By reference to the diagram in Figure 2.3, the Gini coefficient is the dark-shaded area, divided by the total of the areas shaded in dark and grey.
Cumulative percent of Firms
Figure 2.3: Lorenz Curve and Gini Coefficient
Cum
ulat
ive
perc
ent o
f Mar
ket s
hare

24
For a perfectly equal distribution of market shares, there would be no area between the 45-degree line and the Lorenz curve, which means a Gini coefficient of zero. For complete inequality, with the leading firm producing the entire output, the Lorenz curve would coincide with the straight lines at the lower and right boundaries of the curve, so the Gini coefficient’s value would be one. Real economies have some, but not complete inequality, so the Gini coefficients for real economic systems are between zero and one. The lower the Gini coefficient, the more evenly spread of the firms’ equality in an industry.
In generating Lorenz curve, two computations have to be made which are; the percentages of market sales cumulated from the smallest-sized firm; and the percentage of the number of firms cumulated from the smallest firms to the largest. The Gini coefficient is a summary measure that captures the deviation shown in the Lorenz curve.
Formulated by Gini (1912), the coefficient is the ratio of the area between a Lorenz curve and the 45-degree line to the area triangle below the 45-degree line. Its formula is,
Gini Coefficient (G) = 1 + 1/N – 2/(N2ā) [(a1 + 2a2 +….+ NaN)]
where, a, is the amount owned by each firm in decreasing order of size; N is number of firms; and ā is the mean value. The Gini index is thus a weighted sum of shares, with the weights determined by rank order position. As noted by Maasoumi (1995), Gini does not provide for aggregation consistency or full addictive decomposability. In addition, Gini places more weight to transfers affecting the middle of a distribution than the tails. However, a function such as below corrects this latter feature; N
Gini Coefficient = [ Σ (2i – N – 1) Xi] / N2μ i=1
where, Xi = the market share of firm I marked in ascending order; N = the number of firms in the industry; μ = mean size. This measure tends to focus on firm inequalities, and subsequently ignores the number of firms in the industry i.e. an industry with two equal-sized firms would have the same Gini coefficient as an industry with 100 equal-sized firms.

25
2.4.2 Measure of Market Conduct 2.4.2.1 Advertising Intensity According to the Dorfman and Steiner (1954) and Needham (1978), advertising to sales ratio or advertising intensity (ADV) can be used as a proxy to market conduct. The advertising to sales ratio is related to the firms’ conduct and has relationships with the barrier to entry and market power.
Advertising is a form of product differentiation whereby firms communicate to consumers what goods and services they have to sell. Advertising affects the structural and performance characteristics of an industry, and it is likely to affect the prices that consumers pay for products that are advertised. Advertising intensity is measured by the ratio of advertising expenditures to sales. Refer to Dorfman and Steiner condition,
Profit, π = p.q (p, A) – C (q) – A .....(1)
C (q) is production cost (C), of quantity produced (q), while q(p,A) is the demand function facing firm which indicates that price and advertising affect demand. The decision variables for the firm are p (price) and A (advertising) and the first order conditions for profit maximisation become:
dπ = p .dq – dC . dq = 1 dA dA dq dA …..(2)
dπ = p .dq + q – dC .dq = 0
dp dp dq dp …..(3) Then derive from equation (2) and (3), (p – dC) . dC = 1
dq dA …..(4)
(p – dC) . dq = -q dq dp …..(5)
(4) ÷ (5)
dq / dq = -1/q dA dp …..(6)

26
This can be manipulated to yield,
A/q.dq/dA = _A , i.e. A = ea p/q.dq/dp pq S e …..(7) Therefore, advertising to sales ratio could be use as a proxy to market conduct.
Advertising-Sales Ratio = A
S …..(8)
where,
e = absolute value of the price-elasticity of demand;
ea = advertising-elasticity of demand;
A = advertising expenditures;
S = total sales.
Firms with low advertising to sales ratios tend to have little market power and low price-cost margin. Ceteris paribus, oligopolies have larger advertising-sales ratios compared to monopolists and competitive firms. Meanwhile, a monopolist’s advertising is greater than firms in a perfectly competitive level of advertising. 2.4.3 Measures of Market Performance Performance measure is primarily used to monitor the outcomes resulting from competition among firms, within an industry, market and the entire economy. It shows how a firm or a system is performing and identifies the trends of performance over time. In an industry, performance is directly impacted by the structure and conduct of the industry, and can ultimately be used as a measure of the success of the firms. Performance is therefore a function of firms’ conducts and industry structure (Porter, 1980). Accounting profits are used as the measure of relative performance because of the readily available data and they do not require a judgement about the competitive rate of return. In comparison across firms, profits are divided by some base figure to yield a profit rate. Earning positive economic profits is equivalent to earning a rate of return that is greater than the competitive rate of return. There are two general indicators in measuring performance in terms of profit rate, which are the rate of return on assets after tax and the rate of return on shareholders’ equity after

27
tax. Another indicator in terms of sales is the rate of return on sales after tax. All these three measurements are considered as profitability ratio. 2.4.3.1 Rate of Return on Assets after Tax The rate of return on assets after tax (ROA) measures the overall ability of the firm to utilise the assets in which it has invested to earn a profit. It is measured by the following formula:
Return on Assets = P – T + I A
where, P = net profits; T = tax on profits; I = interest payment to debt holders;
A = total assets. Interest payments must be added to the numerator because debt holders are paid interests whereas profits are paid to shareholders. Total assets include the values of both equity and debt capital. 2.4.3.2 Rate of Return on Stockholders’ Equity after Tax Rate of return on shareholders’ equity after tax (ROE) is used to measure profitability. The rate used in this study can be written as:
Return on Shareholders’ Equity = P - T
E
where,
P = net profits;
T = tax on profits;
E = stockholders’ equity.
This measure is better because it corresponds with what individual investors are trying to maximise. In addition, competitive industries with the same risk will have the same rate of return on equity in the long run.
2.4.3.3 Sales Ratio: Return on Sales after Tax This type of ratio is the bottom line of the common size income statement. It is a fundamental indication of the overall profitability of a business. The rate of return on sales (ROS) is expressed as follows:

28
Return on Sales after Tax = P – T S
where, P = net profits; T = tax on profits; S = total sales. The return on sales is not biased by asset revaluation. Moreover, the ratio has the advantage in measuring allocation inefficiency more directly than ROA and ROE ratios. Specifically, return on sales is determined by the capital intensity of the production process. Greer (1980) mentioned that greater capital intensity implies a greater capital investment per unit of sales. Therefore, it requires a greater profit per Ringgit sales in order to reward investors at a given level of return. 2.4.4 Endogenousity of S-C-P Model (Optional) 2.4.4.1 Model Specification The identified specification model for this study follows a traditional three-equation S-C-P model as a system that takes the general form by taking market structure (S), market conduct (C) and market performance (P) in a function of the other two variables. Hay and Morris (1991) suggested that three variables of considerable interest within the traditional SCP paradigm (concentration, advertising and profits) are more properly considered as jointly determined within a system of equation. The traditional three-equation S-C-P model is as follows:
STRUCTURE (S) = ƒ (CONDUCT, PERFORMANCE) .....(1) CONDUCT (C) = ƒ (STRUCTURE, PERFORMANCE) .....(2) PERFORMANCE (P) = ƒ (STRUCTURE, CONDUCT) .....(3)
In this study the three-equation S-C-P model assumes that each variable influences the others not contemporaneously but over time. Subsequently, a particular lag structure is implemented to identify more precisely the relationship between the three variables (Kambhampati, 1996; Vlachvei and Oustapassidis, 1998; and Delorme et al., 2002). Delorme et al.’s (2002) S-C-P model using lagged variables is being followed in this study to analyse structure, conduct and performance in Malaysian food manufacturing industry. However, because of the lack of available data such as research and development (R&D) expenditures, capital intensity is used as a proxy in this study. Concentration ratio is used as the dependent variable for structure equation, advertising as the dependent variable for conduct equation, and profitability as the dependent

29
variable for performance equation. The analysis involves cross-sectional data in the period of ten years (1992-2001) with some lagged variables. The model is exhibited as a system of three linear equations. In the structure (concentration) equation, concentration is assumed to be a function of lagged advertising, lagged profits and lagged capital intensity. Adding error terms, the structure equation to be estimated in this study is:
CR4 = α0 + α1ADVt-1 + α2CAPI t-1 + α3ROE t-1 + ε …..(4) where,
CR4 = four-firm concentration ratio ADVt-1 = lagged advertising intensity CAP t-1 = lagged capital intensity ROE t-1 = lagged return on shareholders’ equity
t-1 = lagged one year ε = error terms α = parameters. It is assumed that the lagged values enable those variables to enter as exogenous rather than endogenous variables. It is generally hypothesised that past values will increase the current concentration level. Capital intensity is lagged as it can act as a potential barrier to entry. The larger the capital requirement to enter an industry and the more differentiated the product, the higher would be the level of concentration. Concentration may be affected by lagged value of advertising and profits, but in principle the direction of the effects is uncertain and cannot be predicted (Kambhampati, 1996). Meanwhile in conduct (advertising) equation, concentration and profitability should have positive signs according to S-C-P paradigm. The Dorfman-Steiner condition suggests that, apart from the positive association between advertising intensity with profitability, if any other elements of market structure affect advertising intensity, it is because they affect the elasticity of demand with respect to advertising. Delorme et al. suggested that lagged growth in sales should be positively related to advertising. However, earlier studies argued that the relationships should be inversed. The conduct (advertising) equation is stated as follows:
ADV = β0 + β1ROE t + β2GROWTH t-1 + β3CR4 t + μ …..(5)
where, CR4 = four-firm concentration ratio ADV = advertising intensity ROE = return on shareholders’ equity GROWTH t-1 = lagged annual growth in sales compared to the year before t-1 = lagged one year μ = error terms
β = parameters.

30
The profitability equation incorporates all the variables with return on shareholders’ equity (ROE) as endogenous variable, while lagged growth, current capital intensity, market concentration and advertising as exogenous variables. In conventional industrial organisations it is hypothesised that the exogenous variables should be all positively related to profits. The profitability equation can be expressed as:
ROE = γ0 + γ1GROWTH t-1 + γ2CAP t + γ3CR4 t + γ4ADV t + ξ …..(6) where,
CR4 = four-firm concentration ratio ADV = advertising intensity CAP = capital intensity ROE = return on shareholders’ equity GROWTH t-1 = lagged annual growth in sales compared to the year before t-1 = lagged one year
ξ = error terms γ = parameters. Growth is expected to influence profitability since it reflects increases in demand. Since capital earns a normal profit under competition, rates of returns is larger and the more capital intensive the production techniques are. Thus, it is predicted to have a positive sign just as advertising. Most importantly, if current profit depends on current market structure, concentration should have a positive sign. In the TSLS regression analysis, lagged advertising intensity, lagged capital intensity, lagged profit, lagged growth and current capital intensity are used as instrument variables for estimating the whole S-C-P model’s system. Meanwhile the endogenous and exogenous variables are similar to those previously stated in the OLS regression. 3 Status of the ASEAN Food Processing Industry
Performance Since the early 1980’s, the ASEAN countries have been restructuring their economies by adopting economic policies that have fostered exports and inward foreign investments. This structural change has transformed their economic profiles from exporters of agricultural commodities and unprocessed goods to exporters of processed agricultural and food products. Whilst the relative importance and performance of the processed agricultural and food products varies across ASEAN members, it is particularly significant for the more advanced ASEAN countries such as Thailand and Malaysia. In these countries, the agriculture’s contribution to the economy has been declining, and presently stands at less than 10percent. In Indonesia, Philippines, and Vietnam, the relative share of the agricultural sector in 2005 remains relatively high at 13.1percent, 14.4percent, and 20.9percent, respectively, albeit at a declining trend (Table 3.1).

31
Table 3.1: Contribution of the Agricultural Sector to GDP (%), Selected ASEAN Countries, 1990 - 2005
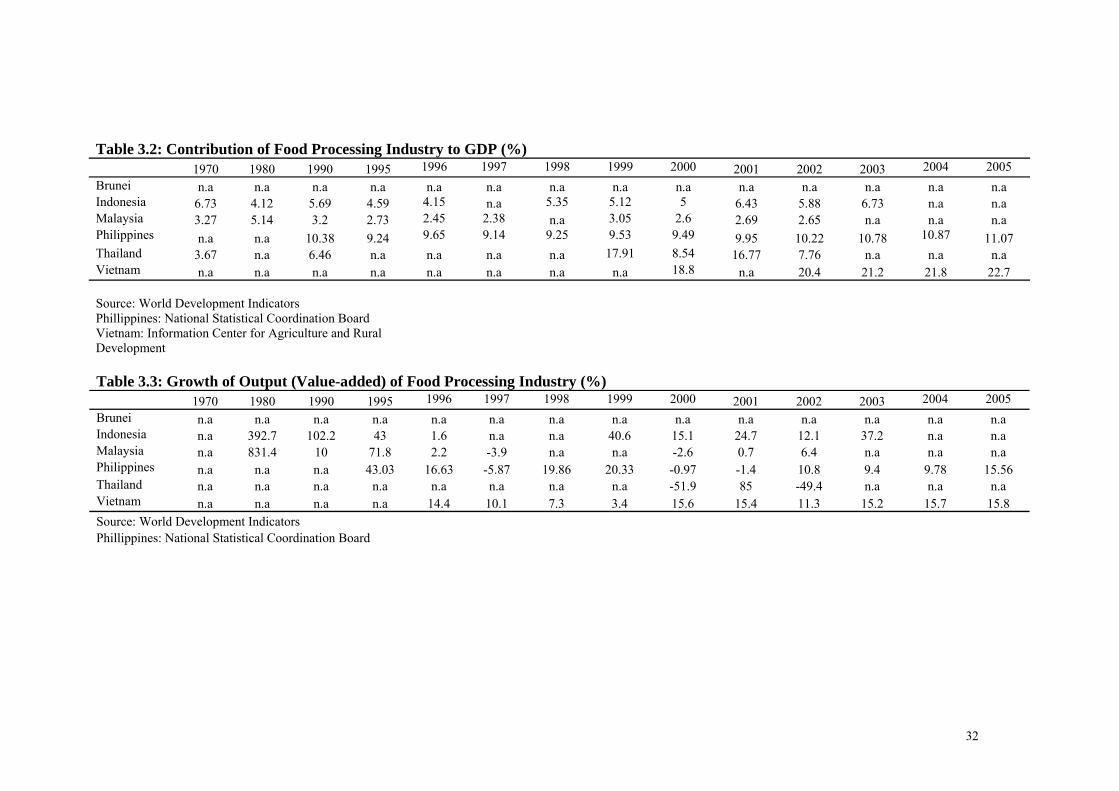
As a country developed, the economic activities that “move up the value-chain” tend to increase, so is a country’s food system. The contribution of the primary production tends to decline, and the processing to higher value food products increases. As shown in Table 3.2, the contribution of the food processing industry to the ASEAN economies, in general, has been on the increasing trend. In the Philippines and Vietnam, the contribution to the GDP from 2002 to 2005 has increased from 10.2percent to 11.1percent and 20.4percent percent to 22.7percent, respectively. In Indonesia, Malaysia and Thailand, the contribution was, respectively, 6.7percent in 2003, 2.7percent in 2002 and 17.8percent in 2002. The value added growth of the industry has also been rising (Table 3.3). In Malaysia, the industry registered an output growth of 2.7percent in 2002. The highest growth was recorded in cocoa, chocolate and sugar confectionary (15.2 per cent), biscuits (11.5 per cent) and other food products (11.4 percent) in response to increased domestic and external demand. In Indonesia, the growth in value-added was 37.2percent in 2003. The contribution of the food processing industry in the Philippines is very significant. There seemed to be a correlation of the growths in the food processing industry and the national economy. The good performance of the food processing industry during the 1986-1990 period, growing by almost 12 percent annually, coincided with an expansion of the country’s GDP by 5.1 percent. This correlation was maintained in the succeeding periods. For example, the decline in food processing output in 1991-1995 ran parallel to the drop in national GDP during the same period. When food processing output recovered during the next periods, national GDP likewise recovered. This correlation can also be observed with the share of food processing to manufacturing.
Country 1990 1995 2000 2005
Brunei 2.4 2.5 2.7 -
Indonesia 19.4 17.1 15.6 13.1
Malaysia 15.2 12.9 8.8 8.7
Philippines 21.9 21.6 15.8 14.3
Thailand 12.5 9.5 9.0 8.9
Vietnam 38.7 27.2 24.5 20.9
32
Table 3.3: Growth of Output (Value-added) of Food Processing Industry (%) 1970 1980 1990 1995 1996 1997 1998 1999 2000 2001 2002 2003 2004 2005 Brunei n.a n.a n.a n.a n.a n.a n.a n.a n.a n.a n.a n.a n.a n.a Indonesia n.a 392.7 102.2 43 1.6 n.a n.a 40.6 15.1 24.7 12.1 37.2 n.a n.a Malaysia n.a 831.4 10 71.8 2.2 -3.9 n.a n.a -2.6 0.7 6.4 n.a n.a n.a Philippines n.a n.a n.a 43.03 16.63 -5.87 19.86 20.33 -0.97 -1.4 10.8 9.4 9.78 15.56 Thailand n.a n.a n.a n.a n.a n.a n.a n.a -51.9 85 -49.4 n.a n.a n.a Vietnam n.a n.a n.a n.a 14.4 10.1 7.3 3.4 15.6 15.4 11.3 15.2 15.7 15.8 Source: World Development Indicators Phillippines: National Statistical Coordination Board
Table 3.2: Contribution of Food Processing Industry to GDP (%) 1970 1980 1990 1995 1996 1997 1998 1999 2000 2001 2002 2003 2004 2005 Brunei n.a n.a n.a n.a n.a n.a n.a n.a n.a n.a n.a n.a n.a n.a Indonesia 6.73 4.12 5.69 4.59 4.15 n.a 5.35 5.12 5 6.43 5.88 6.73 n.a n.a Malaysia 3.27 5.14 3.2 2.73 2.45 2.38 n.a 3.05 2.6 2.69 2.65 n.a n.a n.a Philippines n.a n.a 10.38 9.24 9.65 9.14 9.25 9.53 9.49 9.95 10.22 10.78 10.87 11.07 Thailand 3.67 n.a 6.46 n.a n.a n.a n.a 17.91 8.54 16.77 7.76 n.a n.a n.a Vietnam n.a n.a n.a n.a n.a n.a n.a n.a 18.8 n.a 20.4 21.2 21.8 22.7 Source: World Development Indicators Phillippines: National Statistical Coordination Board Vietnam: Information Center for Agriculture and Rural Development

33
Although ASEAN as a whole is net exporter of agricultural products, it is a net importer of processed food. Thailand, other than Singapore, is the only net exporter of processed food of the country under study. The exports of Thailand increased at a rate 9.8 percent per annum from 1993 to 2005. In Malaysia, the industry accounted for 1.6 percent of Malaysia’s total exports of manufactured goods. Drivers for Growth Several factors affect the performance the food processing industry in ASEAN economies. These factors can be categorised as demand-side and supply-side drivers as follows: Demand-side Drivers 3.2.1.1 Population and Income Growth Food demand in ASEAN economies is driven by population size and growth, as well as GDP per capita and levels of development. The more developed economies such as Singapore are markets for processed food products, consistent with higher GDP per capita. Thailand and Malaysia are markets for such products due to relatively high levels of GDP per capita (although less than Singapore) and increases in the purchasing power of households over the past decade. Other countries such as Indonesia and Philippines represent much larger economies in terms of population size and consumer demand, but slightly lower GDP levels per capita and therefore also demand for more processed products. For the lesser developed CLMV economies, demand is largely population driven, Vietnam the largest market. Consumer markets in Cambodia, Laos and Myanmar remain small and largely under developed. Income increase also led to the changes in food consumption structure. Currently, the growth rate of income achieved by a rural household is only 28percent comparing to 35percent achieved by an urban household in 2002. This has been further widening the gaps in incomes and living conditions between rural and urban regions as well as between delta and mountainous regions (GSO, 2002). The average income (person/month) of a household by the year 2002 increased by 21.1percent comparing to 1999 (with an increase of 10percent/year). Also during the same period, the average income per person in urban area was 41 USD per month ((increased by 21.1percent), and in rural area 18 USD per month (increased by 22.5percent - which is higher than that level in urban area) (GSO, 2002). The changes in food consumption patterns are largely driven by income growth and demographic factors, particularly lifestyle changes brought about by urbanization, away-from-home employment of women, and increased levels of information. 3.2.1.2 Changing Patterns of Food Consumption ASEAN food consumption patterns broadly reflects global trend. In general, as incomes rise, food tends to be consumed in processed form or a form that adds value in another manner (for example, through being partly or pre-prepared). This trend is illustrated by the “trigger

34
points” developed by The Economist (adapted by the authors) to describe evolving food consumption patterns as illustrated below. Derived from the above analysis, one would place the ASEAN countries in the following market system groupings (Figure 3.1):
Group A markets (sophisticated processed and fresh, health products): Singapore, Brunei, Malaysia
Group B markets (basic packaged food and frozen products): Thailand Group C markets (unbranded products, and basic packaged products with some frozen
products): Indonesia, Philippines, Vietnam Group D markets (unbranded products, and some basic packaged foods): Cambodia,
Laos, Myanmar
0 - 1000 1 - 5000 5 - 10000 10 - 15000 15 - 20000 + 20000
Loose unbranded cereals
Basic packaged food
Basic frozen products
Health, variety, pre-prepared
Fresh and health
Chart: SG Heilbron, Source: The Economist, December 4, 1993
Figure 1: Changing patterns of food consumption as income rises
3.2.1.3 Urbanization The urbanization process together with rising income led to changes of food demand to using more processed food. In the Philippines, there is a strong demand for processed food from the middle and upper income consumer groups accounting for 15-20 percent of the population. The expansion of the urban sector and growth of middle class due to women entering the workforce has driven demand for consumer-ready food products. The convenience provided by processed food and improved distribution systems are some of the reasons for the increasing demand among working women. Opportunities are large in the processed meat, fish, fruit, dairy, beverage, snack foods and bakery categories. Based on the Food and Income Expenditure Survey (FIES) of the National Statistics Office in 2000, total household spending for processed fruits and vegetables amounted to P80.2 billion compared to P55.7

35
billion in 1997. Expenditures on processed fish and marine products reached P19B in 2000. Dried fish accounted for the bulk (54 percent), followed by canned fish (34 percent), salted fish (11 percent), and other processed products. Household spending on canned and uncanned meat preparations amounted to P32.4 billion in 2000. Uncanned meat accounted for two-thirds and the rest are canned meat. 3.2.1.4 Global Demand Demand in the world market for processed food has stimulated the growth of the industry in the ASEAN economies. For instance, in Philippines, processed foods are important sources of export earnings. The value of processed food exports from 1991 to 2005 exceeded the value of exports in the mid 1980s. In Thailand, the food processing industry grew rapidly during 1980-1985 in response to the world market demand, especially the developed countries such as USA, EU and Japan. In the seventh national plan (1992-1996), trade liberalization policies were implemented in accordance with the free trade movements under WTO. With 30 year development and experience in the world trade of food and agro-industrial product under considerable free market environment in the domestic market, Thailand become one of the leading food producing and exporting country in the world in 1990. Supply-side Drivers Industrialization Policy The food processing industry has received attention within the framework of export-led industrialization in developing countries, ASEAN included. This policy is viewed to drive the economy up the value chain by processing raw agricultural products to processed products. Various incentives were provided to achieve the industrialization objectives such as deregulation of FDI, free-trade zones (FTZ), and export processing zones (EPZ). This policy has been successful, and according to Athukorala and Sen (1998), the share of manufacturing exports in total world trade increased from 66 percent to 81 percent between 1970 and1994, and developing country share in manufacturing exports leapt from 6 percent to 24 percent. At the same time, the value of processed food in comparison with primary product exports (agriculture plus mining) increased from 26 percent to 37 percent. In general, middle and high-income developing countries have performed better than low-income countries in this respect. 3.2.2.2 Foreign Direct Investment FDI has played an important role in the food processing establishments, providing capital, technology transfer and organizational innovation. It is seen as transforming the competitive environment of the food industry in developing countries. Of particular concern here has been the growing combination in developing countries of poverty, malnutrition and obesity. On the other hand, the food processing industry has become a key source of employment opportunities and the evidence from Europe and Japan suggests that this will continue to be the case throughout the course of development. Ten years ago, discussions on food processing in developing countries were largely restricted to the employment benefits agro-industry could provide in the rural areas. This continues to be a key concern. Today,
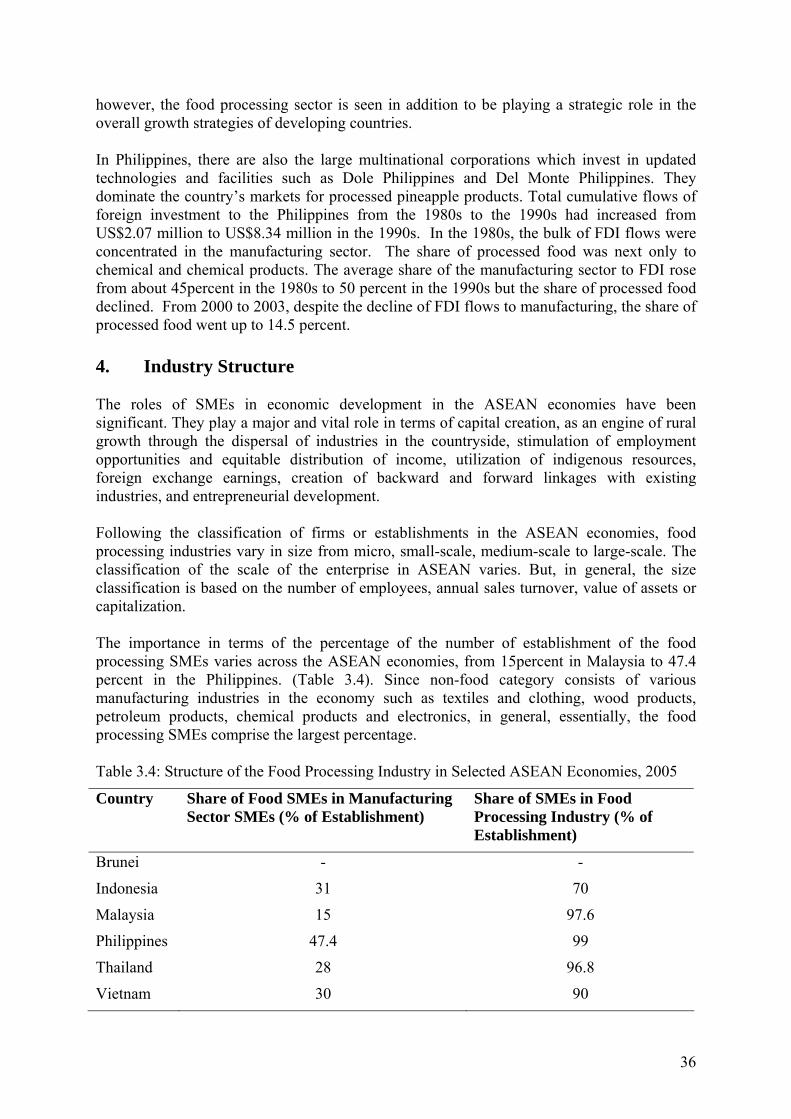
36
however, the food processing sector is seen in addition to be playing a strategic role in the overall growth strategies of developing countries. In Philippines, there are also the large multinational corporations which invest in updated technologies and facilities such as Dole Philippines and Del Monte Philippines. They dominate the country’s markets for processed pineapple products. Total cumulative flows of foreign investment to the Philippines from the 1980s to the 1990s had increased from US$2.07 million to US$8.34 million in the 1990s. In the 1980s, the bulk of FDI flows were concentrated in the manufacturing sector. The share of processed food was next only to chemical and chemical products. The average share of the manufacturing sector to FDI rose from about 45percent in the 1980s to 50 percent in the 1990s but the share of processed food declined. From 2000 to 2003, despite the decline of FDI flows to manufacturing, the share of processed food went up to 14.5 percent. 4. Industry Structure The roles of SMEs in economic development in the ASEAN economies have been significant. They play a major and vital role in terms of capital creation, as an engine of rural growth through the dispersal of industries in the countryside, stimulation of employment opportunities and equitable distribution of income, utilization of indigenous resources, foreign exchange earnings, creation of backward and forward linkages with existing industries, and entrepreneurial development. Following the classification of firms or establishments in the ASEAN economies, food processing industries vary in size from micro, small-scale, medium-scale to large-scale. The classification of the scale of the enterprise in ASEAN varies. But, in general, the size classification is based on the number of employees, annual sales turnover, value of assets or capitalization. The importance in terms of the percentage of the number of establishment of the food processing SMEs varies across the ASEAN economies, from 15percent in Malaysia to 47.4 percent in the Philippines. (Table 3.4). Since non-food category consists of various manufacturing industries in the economy such as textiles and clothing, wood products, petroleum products, chemical products and electronics, in general, essentially, the food processing SMEs comprise the largest percentage. Table 3.4: Structure of the Food Processing Industry in Selected ASEAN Economies, 2005
Country Share of Food SMEs in Manufacturing Sector SMEs (% of Establishment)
Share of SMEs in Food Processing Industry (% of Establishment)
Brunei - -
Indonesia 31 70
Malaysia 15 97.6
Philippines 47.4 99
Thailand 28 96.8
Vietnam 30 90

37
Within the food processing industry, in general, the industry is dominated by the small and medium enterprises (SMEs), as shown in Table 4. Except in Indonesia, where SMEs comprise 70 percent, in other countries, the SMEs are very dominance, where the percentage was all above 90 percent in 2005. In terms of output, the SMEs contribute a large share. In Malaysia, the contribution of SMEs to total processed food output was 84.4percent in 2005. 5. Issues and Challenges Issues and challenges that have been identified in the countries under study include: i. Product quality - A sizeable portion of the processed food products is produced by
the SMEs. The main challenges faced by most SMEs, especially in food manufacturing, are inaccessibility of their products to export markets due to low and inconsistent quality resulting from the adoption of poor technology, low level of processing knowledge as well as unattractive packaging and labelling.
ii. Changing consumer demand and food safety - today, consumers reign supreme and
is putting very different demands on the food system than ever before. The resulting changes include a different mix of food products purchased, greater demand for convenience foods, more concern about the nutritional quality of food, and a more justifiable concern about microbiological contamination of food. There is now increasing interest and concern for the way agricultural products are produced, processed and marketed. Food safety concerns are increasing pressure for more content labelling. Questions are being raised on certain agricultural production and processing practices such as the use of chemical inputs and processing technology that prolong the shelf-life of perishable goods.
iii. Transportation – high transportation costs and the monopolistic nature of the
shipping industry. iv. Adoption of technology – adoption of improved processing technology has been
observed to be low. This is attributed to the cost and availability of equipment suited for the production level of SMEs; lack of communication between the entrepreneurs, the academics and other research institutions.
v. Lack of support services – for small food processors which are mostly in the rural
sector, the lack of post-harvest facilities remain a constraint. Systems of handling contribute to post-harvest losses. Accredited laboratory facilities for analysis of foods are not available in the regions.
vi. Access to financial assistance – loans for food processors are available on a medium-
term basis at an interest rate of 16-20 percent. This arrangement becomes a constraint for small-medium-sized enterprises (SMEs) whose products are paid for on 30-90 days credit. Food processors are also pushing for a decrease in interest rates from 14 to 12 percent of medium-term loans and from eight to six percent for long-term loans.
vii. Trade restrictions – exports in general continue to face high tariffs and non-tariff
barriers that restrict market access to some countries. For instance, exporters have to comply with the numerous SPS such as the strict biosecurity regime in New Zealand, particularly tropical fruit and vegetable sap extract and the New Zealand and

38
Australian labelling requirements for processed seafood exports and rigorous licensing import requirements. Other technical barriers are the specific codes of conduct on environmental standards and certification regarding environmental management systems; and the social accountability standards on workers rights, health and safety of employees. All processed food exported to EU have to comply with HACCP requirements. The SMEs may have difficulty in implementing these requirements.
viii. Competitiveness – related to the ongoing trade liberalization, maintaining
competitiveness in the international market is a major problem of processed food exporters. Quality of a product is a critical factor in establishing a share in the world market. The threat of foreign imports is seen to intensify with the imposition of the 0-50 percent tariff rates in 2004. With the opening up of the market, competition with local producers may bring down domestic prices. Most of the above concerns affect the SMEs in food processing. Large scale establishments engaged in food processing integrate their downstream and upstream activities or outsource some a few of their activities or form subsidiaries to undertake specific activities.
ix. Human resource – SMEs are facing lack of critical mass of skilled manpower. Many
are home-based food processors lacking academic training in food science and technology and operate without the benefit of a formal business plan.
x. Marketing – SMEs in general have inadequate marketing network. xi. Capital - lack of capital is common among the SMEs in the ASEAN countries. xii. Credit – SMEs in general are facing credit problem in term of credit access from the
banks.
6. The Trade Liberalization Environment
The move towards trade liberalization at the multilateral level can be traced to the signing of the General Agreement on Tariff and Trade (GATT) in October 1987 in Geneva with only 23 founding members2. The rest was history, leading to the signing if the Uruguay Round Agreement in 1994 and the subsequent formation of the World Trade Organization (WTO) on 1 January 1995 with 128 founding members. Hence the start of the beginning of a world body that has the legal foundation and framework to enforce international trade to be conducted within acceptable boundaries of practices and codes of conduct.
After and even before and the establishment of the WTO, many key neighboring countries group together and negotiate to form regional free trade areas of their own. Relative decline of country’s competitiveness against other countries in other regions further propagate these regional free trade agreements. It was based on the ground that was better to “exploit for ourselves our own market” (Williams, 1993). Among the more notable ones were the European single market (European Community), the North American Free Trade Area
2 Australia, Belgium, Brazil, Burma, Canada, Ceylon, Chile, China, Cuba, Chzechoslovakia, France, India, Lebanon, Luxemburg, Netherlands, New Zealand, Norway, Pakistan Southern Rhodesia, Syria, South Africa, United Kingdom and the United States

39
(NAFTA), CCeennttrraall AAmmeerriiccaa FFrreeee TTrraaddee AArreeaa ((CAFTA) and in Asia was the ASEAN Free Trade Area (AFTA).
The failure of the multilateral system, to move fast enough has now led countries to sign bilateral free trade agreements (FTAs). This initiative was led by the U.S.A who apparently did not get what it wants or did not get it fast enough from the multilateral system. Now the U.S.A. has quite a number of FTAs with countries around the globe. Among them are with Australia, Bahrain, Canada, Chile, Israel, Jordan, Morocco, Oman, Peru and Singapore. It is still negotiating FTAs with Indonesia, Malaysia, Thailand and others.
Not to be left behind, other major trading nations also initiated their own FTAs including Japan, China, Australia, New Zealand and the higher income developing countries in Asia. ASEAN had also extended its free-trade initiatives by having “ASEAN-PLUS” and dialogue partner forums, such as ASEAN-Japan, ASEAN-China and ASEAN-Korea and ASEAN-EU.
What does all the above free trade agreements means to the signatory countries and what are their implications. This section briefly explains the environment of freer trade resulting form these agreements, especially the major ones that affects ASEAN member countries in particular.
6.1 The World Trade Organization (WTO)
The WTO membership as of July 2007 was I7I member countries, 28 countries more than when it was first formed in 1995. As was mentioned in the section 1, the WTO is a trade body that administers the implementation of the Uruguay Round Agreements. These agreements basically set the legal ground-rules for international commerce, trade in goods, services and intellectual properties. Trades disputes were to be settled through a dispute settlement mechanism and there were periodical trade policy reviews to improve transparency and greater understanding amongst members of these respective trade policies. The policy review also serves as a scrutiny platform by other members of the WTO
6.1.1 The UR Agreements and Outcomes
The “Goods Agreements” can be divided into agriculture and non-agriculture. The latter’s group covers all non-agricultural products such as manufactured products, fuels and mining products, fish and first products and forestry products.
In agriculture, the agreements focused on the three main pillars of reform; market assess, domestic support and export subsidies. Table 3.5 shows in brief the commitments that were required from developed and developing countries in the three respective pillars.
Most of the food processing products covered by this study falls order this category and covered buy the Agreement on Agriculture (AoA). However, products such as fish and fish products, rubber and forestry products, which are traditionally defied as agricultural product were placed as non-agriculture in the WTO. The currently negotiation were held under the non-agriculture market Access group (NAMA).
In agriculture, all members were required to bind their tariffs and subsequently reduce them from that bound levels. The 24 percent cut required from bound tariffs meant that average tariffs of developing countries have gone down from an average of 26.2percent in 1994 to

40
19.9percent in 2004 while developed country tariffs went down to an average of 7.2percent in year 2000 as compared to 11.3 percent before the UR Round Agreement. In fish and fish products, tariffs in developing were reduced from 34.1percent to 25.9percent during the same period. Apart from reductions, members were also required to grant minimum market access in the form of “tariff-quotas”, starting from a minimum of 3 percent of domestic consumption in 1995 to a minimum of 5 percent of domestic consumption at the end of the implementation period.
Table 3.5: The main elements of the Agreement on Agriculture of the WTO
Pillar Developed Countries Developing Countries
Tariffs
Average cut for all products
Minimum cut per product
-36percent
-15percent
-24percent
-10percent
Domestic Support
Total AMS cuts
-20percent
-13percent
Exports
Value of subsidies
Subsidized quantities
-36percent
-21percent
-24percent
-14percent
In domestic support, developed and developing countries need to cut their trade distorting support by 20 percent and 30 percent as well as export subsidies by 36 percent and 24 percent respectively within the some period. There two “policy-intervention” categories were extensively used mostly by developed countries or/and countries the OECD countries while their use by developing countries can be considered to be insignificant.
For industrial products, developed countries agreed to cut their tariffs from an average of 6.3percent percent to 3.8 percent, representing a reduction 40 percent. For developing countries, the percentage share of duty free imports marginally increased from 39 percent to 42 percent while tariffs above 15 percent will be reduced from 43 percent to 38 percent.
In the year 2000, WTO Ministers launched a new round of talks, known today as the Doha Round. This new round of negotiations was to address implementation related issues of the UR Round Agreement as well work on other issues. The whole work program is called the Doha Development Agenda (DDA), which also includes negotiations on services, market access for non-agricultural products (NAMA), trade-related aspects of intellectual property rights (TRIPS) ad a whole list of other issues. Among the major issues were the “Singapore issues” which were trade facilitation, competition policy, investment and government procurement.3 These negotiations were supposed to be concluded on 1 January, 2005 but the
3 The last three issues were dropped at the WTO conference in Cancun, 2002 as result of disagreement from developing country members.

41
deadline was missed. Another target set for end of 2006 was also missed and negotiations are still on going.
Although, there are short falls as well as difficulties at the multilateral level in moving liberalization to the next stage, the prospects remains that the future trade and investment scenario shall move forward towards a direction of increasing liberalism and freer markets where comparative advantage and competitiveness shall be the order of the day. All members of ASEAN except Laos are members of the WTO. 6.2 The ASEAN Free Trade Area (AFTA) The treaty establishing AFTA was signed in 1992 by the then ASEAN-6 comprising Brunei Darussalam, Indonesia, Malaysia, Philippines, Singapore and Thailand. The objective was to remove barriers to free trade among member states, consisting of tariff
reductions, eliminating quantitative restrictions and non tariff barriers. The AFTA was implemented mainly through the Common Effective Preferential Tariff scheme (CEPT). This scheme covers 98 percent of all tariff lines in ASEAN since 2003. Average CEPT rates have decreased from 5.37 percent to only 2.68 percent between 1998-2003. All agricultural products which were listed as sensitive by member countries were to have their tariffs eliminated or at least reduced to 5 percent by year 2010.4
Other liberalization initiatives include the “AFTA Plus” arrangements in 1995 where the scope of AFTA has been expanded to include issues such as intellectual property rights, information technology, competition laws, service trade and agreements on non-tariff barriers (Eurosource 2005). Other efforts to facilitate trade consisted of the “customs post clearance audit” (customs PCA) for facilitation of goods in transit and the mutual Recognition Arrangement (MRA) for use in conformity assessment of related standards and regulations.
In an audacious move towards economic integration of ASEAN is the creation of the ASEAN Investment Area (AIA). This agreement was signed in October 1998 and came into force in 1999. AIA was aimed at making intra – ASEAN investments easier by removing and lowing barriers, as well as make regulations more transparent and liberalized. ASEAN investors were to be given national treatment by 20105 and to non-ASEAN investors by 2020. The ultimate objective is to promote ASEAN as a single international destination for global investments by providing a conducive and competitive environment for business.
There is also a framework agreement in services known as AFATS, the “ASEAN Framework Agreement on Trade and Services”, signed in 1995. As of 2007, AFATS is now into its sixth package of commitments. To further facilitate intra-trade in services, MRAs for ASEAN were agreed for engineering, nursing, architectural and surveying qualifications.
In expanding further the region’s cooperation in trade and investments ASEAN has intensified its cooperation with its neighbors consisting of China, Japan and Korea under the ASEAN +3 arrangement. In 2002 ASEAN and the three countries agreed to study the options of establishing an East Asian Free Trade Area (EAFTA). The specific form and modalities of
4Specific extensions were given to new members consisting of Vietnam, Laos, Myanmar and Cambodia 5 By 2015 for the new members, Cambodia, Laos, Myanmar and Vietnam

42
liberalization for EAFTA are still under negotiations. It however covers a broad range of both economic and functional cooperations including agriculture, environment, finance, ICT, tourism, transnational crime, and SME development..
The ASEAN plan actually goes beyond just free trade areas and widening free trade with other trade partners. In 1997, ASEAN leaders adopted the ASEAN Vision 2020 which envisaged the establishment of a single ASEAN community by the year 2020. It is to be made of three pillars: an ASEAN Economic Community (APEC), an ASEAN Security Community (ASC) and on ASEAN Socio-cultural Community (ASCC) (Cuyrers, de Lombaerde and Veherstraeten, 2005). As with the European Community, the envisaged ASEAN Community is meant to be single market and production base with almost completely free flow of capital, goods, investment and services.
6.3 Asia –Pacific Economic Cooperation Forum (APEC)
APEC was established in 1989 with Australia as its initiator. Its objectives were to develop and strengthen the multilateral trading system, increase the interdependence and prosperity of member economies and promote sustainable economic growth (APEC 2006)
The forum, correcting of 21 developed and developing countries, aims to achieve free trade and investment by 2010 for developed countries and 2020 for developing countries. There are no binding commitments and liberalization is on a voluntary basis. The key areas of work are trade and investment liberalization, business facilitation and economic and technical cooperation.
The significance of APEC as a regional grouping appeared to fading in the light of more binding trade FTAs within or among the APEC member countries themselves and with others outside of APEC. Cuyress, de Lombaerde and Vesherstraeten (2005) attributed this “standstill” to two main reasons:
i. a relatively large membership with diverging options on the pace of liberalization and the means to get there, and
ii the APEC setback of its inability to manage the 1998 Asian financial crisis support the affected countries of which all were developing members. This somewhat built a negative atmosphere among members especially developing economies in APEC
APEC is also diverging into non-economic and trade issues such as terrorism and environment in which a full membership consensus to fully engage in these issues, in a forum which was originally meant to focus on trade and economic cooperation, was not there.

43
7. The Impacts of Trade Liberalization: Structure, Conduct and Performance In this section, the impacts of a more liberalized market on the structure, conduct and performance of the various industries studied in the respective ASEAN countries are analysed. The analysis would attempt to discern the salient developments and evolution of the industry, post liberalization, based on the SCP framework from both the specific-industry and the country’s perspective. 7.1 The Fruit and Vegetable Based Industrial Cluster: Processed Mango of the
Philippines and Processed Fruits and Vegetables of Thailand Both the mango and the fruits and vegetable industries of the Philippines and Thailand respectively are known to be internationally competitive. Being export oriented industries, their exports expanded resulting from global liberalization in the rules of trade. Philippine mango exports expanded from just above US$1 in the mid-1980s to its peak of US$30 million in 2003. Similarly total exports of fruit exports of Thailand increased from about TB15.6 million in the early 1990s to almost TB48 million in 2005. 7.1.2 Market Structure For the Philippine processed mango, the degree of market concentration of the 13 firms in the Philippine, measured through the concentration ratio (CR), Herfindahl-Hirschman Index (HHI), Gini coefficient and Lorenz curve showed that with more firms, the industry shares were spread out. With only five (5) firms in 1997, the 2-firm, 3-firm and 4-firm concentration ratios (CR2, CR3, CR4) were the highest at more than 90 percent each. The ratios decline as the number of firms increases to 13 (Figure 7.1). Nevertheless, the concentration ratios are high regardless of the number of firms. The two largest firms still control the processed mango industry. However, their market dominance declined, from above 90 percent in 1997 to only about 70 percent in 2005. Nevertheless the four-firm concentration ratio remained at above 90 percent albeit a decline from the high of 99 percent early in the period. Hence, evidence showed that processed mango is a large firm industry in the Philippines with the large firms dominating the market with less than 5 percent share hat could be attributed to the SMEs.
Figure 7.1: Concentration ratios of mango processing firms, Philippines
65.00
70.00
75.00
80.00
85.00
90.00
95.00
100.00
105.00
1997 1998 1999 2000 2001 2002 2003 2004 2005
CR2 CR3 CR4

44
However, there is no evidence of collusion among the large firms in order for them to raise their prices. Product quality, brand and packaging contribute to the large market share and pricing. The source of raw material and location of processing also counts. Those coming from Cebu City carry with it perceived quality premium as perceived by domestic consumers. The large mango firms also source part of their requirement of fresh mango as raw material for processing from other growers/processors (Personal interview, 2007b).
HHL and Gini coefficient measures were also in tandem with the CR indicators showing that the Philippine mango processing industry, though competitive were highly concentrated. In contrast to the Philippine mango case, where there were clear evidences of new players coming into the industry to take advantage of the expanding market and subsequently diluting the industry’s concentration, the structure of the fruit and vegetable processing industry in Thailand was almost stable. CR 4 remained in the range of 58 percent to 68 percent with no indication of a clear trend in changes of concentration (Table 7.1) Table 7.1. Thai canned fruit and vegetable processors, concentration ratois, and HHI
Year CR1 CR3 CR4 CR5 CR8 HHI1999 17.46 46.66 58.14 68.29 91.77 1,194.56 2000 19.79 48.79 59.13 69.38 89.34 1,229.74 2001 23.41 53.34 63.30 72.49 89.81 1,335.16 2002 28.57 56.50 67.82 73.95 90.21 1,513.77 2003 31.39 57.88 67.50 76.77 91.86 1,628.09 2004 28.51 54.08 64.14 72.88 92.36 1,496.06
Source: Department of Business Development, Ministry of Commerce
Similarly, the number of firms in the industry also did not show significant changes. This was true for all category of firm size (Table 7.2). Though the industry is still concentrated with CR at over 60 percent, there seemed to be still room for the small and medium scale players. This trend is consistent with a “mature competitive industry” where the industry structure had evolved over a long period through healthy competition.
Table 7.2: Number of canned fruit and vegetable processors, Thailand
Year Number of establishments (firms)
Small Medium Large Total 1999 47 63 47 157 2000 48 62 48 158 2001 50 67 50 167 2002 50 67 50 167 2003 52 68 51 171 2004 49 64 49 162

45
7.1.3 Market Conduct As expected, advertising expenses were positively related to the size of firm. Large mango processing firms in the Philippines spent more on advertising than their SME counterparts. Two of the large firms reported large annual advertising expense from 2002 to 2005. Their yearly ad-sales ratio ranged from 0.91 percent to 4.71 percent during the period. Even small and medium size firms also incur large advertising costs to beef up their market share especially when these are new entrants to the market. In 2004, one small size firm had ad-sales ratio of 3.55 percent and 6.20 for one medium size firm. Based on the records of the firms, advertising costs were more intensive from 2003 to 2005 compared to earlier years. This maybe partly attributed to the increasing competition among domestic mango processing firms, and the influx of substitute fresh and processed fruits from external markets under trade liberalization. Although no data was available for the processed fruits and vegetable industry in Thailand, a similar scenario was also envisaged. It was through advertising that firms can promote their product differentiation and maintain and enhance market share by preventing others from entering into their differentiated market segment. 7.1.4 Market Performance All profitability indicators pointed to the conclusion that bigger firms enjoyed more profits. For the Philippine processed mango industry, analysis on the rates of return on assets, equity and sales after tax showed that these indicators were better for larger firms as compared to the SMEs. In fact many SMEs suffered losses in many of the years, resulting in negative returns (Table 7.3)
Table 7.3: Rate of return on sales (ROS) after tax of mango processing firms Philippines, 1997-2005
Company No. 1997 1998 1999 2000 2001 2002 2003 2004 2005 In Percent
SMEs 1 ** ** ** ** ** ** (97.92) (7.22) (111.94)2 ** ** 4.43 4.59 2.21 ** 2.30 0.22 0.40 3 ** ** (71.05) (60.99) (266.11) (278.31) ** (60.34) *4 ** 1.46 1.05 0.21 1.11 (6.30) 2.23 1.85 2.41 5 ** 8.00 12.54 ** (5.71) 0.13 4.13 2.18 **6 ** (289.19) (288.66) (48.00) 1.39 (55.67) 3.95 3.18 3.97 7 0.54 (2.84) 0.14 (5.88) 0.87 (2.48) 1.12 0.91 1.35 8 ** ** ** ** 1.58 0.71 1.04 0.51 0.60 9 0.45 1.28 1.46 0.56 0.37 0.28 0.30 0.20 0.20
10 0.05 0.11 (2.82) 2.32 0.87 0.98 0.88 1.52 Large
10 1.22 11 36.72 73.47 66.12 49.36 52.40 74.35 18.15 14.53 28.65 12 ** 15.77 11.24 1.10 ** 3.87 2.72 (0.23) (25.69)13 0.79 0.18 0.44 2.49 1.83 1.93 1.51 1.48 1.59
* Incomplete records for the year. ** No report for the year.

46
This is further confirmed by the findings of the performance of the processed fruit and vegetable industry in Thailand. Except for one year in the series, the small and medium firms suffered net losses (Table 7.4). In contrast, the large firms as a whole consistently made profits, although overall, over time the margin of profits were getting smaller. It was most possibly the case of increasing competition in the export markets that led to this shrinking in profits of the industry. It seems that “large” is necessary condition for profits in this industry.
Table 7.4: Average net profit of canned fruit and vegetable processors, Thailand
Average net profit of canned fruit & vegatable processors (baht)
Year /Category Small Medium Large
1999 -96977.78 -1152243 40,470,110.28
2000 -24353.26 -936668.49 10,648,732.15
2001 -82390.28 -1931511.18 19,926,378.48
2002 -11893.3 167816.45 15,055,389.25
2003 727146.15 -496323.69 5,927,212.73
2004 -55931.01 -480646.41 9,882,169.81
7.2 The Fish and Seafood Based Industrial Cluster: Processed Tuna of the
Philippines, Seafood Industry of Thailand and Fish Products of Indonesia 7.2.1 Market Structure The market structure for this cluster showed different developments for the three different countries. As with the mango processing industry, the increased liberalization of the tuna markets resulted in more entrants into the market to take advantage of the business opportunities from an expanding international market (Figure 7.2). The CR2, CR3, were higher with lesser number of canneries in the earlier years and vice-versa. Concentration ratio generally tends to decline as more firms entered the industry. Nevertheless, overall concentration was high, with seemingly lesser role for the SMEs. There, however, appeared to be healthier competition as CR2 and CR3 showed definitive decreasing concentrations.
Figure 7.2: Concentration ratios of tuna canneries, Philippines, 1997-2005
35
45
55
65
75
85
95
1997 1998 1999 2000 2001 2002 2003 2004 2005
CR2 CR3 CR4

47
In Indonesia, the concentration ratio in fish product was relatively stable between 1995 and 2004, except between mid 1996 and mid 1998, which show significant increases (Figure7.3). Concentration ratio in this industry show relatively low value compare with other industry, which CR 2, CR 3 and CR 4 value are 39.97, 49.37 and 56.93 percent respectively. High concentration of these industries only took place during the monetary crisis in 1997/1998, due to the collaspse of many firms during the period.
Figure 7.3. Concentration Ratio of Fish Processing Industry, Indonesia, 1995 to 2005 Source : Central Bureau Statistic (CBS) (Calculated)
The scenario in Thailand was opposite of that of the Philippines. All the market concentration indicators showed increasing concentration as the market continues to liberalize. All calculated values of CR1, CR3 and CR5 increased from 17.5 and 63 per cent in 1999 to 21, 52 and 67 per cent in 2004, respectively (Table 7.5). There was a definitive tendency for larger firms in dominating the market. The computed HHI which showed increases from 1,126 in 1999 to 1,319 in 2004 also reflected increasing market dominance of the industry. The estimated market share showed that the small size firms had very small share fluctuated between 0.37 per cent in 2000 to 0.73 per cent in 2002, and fall to 0.48 per cent. The medium size firms’ market share was at 14.14 per cent in 2000 and then it went down almost every year to 11.68 per cent.
Table 7.5. Thai sea food processors, concentration rations, and HHI
-
10.00 20.00 30.00 40.00 50.00 60.00 70.00 80.00 90.00
1995 1996 1997 1998 1999 2000 2001 2002 2003 2004 2005 Year
Percent
Cr 2Cr 3Cr 4
Year CR1 CR3 CR4 CR5 CR8 HHI1999 17.34 45.57 54.66 63.04 85.67 1,125.89 2000 17.60 43.93 56.04 64.09 86.79 1,127.43 2001 18.81 45.88 57.58 66.52 87.61 1,164.84 2002 16.45 46.01 56.33 64.39 86.53 1,135.84 2003 19.36 47.47 56.64 65.17 86.89 1,215.11 2004 21.30 51.69 59.76 67.30 88.29 1,319.23
Source: Department of Business Development, Ministry of Commerce

48
7.2.2 Market Conduct Advertising-sales ratio for canned tuna of Philippines ranged from 0.003-79.19 percent. The higher bound ratio refers to the newly registered SME cannery in 2004 which invested heavily on advertising to gain market share of canned tuna. Meanwhile, the lower bound ratio refers to one of the large canneries which was registered way back in 1984. One of the large canneries which mainly sell in the domestic market and whose brand is the most popular in the country, continuously invested in advertising. Its ad-sales ratios ranged from 1.53 in 1998 to 29.82 in 2003. The two canneries with the largest annual sales did not report any advertising cost for all the period where they have their financial records available. Generally, sales of canneries started to pick-up following the reduction of the EU tariff imposed on Philippine canned tuna from 24 to 12 percent. There were no market conduct indicators to analyse for the Thailand and Indonesia’s cases. 7.2.3 Market Performance As with the previous cluster, size of firms contributed to their market performance. As was the case for Philippine’s canned tuna, one large company had the highest ROA of about 71 percent in 2005; another with an ROE of about 232 percent in 2001, and another with the highest ROS of 23 percent in 2003. (Table 7.6). The other SME cannery has positive ROA, ROE and ROS. Formerly a large cannery, it opted to operate moderately as the canned tuna export market has become very competitive due to trade liberalization. Similarly for Thailand, the average net profits of small and medium size firms were mostly negative. Only the large size firms had positive net profit during the period. A rapid declining trend of net profits was observed starting from 2001. This was most likely to the intensification of competition as the markets increasingly liberalized. The total net profit of all firms shared the same pattern trend and fluctuation as that of the large size firms (Table 7.7). In 1999, there were 6 registered public companies out of the top-10 firms, while in 2004 the number decreased to 4 out of 10 firms. The highest principal revenue firm has been alternating between 2 limited companies during 1999-2001, and then the public company was ranked the second from 2002 onward in which the total principal revenue was more than 8,000 millions of baht per year. From the interview, the reason for the higher number of public company in this industry was due mainly to the increasing need for investments and expansion of the industry in which heavy capital investment in modern technology to keep up with the dynamic development of world market. Analysis on the sea food processors showed a very similar situation like that of canned fruit and vegetables processors that is the domination of large firms and the very low share of small firms. One reason is the difference in products and market served of firms. This also reflects the divergence of scale of investment and operation. It was pointed out by the industry that some small and medium firms faced difficulties of meeting the hygienic and food safety requirements for export markets. Therefore, these firms could not derived benefit from the trade liberalization directly. Nevertheless, these firms derived indirect benefit of trade liberalization through the domestic market expansion due to the economic growth

49
Table 7.6. Market performance measures of tuna canneries, Philippines, 1997-2005
Company No. 1997 1998 1999 2000 2001 2002 2003 2004 2005
SME 1 11.35 (23.45)2 0.50 2.96 4.32 3.22 3.74 1.07
Large 2 0.61 1.11 2.293 ** 0.22 0.57 0.08 0.68 0.84 1.24 0.75 0.314 14.98 11.645 (14.45) 8.44 (18.24) 9.57 28.32 13.76 2.01 2.55 1.156 ** ** ** ** 0.03 1.78 (7.16) 16.54 71.497 0.65 3.78 0.75 0.82 0.92 1.35 1.40 1.95 **8 ** 1.09 0.58 1.22 2.02 0.87 1.07 0.47 0.109 ** ** ** ** 10.63 (2.01) 12.11 11.27 0.07
SME 1 (366.14) (1088.69)2 1.32 6.45 8.41 6.33 7.39 2.03
Large 2 2.84 3.60 7.603 ** 57.36 44.55 49.18 17.93 4.99 7.68 6.60 5.364 24.04 16.365 152.37 19.05 (632.00) (39.79) 232.89 27.52 8.93 (18.65) (9.27)6 ** ** ** ** 1.70 11.93 (14.32) (101.88) (148.17)7 13.86 19.32 12.78 9.43 2.23 3.00 2.84 3.98 **8 ** 3.87 2.20 3.41 7.73 30.42 39.25 48.38 55.549 ** ** ** ** 51.58 (19.46) 38.94 16.28 (0.14)
SME 1 (128.27) (11.51)2 0.15 0.58 0.64 0.59 0.44 0.20
Large 2 0.14 0.16 0.643 ** 4.99 6.92 9.78 4.97 1.01 0.90 0.86 0.664 6.24 4.295 8.13 1.92 (3.14) 5.36 14.14 2.91 1.02 (2.04) (1.02)6 ** ** ** ** 1.07 0.75 (0.87) 4.15 14.177 6.05 7.42 8.48 8.31 1.98 2.37 23.00 2.30 **8 ** 0.24 0.14 0.28 0.47 1.76 2.28 2.27 2.639 ** ** ** ** 2.33 (1.01) 3.44 2.54 (0.02)
In Percent
not yet established
not yet established
not yet established
Rate of Return on Assets after tax (ROA)
not yet established
Rate of Return on Sales after tax (ROS)
not yet established
not yet establishedRate of Return on Equity after tax (ROE)

50
CR4
75.00%
80.00%
85.00%
90.00%
95.00%
100.00%
105.00%
1997 1998 1999 2000 2001 2002 2003 2004 2005
CR4
Table 7.7: Thai average net profit sea food processors (firms), and total processors 7.3 The Flour Industry Cluster: Indonesia and Thailand 7.3.1 Market Structure
The market structure of the flour industry in Indonesia is a classical example of an evolution from government-controlled perfect monopoly to an oligopolistic market which is more competitive. As shown by Figure 7.4 below, the required IMF reforms imposed on Indonesia forced the Indonesian government to open its market and imports to other firms as well other than the “single-desked” BULOG and its affiliate Bogasari. This transformed the domestic wheat flour market in the country. The concentration ratio plunged during the deregulation era of 1997 – 1999 with new entrants into the market. CR4 declined from almost 100 percent before 1997 to about 85 percent in 2002/2003. However, due to the “lead-market” advantage Bogasari has over other players, it was able to regain its market share resulting in CR4 to again increase thereafter.
Figure 7.4. Market concentration ratio of flour industry, Indonesia Source: APTINDO (2006), computed by TREDA
Average net profit sea food processors (firms) (baht) Year/Category Small Medium Large
1999 (85,446.43)
(211,666.67)
48,145,196.43
2000 (88,258.62)
379,191.10
55,608,412.86
2001 (219,550.13)
(1,551,412.21)
60,560,132.23
2002 (373,694.67)
(3,913,004.15)
30,899,822.20
2003 (137,629.33)
(3,579,093.63)
36,695,792.70
2004 44,936.72
(1,219,783.44)
38,591,866.33

51
Trade liberalization has distributed market share more evenly. The indication is shown by the value of Gini coefficient in 2002 which was 0.559 compare to 0.585 in 1997, by to 2005 Gini cefficient slightly increased to 0.63. It is imperative to see that trade liberalization reduces dominant firm to set higher prices in the industry. The essence is that import pressure can alter pricing strategy of dominant firm and it will endorse for other firms to obtain market share, while trade restriction due to imposing anti dumping duty on imported goods created dominant firm to obtain more market share. In Thailand, the total number of flour-mill firms increased slowly from a total of 98 mills in 1999 to 118 mills in 2004. The medium size mills accounted for 38 per cent of the total, while the rest were equally divided into small and large size. The total assets of firms that were used for classifying small, medium and large size firm were decreasing. In 1999, the small size firms’ the total asset was less than or equal to 7.59 millions of baht, while in 2004 the total asset was decreased to less than or equal to 5.85 millions of baht. However, the total principal revenue of the flour-mill firms was steady increase from 17,140 millions of baht in 1999 to 25,043 millions of baht in 2004 (Table 7.8.). The estimated market share showed the domination of large size firms at 82 per cent in 1999 and expanded to 87 per cent in 2004. The expansion of the market share of large firms was at the expense of the diminishing market shares of both small and medium size firms. These were supported by the decreasing average principal revenue of the small size firms and that of the medium size firms was almost constant during the 1999-2004. The small size firms’ market share was less than 3 per cent in 1999 and drop to only 0.53 per cent in 2004. Although the market share of the medium size firms’ market share was slightly decreasing, these firms were able to maintain the market share at more than 12 per cent in 2004 (Table 7.8). In terms of market performance of the flour milling industry, the total net profit of flour mills industry depicted an upward trend from 1,872.17 millions of baht in 1999 to 2,950.81 millions of baht in 2004. Most of the net profit was belong to the large size flour mills of which the average net profit increased from 22.7 to 33.9 millions of baht. During this period, the average net profit of the small size flour mills was negative, except in 2001. The similar situation was found for the medium size flour mills, only there were 2 years (2003 and 2004) that the net profits were positive. That means, on the average, some of the small and medium size flour mills were operating at loss (Table 7.9)

52
Table 7.8: Thai number of establishment of flour mills, average principal revenue of firm and market share by size of firms
Year TotalSmall Medium Large Total Small Medium Large Mil. Baht Small Medium Large Total
1990 30 38 30 98 13,381,227.27 68,563,935.48 471,107,357.14 17,140.09 2.34 15.20 82.46 1002000 29 38 29 96 11,813,793.10 63,198,812.50 556,017,310.34 18,868.66 1.82 12.73 85.46 1002001 33 42 33 108 6,790,005.90 59,791,353.83 467,773,130.02 18,171.82 1.23 13.82 84.95 1002002 35 47 35 117 5,457,282.87 49,992,730.51 513,299,608.28 20,506.15 0.93 11.46 87.61 1002003 37 50 37 124 2,869,432.30 53,987,047.36 509,578,178.86 21,659.91 0.49 12.46 87.05 1002004 36 46 36 118 3,697,910.15 68,063,764.97 604,990,314.17 25,043.71 0.53 12.50 86.97 100
Remarks:The size of firm small (S), medium (M), and Large (L) are classified according to the total assets of firm in baht in each year as follows1990 [S(30) <= 7,596,800.00 < M(38) <= 105,151,300.00 < L(30)], 2000 [S(29) <= 7,100,500.00 < M(38) <= 114,676,000.00 < L(29)]2001 [S(33) <= 6,045,882.37 < M(42) <= 101,494,209.16 < L(33)] , 2002 [S(35) <= 6,221,859.82 < M(47) <= 98,748,075.37 < L(35)]2003 [S(37) <= 5,673,876.63 < M(50) <= 102,438,333.49 < L(37)], 2004 [S(36) <= 5,857,654.78 < M(46) <= 123,602,046.26 < L(36)]Source : Department of Business Development, Ministry of Commerce
Number of establishments (firms) Average principal revenue of firm (baht) Market share of firm (%)
Table 7.9 Thai average net profit of flour mills by size and total net profit of all flour mills
Total of all flour millsSmall Medium Large mills (Mil. Baht)
1999 (41,250.00) (114,361.11) 22,727,000.00 1,872.17 2000 203,379.31 (217,722.22) 62,407,586.21 5,330.73 2001 (73,114.87) (54,421.79) 28,078,470.59 2,384.35 2002 (52,029.76) (1,029,087.63) 27,257,350.88 2,376.18 2003 (106,934.16) 889,930.95 34,458,989.66 3,010.60 2004 (150,797.30) 433,550.46 33,868,947.29 2,950.81
Remarks:The size of firm small (S), medium (M), and Large (L) are classified according to the total assets of firm in baht in each year as follows1990 [S(30) <= 7,596,800.00 < M(38) <= 105,151,300.00 < L(30)], 2000 [S(29) <= 7,100,500.00 < M(38) <= 114,676,000.00 < L(29)]2001 [S(33) <= 6,045,882.37 < M(42) <= 101,494,209.16 < L(33)] , 2002 [S(35) <= 6,221,859.82 < M(47) <= 98,748,075.37 < L(35)]2003 [S(37) <= 5,673,876.63 < M(50) <= 102,438,333.49 < L(37)], 2004 [S(36) <= 5,857,654.78 < M(46) <= 123,602,046.26 < L(36)]Source : Department of Business Development, Ministry of Commerce
Average net profit of flour mills (baht)

53
The estimated value of CR1, CR3, and CR5 portrayed an upward trend starting from 1999 until 2004. However, there was no single firm dominated in the industry (CR1 was less than 31 per cent). The percentages of CR3 were in the range between 50.06 to 60.42 per cent which were slightly more than 50 per cent, while that of the CR5 were in between 67.30 to 74.42 per cent that was somewhat higher than 67 per cent which suggested some degree of market domination in the industry. Nevertheless, the calculated HHI were between 1,252.77 and 1,619.74. These means there are concentration in the industry. Both indicators suffice one to say that there was slightly degree of market domination during 1999 -2003, and then there was a tendency of higher degrees of industry domination in 2004 that was indicated by an increase of all computed indicators (Table 7.10) Table 7.10: Thai flour mills, concentration ratios, and HHI
Year CR1 CR3 CR4 CR5 CR8 HHI1999 22.17 51.91 60.00 67.88 89.40 1,339.03 2000 24.09 50.83 59.31 67.30 89.05 1,350.74 2001 25.81 52.17 61.24 69.06 89.41 1,377.93 2002 23.90 58.43 65.63 72.39 90.56 1,425.25 2003 20.95 50.06 58.81 67.54 89.11 1,252.77 2004 30.80 60.42 67.68 74.42 90.91 1,619.74
Source: Department of Business Development, Ministry of Commerce
The above results showed that the flour-mill firms are dominated by the large size firms with profitable business operation. However, the small and medium size firms experienced with operating at loss in this sub-sector. The flour-mill industry expressed that the industry has been adopting modern technology so as to take advantage of the new trade liberalization and quality standard. The investment in modern processing and quality improvement equipments requires sizable amount of funding of which some small and medium size firms might not be able to generate necessary financial credits. As a result, only those medium size firms with strong financial credit supports were able to investment of necessary modernized processing equipments so as to stay in the business.

54
7.4 The Soy-Sauce Industry Cluster: Philippines and Indonesia 7.4.1 Market Structure The high degree of concentration of the Philippine’s soy sauce market is shown in Figure 6. The share of the two largest firms ranged from 85-93 percent. The largest firm alone controls two-thirds of the market in 2004-2005 and 46-66 percent the previous years. Overall market concentration in the industry was increasing as markets become more liberalized. SMEs, though still have market shares of between 7-15 percent in 1999-2005. \
Figure 7.5: Concentration ratios of soy sauce manufacturers, Philippines, 1999-2005
Number of firms: 1999(4), 2000-2003(6), 2004-2005(2)
In Indonesia, similar to the one in the Philippines, the soy sauce industry was also dominated by the big players (Figure 7.6). The CR2 showed a very strong indication of monopoly with concentration ratio of 60 percent in 2005. CR 3 also showed similar increases in market dominance by the big players, increasing from 48 percent in 1995 to 80 perecent in 2005. concentration ration was 80 percent. The four biggest player of soy sauce are PT. Heinz ABC Indonesia, PT. Anugrah Setia Lestari, PT. Anugrah Lever and PT. Indosentra Pelangi with its branded product of ABC, Bango and Indofood respectively. These products are well differentiated and it is rather difficult for smaller firms to compete with these established firms.
80.0
82.0
84.0
86.0
88.0
90.0
92.0
94.0
96.0
98.0
1999 2000 2001 2002 2003 2004 2005
CR2 CR3 CR4

55
0,00
10,00
20,00
30,00
40,00
50,00
60,00
70,00
80,00
90,00
100,00
1995 1996 1997 1998 1999 2000 2001 2002 2003 2004 2005
(%)
Year
Concentration Ratio of Soysauce
CR2 CR3 CR4
Figure 7.6: Concentration Ratio of the Soy-Sauce Industry, Indonesia
7.4.2 Market Conduct Information is only available for the soy sauce in the Philippines. The second largest soy sauce manufacturer and one SME which carry its company name as brand of its products has continuously spent for advertising for the whole 1999-2005. The largest firm (reported advertising expense except in 2005. For this firm, sales went up as advertising cost increased, its annual ad-sales ratio was 10.47 percent, on average. The direct relationship between advertising cost and sales was also observed for the other large firm, one of the most popular brand of soy sauce in the country, except in 2001 when sales continued to increase even with reduced advertising cost. This firm had also the highest ad-sales ratio of more than 13 percent in 2000. Here again the promotion of product differentiation through advertising was evidenced. 7.4.3 Market Performance Two SME companies reported losses. The larger of the SME incurred net losses in 2000, 2002 and 2004 and the smaller SME in 2001 and 2002. Both the SMEs also reported negative equities in some years as their losses were apparently written off from their equities. Except for those firms, the other SMEs have positive rates of returns on assets (ROA), equity (ROE) and sales (ROS). The large firms performed favorably during the reference period as shown by the three (3) measures of market performance (Table 7.11).

56
6,96,3 6,0 5,9 5,7
3,62,9
1,8
0
1
2
3
4
5
6
7
8
1995 1998 2000 2001 2002 2003 2004 2005year
ROA
Table 7.11: Market performance measures of soy sauce manufacturers, Philippines
In Indonesia,. soy sauce return on assets (ROA) showed gradual decrease during 1995 to 2005 from 6.9 in 1995 to 1.8 in 2005 (Figure 7.7). Trade liberalization has put pressure on the soybean industries for new capital investments to enhance efficiency resulting in lower ROA. This clearly shoed that the market in soy sauce industry in Indonesia is more competitive after trade liberalization.
Figure 7.7. ROA for soy sauce industry in Indonesia
Company No. 1999 2000 2001 2002 2003 2004 2005
SME 1 0.42 0.40 (14.59) (7.13) 1.86 0.98 1.102 0.10 0.76 2.08 0.75 1.82 ** 8.233 ** 3.49 3.31 4.52 4.23 4.42 3.424 (1.23) (33.56) (22.86) (28.56) (1.02) (50.94) **
Large 5 ** 4.96 4.24 3.62 10.29 10.46 5.056 ** 6.83 8.88 9.65 9.03 9.05 8.59
SME 1 2.38 3.56 (691.32) (80.20) (21.83) (13.04) (14.96)2 5.07 38.04 51.96 16.38 27.24 ** 26.553 ** 9.91 8.60 12.62 11.71 12.34 13.454 (0.67) (23.95) (16.07) (10.42) (13.45) (10.28) **
Large 5 ** 8.51 7.41 6.72 19.94 24.15 24.006 ** 13.02 16.23 17.29 14.64 14.21 13.95
SME 1 0.31 0.38 (17.59) (7.97) 1.28 0.87 0.872 0.04 0.36 0.96 0.32 0.82 ** 0.913 ** 1.67 1.67 1.23 1.27 1.27 1.154 (0.70) (32.55) (24.13) (14.94) (1.86) (22.84) **
Large 5 ** 3.04 1.88 1.38 3.56 3.63 3.776 2.16 3.03 3.93 4.42 4.36 4.30 4.06
Rate of Return on Asset after tax (ROA)
Rate of Return on Equity after tax (ROE)
Rate of Return on Sales after tax (ROS)
In Percent

57
The Rice Milling Industry Cluster; Thailand and Vietnam 7.5.1 Market Structure The Thailand and Vietnam rice industries are considered to be among the most competitive in the world. Here is a unique situation where clear global leadership of the markets resulted in all round gains for all industry players. From Table 7.12, it can be seen that there was steady increase in the number of firms operating in the industry. Despite of this, market concentration ratios were mainly constant except for CR1 where its market share jumped to 53 percent in 2004. Other concentration ratios over the years were quite consistent. The increasing number of firms entering the industry in a situation of increasing market concentration ratio was quite unique. Even without looking at the market performance indicators one could safely derived that even the small players were benefiting from the expansion in the export markets. Table 7.12. Thai number of establishment of rice mills, concentration rations, and HHI
Year No. firms CR1 CR3 CR4 CR5 CR8 HHI1999 726 39.13 66.95 76.91 86.05 96.01 2,160.28 2000 732 39.69 72.42 82.67 87.45 95.41 2,270.94 2001 756 31.53 69.61 79.74 87.29 96.22 1,945.16 2002 797 31.49 71.84 80.60 86.13 95.60 2,103.39 2003 840 23.56 66.60 76.91 82.39 94.77 1,838.22 2004 848 53.08 71.62 79.54 84.08 95.45 3,128.12
Source: Department of Business Development, Ministry of Commerce The was also this point of view from the rice-mill industry that medium size firms are more flexible in adopting marketing strategy and the high sale volume did not always ensure more profits to the firms. More over, the present over capacity of rice mills in Thailand could create problems on shortage of row materials for large rice mills. Vietnam is still evolving from a centrally planned economy to market economy. The government still has substantial control on trading and as such the state own enterprises (SOEs) still enjoyed “monopolistic-related” privileges. Vinafood 2, a SOE, usually holds a first position among the eight leading rice exporting companies and shares with more than 7% of the country’s rice and food market. Vinafood 1 held the second position in 2004 (with 2 % of market share) and the third position in 2006. An Giang Tourimex company advanced to the second position in 2006 sharing 4.38% of the country’s rice and food market. The market share of the eight leading companies in 2004 was as much as 83% of the country’s market and slightly decreased to 72.5% in 2005. In 2006, market share of the eight companies continued to grow, achieving nearly 95% of the country’s market (Table 7.13).

58
Table 7.13: Concentration in the rice industry, Vietnam No 2004 2005 2006 Company Value
(mill. USD)
(% Company Value (mill. USD)
Percentage (%)
Company Value (mill. USD)
Percentage (%)
1 Vinafood 2*
413.9 48.17 Vinafood 2* 692.8 54.15 Vinafood 2* 652.1 54.59
2 Vinafood 1*
122.6 14.27 Thot Not General Commerce (GENTRACO) *
73.5 5.74 An Giang Tourimex
179.3 15.01
3 Dong Thap Foods-Agriculture (DARGIMEX)*
49.6 5.78 An Giang Import-Export (ANGIMEX)*
55.1 4.31 Vinafood 1* 178.4 14.93
4 Vinh Long Food*
41.7 4.85 Dong Thap Foods-Agriculture (DARGIMEX)*
30.4 3.38 Dong Thap Foods-Agriculture (DARGIMEX)*
37.6 3.14
5 Thot Not General Commerce (GENTRACO)*
34.2 3.98 Kien Giang Trading (KIGITRACO
28.2 2.2 Long An Food *
36.7 3.07
6 Long An Food*
29.3 3.41 An Giang Tourimex
15.1 1.18 Kien Giang Trading (KIGITRACO
35.5 2.97
7 Kien Giang Trading (KIGITRACO)
17.4 2.03 Techno-agricultural Supplying Joint Stock (TSC)
10.0 0.78 Binh Dinh Food Co Limited (BIDIFOOD)
14.7 1.23
8 Techno-agricultural Supplying Joint Stock (TSC)
12.5 1.45 Can Tho Agricultural Products and Foodstuff Export Co (MEKONIMEX)
9.8 0.76 Me Kong Company (MKC)
7.7 0.64
7.5.2 Market performance Table 7.14 showed the performance of the respective category of firms in the rice industry in Thailand. As can be seen, average principle revenue increased for all categories of firms, small, medium and large. Net profits for all rice mills also exhibited significant increases. As suspected, this is a clear case of liberalization that brought about benefits all round (Table 7.15)

59
Table 7.14: Thai number of establishment of rice mills, average principal revenue of firm and market share by size of firmsYear Total
Small Medium Large Total Small Medium Large Mil. Baht Small Medium Large Total1990 218 290 218 726 7,332,104.16 14,980,428.02 77,453,226.60 22,827.53 7.00 19.03 73.97 1002000 220 292 220 732 6,755,321.17 18,675,258.04 76,551,283.82 23,780.63 6.25 22.93 70.82 1002001 227 302 227 756 8,068,417.24 18,954,882.08 85,401,497.30 26,942.04 6.80 21.25 71.95 1002002 239 319 239 797 9,922,164.72 25,770,137.64 105,431,924.13 35,790.30 6.63 22.97 70.41 1002003 253 335 152 740 11,972,185.69 33,384,482.58 134,341,173.60 34,632.62 8.75 32.29 58.96 1002004 255 338 255 848 15,936,046.83 41,614,238.08 167,020,099.67 60,719.43 6.69 23.16 70.14 100
Remarks:The size of firm small (S), medium (M), and Large (L) are classified according to the total assets of firm in baht in each year as follows1990 [S(218) <= 1,942,000.00 < M(290) <= 5,975,500.00 < L(218)] , 2000 S(220) <= 2,002,900.00 < M(292) <= 5,985,400.00 < L(220)]2001[S(227) <= 2,338,321.10 < M(302) <= 7,646,868.75 < L(227)] , 2002 [S(239) <= 2,869,199.20 < M(319) <= 10,419,911.86 < L(239)]2003 [S(253) <= 3,500,000.00 < M(335) <= 14,516,851.86 < L(252)] , 2004 [S(255) <= 4,940,734.07 < M(338) <= 19,265,135.66 < L(255)]Source : Department of Business Development, Ministry of Commerce
Number of establishments (firms) Average principal revenue of firm (baht) Market share of firm (%)
Table 7.15: Thai average net profit of rice mills by size and total net profit of all rice mills
Total of all rice millsSmall Medium Large mills (Mil. Baht)
1999 48,022.02 132,250.00 316,047.20 118.002000 35,074.77 197,122.70 496,817.50 175.002001 53,070.14 219,691.90 822,994.80 265.002002 102,025.80 394,335.30 425,665.40 252.002003 148,463.70 467,724.60 561,025.20 336.002004 196,656.80 667,577.90 252,851.10 340.00
Remarks:The size of firm small (S), medium (M), and Large (L) are classified according to the total assets of firm in baht in each year as follows1990 [S(218) <= 1,942,000.00 < M(290) <= 5,975,500.00 < L(218)] , 2000 S(220) <= 2,002,900.00 < M(292) <= 5,985,400.00 < L(220)]2001[S(227) <= 2,338,321.10 < M(302) <= 7,646,868.75 < L(227)] , 2002 [S(239) <= 2,869,199.20 < M(319) <= 10,419,911.86 < L(239)]2003 [S(253) <= 3,500,000.00 < M(335) <= 14,516,851.86 < L(252)] , 2004 [S(255) <= 4,940,734.07 < M(338) <= 19,265,135.66 < L(255)]Source : Department of Business Development, Ministry of Commerce
Average net profit of rice mills (baht)

60
7.6 Carageenan – The Case of the Philippines 7.6.1 Market Structure. The concentration ratios show, the market for the 5 firms were highly concentrated (Figure 7.8). The large firms control the market for processed seaweed and carageenan. The market share of the two large firms comprised more than two-thirds of the total market. The three firms (2 large and one medium size) dominated the market with as high as 92 percent share. In 2005, the 3 firm concentration ratio was 95.4 percent, leaving less than 5 percent to the rest of the SMEs. The highly concentrated market is also indicated by the high Herfindahl Hirschman Index), the index decreases as there were more firms in the market.
Figure 7.8. Concentration ratios of carageenan processors, Philippines
Number of canneries: 1997-1998(2), 1999-2000(3), 2001-2004(4), 2005(5) 7.6.2 Market Conduct Based on available records, only one of the 5 corporations, the second largest, spent for advertising in 2002, 2003 and 2005. Its advertising–sales ratio, however, were less than one percent (Table 7.16).
50.0
55.0
60.0
65.0
70.0
75.0
80.0
85.0
90.0
95.0
1997 1998 1999 2000 2001 2002 2003 2004 2005
CR1 CR2
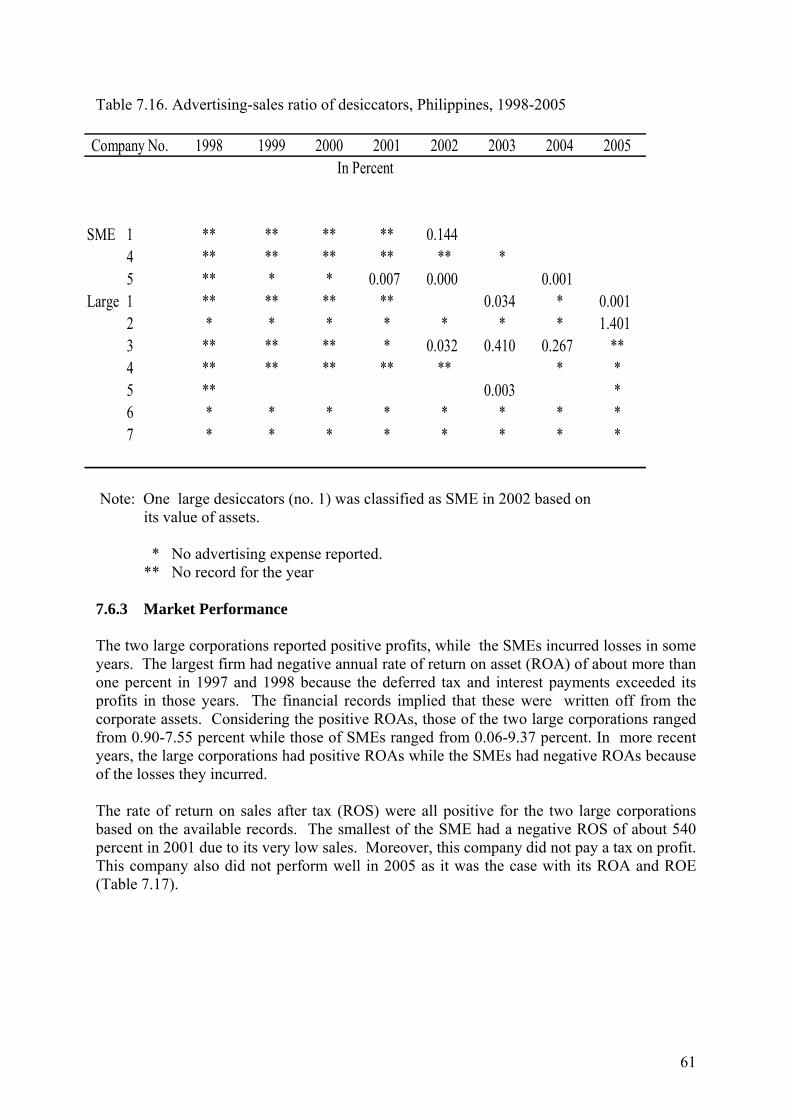
61
Table 7.16. Advertising-sales ratio of desiccators, Philippines, 1998-2005
Note: One large desiccators (no. 1) was classified as SME in 2002 based on its value of assets.
* No advertising expense reported.
** No record for the year 7.6.3 Market Performance The two large corporations reported positive profits, while the SMEs incurred losses in some years. The largest firm had negative annual rate of return on asset (ROA) of about more than one percent in 1997 and 1998 because the deferred tax and interest payments exceeded its profits in those years. The financial records implied that these were written off from the corporate assets. Considering the positive ROAs, those of the two large corporations ranged from 0.90-7.55 percent while those of SMEs ranged from 0.06-9.37 percent. In more recent years, the large corporations had positive ROAs while the SMEs had negative ROAs because of the losses they incurred. The rate of return on sales after tax (ROS) were all positive for the two large corporations based on the available records. The smallest of the SME had a negative ROS of about 540 percent in 2001 due to its very low sales. Moreover, this company did not pay a tax on profit. This company also did not perform well in 2005 as it was the case with its ROA and ROE (Table 7.17).
Company No. 1998 1999 2000 2001 2002 2003 2004 2005
SME 1 ** ** ** ** 0.1444 ** ** ** ** ** *5 ** * * 0.007 0.000 0.001
Large 1 ** ** ** ** 0.034 * 0.0012 * * * * * * * 1.4013 ** ** ** * 0.032 0.410 0.267 **4 ** ** ** ** ** * *5 ** 0.003 *6 * * * * * * * *7 * * * * * * * *
In Percent

62
Table 7.17: Market performance measures of seaweed/carageenan processors, Philippines, 1997-2005
* Incomplete records for the year.
** No record for the year. 7.7 Desiccated Coconut - The case of the Philippines 7.7.1 Market Structure Sales of the largest firm alone comprised almost one-fourth of the total sales of the seven (7) DCN companies in 2004 and 2005. The 2-firm, 3-firm and 4-firm concentration ratios decreased as there were more desiccators reporting. Considering the two desiccators, the concentration ratio of the market ranged from about 40 percent to about 73 percent; from about 56 percent to 82 percent for the largest 3 desiccators (Figure 7.9).
Company No. 1997 1998 1999 2000 2001 2002 2003 2004 2005
SME 1 ** ** ** ** (10.67) ** ** 0.00 (6.22)2 ** ** (1.77) (2.55) (5.67) 0.14 0.06 (0.13) (5.59)3 (7.37) 7.88 0.51 9.37 8.38 (3.72)
Large 3 (0.49) 1.88 (1.15)4 ** ** ** ** ** 1.85 2.54 ** 2.485 (1.46) (1.41) 3.90 7.55 0.90 1.97 1.04 1.30 1.67
SME 1 ** ** ** ** (170.90) ** ** 0.00 (216.79)2 ** ** (218.72) (610.19) (28.86) (118.31) (111.22) (123.34) (30.47)3 (78.81) 701.81 (4.34) 37.75 25.83 (8.94)
Large 3 231.14 (328.66) (3.36)4 ** ** ** ** ** (142.45) (254.75) ** (1266.61)5 80.82 19.85 81.69 21.02 8.60 6.93 4.17 0.98 10.55
SME 1 ** ** ** ** (540.63) ** ** 0.00 (71.92)2 ** ** 0.45 5.94 (1.15) 3.04 2.98 2.52 (3.44)3 (2.14) 3.20 (0.03) 0.44 0.30 (0.11)
Large 3 3.00 2.84 (0.06)4 ** ** ** ** ** 4.05 4.07 ** 5.655 6.89 1.04 2.71 1.87 0.76 0.80 0.40 0.10 1.12
In Percent
Rate of Return on Assets after tax (ROA)
Rate of Return on Equity after tax (ROE)
Rate of Return on Sales after tax (ROS)

63
Figure 7.9: Concentration ratios of desiccators, Philippines, 1998-2005
Number of firms: 1998(3), 1999-2000(4), 2001(5), 2002(6), 2003-2004(7), 2005(6)
7.7.2 Market Conduct The lone SME (no. 5) advertised in 2001, 2002, 2004 which contributed to its increments in its sales for these years, although the ad-sales ratios were only less than one percent, from 0.0002 to 0.007 percent. Only three (3) of the large desiccators advertised but there is no continuity every year. There ad-sales ration, nevertheless, were 0.001 to 1.40 percent. One of the large desiccators (no. 1) was classified as SME in 2002 based on its value of assets (Table 7.18).
Table 7.18. Advertising-sales ratio of desiccators, Philippines, 1998-2005
* No advertising expense reported. ** No record for the year
30.00
40.00
50.00
60.00
70.00
80.00
90.00
1998 1999 2000 2001 2002 2003 2004 2005
CR2 CR3 CR4
Company No. 1998 1999 2000 2001 2002 2003 2004 2005
SME 1 ** ** ** ** 0.1444 ** ** ** ** ** *5 ** * * 0.007 0.000 0.001
Large 1 ** ** ** ** 0.034 * 0.0012 * * * * * * * 1.4013 ** ** ** * 0.032 0.410 0.267 **4 ** ** ** ** ** * *5 ** 0.003 *6 * * * * * * * *7 * * * * * * * *
In Percent

64
7.7.3 Market Performance. Except for two large-scale (nos. 2 and 7, the largest) which declared net losses in 2004, all of the desiccators fared very well in their net profits. For the lone SME, its highest market performance were in 2002 for its ROA of almost 5 percent , in 2004 for ROE of more than 27 percent. Its ROS, however was low at less than one percent (Table 7.19). Among the large desiccators, the largest of the desiccators had the highest ROA in 1998 at more than 11 percent and in 2000 at more than 10 percent. Table 7.19: Market performance measures of desiccators, Philippines, 1998-2005
** No record for the year.
Company No. 1998 1999 2000 2001 2002 2003 2004 2005
SME 1 ** ** ** ** 3.704 ** ** ** ** ** 1.165 ** 2.46 3.48 4.25 4.91 2.69
Large 1 ** ** ** ** 5.97 5.49 7.002 6.71 2.37 8.45 0.08 1.78 2.89 (15.60) 3.703 ** ** ** 0.57 0.64 0.11 (1.16) **4 ** ** ** ** ** 3.67 15.155 ** 2.60 1.816 1.25 1.30 1.12 1.21 1.52 0.78 0.56 0.467 11.69 3.28 10.18 6.21 6.00 0.33 (2.11) 1.33
SME 1 ** ** ** ** 13.514 ** ** ** ** ** 1.885 ** 6.33 7.56 1.29 8.63 27.36
Large 1 ** ** ** ** 13.99 25.07 35.862 5883.32 364.72 107.43 72.65 82.72 50.08 (506.39) 37.363 ** ** ** 122.43 28.57 20.32 9.20 **4 ** ** ** ** ** 16.73 27.385 ** 7.95 44.246 28.48 27.00 18.62 16.23 19.41 10.88 12.12 13.777 12.84 2.90 11.56 7.48 7.67 1.56 (2.62) 1.71
SME 1 ** ** ** ** 2.664 ** ** ** ** ** 1.535 ** 0.19 0.25 0.04 0.23 1.09
Large 1 ** ** ** ** 1.89 1.75 2.712 7.53 4.29 6.84 5.32 4.77 4.00 (11.09) 1.423 ** ** ** 6.50 3.37 2.49 1.39 **4 ** ** ** ** ** 1.92 3.715 ** 0.24 1.406 2.05 2.18 1.87 1.94 1.86 1.38 1.62 1.677 4.13 0.95 4.48 3.74 3.06 0.64 (1.02) 0.61
Rate of Return on Asset after tax (ROA)
Rate of Return on Equity after tax (ROE)
Rate of Return on Sales after tax (ROS)
In Percent

65
7.8 Sauces, Dressings and Condiments – The case of Malaysia 7.8.1 Market Structure 7.8.1.1 Concentration ratio In measuring the Concentration Ratio for Malaysian sauces, dressings and condiments segment, the market share of sales was used. Since CR4 for the Malaysian Sauces, Dressings and Condiments segment is in the range of 25–50 % over 5 year period 2001-2005, hence it can be deduced that this segment is slightly concentrated within the Malaysian Food and Beverage Sector of the Food Processing Industry (Table 7.20 and Figure 7.10). During the period reviewed, the company with the largest market share is Nestle (M) Bhd with an average of 14.8 per cent while the fourth ranked company is Lee Kum Kee with an average of 3.1 %, depicting a 11.7 per cent gap.
05
101520253035
2001 2002 2003 2004 2005Y ear
Perc
enta
ge (%
)
Nestlé (M) Bhd Sing Long Foodstuff Trading Co Pte Ltd Lee Kum Kee (M) Sdn Bhd Zara Foodstuff Industries Sdn Bhd CR4
Figure 7.10: Four Largest Companies’ Market Shares in Malaysia’s Sauces, Dressings and Condiments Segment 2001-2005 (%) 7.8.2 Market Conduct Most marketing activities are undertaken by large enterprises as generally, the SMEs lack the financial capacity in carrying such extensive strategies. 7.8.2.1 Promotions In 2005, Nestlé (M) Bhd continued to lead with its Maggi brand by running constant promotions to increase sales and aggressively expanded its product portfolio. In Malaysia, Nestlé products are found across most areas of sauces, dressings and condiments including chili and oyster sauces, ketchup, and stock cubes. Nestlé products can be found in all major
66
retail chains such as Carrefour , Tesco and Giant, as well as independent food stores in the rural areas. 7.8.2.2 Advertising Throughout 2001-2006, Unilever (M) Holdings Sdn Bhd heavily advertised its Knorr brand of stock cubes through television commercials. Apart from audiovisual commercials, Nestlé and Unilever ran huge advertisements especially in women’s magazines for their culinary range, with cooking recipes to enhance their brand image and positioning. For instance, Nestlé’s Maggi came up with the marketing theme “Let’s Masak Masak with Maggi” (masak-masak is a game played by young children between the age of 4 – 6 whereby they pretend to cook delicious dishes from imaginary ingredients and plastic utensils) for its range of sauces, dressings and condiments, providing quick and easy preparation for meals. 7.8.2.3 New product development Sauces, dressings and condiments saw various new product developments throughout 2001-2006. New brands were introduced including Telly (mayonnaise, tartar sauce, wet/cooking sauces and herbs and spices) and XiFu (herbs and spices). Nestlé also introduced a healthier range of Hari-Hari Favourites wet/cooking sauces with no added monosodium glutamate and less salt. Campbell Soup Southeast Asia Sdn Bhd launched Kimball Kuali Delights wet/cooking sauces in 2005. 7.8.3 Market Performance In the absent of cross-sectional data and the sensitivity or rather difficulty in obtaining the data needed to measure the market performance, we used a case study approach to resolve the problems. A few representative sauces factory were surveyed and specific data related to its performance were collected. Ideally, profit after tax and interest (PATI) should be used to measure performance, but these information’s especially taxes were not relevant as the factory surveyed fell under small and micro industry. They were not required to pay corporate taxes. Thus profit before taxes and interest (PBTI) are used to measure their performance. 7.8.3.1 Return on Sales (ROS). The return on sales as shown in Table 16 ranged from 10% to 32%, which was comparable with the industry standard. Based on data from the 2004 industrial survey by the Statistics Department, the ROS for products category `Man of sauces including flavoring extracts such as MSG’ (Code 15596) was 30%. The survey covered or represented all firms’ sizes. Thus, in terms of profitability, the performance of sauces SMEs were relatively commendable. Our study also revealed that SMEs generally did not use their resources efficiently especially with regard to capital utilization. The average technical efficiency (TE) found in the 1995 study was 0.28. This index indicated that the firms were operating at only 28% of what the best firm can achieved. Taking ROI as a proxy for TE, the efficiency and productivity of sauces SMEs in Malaysia may not improve very much over the years. Sauces SMEs were relatively capital intensive with share of capital to sales aver 70% for all the sample firms. Share of labor to sales can be as low as 17% (company B) which showed a trend towards more mechanization and automation in the industry. This could be due to aggressive campaign by government agencies for SMEs to enhance their processing facilities

67
in order to turn out product that can meet with the quality standard both for domestic and export market. Table 7.20: Performance of sauces producer: Return on sales Company Yearly Sales (RM) PBTI (RM) Return on Sales (%)
A 4,195,920 423,940 10 (73) B 583,000 188,000 32 (83) C 481,760 78,600 16 (72) D 623,660 192,710 31 (71) E 8,588,000 1,791,100 21 (73)
Note: 1. Figure in bracket represent share of capital to sales 2. A comprehensive study in 1995 revealed that the average technical efficiency (TE) of sauce SMI in Malaysia was 0.28
7.8.3.2 Return on Asset This ratio indicates the return on fixed assets of an enterprise. High ratio indicates high return on investment in fixed assets and vice-versa. The ROA as shown in Table 24 ranged from 29% to 59% compared to 42% calculated for the whole sub-sector from the 2004 industrial survey data (Table 7.21). Three of the five sample firms had ROA higher than the industry standard. Although there were some disparity in the ROA among firms, in terms of overall returns, the performance sauces SMEs were relatively commendable.
Table 7.21: Performance of sauces producer: Return on Asset (ROA) Company Fixed Asset (RM) PBTI (RM) Return on Asset (%)
A 793,000 423,940 53 B 500,500 188,000 38 C 326,130 78,600 29 D 192,710 192,710 59 E 3,669,500 1,791,100 49
7.9 Sweet and Savoury Snacks – the case of Malaysia Since CR4 for the Malaysian Sweet and Savory Snacks segment is in the range of 25–50 % over 5 year period 2001-2005, hence it can be deduced that this segment is slightly concentrated within the Malaysian Food and Beverage Sector of the Food Processing Industry (Table 7.22 and Figure 7.11). During the period reviewed, the company with the largest market share is Britannia Brands (Malaysia) Sdn Bhd with an average of 11.6 per cent, followed by Kilang Makanan Mames Sdn Bhd, with average of 8 per cent. The third and fourth ranked companies are URC Snack Foods (M) Sdn Bhd and Procter & Gamble (M) Sdn Bhd, with an average of 8.4 and 6.4 % respectively.
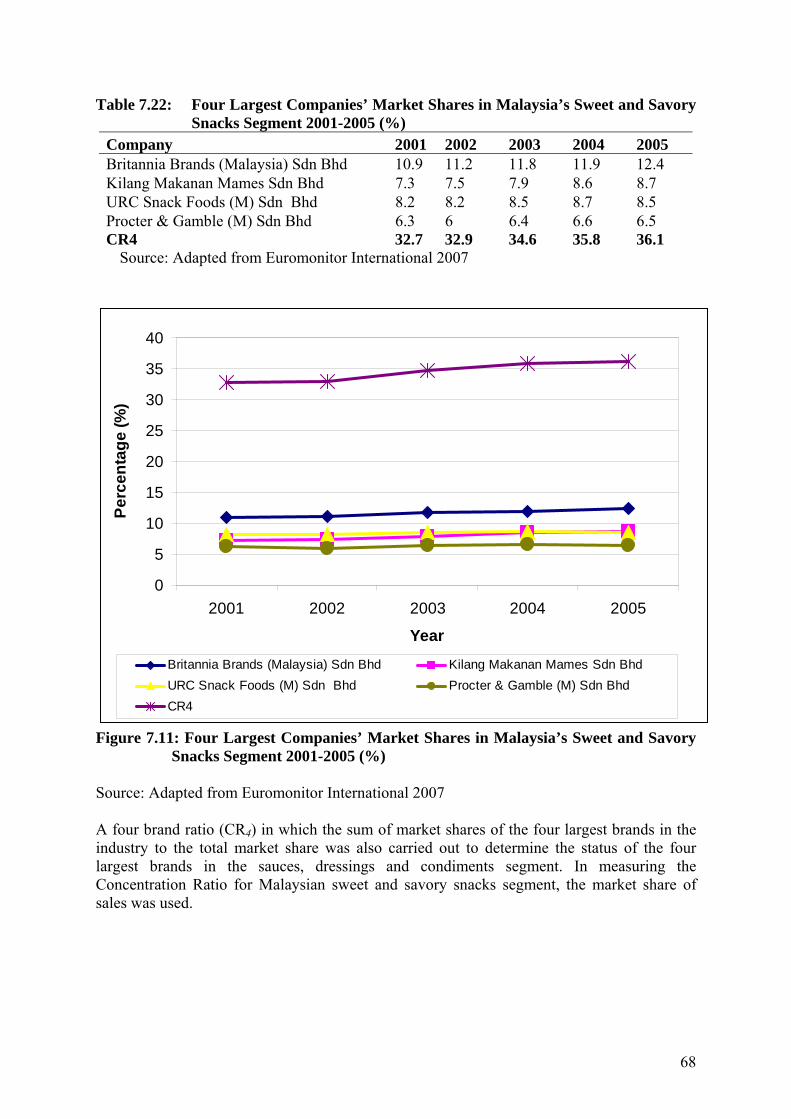
68
Table 7.22: Four Largest Companies’ Market Shares in Malaysia’s Sweet and Savory Snacks Segment 2001-2005 (%)
Company 2001 2002 2003 2004 2005 Britannia Brands (Malaysia) Sdn Bhd 10.9 11.2 11.8 11.9 12.4 Kilang Makanan Mames Sdn Bhd 7.3 7.5 7.9 8.6 8.7 URC Snack Foods (M) Sdn Bhd 8.2 8.2 8.5 8.7 8.5 Procter & Gamble (M) Sdn Bhd 6.3 6 6.4 6.6 6.5 CR4 32.7 32.9 34.6 35.8 36.1
Source: Adapted from Euromonitor International 2007
0
5
10
15
20
25
30
35
40
2001 2002 2003 2004 2005
Year
Perc
enta
ge (%
)
Britannia Brands (Malaysia) Sdn Bhd Kilang Makanan Mames Sdn BhdURC Snack Foods (M) Sdn Bhd Procter & Gamble (M) Sdn BhdCR4
Figure 7.11: Four Largest Companies’ Market Shares in Malaysia’s Sweet and Savory Snacks Segment 2001-2005 (%)
Source: Adapted from Euromonitor International 2007
A four brand ratio (CR4) in which the sum of market shares of the four largest brands in the industry to the total market share was also carried out to determine the status of the four largest brands in the sauces, dressings and condiments segment. In measuring the Concentration Ratio for Malaysian sweet and savory snacks segment, the market share of sales was used.

69
Return on Asset The ROA as shown in Table 7.23 ranged from 40% to 143% compared to 38% calculated for the whole sub-sector from the 2004 industrial survey data. All the five sample firms had ROA higher than the industry standard. There were large variation in the ROA among firms which indicated different level of machine and labor intensity within the industry. However, in terms of overall returns, their performances were very excellent. In other word assets were utilize efficiently. Table 7.23 : Performance of sauces producer: Return on Asset (ROA) Company Fixed Asset (RM) PBTI (RM) Return on Asset (%)
A 500,000 450,000 90 B 300,000 250,000 83 C 25,000 35,000 140 D 248,500 355,000 143 E 1,500,000 600,000 40
7.10 Salient features Sauces and crackers manufacturing in the Malaysian food processing sectors are highly fragmented, encompasses of Multinational Corporations (MNCs), big size locally established factories, SMEs and numerous `micro establishments’. Barrier to entry into these manufacturing business are relatively low in term of investment and technology know-how. While the MNCs and large firms were able to venture the export markets, many SMEs were left to compete among themselves in order to increase sales within the domestic market. Currently the industry is enjoying external economies which mean that the aggregate industrial’s cost curves drop along their entire lengths as the industry grows. As the industry grows, financing and transportation becomes cheaper, raw material will also becomes cheaper as they are supplied in larger quantity and skills of labour force improve as the result of the spread of training. It can be summarized that the industry is experiencing decrease in prices of some inputs and increase in physical productivities of some of these inputs. The sauces, condiments and dressing segment are slightly concentrated while the concentration level of the snacks and chips segment is gradually decreasing. In both segments, it was found that marketing activities are carried out extensively by large enterprises, technology utilized by large enterprises are generated by their own R & D unit or outsourced while SMEs depend heavily on public institutions on generating technologies. For firms that produce crackers using local raw materials, the production and supply of the materials are still inadequate and inconsistent. The competition in the FPI is not regulated, thus competition within this sector is unhealthy. Large companies such as Nestle thrive under Malaysia’s economic condition while SMEs are deprived of the chance to increase their sales growth in order to sustain in the industry. With the enormous funds generated by large companies, they are able to venture into innovative technological advancements and develop new products.

70
8. Meeting The Challenge of the Trade Liberalization: The Policy Response The analyses undertaken on a cross section of industries showed sometimes similar and at time different industrial organization responses to trade liberalization even within clusters of identical industries in different ASEAN economies. This is expected considering that these industries evolved under different policy conditions resulting in different pre-industrialization scenarios of structure, conduct and performance of these industries. The findings revealed one common critical factor required of firms to stay competitive in the food processing industry in this liberalization era; that economies of scale are required to be and remain competitive. In the analyses that have been undertaken in the previous section, all pointed to the fact that in a period of increasing liberalization, big firms usually performed better than smaller ones. This is true for canned tuna and mango processing in the Philippines, seafood processing and fruit and vegetable processing in Thailand as well as flour milling and soy sauce processing in Indonesia. While most of the large firms remained profitable (although some of them exhibited lower profits) most of the small and medium sized firms showed losses. Some even need to offset their losses against equity and assets. This study is consistent with the industrial organization theory that as markets become more competitive as the demand for price efficiency and quality increases, firms need retooling in the form new machines and equipment. This would require substantial new and additional capital investments which the smaller firms are unable to afford. In most of the export-oriented industries, there was dilution in the market concentration of industries as the international market liberalized and as more players entered the market to take advantage of the opportunities that the expanding international market has to offer. In the case of a domestic oriented industry the end case can be different. An example is the wheat flour milling industry in Indonesia. Designed to cater only for the domestic market, the wheat flour industry was protected by the government. The industry grew behind protective walls with certain firms given the privilege to operate and serve the market. A more or less perfect oligopoly industry structure develops with CR4 reaching almost 100 percent in the pre-liberalization days. The IMF imposed liberalization had forced the government to open up the wheat flour milling industry to other investors as well and opened the market for freer competition among the players. The immediate result was the decline in market concentration with CR4 dipping to 85 percent within five years of the markets deregulation. However, CR4 again crept up to above 90 percent thereafter showing that the smaller firms which had earlier gained some market share have lost it to big players. This is the case where the “privileged lead market time” that the bigger firms had enjoyed had placed them with a strong production and market foundation that enables them to improve competitiveness and regain market dominance. However, it is not always a case of “dog-eat-dog” liberalization effects; that it is always the case that under during the liberalization process, the bigger firms would displace the smaller firms out of the market. The case in point is the rice milling industry in Thailand. This study showed that as the international community liberalized their rice markets, firms of all sizes in Thailand’s rice milling industry benefited. In terms of principle revenues, the study showed that for the period of 1990 – 2004, the increase for small firms was by 117 percent, medium size firms by 177 percent and large firms by 115 percent. This can be attributed to Thailand’s high standing in international competitiveness of rice production that clearly demonstrated that even the smaller rice milling firms in Thailand are efficient and competitive. It was also

71
the of view that medium size milling firms are more flexible in adopting production-related and marketing strategies and as such can be more efficient. Overall, though the study showed that the market dominance of the food processing industry post liberalization was by the larger firms, the SMEs, especially the medium ones can play a strategic role in the overall growth of the ASEAN economies. The increasing importance of processed food exports when compared with primary commodities confirms the industry as a key component of export growth strategies. The industry has become a key source of employment opportunities, and the evidence from Europe and Japan suggests that this will continue to be the case throughout the course of development. Previously, discussions on food processing in developing countries were largely restricted to the employment benefits of the agro-industry could provide in the rural areas. Although this continues to be a key concern, presently, the food processing industry is seen as a strategic growth industry, due to the following reasons:
i. SMEs as suppliers for large firms This is in terms of out-sourcing by food processing firms and large-scale retail is opening opportunities for small firms. It remains to be seen to what extent this sector is also suffering from the effects of scale economies.
ii. Obligational subcontracting between SMEs and large firms New quality demands, preoccupations with health hazards, supply management and efficient consumer response techniques are all leading to a marked increase in formal contracts with raw material suppliers, based on clear specification of production and delivery conditions. In many cases, this has been associated with a shift from small farms to medium or large farms run along business lines. However, adequate resource support (IT, credit, technical assistance, market information services), combined with organizational initiatives for the promotion of associativism and cooperatives, have been effective in integrating SMEs into these more demanding coordination networks.
iii. Traditional activities that escape the effects of scale and new demands on quality Lack of adequate physical infrastructure (“weather-proof” roads, transport, cold storage) can favour local supplies, especially in the case of highly perishable products, where short distance and time between production and consumption can make traditional supplies compatible with basic criteria of hygiene and sanitation. Low-density communities (villages and small towns) are less attractive for modern distribution systems. Extreme income inequalities and the prevalence of high levels of absolute poverty ensure the persistence of informal food processing activities: these demand appropriate quality control support measures that are neither punitive nor unrealistic in their requirements.
iv. Innovative firms supplying niche markets, services and technologies These may be urban, often emerging from university or local government “incubator” policies that specifically promote SMEs.

72
In order for the industry to play its strategic role, some policy directions to strengthen the economic foundation in order to increase the efficiency, productivity and competitiveness of the SMEs include:
i. Stronger government support and commitment for R&D; ii. Human resource development programs must be intensified to build up a pool
of researchers and technical personnel; iii. Intensifying technology transfer and adoption; iv. Infrastructure development; v. Establishment of national and international logistics and marketing network.

73
9 References Adelman, M. A. 1951. “The Measurement of Industrial Concentration”, Review of Economics and Statistics, 33: 269-296. Alvarado, F. L. 1988. Market Power: A Dynamic Definition. Paper Presented in Conference on Bank Power System Dynamic Control-IV. The University of Wisconsin, Madison, USA. Azzam, A. M. 1997. “Measuring Market Power and Cost-Efficiency Effects of Industrial Concentration”, The Journal of Industrial Economics, 45(4): 377386. Azzam, A. M. and Rosenbaum, D. 2001. “Differential Efficiency, Market Structure and Price, Journal of Applied Economics, 33:1351-1357. Bain, J. S. 1951. “Relation of Profit Rate to Industry Concentration”, Quarterly Journal of Economics, 65: 293-324. Bain, J. S. 1956. Barriers to New Competition, Cambridge, Mass: Harvard University Press. Bain, J. S. 1959. Industrial Organization, New York: John Wiley. Bain, J. S. 1968. Industrial Organization, 2nd Ed., New York: John Wiley. Baldwin, W. 1995. The Dynamics of Industrial Competition, A North American Perspective, Harvard University Press, Cambridge, MA. Baldwin, J. R and Gorecki, P. K. 1987. “Plant Creation Versus Plant Acquisition: The Entry Process in Canadian Manufacturing”, International Journal of Industrial Organization, 5:27-41. Barthwal, R. R. 1984. Industrial Economics: An Introductory Textbook. Mohinder Singh Sejawal, New Delhi, India. Bhattacharya, M. 2002. “Industrial Concentration and Competition in Malaysian Manufacturing”, Journal of Applied Economics, 34: 2127-2134. Blair, J. M. 1956. Statistical Measure of Concentration in Business: Problem of Compiling and Interpretation, Bulletin of the Oxford University, Institute of Statistics. Buxton, A. J., Davies, S. W. and Lyons, B. R. 1984. “Concentration and Advertising in Consumer and Producer Markets”, Journal of Industrial Economics, 32: 451464. Caves, R. 1982. American Industry: Structure, Conduct and Performance, Prentice Hall Incorporated, 5th edition. Chandrasekaran, G. 1982. Strategy, Structure, Market Concentration and Organizational Performance. University Microfilms International (UMI) Dissertation Information Service. Clarke, R. 1985. Industrial Economics, Blackwell: Oxford.

74
Comanor, W. A. and Wilson, T. A. 1974. Advertising and Market Power. Cambridge: Harvard University Press. Connor, J. M. and Peterson, E. B. 1992. “Market-structure Determinants of National Brand-Private Label Price Differences of Manufactured Food Product”, Journal of Industrial Economics, 40(2): 157-171. Cotterill, R. W. 1986. “Market Power in the Retail Food Industry: Evidence from Vermont”, Review of Economics and Statistics 68(3): 379-386. Cubbin, J. S. 1988. Market Structure and Performance - The empirical research, IJarwood Academic Publishers. Davies, S. W. 1979. “Choosing between Concentration Indices: The Iso-concentration Curve”, Economica, 46:67-75. de Van, J. V. 2001. Distributional Limits and the Gini Coefficient, Department of Economics, University of Melbourne, Research Paper 776. Dessalegn, G., Jayne, T. S. and Shaffer, J. D. 1998. Market Structure, Conduct and Performance: Constraints on Performance of Ethiopian Grain Markets, Grain Market Research Project, Ministry of Economic Development and Cooperation, Addis Ababa, Ethiopia, Working Paper 8. Delorme, C. D., Kamerschen, D. R., Klein, G. K. and Voeks, L. F. 2002. ”Structure, Conduct and Performance: A simultaneous Approach”, Journal of Applied Economic, 34:2135-2141. Dickson, V. 1994. “Aggregate Industry Cost Functions and the Herfindahl index”, Southern Economic Journal, 61:1-10. Dorfman, R and Steiner, P. O. 1954. “Optimal Advertising and Optimal Quality”, American Economic Review, 44: 826-836. Gan, W. B. and Tham, S. Y. 1977. “Market Structure and Price-cost Margins in Malaysian Manufacturing Industries”, The Developing Economics, 15 (3): 280292. Gan, W. B. 1978. “The Relationships between Market Concentration and Profitability in Malaysian Manufacturing Industry”, Malayan Economic Review, 23 (1): 113. Go, G. L., Kamerschen, D. R. and Delorme, J. R. 1999. “Market Structure and Price Cost Margins in Philippine Manufacturing Industries”, Journal of Applied Economics, 31: 857-864. Goldschmid, H. D., Mann, H. M. and Weston, J. F. 1974. Industrial Concentration: The New Learning, Boston: Little, Brown. Greer, D. F. 1980. Industrial Organization and Public Policy, 2nd Ed., MacMillan Publishing Company.

75
Hay, D. and Morris, D. 1991. Industrial Economics and Organization, Theory and Evidence, Oxford University Press, Oxford. House, W. J. 1973. Market Structure and Industry Performance: The Case of Kenya. Oxford Economic Papers 25:405-419. Kambhampati, U. S. 1996. Industrial Concentration and Performance. Oxford University Press, Delhi. Kilpatrik, R. W. 1967. “The Choice among Alternative Measures of Industrial Concentration”, Review of Economics and Statistics, XLI: 258-268. Kohls, R. and Uhl, J. 1985. Marketing of Agricultural Products. Macmillan Publishing Company, New York. Kwoka, J. E. Jr. 1981. “Does the Choice of Concentration Measure Really Matter?”, Journal of Industrial Economics 29:445-453. Lall, S. 1979. “Multinationals and Market Structure in an Open Economy: The Case of Malaysia”, 6G'eltu~irGschaftliches Archive, 115(2):325-350. Lindsey. C. W. III, 1977. “Market Concentration in Philippine Manufacturing”, The Philippinc Economic Journal 16:289-312. Lipczynski, J. and Wilson, J 2001. Industrial Organization: An Analysis of Competitive Markets. New York: Financial Times Prentice Hall. Maasourni, E. 1995. Empirical Analyses of Inequality and Welfare. Forthcoming in Handbook of Applied Microeconometrics. Oxford: Basil Blackwell. Mann, H. M. 1966. “Seller Concentration, Barriers to Entry and Rates of Return in Thirty Industries, 1950-60”, Review of Economics and Statistics, 48:296-307. Mason, E. S. 1939. “Price and Production Policies of Large Scale Enterprises”, American Economic Review, 29:61-74. Mason, E. S. 1949. “The Current Status of the Monopoly Problem in the United States”, Harvard Law Review 62:1265-85. McGivern, M. H. and Tvorik, S. J. 1997. “Detenninants of Organizational Performance”, Journal of Management Decision, 35:417-435. McFetridge, D. G. 1973. “Market Structure and Price Cost Margins: An analysis of the Canadian Manufacturing Sector”, Canadian Journal of Economics, 6.344-355. Miller, R. A. 1967. Marginal Concentration Ratios and Profit Rates: Some Empirical Results of Oligopoly Behaviour”, Southern Economic Journal 34:259-267. Needham, D. 1978. The Economics of Industrial Structure, conduct and performance. Edinburgh: Holt, Rinehart & Winston.

76
Petrochilos, G. A. 1988. “Foreign Direct Investment and Concentration in Greek Manufacturing”, British Review of Economic Issue, 10: 23-53. Phillips, A. 1976. “A Critique of Empirical Studies and Relations between Market Structure and Profitability”, Journal of Industrial Economics, 24: 241-249. Porter, M. E. 1980. Competitive strategy: Techniques for Analyzing Industries and Competitors, New York: The Free Press. Porter, M. E. 1986. Competition in Global Industries. Boston: Harvard Business School Press. Rajan, P. V. 1986. “Product Diversity and Firm Performance: An Empirical Investigation”, Journal of Marketing, 50: 43-57. Rao, V. V. B. and Ramakrisnan, M. K. 1972. “Economic Growth, Structural Change and Income Inequality, Singapore 1966-1975, Malayan Economic Review, 21(2): 92-122. Reid, G. C. 1987. Theories of Industrial Organization, U.K., T.J. Press Limited. Rhodes, S. A. and Cleaver, J. 1973. “The Nature of the Concentration Price-Cost Margin Relationship for 353 Manufacturing Industries: 1967”, Southern Economic Journal, 40:90-102. Rugayah, M. 1993a. Market structure and the structure-conduct-performance paradigm: Empirical evidence from developing economies, Malaysian Journal of Economic Studies, 30(1): 55-76. Rugayah, M. 1993b. “The Measurement of Market Concentration in Malaysian Manufacturing Industries”, Malaysian Management Review, 29(2):1-11. Scarborough, V. and Kydd, J. 1992. Economic Analysis of Agricultural Markets: A Manual, Chatham, UK: Natural Resources Institute. Scherer, F. M. 1980. Industrial Market Structure and Economic Performance, 2nd Ed., Boston: Houghton Mifflin Company. Scherer, F. M. and Ross, D. 1990. Industrial Market Structure and Economic Performance, 3rd Ed., Boston: Houghton Mifflin Company. Sosnick, S. H., 1958. “A Critique of Concepts of Workable Competition”, Quarterly Journal of Economics, 72:380-342. Stigler, G. J. 1964. “A Theory of Oligopoly”, Journal of Political Economy, 72:44-61. Suter, D. and Henneberry, S. R. 1996. “An Examination of the Structure, Conduct and Performance of the U.S. Food Processing Industry”, Journal of Food Products Marketing 3(2):65-85. Teece, D. J., Pisano, G. P., Shuen, A. 1997. “Dynamic Capabilities and Strategic Management”, Strategic Management Journal, 18(7):509-533.

77
Vlacllvci, A. and Oustapassidis, K. 1998. “Advertising, Concentration and Profitability in Greek Food Manufacturing Industries”, Journal of Agricultural Economics, 18: 191-198. Waldman, D. E. and Jensen, E. J. 2001. Industrial Organizational: Theory and Practice, 2nd Ed., Addison Wesley Longman Inc.

80
Market Liberalization and Its Relationship with Market Structure, Conduct and Performance of the Food Processing Industry in Brunei by Haji Anjah @ Amzah bin Haji Abdul Rahman
Table of Contents Page
1 Introduction 82 1.1 Economic Background 82 1.2 GDP Contribution Trends 82
2 Brunei Trade Policies 83 2.1 Brunei-Darussalam Trade Policy 83 2.2 Trade and Investment Policy Framework 84 2.3 Trade And Trade-Related Reforms 84 2.4 Other Measures Affecting Trade 85 2.5 Sectoral Policies 86 2.6 Trade Policies And Trading Partners 86
3 Overview of Livestock And Livestock-Based Processing Industries 87 3.1 Status of Livestock Industry 87 3.2 Status of Livestock-Based Food Processing Industry 87
4 The Beef Industry 90 4.1 The Present Status 90 4.2 The Cattle and Buffaloes Population 91 4.3 Cattle and Buffaloes Imports 92 4.4 The Beef Processing Industry 93 4.5 The Products 93 4.6 Markets 94 4.7 Promotions 94
5 Broiler And Broiler Processing Industry In Brunei Darussalam 96 5.1 The History of Broiler Industry in Brunei 96 5.2 Present Status of the Broiler Industry 96 5.3 Chicken Imports 97 5.4: Chicken Prices 99 5.5: The Chicken Processing Industry 99 5.6: Chicken Processors in 2006 99 5.7: The Chicken Processed Products 100 5.8: Markets and Promotions 101
6 Conclusion And Recommendations 102

81
List of Tables Table 1.1: GDP Trends on Agriculture Sector 83 Table 3.1: Total Contribution of The Seven Livestock-Based Processors 89 Table 4.1 : Beef Industry 2006 90 Table 4.2: Imported Live Cattle And Buffalo From 1992 To 2006 92 Table 4.3: The Major Beef Processing Operators in 2006 93 Table 4.4: Processed Beef Product By Types 2006 94 Table 5.1: Broiler Industry 2006 97 Table 5.2: Broiler Production 1992 - 2006 98 Table 5.3: Categories of Imported Chilled and Frozen Chicken Meat in 2006 99 Table 5.4: The Chicken Processors and Their Volume of Production 2006 100 Table 5.5: Processed Chicken Product By Types 2006 101
List of Figures Figure 4.1: The Local Beef Production Trend 1995 to 2006 91 Figure 4.2: The cattle and Buffaloes Population 1992 till 2006 92 Figure5.1: Local Broiler Production versus Import Trend from 1992 to 2006 96 Figure 5.2: Imported Chilled and Frozen Chicken Meat in 2006 98

82
1. Introduction 1.1 Economic Background Brunei Darussalam, a small economy located on the Island of Borneo is relatively practice an open economy with one of Asia's highest per capita incomes. The economy owes its economic prosperity mainly to its abundant petroleum and natural gas resources, whose share of GDP was 35% in 2000. Since 2000, services have played an increasingly important role in the economy, growing from 38% of GDP in 1990 to 52% by 2000. The services sector is also an important source of employment, employing some 80% of the population. Brunei's main exports are petroleum and liquefied natural gas (some 89% of merchandise exports in 2000), clothing, and machinery and transport equipment; its main export markets are in East Asia. The value of exports as a share of GDP has grown from around 48% in 1994 to 55% in 2000; imports as a share of GDP declined from 43% to 37% during this period.
1.2 GDP Contribution Trends
Agriculture comprises industries such as poultry and ruminants, vegetables, fruits, paddy and other crops. The total agricultural land area is just around 7,615 hectares with 5,200 farmers. Their contribution to the economy is quite significant even though the GDP contribution is at only around 2% in 2006. A GDP trend on agricultural produce over the past two decades shows a modest and stable increase between 1.8% in 1989 to 2% in 2006 (Table 1.1). In a few occasion within that specified period of time agriculture sector also experienced a decrease but the overall trend shows an additional growth of 147% or B$102.00 million. This situation reveals that this sector is making its roots even though the average increases are a bit low of 1.7% annually. Within the period of NDP 7(1996 – 2000) the agriculture development moves tremendously at the rate of 7% from B$91.12 million in 1996 to B$126.74 million in 2000 and increases to B$158.99 in 2005 (NDP 8). The highest achievement was in 2004 where the output values was around B$177.69 million.

83
Table 1.1: GDP Trends on Agriculture Sector. Years Agriculture GDP
(B$ Million) Percentage From GDP
(%) Percentage From GDP Without Petroleum (%)
1989 69.49 1.8 3.3 1990 59.96 1.8 3.6 1991 69.97 1.8 3.4 1992 65.10 1.9 3.3 1993 66.49 1.9 3.1 1994 67.12 1.9 3.0 1995 88.53 1.8 2.9 1996 91.12 1.9 3.1 1997 91.32 2.0 3.4 1998 92.72 2.1 3.3 1999 113.02 1.9 3.2 2000 126.74 1.9 3.2 2001 149.83 2.2 3.6 2002 134.17 2.0 3.2 2003 145.21 2004 177.89 2005 158.99 2006 171.75 2.0
Source: DoA 2007 2 Brunei Trade Policies
2.1 Brunei-Darussalam Trade Policy
Petroleum's large share of GDP has become a cause for concern in recent years. This concern is mainly due to fluctuating international prices and the existence of bio-fuel as substitute, which leaves Brunei to an eventual depletion of resources; Brunei's proven petroleum reserves are expected to last another 20-25 years at current rates of extraction. There is also concern about growing unemployment among Bruneians; official estimates put unemployment at some 4.6% in 2000 and goes to unofficial figure of 7% in 2006. The "Bruneization" policy, which encourages companies to give preference to Bruneians in their employment policies, and which was put into place to reduce unemployment, has been successful mainly in the government and petroleum sectors. Nevertheless, the Brunei Darussalam Economic Council, formed in 1998 in the wake of the regional crisis and the collapse of the local Amedeo development corporation (Brunei's largest non-government employer), has suggested that economic growth must be faster in order for Brunei to absorb the growing labour force. The Government has thus been encouraging economic diversification, mainly into manufacturing and services, especially financial services, tourism, and transport. The private sector is being encouraged to participate, although government salaries and benefits have made it difficult for it to compete with the public sector. It is estimated that around 94% of Bruneians in the labour force are employed by the public sector, including state-owned enterprises.

84
Petroleum also continues to form the main source of income for the Government; corporate taxes and royalties paid by petroleum and natural gas companies account for almost all government revenue. Moreover, Brunei has virtually no taxes on personal incomes or on goods and services. 2.2 Trade and Investment Policy Framework Under Brunei's Constitution, the Sultan is the Head of State and the Executive. The original 1984 Constitution also provided for five Councils to assist the Sultan. One of these, the Legislative Council, was temporarily suspended in 1984, following which all new legislation in Brunei has been promulgated by the Sultan as “Emergency Orders”, which carry the force of law. All international agreements, including the WTO Agreements, once ratified by the Sultan, must be adopted through national legislation to be enforceable in the economy. To date, it appears that, other than legislation on intellectual property rights (including for copyright, trade marks and industrial designs), no changes relating to WTO provisions have been made to national laws. Instead, WTO provisions appear to be implemented in “good faith” or on a “best efforts” basis. Trade policy formulation is carried out by the Ministry of Industry and Primary Resources, which is also responsible for implementing the policy, with the participation of other ministries, notably the Ministry of Finance, and appropriate agencies. And therefore, Brunei sees foreign investment as playing a key role in the economy's economic and technological development; foreign investment is permitted in most sectors, including up to 100% foreign equity investment in all sectors except those employing local resources and those relating to national food security, for which some local participation is required. A minimum 30% local participation appears to be required in agriculture, fisheries, and food processing; however, there is no clear definition of the sectors in which local participation is required. The process of approving foreign investment projects also appears to be somewhat opaque and therefore susceptible to the discretion of the authorities. To encourage foreign investment, Brunei provides tax incentives, particularly under the pioneer status programmed, which exempts companies from payment of corporate tax, normally 30% for non-petroleum companies, up to a maximum of eight years, and from payment of customs duty on plant, machinery, and equipment imports as well as imports of raw materials not available in Brunei but which are to be used by the company in its plants. Given that around 95% of corporate tax revenue in 2000 was raised from petroleum and natural gas companies, it would appear that most companies operating in the non-oil sector are beneficiaries of such programmers. 2.3 Trade And Trade-Related Reforms Brunei's applied tariffs are low, averaging 3.1% in 2000, zero for agriculture, and 3.6% for non-agricultural products. The specific tariffs, which apply mainly to tobacco, alcohol, and petroleum products, are due to be converted to ad volume rates in 2001.

85
As a member of the Association of South East Asian Nations (ASEAN) Common Effective Preferential Tariff (CEPT) scheme, which is the main instrument of the ASEAN Free-Trade Area, Brunei has been reducing its preferential tariff rates on products included under CEPT; tariff reductions within the 0-5% range on these products was completed by 2002. Brunei's CEPT rates on information technology products were also removed to encourage investment in the information technology sector. While Brunei's tariff barriers are relatively low, a number of imports and exports are subject to prohibitions, restrictions, and licensing requirements. Imports of opium, firecrackers, vaccines from Chinese Taipei, and arms and ammunition are prohibited for health, security, and moral reasons. Products subject to import restrictions include rice, sugar, and salt, for the purpose of maintaining food supplies; rice appears to be subject to an import monopoly and is bought mostly from Thailand, under a government-to-government contract. Other products subject to import restrictions include beef, poultry and alcoholic beverages (for religious reasons), plants and live animals, converted timber, and used vehicles five years and older (for safety reasons); imported eggs must be stamped to distinguish them from the local product, apparently to stop the smuggling of eggs that do not meet sanitary requirements and to ensure that all imported eggs meet sanitary requirements. Import licenses appear to be required for, inter alia, telecommunications equipment, medical products, chemicals, and live plants and animals. Although Brunei maintains no import quotas, imports of meat and poultry are monitored and subject to an annual ceiling to avoid excess supply in the local market. A few products are also subject to export restrictions: timber, oil palm, rice, and sugar; the restrictions are maintained mainly to ensure security of domestic supplies, although in the case of timber, the restrictions are also maintained apparently for environmental reasons. 2.4 Other Measures Affecting Trade Brunei has an active industrial policy, which has been used to develop certain priority sectors, especially in services. In addition to government provision of infrastructure, the measures include a five-year National Development Plan, which allocates resources to particular activities; investment promotion in particular targeted sectors through tax and non-tax incentives; and the use of government resources, through its holding company, Semaun Holdings, to invest directly in priority sectors. It appears that the BIA is also involved in industrial development. One of the key tools to attract investment to Brunei is tax and other incentives. In the virtual absence of personal income, goods, and service taxes, the corporate tax has become one of the main instruments of industrial policy, offering tax exemptions of up to eight years for companies investing in a wide range of activities under the pioneer status programmed. Financial assistance for small and medium-sized enterprises (SMEs) is also provided, most recently through a B$200 million working capital credit fund, launched in January 2001. The fund is targeted at SMEs active in areas such as agriculture and fishery and others industries includes construction, tourism, and information technology.

86
In light of the slight fiscal deficit, efforts to reduce the size of the Government have been ongoing since the early 1990s and include "corporetization" and privatization of some public sector companies. The measures taken thus far, however, have been slow and ad hoc; the Seventh National Development Plan suggested that privatization would be pursued only after careful consideration of any negative effects, including on employment and prices. Till now the privatization is still the top of the agenda in the Eighth National Development Plan. To protect consumers, price controls are maintained on a number of products, including rice, sugar, bread, milk for infants, tea, coffee, motor vehicles, and cigarettes. The retail price of petrol has been frozen since 1978, with any difference in the price charged being subsidized by the Government. Distribution controls are also maintained for products imported by the Government, such as rice, which is distributed to local retailers under a quota system. 2.5 Sectoral Policies The agriculture, forestry and fisheries sector is small, accounting for 2% of GDP in 2000. Nevertheless, Brunei has endeavored to increase self-sufficiency in the production of agricultural products, especially rice, mainly through extensive subsidization of infrastructure and inputs; rice production is also subsidized through the end-product subsidy scheme, which ensures the purchase of locally grown paddy by the Government at an annual cost of B$200 million. There also appears to be a government import monopoly for rice paddy. Foreign investment in the sector is seemingly encouraged, although it is subject to a 70% foreign equity limit. Despite the extensive subsidies, further investment in the sector does not appear to have been forthcoming, mainly because of better employment opportunities elsewhere, notably in the public sector, lack of marketing outlets, and unstable prices. 2.6 Trade Policies And Trading Partners Brunei is a founding Member of the WTO and had been a contracting party to the GATT since December 1993. Brunei's trade and investment policies are strongly linked with those of its regional trade and investment partners, principally members of the Association of South-East Asian Nations (ASEAN) and the Asia Pacific Economic Cooperation (APEC) forum; indeed, the Government appears to attach greater importance to ASEAN and APEC than to the WTO. Brunei joined ASEAN in 1984 and will reduce tariffs included in its CEPT tariff to the 0-5% range by 2002; all intra-ASEAN tariff barriers will be removed by 2015. Products originating in other ASEAN countries also have preferential access to Brunei through the ASEAN preferential rules of origin, under which products must have at least 40% ASEAN content. Brunei is also an active participant in other ASEAN foral, including the ASEAN Industrial Cooperation Scheme (AICO), the ASEAN Investment Area (AIA), and the recently signed e-ASEAN Framework Agreement. Since 1993, imports from other ASEAN countries have grown rapidly, from 30% to 48% of total merchandise imports in 1998. This suggests that the lowering of tariff and non-tariff barriers to trade within the ASEAN region as a result of the ASEAN Free-Trade Agreement may have led to significant trade diversion.

87
In the APEC forum, Brunei, as other developing economy members, intends to implement free trade and investment by 2020, and was a participant in the early voluntary sect oral liberalization (EVSL) scheme. Brunei, along with other partners in the region, also participates in other regional agreements, such as the Asia-Europe Meeting (ASEM), which held its third meeting in Seoul, Korea, in October 2000. Brunei is a member of the Brunei Darussalam, Indonesia, Malaysia, Philippines–East ASEAN Economic Growth Area (BIMP–EAGA), which aims to pool complementary resources in the region to develop priority sectors, including agriculture, forestry, fishery, air and maritime linkages, construction and tourism. 3 Overview of Livestock And Livestock-Based Processing Industries
3.1 Status of Livestock Industry Livestock production is considered as the most significant contributor to agriculture economy in term of output value and its contribution is approximately 70% out of the total agricultural contribution. Chicken and egg are the largest contributors in which these two industries has already achieving almost 100% level of self-sufficient. The production main problems affecting the industries are the dependency on imported concentrate feed and fertilized eggs’ supplies. The latest chicken and eggs production industries are capital intensives whereby the cost on labors and others productions items were considered insignificant through the use of high closed-housed technology. But, the local ruminant production status is still very low due to its conventional method of rearing. Brunei relied very much on the importation of live animal from Australia and Sabah and Sarawak for its supplies. Despite of this problems, the industry contributes an annual output value totaling to B$0.66 million in 2006 to the farmers even though having without much effort and high inputs usage especially buffaloes production. Swampy areas which are normally difficult to develop for crop production due to its soil acidity are suitable for grazing areas for buffaloes without much investment. This situation is suited best to the concept of agriculture multi-functionality but it found to be having a very low stocking rate which is impossible to be considered contributor to the beef production for the economy. 3.2 Status of Livestock-Based Food Processing Industry
Livestock-based food processing industry in Brunei Darussalam is an absolutely new business. Statistics shows that the contribution of the local food processing industries is too small toward our national food requirement. According to 2006 statistics, the total national food requirement worth B$800.00 millions where B$171.00 million or 21% are agro-based including livestock and crops, B$17 million (15%) are fishery-based, and B$612.00 million (77%) are from imports. Out of the total, 68% or B$544.00 million are in the form of processed food and almost all of these processed food were imported. The indicators show that the contribution of imported processed food to satisfy national food requirements seems too significant to the economy. Recent survey reveals that the local food processing factories is found to be small and limited to satisfy local needs. In 2006 there were 106 food processors operate throughout the economy.

88
Out of this total, 24 are of livestock-based and 77 engaged in crops-based food processing industries were officially registered with DOA. The remaining 5 operators were recorded by the Fishery Department. Majority (95%) of them operates in a very small scales and seasonal where the operations normally takes place once or twice a year especially during the festive months. Under normal circumstances, the operation took place at their owned houses or make shift building just outside their resident, or in shop houses with old and conventional technology. It was also found out that the technical specialization in the production of processed food is limited, low standard and inconsistent in term of quality. It seems that the efforts rendered by various government agencies such as DOA in providing training programs and entrepreneurial development show minimum impacts to increase their specialization skill and knowledge. Most operators failed to observe and to consider the quality assurance procedures, sanitary and cleanliness of their products. Thus the quality and the presentation of their respective products are of a low standard that lead to losses to their respective business. It was also found out that an appropriate attention on packaging was also being ignored where most products were packed using inappropriate packaging materials such as simple plastics without proper labeling and instructions. While some are packed using used bottle from imported used products. These failures lead to the total rejection either by the local department stores or even ordinary groceries shops. Based on the agricultural output increment on the past few years showed that the agriculture sector is considered matured enough and ready to move forward. The current development in agriculture sector gives positive sign especially with the entry of newly interested entrepreneurs to venture in agriculture and processing sectors. Furthermore, DOA supports and incentives that are being channeled to these sectors is available especially in the form of basic infrastructures and input subsidies. Despite of those constraints stated above, there is still a few operators that are capable in making their way to success and the most notably active operators are in livestock-based where the demand are normally great and increasing from year to year. Out of the 24 processors engaged in the processing of livestock-based processed food in 2006, only seven operators can be considered real processors and out of these seven, only one operators concentrate fully on the processing of chicken-based namely Ideal Food Industries Sdn. Bhd, two operators concentrate fully on beef-based while four operators processed mixed chicken and beef-based. The total contribution by all of these seven companies was around 1,102.82 mt. worth approximately B$7.88 million in 2006. Out of the total production, 61% or 673.10 metric ton are chicken-based while 39% or 429.72 metric ton are beef-based food as stated in Table 3.1 below.

89
Table 3.1: Total Contribution of The Seven Livestock-Based Processors
The success of these operators are also mainly due to their continues commitment in complying quality requirements imposed by DoA aside from continuous implementing of GMP, HACCP, Halal and other food safety procedures before the issuance of veterinary inspected and halal logo on their respective products. Survey revealed that a total of 34 types of products are being produced. All these types can be categorized into 10 main products namely burgers, nugget, sausages and frankfurter, mince, balls and cakes, cold cut, marinated, cooked and canned and others that includes fillets, rolls, patties, etc. In the case of workforces involved, a total of 71 workers are being employed by all the seven factories in which 82% of them or 58 workers are foreigner while only 13 workers (18%) are local.
Chicken Based Beef Based Total Processors Qty
(mt.) Value (B$)
Qty (mt.)
Value (B$)
Qty (mt.)
Value (B$)
Contribution
PDS 14.21 0.18 0.12 1.53 0.14 $1.70 12.6% Ideal 165.90 1.18 0.00 0.00 0.17 $1.18 15.0% BMC 470.24 2.60 0.20 1.35 0.67 $3.95 60.3% Cerah 11.02 0.08 0.02 0.18 0.04 $0.26 3.2% Sabli’s 11.72 0.06 0.02 0.16 0.03 $0.22 2.8% Mulaut 0.00 0.00 0.01 0.07 0.01 $0.07 0.5% Hussyn 0.00 0.00 0.06 0.49 0.06 $0.49 5.6%
Total 673.10 $4.10 0.41 $3.79 1.10 $7.88 100.00% Contribution 61% 39%

90
4.0 The Beef Industry 4.1 The Present Status
The source of beef to satisfy the need of Brunei population is mainly come from the import of live cattle and buffaloes from Australia, Sabah and Sarawak of Malaysia. These animals are slaughtered and processed locally. Aside from the live animals, chilled and frozen beef are also imported beside a few contributions from the local producers.
The present statistics shows that the total beef requirement in 2006 is about 3,386 metric ton which is equivalent to a total of 10,568 heads of cattle and buffaloes that worth B$45.18 million. By average each people in Brunei consumed an annual intake of 8.8 kg of beef. Out of the total requirement, 48.93 metric ton which is equivalent to 301 heads worth around B$0.66 million was supplied by the local farmers with the contribution of 1.4% while the remaining 98.6% was satisfied by the imported live animals but locally slaughtered (68.2%) and imported chilled and frozen beef (30.4%) as shown at table 3.1 below.
Table 4.1 : Beef Industry 2006
It was found out that the present local contribution is the lowest since 1995. By average the local supply contribution is around 200 mt per year except 2004 recorded the highest contribution totaling to 410.78 mt. The declining contribution of the local is mainly blamed to the poor husbandry management in which most animal are left grazing unattended in a confined areas in the jungle and the lost interest in rearing among the younger generation.
Total Consumption: 10,568 Head Carcass Weight: 3,385.89 mt Market Value (B$): 45.18 Million Per Capita Consumption/Year: 8.8 Kg Local Cattle/Buffalo: 301 Head Carcass Weight: 48.93 mt Retail Value (B$) : 0.66 Million Local Contribution (%): 1.4% Imported Live Cattle/Buffalo: 10,267 Head Carcass Weight: 2,308.44 mt C.I.F.Value (B$) : 13.14 Million Retail Value (B$) 35.46 Million Import Contribution (%): 68.2% Imported (Chilled & Frozen) : 1,028.53 mt

91
Figure 4.1: The Local Beef Production Trend 1995 to 2006
4.2 The Cattle and Buffaloes Population
The total population of cattle in the economy is just around 1,010 heads raised by 109 farmers involving an area of 359.08 hectares. This means that the productivity per hectare land used is very low which about 2.8 heads/hectare. The population is maintained since 1992 at an average of 1,540 heads per year.
In the case of buffaloes, the total population recorded in the year 2006 is around 4,685 heads in the hand of 437 farmers with an area of 2,779.60 hectares. The productivity of the land used for buffaloes rearing is very much lower compared with those of cattle which is about 1.7 heads/hectare. As in cattle, the population is maintained at an average of 4,742 heads since 1995 as shown in figure 3.2 below.
0.00
50.00
100.00
150.00
200.00
250.00
300.00
350.00
400.00
450.00
Qty (mt))
Local Production 96.00 168.38 208.00 218.05 204.45 206.90 207.05 205.83 172.53 410.78 146.18 48.93
1995 1996 1997 1998 1999 2000 2001 2002 2003 2004 2005 2006

92
Figure 4.2: The cattle and Buffaloes Population 1992 till 2006
4.3 Cattle and Buffaloes Imports
In the case of imports, statistics also shows a decline in the importation of live cattle and buffaloes from 12,547 heads in 2005 to 10,319 heads in 2006 but the import of chilled and frozen beef in 2006 increases to make a total of about 1,028.53 metric ton with the c.i.f. value of B$13.14 which is mainly coming from India, Malaysia and Australia. Almost all the chilled and frozen imported beef are used in the processing industry.
Table 4.2: Imported Live Cattle And Buffalo From 1992 To 2006 Years Buffaloes (Heads) Cattle (Heads)
1992 1,247 7,877 1993 1,104 8,585 1994 966 7,869 1995 835 6,074 1996 890 4,868 1997 888 5,638 1998 706 6,901 1999 1,029 15,036 2000 2,469 16,663 2001 2,689 16,053 2002 3,380 20,640 2003 2,559 15,766 2004 2,377 13,962 2005 2,263 10,284 2006 1,668 8,651
0
1,000
2,000
3,000
4,000
5,000
6,000
7,000
No. of Heads
Cattle 1,600 1,449 2,092 1,600 2,017 1,924 1,854 1,836 1,726 1,617 1,412 1,443 1,211 1,079 1,010
Buffaloes4,980 3,459 3,549 3,912 4,002 5,953 5,812 5,150 5,748 5,565 5,903 4,675 4,790 4,685
1992 1993 1994 1995 1996 1997 1998 1999 2000 2001 2002 2003 2004 2005 2006
5,899
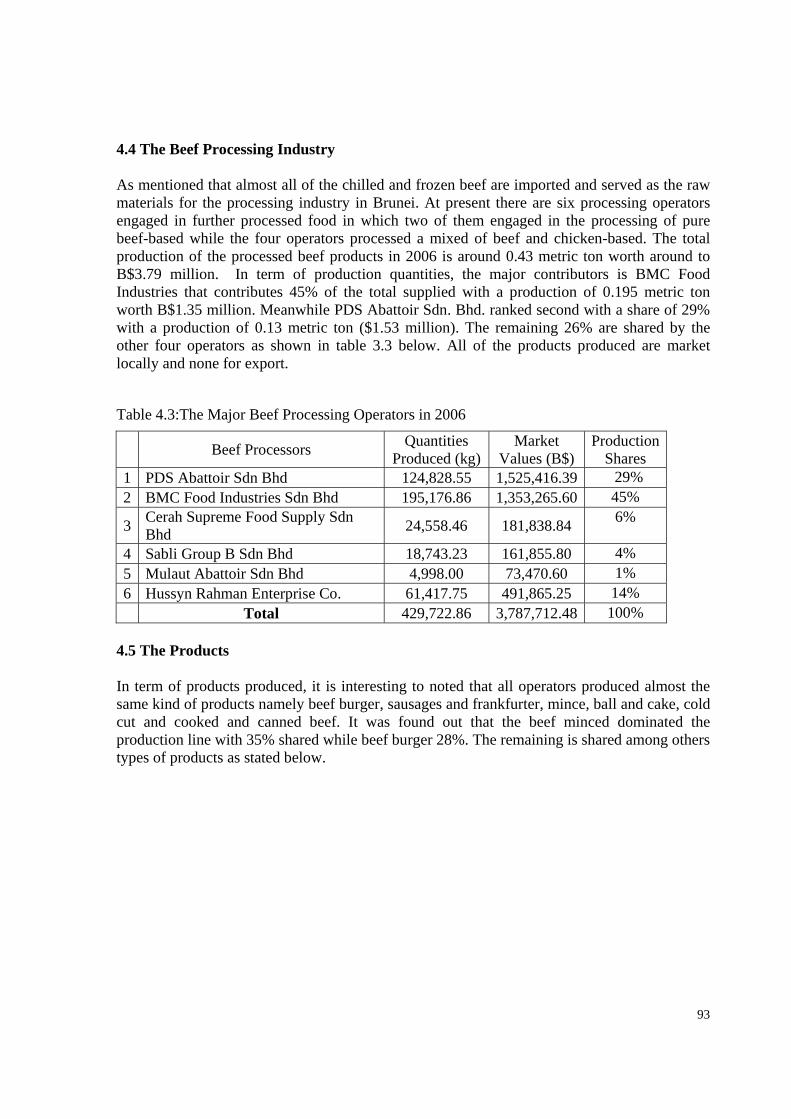
93
4.4 The Beef Processing Industry
As mentioned that almost all of the chilled and frozen beef are imported and served as the raw materials for the processing industry in Brunei. At present there are six processing operators engaged in further processed food in which two of them engaged in the processing of pure beef-based while the four operators processed a mixed of beef and chicken-based. The total production of the processed beef products in 2006 is around 0.43 metric ton worth around to B$3.79 million. In term of production quantities, the major contributors is BMC Food Industries that contributes 45% of the total supplied with a production of 0.195 metric ton worth B$1.35 million. Meanwhile PDS Abattoir Sdn. Bhd. ranked second with a share of 29% with a production of 0.13 metric ton ($1.53 million). The remaining 26% are shared by the other four operators as shown in table 3.3 below. All of the products produced are market locally and none for export.
Table 4.3:The Major Beef Processing Operators in 2006
Beef Processors Quantities Produced (kg)
Market Values (B$)
Production Shares
1 PDS Abattoir Sdn Bhd 124,828.55 1,525,416.39 29% 2 BMC Food Industries Sdn Bhd 195,176.86 1,353,265.60 45%
3 Cerah Supreme Food Supply Sdn Bhd 24,558.46 181,838.84 6%
4 Sabli Group B Sdn Bhd 18,743.23 161,855.80 4% 5 Mulaut Abattoir Sdn Bhd 4,998.00 73,470.60 1% 6 Hussyn Rahman Enterprise Co. 61,417.75 491,865.25 14% Total 429,722.86 3,787,712.48 100%
4.5 The Products In term of products produced, it is interesting to noted that all operators produced almost the same kind of products namely beef burger, sausages and frankfurter, mince, ball and cake, cold cut and cooked and canned beef. It was found out that the beef minced dominated the production line with 35% shared while beef burger 28%. The remaining is shared among others types of products as stated below.

94
Table 4.4: Processed Beef Product by Types 2006
4.6 Markets All beef products processed locally are entirely for local market and none so far for exports. This is due to the facts that the products are basically less competitive to the world markets due to its higher cost of production and processing. Subsequently, the market price offered is quite expensive as compared with those of imports. A classical example is that the 310 grams premium quality local canned corned beef sold at an average price of B$3.80 at the Department Store as compared to B$3.10 for the same products with the same quality but imported. The difference between the locally produced and the imports is about of B$0.70 which is higher by almost 23%. Despite of its higher prices, these products are still the most preferred due to its halalness which is certified by the Government and also due to its tastes that suited best to local customers needs. The demand as claimed by all the operators is increasing steadily and they have to increase their respective productions accordingly to local needs from month to month. It is also interesting to note that the flow of these products is quite simple and straight forward. All operators have their own respective outlets. Starting from the production line, the products then goes straight to the various designated outlets operated either by the same managements or by their respective sister companies which engaged in retailing businesses. Majority of the operators has one or more market outlets to serve to. A good example is that of Mulaut Abattoir’s where their processed products goes to his sister’s company namely the Express Fast Food which has a few branches throughout the state. The others go to Royal Brunei Catering, another sister’s company that caters Royal Brunei Airlines food and catering services and also other various Government Agencies and hotels. In the case of BMC Food Industries Sdn. Bhd, their products normally go to their own retailing shops and groceries under the name of Brunei Meat Company.
4.7 Promotions The acceptance of the population toward Brunei processed products is also influenced by the promotional activities either is done by the Government Agencies or the individual companies
Products Types Quantities (kg)
Market Values (B$)
Average Price Shares
1 Beef Burger 120,543.33 $1,006,117.85 $8.42 28%2 Beef Sausage / Frankfurter 20,151.86 $174,508.41 $9.96 5%3 Beef Mince 150,408.62 $1,177,112.01 $7.58 35%4 Ball / Cake 37,928.50 $ 235,156.70 $6.20 9%
5 Beef Cold Cut (Whole & Sliced) 24,718.41 $442,652.40 $18.17 6%
6 Cooked and Canned Beef 73,547.67 $732,293.30 $8.67 17% Total Production 427,298.40 $3,767,840.68 100%

95
or joint efforts of the two. Since local food products are closely related and associated with the Halal program of the governments, it is therefore the promotional activities are normally done in a joint efforts basis. The most popular promotional approaches used is through the expositions i.e. International Brunei Halal Expo 2007 held in Brunei in August 2007 aside from some others small scale expositions held throughout the countries. The international expositions held in other countries are also participated by the government and private agencies. Other promotional approaches used by majority of the operators are through posters and banners in some major streets and highways and sometimes serves as a sponsoring agencies for any major national events. The use of television and radio to adverts their products are occasionally done due to its high costs. The same is true with the advertisements through the use of newspapers.
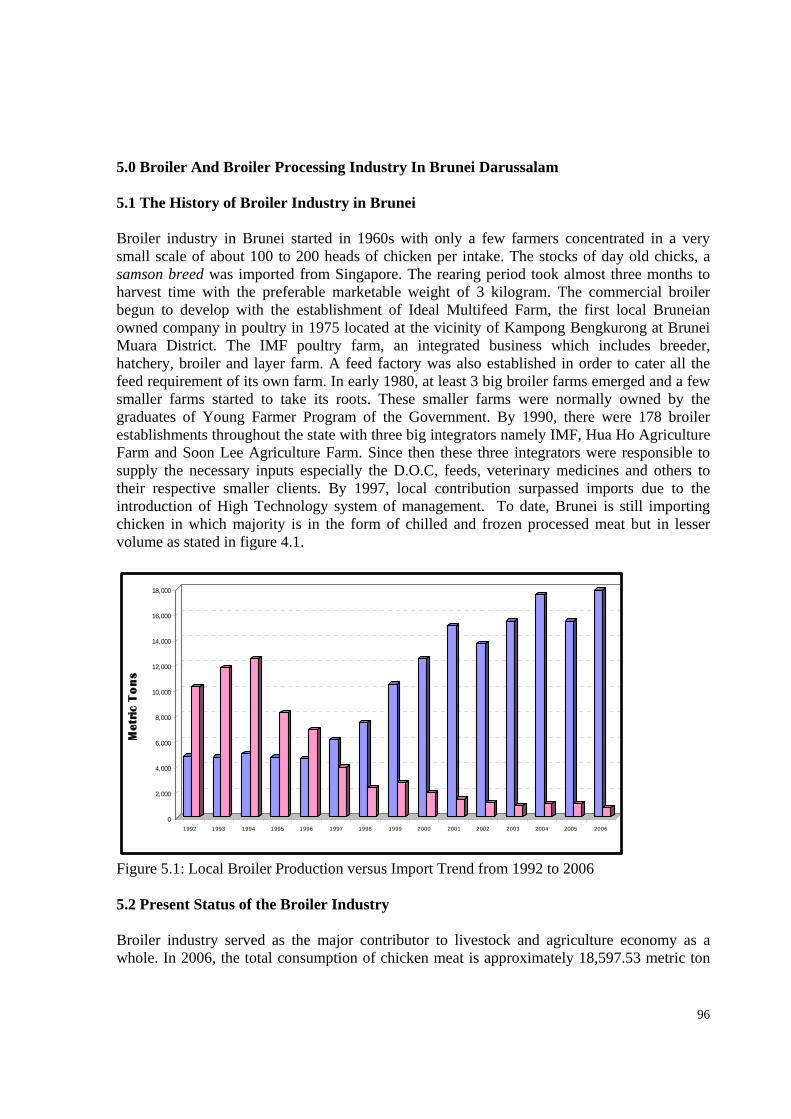
96
5.0 Broiler And Broiler Processing Industry In Brunei Darussalam 5.1 The History of Broiler Industry in Brunei
Broiler industry in Brunei started in 1960s with only a few farmers concentrated in a very small scale of about 100 to 200 heads of chicken per intake. The stocks of day old chicks, a samson breed was imported from Singapore. The rearing period took almost three months to harvest time with the preferable marketable weight of 3 kilogram. The commercial broiler begun to develop with the establishment of Ideal Multifeed Farm, the first local Bruneian owned company in poultry in 1975 located at the vicinity of Kampong Bengkurong at Brunei Muara District. The IMF poultry farm, an integrated business which includes breeder, hatchery, broiler and layer farm. A feed factory was also established in order to cater all the feed requirement of its own farm. In early 1980, at least 3 big broiler farms emerged and a few smaller farms started to take its roots. These smaller farms were normally owned by the graduates of Young Farmer Program of the Government. By 1990, there were 178 broiler establishments throughout the state with three big integrators namely IMF, Hua Ho Agriculture Farm and Soon Lee Agriculture Farm. Since then these three integrators were responsible to supply the necessary inputs especially the D.O.C, feeds, veterinary medicines and others to their respective smaller clients. By 1997, local contribution surpassed imports due to the introduction of High Technology system of management. To date, Brunei is still importing chicken in which majority is in the form of chilled and frozen processed meat but in lesser volume as stated in figure 4.1.
Figure 5.1: Local Broiler Production versus Import Trend from 1992 to 2006 5.2 Present Status of the Broiler Industry Broiler industry served as the major contributor to livestock and agriculture economy as a whole. In 2006, the total consumption of chicken meat is approximately 18,597.53 metric ton
0
2,000
4,000
6,000
8,000
10,000
12,000
14,000
16,000
18,000
Met
ric
To
ns
1992 1993 1994 1995 1996 1997 1998 1999 2000 2001 2002 2003 2004 2005 2006

97
that worth B$78.62 million. Out of the total, 96.2% (17,886.20 metric ton or 11.92 million head) is contributed through local production while the remaining was imported in the form chilled and frozen meat. The local production is found to be increasing by 2,467.05 metric ton or 16% from the previous year (2005), while imports in the form of chilled, frozen, whole, parts, processed and further processed decreased by 359 metric ton or 33.00%. Table 5.1: Broiler Industry 2006
(Source: DoA, 2007) 5.3: Chicken Imports Import Data on chicken reveals that imported chicken meat dominated the Brunei’s market since 1992 till 1996. The imported items includes in the form of the whole chicken, parts, processed and further processed. During those period, most operators employed conventional method of rearing where the productivity and the efficiency was found to be lower. Interest in rearing was also found to be low and the reliance on imported chicken was high due to the fact that those items are found to be very cheap and in good quality. With the introduction of closed-house, the productivity and efficiency started to increase and these lead to the lowering of the price offered to the market comparable to those of imported. The emergence of proven technologies in this sector encourages new investors and upgrading the capacity rate of the existing broiler houses among the existing operators. Through time, local production leads the overall requirement while imports decline until at present time. The imports were just used as fillers to shortages due to immediate requirements for festive occasions and for further processed products. The recent ruling of the government also influencing to the declining imports where interested importers have to seek approval to import through import permits and the exporting sources including their processing facilities and procedures of slaughtering and processing are subjected to verification and certification for its halalness by The Islamic Councils of Brunei Darussalam.
Total Consumption: 18,597.53 Mt Market Value (B$) : 78.62 Million Per Capita Consumption/Year 48.56 Kg Local Production: 17,886.2 Mt Market Value (B$) 73.46 Million Percentage Contribution: 96.2% Import (Chilled And Frozen) : 711.28 Mt C.I.F. Value (B$) : 2.97 Million Market Value (B$) : 5.15 Million Percentage Contribution: 3.82%

98
Table 5.2: Broiler Production 1992 - 2006
The 2006, the import statistics shows that majority (88.7% ) of the imported chicken to Brunei is in the form of processed e.g. nugget, frankfurter, sausage and the like while the remaining potion is shared by whole chicken intended for local processing factories 4.6% (32.71 mt.),and 6.3% are whole chicken and 0.3% parts for direct consumption as stated below.
Figure 5.2: Imported Chilled and Frozen Chicken Meat in 2006
Year Local Import Consumption 1992 4,844 10,314 15,158 1993 4,726 11,826 16,552 1994 4,953 12,487 17,440 1995 4,681 8,223 12,904 1996 4,663 6,871 11,534 1997 6,139 3,908 10,047 1998 7,396 2,324 9,720 1999 10,462 2,752 13,213 2000 12,507 1,906 14,413 2001 15,099 1,399 16,499 2002 13,685 1,155 14,840 2003 15,435 917 16,353 2004 17,594 1,045 18,638 2005 15,419 1,070 16,489 2006 17,886 711 18,598
Processed 88.7%
Part s0.3%
Whole Chicken6.3%For Processed Food
4.6%

99
5.4: Chicken Prices The market price of whole chicken in Brunei is basically follows the concept of perfect competition where the price is determined by the availability of supply and demand at particular period of time. Both supplier and consumers are always aware of the current price offered. Statistics show that in 1990s, the whole chicken price offered was as high as B$6.80/kg but it goes down to B$5.20/kg in 2000 and further decline to $4.30/kg in 2004 and settled at B$4.10/kg till now even though there is still an indicator that the price is going down. On the imports side, the 2006 statistics revealed that by average, the price of imported chicken valued at c.i.f is around $4.17 per kilogram. The whole chicken and parts intended for home consumption is recorded at $3.04/kg c.i.f price while B$3.38 is for the processing industries. The ready imported processed products are about B$3.40/kg. The retail price offered is by average B$5.15/kg in 1996 which is almost 81% higher by the average c.i.f price of B$4.17. in 2006. It is also found out that the price of local whole chicken is almost at par with the price of imported c.i.f price. Table 5.3: Categories of Imported Chilled and Frozen Chicken Meat in 2006.
5.5: The Chicken Processing Industry As mentioned previously that the food processing industries in Brunei Darussalam is entirely a new business. In the case of chicken, the emergence of full line food processing industry was just started late 2005 with a new technologies and new premises. But, the starts of partly processed chicken from whole into parts existed since 2000 and extended into further processed products in 2005. At this infant stage and at this present time, there are only 5 full time commercial and privately owned chicken-based processing operators throughout the economy. The total production in the year 2006 is around 673.10 metric ton with a total market value of B$4.10 million. 5.6: Chicken Processors in 2006 Out of these five operators, only one of them engage purely on chicken origin while the other four companies engaged in the processing of mixed of chicken and beef origin. The only pure
Categories Quantities
(kg)
C.I.F. Values
(B$)
Average Price at C.I.F. (B$/kg)
Percentage (%)
Whole Chicken 45,000 136,896 3.04 6.3 Parts 2,096 6,376 3.04 0.3 Processed 631,206 2,713,515 4.30 88.7 Whole/Parts for Processing Industry 32,976 111,588 3.38 4.6
JUMLAH 711,278 2,968,375 4.17 100.0

100
chicken processing company is Ideal Food Industries Sdn. Bhd. and it is part of the integrating stream of activities of their businesses that started from the production, slaughtering, processing and marketing of broiler. Their production and processing volumes are determined by their owned respective fast food marketing and department store outlets requirements. The nature of production activities is quite small and the line of products is normally concentrated on production of whole and parts with a small volume of further processed product such as sausages, frankfurters and nuggets etc. Their production shares are just around 25% through the year of 2006. In the case of the other four processors, most of their raw materials are imported chicken from Peninsular Malaysia in the form of whole chicken and parts and then processed it into sausages, frankfurters and nuggets and also into cooked and canned chicken curries. Currently, all these companies are operating well below their normal capacities and capabilities. All product produced are of premium type with their target of high end clients due to high price offered. So far none of these products are exported and is only marketed locally.
Table 5.4: The Chicken Processors and Their Volume of Production 2006
5.7: The Chicken Processed Products As in the case of processed beef production, all operators stated aboved produced almost the same kind of products namely beef burger, sausages and frankfurter, mince, ball and cake, cold cut and cooked and canned beef. It was found out that the chicken sausages and frankfurter dominated 56% of the total production line. The remaining is shared among others types of products as stated below.
No. Chicken Processors Quantities Produced Market Values Production
Shares (%) 1 PDS Abattoir Sdn Bhd 14,214.20 176,180.57 2% 2 Ideal Food Industries Sdn Bhd 165,898.00 1,177,216.00 25% 3 BMC Food Industries Sdn Bhd 470,243.73 2,597,029.84 70% 4 Cerah Supreme Food Supply
Sdn Bhd 11,021.76 80,348.80 2%
5 Sabli Group B Sdn Bhd 11,724.92 56,733.37 2% Total 673,102.61 4,087,508.57 100%

101
Table 5.5: Processed Chicken Product By Types 2006
Products Types Quantities Market Values Average Price Shares
Chicken Burger 47,282.70 $326,643.95 $9.04 7%Nugget 82,157.93 $451,017.95 $5.35 12%Chicken Sausage / Frankfurter 375,680.69 $1,960,455.48 $7.69 56%Chicken Mince 7,747.10 $51,191.13 $5.98 1%Ball / Cake 8,220.00 $29,106.00 $3.54 1%Chicken Cold Cut (Whole & Sliced) 9,767.85 $134,292.78 $13.83 1%Lain-Lain Produk Dalam Tin 11,724.92 $56,733.37 $4.84 2%Others (chicken fillet, roll and patty) 130,521.42 $1,078,067.92 $6.49 19% Total 673,102.61 $4,087,508.57 $7.09 100% 5.8: Markets and Promotions The inflow of cheap imported halal processed chicken products from all part of the world are somewhat hindered the development of local processing companies. These cheaper products dominated the sale of majority of super market and grocery stalls. Survey shows that these products are still the best buy of the majority that make the local processed chicken hardly compete due to their comparative disadvantages status and being newly introduced to the customers. Even though the local processed chicken’s prices are a bit higher than that of imported, the preferences of the high end customers as targeted are increasing. The continuous improvements of the technologies through the state of art processing machines is found out to be helpful in reducing the production costs and does the prices offered. The demand of truly halal processed chicken products again helps to push the demand up. As in beef processing industry, All the processed chicken products are sold locally and so far none for exports. The flow of these products is quite simple and straight forward and these products are marketed together with the processed products of the beef. All the operators have their own respective outlets where starting from the production line, the products then goes straight to the various designated outlets operated either by the same managements or by their respective sister companies which engaged in retailing businesses.

102
6 Conclusion And Recommendations As known, the locally made processed products either chicken or beef-based are basically less competitive to the world markets due to its higher cost of production and processing and the market price offered is quite expensive. The target clients of the operators in Brunei are the higher end users whom mostly thinking of the best premium quality and halal. At present, the demand is still great and encouraging and most of the existing operators are not facing any critical problems especially in their marketing. But over time, since Brunei is a small economy with small economy and population, the local demand will be fully saturated and subsequently the operators will no longer enjoy receiving the current offered prices which is definitely be going down. The processors have to sort outside markets for their respective products where the demand is great and more than the total capacity of the overall present operations. As known the global demand now is on the raise especially in the halal processed products which is normally associated with the processing of livestock-based products. Brunei Darussalam being one of the world major players in the verification and certification of halal products should also take the advantage of these opportunities. Thus, the need of the local production of processed food to be accelerated is urgent agenda. For the purpose of accelerating this progress, it is highly recommended for Brunei to concentrate his efforts more in the production of his own broilers, goats, cattle and buffaloes using high technologies and modern method of production. The existing conventional rearing method that is being practiced by most producers in broiler farming need to be upgraded and replaced by high technology closed houses. While the free range goats, cattle and buffaloes need to be housed using feedlot system with cut grasses. The local production of these livestock will serve as the raw materials for the processing industries instead of high reliance of the operators toward imported raw materials in which the supplies and prices of these products is very much dependence on the availability and the exchange rate. The use of modern method of rearing will also lessen the dependency on the imported workforce. The Bruneian cost of production and processing as noted is high. In the case of cooked product such as corned beef and chicken, packaging and canning costs consumed almost half of the price of these products due to its monopolistic business. So it is highly recommended that two or more canning factories should also be established in order to give pressure for more choices and styles of product presentation in the market. A considerable growth of agriculture and agricultural-based processing industry reflects a good achievement to the government in his effort to speed up the process of diversifying its economy. It is also served as an indicator to consumers’ confidence toward local products which is considered complete, safe, halal and good quality. Toward this, government effort to encourage local entrepreneurs through various schemes such as incentives and subsidies is found to be preferable and helpful in solving the lower productivity problems. But the efforts to evaluate and correcting such schemes is found to be minimal. Supports in term of material from the government seem not always to be the best answer. This is due to the fact that most input items left untouched and not in use. Therefore, incentives in the form of knowledge and value added information should be considered given a priority to the entrepreneurs.

103
At the same time, monopolistic issue in commodities trading such as importation of live animals, rice, and sugar seems loosing entrepreneurs’ confidence toward government efforts to develop the private sector. Such a monopolistic system of the government can create inefficiency that forces consumers to bear the price offered. The best way to get out is to corporatize or privatize the state owned enterprises so that free competition can always be ensured. It seems that at this infancy stage of the processing industry as characterized earlier put Brunei in the position of difficulty in getting the slot for export. As known that the importing countries procedures require consistency, bigger volume (shelf space), good quality, good presentation and better shelf life of the products. Due to all these weakness coupled with lack of export endorsement and accreditations from the relevant agencies lead Brunei to be a bit away from the export business.

104
Market Liberalization and its Relationship with Market Structure, Conduct and Performance of the Food Processing Industry in Indonesia by Adrian D. Lubis, Yati Nuryati, Arief Adang and Erwidodo
Table of Contents
Page 1 Introduction 108 1.1. Background of Study 108 1.2. Objective of Research 111 1.3. Research Scope 111 2 An Overview Of Indonesia Food Processing Industry 111 2.1. Indonesia Food Processing Industry Overview 111 2.2 Characteristic of Small and Medium Scale Food Processing
Industry In Indonesia 113
2.2.1 Number of Establishments 113 2.2.2 Number of Labors 114 2.2.3 Value Added 115 2.2.4 Exported Product 116 2.2.5 Concentration Ratio 117 2.2.6 Number of Investment 118 2.3. Policy Issues 119 2.3.1. General Policy Issue 119 2.3.2. Policy and Regulation in Food Processing 122 3 Analysis Of Result 124 3.1. Empirical Evidence of Wheat Flour Industry 124 3.1.1. Market Structure Analysis 124 3.1.1.1 Market-Oriented Strategy 125 3.1.1.2 Bureaucracy-Oriented Strategy 125 3.1.1.3 Transportation-Oriented Strategy 126 3.1.1.4 Concentration Ratio 127 3.1.1.5 Hirschman-Herfindahl Index (HHI) 128 3.1.1.6 Gini Coefficient 128 3.1.2. Market Conduct Analysis 130 3.1.2.1 Pricing 130 3.1.2.2 Channel of distribution 131 3.1.2.3 Strategy To Win the Competition 132 3.1.2.4 Research and Development 133 3.1.2.5 Vertical Integration 134 3.1.3. Market Performance Analysis 134 3.2. Empirical Evidence of Soybean Processing Industry 137 3.2.1. Market Structure Analysis 138 3.2.2. Market Conduct Analysis 139 3.2.3. Market Performance Analysis 139 3.3. Empirical Evidence of Fish Processing Industry 140 3.3.1. Market Structure Analysis 140 3.3.2. Market Performance Analysis 141 3.3.3. Market Conduct Analysis 141 3.3.4. Export-Import 142
105
3.4. Empirical Evidence of Beverage Processing Industry 142 3.4.1. Market Structure Analysis 142 3.4.2. Market Conduct Analysis 143 3.4.3. Market Performance Analysis 143 3.4.4. Export-Import 144 3.5. Empirical Evidence of Palm Oil Industry 145 3.5.1 Palm Oil-Based Industries in Indonesia 145 3.5.2 Development Export Palm Oil by Mayor Exporter
Indonesia 148
3.5.3. Market Structure 149 3.5.3.1 Concentration Ratio 149 3.5.3.2 Hirschman-Herfindahl Index (HHI) 149 3.5.3.3 Gini Coefficient 150 3.5.4 Market Conduct Analysis 151 3.5.4.1 Merger of Industry 151 3.5.4.2 Distribution Channel 152 3.5.5. Market Performance Analysis 153 3.6. Feedback Relationship of Market S-C-P 156 3.7. Performance Indicator for Medium Enterprise in Food
Processing Industry 158
3.8. Granger Causality Test of Fixed Capital (MODT), Variable of Capital (MODTT), Sales, Number of Enterprises (PRSH), and Advertising Cost
160
4 Research Findings 162 4.1. Wheat Flour Based Industries 162 4.2. Crude Palm Oil Industries (CPO 163 4.3. Soybean based industries 163 4.4. Fish Based Industries 163 4.5 Beverages Industries 163 5 Summary and Recommendation 164 5.1. Summary 164 5.2. Recommendation 164 6 References 165 Annex 167

106
List of Tables Table 2.1 Average Percapita Annual Expenditure Structure 112 Table 2.2 Total Food Industry Company in Small and Medium Enterprise in Indonesia (unit) Small Enterprise
114
Table 2.3 Number of Workers of Small and Medium Enterprises by 3 Digit ISIC, 1995-2005
115
Table 2.4. Value Added of Small and Medium Enterprises by 3 Digit SIC, 1995-2005 Small Enterprises (Million Rp)
116
Table 2.5. Shares of Product Exported of Large and Medium Manufacturing by 3 Digit ISIC, 2000-2004 (%)
117
Table 2.6: Concentration Ratio (CR 3) of Several Commodities 117 Table 2.7. Value of Investment in Small and Medium Enterprise, 1995-2005
118
Table 2.8: Indonesia Food Industry Export by SITC 3 digit, 1996-2005 123 Table 2.9. Indonesia Food Industry Import by SITC 3 digit, 1996-2005 123 Table 3.1 Export and Import of Soy sauce Processing Product, 1995 to 2005
140
Table 3.2 Export-Import in Fish Product, 1995-2005 142 Table 3.3 Export and Import in Beverage Product, 1995 to 2005 144 Table 3.4. Contributions of The Palm Oil Industry to The Gross Output, Value Added and Employment, 2005
146
Table 3.5 Contributions of the Palm Oil Industry to Investment, 2001-2004, Number of established companies
147
Table 3.6. Domestic Use of CPO-Based Industry Sector, (‘000 tones), 1993-2005
148
Table 3.7. Name of Companies and Product Differentiation in Cooking oil Industries
152
Table 3.8. Number of Firms in Medium Enterprise Industries (Unit) 158 Table 3.9 Sales Value of Medium Enterprise Industries (Million Rupiah) 159 Table 3.10 The Advertising Cost of Medium Enterprise Industries (Million Rupiah)
159
Table 3.11. Fixed Capital of Medium Enterprise Industries (Million Rupiah)
160
Table 3.12. Granger Causality Test for Fixed Capital, Variable of Capital, Number of Enterprise, Sales and Advertising Cost in Soy sauce industry
161

107
List of Figures Figure 3.1 Location of Each Wheat Flour Mills Company in Indonesia 125 Figure 3.2 Market Share of each player in Indonesia’s domestic 126 Figure 3.3 Development of Concentration Ratio of Wheat Flour Industry from 1997 to 2005
127
Figure 3.4. The Development of HHI in Wheat Flour Industries 128 Figure 3.5. Lorenz Curve of Indonesian Wheat Flour Industry in 1997, 2002, and 2005
129
Figure 3.6:. General Mode of Distribution 132 Figure 3.7. Development of Wheat Flour Prices, 1995-2007 135 Figure 3.8. ROA for Indofood Industry in Indonesia, 2001 to 2005 136 Figure 3.9 Processing of Major Soybean Products in Indonesia 137 Figure 3.10 Development of Concentration Ratio of Soysouce Industry from 1995 to 2005
138
Figure 3.11 ROA for soy sauce Industry in Indonesia, 1995 to 2005 139 Figure 3.12. Development of Concentration Ratio of Fish Processing Industry from 1995 to 2005
140
Figure 3.13 Development of Output in Fish and Meat Industries, 1995 to 2004
141
Figure 3.14 Development of Capital in Fish and Meat Industries, 1995 to 2004
141
Figure 3.15 Development of Concentration Ratio in Beverage Industry, 1995 to 2004
143
Figure 3.16 Development of Output Beverage Industry in Small Medium Enterprise, 1995 to 2004
143
Figure 3.17 Development of Capital Beverage Industry in Small Medium Enterprise, 1995 to 2004
144
Figure 3.18 Geographic Information System (GIS)-Based Mapping of Palm Oil Industry In Northern Sumatra
145
Figure 3.19. Percentage of Production Palm Cooking Oil by Region, 2006 145 Figure 3.20 Player of Oleochemia Industry in Indonesia and Share Capacity Refinery in Indonesia, 2006
149
Figure 3.21. Development of Concentration Ratio of Palm Oil Industry from 2004 to 2006
149
Figure 3.22. Development of Hirschman-Herfindahl Index (HHI) of Palm Oil Industry from 2004 to 2006
150
Figure 3.23. Gini Coefficient of Indonesian Palm oil Industry in 2004 to 2006
151
Figure 3.24 General Mode of Domestic Distribution Cooking Oil 153 Figure 3.25 Figure 3.25 Development of Production Palm Oil in Indonesia, Period 1983:5 – 2006:9
153
Figure 3.26. Development of Production CPO and Cooking Oil Indonesia, 1998 to 2005
154
Figure 3.27 Development of Consumption per Capita Cooking Oil Indonesia (Kg), 1998 to 2005
154
Figure 3.28 Development of Production and Consumption Palm Cooking Oil and Coconut Cooking Oil, 1998-2005 (million tones)
155
Figure 3.29. Development of Cooking oil and CPO Domestic Price 155 Figure 3.30 Development of Cooking Oil and CPO World Price 156

108

108
I. Introduction 1.1. Background of Study
Indonesia offers prospective market for food and agricultural ingredients processing sector. The data showed that almost 10 million Indonesians earn at least US$ 5,000 a year which concentrate in Jabodetabek area, hence Indonesia still ranks as one of the world’s most potential markets. Indonesia has been still undertaking an economic reform after the financial crisis in 1997/1998. However, The USDA reported that the Indonesia’s GDP per capita in 2002 was estimated at US$818.4, and it increased from US$ 609.4 in 2001. Moderate economic growth was about 3.5%, driven by a positive average food processing industry growth rate of 5%. Indonesia’s labor force working in the following sectors has accounted for 100 million person and the shares of each following sectors are agriculture (45%), industry (15%), and services (40%). This shares of labor force has formed an economic structure of agriculture (20%), industry (40%), services (40%). Processed food sales growth in 2002 was 15%, almost achieve reaching sales of over IDR. 61,000 billion (US$ 6.67 billion). Inflation contributed major role in augmenting the current value growth. USDA estimated that food processing sector was growing by only 5% last year. The value of modern snack, for example, has reached almost tripled However, we can justify that the volume just about the same as the pre-crisis level. Price increases for electricity, telephones, rice, and other basic necessity items in 2002 drove up end product prices. Non economy factor such social unrest, has been putting enough obstacle on trade growth. Nonetheless, consumer sophistication, growing health consciousness, the introduction of new food products, and growth of modern retail outlets has amplify the growth in the food processing sector over the next five years. USDA expected that growth will prevail ranging from 4-11% in volume terms and close to 8% in value terms. Indonesian food product imports for 2002 were increasing from US$2.9 billion in 2001 to about US$3.3 billion and it accounted for almost 30% of those products were imported as Processed Food and Beverages. The rest was distributed for directly by end consumer’s consumption or by food processing as ingredients. USDA accomplished a result that Imported processed food and beverages consumption has risen to close to pre-crisis level. Furthermore export of processed food and beverage have surpassed pre-crisis level at over one billion US$. USDA perceived that AFTA trade zone in 2003 should also create augmented opportunities in the ASEAN region for processed food products from Indonesia. Under AFTA, most products manufactured in the Association of Southeast Asian Nations’ 10 member states can be shipped to any other at a 5% duty or less. Despite the risk accounted, Indonesia is still regarded as an attractive investment region for multinationals companies to operate especially in the processed food sector.

109
Companies such as Unilever, Nestlé, Kraft, Danone, Cadbury, Heinz, Campbells, and Nabisco are maintain active operations in Indonesia. Indonesian food processing industry is an integration of agricultural sector on one side as the upstream industry and manufacturing industry on the other side as the downstream industry. Manufacturing and processing industry contributed to 28.1% to the overall Gross Domestic Product (GDP) in 2004. Processing industry output increased from Rp.639.7 trillion in 2004 to Rp.766 trillion in 2005. Food processing sector plays an important role in domestic economy. The backward linkage of the industry is strong. Establish firm for food and beverage in Indonesia were dominated by Small and Medium enterprises and it took 24.5% of the overall available companies in food and beverage sector in 2004. Many of the food processing sectors are located in Java. The other major manufacturing centers are North Sumatra, South Sumatra and North and South Sulawesi. Traditional methods of production are the main characteristic most of the companies. Foreign investment contributed to about 4% of the overall available companies in the industry in 2004 and those were dominated by large firm industry. Employment in food processing sector is immense. Based on the Central Bureau of Statistics publication, food and beverage was absorbing almost 733,062 people and almost 332,893 people were in processing and preserving of meat, fish, fruits, vegetables, cooking oil and fat sector during 2004. Average employment rate for each firm between SME’s and large enterprises is an interesting figure. Large firm absorbed almost 534 people for each company in terms of average; however SME has only managed to absorb 37 people in 2004. Large enterprises play a major role in food and beverage industry rather than Small and Medium enterprises. Another main important indicator to explore economic performance of certain industry is the capability of the industry to contribute on the overall national output. Food and beverage industry has managed to contribute Rp171.3 trillion (USD 17.1 billion) and Rp158.2 trillion (USD 15.8 billion) is supplied by large enterprises in 2004. Processing and preserving of meat, fish, fruits, vegetables, cooking oil and fat sector was the highest supplier of output in food and beverage industry. Based on the statistical data available, this industry contributed to about 53.62% or about Rp 91 trillion (USD 9.1 billion) in 2004. Foreign investment in food and beverage industry is taking the form of franchises and joint ventures. Poultry processing sector is a good example. Franchises seem to be growing rapidly, such as KFC (Kentucky Fried Chicken) and Mc. Donald. Meanwhile, Indonesia’s food export was demonstrating an increase trend for 2001 to 2005. Many export figure shows increasing trend for food product except fresh bovine meat, cold or frozen; edible meat; egg; dry fish; shrimp; spices, grain flour; processed

110
chocolate and non-alcoholic beverage. The triggering reasons for the diminishing exports figure are increasing domestic consumption concomitant with international sluggish demand during 2001 to 2005. Trade barrier, mainly technical barrier to trade, hamper the market access of the product during the period. Quality and SPS (Sanitary and Phyto sanitary) issues are the gigantic icebergs prevail in the export development policy during the period. Consolidation and combination of endorsing domestic efficiency and productivity in terms of quality and quantity are the basic solution to the overcome the obstacles. (See Table 1). Scrutinizing at Indonesian industrial food export, food export in marine based industry has accounted for US$1.79 billion, spices was at about US$ 159 million, flour based was at about US$139.6 million, confectionary- based industry was at US$146.7 million and animal based industry was at US$392.1 million in 2005. Global brands dominates confectionary industry in Indonesia is almost dominated by. Main industrial player for cocoa processed industry are MNCs (Multinational Companies). Nestle and Cadbury Schweppes, considered to be large companies, are good examples of the processing industry. Mars group now has also tried to enter the market and has become a major player in the confectionary industry. Development of hypermart and supermarket has augmented the role of international global market. Global market is an integrated feature in processing food industry and international integration is holding its claw to almost all the region in Indonesia. Existence of international franchises also becomes an eye catching to the development of food processing industry in Indonesia. Interrelation of international firm and local firm is inevitable to the domestic market entry development. Import in food industry was dominated by dairy-based industry and flour-based industry. Import trend for food is demonstrating a positive trend during 2001-2005. The figure of negative other flour processing firms enjoy cheap import of flour in one side as the result of liberalization and Bogasari has been collided with enormous competition. Bogasari, known as one of instant noodle producer, is also flour oligopolist in Indonesia. Increasing cheap flour import from China and India gigantically alter the industrial concentration in instant noodle industry. On the other side of food processing industry, fishery is a strong regulated industry based on the list of Indonesia’s technical barrier to trade. Imports of fish require strong quarantine and it is costly in term of incentives to importer. Fishery is also one of the Indonesian prominent exporting goods. Many of food processing imports are heavily regulated. Liberalizing them can be a very heavy option. Most of the regulation is to protect consumer from consuming dangerous, poisonous, and unhealthy food. Liberalization in terms of putting aside standards of food is not possible, however option is still there.

111
1.2 Objectives of Research
The objective of this research broad sense is to describe and explore further the Indonesian Food Processing Industry condition. Specifically, we may derive the objectives of this research are as follows:
• To analyze the structure of food processing industry in Indonesia • To analyze the development of Indonesia’s food processing industry performance. • To analyze the impact of trade liberalization on Indonesia’s food processing
industry performance. • To formulate policy recommendation to increase market efficiency of the process
food industry with respect to market liberalization.
1.3 Research Scope
This research is mainly exploring the impact of trade liberalization on food processing industry by scrutinizing the case of trade liberalization on Indonesia’s food industry. The proxy for the terminology “trade liberalization” is translated on the increase over imports in the industry. This research will obtain the available secondary data being published by Central Bureau of Statistics of Indonesia. The food processing industry includes in this research are fish based industry, Palm Oil based industry, flour based industry, soybean based industry and beverage industry. The industries have scale small and mediums enterprises (SMEs). The category in SMEs refers to Central Bureau of Statistics of Indonesia base on numbers of labor. 2.0 An Overview of Indonesian Food Processing Industry 2.1 Indonesian Food Processing Industry Overview
Indonesian Food processing industry is an integration of agricultural sector as the source of primary product or the upstream industry; and manufacturing sector as the downstream industry. Manufacturing and processing industry contributes to 28.1% to the overall Gross Domestic Product (GDP) in 2004.
Food processing sector plays an important role in domestic economy. The backward linkage of the industry is strong. Establish firm for food and beverage in Indonesia is dominated by Small and Medium enterprises and it takes 24.5% of the overall available companies in food and beverage sector. Foreign investments contribute to about 4% from the overall available companies in the industry in 2004 and are dominated by large firm industry. Many of the food processing sectors are located in Java. The other major manufacturing centers are North Sumatra, South Sumatra and North and South Sulawesi. Traditional methods of production are the main characteristic most of the companies.
Employment in food processing sector is immense. Food and beverage absorbs almost 733,062 employments, of which almost 332,893 employments are in processing and preserving of fish, fruits, vegetables, cooking oil and fat sector. Large firms absorb

112
Commodity Group Food IDR USD % of tot food IDR USD % of tot food %growth 01-02Cereals 241,344.00 23.52 21% 309,264.00 33.21 21% 28.14%Prepared food & beverages 138,528.00 13.50 12% 240,144.00 25.79 17% 73.35%Tobacco 149,940.00 14.61 13% 168,492.00 18.10 12% 12.37%Fish 114,768.00 11.19 10% 128,100.00 13.76 9% 11.62%Vegetables 79,500.00 7.75 7% 117,000.00 12.57 8% 47.17%Egg & Milk 64,932.00 6.33 6% 81,120.00 8.71 6% 24.93%Meat 59,868.00 5.84 5% 70,836.00 7.61 5% 18.32%Fruits 42,444.00 4.14 4% 70,416.00 7.56 5% 65.90%Beverage Stuffs 58,632.00 5.71 5% 67,068.00 7.20 5% 14.39%Oils & fats 47,832.00 4.66 4% 55,704.00 5.98 4% 16.46%Legumes 48,624.00 4.74 4% 49,932.00 5.36 3% 2.69%Spices 32,772.00 3.19 3% 38,424.00 4.13 3% 17.25%Miscellaneous food items 26,364.00 2.57 2% 33,912.00 3.64 2% 28.63%Tubers 15,780.00 1.54 1% 15,948.00 1.71 1% 1.06%Alcoholic beverages 1,980.00 0.19 0% 2,040.00 0.22 0% 3.03%
Total of food 1,123,308.00 109.48 64% 1,448,400.00 155.56 58% 28.94%Total of non-food 626,340.00 61.05 36% 1,028,220.00 110.43 42% 64.16%Total expenditure 1,749,648.00 170.53 100% 2,476,620.00 265.99 100% 41.55%
Exh. Rate 1 USD = 10,260 IDR 1 USD = 9,311Source: Central Bureau of Statistic
2001 2002Average Per-capita Annual Expenditure Structure
almost 534 employments for each company in term of average; however SMEs only manage to absorb 37 employments in 2004. Large enterprises play a major role rather than Small and Medium enterprises in food and beverage industry. Another main important indicator to explore in observing economic performance of certain industry is the capability of the industry to contribute on the overall national output. Food and beverage industry has managed to contribute 26% of the total manufacturing output, of which 92% is supplied by large enterprises. The suppliers of output in food and beverage industry are mostly dominated by processing and preserving of meat, fish, fruits, vegetables, cooking oil and fat sector. These industries contribute to about 53.6% of the total food and beverage industries in 2004. Foreign investments in food and beverage industry take in the form of franchise and joint venture. Foreign investment usually adopts joint venture and franchises. Poultry processing sector is a good example. Franchises seem to be growing rapidly, such as KFC (Kentucky Fried Chicken) and MacDonald. Indonesians spent 60% of their total expenditure in 2001 and 2002. This was constructed by 25% was spend for processed food & beverage or about US$8.55 billion annually and the rest was for other kind of food.
Table 2.1: Average Percapita Annual Expenditure Structure
Source: Central Bureau Statistic (CBS) (cited from USDA report (2003)

113
USDA explored further down the consumer profile and the perception of Indonesian consumption to processed food. It is conceived that convenience processed food products are affordable only for higher income groups. It is considered to be luxurious product. Middle class urban population, comprising 20 percent of the population, are the main consumers of processed food. Processed food industries are facing changing consumer profiles during post crisis. Conscience towards healthy diet has been an increasing trend.
2.2. Characteristics of Small and Medium Scale Food Processing Industries in Indonesia
Among these small and medium scale industrial activities, the manufacturing of food and beverages is the most important, in terms of the number of businesses (38.271 or 31%) and the number of worker employed (309.603 persons or 31%). Indonesia has a large number of traditional foods which used to be prepared by household for their own use. As the demand for convenience foods grows, the traditional foods which are relatively complex to prepare are being produced industrially, to be sold as ready-to-serve products. They are several ways of classifying the scale of industries. Indonesia’s Central Bureau of Statistics attempts to classify industrial businesses according to the number of their employees:
• Large 100 workers • Medium 20-99 workers • Small 5 – 19 Workers • Home industry, 1 – 4 workers
The classification in the scale of industries base on small and medium enterprise by grouping ISIC 3 digit. They are Processing Foods (151), Milk (152), Grain Mill Processing (153), Other Food (154) and Beverage (155). The using ISIC 3 digit caused limiting of data for ISIC 5 digit especially in small enterprise.
2.2.1 Number of Establishments
Food processing industry in Indonesia is dominated by medium scale enterprises, accounted for around 70%. Despite experienced by economic crises in 1998, the growth of small industry showed a decrease trend exception in Grain Mill Processing (153) and Beverage (155). In 2001 to 2005 the numbers of small industry increase around over 50%, respectively, however, for the period of 1999 to 2002, the number of medium industry showed a decrease trend. Processing foods and grain mill processing tend to increase in their period. In 2005, the number of both medium and small industries went up significantly, mainly due to increases in the number of processed food and beverage industry (see Table 2.2).

114
Table 2.2 Total Food Industry Company in Small and Medium Enterprise in Indonesia (unit) Small Enterprise
1995 59450 2712 114042 720905 161691996 51722 3999 269958 668533 185841998 32206 946 137907 575636 154731999 27470 156 152269 642109 192482001 18935 209 159878 649197 100882002 33580 447 199635 658585 189202003 34998 899 192447 633105 115882004 43373 1031 149473 668302 8198
1995-1999 -24.34 -63.24 1.97 -4.85 3.462001-2005 28.76 73.09 -2.36 0.48 -10.53
154 155
Average Annual Growth Rate (%)
Year 151 152 153
Medium Enterprise
Year 151 152 153 154 1551995 841 33 820 2277 2491996 878 36 831 2438 2681997 857 32 849 2355 2751998 884 38 827 2569 2481999 911 39 842 2612 2582000 947 41 832 2582 2592001 945 39 796 2510 2522002 948 41 796 2494 2572003 950 39 737 2433 2402004 1029 39 752 2541 2742005 1090 43 742 2559 288
1995-1998 1.26 3.10 0.47 3.33 0.141999-2002 1.18 1.01 -2.11 -1.66 -0.392003-2005 7.12 5.00 0.34 2.56 9.54
Average Annual Growth Rate (%)
Source: CBS, 2005
2.2.2 Number of Labors
In the period of 1995 to 1999, the number of labor in small industries showed an increase. At the time in the period of 2001 to 2004 tend to increase, while grain mill processing and beverage were to decrease in their period. The increase was mostly due to the increase in number of labor in processed food, milk and beverage industry, while rice and other food processing and beverage industry demonstrated a decrease trend in the period of 1999-2002 (Table 2.3). Central Bureau Statistic (CBS) indicated a steady role of both medium and large industry in absorbing national labors. In the period of 1999-2003, both

115
medium and large industry took up around 4.8% of national labors per year, which was dominated by food and beverage industry, accounted for 15.3% in 2003 (CBS, 2004). Table 2.3 Number of Workers of Small and Medium Enterprises by 3 Digit ISIC,
1995-2005 Small Enterprise, 1995-2004
Year 151 152 153 154 1551995 128,692 6,670 348,072 1,665,070 34,184 1996 142,145 8,106 718,500 1,592,727 44,830 1998 78,453 1,364 366,214 1,370,972 35,750 1999 88,541 328 395,775 1,559,916 33,961 2001 65,512 387 438,922 1,506,804 26,012 2002 108,410 771 527,541 1,608,007 44,918 2003 91,231 1,319 556,964 1,551,806 29,403 2004 116,856 2,786 388,368 1,617,541 19,046
1995-1999 -15.77 -66.11 -2.85 -3.40 -2.432001-2004 16.92 90.77 -3.08 1.79 -12.71
Average Annual Growth Rate (%)
Medium Enterprise, 1995-2005
Year 151 152 153 154 1551995 137893 6681 89401 269796 248131996 146638 7597 107036 277417 255301997 156439 6840 87708 259748 256821998 172408 6498 103810 292754 222491999 173315 6446 95153 279653 231042000 170218 6897 97004 299620 236342001 168756 7904 91140 289702 252152002 213633 8991 83835 292297 255052003 253847 9287 77422 285857 260842004 331835 9177 76915 284021 308372005 229942 10564 74688 289061 32370
Average Annual Growth Rate (%)1995-1998 7.63 -1.87 2.52 1.81 -3.161999-2002 6.38 1.01 -2.11 -1.66 0.392003-2005 0.95 1.07 0.98 1.01 1.11
Sources: CBS, 2005 (processed)
2.2.3 Value Added
Value added of food processing industry at current prices has increased in the past five years (2000 to 2004). During the past five years (2000 to 2004) the main contributors to growth, both for large and medium manufacturing, were food processing industry, grain processing, and other foods (see Table 2.4). In 1995 to 1999 period for small enterprise, growth value added food processing and beverage industry achieve average 69.11% and 56.56%. Meanwhile In 2001 to 2004 while growth value added in each industry average 1.42% and 1.10%. In Medium enterprise, growth values added of food processing industries achieve 50.48%. Nevertheless in beverage industry has decrease 2.43% in 1995 to 1998 period. Meanwhile in 2003 to 2005 growth value added of both the industries achieve 29.16% and 21.53%. Overall in the industries after trade liberalization growth value added tend to decrease.

116
Table 2.4. Value Added of Small and Medium Enterprises by 3 Digit ISIC, 1995-2005
Small Enterprises (Million Rp) Year 151 152 153 154 1551995 66,194 5,825 463,424 910,866 19,019 1996 180,625 7,696 1,297,638 1,742,483 64,169 1998 295,972 2,428 1,532,910 3,021,270 87,059 1999 323,494 620 1,553,153 3,788,080 76,555 2001 285,794 3,209 2,998,816 4,598,444 98,262 2002 663,872 9,453 2,351,583 5,181,358 195,768 2003 464,013 5,338 4,173,367 6,117,323 179,948 2004 1,027,649 16,342 3,293,042 5,860,559 138,095
1995-1999 69.11 -54.49 46.15 62.03 56.562001-2004 1.42 1.54 1.09 1.09 1.10
Average Annual Growth Rate (%)
Medium Enterprises (Million Rp)
Year 151 152 153 154 1551995 2,439,175 386,962 1,277,218 2,274,950 767,069 1996 2,873,212 536,375 1,335,597 2,750,894 891,957 1997 4,774,312 570,089 2,979,821 2,781,573 992,480 1998 8,040,488 1,028,180 3,309,538 6,986,219 682,040 1999 10,548,059 2,170,819 3,473,776 7,359,672 1,149,121 2000 10,384,281 1,288,923 5,116,305 8,712,625 1,488,278 2001 15,144,641 2,049,514 5,534,536 10,458,460 1,526,587 2002 16,830,327 4,517,085 5,542,493 11,709,424 1,870,267 2003 20,180,566 2,706,066 4,106,649 13,404,971 2,043,489 2004 27,846,738 2,950,535 3,978,755 13,369,534 2,395,796 2005 33,663,444 2,512,100 4,660,863 15,046,010 3,018,048
1995-1998 50.48 34.89 44.18 40.17 -2.431999-2002 19.47 30.50 15.95 17.07 16.032003-2005 29.16 -3.65 6.53 5.94 21.53
Average Annual Growth Rate (%)
Sources: CBS, 2005 (processed)
2.2.4 Exported Product
The shares of exported food processing industries product of large and medium establishment fluctuated within 2000-2004. In 2000 and 2001, the shares of exported product increased, mainly food processing and beverage, while the shares decreased in 2002, 2003, and 2004. The decrease by large and medium establishment in food industries caused some factors, such as (1) word consumption was decreased, (2) trend domestic consumption was increased and (3) competitiveness product in international market was decreased (see Table 2.5).

117
Industri Trend (%)Code 2000 2001 2002 2003 2004 00-04151 Processing Foods 70.41 78.18 61.58 59.82 58.38 -6.22152 Milk 7.99 12.09 6.49 2.08 15.46 -4.30153 Grain Mill Processing 55.17 61.2 41.87 39.42 38.76 -10.83154 Other Food 38.17 43.18 41.73 42.19 32.03 -3.67155 Beverages 87.83 76.7 24.01 46.26 17.52 -31.13
Description Year
Table 2.5. Shares of Product Exported of Large and Medium Manufacturing By 3 Digit ISIC, 2000-2004 (%)
Sources: CBS, 2004 (Processed)
2.2.5 Concentration Ratio
Concentration ratio is one of the measurements for market structure or competition intensity that occur between firm industries. In this analysis for the data use ISIC 5 digit . The data showed that industries which tend to engage in a oligopoly market or CR 3 greater than 0.9 are Flour Industry (15321). The market structure tends to engage in 1995 to 1998 toward perfect oligopoly depicted by CR 3. in 1999 to 2004 period CR 3 greater than 0.8 (80%) is found in flour industry. In Table 6 description to CR3 on several commodities base on ISIC 5 digit of medium enterprises. The small enterprise can’t shown this table because of the time series data not available (see Table 2.6).
Table 2.6: Concentration Ratio (CR 3) of Several Commodities
15112 15121 15321 15493 155401995 59.37 45.95 98.75 46.46 27.561996 54.43 48.81 99.24 50.40 29.991997 46.90 66.30 94.34 77.59 29.001998 37.97 71.95 93.30 88.65 29.001999 41.47 53.56 88.89 87.68 26.782000 40.47 49.02 90.35 87.20 35.012001 39.79 40.03 80.25 79.75 35.242002 54.80 41.13 95.96 77.31 38.992003 63.14 39.77 87.89 86.13 25.032004 38.29 38.45 90.94 81.34 24.332005 29.29 48.13 73.18 79.68 24.54
Average1995-1998 49.67 58.25 96.41 65.77 28.891999-2002 44.13 45.94 88.86 82.98 34.002003-2005 43.57 42.12 84.00 82.38 24.63
ISICYear
Sources: CBS, 2005 (processed)

118
2.2.6 Number of Investment
Number of investment in small enterprise during 1995 to1998 period tend to decrease except for grain mill processing and beverage industry with average growth per year about 16.82% and 2.32%. Meanwhile, grain mill processing industry in medium enterprise show negative trend (tend to decrease), while growth investment decrease to 16.16%. After economic crisis (2001-2004) investment in food processing in small scale industry showed a positive growth, its average growth per year was 28.76%. Meanwhile, the investment in medium enterprise for food processing sector was decreased, average 15.45% per year. In the same period, it’s the grain mill processing and beverage industries were tend to increase with average growth per year each about 71.40% and 4.66%. After trade liberalization growth of value investment in food processing in small industries tend to increase. Nevertheless, in medium enterprise tend to decrease in their period (see Table 2.7). Table 2.7. Value of Investment in Small and Medium Enterprise, 1995-2005 Small Enterprise (Million Rp)
Year 151 152 153 154 1551995 59.45 2.712 114.042 720.905 16.1691996 63.47 1.009 69.367 858.195 20.7561998 32.21 0.946 137.907 575.636 15.4731999 27.47 0.157 152.268 642.109 19.2482001 18.94 0.209 159.878 649.197 10.0882002 33.58 0.447 199.635 658.585 18.922003 35.00 0.899 192.447 633.105 11.5882004 43.37 1.031 149.473 668.302 8.198
1995-1999 -25,88 -57,73 16,82 -7,19 2,322001-2004 28,76 73,09 -2,36 0,48 -10,53
Average Annual Growth Rate (%)
Medium Enterprise (Million Rp)
Year 151 152 153 154 1551995 2,923,837.6 238,911.0 8,437,573.0 3,607,209.0 685,358.31996 4,566,013.4 321,482.8 7,145,891.5 6,200,274.0 687,549.01997 6,208,189.2 404,054.7 5,854,209.9 8,793,339.0 689,739.71998 4,333,607.9 268,178.5 5,011,751.0 10,184,615.8 940,683.11999 29,222,178.3 284,791.1 2,252,813.4 33,708,972.3 769,606.22000 25,748,348.9 343,289.2 4,880,611.1 14,342,612.3 35,283,618.82001 3,991,920.2 648,577.4 4,651,972.5 6,839,058.6 1,459,762.72002 10,539,277.1 1,192,042.7 7,265,912.6 11,339,001.3 1,345,472.62003 51,718,758.5 1,299,880.8 35,084,209.1 181,299,564.9 6,385,120.52004 28,482,740.9 1,237,671.9 4,787,436.5 86,338,363.3 6,630,530.42005 36,973,711.5 1,182,686.3 103,069,034.4 85,075,130.8 6,993,647.8
1995-1998 16,04 5,92 -16,16 41,39 10,001999-2002 -38,88 63,74 41,41 -33,03 -14,012003-2005 -15,45 -4,61 71,40 -31,50 4,66
Average Annual Growth Rate (%)
Sources: CBS, 2005 (Processed)

119
Major constrains, and efforts to solve the problems of small-scale industries. Generally, small-scale industries in Indonesia have little capital, and are managed in a traditional manner. They face technical as well as economic problems. Since they are not able to solve their problem by themselves, the government has decided to assist them. Ilyas and Esmara (1990) say that the main constrains of small-scale food processing industries in Indonesia are (1) they have very little capital. In some case, labor is almost the only production factor used; (2) maintenance costs are often uneconomic; (3) they use, traditional technology; (4) the quality of the product is relative low; (5) their access to markets is limited; (6) marketing expansion is difficult, in the face of regional government organization as was as limited demand; (7) there are credit problems, and often they lack access to banks; and (8) they lack facilities. Generally, there are more facilities available to medium-and large-scale industries than to small industries.
2.3. Policy Issues
2.3.1. General Policy Issues
Indonesia’s trade and related policies are part of its overall social and economic development strategy, and not goals in themselves. While trade and related polices should contribute to the improved efficiency and overall growth of the economy that will increase the availability of resources for social purposes, policies - and their implementation - need to take account of short- to medium-term social consequences of change, particularly in the light of persistent unemployment and poverty, especially in some regions. Because of the diversity of the levels of development across the archipelago, Indonesia considers that social justice requires the greater effort to spread the benefits of its economic achievements to all of its peoples, as in the decentralization program of recent years. Indonesia is also of the view that the longer term development of the economy needs to be consistent with Indonesia’s underlying comparative advantage. However, policy interventions may be need to realize these goals in the presence of externalities associated with certain economic activities and in the light of important distortions on world markets, including barriers to exports. The pace of policy implementation also depends on the success in building supply capacities and social indicators. While Indonesia’s own polices are obviously key, assistance from treading partners and donors can also be of considerable assistance. With regard to the structure of the Indonesian economy, services now make the largest contribution to GDP, around 40 per cent in recent years. Manufacturing is second at some 28 per cent, while the share of agriculture has fallen form 15.5 per cent in 2002 to 12.9 per cent in 2006, and mining and quarrying has grown for 8.8 per cent tot 10.6 per cent in the same period. Construction has grown slightly to 7.5 per cent, while the electricity, gas and water sector has remained stable at around 1 per cent. Clearly services and industry are now major employers, particularly in the urban areas, and any sectoral policy changes need to take account of the potential impact on employment. However, the agricultural sector is also critical for the poorest regions of the country. The sector has an important role in the provision of the most basic food of the nation,

120
rice, but it also has a large element of subsistence farming, and, overall, the agricultural sector is a net consumer of rice. Indonesia has considerable natural resources, renewable, such as its extensive tropical forests, fishing, etc., and non-renewable, such as oil and gas, and minerals. Managing these resources prudently for sustainable development is a major challenge for any government, and more so for Indonesia because of its many islands. To this end, various program are being implemented and being improved, including for example the management of its forestry and fishing resources. Indonesia’s trade balance has fluctuated, but registered a trade surplus of over $3 billion in 2006. Exports grew at the robust rate of some 18 per cent in the period 2003-06, reaching record levels. Much of this can be attributed to strong commodity prices, in particular oil and gas, but also rubber, palm oil, coal and metal ores, as well as the healthy growth of the world economy. However, measures to improve the competitiveness of the Indonesian economy, including control of inflation, also seem to be paying off. Oil and gas exports reached some $2.2 billion in 2006, an increase of 17.6 per cent over the previous year. (In 2005 the increase was partially associated with world price increase of crude oil, which also triggered an increase in the value of oil and gas imports since Indonesia is a net importer of such products). Non-oil & gas exports of goods reached $79.5 billion, nearly 20 per cent higher than in 2005. In the light of reduced expectations for the growth of the world economy, the Government target for non-oil export growth in 2007 is 14.5 per cent. Reaching this target will require special effort, in particular on trade-related infrastructure, but much depends on the external environment, such as the economic growth of major markets and commodity prices.
i) Tariff policy
To fulfill its commitments in the Uruguay Round, Indonesia implemented significant changes in its bound MFN tariffs over the period 1996-2003 (under Minister of Finance Decree No.378/KMK.01/1996). In addition, it has begun to implement further changes in its applied MFN rates under the ASEAN Tariff Harmonization Program for the period of 2005 to 2010, as well as reductions in AFTA preferential rates, consistent with its views on the importance of integration within the Asian region. To accommodate national economic interests, however, some products have been excluded from the general schedule of tariff reduction program. These are mainly in the agricultural, chemicals, plastics, metals, alcoholic beverages and automotive sectors, as well as products related to moral and security items. The tariff reduction schedule for these products was stipulated in the Minister of Finance Decree No. 542/KMK.01/1997.

121
The implementation of the tariff reduction program has changed Indonesian tariff structure significantly. In 1995, the average tariff rate was 15.6 per cent, with rates ranging from 0 to 10 per cent covering 3,832 tariff lines (or just over half of the total of 7,386 tariff lines). In 1996, the year when the program was first launched, the average rates declined to 13 per cent, with an expansion of the rates lying in the 0-10 per cent range to 56 per cent of lines. By the end of the tariff reduction program (2003), the average rates had fallen to 7.2%, while rates lying in the 0-10 per cent range had increased to 83.4 per cent of lines In 2004, one year after the tariff reduction program ended, Indonesia adopted the new tariff classification under “ASEAN Harmonized Tariff Nomenclature” (AHTN) as part of Indonesian commitment under AFTA. As noted earlier, the purpose of the program is a gradual lowering and harmonization of rates, intended to reduce inter-sectoral distortions, while preserving a moderate overall level of assistance to the productive sector on an MFN basis. The program beyond 2010 has not yet been finalized. With the new classification, the total tariff lines increased drastically from 7,540 in 2003 to 11,163 in 2004. As a consequence of the technical classification changes, tariff rates also changed, and the average tariff increased to 9.9 per cent, with rates between 0 and 10 per cent covering 8,387 tariff lines (75 per cent of the total of 11,163 tariff lines).
As a continuation of the tariff reduction program, Indonesia introduced the Tariff Harmonization Program for the period of 2005-2010. Under the program, the average tariff reached 9.5 per cent in 2006, with rates in the 0-10 per cent range covering 8,365 tariff lines or 74.9 per cent the total.
ii) Tariff Exemptions or Concessions and Duty Drawbacks
To increase the efficiency and the competitiveness of domestic industries, Indonesia provides certain tariff exemptions or concessions, in accordance with Indonesia Custom Law (Law 10/1995). The importation of raw materials, components, or machineries that are used by a certain industrial sectors can be exempted from import duties. Some of industries granted tariff exemptions or concessions include aircraft maintenance, public transportation, energy and telecommunications. In addition, Indonesia is also implementing the Duty Drawback System on the re-export of imported inputs. This policy is stipulated in the Minister of Finance decree No. 580/KMK.04/2003. iii) Non-tariff measures In order to improve the functioning of the economy in line with its dynamic comparative advantage and make it more responsive to long-term international price movements, Indonesia has also been progressively eliminating non-tariff measures, in particular the use of import licenses which is currently limited to dangerous materials; explosives; ozone-depleting substances; alcoholic beverages; salt; propylene copolymers; lubricant; clove; textiles and textile products;
122
nitrocellulose; machines and machinery; optical discs; and rough diamonds. The most important measures still in place are: i) the regulation on the timing of the import of rice and sugar: ii) verification and other requirements for the export of tin and granite; and ii) the ban on the export of logs and sand. Some product is relates with social economic condition in Indonesia, such as rice and export logs. Rice import policy is important policy in Indonesia to protect Indonesian rice farmers. Export logs ban is use by Indonesian government to protect Indonesian tropical forest that had high deforestation today. iv) Incentives Concerning central and local authorization of investments, the Ministry of Domestic Affairs is now preparing the amendment to Government Regulation No.25 Year 2003. This process is expected to reach its final stage coinciding with the Investment Law Bill that has just been approved by the legislature. To anticipate challenges that will be faced by Indonesia such as global competition and as mandated in Law No. 32 year 2004 regarding Local Government (an amendment of Law No. 22 year 1999), the Government is now preparing a Government Regulation Bill (GRB) concerning the Guidance for Granting Incentives and Investment Facilitation in Local Area. A draft is currently being discussed with affected sectors. The investment policy package (February 2006) covers the following areas: i) general investment policies; ii) customs; iii) taxation; iv) the labor market; v) small and medium-size enterprises (SMEs). The sectors will be covered in the investment policy are services include health, education, infrastructure, etc; agriculture; fisheries; oil, gas and mineral, manufactures
2.3.2. Policy and Regulation in Food Processing Deregulation of the market in the recent past has removed most import barriers, especially: • The majority of ingredients for food processing may be readily imported after
satisfying Health Department regulations. • An important requirement for food imports is certification acceptable to the Muslim
association of Indonesia (MUI) that the product is Halal. • Import documentation must be complete and in accordance with Government
regulations to avoid costly delay. • Import duties on most food impediments, with the exception of sugar and rice, are five
percent. • Some ingredients may require certain documentations for import product
registration at the Indonesian Food and Drug Administration (Badan Pengawas Obat-obatan dan Makanan / BPOM), and in some cases to the Indonesian Department of Agriculture.

123
Table 2.8: Indonesia Food Industry Export by SITC 3 digit, 1996-2005
1996 1997 1998 1999 2000 2001 2002 2003 2004 2005 Average151 Production, processing and pres 3.109.857 3.855.743 2.783.926 3.262.047 3.254.643 2.895.846 4.099.472 4.506.070 6.064.298 6.717.310 4.054.921 152 Manufacture of dairy products 9.687 5.643 8.694 18.073 75.053 94.874 56.713 64.188 72.896 99.702 50.552 153 Manufacture of grain mill produ 74.510 27.180 65.953 51.587 29.772 29.823 32.615 38.703 99.151 90.630 53.992 154 Manufacture of other food produ 266.832 273.507 216.604 294.240 285.086 294.509 378.096 460.704 522.260 632.114 362.395 155 Manufacture of beverages 16.661 14.956 14.890 20.706 23.826 24.572 28.257 24.087 31.870 26.158 22.598
Total 3.477.548 4.177.029 3.090.067 3.646.652 3.668.379 3.339.623 4.595.154 5.093.752 6.790.475 7.565.914 4.544.459
Share151 Production, processing and pres 89,43 92,31 90,09 89,45 88,72 86,71 89,21 88,46 89,31 88,78 89,25 152 Manufacture of dairy products 0,28 0,14 0,28 0,50 2,05 2,84 1,23 1,26 1,07 1,32 1,10 153 Manufacture of grain mill produ 2,14 0,65 2,13 1,41 0,81 0,89 0,71 0,76 1,46 1,20 1,22 154 Manufacture of other food produ 7,67 6,55 7,01 8,07 7,77 8,82 8,23 9,04 7,69 8,35 7,92 155 Manufacture of beverages 0,48 0,36 0,48 0,57 0,65 0,74 0,61 0,47 0,47 0,35 0,52
Total 100,00 100,00 100,00 100,00 100,00 100,00 100,00 100,00 100,00 100,00 100,00
YearProduk
Source : Wits, World Bank (processed)
Table 2.9. Indonesia Food Industry Import by SITC 3 digit, 1996-2005
1996 1997 1998 1999 2000 2001 2002 2003 2004 2005 Average151 Production, processing and pres 647.655 644.109 303.771 305.973 524.310 568.996 489.547 572.842 877.849 811.390 574.644 152 Manufacture of dairy products 201.659 160.404 125.500 137.957 267.197 332.383 252.284 282.078 447.511 536.650 274.362 153 Manufacture of grain mill produ 985.713 358.823 1.004.408 1.529.824 639.962 414.394 638.460 633.159 440.553 499.895 714.519 154 Manufacture of other food produ 597.323 551.038 414.391 596.655 384.388 365.412 359.638 525.575 549.856 892.326 523.660 155 Manufacture of beverages 49.935 51.390 16.612 17.790 24.520 22.159 19.194 19.896 34.055 37.776 29.333
Total 2.482.285 1.765.765 1.864.681 2.588.198 1.840.376 1.703.344 1.759.124 2.033.550 2.349.823 2.778.038 2.116.518
Share151 Production, processing and pres 26,09 36,48 16,29 11,82 28,49 33,40 27,83 28,17 37,36 29,21 27,51 152 Manufacture of dairy products 8,12 9,08 6,73 5,33 14,52 19,51 14,34 13,87 19,04 19,32 12,99 153 Manufacture of grain mill produ 39,71 20,32 53,86 59,11 34,77 24,33 36,29 31,14 18,75 17,99 33,63 154 Manufacture of other food produ 24,06 31,21 22,22 23,05 20,89 21,45 20,44 25,85 23,40 32,12 24,47 155 Manufacture of beverages 2,01 2,91 0,89 0,69 1,33 1,30 1,09 0,98 1,45 1,36 1,40
Total 100,00 100,00 100,00 100,00 100,00 100,00 100,00 100,00 100,00 100,00 100,00
YearProduk
Source : WITS, World Bank (processed)

124
3. Analysis of Result
3.1. Empirical Evidence of Wheat Flour Industry
3.1.1 Market Structure Analysis
Indonesia does not grow wheat and has become a net importer up to now. Indonesia had recently turned into the world’s largest whet importer. Wheat bakery and bread, derivative products of wheat, became essential food substitution for some Indonesian citizen as the result of western cultural assimilation. In the long term, Indonesian government has continuously developing wheat as food substitution of rice, considering its content of calories. The development of noodle industries is one of the examples. Wheat and wheat flour are considered as major commodities for Indonesia, and the government has put great attention on its development. Magiera (1995) explained that the government imposed strict control on wheat and wheat flour trade. BULOG, National Logistic Agency, used to be the sole authorized importer of wheat grain and control the distribution of wheat. However, Bulog did not process wheat grain into wheat flour and merely just importing wheat grain. Bulog provided the imported wheat to some milling factory. The first milling factory was built in Jakarta by Bogasari Flour Mills. That mill located near to the harbor to obtain economic of scale in production. Shorter distance between mill and harbor is expected to reduce cost of transportation. Bogasari, established on November 29, 1971 located in Tanjung Priok, North Jakarta. After one year of its milling factory establishment in Jakarta, Bogasari invested new factory in Tanjung Perak, Surabaya to expand its production line. Bogasari manages all inputs in the the production process to an integrated package under the company control. Bogasari has created the production chain from importing wheat, transportation facilities, and packaging in one strategic company policy. Packaging company was built in 1977 to wrap up flour distributed to the market. The second largest milling company for wheat flour is PT. Prima Utama which built in 1972 and located in Ujung Pandang, South Celebes. This is a foreign investment establishment in Indonesia from Singapore. The company changed its name into PT. Berdikari Sari Utama in 1982 and it is PT. Eastern Pearl Flour Mills. The company produces wheat flour for food processing consumption and wheat flour for glue to supply ply wood industry.

125
Source: APTINDO, 2002 (cited from Bogasari website)
Notes: Bogasari (BS) Jakarta = PT ISM Bogasari Flour Mills - Jakarta Bogasari (BS) Surabaya = PT ISM Bogasari Flour Mills - Surabaya BSUFM = PT Berdikari Sari Utama Flour Mills Sriboga = PT Sriboga Raturaya Panganmas (PM) = PT Panganmas Inti Persada Figure 3.1 Location of Each Wheat Flour Mills Company in Indonesia Figure 3.1 shows the location of each wheat flour mills company in Indonesia. Wheat flour mills are mostly located in Java and only one factory in South Celebes. The underlying logical reasons for the locations of company are as follows:
3.1.1.1 Market-Oriented Strategy
Market oriented strategy means that a company locates its factory in the nearest place to the market. Java with the highest population density in Indonesia and it has a great consumer potential for wheat flour. The flour milling factory considered to have economic of scale is located in Java. 3.1.1.2 Bureaucracy-Oriented Strategy
The location of Indonesia’s capitol in Java, considered to be cost efficient for administration and services; such as licenses, tax disbursement, and access of information from the central government on the regulations and other government services.

126
0%10%20%30%40%50%60%70%80%90%
100%
1997 1998 1999 2000 2001 2002 2003 2004 2005
ImporPanganmasSribogaBerdikariBogasari
3.1.1.3 Transportation-Oriented Strategy
The closeness of the wheat flour mills to the harbor is very important to reduce transportation costs. Figure 3.2 shows that market shares of Bogasari is immense and starts to decrease after the deregulation of wheat flour industry. Wheat flour industry was initially under strict control by BULOG. BULOG had been administering prices from 1971 to 1998 and during the economic crisis under IMF program in 1998, the market control by the Bulog was eliminated to obtain free competing market in wheat flour trade. It has major contribution to creation of Pt. Indofood in monopolizing market of wheat flour and its derivatives market. Indofood acquisition of Bogasari in 1995 was became the milestone in the development of wheat flour industry in Indonesia. Vertical integration of noodles and wheat flour derivatives created a strong monopoly power of Indofood in the food processing industry. Before the deregulation of wheat flour market, the dominant players in the economy were Bogasari and Berdikari Sari Utama. Bogasari almost possessed 80% of the market shares and the rest is Berdikari Sari Utama. In 1999, the market share of Bogasari was dropped to below 70% due to new entrance from new investment and increasing shares of import in the market. Bogasari managed to increase its market share until 2001 and the government policy to open the market for imports had lowered Bogasari market share in 2002.
Allegation of dumping from United Arab Emirates (UAE) wheat flour imports was became hot issues among wheat flour producer. Complaint of wheat floods in domestic market from UAE, China, and India created tremendous pressure to domestic market. Four domestic companies then filed charges and complain of dumping allegation of dumping for wheat flour imports from UAE, China, and India. The current condition of the market shows that, Bogasari remain as market leader up to 2008 with market share of 70 percent followed by Berdikari, Pangan Mas and Berdikari respectively.
Figure 3.2: Market Share of each player in Indonesia’s domestic
Source: APTINDO (2006), calculated

127
CR4
75.00%
80.00%
85.00%
90.00%
95.00%
100.00%
105.00%
1997 1998 1999 2000 2001 2002 2003 2004 2005
CR4
3.1.1.4 Concentration Ratio
Concentration ratio reflects concentration of certain industry based on the cumulative market shares of n-largest firms determined in the computation. It is very often for industrial statistical report to present CR-4 (Concentration ratio for 4 major firms in the industry). Oligopoly is the market structure of wheat flour industry. The considerable control from government to gain price-stability had created oligopoly. However, deregulation has altered the market concentration of the wheat flour industry. The elimination of BULOG role as the main importer of wheat and regulation to open the import flow of flour by imposing zero tariffs resulted a major change in the market concentration.
Figure 3.3. Development of Concentration Ratio of Wheat Flour Industry from 1997 to 2005
Source: APTINDO (2006), computed by TREDA
Figure 3.3 shows the development of concentration ratio of wheat flour industry from 1997 to 2005. The concentration ratio plunged during the deregulation era 1997 to 1999. New entries have made by Pangan mas Inti Persada and Sriboga Utama Sari Raya. However, Bogasari, as the dominant player, has managed to restore its market share reflected with increased in concentration ratio above 90% in 2001. A steep declined occurred between2002 and 2003, then started to increased to the level above 90% by 2005.

128
HHI (Hirschman-Herfindahl Index)
0.00000
0.20000
0.40000
0.60000
0.80000
1.00000
1997
1998
1999
2000
2001
2002
2003
2004
2005
HHI (Hirschman-Herfindahl Index)
3.1.1.5 Hirschman-Herfindahl Index (HHI) Hirschman-Herfindahl Index (HHI) is the summation of square market share of each firm in the industry. HHI lies between zero to one and it illustrate the market structure of a particular industry. Wheat flour industry has only four firms in the industry. The higher the HHI the more concentrated the industry is (Figure 3.4).
Hirschman-Herfindahl Index shows consistent result with CR-4 and tends to fluctuate similarly. This happens as the result of no available new investment in the industry. The number of the company established in the industry is the same.
Figure 3.4. The Development of HHI in Wheat Flour Industries
Source: APTINDO (2005)
The market concentration in the industry is highly concentrated in 1997 and 1998. Dramatic drop occurred in 1999 and it raised slightly by 2001 and remaining flat for the year through 2005. It is important to highlight that market concentration during this period, as appear in Figure 3.3, shown less concentrated compare to CR4 in figures 8, this shed us a light that that four major companies practice in less competitive market. Wheat flour trade liberalization in 2002 and 2003 had lowered market concentration and co density. This proven that domestic industry is still reaching toward liberalization. Antidumping measures from the government provide strong incentive for domestic firm to restore market share. Two dominant firms, Bogasari and Berdikari, received benefit from antidumping duties imposed to imported product. HHI has shown an increasing trend between 2003 and 2005. This is merely due to the reduction of imports in the industry. 3.1.1.6 Gini Coefficient Formulated by Gini (1912), the coefficient is the ratio of the area between a Lorenz curve and the 45-degree line to the area triangle below the 45-degree line. Its formula is, Gini Coefficient (G) = 1 + 1/N – 2/(N2ā) [(a1 + 2a2 +….+ NaN)]

129
Lorent Curve for Indonesian Wheat Flour Industry in 1997
0.00%
20.00%
40.00%60.00%
80.00%
100.00%
0.00% 33.33% 66.67% 100.00%
Cumulative % of n-firm
cum
ulat
ive
% o
f m
arke
t sha
re
Lorent Curve for Wheat Flour Industry in 2002
0.00%
20.00%
40.00%
60.00%
80.00%
100.00%
0.00% 25.00% 50.00% 75.00% 100.00%
Cumulative % of n-firm
Cum
ulat
ive
% o
f mar
ket
shar
e
Lorenz Curve for Wheat Flour Industry in 2005
0%
20%
40%
60%
80%
100%
0% 25% 50% 75% 100%
Cumulative % of n-firm
Cum
ulat
ive
% o
f mar
ket
shar
e
where, a, is the amount owned by each firm in decreasing order of size; N is number of firms; and ā is the mean value. The Gini index is thus a weighted sum of shares, with the weights determined by rank order position. As noted by Maasoumi (1995), Gini does not provide for aggregation consistency or full addictive decomposability. In addition, Gini places more weight to transfers affecting the middle of a distribution than the tails. However, a function such as below corrects this latter feature;
N Gini Coefficient = [ Σ (2i – N – 1) Xi] / N2μ
i=1
where, Xi = the market share of firm I marked in ascending order; N = the number of firms in the industry; μ = mean size.
This measure tends to focus on firm inequalities, and subsequently ignores the number of firms in the industry. Gini coefficient lies between zero and one. The distribution of the market share is said to be perfectly equally distributed whenever the value of the Gini coefficient is zero. The closer the gini coefficient to one, the larger the inequalities in the industries.
Figure 3.5: Lorenz Curve of Indonesian Wheat Flour Industry in 1997, 2002, and 2005
Gini Coefficient=0.563
Gini Coefficient = 0.585 Gini Coefficient= 0.559

130
Source: computed by TREDA staff
Trade liberalization has distributed market share more evenly. The indication is shown by the value of Gini coefficient in 2002 which was 0.559 compare to 0.585 in 1997, by to 2005 Gini cefficient slightly increased to 0.63 as shown in figures 3.5. This is indicated that 4 companies are adapted to new environment by gaining back the oligopoly power as also shown in CR4 in figures 3.3. It is imperative to see that trade liberalization reduces dominant firm to set higher prices in the industry. The essence is that import pressure can alter pricing strategy of dominant firm and it will endorse for other firms to obtain market share, while trade restriction due to imposing anti dumping duty on imported goods created dominant firm to obtain more market share. 3.1.2. Market Conduct Analysis 3.1.2.1 Pricing Food security has become a great attention of the Indonesian government. Magiera (1995) explained that the government gave strong scrutiny in obtaining stable price of wheat and wheat flour. Wheat and wheat flour are the substitute of rice for food consumption diversification in the country. Magiera (1995) explained that pricing in wheat flour industry had been administered until mid 1998. BULOG maintained subsidy to obtain targeted wheat flour price in domestic market by controlling distribution. The administered price structures for wheat flour appear in Appendix 2. BULOG controlled most of the all the distribution channels of wheat flour. BULOG pay the milling cost, transportation cost, and other related fees to the three milling companies. Magiera (1995) conceived that Bogasari gained profits from the actual price paid by BULOG and the real ex-factory price of wheat flour. These happened due to lack of transparency in cost structure of milling company. Wheat flour prices were less fluctuate before the deregulation. During that period, the government provided subsidies for wheat flour. However, this mechanism has provided Bogasari with some privileges to expand its downstream industry, especially in expanding noodles industry. Bogasari is acting as dominant player in wheat flour processing industry. Based on Bogasari website, there are three major and famous brands of Bogasari are Cakra Kembar, Kunci Biru and Segitiga Biru. These three brands of flour are the basic raw materials of bread biscuits, and noodles. Bogasari also produces by product such as brand, pollard for feed, and flour for plywood glue. Indofood acts as the Core Company while Bogasari as one of the Strategic Business Units (SBUs) are a good example of vertically integrated industry. Indofood also stands along the line of the industry from packaging, raw material consistency supply, and even to the derivatives product of wheat flour. Having strong distribution channel throughout Indonesia, Bogasari becomes the strongest

131
flour supplier and integrated noodles industry under Indofood augments the power. Bogasari partnership with Small and Medium enterprises, especially small scale noodles manufacturer, amplifies Bogasari foundation to be the dominant player in the industry. The development of the industry has indicated that Bogasari seems to behave as the market leader, while other firms are market followers. Market leader would set the prices and the market follower would eventually follow. Bog sari sets up its pricing based on regional basis. The pricing strategy considers purchasing power and cost of transportation in each of the region. Since Bogasari is only one of Indoor Strategic Business Unit (SBU), trade liberalization has forced Indoor to adjust its sale and its profit maximization of the overall Subs portfolio. Liberalization policy has reduced the power of Indofood to be price setter to maximize its profit and earning.
3.1.2.2 Channel of distribution Before the deregulation/liberalization policy, BULOG controlled the distribution of wheat and wheat flour. Distributors should be listed as a member of GAPEGTI (Association of Sugar and Wheat Flour Distributor). After regulation assigning BULOG as main authority to supply wheat flour removed and followed by abolishment of its distribution function, many companies created their own distribution channel in all regions in Indonesia. However, Bogasari remain as strongest distribution channel compare to its competitors. Saratoga Rate Ray, for example, only has 11 distributors in Java while Bogasari has 22 distributors. Distributors of Bogasari have been in the business for a long time than Saratoga Rate Ray. Each firm has a particular strategy to distribute their product. Competing party of Bogasari has also formed distribution networking in Java. Sriboga Raturaya almost contested Bogasari market share in Java. Sriboga Raturaya has managed to obtain almost 16% of Java market share. It is a remarkable achievement from a new entrance. All firms have the same and identical form of integrating distribution network. There are three major model of distributing wheat flour in Indonesia (See Figure 3.6).

132
Figure 3.6. General Mode of Distribution
Source: TREDA (2006)
Figure 3.5 illustrates the general model of all firms distribution channel in Indonesia. Wheat flour first milled in the factory and distributed to distributors. Distributors will then distribute it to the local distributor. There are two ways of wheat flour distribution from the local distributor. First through direct delivery order to the retailer. This commonly applies in the urban area like Jakarta and Surabaya. Second through sub distributor, which applies in the semi-urban and rural area. Retailer should obtain wheat flour from sub distributors and the price is augmented by sub distributor due to extra margin incurred.
Trade liberalization has put enough pressure of options and entrance in this level of distribution. Imported wheat can be obtained and distributed from importer and major entrance to be become distributor has managed to create less monopoly in wheat flour distribution. 3.1.2.3 Strategy to Win the Competition Example for this is Bogasari strategy to increase its competitiveness in domestic market. Bogasari booked total sales volume of 2.33 million tonnes and 2.60 million tonnes in 2005 and 2006 respectively. Its domestic market share was 65 percent and 67 percent in 2005 and 2006. This big share as the result of innovative marketing initiatives implemented, contributed to the improvement of sales
Wheat Milling Factory
Distributor
Local Distributor
Wholesaler
Retailer
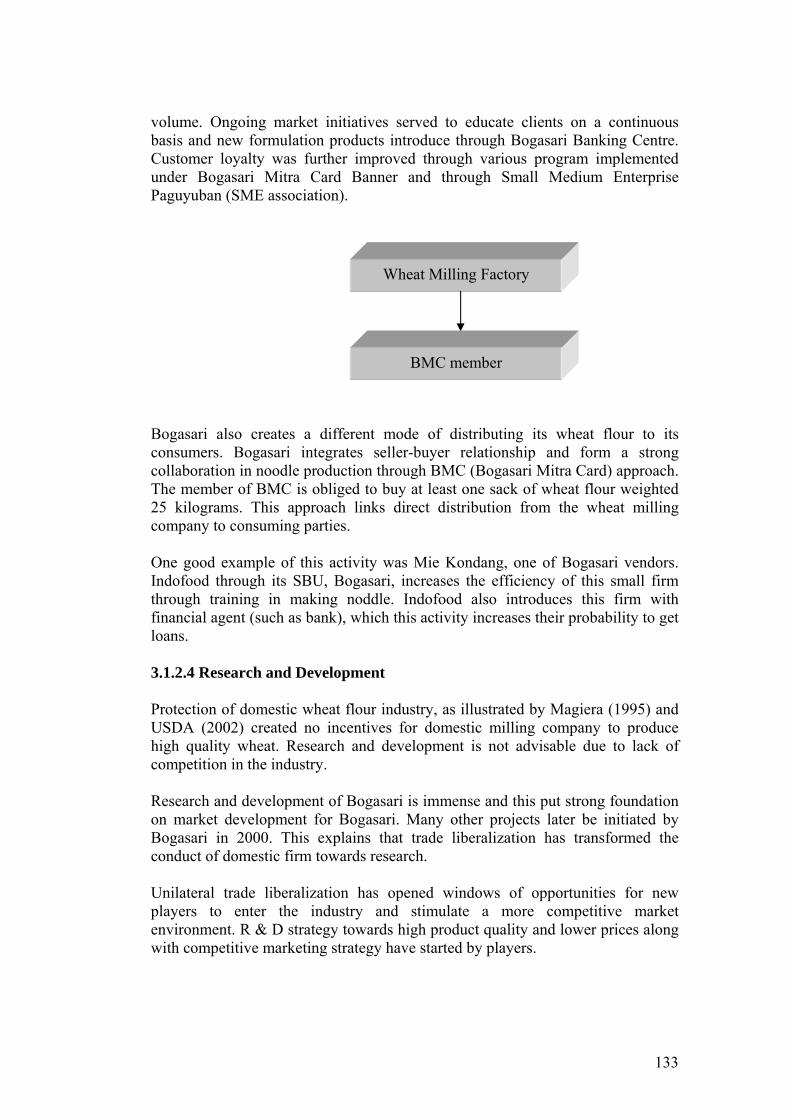
133
volume. Ongoing market initiatives served to educate clients on a continuous basis and new formulation products introduce through Bogasari Banking Centre. Customer loyalty was further improved through various program implemented under Bogasari Mitra Card Banner and through Small Medium Enterprise Paguyuban (SME association).
Bogasari also creates a different mode of distributing its wheat flour to its consumers. Bogasari integrates seller-buyer relationship and form a strong collaboration in noodle production through BMC (Bogasari Mitra Card) approach. The member of BMC is obliged to buy at least one sack of wheat flour weighted 25 kilograms. This approach links direct distribution from the wheat milling company to consuming parties. One good example of this activity was Mie Kondang, one of Bogasari vendors. Indofood through its SBU, Bogasari, increases the efficiency of this small firm through training in making noddle. Indofood also introduces this firm with financial agent (such as bank), which this activity increases their probability to get loans.
3.1.2.4 Research and Development Protection of domestic wheat flour industry, as illustrated by Magiera (1995) and USDA (2002) created no incentives for domestic milling company to produce high quality wheat. Research and development is not advisable due to lack of competition in the industry. Research and development of Bogasari is immense and this put strong foundation on market development for Bogasari. Many other projects later be initiated by Bogasari in 2000. This explains that trade liberalization has transformed the conduct of domestic firm towards research. Unilateral trade liberalization has opened windows of opportunities for new players to enter the industry and stimulate a more competitive market environment. R & D strategy towards high product quality and lower prices along with competitive marketing strategy have started by players.
Wheat Milling Factory
BMC member

134
3.1.2.5 Vertical Integration Indofoodis a dominant player in the wheat flour and wheat flour derivatives industry. Indofood, one of the Salim Group subsidiaries,. is famous for its instant noodles product and manages to develop a strong market penetration before the economic crisis. Instant noodles production started in 1968 when PT Supreme Indonesia established. Supreme used to be the major producer of instant noodle until the beginning of 1970s. Bogasari, with major share of 65% from Salim Group, the biggest milling company of wheat that produces wheat flour. The profits were used by Bogasari to foster Indofood developed its noodles market development. The acquisition of PT. Supreme and PT Summary has benefited Indofood in stepping forward as the dominant player of noodle industry. Indofood then captured almost 90% of the available market sales in the industry. Instant Noodles accounted for approximately 37% of net sales and 39% of income from operations in 1999. The Company produces a wide range of instant noodle products with prices, which covered the low-end, mid-range and high-end retail market segments in Indonesia. The Company owns three major instant noodle brand names in Indonesia, Indomie, Sarimi and Supermi, which lead household names and have existed for many years. In 1999, Indomie accounted for approximately 44% of the Company is instant noodle sales, while Sarimi and Supermi accounted for approximately 28% and 18%, respectively, of the company’s instant noodle sales (Indofood Annual Report, 2006). The acquisition of Bogasari, notably owned 65% by Salim Group, has augmented Indofood power in the wheat flour and wheat flour derivatives industry. However, Mie Sedap from Wings Group has put tremendous pressure on Indofood noodle products. Eventhough Indofood still have 75% market share in 2002, strong effort of Mie Sedap turned into major threat to Indofood product (Indofood Annual Report, 2006). Indofood manages to integrate raw material, processing, packaging, and the downstream industry all together. This vertical integration of Indofood and major trade liberalization in the wheat flour industry has created pressure to Indofood sales. Indofood will adjust its strategy to optimize its division portfolio to obtain maximizing profits (Indofood Annual Report, 2006). 3.1.3 Market Performance Analysis Deregulation in the wheat flour industry has shifted the national market structure. BULOG is no longer the sole authority in importing wheat and distributing wheat flour. However, the inheritance of monopoly structure put great deal of appalling performance of the wheat flour industry and its derivatives. Gigantic force of monopoly power on downstream industry up to the upstream industry was becoming the consequent of inefficient trade management policy to
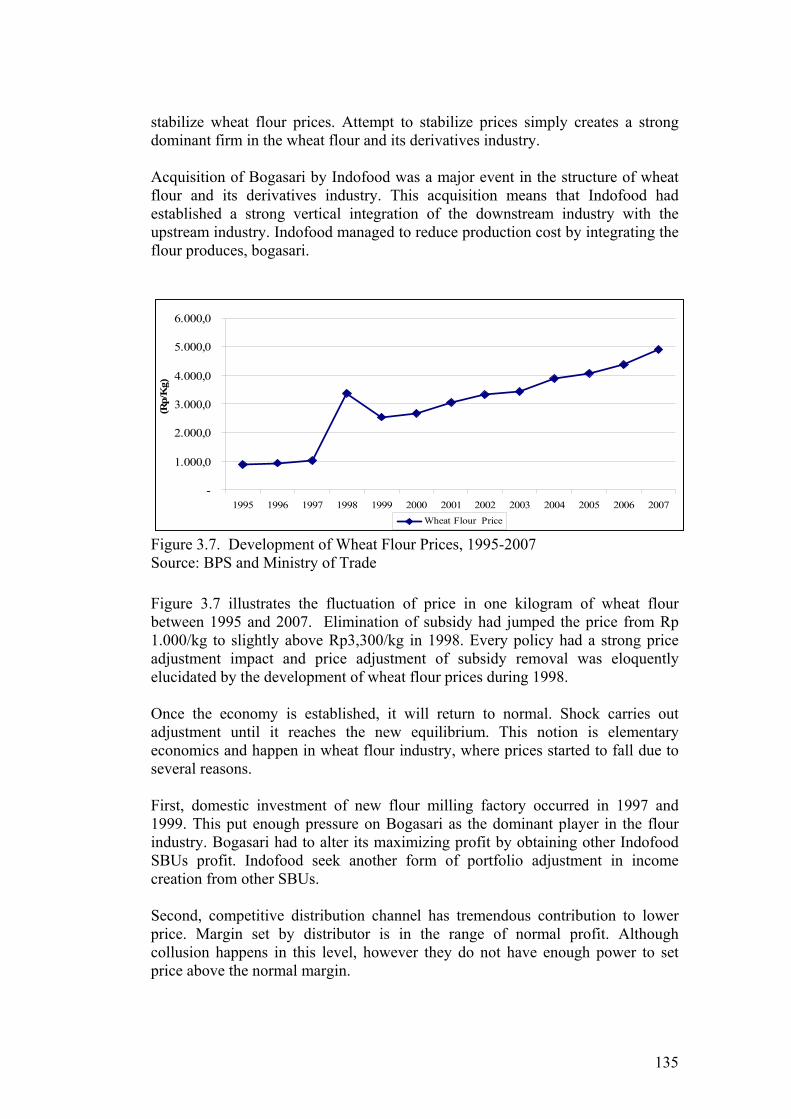
135
stabilize wheat flour prices. Attempt to stabilize prices simply creates a strong dominant firm in the wheat flour and its derivatives industry. Acquisition of Bogasari by Indofood was a major event in the structure of wheat flour and its derivatives industry. This acquisition means that Indofood had established a strong vertical integration of the downstream industry with the upstream industry. Indofood managed to reduce production cost by integrating the flour produces, bogasari.
-
1.000,0
2.000,0
3.000,0
4.000,0
5.000,0
6.000,0
1995 1996 1997 1998 1999 2000 2001 2002 2003 2004 2005 2006 2007
(Rp/
Kg)
Wheat Flour Price
Figure 3.7. Development of Wheat Flour Prices, 1995-2007 Source: BPS and Ministry of Trade Figure 3.7 illustrates the fluctuation of price in one kilogram of wheat flour between 1995 and 2007. Elimination of subsidy had jumped the price from Rp 1.000/kg to slightly above Rp3,300/kg in 1998. Every policy had a strong price adjustment impact and price adjustment of subsidy removal was eloquently elucidated by the development of wheat flour prices during 1998.
Once the economy is established, it will return to normal. Shock carries out adjustment until it reaches the new equilibrium. This notion is elementary economics and happen in wheat flour industry, where prices started to fall due to several reasons. First, domestic investment of new flour milling factory occurred in 1997 and 1999. This put enough pressure on Bogasari as the dominant player in the flour industry. Bogasari had to alter its maximizing profit by obtaining other Indofood SBUs profit. Indofood seek another form of portfolio adjustment in income creation from other SBUs. Second, competitive distribution channel has tremendous contribution to lower price. Margin set by distributor is in the range of normal profit. Although collusion happens in this level, however they do not have enough power to set price above the normal margin.

136
ROA
5.8 5.7
3.9
2.5
0.8
0
1
2
3
4
5
6
7
2001 2002 2003 2004 2005
Third, wheat flour trade was no longer administered by BULOG. Wheat flour imports were allowed to the country by specific assessment to satisfy SNI obligation. Wheat flour importer creates their own distribution channel and sometimes they being distributed it directly to the consumer. Domestic wheat flour has limited power to set price above the normal margin of wheat flour production. Price eventually turned into normal in 2001 at around slightly above Rp3,000/kg. Trade liberalization happened in 2002 by removing tariff from 5% to zero. Starting2002 up to 2007 wheat flour price tend to increase. In 2005 to 2007, wheat flour price increased slightly above Rp.4000/Kg. Imported wheat flour flooded the country. The UAE (United Arab Emirate), China, and India wheat flour were entering Indonesia and started to obtain almost 15% of the local sales. APTINDO complained to this trade liberalization policy and felt that it creates injury to domestic wheat flour industry. Bogasari market share was reducing enormously and net sales were also plunging.
Deregulation by the government to comply with the IMF recovery package crafted new phase in the wheat flour industry. Removal of BULOG authority in wheat import and distributing wheat flour alter the established distribution channel. Indofood establishes its owned wheat flour distribution channel. The other wheat milling firms have performed the same action.
Figure 3.8. ROA for Indofood Industry in Indonesia, 2001 to 2005
Source: Indofood (2006)
Figure 3.8 illustrates the return of asset of Indofood in the last five years during 2001 to 2005. Indofood ROA slightly reduced from 5.8 in 2001 to 5.7 in 2002, but showed a strong plunged between 2003 and 2005. This condition is happened because an increase in Indofood assets and decreased in revenue. Indofood assets tend to increase from 2003 after Indofood took over some small companies that unable to compete in liberalization era. Meanwhile, liberalization increase numbers of imported flour that became competitors for Indofood and decreased its revenue. Trade liberalization has forced Indofood to expand its business unit to obtain profit maximization. Wheat flour and noodles accounted for more than 32% of the et sales. Trade liberalization put Indofood to retain its profit by creating new investment to the new SBUs.

137
SOYBEANS
Boiled, Dehulled, Soaked, cooked
Soaked, Wet milled
Inoculated
Wrapped, fermented
TEMPE
+ roasted rice flour, fermented
Soaked in Salt solution
dried
evaporated
TAUCO
filtered
boiled
coagulated
Pressed, moulded
TOFU
Sugar and Flavor agent added
boiled
SOY MILK
Continously Boiled to form Protein layers
YUBA
Fermented, Soaked in Salt solution
Boiled, Extracted, filtered
Sugar and Spices added
boiled
SOY SAUCE
3.2 Empirical Evidence of Soybean Processing Industry The major source of vegetable protein in Indonesia is soybean. Although other legumes such as mungbean and peanut are also produced, they are less popular than soybean. The soybean processing industry is composed of two sectors; traditional food such tofu (soybean curd), tempe, bean sprout, tauco, soy sauce (kecap) and yuba; and processed foods development abroad such as soybean oil, soymilk and soybean cake. There are 252 factories making soy sauce in Indonesia, plus 860 making Tempe and 1,672 making tofu (Damardjati, 2001). In 2004, there are 245 factories, where 81 are soy sauce factories, 102 are tempe factories and 62 are soybeans/other factories (CBS 2004). The food balance sheet of the Central Bureau Statistics (CBS. 1996) showed that 90% of the soybean is used for human food, although many processing by-products are used as livestock feed. The large variety of foods based on soybean can be classified into two groups: fermented and non fermented. The main fermented soybean products in Indonesia are tempe, oncom, tauco and soy souce. Non fermented products include tofu, soybean sprouts, soybean milk, fried beans (eaten as a snack), beans boiled in the pod (also a snack), and beans cooked as a vegetable or as an ingredient for soup. Major soybean products and how they are processed and fermented are illustrated in Figure 3.9
Figure 3.9 Processing of Major Soybean Products in Indonesia

138
Improvement of the soybean processing industry requires an improved knowledge of the raw materials, as well as better processing technique, the development of new products, and marketing management. The production system particularly needs better quality control, hygienic practices and handling of wastes.
3.2.1. Market Structure Analysis
Concentration Ratio reflects concentration of certain industry based on the cumulative market shares of n-largest firms determined in the computation. It is very often for industry statistical report to present CR-4 (Concentration ratio for 4-firms in industry). The time series data was limited to 1995 to 2005 , at time of this writing no data available of 2006 and 2007.
Figure 3.10 Development of Concentration Ratio of Soysouce Industry from 1995 to 2005
Figure 3.10 shows the market share development on soy sauce industry in Indonesia between 1995 and 2005 period (The biggest four player of soy sauce are PT. Heinz ABC Indonesia, PT. Anugrah Setia Lestari, PT. Anugrah Lever and PT. Indosentra Pelangi). CR 2 in soy sauce industry indicated a very strong indication of monopoly as it is shown in figures above CR2 concentration ration reached 60 percent by 2005, this phenomenon also happened in CR3 where in 1995 concentration ratio was 48 percent and by 2005 concentration ration was 80 percent. This by definition was duopoly. If we look CR4 and CR3 in 1997 to 2000 both had concentration ratio similar which was around 86 percent. Based on concentration ratio analysis in figure 15 it can be seen only two companies became major player in soy sauce industries. This shown in CR2 where this two company performed high increase in market concentration from 40 percent in 1995 to 78 percent in 2005. This shown in soy sauce industry that only two company which is PT. Heinz ABC Indonesia and PT.Anugrah Setia Lestari act as dominant players. The four biggest player of soy sauce are PT. Heinz ABC Indonesia, PT. Anugrah Setia Lestari, PT. Anugrah Lever and PT. Indosentra Pelangi with its branded
0,00
10,00
20,00
30,00
40,00
50,00
60,00
70,00
80,00
90,00
100,00
1995 1996 1997 1998 1999 2000 2001 2002 2003 2004 2005
(%)
Year
Concentration Ratio of Soysauce
CR2 CR3 CR4

139
product of ABC, Bango and Indofood respectively. The products different from their taste and packaging. The taste consists of sweet, middle sweet and salting, while the package consists of bottle and plastics pack.
3.2.2. Market Conduct Analysis
PT Heinz ABC Indonesia is a joint venture company that merged ABC’s great brands with HJ Heinz Companies in 1999. Products under ABC brands have been market leaders in Indonesia for soy sauce, tomato ketchup, chili sauce, syrup, sardines, etc. PT. Heinz ABC has also expanded its market through strategic acquisition of top-ranked frozen snacks in the US and international favorites such as honig dried soups in the Netherland and ABC soy sauces in Indonesia (The world’s second-largest soy sauce brand). 3.2.3. Market Performance Analysis
Figure 3.11 illustrates the return of asset of Soy sauce in the last eight years during 1995 to 2005. Soy sauce return on assets (ROA) really showed gradual decreased during 1995 to 2005 from 6.9 in 1995 to 1.8 in 2005. Trade liberalization had forced Soy sauce industry to expand its business unit and obtain maximum profit. Soybean and Soy sauce is accounted for more than 37% of the net sales with the highest net sale of 38.8%. Trade liberalization put soybean industries to retain its profit to create new investment to the development their industries. After trade liberalization ROA of soy sauce industry tend to decline, it showed that market in soy sauce industry is more competitive after trade liberalization.
Figure 3.11 ROA for soy sauce Industry in Indonesia, 1995 to 2005 The development of export and import of Indonesia’s soy sauce industries in international market between 1995 and 2005 period tend to increase (see table 3.1). Export share of soy sauce to total export food processing in the same period tend to decrease from 5,03% to 1,98%. The decreasing in export share duo to trade liberalization in soy sauce industry. Average share of export soy sauce to total export Indonesia’s food processing to the world is decreasing, in (1999 to 2002) was 2.60% to 2.39% in (2003 to 2005). In import wise 1995 to 2005
6,96,3 6,0 5,9 5,7
3,62,9
1,8
0
1
2
3
4
5
6
7
8
1995 1998 2000 2001 2002 2003 2004 2005year
ROA

140
import share soy sauce product to total import Indonesia’s food processing tend to increase from 1.13% in 1995 to 1.97 in 2005.
Table 3.1 Export and Import of Soy sauce Processing Product, 1995 to 2005 Export of Share Total Export Import of Share Total Import
Soy Sauce (%) Food Processing Soy Sauce (%) Food Processing1995 1,283.44 5.03 25,534.62 537.66 1.13 47,712.02 1996 2,065.48 1.82 113,452.69 2,065.48 1.82 113,452.69 1997 1,383.32 1.52 90,853.72 1,197.950 0.99 120,612.32 1998 1,027.73 0.80 127,771.96 330.41 0.26 127,771.96 1999 2,071.13 1.78 116,465.68 879.52 1.92 45,834.52 2000 3,210.25 2.60 123,421.62 1,215.90 1.26 96,249.14 2001 3,343.90 2.64 126,640.62 1,287.01 2.05 62,868.90 2002 4,121.93 3.39 121,489.15 1,945.88 3.05 63,868.69 2003 4,355.89 3.17 137,283.80 1,577.66 2.34 67,341.01 2004 1,836.18 2.02 91,030.61 2,020.02 2.22 91,030.61 2005 2,462.37 1.98 124,364.83 2,452.34 1.97 124,264.83
Average1995-1998 1,265.67 2.16 110,692.79 1,032.88 1.01 102,387.25 1999-2002 3,186.80 2.60 122,004.27 1,332.08 1.98 67,205.32 2003-2005 2,884,81 2.39 117,559.75 2,016.67 2.14 94,212.15
Year
Sources: CBS (Processed)
3.3. Empirical Evidence of Fish Processing Industry
3.3.1. Market Structure Analysis
Figure 3.12. Development of Concentration Ratio of Fish Processing Industry from 1995 to 2005
Source : Central Bureau Statistic (CBS) (Calculated)
Concentration ratio in fish product relatively stable between 1995 and 2004, except between mid 1996 and mid 1998, which show significant increase.
Concentration Ratio in Fish Product
- 10.00 20.00 30.00 40.00 50.00 60.00 70.00 80.00 90.00
1995 1996 1997 1998 1999 2000 2001 2002 2003 2004 2005 Year
Percent
Cr 2Cr 3Cr 4

141
Concentration ratio in this industry show relatively low value compare with other industry, which CR 2, CR 3 and CR 4 value are 39.97, 49.37 and 56.93 percent. Highly concentration of these industries are only occurred during the monetary crisis in 1998, because many Indonesian industry collapse during that period.
3.3.2. Market Performance Analysis Output for Indonesian SME based on fish and meat product tend to increase sharply between 1995 and 2004. The increased performed a similar pattern in market share only in 1997 to 1998. Indonesian industry export was decreased in 2003-2004, because decreased in output of fish and meat product.
SME Output for Fish dan Meat Product
0
500 000 000
1 000 000 000
1 500 000 000
2 000 000 000
2 500 000 000
3 000 000 000
3 500 000 000
1995 1996 1998 1999 2001 2002 2003 2004
Year
Rp
000
Figure 3.13 Development of Output in Fish and Meat Industries, 1995 to 2004
Source : Calculated from Central Bureau Statistic (CBS)
3.3.3. Market Conduct Analysis
SME Capital for Fish and Meat Product
0 10 000 20 000 30 000 40 000 50 000 60 000 70 000
1995 1996 1998 1999 2001 2002 2003 2004
Year
Rp
000
Figure 3.14 Development of Capital in Fish and Meat Industries, 1995 to 2004
Source : Calculated from Central Bureau Statistic (CBS)
SME capital for these industry tend to decreased from 1995 to 2004, from Rp 60 million to around Rp 40 million. Its tend to decrease from 1995 to 2001, but slightly increase in 2001 to 2004.

142
3.3.4. Export-Import
Table 3.2 Export-Import in Fish Product, 1995-2005
Export Import
Year Quantity (Ton)
Value (US $
Million)
Quantity (Ton)
Value (US $
Million) 1995 3.97 19.12 0.20 0.36 1996 37.00 100.90 37.00 100.90 1997 26.40 81.15 NA NA 1998 44.63 121.89 44.63 121.89 1999 42.60 99.71 0.68 1.31 2000 51.63 107.63 1.61 1.91 2001 44.01 106.81 1.06 1.53 2002 44.22 99.06 1.60 1.75 2003 53.28 114.09 2.42 2.97 2004 3.29 3.98 3.29 3.98 2005 5.87 6.47 5.87 6.47
Source : Calculated from Central Bureau Statistic (CBS)
Indonesia’s export for processing fish product increased between 1995 and 2003, but decreased in 2004 and 2005. Reasons of decreased are related to the tight conditions on food safety regulations in destination countries. On the other hand, Indonesian import very fluctuated between 1995 and 2005, where highest import quantity and value was in 1998. 3.4. Empirical Evidence of Beverage Processing Industry 3.4.1. Market Structure Analysis Concentration ratio between 1995 and 2005 for beverage industries showed slightly decreased, except for 2000 till 2002 showed an increasing trend . In 1995 concentration ratio for biggest 2, 3, and 4 firm were 19.39, 27.56, and 35.07, where in 2005 became 17.23, 24.54, and 28.95 percent. On average, concentration ratio for CR 2, CR 3 and CR 4 was 22.20, 29.59 and 35.52 percent.

143
Figure 3.15 Development of Concentration Ratio in Beverage Industry, 1995 to 2004
Source : Calculated from Central Bureau Statistic (CBS)
3.4.2. Market Conduct Analysis
Outputs for SME Beverage product tend to increase between 1995 and 2002, but after 2002 it was declined. This condition related with reduction in concentration ratio and increased import for beverage product. This condition showed that beverage import tend to increased after 2002, where Indonesia reduce its tariff significantly (from19.58 percent in 1995 to 4.38 percent in 2005)
Small Enterprise Output for Beverage Product
0 50 000 000
100 000 000 150 000 000 200 000 000 250 000 000 300 000 000 350 000 000 400 000 000 450 000 000
1995 1996 1998 1999 2001 2002 2003 2004
Year
Rp
000
Figure 3.16 Development of Output Beverage Industry in Small Medium Enterprise, 1995 to 2004 Source: Calculated from Central Bureau Statistic (CBS)
3.4.3. Market Performance Analysis
Capital that belongs to SME industry tend to fluctuate between 1995 and 2002, but tend to decrease sharply from 2002-2004. Capital decreased between 2002 and 2004 happened subjects to high competition with large industry and import product that increase sharply.
Concnetration Ratio in Baverage Product
- 5.00
10.00 15.00 20.00 25.00 30.00 35.00 40.00 45.00 50.00
1995 1996 1997 1998 1999 2000 2001 2002 2003 2004 2005 Year
Percent
Cr 2
Cr 3
Cr 4

144
SME Capital in Baverage Product
0
5 000
10 000
15 000
20 000
25 000
1995 1996 1998 1999 2001 2002 2003 2004
Year
Rp
000
Figure 3.17 Development of Capital Beverage Industry in Small Medium
Enterprise, 1995 to 2004 Source : Calculated from Central Bureau Statistic (CBS)
3.4.4. Export-Import
Indonesia’s export for beverage products increased, where export value in 1995 US $ 5 million to 26.64 million in 2005. Indonesia’s export quantity also shows increasing trend, where its quantity in 1995 to 2005 was 21.10 ton to 54.95 ton. Similar situation happen in Indonesia beverage imports, where shows lightly increase in imports value and quantity. Indonesia import value in 1995 to 2005 was US $ 15.58 million to US $ 26.64 million, where its quantity was 27.79 ton to 54.94 ton. Table 3.3 Export and Import in Beverage Product, 1995 to 2005
Source : Calculated from Central Bureau Statistic (CBS)
Export Import Year Quantity
(Ton) Value
(US $ Million) Quantity
(Ton) Value
(US $ Million)
1995 21.10 5.00 27.79 15.58 1996 50.15 6.87 50.15 6.87 1997 58.79 5.50 NA NA 1998 10.08 3.24 10.08 3.24 1999 38.37 11.65 23.02 10.84 2000 43.30 10.98 30.97 15.13 2001 43.31 12.74 29.16 12.48 2002 114.55 10.90 26.80 10.64 2003 40.42 9.12 31.17 11.94 2004 55.40 23.36 55.40 23.36 2005 54.94 26.64 54.94 26.64

145
3.5. Empirical Evidence of Palm Oil Industry Indonesia is the second larges producer palm oil in international market after Malaysia and export export Palm Oil to international market. CPO and its derivative products has produced in Indonesia. After Bulog intervention lifted up in1990, CPO export from Indonesia tend to increase. Bulog, National Logistic Agency, was the only authorized exporter on palm oil industry before 1990.
Figure 3.18 Geographic Information System (GIS)-Based Mapping of Palm Oil
Industry In Northern Sumatra
The GIS map shown places to marketing and central industries of palm oil. This map is important to determine market oriented strategy. Market oriented strategy means that a company locate its factory in the nearest place to the market. Sumatra is the highest region to produce palm oil in Indonesia and Java as the potential customer region. Java waste biggest region producing palm cooking oil in 2005. It was the reason why of palm cooking oil mostly found in Java. Java’s share of production 51.40%; Sumatra 47.50% and West Kalimantan 1.10%.
Figure 3.19. Percentage of Production Palm Cooking Oil by Region, 2006 3.5.1 Palm Oil-Based Industries in Indonesia
The palm oil industry is consider as an important sector to the Indonesian economy. It is one of the country's major export earners and a vital source of food for the country’s population, and provide more employment. Palm oil based industries and Crude and Cooking Oil is more labors incentive compared with the
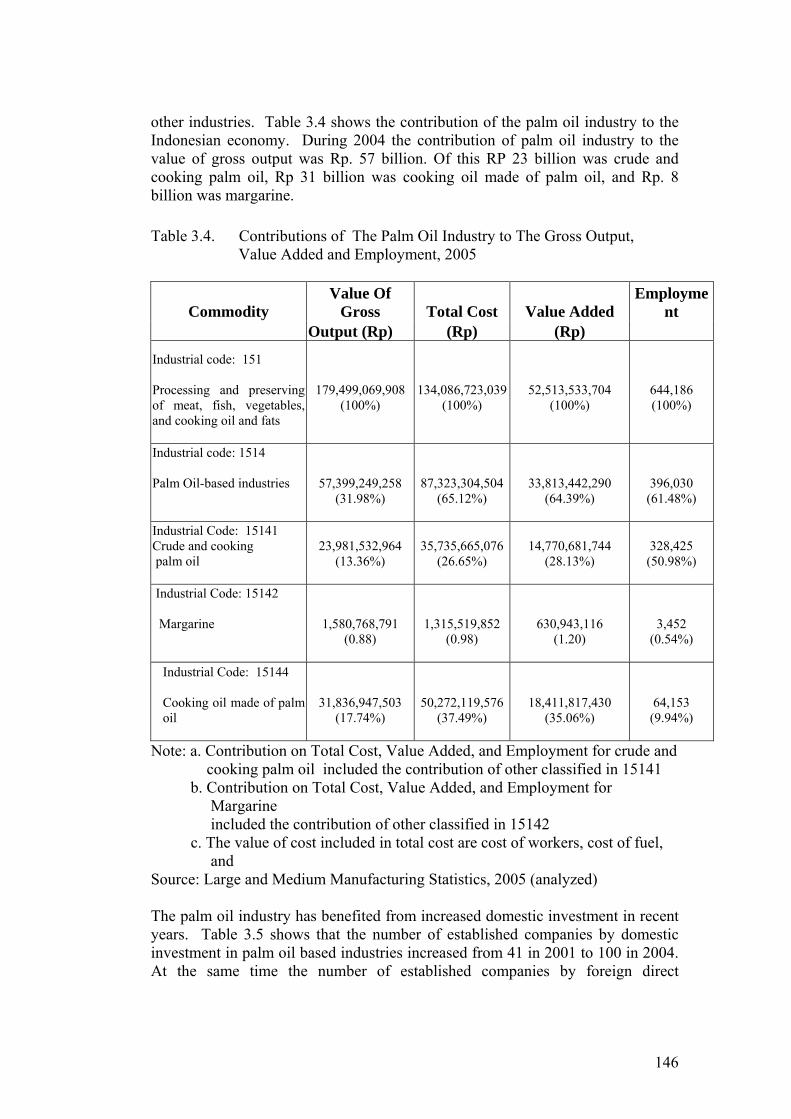
146
other industries. Table 3.4 shows the contribution of the palm oil industry to the Indonesian economy. During 2004 the contribution of palm oil industry to the value of gross output was Rp. 57 billion. Of this RP 23 billion was crude and cooking palm oil, Rp 31 billion was cooking oil made of palm oil, and Rp. 8 billion was margarine. Table 3.4. Contributions of The Palm Oil Industry to The Gross Output, Value Added and Employment, 2005
Commodity Value Of
Gross Total Cost Value Added Employme
nt Output (Rp) (Rp) (Rp)
Industrial code: 151 Processing and preserving of meat, fish, vegetables, and cooking oil and fats
179,499,069,908 (100%)
134,086,723,039(100%)
52,513,533,704 (100%)
644,186 (100%)
Industrial code: 1514 Palm Oil-based industries
57,399,249,258 (31.98%)
87,323,304,504 (65.12%)
33,813,442,290 (64.39%)
396,030 (61.48%)
Industrial Code: 15141 Crude and cooking palm oil
23,981,532,964 (13.36%)
35,735,665,076 (26.65%)
14,770,681,744 (28.13%)
328,425 (50.98%)
Industrial Code: 15142 Margarine
1,580,768,791 (0.88)
1,315,519,852 (0.98)
630,943,116 (1.20)
3,452 (0.54%)
Industrial Code: 15144 Cooking oil made of palm oil
31,836,947,503 (17.74%)
50,272,119,576 (37.49%)
18,411,817,430 (35.06%)
64,153 (9.94%)
Note: a. Contribution on Total Cost, Value Added, and Employment for crude and cooking palm oil included the contribution of other classified in 15141 b. Contribution on Total Cost, Value Added, and Employment for Margarine included the contribution of other classified in 15142 c. The value of cost included in total cost are cost of workers, cost of fuel, and Source: Large and Medium Manufacturing Statistics, 2005 (analyzed) The palm oil industry has benefited from increased domestic investment in recent years. Table 3.5 shows that the number of established companies by domestic investment in palm oil based industries increased from 41 in 2001 to 100 in 2004. At the same time the number of established companies by foreign direct

147
investment in palm oil based industries declined from 98 in 2001 to 23 FDI in 2004. Table 3.5 Contributions of the Palm Oil Industry to Investment, 2001-2004 Number of established companies Source: Large and Medium Manufacturing Statistics, 2004 (analyzed)
Table 3.6, show that most of the investors preferred to invest in into the processing of CPO for cooking oil production rather than on oleo-chemical production. The major reasons for the slower growth of palm oil-based industries particularly becaused investing in oleo-chemical plant require huge amount of capital in the past.
Commodity Domestic Investment Change (%)
Foreign Direct Investment (FDI) Change (%)
2001 2004 2001 2004
Industrial code: 151 Palm Oil-based industries
41
100 +59
100
23
-77
Of which: Industrial code: 1514 Crude and cooking Palm oil
na
na
na
na
na
na
Industrial Code: 15142 Margarine
0
2
+2
2
0
-2
Industrial Code: 15144 Cooking oil made of palm oil
41
98 +57
98
23
-75

148
Table 3.6. Domestic Use of CPO-Based Industry Sector, (‘000 tones), 1993-2005
Sources: MPOB, 2005 (processed)
3.5.2 Development Export Palm Oil by Mayor Exporter Indonesia The players of palm oil industry in Indonesia are PT. KPN/Wilmar, PT. Musim Mas, PT. PHS, PT. SMART, PT Group AAA, PTP, PT. Usaha Inti PI, BEST, Duta Palma, SOG and Others. PT.KPN/Wilmar, PT. Musim Mas, PT PHS, and PT SMART has big contribution in palm oil industry in Indonesia. In 2004 to 2005, the big players in palm oil industry are KPN/Wilmar, Musim Mas, SMART and AAA Group. Their market share totally reached more than 65 percent. In the Oleochemical industry, the big players are Misim Mas, Musim Mas, Ecogreen and Cisadane. This description shows that palm oil industry integrate the derivatives. Major groups are typically vertically integrated, owning primary production processing and distribution facilities. The players of Oleochemical industry as one of derivative of CPO product in Indonesia are Misim mas, Musim mas, Ecogreen, SOC, Cisadane, Sumiasih, and Flora Sawita. Misim mas, Musim mas and ecogreen is the big players in their industries.
8.64389448012.554741705.062007284.0016406978.393055513Average
3.4755467979.625337957.123948306.5136099176.7542571812005
3.98536090610.275504937.123814796.3834217176.2340867632004
12.08515575110.715521847.153685786.2932433375.8539106562003
5.84460010914.076472253.551631762.8413083279.5436588762002
5.78434628013.275768883.681601462.8712460280.1834846442001
4.89410874512.515141953.831571742.8911866880.7733187082000
-1.24391735111.704583153.941542583.6814410580.6831606731999
11.60396643210.304085083.851528592.9111536082.9432897051998
14.86355402812.254354794.171483273.0810936080.5028608621997
17.57309413015.024648694.671445493.3010200077.0123827121996
9.29263162814.573834405.351406863.559344076.5320140621995
24.25240804016.984089985.171244333.588624074.2717883691994
-193804911.862298176.141189704.178080077.8315084621993
Growth (%)(%)Industry(%)Industry(%)Industry(%)Industry
Total AnnualTotalShareOleochemicalShareSoap ShareMargarineShareCooking OilYear

149
Misim Mas 20%
Musim Mas 19%
Ecogreen 16%
Cisadane 13%
Sumi Asih 12%
SOCI 9%
Flora Sawita 6%
Others 5% KPN22%
Musim Mas15%
PHS8%SOG
6%AAA5%
Sungai Budi3%
Others30%
BEST4%
SMART5%
BKP2%
Consentration Ratio
76
77
78
79
80
81
82
83
2004 2005 2006
Year
(%)
CR4
Figure 3.20. Player of Oleochemia Industry in Indonesia and Share Capacity Refinery in Indonesia, 2006
Sources: Apolin, 2007 3.5.3. Market Structure
3.5.3.1 Concentration Ratio
Concentration Ratio reflects concentration of certain industry based on the cumulative market shares of n-largest firms determined in the computation. It is very often for industry statistical report to present CR-4 (Concentration ratio for 4-firms in industry). Oligopoly is the main feature of Palm Oil industry. The palm oil industry has gradual increase of concentration Ratio until 2006 period. It is shown the market distribution of the industry.
Figure 3.21. Development of Concentration Ratio of Palm Oil Industry from
2004 to 2006

150
HHI
2300
2400
2500
2600
2700
2800
2900
3000
2004 2005 2006Year HHI
3.5.3.2 Hirschman-Herfindahl Index (HHI) Hirschman-Herfindahl Index (HHI) is the summation of square market share of each firm in the industry. The HHI is a measure of dispersion. It takes into account the number and shares of all the firms producing for the market. The higher the value index, the less likely the industry will exhibit competitive behavior and become more in equal in firms sizes. As suggested by Hirschman (1964), the HHI can determine market structure by dividing them into three categories, which are concentrated (HHI less than 1000), moderately concentrated (1000 < HHI < 1800) and highly concentrated (HHI more than 1800).
Figure 3.22. Development of Hirschman-Herfindahl Index (HHI) of Palm Oil
Industry from 2004 to 2006
HHI index shows consistent result with CR-4 and tends to fluctuate no similarly and decrease in 2006. This happens as the result of available new industry in the palm oil industry in 2006. The number of the company established in the industry is different the number. Figure 3.22 shows HHI index from palm oil industry illustrate that in the palm oil industry more concentrated. It was showed in the higher HHI index more than 1800.
3.5.3.3 Gini Coefficient
Base on Gini Coefficient index shown the palm oil industry more concentrated with Gini coefficient index in 2004 is 0.627; 0,591 in 2005 and 0.623 in 2006. Base on Gini Coefficient for palm oil processing industry shown relative more concentration palm oil industry until 2006.

151
0%
10%
20%
30%
40%
50%
60%
70%
80%
90%
100%
O
PTP
DU
TA P
ALM
A
SOG
BEST AAA
SMAR
T
Oth
ers
MU
SIM
MAS
KPN
/Wilm
ar
Concentration Ratio
Gini Coefficient = 0,627
0%10%20%30%40%50%
60%70%80%90%
100%
O
PTP
SOG
BEST
DU
TA P
ALM
A
SMAR
T
AAA
Oth
ers
MU
SIM
MAS
KPN
/Wilm
ar
Concentration Ratio
Gini Coefficient 0,591
0%10%20%30%40%50%60%70%80%90%
100%
O
DU
TA P
ALM
A
PTP
SOG
USA
HA
INTI
PI
BEST
SMAR
T
Oth
ers
AAA
SMAR
T
MU
SIM
MAS
KPN
/Wilm
ar
Concentration Ratio
Gini Coefficient = 0,623
Gini Coefficient, 2004 Gini Coefficient 2005
Gini Coefficient 2005
Figure 3.23. Gini Coefficient of Indonesian Palm oil Industry in 2004 to 2006 3.5.4 Market Conduct Analysis 3.5.4.1 Merger of Industry Market behaviour in palm oil industry dominated by PT. SMART, PT. Wilmar, PT. Musim Mas. They are the dominate firms in palm oil industry in Indonesia. Impact of liberalization of those major companies is occurred vertical integration and corporation between industry and differentiation product. In 2005, PT SMART has expand and differentiate their cooking oil products. Their products are Filma, Kunci Mas and Filma Margarine product. Major groups are typically vertical integration, owning primary production, processing and distribution facilities Vertical integration happens between palm oil industry and cooking oil. The market dominated by PT. Wilmas through domination in palm oil and cooking oil production. Based on analysis result of CR4, HHI and Gini

152
coefficient consistent with current palm oil industry and cooking oil in Indonesia. Impact of trade liberalization make the industry corporation and changes of market structure more oligopoly and monopoly. This implication that government as policy maker has seen all structure industry in Indonesia when the policy making implementation.
Table 3.7. Name of Companies and Product Differentiation in Cooking oil Industries No Name of Companies Products 1 Intiboga Sejahtera PT Bimoli, Bimoli Special, Delima, Sunrise 2 SMART Tbk PT Filma and Kunci Mas 3 Bina Karya Prima PT Tropical 4 Pasifik Indomas PT Cap Sendok 5 Multimas Nabati Asahan PT Sania 6 Bonanza Megah PT Delfico, Jamhan, Vitaco & Princess 7 Hasil Kesatuan PT Vetco, Vetcomas, Jempol, Ratu Masak 8 Barco PT Barco 8 Sinar Alam Permai PT Fortune 9 Asia Nagro Agung Jaya PT Camar, Marunda, Palmolin & Harumas
10 Others -
3.5.4.2 Distribution Channel
The cooking oil distribution for consumer in regional level starts from central production from (factory or producer). The factory distribute it to inter insular trader and local distributors. The distributor share it to wholesaler and sub distributor. The last chain are trader and retailer. The mark up price occurred between trader and inter insular trader (pedagang antara ulau) in cooking oil as the result of cost transportation factor. While the cooking oil has become from factory, the price was guaranteed by factory. And it was came from inter insular trader (pedagang antara pulau) the price was guaranteed by their trader with the increase price margin before caused by transportation and margin cost (see figure 3.24). The Major groups are typically vertical integration about distribution and promotion product.

153
Pedagang AntarPulau/Small Distributor
Cooking Oil Factory
WholesalerLocal distribution
Sub-Distributor
Retailer
Pedagang AntarPulau/Small Distributor
Cooking Oil Factory
WholesalerLocal distribution
Sub-Distributor
Retailer
0
200
400
600
800
1000
1200
May
-198
3
Jul-8
4
Sep
-85
Nov
-198
6
Jan-
88
Mar
-89
May
-199
0
Jul-9
1
Sep
-92
Nov
-199
3
Jan-
95
Mar
-96
May
-199
7
Jul-9
8
Sep
-99
Nov
-200
0
Jan-
02
Mar
-03
May
-200
4
Jul-0
5
Sep
-06
Month
Tonn
e/ye
ar
Palm Oil
Figure 3.24 General Mode of Domestic Distribution Cooking Oil 3.5.5. Market Performance Analysis
Palm Oil
The palm oil produced since 1983:5 to 2006:6 increase. It is relevant with development on utilization in palm oil product for food and non food, i.e. oleochemia and Biodiesel. Palm oil production in 1983 to 1995 is relative stagnant. In middle 1997 production palm oil shows an increase. Since 2000 to 2006 production Palm Oil in Indonesia significantly increase (see figure 3.25). As a raw material for derivative product such as cooking oil, The availability their product most important, since its being used as raw materials for derivative product such as cooking oil,
Figure 3.25 Development of Production Palm Oil in Indonesia, Period 1983:5 – 2006:9

154
Palm oil is one of product that has to export value and growth the bigger in 2003 and 2004. Its growth of export reached 18,5%. Moreover, the development CPO and cooking oil production in Indonesia tend to increase. Production of CPO has strongly related with development cooking oil and other industry that use them (see Figure 3.26). Indonesia’s cooking oil production conducted by big cooking oil firms. Meanwhile some small industries also produce palm oil and cooking oil. Such big firms are: SMART, Wilmar and Musim Mas.
Figure 3.26. Development of Production CPO and Cooking Oil Indonesia, 1998 to 2005 The production increase of palm oil increasing related with need to industry that use palm oil as raw material, likely for cooking oil. It proven that cooking oil industry involve small medium enterprises industry, industry and household. The data of consumption per capita has shown development tend to consume cooking oil tend to increase. The consumption Indonesia peoples in 1998-2005 periods account to 10 to 16.50 Kg
Figure 3.27 Development of Consumption per Capita Cooking Oil Indonesia
(Kg), 1998 to 2005
Development Palm Oil and Cooking Oil in Indonesian Market
The development of production and consumption in palm cooking oil and coconut cooking oil were significant until 1998 to 2005 periods. The consumption palm cooking oil tends to increase from 4.53 million tones to 5.06 million tones. The palm cooking oil consumption more than coconut cooking oil consumption because of it has low fat. And at the time, palm cooking oil able to penetration in

155
0.0
1,000.0
2,000.0
3,000.0
4,000.0
5,000.0
1995 1996 1997 1998 1999 2000 2001 2002 2003 2004 2005 2006
Rp/
Kg
0.00
1000.00
2000.00
3000.00
4000.00
5000.00
6000.00
Year
Rp/
Kg
PMG PCPO
world market to changes world animal oils/fat. Consumption palm cooking oil was increased favorable to industry to produce more. Mean while the supply palm oil as row material increase also. Both palm cooking oil and coconut cooking oil was used by home industry, household and others industries to producer some food or as row material to another products. Production consumption Figure 3.28 Development of Production and Consumption Palm Cooking
Oil and Coconut Cooking Oil, 1998-2005 (million tones)
Figure 4.21 shows that The domestic cooking oil price has a similar trend with the domestic CPO price. Based on result co integration test of the residual shows integrated in zero (I (0)). It means that the Cooking Oil and CPO Domestic Prices have integration in the long term. The implication, the CPO Domestic price was increased will be transmitted to increase in Cooking Oil price as well.
Figure 3.29. Development of Cooking oil and CPO Domestic Price
As shown in Figure 4.22 the cooking oil price has a similar trend with the world CPO price. Palm Oil world price and Cooking Oil price were influenced indirectly. Co integration test shows residual integrated in level 1 or I (1). The implication, the Palm Oil world price changes can not transmitt to cooking oil directly, nevertheless its transmitt through palm oil domestic price.

156
0.00
1000.00
2000.00
3000.00
4000.00
5000.00
6000.00
1995 1996 1997 1998 1999 2000 2001 2002 2003 2004 2005 2006Year
Rp/
Kg
-
100.0
200.0
300.0
400.0
500.0
600.0
700.0
800.0
US$
/Ton
ne
PMG PCPOD
Figure 3.30 Development of Cooking Oil and CPO World Price
3.6. Feedback Relationship of Market S-C-P This research will highlight the relationship between market structure, conduct, and performance of wheat flour industry. It is important to observe the emerging notion of trade liberalization to market structure, conduct, and performance of the industry. Trade liberalization is merely the elimination of trade barrier in the economy of a specific region. In the case of industry, trade liberalization is an induction of foreign competitor entrance into the market. Domestic companies only enjoy competition among their own without any competition of foreign companies before trade liberalization occurs. Trade liberalization will surely alter the structure, behavior of domestic player, and performance of domestic player theoretically. Deregulation and trade liberalization were the two sharp blades of Indonesia’s wheat flour industrial policy. We cannot really estimate the impact of trade liberalization without scrutinizing deregulation in 1998. Deregulation has major shift in distribution channel, vertical integration behavior, and competition in domestic industry. It is sometimes difficult to obtain best judgment on the impact of trade liberalization alone since the recovery package of the IMF put these two policies in one basket. Trade liberalization occurred in 2002 beginning with the reduction of tariff in wheat flour import from 5% to 0. Wheat flour import increased during the period. Major complaints from APTINDO indicates that domestic player felt that it has strong impact on domestic player’ sales. The easiest method to acquire the relationship of two variables is by computing the correlation of those variables. The correlation values will lie between 0 and 1. The closer the correlation value to 1 the stronger the correlation is. The negative and the positive mark reflect the direction of the two variables relationship. Positive value means that the two variables are moving the same direction. The

157
correlation value of variable A and B is positive means that Variable A increases and variable B will also increase. We can see the relationship of HHI (Hirschman-Herfindahl Index), Import penetration, and Price by computing the correlation of these variables. Import Penetration and Hirschman Herfindahl Index (HHI) Hirschman-Herfindahl Index (HHI) indicates the market concentration of a particular industry. Import penetration is the market share of import in domestic sales. Based on the computation, we can obtain that the correlation value is – 0.939. This means that HHI and IP have strong and opposite relationship. We can translate that an increase in HHI is accompanied by an increase in IP vice versa. There is no information of causation between the two variables. The result implicates that trade liberalization has strong impact to alter domestic market structure. The increase in import penetration will be accompanied by the decrease in Hirschman Herfindahl Index. We can derive a simple notion that competition of foreign supplier in the domestic market will create domestic industry more competitive. The test result of import penetration and HHI shown correlation -0.939. demonstrates the relationship of the two variables. The regression line shows the negative relationship of import penetration and HHI by drawing downward straight line. Based on the observation during 1997 to 2005, deregulation had strongly reduced the market concentration and created the industry more competitive. However, trade liberalization over the removal of BULOG as the only importer of wheat and wheat flour had totally incorporated more competitive market. The reduction of Bogasari market share and an evenly distributed market share to Panganmas and Sriboga created the market structure to be less concentrated. The value of import penetration and prices correlation is 0.379. It means that Import penetration and prices have positive and weak correlation value. The reason for the weak correlation is that import penetration does not put strong pressure on pricing system of dominant firm, but it alters distributor pricing. Increasing price was still happening during the reduction of tariff. Import penetration created dominant firm to adjust its pricing by not applying high margin above the normal profit. This price setting by dominant firm is not usually followed by distributors. Importers design and build their own distributors and it makes distributor to adjust smaller margin. Consequently, it will create lower price than it is without trade liberalization. Price and HHI show negative and moderate relationship. The value of correlation between price and HHI is – 0.514. Price has a negative relationship since the reduction in market concentration means that it is the reduction of monopoly power by dominant firm in the economy. Dominant firm will adjust pricing due to market share maintenance strategy.
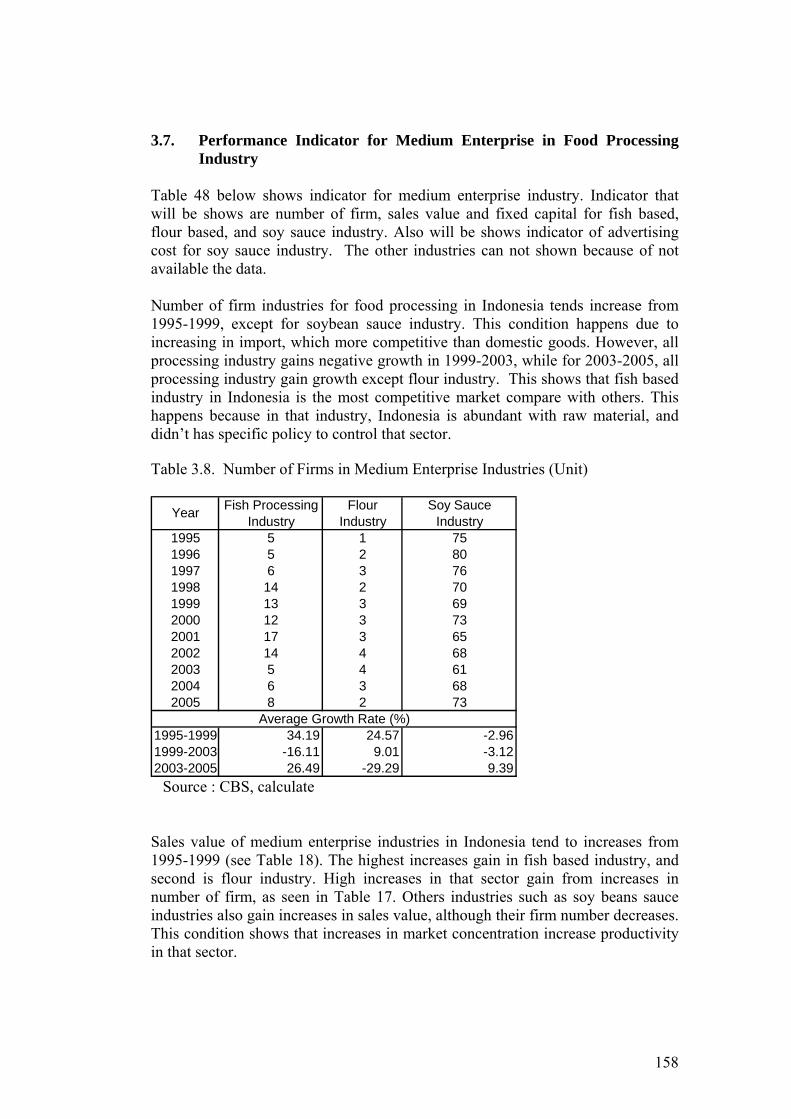
158
3.7. Performance Indicator for Medium Enterprise in Food Processing Industry Table 48 below shows indicator for medium enterprise industry. Indicator that will be shows are number of firm, sales value and fixed capital for fish based, flour based, and soy sauce industry. Also will be shows indicator of advertising cost for soy sauce industry. The other industries can not shown because of not available the data. Number of firm industries for food processing in Indonesia tends increase from 1995-1999, except for soybean sauce industry. This condition happens due to increasing in import, which more competitive than domestic goods. However, all processing industry gains negative growth in 1999-2003, while for 2003-2005, all processing industry gain growth except flour industry. This shows that fish based industry in Indonesia is the most competitive market compare with others. This happens because in that industry, Indonesia is abundant with raw material, and didn’t has specific policy to control that sector. Table 3.8. Number of Firms in Medium Enterprise Industries (Unit)
Fish Processing Flour Soy SauceIndustry Industry Industry
1995 5 1 751996 5 2 801997 6 3 761998 14 2 701999 13 3 692000 12 3 732001 17 3 652002 14 4 682003 5 4 612004 6 3 682005 8 2 73
1995-1999 34.19 24.57 -2.961999-2003 -16.11 9.01 -3.122003-2005 26.49 -29.29 9.39
Average Growth Rate (%)
Year
Source : CBS, calculate
Sales value of medium enterprise industries in Indonesia tend to increases from 1995-1999 (see Table 18). The highest increases gain in fish based industry, and second is flour industry. High increases in that sector gain from increases in number of firm, as seen in Table 17. Others industries such as soy beans sauce industries also gain increases in sales value, although their firm number decreases. This condition shows that increases in market concentration increase productivity in that sector.

159
Table 3.9 Sales Value of Medium Enterprise Industries (Million Rupiah)
Fish Processing Flour Soy SauceIndustry Industry Industry
1995 4,804.7 189.8 25,423.9 1996 3,942.3 102.6 32,881.6 1997 4,068.3 2,907.2 34,501.4 1998 45,352.7 240.0 51,173.4 1999 88,266.2 3,566.1 54,057.8 2000 54,944.2 862.1 65,454.0 2001 22,248.2 877.5 131,452.1 2002 27,030.5 1,886.1 148,748.9 2003 12,229.1 52,567.7 100,380.2 2004 24,796.8 53,196.4 164,945.9 2005 26,006.1 212,156.8 218,562.2
1995-1999 128.51 95.75 21.54 1999-2003 130.39 56.23 20.032003-2005 -19.66 243.41 17.10
Year
Average Growth Rate (%)
Source : CBS, calculated Sales value in 1999-2003 increases for fish based, flour based and soy sauce. Anomaly in this industries happens because it didn’t had competitiveness to compare with import goods. Decreases of sales value in 2003-2005 for fish based industry also happens because domestic firm lack competitiveness to compete with import goods. Based on table above, only flour based and soy sauce industry that had competitiveness to gain better market in in liberalization period. Advertising cost for soy sauce industries in 1995-2003 was increased significantly from 71.2 million rupiah to 1,839.9 million rupiah (see table 19). This pattern shows that sector become more competitive in that period. This shown that market in soy sauce industry become more competitive that ever. Table 3.10 The Advertising Cost of Medium Enterprise Industries (Million Rupiah)
Soy SauceIndustry
1995 71.2 1996 109.4 1997 50.6 1998 352.2 1999 448.5 2000 486.9 2001 1,424.2 2002 1,511.7 2003 717.2 2004 913.5 2005 1,839.9
1995-1999 62.40 1999-2003 23.02 2003-2005 60.16
Year
Average Growth Rate (%)
Source : CBS, calculated

160
Fix capital of medium enterprise industries for all industries during 1995 to 2005 seen same pattern with number of firm (see table 20). This shows increased concentration, where merger of them would reduce the number of firm, but increased fix capital. Table 3.11. Fixed Capital of Medium Enterprise Industries (Million Rupiah)
Fish processing Flour Soy SauceIndustry Industry Industry
1995 3,537.0 41.2 13,563.7 1996 2,959.1 832.1 14,333.6 1997 2,381.2 1,623.1 15,103.5 1998 10,211.2 158.0 18,713.8 1999 12,122.2 1,028.1 37,715.1 2000 12,800.5 1,602.5 39,008.4 2001 8,740.6 1,486.1 28,549.6 2002 8,760.3 2,301.6 34,215.5 2003 5,283.9 - 37,714.0 2004 5,768.4 - 50,128.5 2005 6,545.6 - 67,866.9
1995-1999 44.80 61.17 26.011999-2003 -18.45 - -1.302003-2005 11.30 - 34.15
Average Growth Rate (%)
Year
Source : CBS, calculated
3.8. Granger Causality Test of Fixed Capital (MODT), Variable of Capital (MODTT), Sales, Number of Enterprises (PRSH), and Advertising Cost
Granger initiated a model of conceiving the causality relationship between two variables. Granger causality test observe the F value of the regression estimation. We can reject the null hypothesis one of the variable does not effect causality to other variables. As can be seen in F value (probabylitas) where as value exceeding the F table(statistics). The computation Granger Causality used Eviews 5 (software). We can reject the null hypothesis when the degree of confidence exceeds the F value. The Granger Causality tests results for Soy sauce industry can be seen in Table 4.12.

161
Table 3.12. Granger Causality Test for Fixed Capital, Variable of Capital, Number of Enterprise, Sales and Advertising Cost in Soy sauce industry
Pairwise Granger Causality Tests-Soy Sauce IndustriesDate: 01/09/08 Time: 00:54Sample: 1995 2005Lags: 1
MODT does not Granger Cause PRSH 10 0.16416 0.69745 PRSH does not Granger Cause MODT 233,016 0.17072
MODTT does not Granger Cause PRSH 10 162,466 0.24312 PRSH does not Granger Cause MODTT 0.81564 0.39647
SALES does not Granger Cause PRSH 10 0.70017 0.43036 PRSH does not Granger Cause SALES 0.70664 0.42834
Advertising Cost does not Granger Cause PRSH 10 247,209 0.15988 PRSH does not Granger Cause Advertising Cost 0.38444 0.55487
MODTT does not Granger Cause MODT 10 0.72737 0.42196 MODT does not Granger Cause MODTT 503,857 0.05966
SALES does not Granger Cause MODT 10 149,171 0.26149 MODT does not Granger Cause SALES 456,712 0.06994
Advertising Cost does not Granger Cause MODT 10 0.12542 0.73366 MODT does not Granger Cause Advertising Cost 631,544 0.04022
SALES does not Granger Cause MODTT 10 683,508 0.03469 MODTT does not Granger Cause SALES 635,899 0.03971
Advertising Cost does not Granger Cause MODTT 10 112,092 0.32488 MODTT does not Granger Cause Advertising Cost 240,003 0.16526
Advertising Cost does not Granger Cause SALES 10 277,848 0.13948 SALES does not Granger Cause Advertising Cost 423,977 0.07847
Null Hypothesis: Obs F-Statistic Probability
Note: MODTT: Variable of Capital; MODT : Fixed Capital; SALES : Value of Sales; PRSH : Number of Enterprises; Advertising cost. Source : CBS, calculated The result shows that in soy sauce Industry, we can show accept the null hypothesis both variable of capital (MODTT) and number of enterprises (PRSH) do not have Granger cause. MODTT, Sales and Advertising cost do not Granger cause PRSH under the degree of confidence more than 5%. The degree of confidence exceeds the probability value. We can accept the null hypothesis both PRSH and MODT do not have a Granger advertising cost. This explains that PRSH and MODT do not have causality relationship. We can reject the null hypothesis that MODTT cause advertising cost at 5% level of confidence vice versa. However, we can reject the hypothesis and say that advertising cost Ganger cause MODTT. We can explain in both sales and advertising cost variable does not cause when we accept the null hypothesis at less than 5% level degree of confidence.

162
We can accept the null hypothesis of MODT does not Granger cause advertising cost at level of confidence less 5%. However, we can reject the null hypothesis and conclude that Advertising cost Ganger cause MODT. We can get information where Advertising cost and Sales have causality relationship in soybean processing industries. In the other side, we can reject the null hypothesis of Sales does granger cause MODTT and MODTT doest granger cause Sales at level degree of confidence more than 5%. The implication of the causality test is that import penetration induce domestic price to decrease. This is happening since the fact that import penetration will alter domestic player to adjust its pricing methods. In another case, dominant firm, in this case Bogasari, has to maintain smaller profit at the normal profit to maintain its market share. Even though the data of pricing tends to show increasing trend after trade liberalization, import penetration has forced dominant domestic player to set moderate pricing. Dominant firm in Soy sauce industry is Heinz ABC Indonesia PT, have to maintain smaller profit at the normal profit to maintain its market share. Caused the prices data is limited, analysis to import penetration in soy sauce industry not in-depth. In addition, distribution channel is getting more competitive. Distributor of importer will enter this level and pricing above the normal profit at this level will shift consumer to the importer distributor. Distributor cannot set the price above the normal profit added by the cost of transportation. Setting market maintenance through moderate pricing will reduce prices in the overall domestic wheat flour. Import penetration does not alter domestic market structure (HHI) since the fact that the dominant firm is strong and dominant firm will adjust its market maintenance strategy by conducting moderate pricing, product differentiation, and profit adjustment in other SBUs for vertical integrated company. Import alters the market concentration in the distributor level rather than in the milling wheat flour producer.
4. Research Findings 4.1. Wheat Flour Based Industries: Research findings for wheat flour based industries are :
• Four large enterprises of the wheat flour based industries, which have among the highest market concentration, showed a decrease in their market share in the beginning of liberalization period from 99% in 1995 to 85 % in 2003. However, after having the period for adjustments, their market share has started to increase again from 85 in 2003 to 90% in 2005.
• Indofood, one of the biggest enterprises, showed a decrease in its ROA (Return of Assets) in the period of 2001 to 2005. The significant decrease of the ROA occurred particularly in the last three year of the observation (2003-2005) from 3.9 to 0.8.

163
• Vertical integration is a business strategy to maintain market share, which will increase market concentration. Vertical integration strategy has been applied by Indofood to maintain its domestic market share of instant Noodle from competition of import of wheat flour (raw materials for instant noodles). Indofood bought Bogasari wheat flour millings to integrate to its instant noodles industries.
4.2. Crude Palm Oil Industries (CPO) : Research findings for CPO industries are :
• Four CPO companies have managed to dominate their market concentration with a tendency to increase. Their market share increased from 72% to 82 % in the last three years of the observation (2002 to 2005). However, their Hirschman-Herfindahl index has shown a decline from 2950 to 2550 (1995-2005).
• The CPO and Cooking oil production have increased to three fold in the last ten years, while domestic consumption of cooking oil has increased by 60 percents in the same period..
4.3. Soybean based industries Research findings soybean based industries are :
• Two big enterprises in the soybean based industry (soy sauce industry) experienced almost double of their market share from 38 percent to 70 percents in the last ten years (1995 – 2005). The two companies are Heinz (foreign company) and PT.ABC (National Company). The two companies were then merged so that they dominate domestic market for soy sauce products.
• ROA of soy sauce industry has show a decreasing trend from 1995 to 2005. The decrease was mild between 1995 to 2002 from 6.9 to 5.7, followed with further drastic fall from 5.7 to 1.8 from 2002 to 2005.
4.4. Fish Based Industries Research findings for fish based industries are :
• Market concentration of four large enterprises for fish based industries have been relatively stable from 1995 to 2005 .
• The output value of fish based industries showed a high rise in between 2003 to 2004 (data included Fish based and meat based industries)
• Capital Value for fish and meat based industries has showed a decreasing trend from 1996 to 2001, but has started to increase from 2002 to 2004 (data included Fish based and meat based industries).
4.5 Beverages Industries: A research finding for beverage industries is:
• Market concentration of the four big companies experienced a decreasing trend from 35 percents to 29 percents for the period of 1995-2005. During the liberalization era, tariff for beverage import was significantly reduce

164
from 19 percent to 4.8 percent, hence the import quantity of beverage product was increased from 27.79 ton – 54.94 ton or almost double in the last ten years (1995-2005).
5. Summary and Recommendation 5.1. Summary From the research findings above, some pattern are merged, they are:
1. Most of large enterprise showed decreased market concentration during the liberalization period. However, in wheat industry, after the period of adjustment their market share has started to increased again. 2. Large enterprise retains their market share to increased market
concentration after liberalization due to a. Vertical integration strategy (i.e. Wheat industry) and b. Merge and acquisition (ie CPO and Soysauce industry).
3. Import product has proved to be a competitor for domestic products as it was shown in wheat flour and beverage industry.
4. Most of return on assets of large enterprise tend to decrease, this due to decrease in revenue and increase in assets.
5.2. Recommendation Some recommendation based on research findings are:
Indonesian government should create a fair trade atmosphere in food processing industry to reduce monopoly or oligopoly power. 1. Indonesian government should provide policies to increase efficiency and productivity in food processing industry, to increase their competitiveness again import goods. To achieve this goal, government must give incentive such as tax holiday or lower interest rate, or precisely targeted subsidy.
2. Indonesia government should encourage merger activity for uncompetitive food processing industry, especially SME, to increase their competitiveness.

165
6 References Amin A. 2003. Trade Policy and Market Structure under Asymmetric
Information. Colombia University. Astiyah, S., A.R. Hutabarat, D.V.B. Sianipar. Maret 2005. Dampak Liberalisasi
Perdagangan Terhadap Perilaku Pembentukan Harga Produk Industri melalui Structure-Conduct-Performance Model. Buletin Ekonomi Moneter dan Perbankan.
Bataile E. and B. Julien. 2005. Advertising, Pricing and Market Structure in
Competitive Matching Market, NBER Working Papers. Brambilia, I. and G. Porto. 2005. Farm Productivity and Market Structure,
Evidance from Cotton Reform in Zambia, NBER Working Paper. Carlton, D.W. and J.M. Perloff. 2000. Modern Industrial Organization. Addison-
Wesley Publ. Comp. Reading. Central Biro of Statistic. Various years. Indonesian Statistics. Jakarta. Chawdury, N., N. Farid and D. Roy. 2006. Food Policy Liberalization in
Bangladesh : How Government and Market Delivered?. MTID Discussion Paper No 92. International Food Policy Reseach Institute. Washington.
Cockburn, I.M. and M.J. MacGarvie. 2006. Entry, Exit and Patenting in Software
Industry, NBER Working Paper. Cohen A., and M. Mazzeo. 2003. Market Structure and Competition among
Depository Institution, NBER Working Paper. Davis, D. R. and D.E., Weinstein. 2001. Market Size, Linkage and Productivity :
A Study of Japanese Region, NBER Working Paper. Departemen Perindustrian. 2007. Pengembangan Industri Kelapa Sawit
Indonesia Dari Hulu Sampai Hilir: Suatu Saran Alternatif Terhadap Penerapan PE/Kuota
Ilyas, Y. and H. Esmara. 1990. Small Industry and Culture Area: Experience in
West Sumatera. In: Rural Industrialization, Sayogyo and M. Tambunan (eds.) Sekindo Eda Jaya, Jakarta, Indonesia. (In Bahasa Indonesia)
Indofood Annual Report. 2006. Jakarta Jansen, E.G. Rich Fisheries-Poor Fisherfolk, Some Preliminary Observation
About Effect of Trade and Aid In The Lake Victoria Fisheries. Socio-Economics of The Nile Pearch Fishery onLake Victoria, IUCN - The World Conservation Union, Kenya.

166
Knips, V. 2005. Developing Countries and Global Dairy Sector : Part I Global
Overview. Pro-Poor Livestock Policy Initiative Worling Paper, N0. 30. Kunt, A.D., L. Laeven and R. Levine. 2003. Regulations, Market Structure,
Institution, and The Cost Financial Intermediations, NBER Working Paper.
Mausser, A. Enviromental Management in Dutch Dairy Industry. Institute for
Enviromental Management, University of Amsterdam. Sung, N. 2006. Effect of Regulatory Policy of Market Structure and Performance
in OECD Mobile Market, University of Seoul, Seoul. USDA Report. 2003. Russian Federation Agricultural Situation Flour and Bread
Prices 2003. USDA Foreign Agricultural Services. Series: RS.3046. United Nation Environment Programme, 2005. Integrated Asessment of The
Impact of The Trade Liberalization. Wagner, E; Fahwani Y; and Rangkuti. 2007. Indonesia Food Processing
Ingredient Sector. Food Processing Update, USDA Foreign Agriculture Services. Gain Report, Worldbank, Jakarta.
Varian, H.R. 1992. Microeconomics Analysis, 3rd edition. Norton and Company,
New York.

167
Annex 1. Regression Result 1. Fish Based Industry
Variable Coefficient Std. Error t-Statistic Prob. Total Assets -2.281 0.617 -3.696 0.021Sales 0.535 0.409 1.307 0.261Advertising Cost 0.755 0.145 5.210 0.007Number of Firm (-2) -1.101 0.255 -4.314 0.013Constant 35.626 6.228 5.720 0.005
R-squared 0.879 Mean dependent var 4.940Adjusted R-squared 0.758 S.D. dependent var 0.094S.E. of regression 0.046 Akaike info criterion -3.005Sum squared resid 0.009 Schwarz criterion -2.895Log likelihood 18.521 7.264Durbin-Watson stat 3.166 Prob(F-statistic) 0.040
F-statistic
Source : CBS, calculated 2. Milk Based Industry
Variable Coefficient Std. Error t-Statistic Prob. Total Assets -0.139 0.164 -0.845 0.426Sales 0.154 0.132 1.167 0.281Advertising Cost -0.030 0.047 -0.646 0.539Constant 2.483 1.597 1.555 0.164
R-squared 0.167 Mean dependent var 2.377Adjusted R-squared -0.191 S.D. dependent var 0.101S.E. of regression 0.110 Akaike info criterion -1.298Sum squared resid 0.085 Schwarz criterion -1.154Log likelihood 11.142 0.466Durbin-Watson stat 2.023 Prob(F-statistic) 0.715
F-statistic
Source : CBS, calculated 3. Paddy Based Industry
Variable Coefficient Std. Error t-Statistic Prob.
Total Assets -0.146 0.131 -1.114 0.316Sales 0.098 0.121 0.809 0.455Advertising Cost -0.028 0.020 -1.405 0.219Number of Firm (-1) 0.497 0.188 2.637 0.046Constant 4.135 1.411 2.931 0.033
R-squared 0.963 Mean dependent var 5.687Adjusted R-squared 0.934 S.D. dependent var 0.053S.E. of regression 0.014 Akaike info criterion -5.442Sum squared resid 0.001 Schwarz criterion -5.291Log likelihood 32.211 32.763Durbin-Watson stat 1.742 Prob(F-statistic) 0.001
F-statistic
Source : CBS, calculated

168
4. Soy souce Industry
Variable Coefficient Std. Error t-Statistic Prob. Total Assets 0.155 0.282 0.551 0.599Sales -0.076 0.211 -0.362 0.728Advertising Cost -0.069 0.054 -1.291 0.238Constant 3.699 1.650 2.242 0.060
R-squared 0.470 Mean dependent var 4.256Adjusted R-squared 0.242 S.D. dependent var 0.077S.E. of regression 0.067 Akaike info criterion -2.305Sum squared resid 0.031 Schwarz criterion -2.160Log likelihood 16.676 2.066Durbin-Watson stat 2.194 Prob(F-statistic) 0.193
F-statistic
Source : CBS, calculated
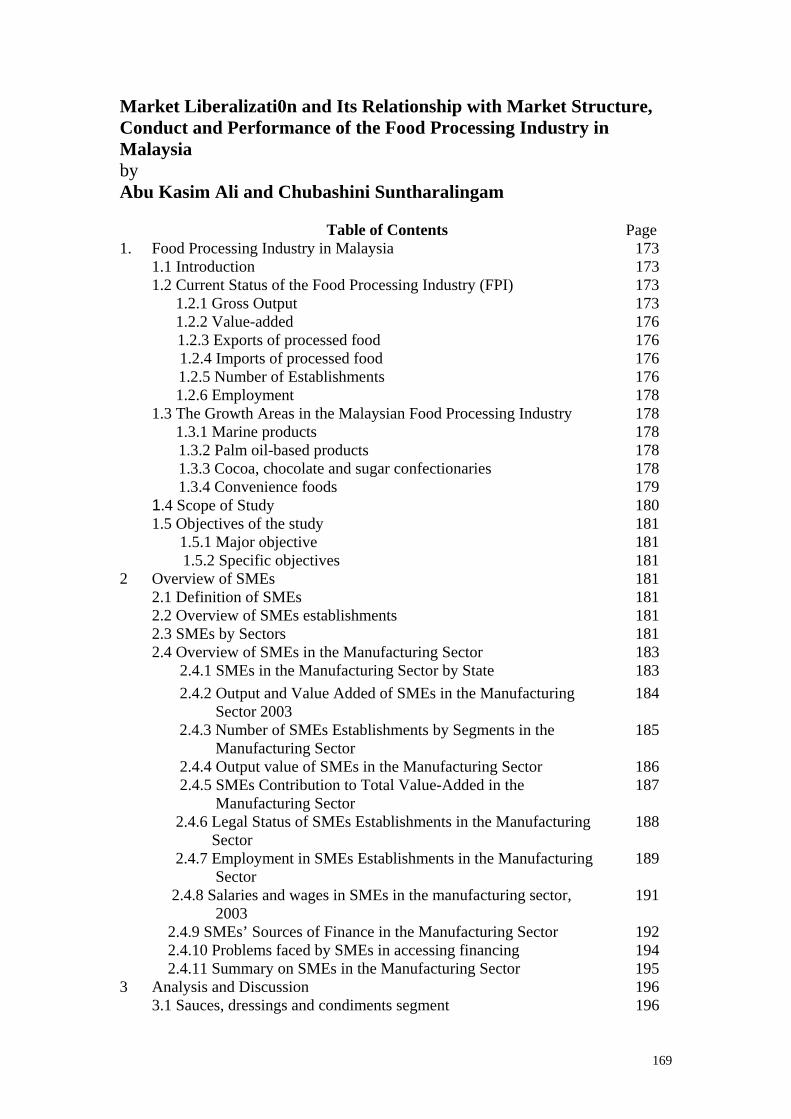
169
Market Liberalizati0n and Its Relationship with Market Structure, Conduct and Performance of the Food Processing Industry in Malaysia by Abu Kasim Ali and Chubashini Suntharalingam
Table of Contents Page 1. Food Processing Industry in Malaysia 173 1.1 Introduction 173 1.2 Current Status of the Food Processing Industry (FPI) 173 1.2.1 Gross Output 173 1.2.2 Value-added 176 1.2.3 Exports of processed food 176 1.2.4 Imports of processed food 176 1.2.5 Number of Establishments 176 1.2.6 Employment 178 1.3 The Growth Areas in the Malaysian Food Processing Industry 178 1.3.1 Marine products 178 1.3.2 Palm oil-based products 178 1.3.3 Cocoa, chocolate and sugar confectionaries 178 1.3.4 Convenience foods 179 1.4 Scope of Study 180 1.5 Objectives of the study 181 1.5.1 Major objective 181 1.5.2 Specific objectives 181 2 Overview of SMEs 181 2.1 Definition of SMEs 181 2.2 Overview of SMEs establishments 181 2.3 SMEs by Sectors 181 2.4 Overview of SMEs in the Manufacturing Sector 183 2.4.1 SMEs in the Manufacturing Sector by State 183 2.4.2 Output and Value Added of SMEs in the Manufacturing
Sector 2003 184
2.4.3 Number of SMEs Establishments by Segments in the Manufacturing Sector
185
2.4.4 Output value of SMEs in the Manufacturing Sector 186 2.4.5 SMEs Contribution to Total Value-Added in the
Manufacturing Sector 187
2.4.6 Legal Status of SMEs Establishments in the Manufacturing Sector
188
2.4.7 Employment in SMEs Establishments in the Manufacturing Sector
189
2.4.8 Salaries and wages in SMEs in the manufacturing sector, 2003
191
2.4.9 SMEs’ Sources of Finance in the Manufacturing Sector 192 2.4.10 Problems faced by SMEs in accessing financing 194 2.4.11 Summary on SMEs in the Manufacturing Sector 195 3 Analysis and Discussion 196 3.1 Sauces, dressings and condiments segment 196

170
3.1.1 Background 196 3.1.2 Current Status of Sauces, dressings and condiments segment
in Malaysia. 196
3.1.3 Market Structure analysis 198 3.1.3.1 Concentration ratio 198 3.1.3.2 Herfindahl-Hirschman Index 203 3.1.3.3 Technology 204 3.1.3.4. Raw Materials 205 3.1.4. Market Conduct analysis 206 3.1.4.1 Product promotions 206 3.1.4.2 Advertising 206 3.1.4.3 New product development 207 3.1.5. Market Performance Analysis 207 3.1.5.1 Return on Sales (ROS) 207 3.1.5.2 Return on Asset (ROA) 208 3.2 Sweet and Savory Snacks Segment 209 3.2.1 Introduction 209 3.2.2 Market Structure 210 3.2.2.1 Concentration ratio 210 3.2.2.2 Herfindahl-Hirschman Index 217 3.2.2.3 Technology 219 3.2.2.4 Raw Materials 219 3.2.3 Market Conduct 220 3.2.3.1 Product promotions and advertising 220 3.2.3.2 New product development 220 3.2.4 Market Performance 221 3.2.4.1 Return on Sales (ROS) 221 4 Conclusion 222 5 Policy Recommendation 222 6 References 227 Appendix 228

171
List of Tables Table 1.1: Exports of Processed Food 174 Table 1.2: Profile of the Food Processing Industry, 2003 175 Table1.3: Imports of Processed Food 177 Table 1.4: Average Annual Growth Rate (%) of Output Value (2000-2004) 179 Table 2.1: Definition of SMEs 182 Table 2.2: SMEs by sector and size, 2003 182 Table 2.3: SMEs by sector, 2003 183 Table 2.4: SMEs in the Manufacturing Sector by State, 2003 184 Table 2.5: Output and value added of SMEs in manufacturing sector by size, 2003
185
Table 2.6: No of establishments by segments in the manufacturing sector 185 Table 2.7: Output value of manufacturing sectors, 2003 186 Table 2.8: SMEs in manufacturing sector by legal status and size, 2003 189 Table 2.9: Employment by category of workers and gender in SMEs in manufacturing sector, 2003
189
Table 2.10: Sources of financing accessed by SMEs in the manufacturing sector, 2003
193
Table 2.11: Problems faced in accessing financing by SMEs, 2003 194 Table 2.12: Distribution of SMEs by key indicators and segments, 2005 and 1996
195
Table 3.1: Sales of Sauces, Dressings and Condiments by Subsector: Value 2001-2006 (RM million)
197
Table 3.2: Percentage Breakdown of Wet Sauces by Type, 2004-2006 (% Sales)
198
Table 3.3: Sauces, Dressings and Condiments Company Shares based on Sales, 2001-2005 (%)
199
Table 3.4: Four Largest Companies’ Market Shares in Malaysia’s Sauces, Dressings and Condiments Segment 2001-2005 (%)
200
Table 3.5: Sales of Sauces, Dressings and Condiments by Subsector: Value 2001-2006 (RM million)
202
Table 3.6: Four Largest Brands’ Market Shares in Malaysia’s Sauces, Dressings and Condiments Segment 2001-2005 (%)
201
Table 3.7: Computation of HHI for the Sauces, Dressings and Condiments Company Shares based on Sales, 2001-2005 (%)
204
Table 3.8: Raw Material Requirement for Sauce Products 206 Table 3.9: Performance of sauces producer: Return on sales (ROS) 208 Table 3.10: Performance of sauces producer: Return on Asset (ROA) 208 Table 3.11: Sales of Sweet and Savory Snacks by Subsector: Value 2001-2006 (RM million)
211
Table 3.12: Sales Volume and Value Growth of Sweet and Savoury Snacks by Subsector: 2005/2006 (%)
210
Table 3.13: Sweet and Savoury Snacks Company Shares based on Sales, 2001-2005 (%)
213
Table 3.14: Four Largest Companies’ Market Shares in Malaysia’s Sweet and Savory Snacks Segment 2001-2005 (%)
212
Table 3.15: Sweet and Savory Snacks Brand Shares based on Sales, 2002-2005 (%)
215
Table 3.16: Four Largest Brands’ Market Shares in Malaysia’s Sweet and 216

172
Savory Snacks Segment 2002-2005 (%) Table 3.17: Computation of HHI for the sweet and savory snacks Company Shares based on Sales, 2001-2005 (%)
218
Table 3.18: Raw Material Requirement for Snacks and Chips Products by SMEs (mt)
220
Table 3.19: Performance of a traditional cracker/chip producer: Return on sales (ROS)
221
Table 3.20: Performance of sauces producer: Return on Asset (ROA) 222 Table 5.1: Sectoral Regulation in Malaysia 225
List of Charts Chart 2.1 : SMEs in manufacturing sector by size, 2003 183 Chart 2.2: SMEs in major manufacturing segments, 2003 186 Chart 2.3: Share of output value by SMEs in the manufacturing sector, 2003 187 Chart 2.4: Share of value added by SMEs in the manufacturing sector, 2003 188 Chart 2.5: Employment in SMEs in manufacturing sector by size, 2003 190 Chart 2.6: Employment share in SMEs by segments in the manufacturing sector
191
Chart 2.7: Salaries and wages in SMEs in the manufacturing sector, 2003 192 Chart 2.8: Problems faced by SMEs in accessing financing, 2003 194 Chart 3.1: Four Largest Companies’ Market Shares in Malaysia’s Sauces, Dressings and Condiments Segment 2001-2005 (%)
200
Chart 3.2: Four Largest Brands’ Market Shares in Malaysia’s Sauces, Dressings and Condiments Segment 2001-2005 (%)
201
Chart 3.3: Herfindahl-Hirschman Index (HHI) for Malaysia’s Sauces, Dressing & Condiments Segment, 2001-2005
203
Chart 3.4: Four Largest Companies’ Market Shares in Malaysia’s Sweet and Savory Snacks Segment 2001-2005 (%)
214
Chart 3.5: Four Largest Brands’ Market Shares in Malaysia’s Sweet and Savory Snacks Segment 2002-2005 (%)
217
Chart 3.6 : Herfindahl-Hirschman Index (HHI) for Malaysia’s Sweet and Savory Snacks Segment, 2001-2005
218
173
1. The Food Processing Industry in Malaysia
1.1 Introduction
The Malaysian FPI comprises the following segments: i) Cocoa and cocoa products ii) Cereals and flour based products iii) Processed fish and seafood products iv) Processed livestock products v) Processed fruits and vegetables vi) Sugar and sugar confectionery vii) Dairy products viii) Coffee ix) Tea x) Spices xi) Edible products and preparations
The FPI ranges from small medium enterprises (SMEs) to multinational corporations (MNCs). SMEs comprised more than 80 per cent of the total food industry establishments in Malaysia. Most of these establishments serve the domestic market with the MNCs serving the export markets as well.
1.2 Current Status of the Food Processing Industry (FPI)
The FPI accounted for 1.6 percent of Malaysia’s total exports of manufactured goods and about 10 per cent of Malaysia’s manufacturing output (Malaysia’s Trade Performance Report 2006, 2007). Processed foods are exported to 80 countries, with an annual export value of more than RM5 billion* (Food and Beverage FMM – MATRADE Industry Directory, 2005-2006). The FPI registered an output growth of 4.2 percent in 2004. As shown in Table 1.1, the highest growth was recorded in cocoa, chocolate and sugar confectionary (15.2 per cent), biscuits (11.5 per cent) and other food products (11.4 percent) in response to increased domestic and external demand. Negative growth was recorded in rice milling (-23.8 percent) due to demand being increasingly met by imports. 1.2.1 Gross Output The total gross output of the FPI was about RM20 billion, in which the largest contributor was the cereal and flour based products’ segment, with a total contribution of approximately RM5 billion, followed by the other food products’ segment with RM4 billion and dairy products’ segment with RM2.2 billion (Table 1.2), (Industrial Master Plan 3, 2006-2020). ___________________________________________________________
* US1.00 = RM3.35

174
Table 1.1: Exports of Processed Food
1996 2005 1996-2005
Product Value
(RM million)
Share
(%)
Value
(RM million)
Share
(%)
Average Annual
Growth Rate (%)
Total 2,753.8 100 7,821.9 100 11.3
Processed fish and seafood products 674.3 24.5 2,059.7 26.3 11.1
Cocoa products 456.0 16.6 1,873.2 23.9 15.2
Edible products and preparations 426.6 15.5 1,249.1 16.0 11.9
Prepared cereals and flour preparations 381.3 13.8 902.9 11.5 9.9
Sugar and sugar confectionary 213.2 7.7 470.0 6.0 8.8
Dairy products 167.0 6.1 418.2 5.3 9.8
Coffee 45.5 1.7 277.0 3.5 21.6
Processed fruits and vegetables 158.8 5.8 262.7 3.4 4.5
Spices 138.9 5.0 188.3 2.4 5.6
Processed meat 84.4 3.1 86.6 1.1 2.0
Tea 7.8 0.3 34.2 0.4 24.6
Source: Third Industrial Master Plan (IMP3), 2006-2020

175
Table 1.2: Profile of the Food Processing Industry, 2003
Food Segment No of
Establishments
Gross Output
(RM million)
Value-added
(RM million) Employment
Total 2,335 16,793.9 4,405.6 80,493
Manufacture of grain mill products, starches and starch products 303 2,565.9 463.9 7,267
Manufacture of dairy products 41 2,185.3 563.2 4,109
Manufacture of cocoa products, chocolate products and sugar
confectionery 66 1,828.1 408.4 6,451
Manufacture of biscuits, cookies, bread, cakes and other bakery
products 762 1,717.7 588.5 20,045
Processing and preserving of fish and fish products 131 1,447.3 320.7 8,879
Processing and preserving of poultry and poultry products 12 733.2 144.4 2,491
Production, processing and preserving of other meat and meat products 42 548.9 109.5 5,569
Manufacture of spices, curry powder and sauces, including flavouring
extracts 97 637.8 211.2 2,709
Manufacture of macaroni, noodles and similar products 258 574.2 167.6 4,684
Manufacture of coffee and tea 129 377 116.7 2,607
Canning and preserving of fruits and vegetables (including pineapples) 54 271 67.6 1,919
Manufacture of other food products* 440 3,807.5 1,238.5 15,763
Note: * Include sugar, ice, nuts and nut products, snacks, crackers and chips Source: Industrial Master Plan 3, 2006 – 2020

176
1.2.2 Value-added The two top food segments that contribute the highest in terms of value adding existing products were cereal and flour based products (grain mill, starch, bakery and noodles products) and followed by the other food products amounting to about RM1.2 billion, respectively. These segments accounted for 56% of the total value adding for FPI. Dairy products’ segment follows suit with RM563 million (Table 1.2), (Industrial Master Plan 3, 2006-2020).
1.2.3 Exports of processed food The exports of processed food have escalated from RM2.8 billion in 1996 to RM7.8 billion in 2005, an average annual growth rate of 11.3% (Table 1.1). This increment is attributable to the expansion of food processing activities and the increasing acceptance of Malaysia’s processed foods in the international market. Major processed food exported were processed seafood, cocoa and cocoa preparations, and prepared cereal and flour preparations. Malaysia’s top export destinations in 2006 were Singapore (RM1.16 billion) followed by the USA (RM597.6 million), Indonesia (RM586 million), Japan (RM364.1 million) and the Netherlands (RM339.9 million) Malaysia was Singapore’s largest supplier of processed food, accounting for 16.6 percent share of Singapore’s total imports of these products. Major exports to Singapore were prepared cereals and flour preparations (4.6 per cent). Main export items to the USA were cocoa and cocoa preparations, processed seafood and prepared cereals and flour preparations. Indonesia’s main imports of processed food from Malaysia were sugar and sugar confectionary and prepared cereals and flour preparation. Main exports to Japan were cocoa and cocoa preparations, prepared cereals and flour preparations, and processed seafood. Main exports to Netherlands were cocoa and cocoa preparations, processed seafood, and prepared or preserved vegetables and fruits (Malaysia’s Trade Performance Report 2006, 2007).
1.2.4 Imports of processed food Imports of processed food increased from RM4.4 billion in 1996 to RM8.9 billion in 2005 (Table 1.3), depicting an average annual growth rate of 8.7%. Major imports were dairy products, sugar and sugar confectionary and prepared or preserved vegetables and fruits. In 2006, Australia was Malaysia’s largest source of imports, with a share of 18.9 percent while Thailand fell to second place, registering a share percentage of 13.5 percent. The main imports from Australia were sugar and sugar confectionary and dairy products and main imports from Thailand were dairy products and processed seafood (Malaysia’s Trade Performance Report 2006, 2007).
1.2.5 Number of Establishments The findings of the Annual Survey of Manufacturing Industries, 2003 showed that there were more than 2,000 establishments involved in the food processing industry (Table 1. 2). The largest food segment was cereal and flour based products (grain, bakery and noodle products) with 1323 establishments followed by other food products’ segment (sugar, ice, nuts and nut products, snacks, crackers and chips) with 440 enterprises, and fish and fish products’ segment with 131 companies (Industrial Master Plan 3, 2006-2020).

177
Table1.3: Imports of Processed Food
1996 2005 1996-2005
Product Value
(RM million)
Share
(%)
Value
(RM million)
Share
(%)
Average Annual
Growth Rate (%)
Total 4,399.2 100 8,921.5 100 8.7
Processed fish and seafood products 764.7 17.4 1,783.2 20.0 11.3
Cocoa products 977.1 22.2 1,716.7 19.2 6.2
Edible products and preparations 501.7 11.4 1,505.0 16.9 12.9
Prepared cereals and flour preparations 874.7 19.9 1,339.6 15.0 4.6
Sugar and sugar confectionary 463.6 10.5 1,048.3 11.8 10.6
Dairy products 362.3 8.2 418.4 4.7 5.3
Coffee 215.3 4.9 396.8 4.4 6.9
Processed fruits and vegetables 125.7 2.9 342.0 3.8 14.2
Spices 53.4 1.2 179.3 2.0 15.9
Processed meat 27.2 0.6 108.0 1.2 16.2
Tea 33.5 0.8 84.0 1.0 11.2
Source: Third Industrial Master Plan (IMP3), 2006-2020

178
1.2.6 Employment
The food processing industry employs about 81,000 workers (Table 1.2), out of which the cereal and flour based products’ segment employs the most (40% of total FPI), followed by the other food products’ segment (20%), and fish and fish products’ segment, employing about 8879 workers (11%). Thus these three segments collectively employ 71% of total workforce in the FPI. (Industrial Master Plan 3, 2006-2020).
1.3 The Growth Areas in the Malaysian Food Processing Industry
The food processing industry has been targeted as one of the twelve industries in the Malaysian manufacturing sector for greater development and promotion (Industrial Master Plan 3, 2006-2020). The Average Growth Rate of Sales of the major food processing industries is depicted in Appendix 1. The major processed food segments that have been identified as growth areas are products of marine, palm oil-based, cocoa, chocolates and sugar confectionaries and convenience foods (Table 1.4).
1.3.1 Marine products
An export-oriented sector, fish processing includes the processing of prawns such as chilled and frozen prawns, frozen products, canning of fish and the production of surimi and surimi products. Exports exceeded RM1.5 billion per annum of which frozen prawns constitute more than RM600 million (Food and Beverage FMM – MATRADE Industry Directory, 2005-2006). The sub-sector of `Processing and preserving of fish and fish products’ registered an average annual growth rate (AGR) for output value at almost 11% during 2000 to 2004 period.
1.3.2 Palm oil-based products
Malaysia is the world’s largest producer and exporter of palm oil contributing 50 percent and 65 percent of the world’s palm oil output and export respectively. Total export value of edible palm-oil-based products is about RM22 billion per annum (Food and Beverage FMM – MATRADE Industry Directory, 2005-2006). In terms of output value,it was one of the performers with double digit AGR for both the manufacture of crude and refined palm oil sub-sectors.
1.3.3 Cocoa, chocolate and sugar confectionaries
Malaysia is the largest cocoa grinder in Asia and ranked sixth largest in the world. It is a net exporter of cocoa products including chocolates, exporting to more than 70 countries. Exports of intermediate products, i.e. cocoa butter and cocoa cake/powder worth about RM1 billion per annum while that of chocolate and other food preparations containing cocoa are valued at about RM170 million (Food and Beverage FMM – MATRADE Industry Directory, 2005-2006). As shown under MISC code 15431 in Table 1.4, it AGR for 2000 to 20004 was 15%.

179
1.3.4 Convenience foods
The sales of sauces and snack products are escalating due to the demand of the population in seeking convenient ways of preparing food at home. Advanced packaging techniques and sophisticated methods of preserving fresh foods have enabled Malaysian-prepared foods to penetrate overseas markets. Freezing and food preservation techniques are key in producing frozen convenience foods including Asian style breads such as ‘roti canai’, steamed buns, samosa, curry puff, pizza and frozen dumpling.
Table 1.4: Average Annual Growth Rate (%) of Output Value (2000-2004)
MSIC* Description 2000 2,001 2,002 2003 2004 AGR (%)
151
Production, processing and preservation of meat, fish, fruit, vegetables, oils and fats
2,927,728 2,789,931 3,695,213 4,192,920 4,571,300 11.14
15120 Processing and preserving of fish and fish products 174,839 156,153 203,328 227,419 268,773 10.75
15142 Manufacture of crude palm oil 1,845,589 1,643,098 2,208,979 2,727,444 3,023,079 12.34 15143 Manufacture of refined palm oil 354,875 518,432 367,154 489,886 726,708 17.92 152 Manufacture of dairy products 478,693 397,658 420,140 430,343 485,663 0.36
15202 Manufacture of condensed, powdered and evaporated milk
15209 Manufacture of other dairy products
426,647 346,840 398,241 409,307 460,296 1.90
154 Manufacture of other food products 1,583,815 1,752,405 1,787,006 1,949,303 2,037,221 6.29
15412 Manufacture of bread, cake and other bakery products 186,202 295,295 224,470 267,612 317,327 13.33
15420 Manufacture of sugar 228,841 240,993 266,988 382,488 409,759 14.56 15431 Manufacture of cocoa products 65,020 71,119 87,508 95,227 118,466 15.00 15432 Manufacture of chocolate product
and sugar confectionery 140,226 120,940 147,806 197,625 161,908 3.59
15494 Manufacture of spices and curry powder 60,138 49,098 59,595 60,246 60,208 0.03
15496 Manufacture of sauces including flavouring extracts such as MSG 84,861 141,042 74,506 92,550 88,491 1.05
15497 Manufacture of snack: cracker/chips (prawn, fish, potato/banana/tapioca) 109,543 113,644 116,353 107,557 123,476 2.99
15499 Manufacture of other food products n.e.c (not elsewhere classified) 323,930 355,723 471,208 406,787 414,866 6.19
Note: * Malaysian Standard Industrial Classification 2000
Source: Department of Statistics, Malaysia 2005
These foods are classified under `Manufacture of other food products’, which include sauces and crackers. Both sub-sectors registered positive AGR with respect to output values or sales during 2000 to 2004.

180
1.4 Scope of Study
The growth rate of Malaysia’s processed foods’ exports has increased by 12% from RM2754 million in 1996 to RM7822 million in 2005, surpassing the growth rate of import processed foods at 8% over the same period. Although, these figures could be an indication that the Malaysian food processing industry has benefited from liberalized trading environment, there is no comprehensive and analytical marketing studies carried to study the effects of market liberalization on the Malaysian food processing industry. As such, this study aims to analyze the structure, conduct and performance of the convenience food sector within the food processing industry in order to determine the competitive positioning of this sector as to formulate appropriate marketing policies to take advantage of the growing convenience food market. Malaysia’s aspiration of becoming a world class producer of processed food products must be matched with creative marketing strategies in order to compete effectively in the global market. The `convenience foods’ sector is focused due its widely growing demand. The convenience foods has achieved high global retail sale of US$40.1 billion in 2003, and is expected to grow to US$46.3 billion in 2007 (Industrial Master Plan 3, 2006-2020). The foods that fall in this sector are ready-to-cook and ready-to-serve products, frozen meals or snacks, retort-pouch-foods, recipe-based ethnic foods and related ingredients, such as sauces, dried food stuffs and spices. Smaller households, longer working hours and less structured mealtimes have resulted in higher consumer demand for convenient food products. Since there is a growing market for production of ethnic food within the convenience foods sector, i.e. sauces, condiments and dressings and, snacks and chips from consumers across the globe and locally, these two food segments will be concentrated upon in this study. The Asian flavour attached to these products will continue to assist in spurring the sales growth of convenience foods, which in return steer Malaysian FPI to emerge as a competitive industry in the future. This study will also focus on the effects of trade liberalization on SMEs in the convenience foods sector. SMEs form the bulk of total establishments in the food products and beverages sector in Malaysia, representing ninety eight percent of total establishments in the food and beverage sector within the manufacturing industry. However, their contribution to the total manufacturing industry’s output is a meager fifteen percent. There are many and varied reasons contributing to this rather low productivity, nevertheless one major reason that is of relevance to this study is the one related to market access. The need to be competitive, meeting consumers’ demands and complying with basic international standards are some challenges that SMEs today face in the globalized environment. Thus, it is vital that strategic marketing policies and advanced marketing strategies are formulated in order to better assist the SMEs to compete and sustain in the global market.

181
1.5 Objectives of the study
1.5.1 Major objective
To evaluate the market efficiency of Malaysia’s food processing industry in terms of structure, conduct and performance resulting from trade liberalization.
1.5.2 Specific objectives
• To assess the market structure and conduct of the sauces, condiments and dressings and, snacks and chips segments in Malaysia
• To determine the market performance of the sauces, condiments and dressings and, snacks and chips segments in Malaysia
• To analyze the impact of trade liberalization on the Malaysian FPI, including SMEs
• To recommend policies and strategies in order to increase market efficiency of the processed food industry in Malaysia
2.0 Overview of SMEs
2.1 Definition of SMEs
The definition of SMEs used in Malaysia is based on two criteria to enable a wider coverage and applicability, namely:
i) Number of full time employees ii) Annual sales turnover
An establishment will be classified as an SME if it meets either one of the above criteria (Table 2.1)
2.2 Overview of SMEs establishments
Out of 523,132 establishments participated in the Baseline Census of Establishments and Enterprises conducted in 2005 by the Department of Statistics, Malaysia, SMEs accounted for 99.2 percent or 518,996 establishments while large enterprises (LEs) accounted the remaining 0.8 per cent or 4,136 business establishments. Most SMEs were very small, with 79.4% (411,849 establishments) classified as micro establishments. The remaining 18.4% and 2.2% establishments were classified as small and medium respectively (Table 2.2)
2.3 SMEs by Sectors
On a sectoral basis, the largest numbers of SMEs were found in the services sector with 449,004 establishments, followed by manufacturing (37,886) and the agriculture sector (32,126) firms (Table 2.3).
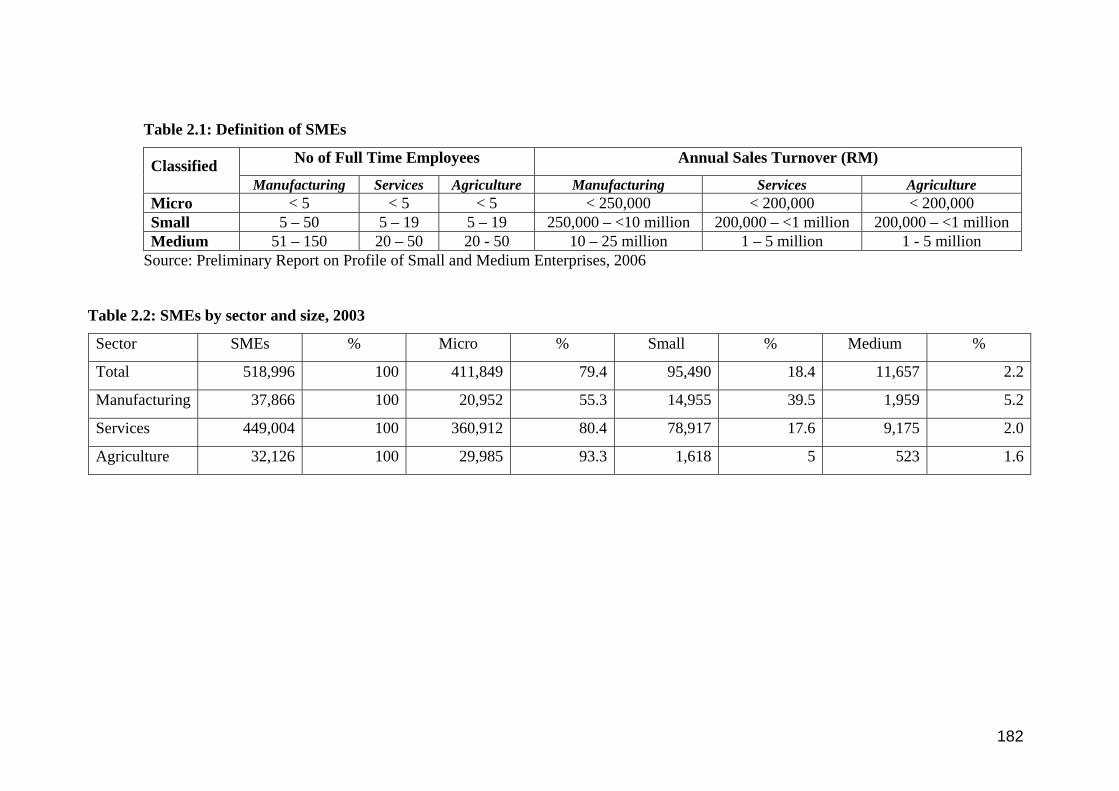
182
Table 2.1: Definition of SMEs
No of Full Time Employees Annual Sales Turnover (RM) Classified Manufacturing Services Agriculture Manufacturing Services Agriculture
Micro < 5 < 5 < 5 < 250,000 < 200,000 < 200,000 Small 5 – 50 5 – 19 5 – 19 250,000 – <10 million 200,000 – <1 million 200,000 – <1 million Medium 51 – 150 20 – 50 20 - 50 10 – 25 million 1 – 5 million 1 - 5 million
Source: Preliminary Report on Profile of Small and Medium Enterprises, 2006
Table 2.2: SMEs by sector and size, 2003
Sector SMEs % Micro % Small % Medium %
Total 518,996 100 411,849 79.4 95,490 18.4 11,657 2.2
Manufacturing 37,866 100 20,952 55.3 14,955 39.5 1,959 5.2
Services 449,004 100 360,912 80.4 78,917 17.6 9,175 2.0
Agriculture 32,126 100 29,985 93.3 1,618 5 523 1.6

183
Table 2.3: SMEs by sector, 2003
No of establishments Sector
Total SMEs Percentage (%)
Total 523,132 518,996 99.2
Services 451,516 449,004 99.4
Agriculture 32,397 32,126 99.2
Manufacturing 39,219 37,866 96.6
Source: Preliminary Report on Profile of Small and Medium Enterprises by Department of Statistics, 2006.
Since the Food Processing Industry falls under the manufacturing sector, hence the following discussions will be focused on SMEs in the manufacturing sector.
2.4 Overview of SMEs in the Manufacturing Sector
SMEs accounted for 96.6% (37,866) of the total establishments (39,219) in the manufacturing sector. In terms of size, 55 % (20,952) establishments were classified as micro, 40% and 5% as small and medium respectively (Chart 2.1)
Chart 2.1 : SMEs in manufacturing sector by size, 2003
Small40% Micro
55%
Medium5%
Source: Preliminary Report on Profile of Small and Medium Enterprises, 2006
2.4.1 SMEs in the Manufacturing Sector by State
Selangor accounted for the largest number of SMEs with 7,439 companies, followed by Johor 5,191 and W.P. Kuala Lumpur 5,136 companies. These three states collectively accounted for 47% of the total SMEs in the manufacturing sector (Table 2.4)
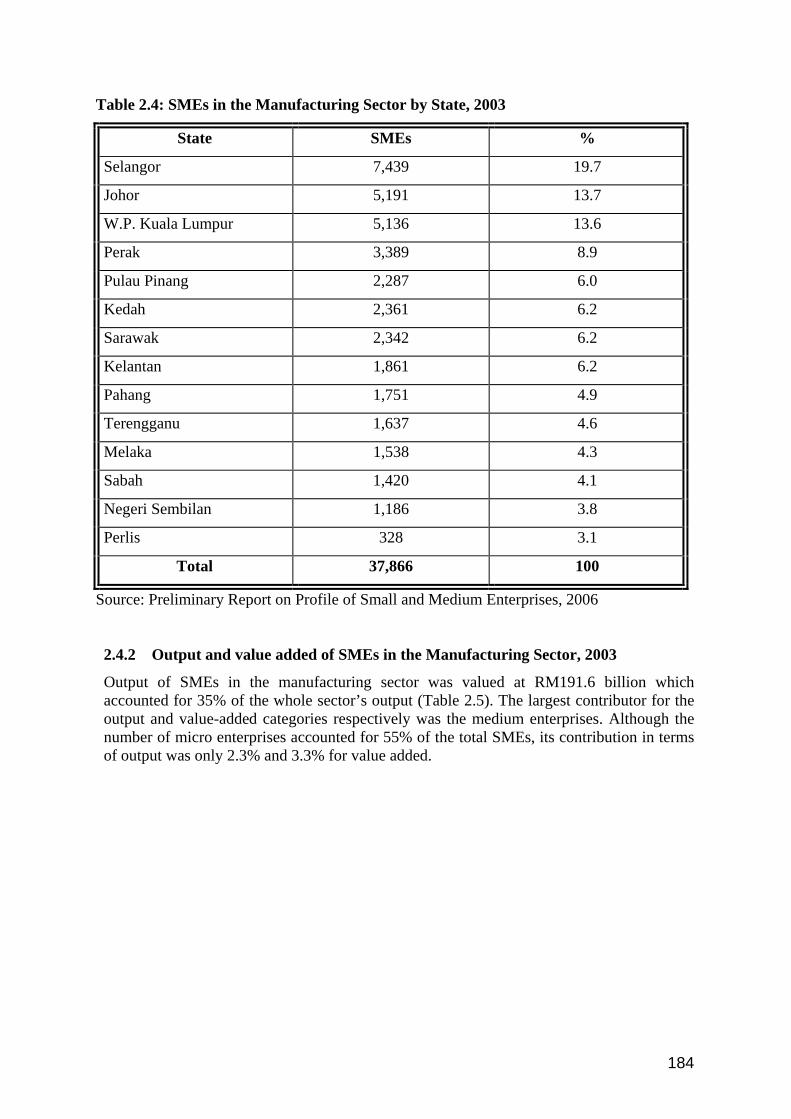
184
Table 2.4: SMEs in the Manufacturing Sector by State, 2003
State SMEs %
Selangor 7,439 19.7
Johor 5,191 13.7
W.P. Kuala Lumpur 5,136 13.6
Perak 3,389 8.9
Pulau Pinang 2,287 6.0
Kedah 2,361 6.2
Sarawak 2,342 6.2
Kelantan 1,861 6.2
Pahang 1,751 4.9
Terengganu 1,637 4.6
Melaka 1,538 4.3
Sabah 1,420 4.1
Negeri Sembilan 1,186 3.8
Perlis 328 3.1
Total 37,866 100
Source: Preliminary Report on Profile of Small and Medium Enterprises, 2006
2.4.2 Output and value added of SMEs in the Manufacturing Sector, 2003
Output of SMEs in the manufacturing sector was valued at RM191.6 billion which accounted for 35% of the whole sector’s output (Table 2.5). The largest contributor for the output and value-added categories respectively was the medium enterprises. Although the number of micro enterprises accounted for 55% of the total SMEs, its contribution in terms of output was only 2.3% and 3.3% for value added.

185
Table 2.5: Output and value added of SMEs in manufacturing sector by size, 2003
Size No of
enterprises
% Output
(RM billion)
% Value added
(RM billion)
%
Total SMEs 37,866 100 191.6 100 47.5 100
Micro 20,952 55 4.4 2.3 1.6 3
Small 14,955 40 68.1 36 21.6 46
Medium 1,959 5 119 62 24.2 51
Source: Preliminary Report on Profile of Small and Medium Enterprises, 2006
2.4.3 Number of SMEs establishments by segments in the manufacturing sector SMEs accounted for more than 90% of the total number of establishments in 10 of the segments shown in (Table 2.6)
Table 2.6 : No of establishments by segments in the manufacturing sector
Source: Preliminary Report on Profile of Small and Medium Enterprises, 2006
The presence of SMEs was most dominant in textiles and clothing’ segment, accounting for 8, 779 establishments in the manufacturing sector. This was followed by metal and non-metallic mineral products with 6,336 establishments and food products and beverages with 5,664 establishments (Chart 2.2). These three segments accounted for 55% of the total SMEs’ establishments in the manufacturing sector.
No. of establishments Segment
Total SMEs % of SMEs in manufacturing
Total 39,219 37,866 96.6 Food products & beverages 5,804 5,664 97.6 Textiles & clothing 8,855 8,779 99.1 Wood products 2,149 2,052 95.5 Paper & recorded media 3,549 3,483 98.1 Petroleum products 83 75 90.4 Chemical products 1,115 1,047 93.9 Rubber & plastic products 2,343 2,166 92.4 Metal & non-metallic mineral products 6,517 6,336 97.2 Machinery & equipment n.e.c 1,435 1,390 96.9 Office machinery 88 57 64.8 Electronics & other components 372 250 67.2 TV, radio transmitters & telephone 41 30 73.2 TV, radio Receivers & associated goods 191 142 74.3 Motor vehicles, parts & accessories 438 393 89.7 Furniture 2,352 2,286 97.2

186
Chart 2.2: SMEs in major manufacturing segments, 2003
23%
17%
15%
9% 6%
30%
Furniture2,286
Other sub-sectors11,318
Textile & clothings
8,779
Metal & non-metalilic mineral products
6,336
Food products & beverages
5,664
Paper & recorded media
3,483
Source: Preliminary Report on Profile of Small and Medium Enterprises, 2006
2.4.4 Output value of SMEs in the manufacturing sector
The highest SME contributor to the output of the manufacturing sector was from the food products and beverages segment, with RM84.4 billion followed by SMEs in the rubber and plastic products segment (Table 2.7).
Table 2.7: Output value of manufacturing sectors, 2003
Source: Preliminary Report on Profile of Small and Medium Enterprises, 2006
Output (RM billion) Segment
Total SMEs % of SMEs in manufacturing
Total 549.1 191.6 33.9 Food products & beverages 120.1 84.4 70.3 Textiles & clothing 12.6 4.7 37.2 Wood products 15.5 7.2 46.6 Paper & recorded media 14 7.3 52 Petroleum products 45.1 9.5 21 Chemical products 37.3 11.7 31.3 Rubber & plastic products 29.4 16.3 55.4 Metal & non-metallic mineral products 45.4 17.8 39.3 Machinery & equipment n.e.c 13.7 4.3 31.1 Office machinery 53.6 8.5 15.8 Electronics & other components 69.5 1.3 1.8 TV, radio transmitters & telephone 10.4 0.2 2.1 TV, radio Receivers & associated goods 24.1 0.5 2.6 Motor vehicles, parts & accessories 14.9 2.1 14.1 Furniture 8.4 4.1 49.1 Others 35.1 11.8 33.7

187
When some of these segments are grouped together, there are altogether 11 subsectors (Chart 2.3). Out of these eleven segments, SMEs from four segments dominate the manufacturing industry structure, i.e. food and beverages segment with 32%, chemicals and chemical product, 14%, metal and metal products, 13% and rubber and plastic products, 10%. Together, they account for 70% of the output generated by the SMEs.
13%10%
8%
5%4%
14%
32%7%
3%2% 2%
Food & Beverages Chemical & Chemical Products
Metal & Metal Products Rubber & Plastic Products
Wood Products Electrical & Electronic
Non Metallic Mineral Products Machinery & Equipment
Transport Equipment Textile & Apparels
Others
Chart 2.3: Share of output value by SMEs in the manufacturing sector, 2003
Source: SME Performance Report, 2005
2.4.5 SMEs Contribution to Total Value-Added in the Manufacturing Sector
SMEs generated about RM154 billion of value added (43.7% of the total manufacturing value added) despite of accounting for 99% of total business establishments. SMEs’ contribution of value added was the lowest in the manufacturing sector, accounting for 37%. This clearly indicates that LEs dominate this sector, in which 1,353 large enterprises contributed about 63% of total value added to this sector (SME Annual Report, 2005). Within the manufacturing sector, SMEs from the food and beverages segment generated the largest percentage with 22% followed by chemical and chemical products with 15%, metal and metal products with 13% and, rubber and plastic products with 12%. Collectively these four segments generated 62% of value added to this sector (Chart 2.4).

188
13%12%9%
6%
5%
15%
22%9%
4%2%
3%
Food & Beverages Chemical & Chemical Products
Metal & Metal Products Rubber & Plastic Products
Wood Products Electrical & Electronic
Non Metallic Mineral Products Machinery & Equipment
Transport Equipment Textile & Apparels
Others
Chart 2.4: Share of value added by SMEs in the manufacturing sector,2003
Source: SME Performance Report, 2005
2.4.6 Legal Status of SMEs establishments in the manufacturing sector
Sole proprietorship formed the largest group accounting for 69% of the total SMEs. This is followed by private limited (21%) and partnership (10%). The bulk of micro enterprises are in the form of sole proprietorship, while most of the small and medium enterprises are classified as private limited. The same scenario is depicted in the manufacturing sector. The majority of SMEs in the manufacturing sector operated as individual proprietorships, constituting 48% (18,312) of the total SMEs. SMEs which were private limited companies and partnerships accounted for 40% and 11% respectively.
Majority of the more than 18,000 individual proprietorship firms were classified as micro (86%), with only 18 firms (0.1%) were defined as medium size, while the remaining establishments were regarded as small (Table 2.8). On the other hand, private limited company establishments were dominated by small firms, accounting for about 70% of the 15,124 firms belonging to that legal status.
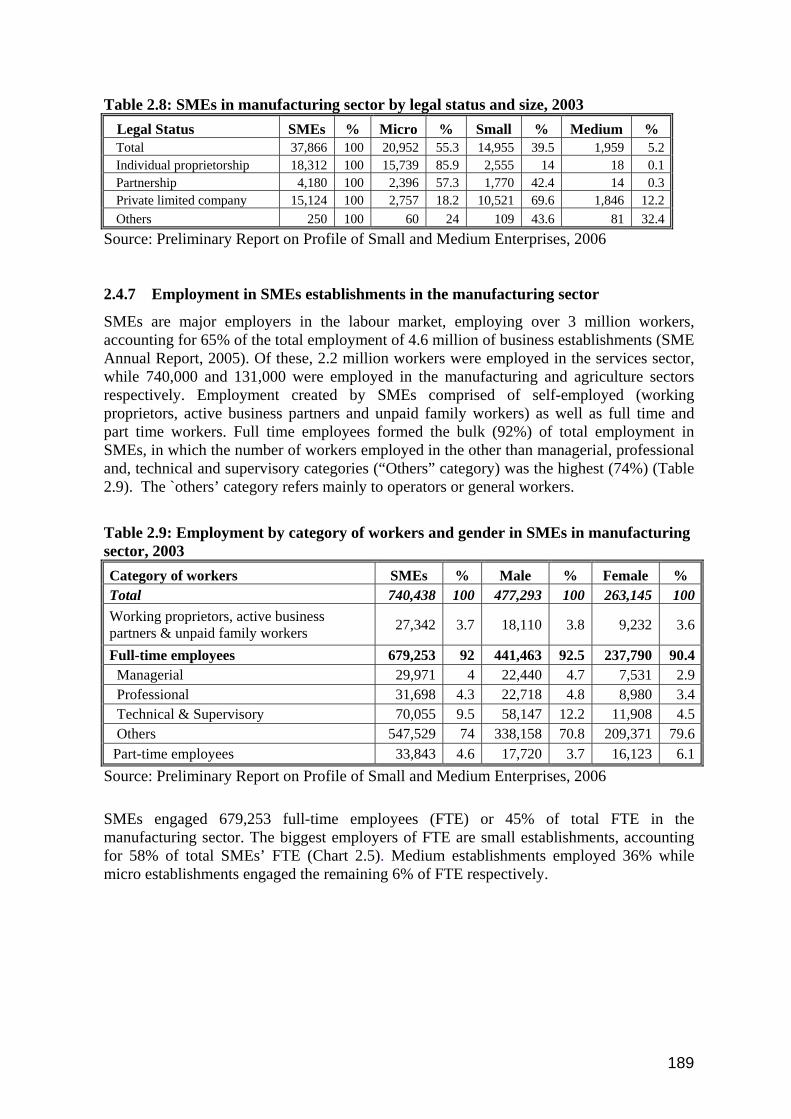
189
Table 2.8: SMEs in manufacturing sector by legal status and size, 2003
Legal Status SMEs % Micro % Small % Medium % Total 37,866 100 20,952 55.3 14,955 39.5 1,959 5.2 Individual proprietorship 18,312 100 15,739 85.9 2,555 14 18 0.1 Partnership 4,180 100 2,396 57.3 1,770 42.4 14 0.3 Private limited company 15,124 100 2,757 18.2 10,521 69.6 1,846 12.2 Others 250 100 60 24 109 43.6 81 32.4
Source: Preliminary Report on Profile of Small and Medium Enterprises, 2006
2.4.7 Employment in SMEs establishments in the manufacturing sector
SMEs are major employers in the labour market, employing over 3 million workers, accounting for 65% of the total employment of 4.6 million of business establishments (SME Annual Report, 2005). Of these, 2.2 million workers were employed in the services sector, while 740,000 and 131,000 were employed in the manufacturing and agriculture sectors respectively. Employment created by SMEs comprised of self-employed (working proprietors, active business partners and unpaid family workers) as well as full time and part time workers. Full time employees formed the bulk (92%) of total employment in SMEs, in which the number of workers employed in the other than managerial, professional and, technical and supervisory categories (“Others” category) was the highest (74%) (Table 2.9). The `others’ category refers mainly to operators or general workers.
Table 2.9: Employment by category of workers and gender in SMEs in manufacturing sector, 2003
Category of workers SMEs % Male % Female % Total 740,438 100 477,293 100 263,145 100Working proprietors, active business partners & unpaid family workers 27,342 3.7 18,110 3.8 9,232 3.6
Full-time employees 679,253 92 441,463 92.5 237,790 90.4 Managerial 29,971 4 22,440 4.7 7,531 2.9 Professional 31,698 4.3 22,718 4.8 8,980 3.4 Technical & Supervisory 70,055 9.5 58,147 12.2 11,908 4.5 Others 547,529 74 338,158 70.8 209,371 79.6 Part-time employees 33,843 4.6 17,720 3.7 16,123 6.1
Source: Preliminary Report on Profile of Small and Medium Enterprises, 2006
SMEs engaged 679,253 full-time employees (FTE) or 45% of total FTE in the manufacturing sector. The biggest employers of FTE are small establishments, accounting for 58% of total SMEs’ FTE (Chart 2.5). Medium establishments employed 36% while micro establishments engaged the remaining 6% of FTE respectively.

190
Chart 2.5: Employment in SMEs in manufacturing sector by size, 2003
76,640 (10.4%)
416,906 (56.3%)
246,892 (33.3%)
43,311 (6.4%)
394,861 (58.1%)
241,081 (35.5%)
0 100,000 200,000 300,000 400,000 500,000
Micro
Small
Medium
Total employment Full-time employees
Number ('000)
Source: Preliminary Report on Profile of Small and Medium Enterprises, 2006
The number of males employed by the SMEs are larger (65%) compared with females (35%). The percentage of males and females in the category working proprietors, active business partners and unpaid family workers was relatively similar, at 3.8% and 3.6% respectively, but the percentage of female workers (80%) employed in the “others” category is much higher than males working in the same category (74%). In terms of employment share in SMEs by segments, food and the beverages segment topped the list once again with 16%, followed by wood based products and furniture with 16%, metal and metal products, and, rubber and plastics products with 13% respectively (Chart 2.6). These five subs-sectors generate 65% of employment by SMEs in the manufacturing sector.

191
13%
13%7%
6%6%
16%
16%11%
5%
4%3%
Food & Beverages Wood Products & Furniture
Metal & Metal Products Rubber & Plastic Products
Textile & Apparels Chemical & Chemical Products
Electrical & Electronic Non Metallic Mineral Products
Machinery & Equipment Transport Equipment
Others
Chart 2.6: Employment share in SMEs by segments in the manufacturing sector Source: SME Performance Report 2005
2.4.8 Salaries and wages in SMEs in the manufacturing sector, 2003
SMEs in the manufacturing sector disbursed RM10.9 billion on salaries and wages, representing 39% of total salaries and wages paid out in this sector (Chart 2.7). Despite representing more than 50% of establishments, the micro firms’ contributions to the total wages and salaries paid in 2003 were only 5%, with the remaining 95% were attributed to small and medium size firms.

192
RM 4.5 billion 41%
RM 5.9 billion 54%
RM 0.5 billion 5%
Micro Small Medium
Chart 2.7: Salaries and wages in SMEs in the manufacturing sector, 2003
Source: Preliminary Report on Profile of Small and Medium Enterprises, 2006
2.4.9 SMEs’ Sources of Finance in the Manufacturing Sector
The prime source of financing accessed by majority of SMEs (34%) was via own internally generated funds (Table 2.10). Another 24% of the SMEs accessed borrowings from friends and family while only 16% of them sourced their financial need from financial institutions (commercial banks/finance companies and development financial institutions) (SME Annual Report, 2005). In the manufacturing sector, 34.4% of all SMEs accessed funds via own contributions or internally generated funds (Table 2.10). However, as the establishments grow in size, they tend to seek more financing from financial institutions.

193
Table 2.10: Sources of financing accessed by SMEs in the manufacturing sector, 2003
Source: Preliminary Report on Profile of Small and Medium Enterprises, 2006
Financial Sources SMEs % Micro % Small % Medium %
Total 518,996 100 411,849 100 95,490 100 11,657 100
Commercial banks/ finance companies 69,317 13.4 42,266 10.3 22,282 23.3 4,769 40.9
Own contribution/internally generated funds 176,325 34 129,444 31.4 42,376 44.4 4,505 38.6
Development financial institutions 14,060 2.7 11,764 2.9 2,024 2.1 272 2.3
Co-operatives 1,179 0.2 903 0.2 238 0.2 38 0.3
Government loans or grants 746 0.1 537 0.1 170 0.2 39 0.3
Bank Negara Malaysia
SME Special Funds 1,696 0.3 1,329 0.3 285 0.3 82 0.7
Borrowings from friends & family 122,411 23.6 101,461 24.6 19,794 20.7 1,156 9.9
Others 133,262 25.7 124,145 30.1 8,321 8.7 796 6.8

194
2.4.10 Problems faced by SMEs in accessing financing
Of the total 518,996 SME establishments from the manufacturing sector that participated in the Census of Establishment and Enterprise 2005, only about 1% of them responded to the difficulties faced in obtaining financing from financial institutions (Table 2.11). Lack of collateral was the main obstacle faced by SMEs (56%) when seeking financing from banking institutions (Chart 2.8). This is followed by insufficient loan documentation (12%), lack of financial track record (10%), long loan processing time (10%) as well as business viability (6%).
Table 2.11: Problems faced in accessing financing by SMEs, 2003
Problems Total % Lack of collateral 2,698 56 Insufficient documents to support loan application 559 12 No financial track record 465 10 Long loan processing time 401 8 Business plan deemed not viable by financial institutions 284 6 Existing non-performing loan/adverse track record 168 4 Lack of technical expertise by financial institutions to assess loan 85 2
Others 108 2 Total 4768 100
Source: Preliminary Report on Profile of Small and Medium Enterprises, 2006
12
10
8
6
4
2
2
56
0 20 40 60 80 100
Lack of collateral
Insufficient documents
No financial track record
Long loan processing time
Business plan deemed not viable
Bad track record
Lack of technical expertise by financialinstitutions to assess loan
Others
Prob
lem
s
Percentage (%)
Chart 2.8: Problems faced by SMEs in accessing financing, 2003
Source: Preliminary Report on Profile of Small and Medium Enterprises, 2006

195
2.4.11 Summary on SMEs in the Manufacturing Sector
The structure of output, value added and employment contributions by SMEs over the decade (1996-2005) are shown in Table 2.12. The food and beverages segment has the highest share contribution in the three key indicators, i.e. total output (33%), value added (22%) and employment (17%). Over the 9 year period, its value added share within the manufacturing sector has increased from 16% to 22%, an increase of 37.5%. Similarly, its employment share has increased by 31% (from 13% to 17%) over the same period. Low barriers to entry encourage SMEs to thrive in this segment. SMEs predominate in terms of number of establishments, output value and value added in industries such as bakery, vegetables and fruit canning, and seafood processing while cocoa, sugar and flour production tend to be undertaken by large firms (SME Performance Report 2005). The textiles and apparels segment has experienced a sharp decline while the chemicals and chemicals products as well as the metal and metal products segments have increased in share respectively.
Table 2.12: Distribution of SMEs by key indicators and segments, 2005 and 1996 Share 2005 (%) Share 1996 (%)
Indicator Sub- sectors
Total Output
Value Added Employment
Value Added Employment
Food & Beverages 33 22 17 16 13 Chemicals & Chemical Products 14 15 6 10 3
Metal & Metal Products 13 13 13 10 10 Rubber & Plastics Products 10 12 13 14 14 Wood & Wood Products Including Furniture 8 9 16 13 20
Electrical & Electronics 5 5 6 7 7 Non-metallic Mineral Products 4 6 5 5 4
Machinery & Equipment 3 4 4 4 4 Transport Equipment 2 2 3 3 3 Textiles & Apparels 2 3 7 5 9 Others 7 9 11 11 13 Total 100 100 100 100 100
Source: SME Performance Report 2005
Generally, SMEs have limited resources and capabilities and are dependent on public research institutes for advice and support in product and process improvements while the MNCs or LEs have their own established brands, possess greater financial resources and apply modern technology, including own in-house research and development (R&D) facilities.

196
3.0 Analysis and Discussion
3.1 Sauces, dressings and condiments segment
3.1.1 Background
In Malaysia, the demand for sauces, dressings and condiments is relatively high as Malaysian consumers connect home cooking with family attachment. However, the majority of Malaysians’ do not emphasize brand loyalty but rather price sensitivity. Nevertheless, this segment within the FPI has significant expansion potential as manufacturers are willing to venture into new products to generate interest. This segment’s product types is grouped into 2 categories, i.e. niche Western and mass market Asian. The Western types are mustard, salad dressing and pasta sauces while the Asian types are chilly sauces, ketchup, dipping and cooking sauces. Asian sauces are utilized to accompany a meal or to enhance the taste of food via seasonings or marinates. The demand for Asian products remains relatively stable as Asian cooking styles and eating habits incorporate many local sauces such as oyster and soy sauce. Nonetheless, the demand for Western type sauces, dressings and condiments such as salad dressings and pasta sauce has been growing as western food cooked or prepared at home, i.e. pasta and pizza is rising.
3.1.2 Current Status of Sauces, dressings and condiments segment in Malaysia
In year 2006, the export value of sauces and preparations, and mixed condiments, and mixed seasonings was RM223 million registering an average growth rate over a five year period (from 2001 -2006) at 17.6 per cent. The findings of Abu Kasim and Hamdzah (2003) depicted that with RM 126 million worth of products exported, the Malaysian sauces sector had a positive balance of trade valued at RM50 million in 2000. This food segment was one of the few food segments that registered a positive balance of trade, despite being dependent on imported raw materials. The retail sales of sauces, dressings and condiments increased from RM917 million in 2000 to RM1,050 million in 2006, depicting a sales increment of 14.6% with an annual average growth rate of 2.8% for the 5 year period (Table 3.1).
From period 2001 - 2006, pasta sauces posted strong growth in this segment with an average growth rate of 5.2 per cent per annum. The wide availability and acceptance of dried pasta contributed to the strong consumption of pasta sauce. Pasta dishes are relatively quick and easy to prepare compared to local delicacies. Purchasing pasta sauce in a bottle is a “quick fix” and convenient option as the time required to make a pasta meal becomes relatively easy and quick. The instruction on the pasta jar label explains the steps needed to fix a pasta meal and this makes it very convenient for practically anyone to prepare a pasta meal. The average growth rate of tomato pastes and purees from 2001 – 2006 came in second with 4.7 per cent per annum. The consumption of tomato pastes and purees was the highest in year 2006 and its sales growth rate for 2005 – 2006 period was 5.5 per cent. This clearly shows that once pasta becomes a regular dish in a household, consumers begin to prepare homemade pasta sauces with tomato pastes and purees to add variety.

197
Table 3.1 : Sales of Sauces, Dressings and Condiments by Subsector: Value 2001-2006 (RM million)
Subsector 2001 2002 2003 2004 2005 2006 *AGR
2005/06 *AGR
2001-06Changes (%)
2001/06 Tomato pastes and purées 5.3 5.5 5.7 6 6.3 6.6 5.5 4.7 25.9 Stock cubes 9.4 9.6 9.8 10 10.3 10.7 3.5 2.6 13.8 Gravy granules 6.3 6.4 6.5 6.7 6.9 7.1 3.5 2.6 13.8 Liquid stocks and fonds - - - - - - - - - Bouillon/stock cubes 15.7 16 16.3 16.7 17.2 17.8 3.5 2.6 13.8 Herbs and spices 391.5 403.2 407.2 415.4 427.8 442.8 3.5 2.5 13.1 Monosodium glutamate (MSG) 5.5 5.5 5.7 5.8 5.9 6 1.5 1.9 9.9 Chili sauces 68 69.6 72.4 74.6 76.4 79.1 3.5 3.1 16.3 Oyster sauces 38.6 40.6 41.4 42.4 43.7 45.3 3.5 3.2 17.2 Other table sauces 19.1 19.5 20 20.5 21.1 22.3 6 3.2 17 Table sauces 125.7 129.7 133.8 137.5 141.2 146.7 3.9 3.1 16.7 Soy based sauces 109.8 113.1 115.4 117.7 120.6 124.2 3 2.5 13.1 Pasta sauces 13.7 15 15.5 16.1 16.8 17.6 5 5.2 28.9 Wet/cooking sauces 103.2 107.3 109.4 112.7 116.7 121.3 4 3.3 17.6 Dry sauces/powder mixes - - - - - - - - - Ketchup 45.2 46.6 47.7 48.9 50.4 52.1 3.5 2.9 15.3 Regular mayonnaise 3.7 3.9 4 4.1 4.2 4.3 3.5 3.3 17.5 Low fat mayonnaise - - - - - - - - - Mayonnaise 3.7 3.9 4 4.1 4.2 4.3 3.5 3.3 17.5 Mustard - - - - - - - - - Regular salad dressings 5.9 6 6.3 6.6 6.8 7.2 5 4.2 22.7 Low fat salad dressings - - - - - - - - - Salad dressings 5.9 6 6.3 6.6 6.8 7.2 5 4.2 22.7 Vinaigrettes - - - - - - - - - Dips - - - - - - - - - Pickled products 29.7 29.8 30.2 30.7 31.3 32.2 3 1.6 8.4 Other sauces, dressings and condiments 61.9 64.9 66.3 67.6 69.3 71.4 3 2.9 15.3 Total 916.6 946.5 963.4 985.6 1,014.50 1,050.40 3.5 2.8 14.6 Source: Euromonitor International 2007 Notes: * Current value growth (%) ** Current average value growth (%) *** Total average value growth (%)

198
The other table sauces emerged as the most dynamic sub-segments with sales growth of 6 per cent in 2006, despite starting low. The most common types are shrimp paste (belacan), rojak and satay sauces. These types of products are well established in the economy and very popular amongst Malaysians. There are many players competing in the market due to low cost of production and high demand. Consumers do not exhibit strong brand preference and tend to purchase any brands that are available on the shelves. Other types of sauces, dressings, condiments grew marginally over a 5 year period (2001-2006). Sustained demand for chili sauces, ketchup, stock cubes, pickled products, soy based sauces, monosodium glutamate and herbs and spices assisted in maintaining sales volume. Soy based sauces grew in proportion with the population growth rate as these products can be found in almost every household of different ethnic groups. Sales of oyster sauces are starting to pick up as consumers begin to savor its taste and use it as a cooking ingredient. The wet/cooking sauces are also gaining in momentum as its sales growth was the highest in 2005/2006 compared to previous years with a 4.0 per cent growth. The product range within the wet/cooking sauces is wide and it continues to expand to cater to the increasingly fast-paced lifestyles and multi-ethnic population of Malaysia. Demand for ready-mixes wet/cooking sauces are increasing as these products reduces the cooking time of a meal. The most popular type is curry followed by sweet and sour, teriyaki and black bean (Table 3.2). Demand for curry meals is gaining momentum due to its exotic and exquisite tastes but making a curry meal from scratch is time consuming. Hence, a ready mix curry sauce is indeed a hassle-free fix that is appealing and convenient.
Table 3.2 : Wet Sauces Percentage Breakdown by Type, 2004-2006 (% Sales)
Wet sauces 2004 2005 2006 Black bean 13 11 10 Char siu 4 5 5 Curry 27 26 25.5 Lemon 10 9 9.5 Plum 10 9 9 Sweet & sour 18 19 19 Teriyaki 9 11 11.5 Others 9 10 10.5 Total 100 100 100 Source: Euromonitor International 2007
3.1.3 Market Structure analysis
3.1.3.1 Concentration ratio
In measuring the Concentration Ratio for Malaysian sauces, dressings and condiments segment, the market share of sales was used (Table 3.3). The four-firm concentration ratio (CR4) is the sum of market shares of the four largest firms in the industry to the total market share, i.e.
4 CR4 = ∑ Si i=1
CR4 = Market Share (Nestle + Sing Long + Lee Kum Kee + Zara)

199
Table 3.3 : Sauces, Dressings and Condiments Company Shares based on Sales, 2001-2005 (%)
Company 2001 2002 2003 2004 2005 AVG* 2001-2005
Nestlé (M) Bhd 14.7 14.7 14.8 15.0 14.8 14.8 Sing Long Foodstuff Trading Co Pte Ltd 9.7 9.8 9.9 10.2 10.1 10.0 Lee Kum Kee (M) Sdn Bhd 4.4 4.7 4.8 5.0 5.0 4.8 Zara Foodstuff Industries Sdn Bhd 3.5 3.5 3.0 2.9 2.9 3.1 McCormick & Co Inc 2.1 2.1 2.3 2.3 2.5 2.3 Campbell Soup Southeast Asia Sdn Bhd 2.5 2.5 2.5 2.5 2.5 2.5 Kikkoman (S) Pte Ltd 2.4 2.4 2.3 2.3 2.4 2.3 Adabi Consumer Industries Sdn Bhd 1.8 1.8 1.9 1.9 2.0 1.9 Masterfoods of Australia Pty Ltd 1.6 1.6 1.4 1.6 1.9 1.6 Tong Foong Sauce Factory Sdn Bhd 2.0 2.0 1.9 1.9 1.7 1.9 Unilever (M) Holdings Sdn Bhd 1.4 1.4 1.4 1.4 1.4 1.4 Yeo Hiap Seng (M) Bhd 1.1 1.1 1.2 1.2 1.2 1.2 Sri Nona Food Industries Sdn Bhd 1.0 1.2 1.2 1.2 1.1 1.1 Dewina Sdn Bhd 0.6 0.6 0.6 0.6 0.7 0.6 Ajinomoto (Malaysia) Sdn Bhd 0.6 0.5 0.5 0.5 0.5 0.5 Kraft Foods (Malaysia) Sdn Bhd 0.3 0.3 0.3 0.3 0.3 0.3 Del Monte Asia Pte Ltd 0.2 0.2 0.2 0.2 0.2 0.2 Simplot Co, J R 0.2 0.2 0.2 0.2 0.2 0.2 S & W Fine Foods Inc 0.1 0.1 0.1 0.2 0.2 0.1 Clouet, A & Co (KL) Sdn Bhd 1.4 0.8 0.4 0.1 0.1 0.6 ConAgra Foods Inc 0.1 0.1 0.1 0.1 0.1 0.1 Generics 13.7 13.6 13.5 13.6 13.6 13.6 Private Label 6.4 6.3 6.3 5.4 5.0 5.9 Others 28.4 28.3 29.1 29.3 29.8 29.0 Total 100 100 100 100 100 100 Note: AVG* - Average Source: Adapted from Euromonitor, 2007

200
Since CR4 for the Malaysian Sauces, Dressings and Condiments segment is in the range of 25–50 percent over 5 year period 2001-2005, hence it can be deduced that this segment is slightly concentrated within the Malaysian Food and Beverage Sector of the Food Processing Industry (Table 3.4 and Chart 3.1). During the period reviewed, the company with the largest market share is Nestle (M) Bhd with an average of 14.8 per cent while the fourth ranked company is Lee Kum Kee with an average of 3.1 percent, depicting a 11.7 per cent gap.
Table 3.4: Four Largest Companies’ Market Shares in Malaysia’s Sauces, Dressings and Condiments Segment 2001-2005 (%) Company 2001 2002 2003 2004 2005Nestlé (M) Bhd 14.7 14.7 14.8 15 14.8 Sing Long Foodstuff Trading Co Pte Ltd 9.7 9.8 9.9 10.2 10.1
Lee Kum Kee (M) Sdn Bhd 4.4 4.7 4.8 4.9 5 Zara Foodstuff Industries Sdn Bhd 3.5 3.5 3.0 2.9 2.9 CR4 32 33 32 33 33
Source: Adapted from Euromonitor 2007
05
101520253035
2001 2002 2003 2004 2005Y ear
Per
cent
age
(%)
Nestlé (M) Bhd Sing Long Foodstuff Trading Co Pte Ltd Lee Kum Kee (M) Sdn Bhd Zara Foodstuff Industries Sdn Bhd CR4
Chart 3.1 : Four Largest Companies’ Market Shares in Malaysia’s Sauces, Dressings and Condiments Segment 2001-2005 (%) Source: Adapted: Euromonitor 2007
A four brand ratio (CR4) in which the sum of market shares of the four largest brands in the industry to the total market share was also carried out to determine the status of the four largest brands in the sauces, dressings and condiments segment (Table 3.5). It was found that the computation of the (CR4) of the four largest brands conforms to the

201
findings of (CR4) of the four largest firms in the industry (Table 3.6 and Chart 3.2) in which is in the range of 25-50 per cent, indicating that this segment is slightly concentrated within the Malaysian Food and Beverage Sector of the Food Processing Industry.
Table 3.6 : Four Largest Brands’ Market Shares in Malaysia’s Sauces, Dressings and Condiments Segment 2001-2005 (%)
Source: Adapted from Euromonitor International 2007
0
5
10
15
20
25
30
35
2002 2003 2004 2005
Maggi Sing Long Lee Kum Kee Habhal's CR4
Chart 3.2: Four Largest Brands’ Market Shares in Malaysia’s Sauces, Dressings and Condiments Segment 2001-2005 (%)
Source: Adapted from Euromonitor International 2007
Brand Company 2002 2003 2004 2005Maggi Nestlé (M) Bhd 14.7 14.8 15.0 14.8
Sing Long Sing Long Foodstuff Trading Co Pte Ltd 9.4 9.4 9.7 9.6
Lee Kum Kee Lee Kum Kee (M) Sdn Bhd 4.7 4.8 4.9 5.0Habhal's Zara Foodstuff Industries Sdn Bhd 3.5 3.0 2.9 2.9CR4 CR4 32.3 32.0 32.5 32.3

202
Table 3.5: Sales of Sauces, Dressings and Condiments by Subsector: Value 2001-2006 (RM million)
Subsector 2001 2002 2003 2004 2005 2006 *AGR
2005/06*AGR
2001-06Changes (%)
2001/06 Tomato pastes and purées 5.3 5.5 5.7 6 6.3 6.6 5.5 4.7 25.9 Stock cubes 9.4 9.6 9.8 10 10.3 10.7 3.5 2.6 13.8 Gravy granules 6.3 6.4 6.5 6.7 6.9 7.1 3.5 2.6 13.8 Liquid stocks and fonds - - - - - - - - - Bouillon/stock cubes 15.7 16 16.3 16.7 17.2 17.8 3.5 2.6 13.8 Herbs and spices 391.5 403.2 407.2 415.4 427.8 442.8 3.5 2.5 13.1 Monosodium glutamate (MSG) 5.5 5.5 5.7 5.8 5.9 6 1.5 1.9 9.9 Chili sauces 68 69.6 72.4 74.6 76.4 79.1 3.5 3.1 16.3 Oyster sauces 38.6 40.6 41.4 42.4 43.7 45.3 3.5 3.2 17.2 Other table sauces 19.1 19.5 20 20.5 21.1 22.3 6 3.2 17 Table sauces 125.7 129.7 133.8 137.5 141.2 146.7 3.9 3.1 16.7 Soy based sauces 109.8 113.1 115.4 117.7 120.6 124.2 3 2.5 13.1 Pasta sauces 13.7 15 15.5 16.1 16.8 17.6 5 5.2 28.9 Wet/cooking sauces 103.2 107.3 109.4 112.7 116.7 121.3 4 3.3 17.6 Dry sauces/powder mixes - - - - - - - - - Ketchup 45.2 46.6 47.7 48.9 50.4 52.1 3.5 2.9 15.3 Regular mayonnaise 3.7 3.9 4 4.1 4.2 4.3 3.5 3.3 17.5 Low fat mayonnaise - - - - - - - - - Mayonnaise 3.7 3.9 4 4.1 4.2 4.3 3.5 3.3 17.5 Mustard - - - - - - - - - Regular salad dressings 5.9 6 6.3 6.6 6.8 7.2 5 4.2 22.7 Low fat salad dressings - - - - - - - - - Salad dressings 5.9 6 6.3 6.6 6.8 7.2 5 4.2 22.7 Vinaigrettes - - - - - - - - - Dips - - - - - - - - - Pickled products 29.7 29.8 30.2 30.7 31.3 32.2 3 1.6 8.4 Other sauces, dressings and condiments 61.9 64.9 66.3 67.6 69.3 71.4 3 2.9 15.3 Total 916.6 946.5 963.4 985.6 1,014.50 1,050.40 3.5 2.8 14.6 Source: Euromonitor International 2007 Notes: * Current value growth (%) ** Current average value growth (%) *** Total average value growth (%)
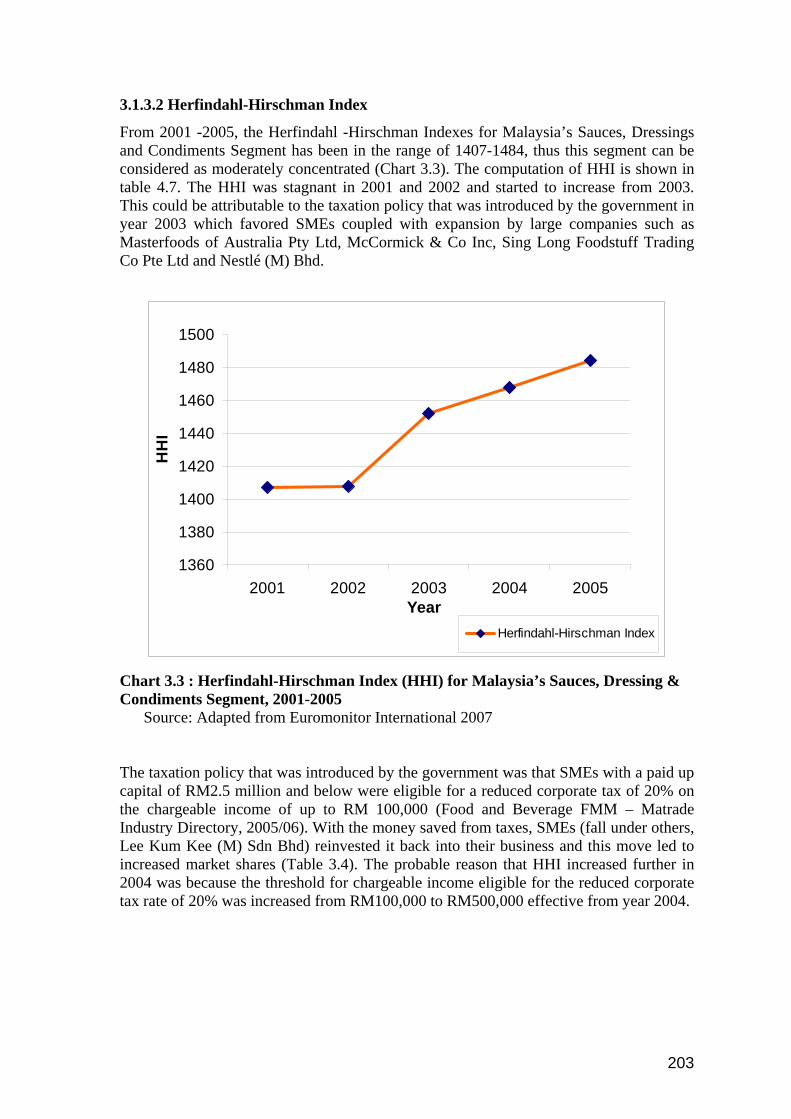
203
3.1.3.2 Herfindahl-Hirschman Index
From 2001 -2005, the Herfindahl -Hirschman Indexes for Malaysia’s Sauces, Dressings and Condiments Segment has been in the range of 1407-1484, thus this segment can be considered as moderately concentrated (Chart 3.3). The computation of HHI is shown in table 4.7. The HHI was stagnant in 2001 and 2002 and started to increase from 2003. This could be attributable to the taxation policy that was introduced by the government in year 2003 which favored SMEs coupled with expansion by large companies such as Masterfoods of Australia Pty Ltd, McCormick & Co Inc, Sing Long Foodstuff Trading Co Pte Ltd and Nestlé (M) Bhd.
1360
1380
1400
1420
1440
1460
1480
1500
2001 2002 2003 2004 2005Year
HH
I
Herfindahl-Hirschman Index
Chart 3.3 : Herfindahl-Hirschman Index (HHI) for Malaysia’s Sauces, Dressing & Condiments Segment, 2001-2005
Source: Adapted from Euromonitor International 2007
The taxation policy that was introduced by the government was that SMEs with a paid up capital of RM2.5 million and below were eligible for a reduced corporate tax of 20% on the chargeable income of up to RM 100,000 (Food and Beverage FMM – Matrade Industry Directory, 2005/06). With the money saved from taxes, SMEs (fall under others, Lee Kum Kee (M) Sdn Bhd) reinvested it back into their business and this move led to increased market shares (Table 3.4). The probable reason that HHI increased further in 2004 was because the threshold for chargeable income eligible for the reduced corporate tax rate of 20% was increased from RM100,000 to RM500,000 effective from year 2004.

204
Table 3.7: Computation of HHI for the Sauces, Dressings and Condiments Company Shares based on Sales, 2001-2005 (%) Company 2001 2002 2003 2004 2005 Nestlé (M) Bhd 216 216 220 225 219 Sing Long Foodstuff Trading Co Pte Ltd 95 97 98 103 103 Lee Kum Kee (M) Sdn Bhd 19 22 23 25 25 Zara Foodstuff Industries Sdn Bhd 12 12 9 9 8 McCormick & Co Inc 5 5 5 5 6 Campbell Soup Southeast Asia Sdn Bhd 6 6 6 6 6 Kikkoman (S) Pte Ltd 6 6 5 5 6 Adabi Consumer Industries Sdn Bhd 3 3 4 4 4 Masterfoods of Australia Pty Ltd 3 3 2 3 3 Tong Foong Sauce Factory Sdn Bhd 4 4 4 3 3 Unilever (M) Holdings Sdn Bhd 2 2 2 2 2 Yeo Hiap Seng (M) Bhd 1 1 1 2 1 Sri Nona Food Industries Sdn Bhd 1 1 1 1 1 Dewina Sdn Bhd 0 0 0 0 0 Ajinomoto (Malaysia) Sdn Bhd 0 0 0 0 0 Kraft Foods (Malaysia) Sdn Bhd 0 0 0 0 0 Del Monte Asia Pte Ltd 0 0 0 0 0 Simplot Co, J R 0 0 0 0 0 S & W Fine Foods Inc 0 0 0 0 0 Clouet, A & Co (KL) Sdn Bhd 2 1 0 0 0 ConAgra Foods Inc 0 0 0 0 0 Generics 187 185 181 186 186 Private Label 41 40 40 29 25 Others 805 803 849 860 885 Total 1407 1408 1452 1468 1484
Source: Adapted from Euromonitor 2007
3.1.3.3 Technology Technology for sauces, dressings and condiments are readily available Malaysia. Large enterprises carry out their own research and development in generating technologies for their own utilization and production and thus, the technologies that are generated by public research agencies institutions such as Malaysian Agricultural Research and Development Institute (MARDI) or universities are for the benefit of SMEs. MARDI as the research and development agency for Ministry of Agriculture and Agro-based Industries conducts courses for entrepreneurs involved in the sauces and condiments segment of the FPI and for future entrepreneurs. It also provides extension and guidance services to existing SMEs in almost all aspect of production. SMEs are anticipated to undertake some basic research and products development from MARDI via adaptation process as it is believed that the ability to undertake in house R&D will assist SMEs attain business success. They pursue adaptation efforts in product formulation as
205
major research such as new product development is beyond their capability and capacity due to no or limited budget allocation, low retained earning and non-existence of human expertise. SMEs depends on public research agencies for any R&D undertakings since these agencies are non-profit organizations, thus cost charges, if any is very minimal (Abu Kasim, 2003). 3.1.3.4 Raw Materials Although the growth of food processing industry in Malaysia is very much supported by the excellent infrastructures, good government policies, incentives, regulation and programs, local supply of raw materials pose a major problem to this industry. This is due to various reasons:
i) Producers inability to adopt strategies that are flexible and arimed at meeting changes in market demands
ii) Farming operations are mainly manual as the utilization of modern machinery and equipment is low
iii) Most of agriculture land is dominated by estate crops leaving marginal areas for production of agro-based raw materials
iv) Producers lack the knowledge of market information and thus rarely plan their production according to market needs. This inevitably exposes them with problems of over supply or under supply, which leads to huge amount of losses
v) Scattered and uneconomic production plot size affects the farm productivity vi) Low capital investment vii) Lack of technical information leads to poor land and crop management viii) Producers are unwilling to seek assistance, knowledge and information from
government related advisory agencies. Given the above scenario, a concerted effort was undertaken by the Lembaga Pertubuhan Peladang (LPP) to organize and match the requirements of both entities (producers and food processors) such that a win-win situation can be achieved. Contract farming has been recommended as one of the operational action plan under the organized raw material supply and commercial raw material production strategies. It is a win-win action plan whereby the implementation will benefit both farmer and food producer. LPP has been given the task to execute the action plan, i.e. identifying and organizing the potential farmers who are willing to offer full commitment to produce by providing technical and advisory assistance. This agency also acts as a coordinating body to ensure that supply of raw materials matches market needs and that price secured and quantity sold will yield some economic benefit to the farmers. The discussion that follows, i.e. matching raw materials with market needs will only be focused on four product categories as they rely heavily on raw materials that can be produced locally. There are 236 SMEs (MoA Inc.) producing various types of bottled sauces (Abu Kasim, 2003). Their present requirement for various types of red chilly is 8,300 metric tones as depicted in table 4.8 below. Chilly as raw material for sauces is being supplied by local independent farmers and farmers managed by LPP. Requirement for pineapple and papaya up to year 2007 is also depicted in table 3.8. Through various value adding programs, Ministry of Agriculture and Agro-based Industries is aiming towards
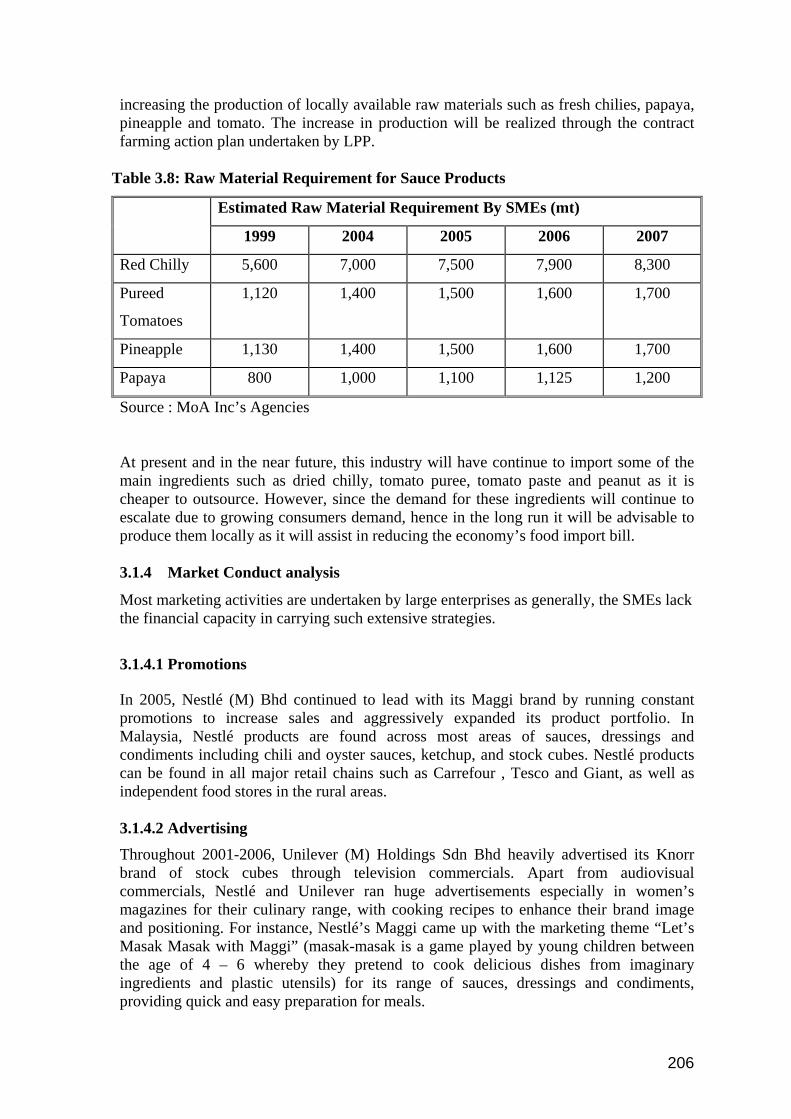
206
increasing the production of locally available raw materials such as fresh chilies, papaya, pineapple and tomato. The increase in production will be realized through the contract farming action plan undertaken by LPP.
Table 3.8: Raw Material Requirement for Sauce Products
Estimated Raw Material Requirement By SMEs (mt)
1999 2004 2005 2006 2007
Red Chilly 5,600 7,000 7,500 7,900 8,300
Pureed
Tomatoes
1,120 1,400 1,500 1,600 1,700
Pineapple 1,130 1,400 1,500 1,600 1,700
Papaya 800 1,000 1,100 1,125 1,200
Source : MoA Inc’s Agencies
At present and in the near future, this industry will have continue to import some of the main ingredients such as dried chilly, tomato puree, tomato paste and peanut as it is cheaper to outsource. However, since the demand for these ingredients will continue to escalate due to growing consumers demand, hence in the long run it will be advisable to produce them locally as it will assist in reducing the economy’s food import bill. 3.1.4 Market Conduct analysis
Most marketing activities are undertaken by large enterprises as generally, the SMEs lack the financial capacity in carrying such extensive strategies.
3.1.4.1 Promotions
In 2005, Nestlé (M) Bhd continued to lead with its Maggi brand by running constant promotions to increase sales and aggressively expanded its product portfolio. In Malaysia, Nestlé products are found across most areas of sauces, dressings and condiments including chili and oyster sauces, ketchup, and stock cubes. Nestlé products can be found in all major retail chains such as Carrefour , Tesco and Giant, as well as independent food stores in the rural areas. 3.1.4.2 Advertising
Throughout 2001-2006, Unilever (M) Holdings Sdn Bhd heavily advertised its Knorr brand of stock cubes through television commercials. Apart from audiovisual commercials, Nestlé and Unilever ran huge advertisements especially in women’s magazines for their culinary range, with cooking recipes to enhance their brand image and positioning. For instance, Nestlé’s Maggi came up with the marketing theme “Let’s Masak Masak with Maggi” (masak-masak is a game played by young children between the age of 4 – 6 whereby they pretend to cook delicious dishes from imaginary ingredients and plastic utensils) for its range of sauces, dressings and condiments, providing quick and easy preparation for meals.

207
3.1.4.3 New product development Sauces, dressings and condiments saw various new product developments throughout 2001-2006. New brands were introduced including Telly (mayonnaise, tartar sauce, wet/cooking sauces and herbs and spices) and XiFu (herbs and spices). Nestlé also introduced a healthier range of Hari-Hari Favourites wet/cooking sauces with no added monosodium glutamate and less salt. Campbell Soup Southeast Asia Sdn Bhd launched Kimball Kuali Delights wet/cooking sauces in 2005. 3.1.5. Market Performance Analysis In the absent of cross-sectional data and the sensitivity or rather difficulty in obtaining the data needed to measure the market performance, we used a case study approach to resolve the problems. A few representative sauces factory were surveyed and specific data related to its performance were collected. Ideally, profit after tax and interest (PATI) should be used to measure performance, but these information’s especially taxes were not relevant as the factory surveyed fell under small and micro industry. They were not required to pay corporate taxes. Thus profit before taxes and interest (PBTI) are used to measure their performance.
3.1.5.1 Return on Sales (ROS)
This is a measure of how effective or efficient a firm manages its input factors that can determine its profitability level. The return on sales as shown in Table 3.9 ranged from 10% to 32%, which was comparable with the industry standard. Based on data from the 2004 industrial survey by the Statistics Department, the ROS for products category `Man of sauces including flavoring extracts such as MSG’ (Code 15596) was 30%. The survey covered or represented all firms’ sizes. Thus, in terms of profitability, the performance of sauces SMEs were relatively commendable. Our study also revealed that SMEs generally did not use their resources efficiently especially with regard to capital utilization. The average technical efficiency (TE) found in the 1995 study was 0.28. This index indicated that the firms were operating at only 28% of what the best firm can achieved. Taking ROI as a proxy for TE, the efficiency and productivity of sauces SMEs in Malaysia may not improve very much over the years. Sauces SMEs were relatively capital intensive with share of capital to sales aver 70% for all the sample firms. Share of labor to sales can be as low as 17% (company B) which showed a trend towards more mechanization and automation in the industry. This could be due to aggressive campaign by government agencies for SMEs to enhance their processing facilities in order to turn out product that can meet with the quality standard both for domestic and export market.

208
Table 3.9: Performance of sauces producer: Return on sales (ROS) Company Yearly Sales (RM) PBTI (RM) Return on Sales (%)
A 4,195,920 423,940 10 (73)
B 583,000 188,000 32 (83)
C 481,760 78,600 16 (72)
D 623,660 192,710 31 (71)
E 8,588,000 1,791,100 21 (73)
Note: 1. Figure in bracket represent share of capital to sales 2. A comprehensive study in 1995 revealed that the average technical efficiency
(TE) of sauce SMI in Malaysia was 0.28
3.1.5.2 Return on Asset (ROA) This ratio indicates the return on fixed assets of an enterprise. High ratio (percentage) indicates high return on investment in fixed assets and vice-versa. The ROA as shown in Table 3.10 ranged from 29% to 59% compared to 42% calculated for the whole sub-sector from the 2004 industrial survey data. Three of the five sample firms had ROA higher than the industry standard. Although there were some disparity in the ROA among firms, in terms of overall returns, the performance sauces SMEs were relatively commendable. Table 3.10: Performance of sauces producer: Return on Asset (ROA) Company Fixed Asset (RM) PBTI (RM) Return on Asset (%)
A 793,000 423,940 53
B 500,500 188,000 38
C 326,130 78,600 29
D 192,710 192,710 59
E 3,669,500 1,791,100 49

209
3.2 Sweet and Savory Snacks Segment
3.2.1 Introduction
The sweet and savory snacks segment has gone through some changes over the years with the development of new products, catering to consumers demands. Presently, it is grouped into three broad categories: i) baked snacks – cookies, crackers, pies, tortillas ii) salted snacks – potato chips, corn chips, popcorn, nuts iii) specialty snacks – extruded snacks, dried fruit, pizza, ice cream novelties,
yogurt. Malaysia has a relatively young population, with over 30% under 15 years of age and over 40% in the 15-39 years age group. The younger generation of the population has a significant impact upon sweet and savory snacks sales as the core consumer group is children and teenagers (Euromonitor 2007). Sweet and savory snacks experienced growth of 5 per cent in volume and 4 per cent in value terms reaching RM518 million in 2006 (Table 3.11). Among all sub-sectors of the sweet and savory snacks segment, the chips/crisps registered strongest sales growth from 2001- 2006. Its sales was RM67 million in 2001 and increased to RM92 million in 2006, registering an average growth rate of 6.3 percent. Its sales growth was also the highest from 2005-2006, registering a growth rate of 5.3%. Fruit snacks also registered a similar growth rate during this period. However, the sales value of fruit snacks is very much lower than chips/crips. This is probably attributable to the fact that aggressive marketing strategies were pursued by key players in this sub-segment to drive higher sales coupled with consumers’ preference towards potato based products.
Popcorn is a niche product in Malaysia with limited impact on the sweet and savory snacks sector. One of the main factors impeding popcorn is the wide availability of lower priced freshly made popcorn sold in most mobile kiosks and cinemas. Although microwave ovens are still not common household appliances in Malaysia – especially among the low- and middle-income group – it is expected that microwave popcorn will become more established because the majority of microwave oven users exist in urban areas.
In 2006, the volume growth of sweet and savory snacks outperformed value growth (Table 3.12). This was largely due to the product promotion undertaken by retailers. Retailers engaged in price war and bonus pack promotion such as a free extra 20 per cent of product quantity for every 85g pack size offered. Since the sweet and savory snacks is in its matured stage in the product development life cycle, most manufacturers are eager to maintain their volume share, as such to assist them, retailers kept prices low so that they were able to increase their retail distribution share, which led to increase in manufacturers volume share.

210
Table 3.12: Sales Volume and Value Growth of Sweet and Savory Snacks by Subsector: 2005/2006 (%)
Subsector % volume
growth % value growth
Fruit snacks 5 5.5 Chips/crisps 6 5.5 Extruded snacks 5.5 5 Tortilla/corn chips 4.5 5 Popcorn 3.5 4 Pretzels - Nuts 4 3.5 Other sweet and savoury snacks 3 2.5 Total 4.5 4.3 Source: Euromonitor 2007
While most types of sweet and savory snacks remained relatively stable over the review period, sales of healthier products like fruit snacks, nuts and tortilla/corn chips are expected to grow, benefiting from the general trend towards consumption of healthier, natural snacks, especially among older consumers.
In Malaysia, other sweet and savory are popular among Malaysians because the main component of this category is various nut-related products such as green peas, sugared cuttlefish strips, jelly, pudding, fish and prawn crackers. Jelly and pudding are particularly popular with children.
Processed potato remained the main type of extruded snacks as while other popular extruded snacks are corn-based snacks, fish crackers, prawn crackers and rice crackers. These local product variants are immensely popular because they are widely available from local players and are sold at street stalls at low prices.

211
Table 3.11: Sales of Sweet and Savory Snacks by Subsector: Value 2001-2006 (RM million)
Subsector 2001 2002 2003 2004 2005 2006 *AGR
2005/06 *AGR
2001-06 Changes (%)
2001/06 Fruit snacks 30.7 32.2 33.5 34.7 36.4 38.4 5.5 4.6 25.2 Chips/crisps 67.4 70 76.9 82.7 87.6 92.4 5.5 6.5 37.2 Extruded snacks 112.4 117.5 128.9 136.6 144.1 151.3 5 6.1 34.6 Tortilla/corn chips 25.5 27.4 29.7 31.5 33.2 34.9 5 6.5 36.8 Popcorn 10.9 11.5 11.7 12.1 12.5 13 4 3.5 18.7 Nuts 69.6 75 76.5 78.4 80.8 83.6 3.5 3.7 20 Other sweet and savoury snacks 97.1 96 97.9 99.4 101.4 103.9 2.5 1.4 7 Total 413.6 429.6 455.1 475.2 496 517.5 4.3 4.6 25.1
Source: Euromonitor International 2007 Notes: * Current value growth (%) ** Current average value growth (%) *** Total average value growth (%)

212
3.2.2 Market Structure Malaysian manufacturers lead in sweet and savory snacks segment. There are also imported brands such as Lay’s and Ruffles but their contribution remains small due to their premium prices. 3.2.2.1 Concentration ratio
In measuring the Concentration Ratio for Malaysian sweet and savory snacks segment, the market share of sales was used (Table 3.13). The four-firm concentration ratio (CR4) is the sum of market shares of the four largest firms in the industry to the total market share, i.e.
4 CR4 = ∑ Si i=1
The concentration ratio for this processing segment is as below: CR4 = Market Share (Britannia + Mamees + URC + Procter & Gamble)
Since CR4 for the Malaysian Sweet and Savory Snacks segment is in the range of 25–50 percent over 5 year period 2001-2005, hence it can be deduced that this segment is slightly concentrated within the Malaysian Food and Beverage Sector of the Food Processing Industry (Table 3.14 and Chart 3.4). During the period reviewed, the company with the largest market share is Britannia Brands (Malaysia) Sdn Bhd with an average of 11.6 per cent, followed by Kilang Makanan Mames Sdn Bhd, with average of 8 per cent. The third and fourth ranked companies are URC Snack Foods (M) Sdn Bhd and Procter & Gamble (M) Sdn Bhd, with an average of 8.4 and 6.4 percent respectively.
Table 3.14: Four Largest Companies’ Market Shares in Malaysia’s Sweet and Savory Snacks Segment 2001-2005 (%) Company 2001 2002 2003 2004 2005Britannia Brands (Malaysia) Sdn Bhd 10.9 11.2 11.8 11.9 12.4 Kilang Makanan Mames Sdn Bhd 7.3 7.5 7.9 8.6 8.7 URC Snack Foods (M) Sdn Bhd 8.2 8.2 8.5 8.7 8.5 Procter & Gamble (M) Sdn Bhd 6.3 6 6.4 6.6 6.5 CR4 32.7 32.9 34.6 35.8 36.1
Source: Adapted from Euromonitor International 2007

213
Table 3.13: Sweet and Savoury Snacks Company Shares based on Sales, 2001-2005 (%)
Company 2001 2002 2003 2004 2005 AVG* 2001-
2005 AGR** 2004/05 Britannia Brands (Malaysia) Sdn Bhd 10.9 11.2 11.8 11.9 12.4 11.64 3.2 Kilang Makanan Mames Sdn Bhd 7.3 7.5 7.9 8.6 8.7 8 4.4 URC Snack Foods (M) Sdn Bhd 8.2 8.2 8.5 8.7 8.5 8.42 0.9 Procter & Gamble (M) Sdn Bhd 6.3 6 6.4 6.6 6.5 6.36 0.8 Tong Garden Snack Foods Sdn Bhd 4.1 4.4 4.2 4.2 4.2 4.22 0.6 JC Food & Snacks Malaysia Sdn Bhd 2.3 2.3 2.3 2.6 2.5 2.4 2.1 Ngan Yun Groundnut Factory Sdn Bhd 1.8 1.9 1.8 1.8 1.8 1.82 0.0 Frito-Lay Co 1.8 1.7 1.8 1.6 1.7 1.72 -1.4 Thong Thye Groundnut Factory Sdn Bhd 1.6 1.7 1.6 1.6 1.6 1.62 0.0 Sunsweet Growers Inc 0.7 0.8 1 1.2 1.2 0.98 13.5 Kee Wee Hup Kee Trading (M) Sdn Bhd 1.9 1.6 1.3 1.1 1.1 1.4 -13.7 NOI Food Products Sdn Bhd 0.9 0.9 0.9 0.9 1 0.92 2.6 Sun-Maid Growers Inc 0.7 0.7 0.8 0.9 1 0.82 8.9 Liberty Gold Fruit Co Inc 0.7 0.8 0.8 0.9 0.9 0.82 6.3 Kraft Foods (Malaysia) Sdn Bhd 1.2 1.3 1.1 0.8 0.8 1.04 -10.1 Oriental Food Industries Sdn Bhd 0.6 0.6 0.6 0.7 0.7 0.64 3.9 Kettle Foods Inc 0.3 0.3 0.3 0.3 0.4 0.32 7.2 Heritage Murgerbon Ltd 0.5 0.6 0.5 0.4 0.3 0.46 -12.8 Seng Hua Hng Foodstuffs Pte Ltd 0.2 0.2 0.3 0.3 0.3 0.26 10.1 Sing Aik Seng Sdn Bhd 0.4 0.4 0.4 0.3 0.2 0.34 -17.3 Kong Heong Yuen Groundnut Factory Sdn Bhd 0.3 0.3 0.3 0.2 0.2 0.26 -10.1 Central Vista (M) Sdn Bhd 0.4 0.4 0.3 0.1 0.1 0.26 -34.7 RA-PPB (Tops) Retail Sdn Bhd 0.6 0.6 0.3 - - 0.3 - The Hain Celestial Group Inc 0.2 0.2 0.1 - - 0.1 - Hwa Tai Food Industries (M) Sdn Bhd 0.2 0.2 0.1 - - 0.1 - Private Label 2.4 2.4 2.5 2.3 2.4 2.4 0.0 Others 43.7 42.9 42.1 41.7 41.5 42.38 -1.3 Total 100 100 100 100 100 100 0.0
Note: AVG* – Average AGR** - Annual Growth Rate Source: Adapted from Euromonitor 2007
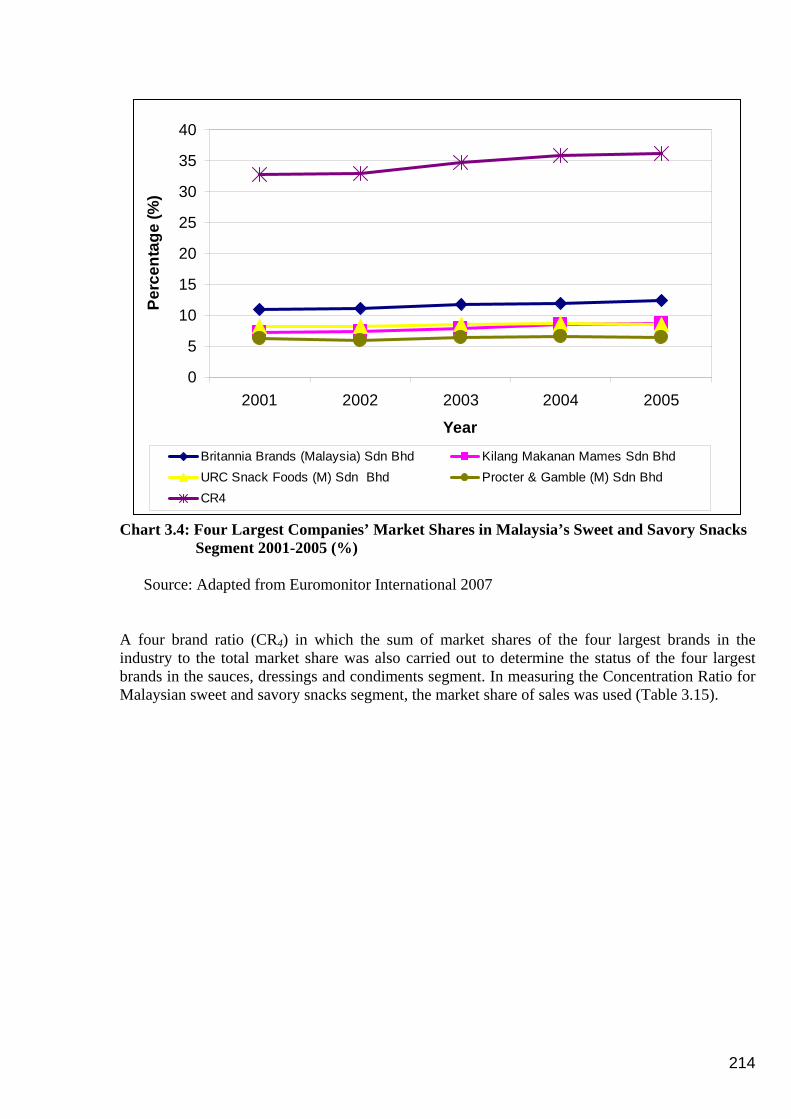
214
0
5
10
15
20
25
30
35
40
2001 2002 2003 2004 2005
Year
Perc
enta
ge (%
)
Britannia Brands (Malaysia) Sdn Bhd Kilang Makanan Mames Sdn BhdURC Snack Foods (M) Sdn Bhd Procter & Gamble (M) Sdn BhdCR4
Chart 3.4: Four Largest Companies’ Market Shares in Malaysia’s Sweet and Savory Snacks Segment 2001-2005 (%)
Source: Adapted from Euromonitor International 2007
A four brand ratio (CR4) in which the sum of market shares of the four largest brands in the industry to the total market share was also carried out to determine the status of the four largest brands in the sauces, dressings and condiments segment. In measuring the Concentration Ratio for Malaysian sweet and savory snacks segment, the market share of sales was used (Table 3.15).
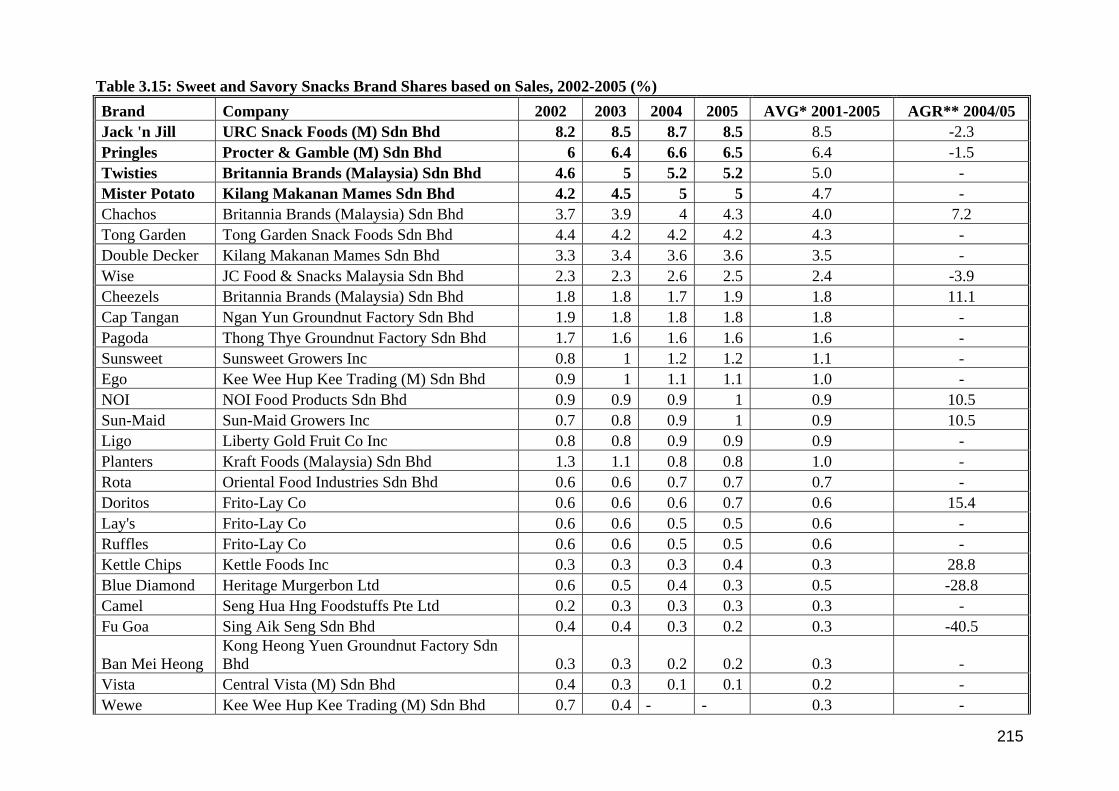
215
Table 3.15: Sweet and Savory Snacks Brand Shares based on Sales, 2002-2005 (%) Brand Company 2002 2003 2004 2005 AVG* 2001-2005 AGR** 2004/05 Jack 'n Jill URC Snack Foods (M) Sdn Bhd 8.2 8.5 8.7 8.5 8.5 -2.3 Pringles Procter & Gamble (M) Sdn Bhd 6 6.4 6.6 6.5 6.4 -1.5 Twisties Britannia Brands (Malaysia) Sdn Bhd 4.6 5 5.2 5.2 5.0 - Mister Potato Kilang Makanan Mames Sdn Bhd 4.2 4.5 5 5 4.7 - Chachos Britannia Brands (Malaysia) Sdn Bhd 3.7 3.9 4 4.3 4.0 7.2 Tong Garden Tong Garden Snack Foods Sdn Bhd 4.4 4.2 4.2 4.2 4.3 - Double Decker Kilang Makanan Mames Sdn Bhd 3.3 3.4 3.6 3.6 3.5 - Wise JC Food & Snacks Malaysia Sdn Bhd 2.3 2.3 2.6 2.5 2.4 -3.9 Cheezels Britannia Brands (Malaysia) Sdn Bhd 1.8 1.8 1.7 1.9 1.8 11.1 Cap Tangan Ngan Yun Groundnut Factory Sdn Bhd 1.9 1.8 1.8 1.8 1.8 - Pagoda Thong Thye Groundnut Factory Sdn Bhd 1.7 1.6 1.6 1.6 1.6 - Sunsweet Sunsweet Growers Inc 0.8 1 1.2 1.2 1.1 - Ego Kee Wee Hup Kee Trading (M) Sdn Bhd 0.9 1 1.1 1.1 1.0 - NOI NOI Food Products Sdn Bhd 0.9 0.9 0.9 1 0.9 10.5 Sun-Maid Sun-Maid Growers Inc 0.7 0.8 0.9 1 0.9 10.5 Ligo Liberty Gold Fruit Co Inc 0.8 0.8 0.9 0.9 0.9 - Planters Kraft Foods (Malaysia) Sdn Bhd 1.3 1.1 0.8 0.8 1.0 - Rota Oriental Food Industries Sdn Bhd 0.6 0.6 0.7 0.7 0.7 - Doritos Frito-Lay Co 0.6 0.6 0.6 0.7 0.6 15.4 Lay's Frito-Lay Co 0.6 0.6 0.5 0.5 0.6 - Ruffles Frito-Lay Co 0.6 0.6 0.5 0.5 0.6 - Kettle Chips Kettle Foods Inc 0.3 0.3 0.3 0.4 0.3 28.8 Blue Diamond Heritage Murgerbon Ltd 0.6 0.5 0.4 0.3 0.5 -28.8 Camel Seng Hua Hng Foodstuffs Pte Ltd 0.2 0.3 0.3 0.3 0.3 - Fu Goa Sing Aik Seng Sdn Bhd 0.4 0.4 0.3 0.2 0.3 -40.5
Ban Mei Heong Kong Heong Yuen Groundnut Factory Sdn Bhd 0.3 0.3 0.2 0.2 0.3 -
Vista Central Vista (M) Sdn Bhd 0.4 0.3 0.1 0.1 0.2 - Wewe Kee Wee Hup Kee Trading (M) Sdn Bhd 0.7 0.4 - - 0.3 -
216
Brand Company 2002 2003 2004 2005 AVG* 2001-2005 AGR** 2004/05 Tops RA-PPB (Tops) Retail Sdn Bhd 0.6 0.3 - - 0.2 - Hwa Tai Hwa Tai Food Industries (M) Sdn Bhd 0.2 0.1 - - 0.1 - Terra The Hain Celestial Group Inc 0.2 0.1 - - 0.1 - Private label 2.4 2.5 2.3 2.4 2.4 4.3 Others 44 43.2 42.7 42.5 43.1 -0.5 Total 100 100 100 100 100
Source: Adapted from Euromonitor International 2007
*AVG – Average
** AGR – Average Growth Rate
Table 3.16: Four Largest Brands’ Market Shares in Malaysia’s Sweet and Savory Snacks Segment 2002-2005 (%)
Source: Adapted from Euromonitor International 2007
Brand Company 2002 2003 2004 2005 Jack 'n Jill URC Snack Foods (M) Sdn Bhd 8.2 8.5 8.7 8.5Pringles Procter & Gamble (M) Sdn Bhd 6 6.4 6.6 6.5Twisties Britannia Brands (Malaysia) Sdn Bhd 4.6 5 5.2 5.2Mister Potato Kilang Makanan Mames Sdn Bhd 4.2 4.5 5 5CR4 CR4 23 24.4 25.5 25.2

217
It was found that the computation of the (CR4) of the four largest brands (Table 3.16 and Chart 3.5) conforms to the findings of (CR4) of the four largest firms in the industry in which is in the range of 25-50 per cent, indicating that this segment is slightly concentrated within the Malaysian Food and Beverage Sector of the Food Processing Industry.
0
5
10
15
20
25
30
2002 2003 2004 2005
Year
Perc
enta
ge (%
)
Jack 'n Jill URC Snack Foods (M) Sdn Bhd Pringles Procter & Gamble (M) Sdn Bhd
Twisties Britannia Brands (Malaysia) Sdn Bhd Mister Potato Kilang Makanan Mames Sdn Bhd
CR4 CR4
Chart 3.5: Four Largest Brands’ Market Shares in Malaysia’s Sweet and Savory Snacks Segment 2002-2005 (%)
3.2.2.2 Herfindahl-Hirschman Index
From 2001 -2005, the Herfindahl -Hirschman Indexes for Malaysia’s Sweet and Savory Segment has been in the range of HHI more than 1800, indicating that this segment is highly concentrated (Chart 3.6). The computation of HHI is shown in table 3.17. The HHI was high (2235) in 2001 and it gradually decreased (2112) in 2005. This indicates that the competition within this segment is growing and the opportunities for SMEs to further develop are great.
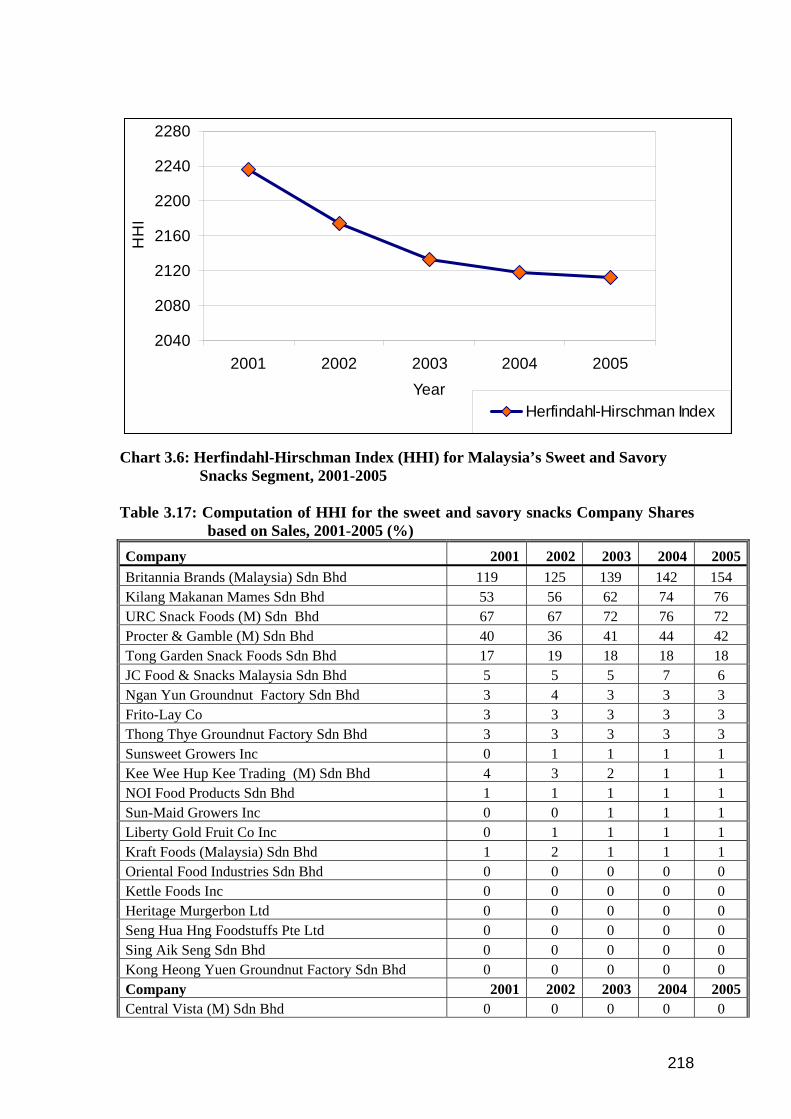
218
2040
2080
2120
2160
2200
2240
2280
2001 2002 2003 2004 2005Year
HH
I
Herfindahl-Hirschman Index
Chart 3.6: Herfindahl-Hirschman Index (HHI) for Malaysia’s Sweet and Savory Snacks Segment, 2001-2005
Table 3.17: Computation of HHI for the sweet and savory snacks Company Shares
based on Sales, 2001-2005 (%) Company 2001 2002 2003 2004 2005Britannia Brands (Malaysia) Sdn Bhd 119 125 139 142 154 Kilang Makanan Mames Sdn Bhd 53 56 62 74 76 URC Snack Foods (M) Sdn Bhd 67 67 72 76 72 Procter & Gamble (M) Sdn Bhd 40 36 41 44 42 Tong Garden Snack Foods Sdn Bhd 17 19 18 18 18 JC Food & Snacks Malaysia Sdn Bhd 5 5 5 7 6 Ngan Yun Groundnut Factory Sdn Bhd 3 4 3 3 3 Frito-Lay Co 3 3 3 3 3 Thong Thye Groundnut Factory Sdn Bhd 3 3 3 3 3 Sunsweet Growers Inc 0 1 1 1 1 Kee Wee Hup Kee Trading (M) Sdn Bhd 4 3 2 1 1 NOI Food Products Sdn Bhd 1 1 1 1 1 Sun-Maid Growers Inc 0 0 1 1 1 Liberty Gold Fruit Co Inc 0 1 1 1 1 Kraft Foods (Malaysia) Sdn Bhd 1 2 1 1 1 Oriental Food Industries Sdn Bhd 0 0 0 0 0 Kettle Foods Inc 0 0 0 0 0 Heritage Murgerbon Ltd 0 0 0 0 0 Seng Hua Hng Foodstuffs Pte Ltd 0 0 0 0 0 Sing Aik Seng Sdn Bhd 0 0 0 0 0 Kong Heong Yuen Groundnut Factory Sdn Bhd 0 0 0 0 0 Company 2001 2002 2003 2004 2005Central Vista (M) Sdn Bhd 0 0 0 0 0

219
RA-PPB (Tops) Retail Sdn Bhd 0 0 0 - - The Hain Celestial Group Inc 0 0 0 - - Hwa Tai Food Industries (M) Sdn Bhd 0 0 0 - - Private Label 6 6 6 5 6 Others 1910 1840 1772 1739 1722 Total 2235 2174 2133 2118 2112
3.2.2.3 Technology
Technology for snacks and chips are readily available Malaysia. Large enterprises carry out their own research and development or outsource in generating technologies for their own utilization and production and thus, the technologies that are generated by public research agencies institutions such as Malaysian Agricultural Research and Development Institute (MARDI) or universities are for the benefit of SMEs. MARDI’s competency in generating technology pertaining to the snacks and chips industry is comparable with that of private sectors. However, it is still weak in areas of packaging technology, product presentation and some aspect of processing of which both the hardware (machines/equipment) and software (human resource, i.e. graphic designers) needs upgrading.
3.2.2.4 Raw materials
Processors of snacks and chips products use both imported and locally produced raw materials. The strategic alliance between raw materials producers and snack and chips producers could lead to a win-win situation whereby processors can be assured of consistent supply of raw materials while farmers receive reasonable price for their produce (Abu Kasim, 2005) Contract farming has been recommended as one of the operational action plan under the organized raw material supply and commercial raw material production strategies. It is a win-win action plan whereby the implementation will benefit both farmer and food producer. LPP has been given the task to execute the action plan, i.e. identifying and organizing the potential farmers who are willing to offer full commitment to produce by providing technical and advisory assistance. This agency also acts as a coordinating body to ensure that supply of raw materials matches market needs and that price secured and quantity sold will yield some economic benefit to the farmers. The discussion that follows, i.e. matching raw materials with market needs will only be focused on five products as their raw materials can be produced locally.
There are about 1,100 SMEs producing snacks and chips products under supervision of Ministry of Agriculture and Agro-based Industries (Abu Kasim, 205). They mainly concentrate on production of chips made from banana, sweet potatoes, yam and tapioca. Processing methods involves peeling slicing, frying and glazing. Presently only about 2,780 mt of tapioca, 4804 mt of sweet potato and 700 mt of yam was produced by farmers. It is envisage that LPP will play a crucial role in ensuring continuous supply of raw materials to the SMEs.
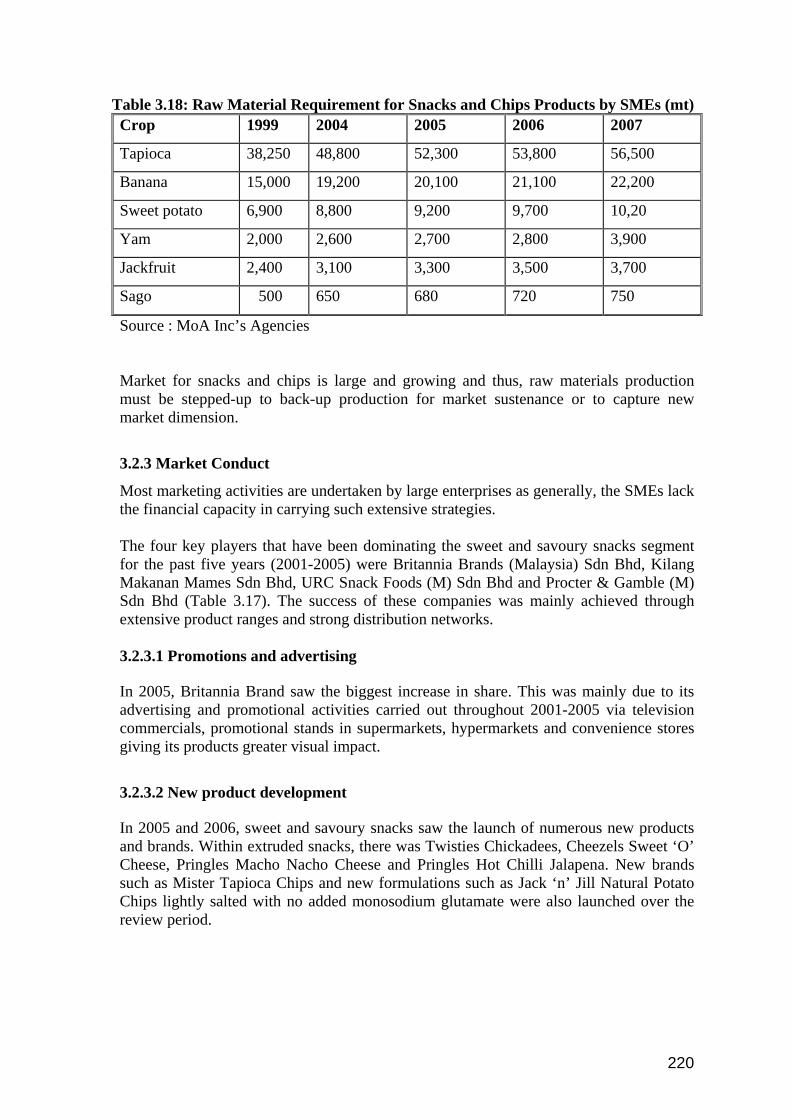
220
Table 3.18: Raw Material Requirement for Snacks and Chips Products by SMEs (mt) Crop 1999 2004 2005 2006 2007
Tapioca 38,250 48,800 52,300 53,800 56,500
Banana 15,000 19,200 20,100 21,100 22,200
Sweet potato 6,900 8,800 9,200 9,700 10,20
Yam 2,000 2,600 2,700 2,800 3,900
Jackfruit 2,400 3,100 3,300 3,500 3,700
Sago 500 650 680 720 750
Source : MoA Inc’s Agencies
Market for snacks and chips is large and growing and thus, raw materials production must be stepped-up to back-up production for market sustenance or to capture new market dimension.
3.2.3 Market Conduct
Most marketing activities are undertaken by large enterprises as generally, the SMEs lack the financial capacity in carrying such extensive strategies. The four key players that have been dominating the sweet and savoury snacks segment for the past five years (2001-2005) were Britannia Brands (Malaysia) Sdn Bhd, Kilang Makanan Mames Sdn Bhd, URC Snack Foods (M) Sdn Bhd and Procter & Gamble (M) Sdn Bhd (Table 3.17). The success of these companies was mainly achieved through extensive product ranges and strong distribution networks. 3.2.3.1 Promotions and advertising
In 2005, Britannia Brand saw the biggest increase in share. This was mainly due to its advertising and promotional activities carried out throughout 2001-2005 via television commercials, promotional stands in supermarkets, hypermarkets and convenience stores giving its products greater visual impact.
3.2.3.2 New product development
In 2005 and 2006, sweet and savoury snacks saw the launch of numerous new products and brands. Within extruded snacks, there was Twisties Chickadees, Cheezels Sweet ‘O’ Cheese, Pringles Macho Nacho Cheese and Pringles Hot Chilli Jalapena. New brands such as Mister Tapioca Chips and new formulations such as Jack ‘n’ Jill Natural Potato Chips lightly salted with no added monosodium glutamate were also launched over the review period.

221
3.2.4 Market Performance
Similar to the case of sauces sub-sector we used a case study approach to resolve the problems of limited availability of published data to measure performance. A few representative processors / factories that primarily manufacture crackers based on local raw material (tapioca, banana) were surveyed and specific data related to its performance were collected. Ideally, profit after tax and interest (PATI) should be used to measure performance, but these information’s especially taxes were not relevant as the factory surveyed fell under small and micro industry. They were not required to pay corporate taxes. Thus profit before taxes and interest (PBTI) are used to measure their performance.
3.2.4.1 Return on Sales (ROS)
The return on sales for the sample crackers firms that used primarily local raw materials were shown in Table 3.19 ranged from 15% to 42%, which was comparable with the industry standard. ROS calculated from 2004 data of the industrial survey by the Statistics Department for products category ` Manufacture of snack: cracker/chips (prawn, fish, potato/banana/tapioca’ (Code 15497) was 24%. As mentioned earlier the survey covered or represented all firms’ sizes. Thus, in terms of profitability, the performance of local material based crackers SMEs were relatively good. Crackers (kerepek) SMEs were relatively capital intensive with share of capital to sales aver 60% for majority of the sample firms with the exception of one which had share of capital at about 29%. The firms obviously lack fund to invest in new machineries. Share of labor to sales can be as low as 18% (company E). This firm had invested in new equipment and had succeeded in exporting a small portion of their products.
Table 3.19: Performance of a traditional cracker/chip producer: Return on sales (ROS)
Company Yearly Sales (RM) PBTI (RM) Return on Sales (%)
A 2,700,000 450,000 15 (70)
B 1,250,000 250,000 20 (64)
C 200,000 35,000 18 (29)
D 847,760 355,000 42 (57)
E 2,500,000 600,000 24 (82)
Note: 1. Figure in bracket represent share of capital to sales 3.2.4.2 Return on Asset (ROA) The ROA as shown in Table 3.20 ranged from 40% to 143% compared to 38% calculated for the whole sub-sector from the 2004 industrial survey data. All the five sample firms had ROA higher than the industry standard. There were large variation in the ROA among firms which indicated different level of machine and labor intensity within the industry. However, in terms of overall returns, their performances were very excellent. In other word assets were utilize efficiently.

222
Table 3.20: Performance of sauces producer: Return on Asset (ROA) Company Fixed Asset (RM) PBTI (RM) Return on Asset (%)
A 500,000 450,000 90
B 300,000 250,000 83
C 25,000 35,000 140
D 248,500 355,000 143
E 1,500,000 600,000 40
4.0 Conclusion
Sauces and crackers manufacturing in the Malaysian food processing sectors are highly fragmented, encompasses of Multinational Corporations (MNCs), big size locally established factories, SMEs and numerous `micro establishments’. Barrier to entry into these manufacturing business are relatively low in term of investment and technology know-how. While the MNCs and large firms were able to venture the export markets, many SMEs were left to compete among themselves in order to increase sales within the domestic market. Currently the industry is enjoying external economies which mean that the aggregate industrial’s cost curves drop along their entire lengths as the industry grows. As the industry grows, financing and transportation becomes cheaper, raw material will also becomes cheaper as they are supplied in larger quantity and skills of labour force improve as the result of the spread of training. It can be summarized that the industry is experiencing decrease in prices of some inputs and increase in physical productivities of some of these inputs. The sauces, condiments and dressing segment are slightly concentrated while the concentration level of the snacks and chips segment is gradually decreasing. In both segments, it was found that marketing activities are carried out extensively by large enterprises, technology utilized by large enterprises are generated by their own R & D unit or outsourced while SMEs depend heavily on public institutions on generating technologies. For firms that produce crackers using local raw materials, the production and supply of the materials are still inadequate and inconsistent. The competition in the FPI is not regulated, thus competition within this sector is unhealthy. Large companies such as Nestle thrive under Malaysia’s economic condition while SMEs are deprived of the chance to increase their sales growth in order to sustain in the industry. With the enormous funds generated by large companies, they are able to venture into innovative technological advancements and develop new products.
5.0 Policy Recommendation
The challenges and issues faced by the SME sector in this economy are basically the same. Thus, some recommendations put forward here can also be considered for SME sectors other than food. The recommendation focuses mainly on institutions and SMEs capability and capacity building.

223
Generally, the study indicated that both the sauces, condiments and dressing segment as well as snacks and chips are slightly concentrated, although it is gradually decreasing for the later segment. The financial muscle of large national MNCs such as Brittania and Nestle had enabled them to dominate the domestic market through new product innovation and extensive marketing initiatives. This scenario will have implication on the development of SMEs within the sectors. In this respect, the following policy options are recommended:
1. A cohesive and coordinated effort is critical in developing the food SMEs into competitive business. Presently, there are many ministries and agencies responsible to the development of SMEs. In the case of food, besides The Ministry of Agriculture and Agro-based Industries (MOA), Ministry of Trade and Industry (MITI), Ministry of Entrepreneurial Development and Cooperation (MEDC), Ministry of Rural and Regional Development (KKLW) and various other ministries and agencies are involved. It is crucial that the roles and responsibilities of the relevant ministries and agencies to be reviewed to avoid duplication of function and ensure government resources are utilized efficiently.
2. In view of the development framework of SMEs in Malaysia being fragmented, it is proposed that a dedicated Central SME agency be established. This agency will be responsible to coordinate all the efforts by various ministries and agencies. Additionally, it shall formulate and develop key performance indicator (KPI) for the purpose of monitoring the performance of SMEs; serve as a `one stop information centre’ for SME, and provide advisory and consultancy services, especially in management (non – technical aspect) to SMEs.
3. Generally, the food sub-sectors (sauces and crackers) under study are relatively concentrated with CR4 slightly above 30. This is normal in all developed and developing countries. There is also almost no barrier to enter the industry due to the relatively simple technology and low initial investment. Many SME firms producing similar products encounter stiff market and price competition. It is envisaged that Malaysia requires a national competition policy. At the moment competition is only regulated at certain sectors in the economy (Table 5.1). The presence of a competition policy in the food and beverages segment will assist in accelerating the development and growth of SMEs and this will create a healthy competitive environment for the benefit of consumers. A fair competitive environment is a prerequisite for the survival and development of SMEs. Continued efforts in strengthening regulatory policy environment, and in establishing rules and regulations conforming as far as possible to international practices are required. Creating transparent policies and regulations for the development of SMEs’ are crucial and must remain a top national priority.
4. Although the contribution of capital to sales was higher than labor, most the firms surveyed showed that the lack certain critical machineries such as packaging, drying and frying equipment. These equipments are crucial in enhancing production capacity and product quality. Since SMEs lack financial resources, the government, through SME agency can consider matching grant scheme.

224
Granting full or outright grant should be avoided as experiences demonstrate that it usually lead to inefficiency, wastage and less commitment from the recipient.
5. Food SMEs still have to face tight capital fund situation and the limited market for their finished products. Efficiency improvement is possible through improved mechanization and automation to ease labour problems, which require more capital injection in the form of loans or grants from the relevant agencies. Market access can also help the industry in minimizing underutilization of resources that will lead to better efficiency level. The SMEs need support particularly in marketing and technology aspects. In marketing, an aggressive advertising campaign and promotion of products would be possible through funding by FAMA using a common brand. This may lead to better market penetration especially to the level of super and hypermarkets. However, to maintain and improve the market position, a continuous product development is vital, which is only possible through conducting contract research in collaboration with the research institutions because R&D is generally beyond the capacity and capability of small and medium scale industries.
6. The government intervention will continue to be an important element to support food SMEs development. The success of SME in Germany, Japan, Taiwan and Korea are mainly due to prudent and favourable government policy and legislations toward SMEs. However, the current pressure to comply with WTO and AFTA agreements entail the government to be creative to find alternative measures to continue supporting the SMEs.

225
Table 5.1: Sectoral Regulation in Malaysia
Sector
Regulatory Agency
Legislation
Type of Regulation
Distributive Trade
• Ministry of Domestic Trade and Consumer Affairs (MDTCA)
• Consumer Protection Act 1999, Price Control Act 1946
• Supply Control Act 1961
• Prices of essential goods are regulated. • No provision for competition regulation.
Road
• Public roads are regulated by the Road Transport Department (Ministry of Transport)
• Privatized roads are regulated
by the Malaysian Highway Authority under the Ministry of Works.
• Road Transport Act, 1987
• Price regulation (toll rates) by Ministry of Works
• Commercial vehicle licensing
(entry) by Commercial Vehicle Licensing Board, Ministry of Entrepreneurial Development
Railways
• Railways Department (Ministry of Transport)
• Railways Act 1991 and Railways (Successor Company) Act 1991
• Price regulation (fare rates) by Ministry of Transport
Ports
• Corporatized ports are regulated by the respective Ports Commission (e.g. Johor Port Authority, Bintulu Port Authority, Klang Port Authority etc.)
• Federal ports are regulated by
the Ministry of Transport.
• Ports Authorities Act 1963 • Ports Act (Privatization) 1990 • Various port commission acts for each
port
• Price regulation by port commission

226
Sector Regulatory Agency Legislation Type of Regulation Airports
• Civil Aviation Department, Ministry of Transport
• Civil Aviation Act, 1969; Landing, Parking and Housing
• Passenger Services and Air Navigation Facility Charges (and) Regulations 1992.
• Price regulation by Ministry of Transport
Communications and Multimedia
• Communications and Multimedia Commission
• Communications and Multimedia Act 1998
• Price regulation and Competition regulation – CMC advises the Ministry of Energy, Communications and Multimedia.
• Entry is regulated via licensing.
Electricity Supply
• Energy Commission
• Energy Commission Act 2001 • Electricity Supply Act 1990 • Electricity Supply (Successor
Company) Act 1990
• Regulation of wholesale prices via agreements between IPPs and Tenaga Nasional incumbent distributor company). • Retail tariffs regulated by Ministry of Energy, Communications and Multimedia.
Water Supply
• Water Supply Department, Water Board, PWD
• Water Supply Act • State legislation
• For privatized supplier prices are regulated via concession agreements.
Source Adapted from Lee, Cassey, 2004

227
6 References
_________, The Food Products Industry, http://www.mida.gov.my assessed on 18th January 2007
Abu Kasim, A. and Hamdzah, A.R. (2003). Peluang perniagaan dalam industri sos, rempah dan kondimen. Paper presented at Food Processing Business Development Forum, 23 October 2003, Sungai Petani, Malaysia.
Abu Kasim Ali (2005): Trade Liberalization: Its Effects and Implications on Food Production Programme in Malaysia - unpublished Euromonitor International (2007). Food and Beverage: FMM – Matrade Industry Directory (2005/06). Published by Federation of Malaysian Manufacturers Food and Beverage: FMM – Matrade Industry Directory (2002/03). Published by Federation of Malaysian Manufacturers Lee, Cassey (2004). Competition Policy in Malaysia. Working Paper Series: Paper No 68. Published by Centre on Regulation and Competition. Institute for Development, Policy and Management, University of Manchester UK.
MoA Inc., Report on Value Adding of Locally Produced Food Crops, February 2003.
MITI, Third Industrial Master Plan, 2006 -2020. Printed by Percetakan Nasional Malaysia Berhad
Malaysia’s Trade Performance Report 2006 (2007). Published by Malaysia External Trade Development Corporation, Malaysia. Preliminary Report on Profile of Small and Medium Enterprises (2006). Published by Department of Statistics SME Performance Report (2005). Published by Small and Development Industries Development Corporation (SMIDEC), 2006 SME Annual Report (2005). Published by National SME Development Council (NSDC), 2006.
Suter, D and Henneberry, S.R., 1996. An examination of the structure, conduct and performance of the U.S. food processing industry. Journal of Food Products Marketing, Vol. 3 (2).

228
Appendix 1: Average Growth Rate (%) of Sales (2000-2004)
MSIC Description 2000 2,001 2,002 2003 2004 AGR (%)
151 Production, processing and preservation of meat, fish, fruit, vegetables, oils and fats
2,927,728 2,789,931 3,695,213 4,192,920 4,571,300 11.14
15111 Processing and preserving of poultry and poultry products 100,247 81,374 84,272 97,289 97,142 (0.79)
15120 Processing and preserving of fish and fish products 174,839 156,153 203,328 227,419 268,773 10.75
15131 Pineapple canning 11,465 3,427 8,260 10,864 7,027 (12.24)
15139 Canning and preserving of other fruits and vegetables 31,589 21,680 19,836 27,879 29,774 (1.48)
15142 Manufacture of crude palm oil 1,845,589 1,643,098 2,208,979 2,727,444 3,023,079 12.34 15143 Manufacture of refined palm oil 354,875 518,432 367,154 489,886 726,708 17.92 15144 Manufacture of palm kernel oil 239,681 234,683 377,687 227,880 213,600 (2.88) 152 Manufacture of dairy products 478,693 397,658 420,140 430,343 485,663 0.36 15201 Manufacture of ice cream 52,046 50,818 21,900 21,036 25,366 (17.97)
15202 Manufacture of condensed, powdered and evaporated milk
15209 Manufacture of other dairy products
426,647 346,840 398,241 409,307 460,296 1.90
153 Manufacture of grain mill , starches and starch products and prepared animal feeds
662,387 635,839 705,229 626,295 602,756 (2.36)
15311 Rice milling 126,358 107,344 78,939 97,679 118,044 (1.70) 15312 Flour milling 220,172 208,267 332,417 217,564 211,246 (1.03) 15319 Manufacture of other flour/grain
mill product 15322 Manufacture of glucose and
glucose syrup, maltose
24,830 31,495 23,964 8,754 20,134 (5.24)
15323 Manufacture of sago and tapioca flour/product
15329 Manufacture of other starch prd 8,537 7,605 8,574 10,816 7,850 (2.10)
154 Manufacture of other food products 1,583,815 1,752,405 1,787,006 1,949,303 2,037,221 6.29
15411 Manufacture of biscuits & cookies 159,564 158,452 99,360 94,929 111,792 (8.90) 15412 Manufacture of bread, cake and other
bakery products 186,202 295,295 224,470 267,612 317,327 3.33
15440 Manufacture of macaroni, noodles and similar prd 104,505 114,257 107,452 105,080 101,629 (0.70)
15420 Manufacture of sugar 228,841 240,993 266,988 382,488 409,759 14.56 15431 Manufacture of cocoa products 65,020 71,119 87,508 95,227 118,466 15.00 15432 Manufacture of chocolate product
and sugar confectionery 140,226 120,940 147,806 197,625 161,908 3.59
15494 Man. of spices and curry powder 60,138 49,098 59,595 60,246 60,208 0.03 15496 Manufacture of sauces including
flavoring extracts such as MSG 84,861 141,042 74,506 92,550 88,491 1.05
15497 Man. of snack: cracker/chips,fish prawn, potato, banana/tapioca) 109,54 113,644 116,353 107,557 123,476 2.99
15499 Man. of other food products n.e.c (not elsewhere classified) 323,930 355,72 471,20 406,787 414,866 6.19
Note: * Malaysian Standard Industrial Classification 2000
Source: Department of Statistics, Malaysia 2005

229
Market Liberalization and its Relationship with Market Structure, Conduct and Performance of the Food Processing Industry in Thailand by Boonjit Titapiwatanakun
Table of Contents Page No
1 Introduction 232 1.1 Background 232
2 Brief overview of Thai agricultural sector 232 2.1 Brief review of Thai agro-industry and related policy 232 2.2 Gross domestic products (GDP) 233 2.3 International Trade 234 2.4 Exports of food commodities 237
3 Overview of small and medium enterprises (SMEs) 241 3.1 Number of SMEs 241 3.2 Roles of SMEs in employment 241 3.3 SMEs’ contributions in gross domestic product (GDP) 243 3.4 Promoting and supporting polices on SMEs 244 3.5 Assessment of financial polices or strategies on promoting SME
during 2003-2004 246
4 Food Processing Industry 247 4.1 Food processors 247 4.2 Food processor by food category and size 249 4.3 Rice mill 250
5 Results of the analysis 253 5.1. Methodology 253 5. 2. Selection of commodities and industries for analysis 254 5.3. Analysis of market structure, conducts and performance (SCP) 254 5.3.1 Rice mills 255 5.3.2 Flour mill 259 5.3.3 Cassava starch factories 262 5.3.4 Canned fruit and vegetable factories 264 5.3.5 Sea food processors 267 5.3.6 Canned sea food processors 268 5.3.7 Slaughterhouse 270
6 Summary and conclusion 274 6.1 Summary 274 6.2 Recommendations 276
7 References 278

230
List of Tables Table 2.1 Thai agriculture, non-agriculture and total gross domestic products at current price 1993-2006
234
Table 2.2 Thai trade classified by commodity group (Unit Millions of Baht)
235
Table 2.3 Thai total value of food (agricultural) exports and by major group of commodity (Unit Millions of baht)
239
Table 3.1 Number of Employment, Percentage, and Average Employment Under Small ang Medium Enterprises in 2004 by Region
242
Table 3.2. Average number of employment under SMEs in 2004 by industry
243
Table 3.3: Thailand's Gross Domestic Product 2000-2004 by Size of Enterprise
244
Table 3.4. Loans and financial assistance received by SMEs, 2003- 2004 247 Table 4.1. Thai total number of food factories, total labor employed, and total investment
248
Table 4.2. Thai total labor employed by the registered food factories and by industry (accumulated number)
249
Table 4.3. Thai number of food processors by food category and size 250 Table 4.4: Thai total number of rice milling firms total investments and total labor employed
251
Table 5.1. Thai number of establishment of rice mills, average principal revenue of firm and market share by size of firms
258
Table 5.2. Thai average net profit of rice mills by size and total net profit of all rice mills
258
Table 5.3 Thai number of establishment of rice mills, concentration rations, and HHI
256
Table 5.4. Thai number of establishment of flour mills, average principal revenue of firm and market share by size of firms
261
Table 5.5 Thai average net profit of flour mills by size and total net profit of all flour mills
261
Table 5.6 Thai flour mills, concentration ratios, and HHI 260 Table 5.7 Thai number of establishment of cassava starch factories, average principal revenue of firm and market share by size of firms
263
Table 5.8 Thai average net profit of cassava starch factories, and total starch factories
255
Table 5.9. Thai cassava starch factories, concentration ratios, and HHI 264 Table 5.10 Thai number canned fruit and vegetable processors (firms), average principal revenue, and market share by size of firm
266
Table 5.11: Thai average net profit canned fruit and vegetable processors (firms) and total canned factories
266
Table 5.12 Thai canned fruit and vegetable processors, concentration ratois, and HHI
265
Table 5.13 Thai number sea food processors (firms), average principal 269

231
revenue, and market share by size of firm Table 5.14 Thai average net profit sea food processors (firms), and total processors
269
Table 5.15. Thai sea food processors, concentration rations, and HHI 268 Table 5.16. Thai principal revenue of canned food processor by firm 270 Table 5.17 Thai number slaughterhouses (firms), average principal revenue, and market share by size of firm
273
Table 5.18 Thai number of establishment slaughterhouse and meat processors,
272

232
I. Introduction 1.1 Background The study on market liberation and its relationship with market SCP in Thailand follows the overall objective of the regional project entitled “Market Liberalization and its Relationship with Market Structure, Conduct and Performance of Selected Food Processing Industry of APEC Member Economies” The overall object of the study of the regional project mainly focus on the effects of trade liberalization on food processing of SMEs in selected APEC economies, in particular, on how the change of market structure, conduct and performance resulting from trade liberalization, if any, affects their ability to compete fairly in the market place. The specific objectives of this project are:
i) to assess the structure and conduct of selected processed food markets in APEC member economies,
ii) to determine the market performance of the selected processed food
industries in the APEC member economies, and
iii) to recommend policies and strategies in order to increase market efficiency of processed food industries in APEC member economies.
In line with the above objectives, the specific objectives of the Thai study are:
1) to analyze the market share of selected food processing industries in 3 agricultural sub-sectors namely; crop, fishery, and livestock;
2) to estimate the market concentration ratios of the selected food
processing industry; and
3) to propose policy recommendations.
The overall methodologies for the study employed both quantitative analysis using secondary information and qualitative analysis that was carried out by interviewing entrepreneur and stakeholders in the selected food processing industries.
2. Brief overview of Thai agricultural sector 2.1 Brief review of Thai agro-industry and related policy Thailand started the first national economic and social development plan in 1961 in which the agro-industry development was promoted. At the same time, the general policy direction was focused on export promotion and import substitution. By the third national plan (1972-1976) the promotion of agro-industrial product export was

233
further enhance. However, the policy direction was shifted toward more export-oriented industries sectors instead of agricultural sector. Nevertheless, the Thai food processing industry growth rapidly during 1980-1985 in response to the world market demand, especially the developed countries such as USA, EU and Japan. And in the seventh national plan (1992-1996), trade liberalization policies were implemented in accordance with the free trade movements under WTO. With 30 year development and experience in the world trade of food and agro-industrial product under considerable free market environment in the domestic market, Thailand become one of the leading food producing and exporting economy in the world in 1990. In 2005, Thailand started to follow the direction of Free Trade Agreement (FTA) with trading countries such as ASEAN, Australia, New Zealand, China, Bahrain, Peru and Japan. The creation of FTA generated both positive and negative impacts on agricultural sector of which the GDP share this sector have been declining to about 9 per cent in 2006. At present, it would be too soon to assess the actual impacts from all the implemented FTAs, however, adaptation of stakeholders in the agricultural are inevitable.
2.2 Gross domestic products (GDP) The total GDP of Thailand increased from 2,469,458 millions of baht in 1993 to 4,044,310 millions of baht in 2006 that was an increase of more than 60 per cent. The non-agriculture GDP accounted for more than 90 per cent of the total while that of the agriculture GDP was only 10 per cent. During 1993-2006, the percentage share of agriculture GDP and non-agriculture GDP were rather constant. This due to the compound growth rate of total GDP, agriculture GDP and non-agriculture GDP during 1993-2006 were in a rather narrow rang between 2.6 to 3.6 per cent per annum. That is 3.6, 2.5, and 3.7 per cent per year for the total GDP, agriculture GDP and non-agriculture GDP, respectively (Table 1.) In terms of time trends, upward trends were observed for all the GDPs. However, after 1997, the non-agricultural GDP showed a steeper upward trend while that of the agriculture GDP still remained a rather stable with a slow upward trend. This may be explained by the restructuring of the Thai economy in non-agricultural sector to the new direction of globalization and trade liberalization of the world economy (Figure 1).

234
Table 2.1 Thai agriculture, non-agriculture and total gross domestic products at current price 1993-2006 Agriculture GDP Non-Agr. GDP Total GDP Mil. Baht % Mil. Baht % Mil. Baht %
1993 254,105 10.29 2,215,353 90 2,469,458 100 1994 263,393 9.79 2,426,194 90 2,689,587 100 1995 276,924 9.42 2,663,993 91 2,940,917 100 1996 290,221 9.31 2,825,855 91 3,116,076 100 1997 287,944 9.37 2,785,263 91 3,073,207 100 1998 280,313 10.2 2,468,040 90 2,748,352 100 1999 288,469 10.04 2,583,611 90 2,872,080 100 2000 310,659 10.32 2,698,823 90 3,009,482 100 2001 318,883 10.38 2,753,387 90 3,072,270 100 2002 322,499 9.96 2,914,629 90 3,237,127 100 2003 363,368 10.48 3,104,398 90 3,467,766 100 2004 352,866 9.58 3,331,839 90 3,684,705 100 2005 342,065 8.88 3,508,769 91 3,850,834 100
2006P 358,712 8.87 3,685,598 91 4,044,310 100 Growth 2.5 3.7 3.6 Remarks P=Preliminary data, and Growth=Compound growth rate 2003-06 Source: National account division, National Economics and Social Development Broad, as of 28 April 2007, www.nesdb.ac.th
2.3 International Trade International trade plays a vital role in Thai economic development. The contribution of overall trade has been increasing during 1995-2006. The important role of international trade reflected by the increase of the percentage of openness to trade from 75.72 per cent in 1995 to 129.72 per cent in 2006. During this period, the export of Thailand expanded from 1,406 billions of baht in 1995 to 4,946 billions of baht in 2006 that was more than 350 per cent while the total imports increased from 1,764 to 4,871 billions of baht. The overall balance of trade was positives except in year 1995 to 1997 that was caused by the deficit balance of trade in non-agricultural products (Table 2.2).
Figure 1. Thai agriculture and non-agriculture GDP at current pri
-
500,000
1,000,000
1,500,000
2,000,000
2,500,000
3,000,000
3,500,000
4,000,000
1993 1994 1995 1996 1997 1998 1999 2000 2001 2002 2003 2004 2005 2006
Mil. baht
Agriculture GDP
Non-Agriculture GDP

235
Table 2.2 Thai trade classified by commodity group (Unit Millions of Baht) 1995 1996 1997 1998 1999 2000 Exports 1,406,310.09 1,412,110.65 1,806,699.66 2,248,321.19 2,215,179.94 2,773,827.02 Food 268,071.56 274,340.15 325,637.51 393,088.38 370,434.60 392,161.89 Beverages and tobacco 3,576.63 5,329.77 6,422.42 6,409.04 6,039.91 6,906.32 Animal and vegetable oils and fats 495.87 344.17 2,141.74 2,189.21 2,777.84 2,848.85
Sub-total export of agr. Products Exp. 272,144.05 280,014.08 334,201.66 401,686.63 379,252.36 401,917.06 Share of agr. Products Exports 19.35 19.83 18.5 17.87 17.12 14.49 Sub-total Non-agr. Exports 1,131,803.38 1,129,506.06 1,466,398.24 1,840,412.81 1,831,136.95 2,368,197.70 Re-exports 2,362.66 2,590.51 6,099.76 6,221.76 4,790.64 3,712.26
Imports 1,763,591.27 1,832,825.18 1,924,283.03 1,774,066.18 1,907,390.62 2,494,141.11 Food 51,374.46 56,679.67 64,011.60 73,366.89 67,839.94 73,647.05 Beverages and tobacco 6,544.18 7,100.76 6,460.05 6,173.30 7,421.14 9,154.72 Animal and vegetable oils and fats 1,798.70 1,812.63 1,879.38 1,533.00 2,040.12 1,940.68
Sub-total agr. Imports 59,717.33 65,593.07 72,351.03 81,073.19 77,301.19 84,742.45 Share of agr. Products Imports 3.39 3.58 3.76 4.57 4.05 3.4 Sub-total Non-agr. Imports 1,703,873.94 1,767,232.11 1,851,932.00 1,692,992.98 1,830,089.43 2,409,398.66 Net Trade of agr. Products (Exports - Imports) 212,426.72 14,421.02 61,850.63 20,613.44 1,951.16 17,174.61 Net Trade of non-agr. Products (Exports - Imports) -572,070.56 -637,726.05 -385,533.76 147,419.82 1,047.52 -41,200.96 Net Trade (Exports - Imports) -357,281.18 -420,714.53 -117,583.37 474,255.02 307,789.31 279,685.92 Total trade 3,169,901.37 3,244,935.83 3,730,982.69 4,022,387.37 4,122,570.56 5,267,968.13 GDP Cur. (1,000 Mil.B) 4,186.21 4,611.04 4,732.61 4,626.45 4,637.08 4,922.73 Openness to trade 75.72 70.37 78.84 86.94 88.9 107.01 Extracted from Bank of Thailand www.bot.or.th as of 30 March 2007 Source : Customs Department

236
Table 2.2 (Continue) Thai trade classified by commodity group (Unit Millions of Baht) 2001 2002 2003 2004 2005 2006 Exports 2,884,703.89 2,923,941.39 3,325,630.12 3,874,823.79 4,439,310.65 4,946,452.04 Food 433,938.82 416,501.14 457,409.85 486,065.93 502,005.15 547,591.28 Beverages and tobacco 7,591.72 7,527.05 8,302.41 9,223.98 10,186.61 11,189.52 Animal and vegetable oils and fats 4,606.71 4,145.26 6,468.48 8,491.22 6,520.49 7,490.26
Sub-total export of agr. Products Exp. 446,137.25 428,173.45 472,180.74 503,781.14 518,712.25 566,271.07 Share of agr. Products Exports 15.47 14.64 14.2 13 11.68 11.45 Sub-total Non-agr. Exports 2,434,325.82 2,489,536.03 2,847,987.10 3,364,576.42 3,912,922.90 4,373,121.73 Re-exports 4,240.82 6,231.91 5,462.28 6,466.23 7,675.49 7,059.24
Imports 2,752,346.05 2,774,840.19 3,138,776.03 3,801,170.99 4,754,637.32 4,871,634.64 Food 95,215.75 95,549.59 102,083.61 116,189.68 133,679.36 137,701.13 Beverages and tobacco 9,694.36 9,548.44 9,867.53 11,186.01 12,383.32 12,263.11 Animal and vegetable oils and fats 2,289.85 2,468.98 3,229.59 4,685.57 4,024.80 3,676.21
Sub-total agr. Imports 107,199.97 107,567.01 115,180.73 132,061.26 150,087.49 153,640.45 Share of agr. Products Imports 3.89 3.88 3.67 3.47 3.16 3.15 Sub-total Non-agr. Imports 2,645,146.09 2,667,273.18 3,023,595.30 3,669,109.72 4,604,549.83 4,717,994.19 Net Trade of agr. Products (Exports - Imports) 338,937.29 320,606.44 357,000.01 371,719.87 368,624.76 412,630.62 Net Trade of non-agr. Products (Exports - Imports) -210,820.27 -177,737.15 -175,608.20 -304,533.31 -691,626.93 -344,872.46 Net Trade (Exports - Imports) 132,357.84 149,101.20 186,854.09 73,652.80 -315,326.68 74,817.40 Total trade 5,637,049.94 5,698,781.57 6,464,406.15 7,675,994.77 9,193,947.97 9,818,086.68 GDP Cur. (1,000 Mil. baht) 5,133.50 5,450.64 5,917.37 6,489.85 7,087.66 Openness to trade 109.81 104.55 109.24 118.28 129.72 Extracted from Bank of Thailand www.bot.or.th as of 30 March 2007 Source : Customs Department

“ 237
The agricultural commodity exports increased from 272 billions of bath in 1995 to 566 billions of bath in 2006 (an increase of 200 per cent). However, the share of agricultural exports has been declining every year since 1995 from 19.35 per cent to 11.45 per cent in 2006. The export of food commodity has been the principal agricultural exports of Thailand. Its export values accounted for more that 96 per cent of the total agricultural commodity exports. Nevertheless, during 1995-2006 the percentage shares of food export show a slight decline trend from 98.5 to 96.7 per cent. Although the value and percentage share of beverage and tobacco, and animal and vegetable oils and facts were rather small, both groups of commodity showed an increasing trend. The percentage share of animal and vegetable oils and fats increased from 0.18 per cent (496 Millions of baht) in 1995 to 1.67 per cent (8,491 Millions of baht) in 2004 (Table 2.). In teams of overall trends of total exports, clear upward trends were observed for the total exports and total exports of non-agricultural products and agricultural products. Both total exports and total export of non-agricultural products depicted similar sharp increasing trend from 1996 all the way to 2006. The export of agricultural commodity steadily increased with a rather flat upward trend (Figure 2.). It is quite clear that since 1995 the non-agricultural sector has been the dominant sector of the Thai economy. The stead increasing percentage of openness to trade of Thailand is also due to the rapid expansion of non-agricultural commodity exports. It is interesting to note that after the Asian financial crisis (1997-98), the non-agricultural exports have regain momentum of growth, while that of the agricultural exports has been rather steady (Figure 2.).
Figure 2. Thai total exports, total agriculture commodity exports and total non-agricultural commodity exports 1995-2006
-
1,000,000
2,000,000
3,000,000
4,000,000
5,000,000
6,000,000
1995 1996 1997 1998 1999 2000 2001 2002 2003 2004 2005 2006
Mil. baht
Total Exports
Total export of agr. ProductsExportTotal Non-agr. Exports
2.4 Exports of food commodities A closer look at the total food export of Thailand using statistic complied by the Thai National Food Institute revealed that total export increased from 203,522.6 millions of baht in 1993 to 519,816.3 millions of baht in 2005 that was increased more than double. In percentage teams, only 10 group of commodities that their shares of export value are more than 2 per cent in 2005. These are: 1) fishery products (34.18 %); 2) rice and cereal (18.18 %); 3) fruit (9.21 %); 4) meat and poultry (7.12 %) 5) sugar honey (5.69 %); 6) unspecified food (3.74 %); 7) animal feed (3.51 %); 8)

“ 238
flour and starch 3.35 %) 9) vegetable (3.13 %); and cassava pellets (2.46 %). These 10 groups accounted for 90.57 per cent of the total food exports in 2005 which was decreased from 94.88 in 1993 (Table 3.) From 1993 to 2005, the value of export of the top 5 group of food commodities have been increasing, especially the fishery products, rice and cereal and fruits. The meat and poultry groups depicted an upward trend from1993 to 2003, and then it was decreased due most to the bird-flue epidemic. Nevertheless, these top 5 groups of commodities are contributing more than 70 per cent of the total food exports (Figure 3).
Figure 3. Thai export value of the top 5 group of food commodities
-
20,000
40,000
60,000
80,000
100,000
120,000
140,000
160,000
180,000
200,000
1993 1994 1995 1996 1997 1998 1999 2000 2001 2002 2003 2004 2005
Mil. bahtFishery ProductsRice and CerealFruitsMeat and Poultry ProductsSugar Honey
During 1996-2005, the total food commodities export value increase at a compound growth rate of 9.8 per cent per annum. The top 5 group of commodities growth rate were at 5.5, 6.3, 8.2 and 14.00 per cent per year for fishery products, rice and cereal, fruits, meat and poultry products, respectively, while that of sugar honey experienced with a negative growth. The meat and poultry products has the highest growth rate among the top 5, however, the bird-flue epidemic would slow down the expansion of this group of commodities. Furthermore, the dynamic and increasing hygienic and food safety measures imposed by importing countries that require more stringent control of the whole supply chain of meat and poultry products. Although the total value of fruits export was at 47,854.92 millions of baht or only at 9.2 per cent of the total, it showed an impressive compound growth rate that reflected good potential for expansion (Table 2.3.).

“ 239
Table 2.3 Thai total value of food (agricultural) exports and by major group of commodity (Unit Millions of baht)
Fishery Products Rice and Cereal Fruits Meat and Poultry ProductsSugar Honey Unspecified FoodAnimal Feed Flour and StarchVegetable 1993 85,811.04 33,769.07 15,645.52 11,161.35 12,296.08 3,384.15 4,728.03 3,857.87 5,337.01 1994 98,234.30 39,847.25 16,253.87 12,684.74 17,289.66 4,721.81 4,800.45 6,055.75 7,106.84 1995 110,474.47 49,237.16 17,324.77 13,867.14 28,894.32 5,263.96 5,497.38 6,370.07 7,098.02 1996 103,792.38 51,345.07 21,734.33 10,021.98 32,287.40 6,547.24 6,226.18 4,986.69 7,591.74 1997 129,851.09 65,809.37 23,101.90 17,273.78 31,750.82 6,643.99 7,783.88 8,129.55 8,452.15 1998 165,446.87 87,688.18 21,696.52 27,167.36 27,050.63 7,148.88 9,441.20 7,223.23 9,873.10 1999 154,257.84 74,254.41 30,086.09 27,303.82 21,277.19 8,214.39 9,257.44 6,703.84 9,508.10 2000 173,273.52 65,899.21 28,585.11 31,593.80 26,197.29 8,985.85 11,089.52 8,401.79 9,916.48 2001 178,223.85 72,682.56 30,739.11 44,337.37 31,147.11 10,709.36 11,174.09 8,508.79 11,364.55 2002 155,665.68 71,060.55 34,584.78 46,495.16 29,939.35 12,254.06 12,972.88 8,903.31 11,780.03 2003 160,247.54 77,510.73 39,782.17 49,389.85 39,107.51 16,805.43 14,910.60 9,782.16 13,006.56 2004 161,791.43 113,850.10 42,489.54 28,488.52 33,594.49 20,319.17 16,687.44 11,412.01 15,409.39 2005 177,651.24 94,506.58 47,854.92 37,038.03 29,581.09 19,436.54 18,250.85 17,423.71 16,287.34
Growth 5.5 6.3 8.2 14 -1 11.5 11.4 13.3 7.9Remarks: Growth = compound growth rate for a period of 1996-2005. Source: National Food Institute, Bangkok Thailand, as of 6 December 2006
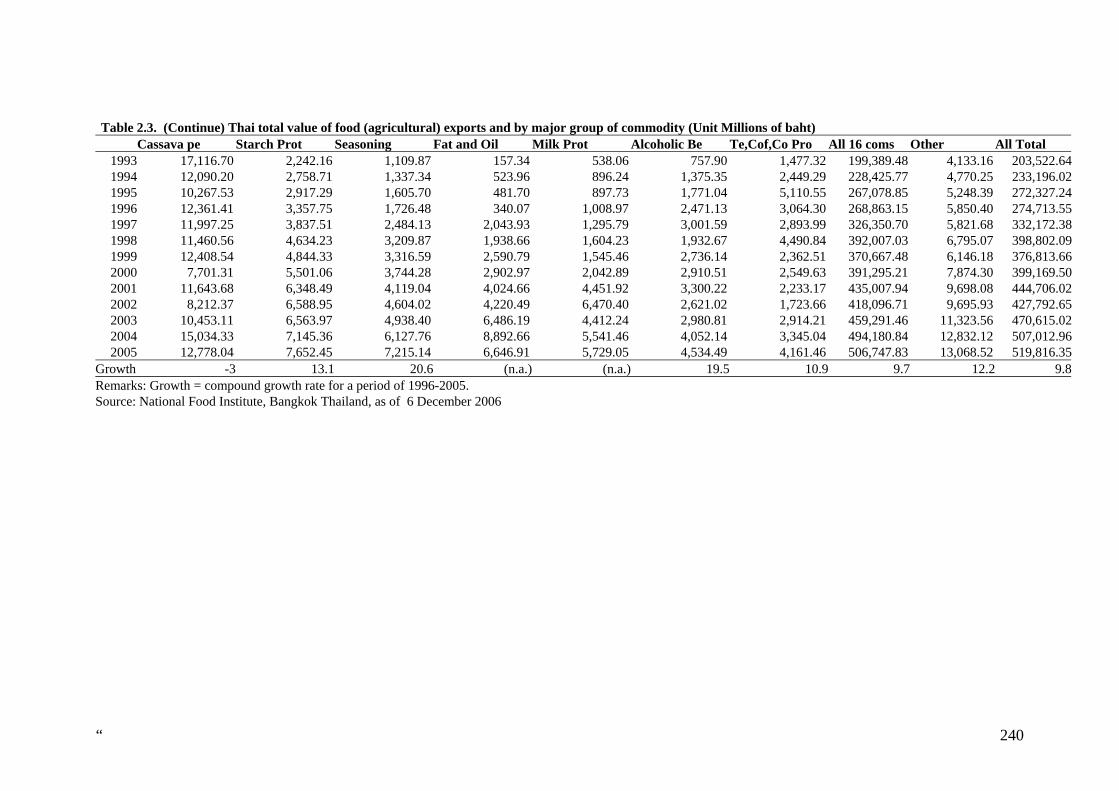
“ 240
Table 2.3. (Continue) Thai total value of food (agricultural) exports and by major group of commodity (Unit Millions of baht) Cassava pe Starch Prot Seasoning Fat and Oil Milk Prot Alcoholic Be Te,Cof,Co Pro All 16 coms Other All Total
1993 17,116.70 2,242.16 1,109.87 157.34 538.06 757.90 1,477.32 199,389.48 4,133.16 203,522.64 1994 12,090.20 2,758.71 1,337.34 523.96 896.24 1,375.35 2,449.29 228,425.77 4,770.25 233,196.02 1995 10,267.53 2,917.29 1,605.70 481.70 897.73 1,771.04 5,110.55 267,078.85 5,248.39 272,327.24 1996 12,361.41 3,357.75 1,726.48 340.07 1,008.97 2,471.13 3,064.30 268,863.15 5,850.40 274,713.55 1997 11,997.25 3,837.51 2,484.13 2,043.93 1,295.79 3,001.59 2,893.99 326,350.70 5,821.68 332,172.38 1998 11,460.56 4,634.23 3,209.87 1,938.66 1,604.23 1,932.67 4,490.84 392,007.03 6,795.07 398,802.09 1999 12,408.54 4,844.33 3,316.59 2,590.79 1,545.46 2,736.14 2,362.51 370,667.48 6,146.18 376,813.66 2000 7,701.31 5,501.06 3,744.28 2,902.97 2,042.89 2,910.51 2,549.63 391,295.21 7,874.30 399,169.50 2001 11,643.68 6,348.49 4,119.04 4,024.66 4,451.92 3,300.22 2,233.17 435,007.94 9,698.08 444,706.02 2002 8,212.37 6,588.95 4,604.02 4,220.49 6,470.40 2,621.02 1,723.66 418,096.71 9,695.93 427,792.65 2003 10,453.11 6,563.97 4,938.40 6,486.19 4,412.24 2,980.81 2,914.21 459,291.46 11,323.56 470,615.02 2004 15,034.33 7,145.36 6,127.76 8,892.66 5,541.46 4,052.14 3,345.04 494,180.84 12,832.12 507,012.96 2005 12,778.04 7,652.45 7,215.14 6,646.91 5,729.05 4,534.49 4,161.46 506,747.83 13,068.52 519,816.35
Growth -3 13.1 20.6 (n.a.) (n.a.) 19.5 10.9 9.7 12.2 9.8Remarks: Growth = compound growth rate for a period of 1996-2005. Source: National Food Institute, Bangkok Thailand, as of 6 December 2006

241
3. Overview of small and medium enterprises (SMEs) 3.1 Number of SMEs
According to the available statistics the number of SME in Thailand consisted of 437,905 and 524,960 enterprises in 1994 and 1999, respectively. During the period of 1994-1999 it was increased by 3.7 percent. However, in 2004, Thailand had a total of 2,166,621 enterprises, of which 2,161,577 or 99.8 percent were SMEs. The rapid increase of the number of SME was due partly to the updating of database in order to improve its coverage carried out by the Office of Small and Medium Enterprises Promotion using data from: a) The 1997 Industrial Census and The 2002 Business Trade and Services Census by National Statistical Office; b) List of registered establishments; c) Department of Business Development, Ministry of Commerce; d) List of insured employees, the Social Security Office and e) List of registered manufacturers, Department of Industrial Works.
In 2004, the manufacturing SMEs totaled at 482,229, accounted for 99.7 percent of the entire manufacturing sector. The top 5 industries in the sector were food and beverage, clothing, textiles, wood and wood products (excluding furniture) and tobacco products. The number of SMEs under each industry, and their proportion in manufacturing SMEs, are 135,227 in food and beverage industry (28% of the entire sectors), 72,315 in clothing industry (15%), 57,504 in textiles industry (11.9%), 45,208 in wood and wood products industry excluding furniture (9.4%) and 31,532 in tobacco products (6.5%) (Table 3.1). 3.2 Roles of SMEs in employment The growth occurred in every SMEs sector, services, manufacturing, and trade. The employment in SMEs was 6.6 million in 1999, accounted for 79.2 percent of the total employment. During 1994 to 1999 the annual growth rate of SMEs’ employment was 4.7 percent. Available statistic showed that the total persons employed by SMEs increased sharply from 5,566,885 out of the total of 9,172,500 (or 60.69 per cent of the total) in 2003 to 9,330,667 or 80.4 percent of the total (11,604,332 persons) in 2004. That was an increase of 67.6 per cent. Such a huge magnitude of increase was due to the updating of the SMEs database in 2004. Unfortunately, employment by each category of manufacturing was not available due the difference in the classification of the employment statistic and number of establishment. Under the 4 broad categories of industries, the manufacturing industries had the highest number of employment at 3,233,484, or 34.7 percent of all SMEs employed persons followed by the services sub-sector 2,755,485 employed persons, or 29.5 per cent of the total. The retail trade hired 1,694,029 persons or 18.2 per cent, while wholesale trade contributed 935,702 jobs or 10 percent of the total of employment under SMEs.

242
Table 3.1 Number of Employment, Percentage, and Average Employment Under Small ang Medium Enterprises in 2004 by Region
RegionsTotal employment in the region (persons)
Enployment under SMEs (persons)
% of employment in the region to total
employment under SMEs
% of employment under SMEs to total employment in the
region 1.Bangkok & vicinity 6,570,755 4,832,519 51.8 73.5 2.Central 1,120,267 925,198 9.9 82.6 3.Northern 983,768 921,412 9.9 93.7 4.Northeastern 1,357,906 1,311,843 14.1 96.6 5.Southern 857,588 797,266 8.5 93.0 6.Eastern 714,084 542,429 5.8 76.0
Total 11,604,368 9,330,667 100.0 80.4 Source: The 1997 Industrial Census and The 2002 Business Trade and Services Census by National Statistical Office : List of registered establishment, Department of Business Development, Ministry of Commerce. : List of insured employees, the Social Security Office : List of registered manufacturers, Department of Industrial WorksCompiled by: the Office of Small and Medium Enterprises
Nevertheless, the average number of employment of large, medium, and small enterprise showed a big difference. For example, in the manufacturing industry the industry average, large enterprise, medium enterprise, and small enterprise were at 9, 784, 200, and 5 persons respectively. Among the listed 5 industries, the lowest number of employed of the overall average employment was 3 and large enterprise was 260, while that of the medium and small enterprise were at 68 and 2 (Table 3.2.)

243
Table 3.2. Average number of employment under SMEs in 2004 by industry
Industries
Average Emplmt. (Persons)
SMEs Average Emplmt.(Persons)
LE Average Emplmt.(Persons)
ME Average Emplmt.(Persons)
SE Average Emplmt.(Persons)
Manufacturing 9 7 784 200 5 Wholesale 9 7 260 70 6 Retail 3 2 292 68 2 Services 5 4 408 93 3 N/a 7 6 606 157 6 Averages 5 4 451 120 4 Source : The 1997 Industrial Census and The 2002 Business Trade and Services Census by National Statistical Office : List of registered establishments, Department of Business Development, Ministry of Commerce. : List of insured employees, the Social Security Office : List of registered manufactures. Department of Industrial Works Compiled by: the Office of Small and Medium enterprises Promotion
3.3 SMEs’ contributions in gross domestic product (GDP) The roles of SMEs in economic development have been significant. It was estimated that SMEs accounted for 39.5 percent of GDP in 2000. During 2000-2004, the large enterprise contribution in GDP was increased from 1,980,084 millions of baht in 2000 to 2,722,095 millions of baht in 2004, while that of the SMEs contributions was also increased from 1,945,800 to 2,486,892 millions of baht during the same period. In percentage terms, the large enterprise’s share increase slightly from 40.2 per cent to 41.4 per cent, while that of the SMEs gradually decreased from 39.5 per cent to 37.8 per cent. Unfortunately, the GDP contribution of SMEs in agricultural sector was not available (Table 3.3.). The SMEs GDP shares was further scrutinized and found that the share of small enterprises decreased from 21.2 to 20.3 per cent and that of the medium enterprises reduced from 18.3 to 17.5 per cent. Nevertheless, the average of year-to-year real GDP growth of the small enterprise (4.54 per cent) showed a marginally low percentage of growth than that of the medium enterprises (4.86 per cent). The performance of SMEs reflected a broad picture that the overall share of large enterprise and SMEs is equal at about 40 per cent each in 2000. Then the share of SMEs has been slowly decreasing while a similar trend in the opposite direction was observed for the share of large enterprises. Moreover, the overall performance the small enterprise is the lowest among the 3 categories of enterprises. It suffice one to conclude that during the period of 2000 to 2004, among the large, medium and small enterprises, the large enterprise has the most comparative advantage. This may due to the difficulties faced by the small enterprise to crop with the changing trade liberalization and global competition.

244
Table 3.3: Thailand's Gross Domestic Product 2000-2004 by Size of Enterprise2000 2001 2002 2003 2004
GDP at market prices (value:THB million)National 4,922,731 5,133,502 5,446,043 5,930,362 6,576,834Agriculture 444,185 468,905 513,094 595,004 651,629Non-agriculture 4,478,546 4,664,597 4,932,949 5,335,358 5,925,205- Large Enterprises 1,980,084 2,070,339 2,208,262 2,436,805 2,722,095- SMEs 1,945,800 2,019,480 2,112,599 2,256,353 2,486,892 Small Enterprises 1,043,349 1,084,056 1,135,987 1,206,535 1,331,954 Med. Enterprises 902,451 935,424 976,612 1,049,818 1,154,938- Other Enterprises 552,661 574,778 612,088 642,199 716,218GDP at market prices (percentage)National 100 100 100 100 100Agriculture 9.1 9.2 9.5 10.1 9.9Non-agriculture 90.9 90.8 90.5 89.9 90.1- Large Enterprises 40.2 40.3 40.5 41.1 41.4- SMEs 39.5 39.3 38.8 38.0 37.8 Small Enterprises 21.2 21.1 20.9 20.3 20.3 Med. Enterprises 18.3 18.2 17.9 17.7 17.5- Other Enterprises 11.2 11.2 11.2 10.8 10.9Real GDP growth (percentage)National 4.8 2.2 5.3 6.9 6.1Agriculture 7.2 3.2 1.0 8.7 -4.4Non-agriculture 4.5 2.0 5.8 6.7 7.2- Large Enterprises 4.6 2.1 6.9 8.3 8.1- SMEs 4.3 1.8 4.7 5.5 7.1 Small Enterprises 4.1 1.7 4.7 5.0 7.2 Med. Enterprises 4.6 2.0 4.7 6.1 6.9- Other Enterprises 4.6 2.8 4.9 3.1 3.1Source: the Office of National Economic and Social Development Board Compiled by: the office of Small and Medium Enterprises Promotion 3.4 Promoting and supporting polices on SMEs The policies and measures to promote and support SMEs in Thailand has been rather comprehensive and covered almost all aspects of SME development including finance, marketing, technology, innovation, management, human resources, and adjustment of laws and taxes. All these policies can be briefly summarized as the followings. Financial Policies The financial policies currently implemented by the government include the following:
(1) Extension of loans through financial institutions and commercial banks has not fully met the financial needs of SMEs.
(2) Mobilization of fund through security market which includes establishment of mutual funds for SMEs, mutual funds for medium enterprises, and investment in Market for Alternative Investment (MAI). These measures are not satisfactory in spite of tax incentive measures.

245
(3) SMEs and People Financial Advisory Center (SFAC) gives advises to people three times more than to SME entrepreneurs.
Policies on Marketing The government has been trying to solve problems of locating markets by finding markets for SMEs and advertising their products domestically and aboard. The important measures are as follows:
(1) Promoting establishments of product distribution centers. Most of the products are agricultural and agro-industrial products produced in communities in various regions of the economy.
(2) Promoting improvement of packaging standard by providing advice on package design, promoting brand names and advertising Thailand brands to make them well known and acceptable aboard.
(3) Developing trade information system and the use of e-commerce. Policies on Technology and Innovation Major policies include the following:
(1) Corporate tax exemption on income in the same amount of the firm’s expenditure on research and development on technology and depreciation deduction on machines and equipment used for technological research and development.
(2) Technological data services for improvement of product and research services for manufacturing problem solving and quality improvement.
(3) Promoting technological transfer by setting up conditionality for investment promotion that transnational companies investing in Thailand must transfer technology to Thai supporting industries, and preparing Thai personnel for technological transfer.
Policies on Management and Human Resources Counseling services on management and training have been provided to SME workers and entrepreneurs in all sectors through responsible government agencies, for example, the Ministry of Industry, the Ministry of Science Technology and Environment, the Ministry of Commerce, the Tourism Authority of Thailand and the Institute for Small and Medium Enterprises Development (ISMED). Policies on Taxes, Privileges, and Regulations Tax measures for SMEs include the cancellation of 1.5 % value added tax for SMEs whose income exceeds 600,000 baht but less than 1,200,000 annually. There is also the reduction of corporate income tax for SMEs who have registered capital less than 5 million bath. The SMEs of this size account for 85 percent of companies, partnerships, or corporations who submit the tax form. SMEs can receive special deduction for depreciation.

246
Other Policies
(1) Promoting the one stop service (OSS) for SMEs by establishing SME service centers. Its job is to advise and collect information from related agents and guide SMEs to specialized agencies. There should be network centers to coordinate agencies around the economy.
(2) Supporting SMEs networking to increase bargaining power and reduce cost of raw materials and marketing, etc. The examples of SME networking are the “buyers-meet-producers project and establishment of sale and distribution centers.
(3) Decentralizing supports for SMEs outside Bangkok and communities by providing continued supports to community stores. The “One Tambon One Product project or OTOP” has developed coordination plan for the public and private sectors in the distribution of commodities. There have been, however, complaints on the falling prices.
(4) Promoting tourism is a policy that works well in supporting SMEs because many enterprises in tourism such as hotels, restaurants, etc. are SMEs.
3.5 Assessment of financial polices or strategies on promoting SME during 2003-2004. In 2003, under the strategy or policy on assisting and strengthening financial capability of SMEs, it was reported by the Office of Small and Medium Enterprise Promotion that 318,753 SMEs received assistance in solving their financial problems such as lack of investment capital, shortage of cash flows and non performance loans (NPL). And the total financial credit provided was 150,175.50 millions of baht. This equals to an average of 0.47 millions of baht credit per SME. During 2004, the total number of SMEs received assistance increased to 350,092 firms with a total credit provision of 201,088 million bath or an average of 0.57 millions of baht per SME (Table 3.4). At least two implications can be drawn from the financial support data. First the number of firms and total credit provided were increased which indicated more SMEs were able to receive financial assistance. This means the policy or strategy was successfully implemented. Second, the average credit per SME was increased by 21.3 per cent during 2003-2004, which reflected a questionable financial condition of the SME. During 2003 to 2004, the number SME received loan increased by 10.28 per cent, while the total amount of money provided for loans increased by 33.82 per cent. This means the amount of loans per SME increase that might be due to expansion of the business or to the increase of the NPL of SMEs. The available data showed that the number SME experienced with NPL and total amount of money utilized for supporting were increased from 15 firms and 82.5 millions of baht in 2003 to 80 firms and 357 millions of baht in 2004 or an increase of 4 times and 3 times, respectively. The number of SME provided with loan guarantee decreased from 3,875 firms in 2003 to 2,794 firms in 2004, while the total amount of money increased from 4,647 millions of baht to 6,018 millions of baht in the respective periods. This might imply that the magnitudes investment per firm increase as the number investment decreased due to the economic condition. Based on the financial support information, it is safe to conclude that the financial policy on promoting SMEs was successfully

247
implemented; however, there is no clear evidences which show SMEs financial status are enhanced (Table 3.4.).
Table 3.4. Loans and financial assistance received by SMEs, 2003- 2004 Type of assistance Jan.-Dec. 2003 Jan.-Dec. 2004
Number of SME Total amount
Number of SME Total amount
(firm) of money Mil. Baht (firm)
of money Mil. Baht
Credit 314,863
145,446.00
347,218
194,633.00
NPL 15
82.50
80
357.00
Loan Guarantee 3,875
4,647.00
2,794
6,018.00
318,753
150,175.50
350,092
201,008.00
Average amount of money per SME 0.47 0.57 Source: Office of Small and Medium Enterprise Promotion, Ministry of Industry
4. Food Processing Industry 4.1 Food processors Statistic obtained from the Ministry of Industry recorded that in 1982 the total number of factories registered with Ministry of Industry, under the factory act 1982, was 127,364 factories classified into 21 industries. There were 3 industries that related to food processing namely basic agro-industry, food, and beverage of which a total of 56,287 factories was registered and accounted for 44.2 per cent of the total 21 industries. By 2004, the total number of factories registered of which a total of 51,403 factories were food processors and accounted for 42.0 per cent of the industry’s total. During this period, the total number of registered factories and the food processors were slowly decreased (Table 4.1) Among the 3 categories of food processors, the number of factor under basic agro-industry is the highest at 48,985 in 1998 and 44,097 in 2004 which is more than 42 per cent of the total number of food processors. The food industry is the second largest with number of factories between 6,620 in 2003 and 7,287 in 2001 which is about 13 per cent of the total number of food processors (Table 4.1.) Although the percentage share of food processors is the highest, the percentage share of investment is only 13 per cent. This is due mainly to the low investment cost. However, the labor employed by the food processing industry is quite high at 17.86 per cent of the total 21 industries in 1998 (total labor employed 3,151,955) and 16.73 per cent in 2004 (total labor employed 4,045,982). This means food processing

248
industry is a major source of employment in the overall industry of Thailand (Table 4.1.) In terms of investment of all industry, the total investment have been increasing from 2,343,976 millions of baht in 1998, to 4,045,982 millions of baht in 2005, that of the food processors also expanded from 315,532 (13.46 per cent of the total) to 527,658 millions of baht (13.04 per cent of the total). This reflects the comparatively labor intensive industry as compared to the non-agricultural based industries (Table 4.1.) The employment in the food processing industry was dominated the food factories that accounted for 60.37 per cent of the total labor employed by the food processing industry in 1998 (562,819 labors), while the basic agro-industry employed 33.73 per cent of the total and the rest 5.9 per cent of the total was employed by the beverage industry. It should be noted that only the labor employment in the food factories were increasing during 1998-2004, but the other 2 industries (basic agro-industry and beverage) were decreasing. This might imply that the other 2 industries have been developed toward more capital intensive machinery and equipments. In fact, there is a rather clear downward trend of labor employed in basic agro-industry and beverage industry in 2002 and 2001, respectively. In contrast, a steeper upward trend was revealed for the food industry started in 2003. This could be explained by government policy on promoting the food processing sector such as “Thailand kitchen of the world program”, and the OTOP program (Table 4.2.). Table 4.1. Thai total number of food factories, total labor employed, and total investment
1998 1999 2000 2001Number of factories 1, Basic agro-Industry 48,985 48,936 45,752 44,736 2, Food 6,937 7,067 7,100 7,159 3. Beverage 365 375 383 395 Total food processors 56,287 56,378 53,235 52,290 % of total factories (21 industries) 44.19 43.93 42.44 42.14 Total 21 industries 127,364 128,350 125,449 124,079 Number of labor employment 1, Basic agro-Industry 189,827 191,036 179,416 181,830 2, Food 339,759 352,298 355,130 359,586 3. Beverage 33,233 32,819 31,813 32,209 Total food processors 562,819 576,153 566,359 573,625 % of total factories (21 industries) 17.86 18.10 17.61 17.35 Total 21 industries 3,151,955 3,184,018 3,216,252 3,306,713 Total investment (Millions of baht)1, Basic agro-Industry 96,191 99,294 93,702 99,879 2, Food 179,854 193,367 201,633 220,462 3. Beverage 39,487 46,021 53,593 53,116 Total food processors 315,532 338,682 348,929 373,458 % of total factories (21 industries) 13.46 13.87 13.78 14.24 Total 21 industries 2,343,976 2,442,088 2,531,265 2,622,523 Source: Ministry of Industry

249
Total food processors 56,287 56,378 53,235 52,290 % of total factories (21 industries) 44.19 43.93 42.44 42.14 Total 21 industries 127,364 128,350 125,449 124,079 Number of labor employment 1, Basic agro-Industry 189,827 191,036 179,416 181,830 2, Food 339,759 352,298 355,130 359,586 3. Beverage 33,233 32,819 31,813 32,209 Total food processors 562,819 576,153 566,359 573,625 % of total factories (21 industries) 17.86 18.10 17.61 17.35 Total 21 industries 3,151,955 3,184,018 3,216,252 3,306,713 Total investment (Millions of baht)1, Basic agro-Industry 96,191 99,294 93,702 99,879 2, Food 179,854 193,367 201,633 220,462 3. Beverage 39,487 46,021 53,593 53,116 Total food processors 315,532 338,682 348,929 373,458 % of total factories (21 industries) 13.46 13.87 13.78 14.24 Total 21 industries 2,343,976 2,442,088 2,531,265 2,622,523 Source: Ministry of Industry
Table 4.1 (Cont.) Thai total number of food factories, total labor employed, and total investment 2002 2003 2004 2005
Number of factories 1, Basic agro-Industry 46,774 42,575 45,857 44,097 2, Food 7,287 6,814 6,620 6,899 4.2 Food processor by food category and size The total number of food processors or manufacturers in Thailand recorded by the Ministry of Industry as of September 2001 was 9,439 factories (Table 4.3.). The manufacturers are classified into 3 sized based on the amount of total capital investment of the manufacture. The small size is for factor with capital investment less than 50 millions of baht, the medium size factor’s capital investment is between 50 to 200 millions of baht, and for capital investment more than 200 millions of baht is the large size.
Table 4.2. Thai total labor employed by the registered food factories and by industry (accumulated number)Total labor employed 21 ind.
Labors % of total Labors % of total Labors % of total Labors % Total 21 ind. % food/total 1998 189,827 33.7279 339,759 60.3674 33,233 5.9047 562,819 100 3,151,955 17.861999 191,036 33.1572 352,298 61.1466 32,819 5.6962 576,153 100 3,184,018 18.102000 179,416 31.6788 355,130 62.7040 31,813 5.6171 566,359 100 3,216,252 17.612001 181,830 31.6984 359,586 62.6866 32,209 5.6150 573,625 100 3,306,713 17.352002 185,567 32.3933 357,744 62.4492 29,545 5.1575 572,856 100 3,300,080 17.362003 154,868 28.0267 368,880 66.7567 28,826 5.2167 552,574 100 3,186,488 17.342004 147,269 26.3054 388,104 69.3236 24,471 4.3710 559,844 100 3,359,345 16.67
Basic agro-Industry Food Beverage Total food factories
Under the mentioned classifications, there are 294 large factories that equal to 3.11 per cent of the total, and 497 medium size factories (5.27 per cent), while the rest are 8,648 small size factories (91.62 per cent). It is clear that, in terms of capital investment of manufacturer, food processing factories are mostly small enterprises. Although, the total production of each categories of factor are not available, it is possible to make a preliminary assertion that the food processing industry as a whole is dominated by the total number of small and medium enterprises (Table 4.3).

250
Table 4.3. Thai number of food processors by food category and size
Commodity Small Medium Large Total Meat & Poultry 529 40 21 590 Dairy Products 72 9 16 97 Fishery Products 377 80 23 480 Fat & Oils 179 39 11 229 Fruit & Vegetable 411 57 15 483 Cereal Product 1,792 61 24 2,877 Starch, Grind & Pound Grind 1,308 49 36 1,393 Syrup & Sugar 61 11 53 125 Tea, Coffee & Confectionary 471 25 13 509 Seasonings 384 17 10 602 Ice 1,294 15 1 1,310 Feedstuff 518 66 18 602 Alcoholic Beverages 20 11 30 61 Non-Alcoholic Beverages 232 17 23 272 Total 8,648 497 294 9,439 Source : Office of Industrial Economics : September 2001 Note : Size of factories are classified by capital investment (millions of baht), Small: <50, Medium: >=50, <200 and Large: >=200
The commodity group classification of food factories showed that cereal products has the highest number of factories at 2,877 (30.48 per cent of the total), followed by ice factories at 1,310 (13.88 per cent of the total), and fruit & vegetables and fishery products at 483 and 480 factories, respectively. It is interesting to note that within each commodity group, large size factories in fishery products group is the highest at 4.79 per cent of the total, while that of ice factories is only 0.08 per cent of the total. This may due to the nature of processing technologies of commodity that determines the capital investment requirements which in turn causes the different size of factories. It might also reflect problems on factories classification based on the total capital investment (Table 4.3.). The performance of food processing factories that classified by the Ministry of Industry was not available. This is due mainly to the fact that difference Ministry has different classification of size. The Department of Business Development (DBD), Ministry of Commerce, provided statistic of number of registered firms and the average major revenue of each size of firms which are based on the total assess of reported by the firm. The available information from DBD will be employed for the analysis of market share of each size of firm and will be discussed later. 4.3 Rice mill Rice milling is one of the important and oldest conventional agro-industry in Thailand. It plays a vital role in the rice industry that enables Thailand being one of

251
the top rice exporting economy in the world for more than 3 decades. Therefore, rice mill industry is employed as a case in point for discussion on the Thai food processing industry to show the development in terms of total number of rice mills, total investment, and total labor employed during 1987-2005. The total accumulated number, investment, and labor employed of rice-mills statistic recorded by the Ministry of Industry from 1987 to 2005 showed that total number increased from 34,414 rice-mills in 1987 to 43,305 rice-mills in 1996, then decreased to 39,877 rice-mills in 2005. These figures excluded thousands of small local rice-millers operating in villages that were not registered. The total accumulated labor employed by the rice-mills expanded from 73,569 in 1987 to 98,001 in 1999, and then it dropped to 89,884 in 2005. However, the total accumulated investments enlarged almost every year from 29,751 millions of baht in 1987 to 64,156 millions of baht in 2005 (Table 4.4.) In terms of percentage year-on-year changes of accumulated total number, investment, and labor employed, all these depicted a decreasing trend starting from 1989 to 1999, and then a fluctuation of percentage changes were observed. These trends reflected the structural changes of rice-milling industry toward more capital intensive during the period of 1988 to 1999 that response to the changing world rice market and trade liberalization movements. However, the fluctuations of percentage change starting from 2000 to 2005 are due mainly to the government interventions in rice marketing and the increasing competition in the world rice market (Figure 4.) Further investigation of rice-mill structure by the ratio between investment and rice-mill and the ratio of investment per labor (or capital labor ratio) revealed that investment per rice-mill increased from 864,503 baht in 1987 to 1,623,449 baht of in 2005. And a clear increasing trend during this period (1987-2005) was observed. In the same period, the investment and labor ratio raised from 404,386 baht/labor in 1987 to 729,078 in 2005 (Figure 5. and 6.). Table 4.4: Thai total number of rice milling firms total investments and total labor employed
Rice-milling firms Investment (Mil. baht) Labor employed Number Annual
changes of rice-mills
Total Annual changes of investment
Number Annual changes labor employed
1987 34,414 29,751 73,569 1988 36,231 5.2798 34,108 14.6449 83,209 13.1033 1989 39,115 7.9600 42,454 24.4693 87,879 5.6124 1990 40,722 4.1084 47,720 12.4040 90,565 3.0565 1991 41,723 2.4581 49,173 3.0448 92,482 2.1167 1992 42,862 2.7299 50,090 1.8648 94,419 2.0945 1993 43,006 0.3360 51,115 2.0463 95,311 0.9447 1994 43,122 0.2697 52,426 2.5648 96,183 0.9149 1995 43,277 0.3594 53,350 1.7625 96,976 0.8245 1996 43,305 0.0647 54,157 1.5127 97,599 0.6424 1997 43,278 -0.0623 55,284 2.0810 97,853 0.2602
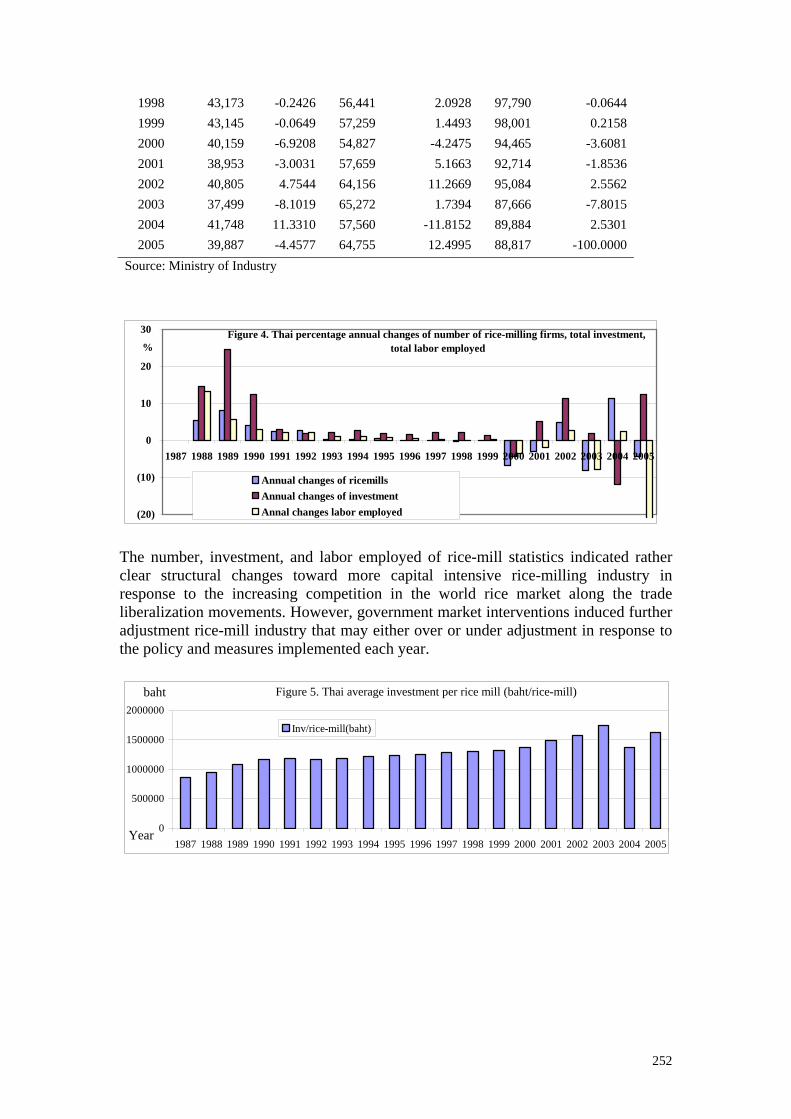
252
1998 43,173 -0.2426 56,441 2.0928 97,790 -0.0644 1999 43,145 -0.0649 57,259 1.4493 98,001 0.2158 2000 40,159 -6.9208 54,827 -4.2475 94,465 -3.6081 2001 38,953 -3.0031 57,659 5.1663 92,714 -1.8536 2002 40,805 4.7544 64,156 11.2669 95,084 2.5562 2003 37,499 -8.1019 65,272 1.7394 87,666 -7.8015 2004 41,748 11.3310 57,560 -11.8152 89,884 2.5301 2005 39,887 -4.4577 64,755 12.4995 88,817 -100.0000
Source: Ministry of Industry
Figure 4. Thai percentage annual changes of number of rice-milling firms, total investment, total labor employed
(20)
(10)
0
10
20
30
1987 1988 1989 1990 1991 1992 1993 1994 1995 1996 1997 1998 1999 2000 2001 2002 2003 2004 2005
%
Annual changes of ricemillsAnnual changes of investmentAnnal changes labor employed
The number, investment, and labor employed of rice-mill statistics indicated rather clear structural changes toward more capital intensive rice-milling industry in response to the increasing competition in the world rice market along the trade liberalization movements. However, government market interventions induced further adjustment rice-mill industry that may either over or under adjustment in response to the policy and measures implemented each year.
Figure 5. Thai average investment per rice mill (baht/rice-mill)
0
500000
1000000
1500000
2000000
1987 1988 1989 1990 1991 1992 1993 1994 1995 1996 1997 1998 1999 2000 2001 2002 2003 2004 2005Year
baht
Inv/rice-mill(baht)

253
Figure 6. Thai ratios between investment and labor of rice-mill (baht/labor)
0
100000
200000
300000
400000
500000
600000
700000
800000
1987 1988 1989 1990 1991 1992 1993 1994 1995 1996 1997 1998 1999 2000 2001 2002 2003 2004 2005Year
baht
Inv./labor(baht/head)
The structural change in rice mill industry could also be further analyzed by statistics from the Department of Business Development (DBD). The number of establishment of rice mills, average principal revenue of firms classified into 3 sizes according to the DBD were utilized for calculating the market share by size of firms. The results are to be discussed. 5. Results of the analysis 5.1. Methodology Market structure, conducts and performance (SCP) analysis The study of impacts of trade liberalization on the performance of the food industry was carried out using SCP analysis. In theory market structure defined as a selected number of organizational characteristics of a market that establishes relationships between buyers and sellers of homogeneous products. More specifically it refers to the number and size of distribution of firms and entry barriers arising from the technology of production (Rugayah, 1993a). There are many market structure indicators such as concentration ratio CR), Herifindahl-hirschman Index (HHI), Gini Coefficient and Lorenz Curve. The market share analysis was undertaken for selected food processing industry. The market share is estimated by dividing the total principal revenue of the firms in each size by the total principal revenue of the whole industry. That is: MSi = TPRi/TPRt……………………………….(1) Where: MSi = Market share of firms size i which represents small, medium, and large; TPRi = Total principal revenue of firms size i. ; and TPRt = Total principal revenue of all firms under the industry. The concentration ratio (CR) and Herifindahl-hirschman Index (HHI) of the selected food processing industries were also computed using the total principal revenue data.

254
The marketing conduct analysis was conducted based on the interview of key informant of the industry on issues such as determination of price and output and barriers to entry limit competition by preventing market entry of new firms. Market performance of the selected industry was assessed by the overall net profits of the selected industries during 1999-2004. 5. 2. Selection of commodities and industries for analysis Commodity selection is based on the export value of the commodity within each agricultural sub-sector. However, the selection of industry to be analyzed was constrained by the availability and the continuity of data, especially the classification of 3 sizes of firms. Ideally, the selection should be based on the importance of the industry’s contribution to the economy such as GDP, total value of export and employment. The selection of the study employed the agricultural sub-sector criteria. That is within the 4 broad sub-sectors namely; (1) crop; (2) fruit and vegetable; (3) fishery; and (4) livestock, and at least one agro-processing or industry was selected as a representative of the sector for study. Therefore, the selected agro-processing or industries for the analysis are as follows:
1. Crop sub-sector 1) rice mills 2) flour mills 3) cassava starch
2. Fruit and vegetable sub-sector: 1) canned fruit and vegetable processing
3. Fishery sub-sector 1) sea food processing 2) canned sea food processing
4. Livestock sub-sector 1) Slaughterhouse
5.3. Analysis of market structure, conducts and performance (SCP) The market share analysis and market performance analysis utilized the statistic from the Department of Business Development (DBD), Ministry of Commerce. The DBD information statistic categorized business into 17 sectors. The sectors that related to agriculture are: sector a) agriculture, hunting and forestry; sector b) fishery; sector d) manufacturing. Only those sub-sectors that the total number of firms is more than 30 firms, and then firms are classified into 3 sizes namely: small, medium and large according to the firm’s total assets by the DBD. Data are available from 1999 to 2004 or 2005. Some sub-sectors’ data were not complete for not analysis; therefore, the analysis was carried out for the selected sub-sectors with complete time series during 1999 to 2005. Market conducts information obtained from the interview of selected industries stakeholders market was summarized and discussed. The results are discussed as the followings.

255
5.3.1 Rice mills The reported total number of rice mills data from the DBD increased from 726 firms in 1999 to 848 firms in 2004, except the unusual record in 2003. Almost 40 per cent of the total rice mill firms are the medium size, while the numbers of small and large size firms are almost the same. The total principal revenue of reported rice mills were computed by adding the total revenue of each size for firms which were calculated by multiplying average principal revenue of each size of firms by the number of firms. The total principal revenue of the rice-mill firms increased from 22,828 millions of baht in 1999 to 34,633 millions of baht in 2003, and then it jumped to 60,719 millions of baht in 2004. During this period, a clear upward trend of principal revenue was observed (Table 5.1). During 1999-2004, the total assets of each size of rice-mill firm was rising every year, for example the small size total asset increased from less than 1.94 millions of baht to less than 4.94 millions of baht, while the medium size jumped from less than 5,96 millions of baht to less than 19.26 millions of baht. This suggests the expansion of rice-mill firms’ business performance over the period. The estimated market share of each size of rice-mill firms for the period of 1999 to 2004 showed that the market share of small size was almost the same at around 7 per cent, while the market share of medium size was on the rise from 19 per cent in 1999 to 23 per cent. However, the large size rice-mill firms’ market share fell down from 74 per cent in 1999 to 70 per cent (Table 5.1). The average net profit of each size of rice mills obtained from the DBD revealed that the net profit of the small size rice mills was 48,022.02 baht in 1999 which as about 36.3 per cent and 15.2 per cent of the net profits of medium and large size, respectively. The average net profit of the small rice mill increase to 196,656.80 in 2004 that was 29.5 per cent of the medium size and 77.8 per cent of the large size (Table 5.2) During 1999-2004, the average net profit of the small and medium size rice mill showed an upward trend, especially the medium size a rather steep trend was observed. The large size rice mills’ average net profit was fluctuating between 252,851.10 in 2004 and 822,994.80 in 2001. Nevertheless, the total net profits for all rice mills increased every year from 118 millions of baht in 1999 to 340 millions of baht in 2004. This would imply that the overall performance of rice milling industry was making profit in which the medium size rice mill performed better than the small and large sizes. It was expressed by the rice mills industry that the decline of large rice-mills’ average net profit starting from 2001 was due to the investment in rice color sorting equipment of large rice-mills. Therefore, the decrease in net profits was due to the depreciation of investment (Table 5.2) The available statistic of average net profit of each size of firms suggests that the overall performance of rice-mill firms have been favorable that may due to the trade liberalization and positive government policies. The market share and average net profits indicated the medium size firms were gaining more market share and profit from the large size firms. This may imply the large size firms could not achieve gain from economy of scale over the medium size firms.

256
The computed concentration indicators for rice mills revealed that CR1 in 1999-2000 were more than 39 per cent, and then it decreased to less than 32 per cent during 2001-2003 and jumped up to 53 per cent in 2004. These indicated that the industry or market was dominated by one company during 1999-2000 and 2004. During 1999-2004, the computed value of CR3 and CR5 were more than 70 per cent and 80 per cent respectively, which indicated that the present of market dominance. The magnitudes of HHI were more than 1,800 that reflected the highly concentrated industry during the period. All these indicators pointed out that during 1999-2004 the rice-mill industry was highly concentrated by five large firms (Table 5.3)
It is interesting to note that registered firm within CR1 and CR3 are all company limited. And the top three firms (CR3) have been the same since 1999. However, there was one public company that was ranked as last firm of CR5. This firm’s principal revenue has been with the top ten highest revenue firms during the Table 5.3 Thai number of establishment of rice mills, concentration rations, and HHI
Year No. firms CR1 CR3 CR4 CR5 CR8 HHI1999 726 39.13 66.95 76.91 86.05 96.01 2,160.28 2000 732 39.69 72.42 82.67 87.45 95.41 2,270.94 2001 756 31.53 69.61 79.74 87.29 96.22 1,945.16 2002 797 31.49 71.84 80.60 86.13 95.60 2,103.39 2003 840 23.56 66.60 76.91 82.39 94.77 1,838.22 2004 848 53.08 71.62 79.54 84.08 95.45 3,128.12
Source: Department of Business Development, Ministry of Commerce studied period. The status of firms illustrated that the rice mills industry are still depend funding from private firms and commercial banks. The point of view from the rice-mill industry expressed that medium size firms are more flexible in adopting marketing strategy and the high sale volume did not always ensure more profits to the firms. More over, the present over capacity of rice mills in Thailand create problems on shortage of row materials of large rice mills. It was estimated that total paddy production of Thailand at around 24 million tons per year could be milled into rice in less than 4 months with existing rice milling capacity. Most of the small village rice mills served the village level market in a relatively small proportion, while small rice-mill firms’ products sold in both domestic and export markets. The local packed rice markets are very competitive among all sizes of rice mills and rice packaging/conditioning factories, while the export markets are completing among hundred rice exporters. All these firms are registered under rice mills firms or wholesalers. Although trade liberalization opens more markets for Thai rice, it also creates higher competitions and fluctuations in the world markets. As the world rice market became more dynamic, the availability of up-to-date and timely

257
market information is crucial for decision making of all market participants in the rice industry. Therefore, to enable small and medium size firms to take advantage of trade liberalization, ways and means should be explored for providing quality and timely market information as well as providing and updating trade regulations in major importing countries.

258
Table 5.1. Thai number of establishment of rice mills, average principal revenue of firm and market share by size of firmsYear Total
Small Medium Large Total Small Medium Large Mil. Baht Small Medium Large Total1990 218 290 218 726 7,332,104.16 14,980,428.02 77,453,226.60 22,827.53 7.00 19.03 73.97 1002000 220 292 220 732 6,755,321.17 18,675,258.04 76,551,283.82 23,780.63 6.25 22.93 70.82 1002001 227 302 227 756 8,068,417.24 18,954,882.08 85,401,497.30 26,942.04 6.80 21.25 71.95 1002002 239 319 239 797 9,922,164.72 25,770,137.64 105,431,924.13 35,790.30 6.63 22.97 70.41 1002003 253 335 152 740 11,972,185.69 33,384,482.58 134,341,173.60 34,632.62 8.75 32.29 58.96 1002004 255 338 255 848 15,936,046.83 41,614,238.08 167,020,099.67 60,719.43 6.69 23.16 70.14 100
Remarks:The size of firm small (S), medium (M), and Large (L) are classified according to the total assets of firm in baht in each year as follows1990 [S(218) <= 1,942,000.00 < M(290) <= 5,975,500.00 < L(218)] , 2000 S(220) <= 2,002,900.00 < M(292) <= 5,985,400.00 < L(220)]2001[S(227) <= 2,338,321.10 < M(302) <= 7,646,868.75 < L(227)] , 2002 [S(239) <= 2,869,199.20 < M(319) <= 10,419,911.86 < L(239)]2003 [S(253) <= 3,500,000.00 < M(335) <= 14,516,851.86 < L(252)] , 2004 [S(255) <= 4,940,734.07 < M(338) <= 19,265,135.66 < L(255)]Source : Department of Business Development, Ministry of Commerce
Number of establishments (firms) Average principal revenue of firm (baht) Market share of firm (%)
Table 5.2. Thai average net profit of rice mills by size and total net profit of all rice mills
Total of all rice millsSmall Medium Large mills (Mil. Baht)
1999 48,022.02 132,250.00 316,047.20 118.002000 35,074.77 197,122.70 496,817.50 175.002001 53,070.14 219,691.90 822,994.80 265.002002 102,025.80 394,335.30 425,665.40 252.002003 148,463.70 467,724.60 561,025.20 336.002004 196,656.80 667,577.90 252,851.10 340.00
Remarks:The size of firm small (S), medium (M), and Large (L) are classified according to the total assets of firm in baht in each year as follows1990 [S(218) <= 1,942,000.00 < M(290) <= 5,975,500.00 < L(218)] , 2000 S(220) <= 2,002,900.00 < M(292) <= 5,985,400.00 < L(220)]2001[S(227) <= 2,338,321.10 < M(302) <= 7,646,868.75 < L(227)] , 2002 [S(239) <= 2,869,199.20 < M(319) <= 10,419,911.86 < L(239)]2003 [S(253) <= 3,500,000.00 < M(335) <= 14,516,851.86 < L(252)] , 2004 [S(255) <= 4,940,734.07 < M(338) <= 19,265,135.66 < L(255)]Source : Department of Business Development, Ministry of Commerce
Average net profit of rice mills (baht)

259
5.3.2 Flour mill The total number of flour-mill firms increased slowly from a total of 98 mills in 1999 to 118 mills in 2004. The medium size mills accounted for 38 per cent of the total, while the rest were equally divided into small and large size. The total assets of firms that were used for classifying small, medium and large size firm were decreasing. In 1999, the small size firms’ the total asset was less than or equal to 7.59 millions of baht, while in 2004 the total asset was decreased to less than or equal to 5.85 millions of baht. However, the total principal revenue of the flour-mill firms was steady increase from 17,140 millions of baht in 1999 to 25,043 millions of baht in 2004 (Table 5.4). The estimated market share showed the domination of large size firms at 82 per cent in 1999 and expanded to 87 per cent in 2004. The expansion of the market share of large firms was at the expense of the diminishing market shares of both small and medium size firms. These were supported by the decreasing average principal revenue of the small size firms and that of the medium size firms was almost constant during the 1999-2004. The small size firms’ market share was less than 3 per cent in 1999 and drop to only 0.53 per cent in 2004. Although the market share of the medium size firms’ market share was slightly decreasing, these firms were able to maintain the market share at more than 12 per cent in 2004 (Table 5.4). In terms of market performance of the flour milling industry, the total net profit of flour mills industry depicted an upward trend from 1,872.17 millions of baht in 1999 to 2,950.81 millions of baht in 2004. Most of the net profit was belong to the large size flour mills of which the average net profit increased from 22.7 to 33.9 millions of baht. During this period, the average net profit of the small size flour mills was negative, except in 2001. The similar situation was found for the medium size flour mills, only there were 2 years (2003 and 2004) that the net profits were positive. That means, on the average, some of the small and medium size flour mills were operating at loss (Table 5.5) The estimated value of CR1, CR3, and CR5 portrayed an upward trend starting from 1999 until 2004. However, there was no single firm dominated in the industry (CR1 was less than 31 per cent). The percentages of CR3 were in the range between 50.06 to 60.42 per cent which were slightly more than 50 per cent, while that of the CR5 were in between 67.30 to 74.42 per cent that was somewhat higher than 67 per cent which suggested some degree of market domination in the industry. Nevertheless, the calculated HHI were between 1,252.77 and 1,619.74. These means there are concentration in the industry. Both indicators suffice one to say that there was slightly degree of market domination during 1999 -2003, and then there was a tendency of higher degrees of industry domination in 2004 that was indicated by an increase of all computed indicators (Table 5.6) Among the top 10 flour mills (CR10), there was only one firm registered as public company and it was ranked the second highest principal revenue during 1999-2004, excepted in 2003 it was ranked the first. Almost the same firms have been holding the position as the first and the third highest principal revenue. It was pointed out by the interviewed firm that, among the top 10 firms, there were 6 large flour mills that were

260
involved in producing wheat flour and flour products, 3 large tapioca modified starch producers, and large rice flour mills. Only the wheat-flour mills utilized imported raw material, while the others used domestic material (native or raw cassava starch and rice). Table 5.6 Thai flour mills, concentration ratios, and HHI
Year CR1 CR3 CR4 CR5 CR8 HHI1999 22.17 51.91 60.00 67.88 89.40 1,339.03 2000 24.09 50.83 59.31 67.30 89.05 1,350.74 2001 25.81 52.17 61.24 69.06 89.41 1,377.93 2002 23.90 58.43 65.63 72.39 90.56 1,425.25 2003 20.95 50.06 58.81 67.54 89.11 1,252.77 2004 30.80 60.42 67.68 74.42 90.91 1,619.74
Source: Department of Business Development, Ministry of Commerce The above results showed that the flour-mill firms are dominated by the large size firms with profitable business operation. However, the small and medium size firms experienced with operating at loss in this sub-sector. The flour-mill industry expressed that the industry has been adopting modern technology so as to take advantage of the new trade liberalization and quality standard. The investment in modern processing and quality improvement equipments requires sizable amount of funding of which some small and medium size firms might not be able to generate necessary financial credits. As a result, only those medium size firms with strong financial credit supports were able to investment of necessary modernized processing equipments so as to stay in the business. Nevertheless, this does not imply that there is an existing of technological or economical barriers to entry in this industry.
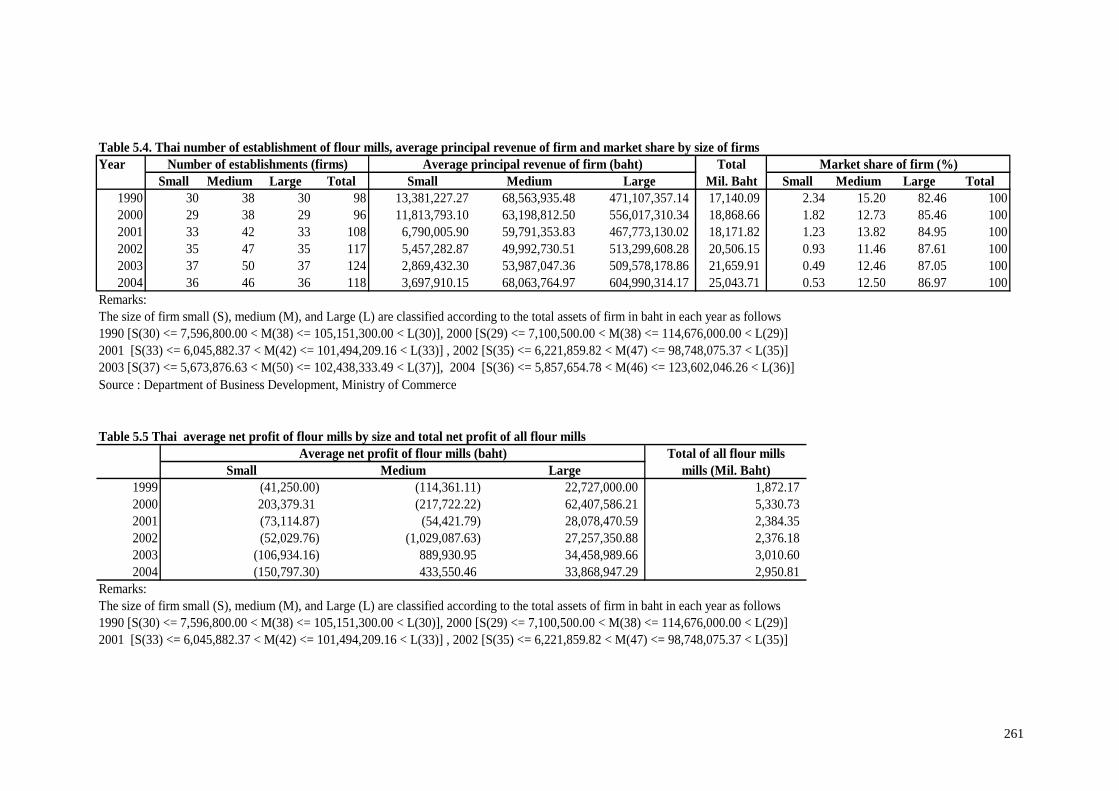
261
Table 5.4. Thai number of establishment of flour mills, average principal revenue of firm and market share by size of firmsYear Total
Small Medium Large Total Small Medium Large Mil. Baht Small Medium Large Total1990 30 38 30 98 13,381,227.27 68,563,935.48 471,107,357.14 17,140.09 2.34 15.20 82.46 1002000 29 38 29 96 11,813,793.10 63,198,812.50 556,017,310.34 18,868.66 1.82 12.73 85.46 1002001 33 42 33 108 6,790,005.90 59,791,353.83 467,773,130.02 18,171.82 1.23 13.82 84.95 1002002 35 47 35 117 5,457,282.87 49,992,730.51 513,299,608.28 20,506.15 0.93 11.46 87.61 1002003 37 50 37 124 2,869,432.30 53,987,047.36 509,578,178.86 21,659.91 0.49 12.46 87.05 1002004 36 46 36 118 3,697,910.15 68,063,764.97 604,990,314.17 25,043.71 0.53 12.50 86.97 100
Remarks:The size of firm small (S), medium (M), and Large (L) are classified according to the total assets of firm in baht in each year as follows1990 [S(30) <= 7,596,800.00 < M(38) <= 105,151,300.00 < L(30)], 2000 [S(29) <= 7,100,500.00 < M(38) <= 114,676,000.00 < L(29)]2001 [S(33) <= 6,045,882.37 < M(42) <= 101,494,209.16 < L(33)] , 2002 [S(35) <= 6,221,859.82 < M(47) <= 98,748,075.37 < L(35)]2003 [S(37) <= 5,673,876.63 < M(50) <= 102,438,333.49 < L(37)], 2004 [S(36) <= 5,857,654.78 < M(46) <= 123,602,046.26 < L(36)]Source : Department of Business Development, Ministry of Commerce
Number of establishments (firms) Average principal revenue of firm (baht) Market share of firm (%)
Table 5.5 Thai average net profit of flour mills by size and total net profit of all flour millsTotal of all flour mills
Small Medium Large mills (Mil. Baht)1999 (41,250.00) (114,361.11) 22,727,000.00 1,872.17 2000 203,379.31 (217,722.22) 62,407,586.21 5,330.73 2001 (73,114.87) (54,421.79) 28,078,470.59 2,384.35 2002 (52,029.76) (1,029,087.63) 27,257,350.88 2,376.18 2003 (106,934.16) 889,930.95 34,458,989.66 3,010.60 2004 (150,797.30) 433,550.46 33,868,947.29 2,950.81
Remarks:The size of firm small (S), medium (M), and Large (L) are classified according to the total assets of firm in baht in each year as follows1990 [S(30) <= 7,596,800.00 < M(38) <= 105,151,300.00 < L(30)], 2000 [S(29) <= 7,100,500.00 < M(38) <= 114,676,000.00 < L(29)]2001 [S(33) <= 6,045,882.37 < M(42) <= 101,494,209.16 < L(33)] , 2002 [S(35) <= 6,221,859.82 < M(47) <= 98,748,075.37 < L(35)]
Average net profit of flour mills (baht)

262
5.3.3 Cassava starch factories The total number of cassava factories and their principal revenue depicted an opposite trends, the former went down from 84 factories in 1999 to 79 factories in 2004, while the later went up from 13,629.42 to 17,610.45 millions of baht. The average principal revenue of small size factories decrease almost every year from 15.4 millions of baht in 1999 to 6.2 millions of baht in 2004, while that of the large size factories increased from 432.6 millions of baht to 565.0 millions of baht, except a slight decease in 2003 (381.6 millions of baht). However, the medium size factors’ average principal revenue expanded annually from 71.4 millions of baht in1999 to 125.9 millions of baht in 2004 (Table 5.7) During 1999-2004, the market share of the large size factories drop slightly from 79.4 to 77.0 per cent, while that of the small size factories diluted from 2.8 to 0.8 per cent. The decrease of the large and small sizes’ market share provided a gain for the medium size factories from 17.82 per cent to 22.16 per cent. Based on the computed market shares, the large size factors or firms appear to dominate the cassava starch industry (Table 5.7). The average net profits of all size of cassava starch factories were negative from 1999 to 2001. It turned to positive in 2002 for medium and large size, and in 2004 for the small size. The negative average net profit caused a negative net profit of the total cassava starch factories until 2001, and then a big jump to 1,371.66 millions of baht in 2003 and declined to 162.89 millions of baht in 2004. That means on the average starting from 1999 the small size factories is losing money 5 years continuously, while the medium and large size factories are also losing money for three straight years (Table 5.8). The negative net profit of cassava starch factories, as indicated by the industry, was partly due to the depreciation cost and high energy costs which are the one of the major input cost items in the processing. In addition, the price fluctuation of fresh cassava roots caused by the increasing demand for cassava chips for alcohol or ethanol (for gasohol) production in mainland China. During 1999-2004, the computed values of CR1 were fluctuated within 10 to 18 per cent, while that of the CR3 were in between 39 to 43 per cent. These indicated that there was no evidence of significant market dominance from the top 3 firms. However, value of the CR5 ranged from 62 to 66 per cent which were very close 66.7 per cent. This might reflect some degree of market domination from the top-5 firms in the industry. In terms of the overall trend, all 3 indicators showed a rather constant trend. The HHI were fluctuated in small range from 1,082 to 1,136 implying somewhat moderately concentrated phenomenon. Based on both indicators, it would be safe to conclude that a moderate dominance of large firms existed in the industry and there is no indication of increasing domination in the short run (Table 5.9) The structure of the registered firms is similar to the flour mill that is only one public company out of the top-10 firms. And the top-3 firms have been the same firms

263
Table 5.7 Thai number of establishment of cassava starch factories, average principal revenue of firm and market share by size of firmsYear Total
Small Medium Large Total Small Medium Large Mil. Baht Small Medium Large Total1999 25 34 25 84 15,453,880.00 71,416,041.67 432,597,240.00 13,629.42 2.83 17.82 79.35 1002000 24 32 24 80 5,942,916.67 55,319,956.52 381,635,291.67 11,072.12 1.29 15.99 82.72 1002001 26 33 26 85 7,759,344.88 64,948,322.22 415,996,978.90 13,160.96 1.53 16.29 82.18 1002002 23 31 23 77 7,316,445.77 93,642,494.68 439,368,010.55 13,176.66 1.28 22.03 76.69 1002003 24 30 24 78 9,820,638.52 112,695,259.65 511,595,642.76 15,894.85 1.48 21.27 77.25 1002004 24 31 24 79 6,174,033.45 125,882,127.04 564,997,030.76 17,610.45 0.84 22.16 77.00 100
Remarks:The size of firm small (S), medium (M), and Large (L) are classified according to the total assets of firm in baht in each year as follows1999 [S(25) <= 6,174,500.00 < M(34) <= 59,251,000.00 < L(25)], 2000 [S(24) <= 6,060,200.00 < M(32) <= 60,847,700.00 < L(24)]2001[S(26) <= 4,006,237.74 < M(33) <= 60,951,152.16 < L(26)] , 2002 [S(23) <= 5,126,626.95 < M(31) <= 109,833,857.58 < L(23)]2003 [S(24) <= 10,807,525.70 < M(30) <= 153,703,849.70 < L(24)] , 2004 [S(24) <= 10,555,297.11 < M(31) <= 189,332,753.96 < L(24)]
Number of establishments (firms) Average principal revenue of firm (baht) Market share of firm (%)
Table 5.8 Thai average net profit of cassava starch factories, and total starch factories
Total of all starch factoriesSmall Medium Large mills (Mil. Baht)
1999 (146,840.00) (574,687.50) (26,791,600.00) (693.00) 2000 (105,541.67) (573,100.00) (77,257,500.00) (1,875.05) 2001 (61,339.78) (231,489.04) (15,655,597.68) (416.28) 2002 (873,269.61) 290,783.78 1,022,741.74 12.45 2003 (134,953.31) 518,260.38 56,639,650.56 1,371.66 2004 1,128,619.95 380,635.25 5,166,713.02 162.89
Remarks:The size of firm small (S), medium (M), and Large (L) are classified according to the total assets of firm in baht in each year as follows1999 [S(25) <= 6,174,500.00 < M(34) <= 59,251,000.00 < L(25)], 2000 [S(24) <= 6,060,200.00 < M(32) <= 60,847,700.00 < L(24)]2001[S(26) <= 4,006,237.74 < M(33) <= 60,951,152.16 < L(26)] , 2002 [S(23) <= 5,126,626.95 < M(31) <= 109,833,857.58 < L(23)]2003 [S(24) <= 10,807,525.70 < M(30) <= 153,703,849.70 < L(24)] , 2004 [S(24) <= 10,555,297.11 < M(31) <= 189,332,753.96 < L(24)]Source : Department of Business Development, Ministry of Commerce
Average net profit of rice mills (baht)

264
that were rotating the ranking. From the industrial interview, the top-10 firms are both operating in the producing native cassava starch and modified cassava starch. Table 5.9. Thai cassava starch factories, concentration ratios, and HHI
Year CR1 CR3 CR4 CR5 CR8 HHI1999 14.37 42.24 53.12 62.98 87.97 1,104.26 2000 17.76 42.75 53.30 62.07 86.38 1,106.37 2001 15.81 39.98 51.53 62.59 85.65 1,082.53 2002 17.57 44.57 56.55 66.25 87.84 1,141.95 2003 10.27 39.30 52.13 63.13 86.33 1,094.63 2004 15.02 41.22 54.76 65.23 90.69 1,135.70
Source: Department of Business Development, Ministry of Commerce As pointed out by the leading cassava starch firm, the cassava industry as a whole is very competitive industry in which at least 3 different derived-demand for cassava fresh roots for processing are completing in the market. The first category is the derived demand for fresh cassava root for cassava starch processing. The second category is demand for root for processing cassava chip that is further processed into tapioca pellet for animal feed. And the third category is fresh root demand for cassava chips processing which is used for producing ethanol or alcohol. Therefore, the multiple usages of cassava fresh root creates variation of market demand that generate from different industries such as animal feed industry or ingredient commodity markets, alcohol industry, the energy industry and all other industries that used cassava starch as one major input such as food industry, paper and printing industry. Given the multiple market demand for cassava starch, one should bear in mind that the estimated market share for the period during 1999-2004 was not an ideal market structure indicator due to the heterogeneous products of cassava starch produced by each size of factory. In reality, each size of firms may serve different kind of users or markets. Nevertheless, the market share does indicate an overall market structure that was dominated by large firms. 5.3.4 Canned fruit and vegetable factories From 1999 to 2004, the total number of canned fruit and vegetable processors (or firms) increased slowly from 157 to 162 factories, of which the medium size firms accounted from 40 per cent. The average principal revenue of each size of firms and total firms showed an upward trend. However, there are big different in magnitude of average principle revenue of each scale of firms. For example, in 2004, in percentage terms of the large size firms the average principle revenue (640.387 millions of baht) the small size firm was only 0.45 per cent (2.920 millions of baht), and the medium size was 8.74 per cent (56.00 millions of baht). The overall performance of the industry was reflected by the increase of the total principal revenue of all firms from 29,032 to 35,106 millions of baht (Table 5.10)

265
During the period from 1999 to2004, the estimated market share for the small size canned fruit and vegetable processors was less then 0.5 per cent, while that of the medium size was around 11 per cent. As a result, a big market share for the large size firms at more than 89 per cent was estimated. This implies that large size firms are the major key players in this industry (Table 5.10). The average net profit of small and medium sizes showed negative figures almost every year, except in 2003 for small size and 2002 for medium size. The accumulated net profit from 1999-2004 revealed that, on the average, the small size firms managed to have a positive net profit at 0.455 millions of baht, while the medium size firms still encountered a loss of 4.829 millions of baht. Although the large size firms’ negative net profits were positive for the whole period, a sharp dropping trend was observed from 40.47 millions of baht in 1999 to 9.88 millions of baht in 2004. The total all processors net profits shared the same pattern as the large size firms. This was due to the high degree of market share of large size firms (Table 5.11)
An increasing trend was observed for the calculated CR1, CR3 and CR5 value during the period of 1999 to 2003, and then there were a slight declining trend in 2004. The highest value of CR1 was 32 per cent in 2002 and the lowest was at 17 per cent in 1999. And the highest CR3 was in 2003 at 58 per cent. These mean no evidence of market domination of the first and the top-3 firms in the industry. The computed CR5 values were between 68 per cent and 77 per cent which were higher than 66.7 per cent. The indicated an existence of market dominance of the industry. The moderate market domination was further verified by the estimated HHI which was increased from 1,195 in 1999 every to 1,628 in 2003 and then decreased to 1,496 in 2004 (Table 5.12) There were 4 public companies out of the top-10 registered firms. The first and the second highest principal revenue firms have been the same firm through out the period of 1999 to 2003. The number one firm was registered as company limited and has been the leader of canned pineapple industry. From the field visit, at least 3 out of the top-10 firms are canned pineapple factories, while the rest are factories that are producing various kinds of canned fruits and vegetable such as rambutan, baby corn, bamboo shoot etc. Table 5.12 Thai canned fruit and vegetable processors, concentration ratois, and HHI
Year CR1 CR3 CR4 CR5 CR8 HHI1999 17.46 46.66 58.14 68.29 91.77 1,194.56 2000 19.79 48.79 59.13 69.38 89.34 1,229.74 2001 23.41 53.34 63.30 72.49 89.81 1,335.16 2002 28.57 56.50 67.82 73.95 90.21 1,513.77 2003 31.39 57.88 67.50 76.77 91.86 1,628.09 2004 28.51 54.08 64.14 72.88 92.36 1,496.06
Source: Department of Business Development, Ministry of Commerce

266
Table 5.10 Thai number canned fruit and vegetable processors (firms), average principal revenue, and market share by size of firmYear Total Rev.
Small Medium Large Total Small Medium Large Mil. Baht Small Medium Large Total1999 47 63 47 157 2,401,892.86 49,704,385.72 548,680,114.01 29,032.23 0.39 10.79 88.83 1002000 48 62 48 158 2,978,068.97 50,125,840.82 486,029,666.23 26,580.17 0.54 11.69 87.77 1002001 50 67 50 167 2,875,281.88 49,926,962.96 527,086,633.52 29,843.20 0.48 11.21 88.31 1002002 50 67 50 167 2,756,086.28 50,328,141.85 502,469,152.91 28,633.25 0.48 11.78 87.74 1002003 52 68 51 171 2,412,439.21 60,720,059.33 638,151,972.38 36,800.16 0.34 11.22 88.44 1002004 49 64 49 162 2,919,939.71 56,000,876.19 640,386,843.98 35,106.09 0.41 10.21 89.38 100
Remarks: Agricultural raw material wholesalers excluding agricultural inputs, live animal and animal feeds. The size of firms are classified by its total assets as follows:1999 [S(47) <= 4,806,600.00 < M(63) <= 83,022,800.00 < L(47)], 2000 [S(48) <= 4,146,800.00 < M(62) <= 80,361,100.00 < L(48)]2001 [S(50) <= 4,346,461.41 < M(67) <= 85,097,180.64 < L(50)] , 2002 [S(50) <= 4,838,095.15 < M(67) <= 74,493,992.07 < L(50)]2003 [S(52) <= 4,961,225.85 < M(68) <= 77,113,652.85 < L(51)], 2004 [S(49) <= 5,268,442.38 < M(64) <= 84,615,335.31 < L(49)]
Number of establishments (firms) Average principle revenue of firm (baht) Market share of firm (%)
Table 5.11: Thai average net profit canned fruit and vegetable processors (firms) and total canned factories
Total of all processorsSmall Medium Large mills (Mil. Baht)
1999 -96977.78 -1152243 40,470,110.28 1824.952000 -24353.26 -936668.49 10,648,732.15 451.902001 -82390.28 -1931511.18 19,926,378.48 862.792002 -11893.3 167816.45 15,055,389.25 763.422003 727146.15 -496323.69 5,927,212.73 312.282004 -55931.01 -480646.41 9,882,169.81 450.72
Remarks: Agricultural raw material wholesalers excluding agricultural inputs, live animal and animal feeds. The size of firms are classified by its total assets as follows:1999 [S(47) <= 4,806,600.00 < M(63) <= 83,022,800.00 < L(47)], 2000 [S(48) <= 4,146,800.00 < M(62) <= 80,361,100.00 < L(48)]2001 [S(50) <= 4,346,461.41 < M(67) <= 85,097,180.64 < L(50)] , 2002 [S(50) <= 4,838,095.15 < M(67) <= 74,493,992.07 < L(50)]2003 [S(52) <= 4,961,225.85 < M(68) <= 77,113,652.85 < L(51)], 2004 [S(49) <= 5,268,442.38 < M(64) <= 84,615,335.31 < L(49)]Source: Department of Business Development, Ministry of Commerce
Average net profit of canned fruit & vegatable processors (baht)
267
Information obtained from the industry indicated that small firms mostly serve the local markets, while the medium and large firms’ products serve both domestic and export markets. There are different in quality and forms of products produced and marketed. Therefore, the interpretation of available information should be done with care. It should also be pointed out that among the large firms there are product differences and different markets. Although the large firms are competing, the cooperation among the large and medium firms on solving trading problems of the industry is quite strong through the trade association. One medium size firm expressed that the information on trade liberalization are not very update and difficult to under, therefore, there is a need for more understandable and timely information. 5.3.5 Sea food processors The sea food processors or firms covered factories that preserved, prepared or processed food such as fish, shell and other sea food. The total number of sea food processors increased from 193 in 1999 to 231 in 2004, in which about 40 per cent of the total is classified as medium size. During 1999-2004, the average principal revenue of each size of firms and total of all firms has been decreasing. However, there was a temporary slight increase in 2000-2001 for the average principal revenue of the medium and large size firms. The total principal revenue of all firms increased from 115,216 millions of baht in 1999 to 144,257 millions of baht in 2001, and then steadily decreased to 120,768 millions of baht in 2004 (Table 5.13.). The estimated market share showed that the small size firms had very small share fluctuated between 0.37 per cent in 2000 to 0.73 per cent in 2002, and fall to 0.48 per cent. The medium size firms’ market share was at 14.14 per cent in 2000 and then it went down almost every year to 11.68 per cent. The market share of the large firms was the biggest at about 87 per cent during the six year period (Table 5.13). During 1999-004, almost every year, the average net profit of small and medium size firms was negative. The only year that net profit was positive for the small size was in 2003 and medium size firm was in 2002. Nevertheless, on the average, both small and medium size firms experienced with an accumulated loss at 0.859 and 10.10 millions of baht, respectively. Only the large size firms had positive net profit during the period, however, a rapid declining trend of net profit was observed starting from 2001. The total net profit of all firms shared the same pattern trend and fluctuation as that of the large size firms (Table 5.14). All calculated values of CR1, CR3 and CR5 increased from 17, 46 and 63 per cent in 1999 to 21, 52 and 67 per cent in 2004, respectively. Based on the selected criteria for concentration ratios, there is no strong ground to indicate the existing market domination. Nevertheless, the computed HHI increased from 1,126 in 1999 to 1,319 in 2004 that reflected an increasing market dominance of the industry. In fact, a sharp upward trend of HHI was observed starting from 2002 (Table 5.15). In 1999, there were 6 registered public companies out of the top-10 firms, while in 2004 the number decreased to 4 out of 10 firms. The highest principal revenue firm has been alternating between 2 limited companies during 1999-2001, and then the

268
public company was ranked the second from 2002 onward in which the total principal revenue was more than 8,000 millions of baht per year. From the interview, the reason for the higher number of public company in this industry was due mainly to the increasing need for investments and expansion of the industry in which heavy capital investment in modern technology to keep up with the dynamic development of world market.
Information on the sea food processors showed a very similar situation like that of canned fruit and vegetables processors that is the domination of large firms and the very low share of small firms. One reason is the difference in products and market served of firms. This also reflects the divergence of scale of investment and operation. It was pointed out by the industry that some small and medium firms faced difficulties of meeting the hygienic and food safety requirements for export markets. Therefore, these firms could not derived benefit from the trade liberalization directly. Nevertheless, these firms derived indirect benefit of trade liberalization through the domestic market expansion due to the economic growth. 5.3.6 Canned sea food processors The number of canned sea food processors reported by the DBD was less than 30 firms, so there were no classifications of small, medium and large sizes. The selected year’s principle revenue of firms in 1999, 2002, and 2004 were used for constructing the Lorenz curve. The principal revenue data ranking from small to large showed a vast difference between the smallest and the largest each year, while the total principal revenue of all firms increased from 9,292.10 millions of baht in 1999 to 17,970.98 millions of baht in 2004. Given the difference number of firms report each year, it was observed that the number of firms that had total principal revenue more than 1,000 millions of baht per year increased from 4 firms (25 per cent of the total) in 1999 to 5 firms in 2002 (40 per cent of the total and 7 firms (30 per cent) in 2004. This would imply that the industry has developed and created a large firms dominating situation (Table 5.16.).
Table 5.15. Thai sea food processors, concentration rations, and HHIYear CR1 CR3 CR4 CR5 CR8 HHI1999 17.34 45.57 54.66 63.04 85.67 1,125.89 2000 17.60 43.93 56.04 64.09 86.79 1,127.43 2001 18.81 45.88 57.58 66.52 87.61 1,164.84 2002 16.45 46.01 56.33 64.39 86.53 1,135.84 2003 19.36 47.47 56.64 65.17 86.89 1,215.11 2004 21.30 51.69 59.76 67.30 88.29 1,319.23
Source: Department of Business Development, Ministry of Commerce

269
Table 5.13 Thai number sea food processors (firms), average principal revenue, and market share by size of firmYear Total Rev.
Small Medium Large Total Small Medium Large Mil. Baht Small Medium Large Total1999 58 77 58 193 11,444,444.44 192,037,209.68 1,720,097,763.64 115,216.31 0.58 12.83 86.59 1002000 60 80 60 200 7,916,497.38 229,394,420.78 1,849,188,043.76 129,777.83 0.37 14.14 85.49 1002001 65 85 65 215 15,379,402.66 210,336,799.17 1,928,896,502.11 144,256.56 0.69 12.39 86.91 1002002 66 86 66 218 14,417,916.94 179,563,727.36 1,737,452,038.33 131,065.90 0.73 11.78 87.49 1002003 67 90 67 224 9,812,383.50 153,867,263.83 1,641,502,842.90 124,486.17 0.53 11.12 88.35 1002004 70 92 69 231 8,291,233.39 153,327,102.59 1,537,417,076.02 120,768.26 0.48 11.68 87.84 100
Remarks: Agricultural raw material wholesalers excluding agricultural inputs, live animal and animal feeds. The size of firms are classified by its total assets as follows:1999 [S(58) <= 12,549,400.00 < M(77) <= 185,506,400.00 < L(58)], 2000 [S(60) <= 12,097,300.00 < M(80) <= 203,440,800.00 < L(60)]2001 [S(65) <= 12,329,272.84 < M(85) <= 228,155,988.70 < L(65)] , 2002 [S(66) <= 10,924,627.48 < M(86) <= 218,654,732.48 < L(66)]2003 S(67) <= 9,483,492.77 < M(90) <= 186,697,835.29 < L(67)], 2004 [S(70) <= 6,525,213.18 < M(92) <= 184,012,839.00 < L(69)]
Number of establishments (firms) Average principle revenue of firm (baht) Market share of firm (%)
Table 5.14 Thai average net profit sea food processors (firms), and total processorsTotal of all processors
Small Medium Large mills (Mil. Baht)1999 (85,446.43) (211,666.67) 48,145,196.43 2,771.17 2000 (88,258.62) 379,191.10 55,608,412.86 3,361.54 2001 (219,550.13) (1,551,412.21) 60,560,132.23 3,790.27 2002 (373,694.67) (3,913,004.15) 30,899,822.20 1,678.21 2003 (137,629.33) (3,579,093.63) 36,695,792.70 2,127.28 2004 44,936.72 (1,219,783.44) 38,591,866.33 2,553.76
Remarks: Agricultural raw material wholesalers excluding agricultural inputs, live animal and animal feeds. The size of firms are classified by its total assets as follows:1999 [S(58) <= 12,549,400.00 < M(77) <= 185,506,400.00 < L(58)], 2000 [S(60) <= 12,097,300.00 < M(80) <= 203,440,800.00 < L(60)]2001 [S(65) <= 12,329,272.84 < M(85) <= 228,155,988.70 < L(65)] , 2002 [S(66) <= 10,924,627.48 < M(86) <= 218,654,732.48 < L(66)]
Average net profit sea food processors (firms) (baht)

270
The plotted Lorenz curve depicted that the accumulated principal revenue the canned food firms moved toward the large size firms. The area between the 45 degree line (or the cumulated per cent of firms) and the Lorenz curve (cumulated per cent of market share), let say area “A”, represents the degree of concentration of market share to the cumulated per cent of firms. The larger the area “A” means more unequal distribution of market shares among firms. It could be observed that the area “A” in 1999, 2003 and 2004 were almost the same size and Lorenz curve shifted downward. This means the large size firms have more market share than that of the small and medium size firms, and the small firms’ market share gradually decreased (Figure 7, 8, and 9.). Table 5.16. Thai principal revenue of canned food processor by firm in 1999, 2002 and 2004 (Unit: baht)Firm 1999 2002 2004
1 30,000.00 3,750.00 142.30 2 250,000.00 1,186,240.00 3,000.00 3 1,759,000.00 4,808,550.71 9,500.00 4 4,031,000.00 11,164,000.00 19,000.00 5 5,283,000.00 330,759,983.84 379,401.87 6 5,973,696.10 487,606,022.94 481,570.00 7 6,860,000.00 746,923,797.93 2,922,365.00 8 233,770,000.00 1,068,014,853.00 3,391,903.52 9 402,812,000.00 1,321,008,525.00 6,671,127.30
10 459,398,000.00 2,363,927,692.26 24,033,406.91 11 550,242,000.00 2,999,600,569.00 77,897,130.55 12 890,986,000.00 3,529,177,246.86 135,877,750.16 13 1,379,971,000.00 166,974,187.85 14 1,427,003,000.00 747,731,648.89 15 1,737,947,000.00 764,040,547.00 16 2,185,786,000.00 1,261,161,644.24 17 1,403,413,932.00 18 1,741,261,768.34 19 2,099,731,379.45 20 2,477,656,306.00 21 2,914,001,072.15 22 4,143,316,289.27
Total 9,292,103,695.10 12,864,181,231.54 17,970,975,072.80 source: Department of Business Develolpment, Ministry of Commerce Bangkok, Thailand 5.3.7 Slaughterhouse The number of registered slaughterhouses or firms increased from 31 in 2001 to 52 in 2003 in which the large firm increased from12 to 20 in the respective years. The total principal revenue of the industry was 23,687 millions of baht in 2001 and increased to 30,544 millions in 2003 and then decreased to 28,844 million baht. The decrease was due to the declining of average principal revenue of the large firms from 2,572 millions of baht in 2001 to 1,762 millions of baht in 2003. The large firms market share was 98 per cent of the total in 2001 and almost constant until 2003. The

271
Figure 7. Thai Lorenz curve & Gini Coefficient of canned food manufacturers 1999
0
20
40
60
80
100
1 2 3 4 5 6 7 8 9 10 11 12 13 14 15 16Cumulated % of firms
Cum
ulat
ed %
of m
arke
t sh
are
Cumulated% offirms
Figure 8. Thai Lorenz curve & Gini Coefficient of canned food manufacturers 2002
0
20
40
60
80
100
1 2 3 4 5 6 7 8 9 10 11 12Cumulated % of firms
Cum
ulat
ed %
of m
arke
t sh
are
Cumulated %of firms
Cumulated %
Figure 9. Thai Lorenz curve & Gini Coefficient of canned food manufacturers 2004
0
20
40
60
80
100
1 2 3 4 5 6 7 8 9 10 11 12 13 14 15 16 17 18 19 20 21 22Cumulated % of firms
Cum
ulat
ed %
of m
arke
t sha
re
Cumulated % offirms
Cumulated % ofmarketshare
market shares of small size firms are almost imperceptible and that of the medium size are less than 3 per cent. These clearly showed that the industry is under the control of large firms (Table 5.17.). During 1999-2003, the estimated value of CR1, CR3 and CR5 showed slow downward trend from 36 per cent, 67 per cent and 87 per cent to 27.4 per cent, 54 per

272
cent and 83 per cent, respectively. These indicated the existence of market dominance of large firms in the industry. The computed HHI was 2,081in 1999 and reduced to 1,507 in 2003. This reflected that highly concentrated industry was slowly moving toward moderately concentrated industry (Table 5.18.). Table 5.18 Thai number of establishment slaughterhouse and meat processors,
concentration rations, and HHYear No. of firms CR1 CR3 CR4 CR5 CR8 HHI1999 23 36.24 67.17 80.89 87.37 98.75 2081.142000 25 34.01 64.46 78.45 91.41 99.13 2019.232001 31 31.30 61.35 75.96 87.84 98.07 1836.052002 34 29.93 59.78 74.02 84.63 95.64 1712.522003 43 27.41 54.20 66.98 77.27 94.60 1507.342004 52 27.89 62.31 72.42 81.67 94.60 1704.50

273
Table 5.17 Thai number slaughterhouses (firms), average principal revenue, and market share by size of firm
Year Total Rev.Small Medium Large Total Small Medium Large Mil. Baht Small Medium Large Total
1999 - - - - - - - - - - - -
2000 - - - - - - - - - - - -
2001 10 12 9 31 4,960,292.27 40,414,603.09 2,572,524,374.58 23,687.30 0.21 2.05 97.74 100
2002 10 14 10 34 6,123,457.04 68,026,885.44 2,417,118,910.69 25,184.80 0.24 3.78 95.98 100
2003 13 17 13 43 9,165,402.31 16,053,924.66 2,319,393,620.80 30,544.18 0.39 0.89 98.72 100
2004 16 20 16 52 7,500,116.87 25,894,436.79 1,762,888,610.47 28,844.11 0.42 1.80 97.79 100
Source: Department of Business Development, Ministry of CommerceRemarks: in 1999 and 2000 the total number of establishments was less than 30, therefore no classification of firm size according to its total assets. From 2001 to 2004, the size of firms are classified by its total assets as follows:2001 [S(10) <= 3,254,271.79 < M(12) <= 40,213,239.18 < L(9)] , 2002 [S(10) <= 1,975,287.27 < M(14) <= 87,952,188.03 < L(10)] 2003 [S(13) <= 1,700,347.67 < M(17) <= 52,592,835.22 < L(13)] , 2004 [S(16) <= 1,991,252.53 < M(20) <= 38,486,930.65 < L(16)]
Number of establishments (firms) Average principle revenue of firm (baht) Market share of firm (%)

274
6. Summary and conclusion 6.1 Summary In general, the contribution of the Thai agricultural sector to the overall GDP has been declining since early 1990s, and the agricultural share was about 8.8 per cent of the total GDP in 2006 (primary data). In terms of export, the share of agricultural commodity export also decreased from more than 20 per cent in the early 1990s to 11.4 per cent in 2006. During this period, the openness to trade increased from around 70 per cent to 129.72 per cent in 2005. These reflect that Thai economy has been restructuring toward non-agricultural sector in response to the global trade liberalization movement. Nevertheless, agricultural sector still be one important sector that created employment and value-added to the overall economy, and a vital sector that provides food and beverage to both domestic and word markets. During 1996-2005, the total food commodity export value increase at a compound growth rate of 9.8 per cent per annum. The top 5 group of commodities growth rate were at 5.5, 6.3, 8.2 and 14.00 per cent per year for fishery products, rice and cereal, fruits, meat and poultry products, respectively, while that of sugar honey experienced with a negative growth. The meat and poultry products have the highest growth rate among the top 5, however, the bird-flu epidemic slow down the expansion of this group of commodities. Furthermore, the increasing hygienic and food safety measures imposed by importing countries require more stringent control of the whole supply chain of meat and poultry products. Although the total value of fruits export was at 47,854.92 millions of baht or only at 9.2 per cent of the total, it showed an impressive compound growth rate that reflected good potential for expansion. However, strict implementation of food safety and SPS measures of importing countries generated new adaptation of new production systems in fruit and vegetable production. According to the available statistics, the number of SME in Thailand consisted of 437,905 and 524,960 enterprises in 1994 and 1999. During the period of 1994-1999, it was increased by 3.7 percent. However, in 2004, Thailand had a total of 2,166,621 enterprises, of which 2,161,577 or 99.8 percent were SMEs. The rapid increase of the number of SME was due partly to the updating of database in order to improve its coverage carried out by the Office of Small and Medium Enterprises Promotion using data from: a) The 1997 Industrial Census and The 2002 Business Trade and Services Census by National Statistical Office; b) List of registered establishments; c) Department of Business Development, Ministry of Commerce; d) List of insured employees, the Social Security Office; and e) List of registered manufacturers, Department of Industrial Works.
In 2004, the number of manufacturing SMEs totaled at 482,229, accounted for 99.7 percent of the entire manufacturing sector. The top 5 industries in the sector are food and beverage, clothing, textiles, wood and wood products (excluding furniture) and tobacco products. The number of SMEs under each industry, and their proportion in manufacturing SMEs, are 135,227 in food and beverage industry (28% of the entire sectors), 72,315 in clothing industry (15%), 57,504 in textiles industry (11.9%), 45,208 in wood and wood products industry excluding furniture (9.4%) and 31,532 in

275
tobacco products (6.5%). However, most of the SMEs information is for non-agricultural sector, while that of agricultural sector are not available. The performance of non-agriculture SMEs reflected a broad picture that the overall share of large enterprise and SMEs is equal at about 40 per cent each in 2000. Then the share of SMEs has been slowly decreasing while a similar trend in the opposite direction was observed for the share of large enterprises. Moreover, the overall performance of the small enterprise is the lowest among the 3 categories. It suffices one to conclude that during the period of 2000 to 2004, among the large, medium and small enterprises, the large enterprise has the most comparative advantage. This may due to the difficulties faced by the small enterprise to encounter with the changing trade liberalization and global competition. To enhance the capacity of SMEs in the changing environments, Thailand has been implementing policies and measures to promote and support SMEs that covered almost all aspects of SME development including finance, marketing, technology, innovation, management, human resources, and adjustment of laws and taxes. Statistic obtained from the Ministry of Industry recorded that in 1982 the total number of factories registered with Ministry of Industry, under the factory act 1982, was 127,364 factories classified in 21 industries. There were 3 industries that related to food processing namely basic agro-industry, food, and beverage of which a total of 56,287 factories was registered and accounted for 44.2 per cent of the total 21 industries. By 2004, the total number of factories registered of which a total of 51,403 factories were food processors and accounted for 42.0 per cent of the industry’s total. During this period, the total number of registered factories and the food processors were slowly decreased. Among the 3 categories of food processors, the number of factor under basic agro-industry is the highest at 48,985 in 1998 and 44,097 in 2004 that is more than 42 per cent of the total number of food processors. The food industry is the second largest with number of factories between 6,620 in 2003 and 7,287 in 2001 which is about 13 per cent of the total number of food processors. Although the percentage share of food processors is the highest, the percentage share of investment is only 13 per cent. This due mainly to the low investment cost. However, the labor employed by the food processing industry is quite high at 17.86 per cent in 1998 (total labor employed 3,151,955) and 16.73 per cent in 2004 (total labor employed 4,045,982). The food processing industry is a comparatively labor intensive industry as compared to the non-agricultural based industry. As a results, it is a major source of employment in the overall industry of Thailand. The Ministry of Industry’s classification of food factories by commodity groups in 2001 showed that cereal products has the highest number of factories at 2,877 (30.48 per cent of the total), followed by ice factories at 1,310 (13.88 per cent of the total), and fruit & vegetables and fishery products at 483 and 480 factories, respectively. Due to the nature of processing technologies of commodity, the percentage of large, medium and small sizes of factories that classified according to the cost of capital investment are difference among each category of industry. Rice milling is one of the import and oldest conventional agro-industry or food factories in Thailand. It plays a vital role in the rice industry that enables Thailand being one of the top rice exporting countries in the world for more than 3 decades. The development of the rice mill industry in terms of accumulated number, investment, and labor employed during 1987-2005 reflected the structural changes of rice-milling industry toward more

276
capital intensive during the period of 1988 to 1999. This was a response to the changing world rice trade and liberalization. The market share analysis and market performance analysis utilized the statistic from the Department of Business Development (DBD), Ministry of Commerce. The DBD statistic categorized business into 17 sectors. The sectors that related to agriculture are: sector a) agriculture, hunting and forestry; sector b) fishery; sector d) manufacturing. Market performance of the selected industry was assessed by the overall net profits of the selected industries during 1999-2004. The marketing conduct analysis was conducted based on the interview of key informant of the industry on issues such as determination of price and output and barriers to entry limit competition by preventing market entry of new firms. Five food and agricultural sub-sectors’ market shares and net profits were analyzed namely: rice mills, flour mills, cassava starch, fruit and vegetable processors, sea food processors; and livestock. Among these sub-sectors, the sea food sub-sector has the highest total principle revenue of the industry (or a proxy for the total sale of the industry), followed by rice mills, canned fruit and vegetable, flour mills and cassava starch. All these sub-sectors were dominated by the large firms. The market share of large firms in canned fruit and vegetable processors and sea food processors were more than 86 per cent, while that of the flour mills’ was more than 84 per cent, the cassava starch was around 77 per cent, and the rice mills was less than 70 per cent. This indicates that industry with low per unit price of inputs and outputs have less domination of large firms. The performance as indicated by the net profits of firms and the industry showed that the highest net profit industry was sea food processors followed by flour mills, and canned fruit and vegetables processors and rice mills, that of the cassava starch factors’ was negative (or loss) for 4 years out of the 6 years during 1999-2004. The large firms’ net profits followed the overall direction of net profit of the industry, while that of the small and medium size firms’ experienced with loss which was in the opposite direction of the industry, except the rice mills industry. In general, the Thai food and agricultural processing sub-sector are quite competitive. All firms (small, medium and large size) have experiencing with changes in both domestic and foreign market regulations and requirements on quality and food safety. In addition, some food processing industry faced with increasing competition in the world market and imports into domestic market due to the trade liberalization policy and Free Trade Agreements (FTA) between Thailand and trading countries such as China, India, Australia and New Zealand. 6.2 Recommendations The adjustments to changes created by the global trade liberalization movement have been problems for small and medium size firms, especially the needs for market information, additional capital and human resource investment. Therefore, to enhance the capacity of small and medium firms to be competitive in both domestic and world market, the followings are recommended.
277
1. Ways and means should be explored for providing update and easy understanding marketing information and trade regulations or measures of major and potential importing countries as well as relevant trainings for principal agricultural food and commodities market participants, especially the small and medium firms;
2. To enhance the competitiveness of food processing and agricultural
commodity SMEs, credit and funding should be available for financing additional investment required due to the implementation of hygienic and food safety measures imposed by importing countries; and
3. An appropriate transition period should be considered for food agricultural
and commodity SMEs, in the implementation of regulations and measure that requires adaptation and special trainings.
Some of the above mentioned recommendations, to a certain degree, can be adapted for cooperation among Asean member countries. In fact, there are venues and cooperation among Asean member countries that are related to food processing. For instance, Asean Cooperation on Food, Agriculture and Forestry that are dealing directly with agricultural sectors and selected commodities, and the AFTA Council within which a Working group on SME was established. Nevertheless, there is still a need for a focus on SMEs in agro-processing sub-sector to be further strengthened on cooperation in common issues of Asean interest for enhancing the competitiveness and cooperation SMEs in information exchange, marketing and supply chain management, and modern technology. The future challenge is to promote synergy among SMEs in agro-processing Asean member countries within the value chain of agro-industry through Asean cooperation so as to face the increasing competition in world market.

278
7 References
1. Department of Business Development, Ministry of Commerce, http://www.dbd.go.th/thai/statistics/old_stat.phtml
2. Hill S. John “World Business: Globalization Analysis and Strategy First
Edition”, Thomson south-Western, 2005
3. National Food Institute www.nfi.go.th
4. Office of Research and Development, Office of Small and Medium Enterprises Promotion (OSMEP), The White Paper on Small and Medium Enterprises of Thailand in 2004 and Trends 2005, OSMEP, Superprint Co., Ltd. Bangkok, Thailand, 2006
5. Office of Research and Development, Office of Small and Medium
Enterprises Promotion (OSMEP), White Paper on Small and Medium Enterprises in Thailand, 2002 OSMEP, Idea Instant Printing, Bangkok, Thailand, 2003
6. Office of Industry Economics, Ministry of Industry, www.oie.go.th
7. Office of Agricultural Economics, Ministry of Agriculture and Co-operative,
www.oae.go.th
8. Pratap S. Birthal, P.K. Joshi, and Ashok Gulati, Vertical Coordination of High-value Food Commodities Implications for Smallholders, MTID Discussion Paper No 85, International Food Policy Research Institution (IFPRI), April, 2005
9. Wilson H.J. and Barry Keating “Business Forecasting with Accompanying
Excel-Based ForecastXtm Software”, Mcgraw-Hill, 2004

279
Market Liberalization and Its Relationship with Market Structure, Conduct and Performance of the Food Processing Industry in the Philippines by Minda C. Mangabat
Table of Contents Page No
1 Performance Of The Philippine Food Processing Industry 284 1.1 The Philippine Economy and the Role of Food Processing 284 1.1.1 Structural Change in the Philippine Economy 284 1.1.2 Contribution of Food Processing to the Economy 284 1.2 Philippine Processed Foods 286 1.2.1 Demand-side Drivers 286 1.2.2 Supply-side Drivers 288 2 Food Processing Industry Characteristics 291 2.1 Small and Medium Enterprises (SMEs) in Food
Processing 291
3 Trade Policy Environment 295 3.1 Effects of Trade Policies and Reforms in Processed Foods 297 3.2 Trade Shares of Processed Food 300 3.2.1 Exports 300 3.2.2 Imports 302 4 Issues And Challenges Of The Food Processing Industry 303 5 Impact Of Trade Liberalization: Industry Level Analysis 305 5.1 Processed Mango Industry 306 5.1.1 World Mango Production and Trade 306 5.1.2 Industry Profile 307 5.1.3 Trade Liberalization and Exports of Processed Mango
Products Standards 310
5.1.4 Market Performance Analysis 313 5.2 Processed Tuna Industry 318 5.2.1 Profile of the Philippine Canned Tuna Industry 318 5.2.2 Effects of Trade Liberalization 322 5.2.3 Market Performance Analysis 327 5.3 Processed Seaweeds/Carageenan 331 5.3.1 Industry Profile 331 5.3.2 Effects of Trade Liberalization 334 5.3.3 Market Performance Analysis 336 5.4 Soy Sauce 340 5.4.1 The Philippines in World Soy Sauce Market 340 5.4.2 Non-tariff Barriers to Trade 340 5.4.3 Effects of Trade Liberalization 340 5.4.4 Market Performance Analysis 343 5.5 Noodles 346 5.5.1 Trade Related Issue 346 5.5.2 Effects of Trade Liberalization 346 5.5.3 Market Performance Analysis 348 5.6 Desiccated Coconut 352 5.6.1 The Philippines in World Desiccated Coconut Market 352
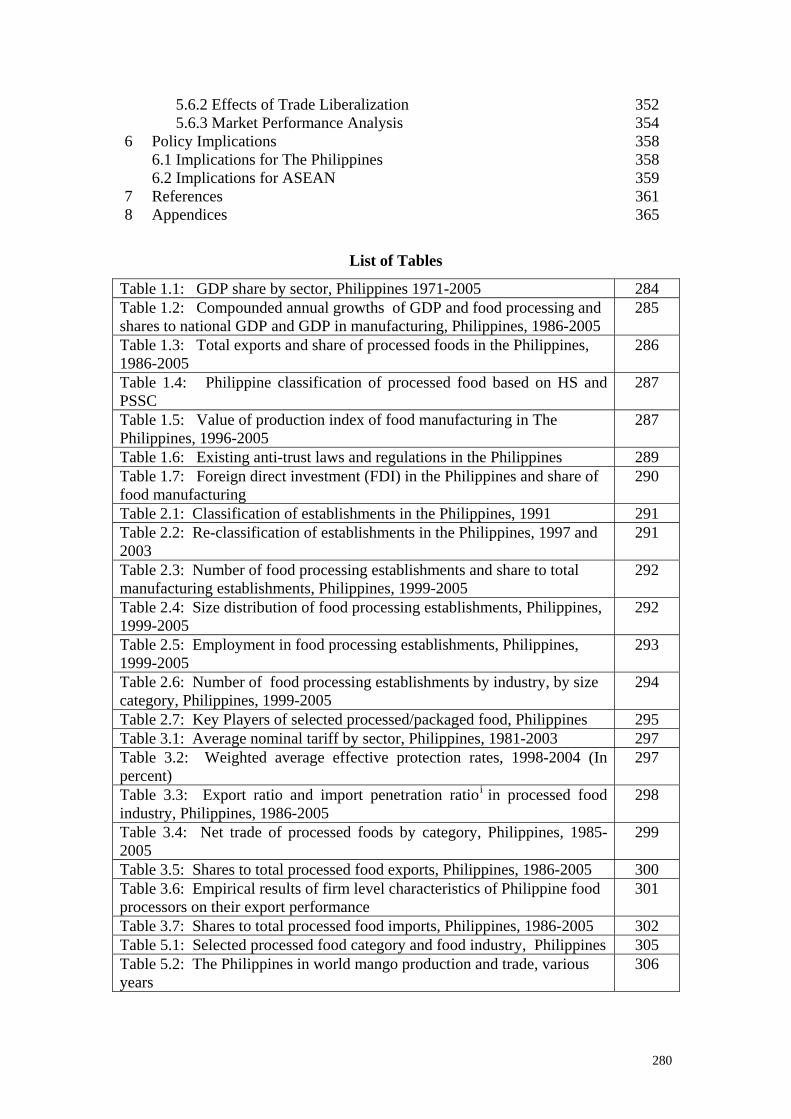
280
5.6.2 Effects of Trade Liberalization 352 5.6.3 Market Performance Analysis 354 6 Policy Implications 358 6.1 Implications for The Philippines 358 6.2 Implications for ASEAN 359 7 References 361 8 Appendices 365
List of Tables
Table 1.1: GDP share by sector, Philippines 1971-2005 284 Table 1.2: Compounded annual growths of GDP and food processing and shares to national GDP and GDP in manufacturing, Philippines, 1986-2005
285
Table 1.3: Total exports and share of processed foods in the Philippines, 1986-2005
286
Table 1.4: Philippine classification of processed food based on HS and PSSC
287
Table 1.5: Value of production index of food manufacturing in The Philippines, 1996-2005
287
Table 1.6: Existing anti-trust laws and regulations in the Philippines 289 Table 1.7: Foreign direct investment (FDI) in the Philippines and share of food manufacturing
290
Table 2.1: Classification of establishments in the Philippines, 1991 291 Table 2.2: Re-classification of establishments in the Philippines, 1997 and 2003
291
Table 2.3: Number of food processing establishments and share to total manufacturing establishments, Philippines, 1999-2005
292
Table 2.4: Size distribution of food processing establishments, Philippines, 1999-2005
292
Table 2.5: Employment in food processing establishments, Philippines, 1999-2005
293
Table 2.6: Number of food processing establishments by industry, by size category, Philippines, 1999-2005
294
Table 2.7: Key Players of selected processed/packaged food, Philippines 295 Table 3.1: Average nominal tariff by sector, Philippines, 1981-2003 297 Table 3.2: Weighted average effective protection rates, 1998-2004 (In percent)
297
Table 3.3: Export ratio and import penetration ratioi in processed food industry, Philippines, 1986-2005
298
Table 3.4: Net trade of processed foods by category, Philippines, 1985-2005
299
Table 3.5: Shares to total processed food exports, Philippines, 1986-2005 300 Table 3.6: Empirical results of firm level characteristics of Philippine food processors on their export performance
301
Table 3.7: Shares to total processed food imports, Philippines, 1986-2005 302 Table 5.1: Selected processed food category and food industry, Philippines 305 Table 5.2: The Philippines in world mango production and trade, various years
306
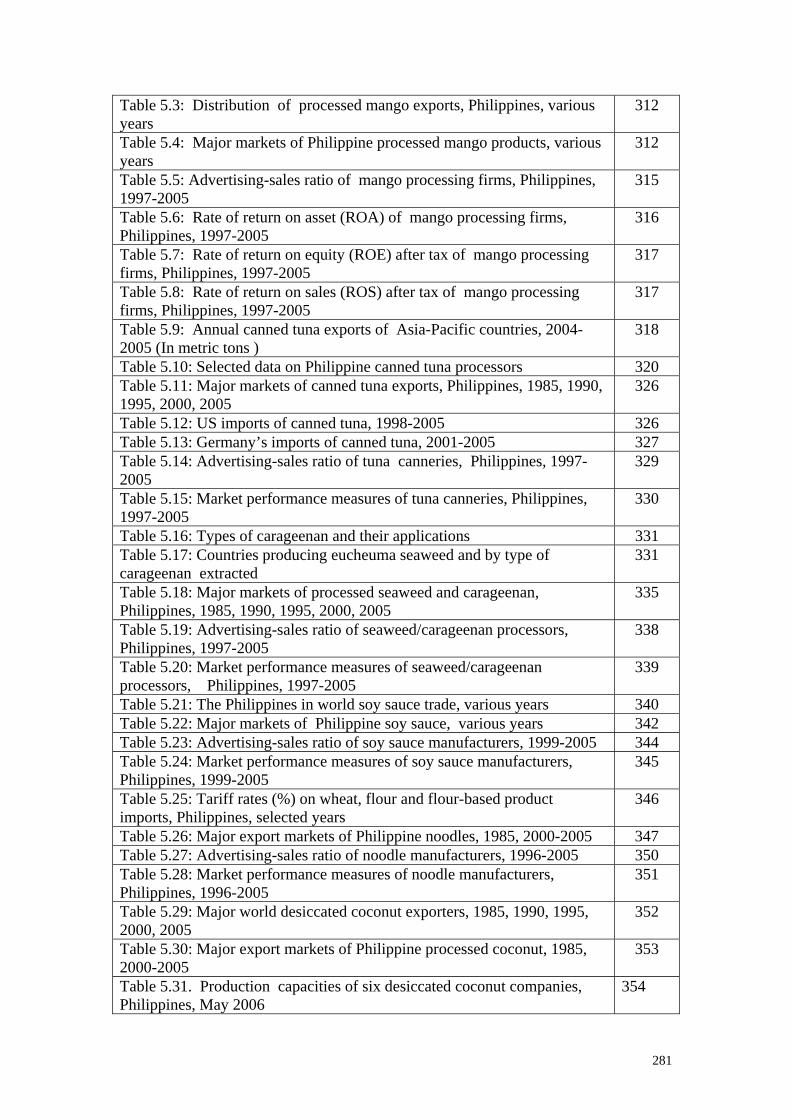
281
Table 5.3: Distribution of processed mango exports, Philippines, various years
312
Table 5.4: Major markets of Philippine processed mango products, various years
312
Table 5.5: Advertising-sales ratio of mango processing firms, Philippines, 1997-2005
315
Table 5.6: Rate of return on asset (ROA) of mango processing firms, Philippines, 1997-2005
316
Table 5.7: Rate of return on equity (ROE) after tax of mango processing firms, Philippines, 1997-2005
317
Table 5.8: Rate of return on sales (ROS) after tax of mango processing firms, Philippines, 1997-2005
317
Table 5.9: Annual canned tuna exports of Asia-Pacific countries, 2004-2005 (In metric tons )
318
Table 5.10: Selected data on Philippine canned tuna processors 320 Table 5.11: Major markets of canned tuna exports, Philippines, 1985, 1990, 1995, 2000, 2005
326
Table 5.12: US imports of canned tuna, 1998-2005 326 Table 5.13: Germany’s imports of canned tuna, 2001-2005 327 Table 5.14: Advertising-sales ratio of tuna canneries, Philippines, 1997-2005
329
Table 5.15: Market performance measures of tuna canneries, Philippines, 1997-2005
330
Table 5.16: Types of carageenan and their applications 331 Table 5.17: Countries producing eucheuma seaweed and by type of carageenan extracted
331
Table 5.18: Major markets of processed seaweed and carageenan, Philippines, 1985, 1990, 1995, 2000, 2005
335
Table 5.19: Advertising-sales ratio of seaweed/carageenan processors, Philippines, 1997-2005
338
Table 5.20: Market performance measures of seaweed/carageenan processors, Philippines, 1997-2005
339
Table 5.21: The Philippines in world soy sauce trade, various years 340 Table 5.22: Major markets of Philippine soy sauce, various years 342 Table 5.23: Advertising-sales ratio of soy sauce manufacturers, 1999-2005 344 Table 5.24: Market performance measures of soy sauce manufacturers, Philippines, 1999-2005
345
Table 5.25: Tariff rates (%) on wheat, flour and flour-based product imports, Philippines, selected years
346
Table 5.26: Major export markets of Philippine noodles, 1985, 2000-2005 347 Table 5.27: Advertising-sales ratio of noodle manufacturers, 1996-2005 350 Table 5.28: Market performance measures of noodle manufacturers, Philippines, 1996-2005
351
Table 5.29: Major world desiccated coconut exporters, 1985, 1990, 1995, 2000, 2005
352
Table 5.30: Major export markets of Philippine processed coconut, 1985, 2000-2005
353
Table 5.31. Production capacities of six desiccated coconut companies, Philippines, May 2006
354

282
Table 5.32: Advertising-sales ratio of desiccated coconut processors, 1998 2005
356
Table 5.33: Market performance measures of desiccated coconut processors, Philippines, 1998-2005
357
List of Figures
Figure 1.1: The industry sector, manufacturing sub-sector and food processing industry, 2001
284
Figure 1.2:.Share of food processing to employment in manufacturing, Philippines, 2000, 2005
285
Figure 3.1:. Value of exports and imports of processed foods, Philippines, 1985-2005
298
Figure 5.1:.A model of Structure-Conduct-Performance paradigm 305 Figure 5.2: Market flow of mango, Philippines 308 Figure 5.3: Value of total mango exports, fresh and processed mangoes, Philippines, 1985, 1990-2005
311
Figure 5.4: Percent share of processed mango to total value of mango exports, Philippines, 1985, 1990-2005
311
Figure 5.5: Concentration ratios of mango processing firms, Philippines, 1997-2005
314
Figure 5.6: Herfindahl-Hirschman Index of mango processing firms, Philippines, 1997-2005
314
Figure 5.7: Lorenz curve for mango processing firms, Philippines, 2004 314 Figure 5.8: Center of tuna canneries in the Philippines 319 Figure 5.9: Value of total tuna exports, processed and fresh, Philippines 1985, 1990-2005
324
Figure 5.10: Percent share of canned tuna to total value of processed tuna exports, Philippines, 1985, 1990-2005
325
Figure 5.11: Concentration ratios of tuna canneries, Philippines, 1997-2005 328 Figure 5.12: Herfindahl-Hirschman Index, tuna canneries, Philippines, 1997-2005
328
Figure 5.13: Lorenz curve for tuna canneries , Philippines, 2004 328 Figure 5.14: Marketing channels of seaweeds, Philippines 332 Figure 5.15: Value of seaweeds/carageenan exports, Philippines, 1985, 1990-2005
334
Figure 5.16: Percent share of processed seaweed/carageenan to total value of seaweed exports, Philippines, 1985, 1990-2005
335
Figure 5.17: Imports of seaweeds, Philippines,1985, 1990-2005 336 Figure 5.18: Concentration ratios of seaweed/carageenan processors, Philippines, 1997-2005
337
Figure 5.19: Herfindahl-Hirschman Index, seaweed/carageenan processors, Philippines, 1997-2005
337
Figure 5.20: Lorenz curve of seaweed/carageenan processors, Philippines, 2005
337
Figure 5.21: Exports values of sauces, condiments & mixed seasoning and soy sauce, Philippines, 1985, 1990-2005
341
Figure 5.22: Share of soy sauce exports to total value of sauces, condiments & mixed seasonings, Philippines, 1985, 1990-2005
341
Figure 5.23:Value of imports and exports of soy sauce, Philippines, 1985, 342
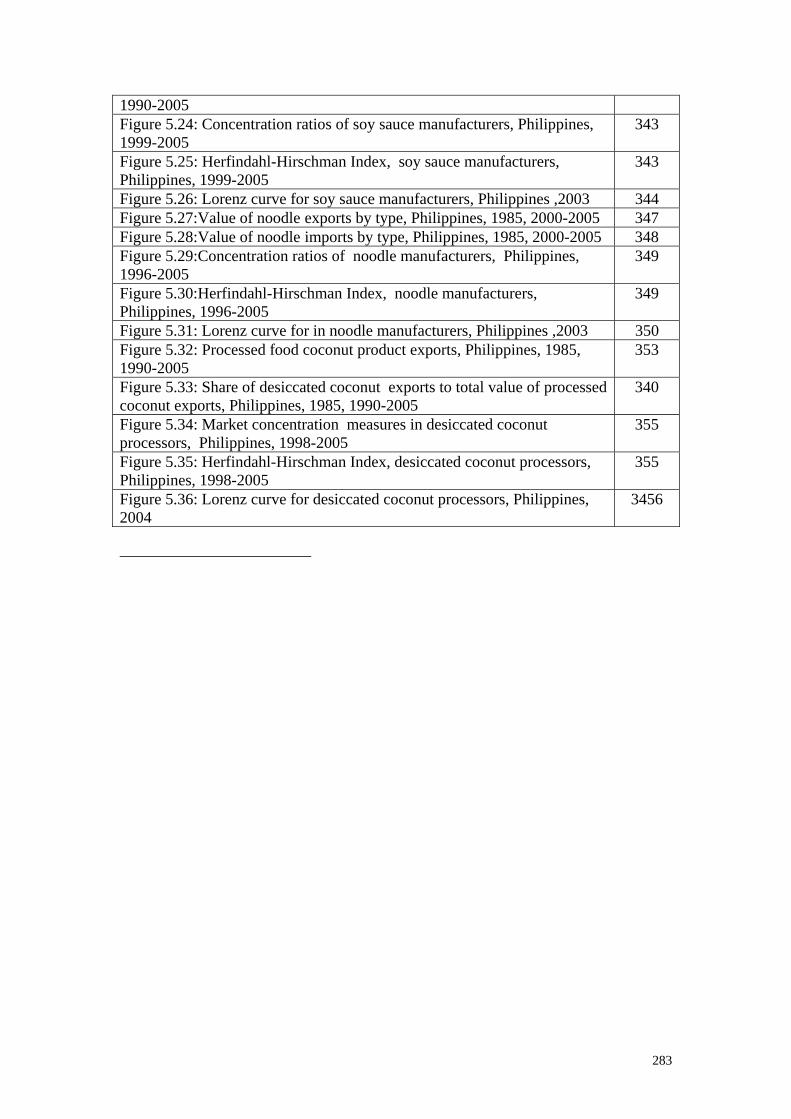
283
1990-2005 Figure 5.24: Concentration ratios of soy sauce manufacturers, Philippines, 1999-2005
343
Figure 5.25: Herfindahl-Hirschman Index, soy sauce manufacturers, Philippines, 1999-2005
343
Figure 5.26: Lorenz curve for soy sauce manufacturers, Philippines ,2003 344 Figure 5.27:Value of noodle exports by type, Philippines, 1985, 2000-2005 347 Figure 5.28:Value of noodle imports by type, Philippines, 1985, 2000-2005 348 Figure 5.29:Concentration ratios of noodle manufacturers, Philippines, 1996-2005
349
Figure 5.30:Herfindahl-Hirschman Index, noodle manufacturers, Philippines, 1996-2005
349
Figure 5.31: Lorenz curve for in noodle manufacturers, Philippines ,2003 350 Figure 5.32: Processed food coconut product exports, Philippines, 1985, 1990-2005
353
Figure 5.33: Share of desiccated coconut exports to total value of processed coconut exports, Philippines, 1985, 1990-2005
340
Figure 5.34: Market concentration measures in desiccated coconut processors, Philippines, 1998-2005
355
Figure 5.35: Herfindahl-Hirschman Index, desiccated coconut processors, Philippines, 1998-2005
355
Figure 5.36: Lorenz curve for desiccated coconut processors, Philippines, 2004
3456

284
1. PERFORMANCE OF THE PHILIPPINE FOOD PROCESSING INDUSTRY 1.1 The Philippine Economy and the Role of Food Processing 1.1.1 Structural Change in the Philippine Economy While agriculture is still a dominant sector, its contribution to national gross domestic product (GDP) has been declining while the shares of the industrial sector and the services sector have been increasing (Table 1.1). Among the three sectors, the contribution of industry to total GDP was the largest from the mid-1970s to the mid-1980s. The industry sector accounted for 38.20 percent of annual GDP during the latter period. Beginning the second half of the 1980s, however, the services sector became the largest contributor to GDP with its annual share rising to 46.60 percent in 2001-2005.
Table 1.1. GDP share by sector, Philippines 1971-2005
Percent share to GDP Period Total Agriculture* Industry Services
1971 –1975 100 30.40 34.20 35.40 1976 – 1980 100 27.40 37.40 35.20 1981 – 1985 100 24.00 38.20 37.80 1986 – 1990 100 23.40 34.70 41.90 1991 – 1995 100 22.50 32.70 44.80 1996 – 2000 100 20.20 35.40 44.40 2001 – 2005 100 20.20 33.90 46.60
* Including fishery and forestry. Source: National Statistical Coordination Board (NSCB). GDP at constant 1985 prices. 1.1.2 Contribution of Food Processing to the Economy GDP. In the industry sector, output in manufacturing accounts for more than one-third or 72 percent, on average, from 2001-2005 (Figure 1.1). The other 28 percent is shared by mining and quarrying; construction; and electricity, gas and water. In the manufacturing sub-sector, the food processing (food and beverages) industry remains the largest component with 47 percent share or about 10 percent to total gross domestic product of the economy. The annual shares of food processing output to the GDP of the whole economy and in manufacturing from 1986 to 2005 are shown in Table 1.2. The correlation of the growths in
Figure 1.1. The industry sector, manufacturing sub-sector and food processing industry,
2001-2005

285
Others74.80%
Food processing25.20%
Others74.12%
Food processing
25.88%
Table 1.2. Compounded annual growths of GDP and food processing* and shares to national GDP and GDP in manufacturing, Philippines, 1986-2005
Annual Growth, % Share (%) of Food Processing Period
National GDP Food Processing GDP
National GDP Manufacturing
1986-1990 5.1 11.80 12.28 47.49 1991-1995 2.9 8.92 10.58 44.76 1996-2000 3.1 10.75 9.95 47.17 2001-2005 5.0 12.93 10.61 49.33
*Food and beverages. Source: Based on data from NSCB. The correlation of the growths in the food processing industry and the national economy can be observed also in Table 2. The good performance of the food processing industry during the 1986-1990 period, growing by almost 12 percent annually, coincided with an expansion of the economy’s GDP by 5.1 percent as the economy rebounded from political and economic crises, the latter triggered by the second world oil crisis, a decline of world commodity prices, and growing trade deficits and external debt. This correlation was maintained in the succeeding periods. For example, the decline in food processing output in 1991-1995 ran parallel to the drop in national GDP during the same period. The acute power shortage in the early part of 1992 dampened the performance of the industry sector. Among the industry sub-sectors, manufacturing was hardest hit by the perennial brown-outs and this was exhibited particularly in the low outputs in food processing, chemical and chemical products. When food processing output recovered from 1996 to 2005, national GDP likewise recovered. This correlation can also be observed with the share of food processing to manufacturing. Employment. The importance of the food processing to the economy is also reflected in its share to employment. In 2000, one-fourth or 25 percent of the total number of employees in the manufacturing sector was attributable to food processing and this increased slightly to about 26 percent in 2005 (Figure 1.2).
2000 2005
Figure 1.2. Share of food processing to employment in manufacturing, Philippines, 2000, 2005

286
Exports. Processed foods contribute to the economy’s export earnings. The annual average value of processed food exports in 1991-1995 and in 1996-2005 exceeded annual average value of exports in 1981-1990 (Table 1.3). Its share to annual total value of exports has, however, continuously declined from more than 7 percent in the second half the 1980s to 5.56 percent and 2.36 percent in the next two 5-year periods ending 2000. Annual average value of processed food exports accounted for less than 2 percent in 2001-2005.
Table 1.3. Total exports and share of processed foods in the Philippines, 1986-2005
Processed food exports Year
Total Exports FOB US$M
Average FOB, US$M
Average Share to total
exports, % 1986-1990 6,728.6 510.5 7.59
1991-1995 12,193.7 677.7 5.56 1996-2000 29,676.3 700.4 2.36 2001-2005 36,905.0 674.3 1.83
Source: NSO, various years. Foreign Trade Statistics of the Philippines. 1.2 Philippine Processed Foods As defined by the economy’s Department of Health (DOH, 2005), processed food has been subjected to some degree of processing like drying, milling, concentrating, canning, or addition of some ingredients which partially or completely change the physico-chemical and/or sensory characteristics of the food’s raw material. These processes are value-adding. The processed food industries are diverse, with many varieties of products. There are 15 processed food classifications in the economy based on the Harmonized System (HS) and the Philippine Standard Commodity Classification (PSCC) (Table 1.4). 1.2.1 Demand-side Drivers In the domestic market, there is a strong demand for processed food from the middle and upper income consumer groups accounting for 15-20 percent of the population. The expansion of the urban sector and growth of middle class due to women entering the workforce has driven demand for consumer-ready food products. The convenience provided by processed food and improved distribution systems are some of the reasons for the increasing demand among working women. Opportunities are large in the processed meat, fish, fruit, dairy, beverage, snack foods and bakery categories (Mojica, 2003). Based on the Food and Income Expenditure Survey (FIES) of the National Statistics Office, in 2000 total household spending for processed fruits and vegetables amounted to P80.2 billion compared to P55.7 billion in 1997. Expenditures on processed fish and marine products reached P19B in 2000. Dried fish accounted for the bulk (54 percent), followed by canned fish (34 percent), salted fish (11 percent), and other processed products. Household spending on canned and uncanned meat preparations amounted to P32.4 billion in 2000. Uncanned meat accounted for two-thirds and the rest are canned meat.

287
Table 1.4. Philippine classification of processed food based on HS and PSSC _______________________________________________________________
Meat and meat preparations (pork, chicken and beef are smoked, cured, prepared in brine, dried; pork/beef loaves, sausages, corned beefs, liver spreads, meat pastes, luncheon meats, hams, bacons, etc.)
Dairy products and bird’s eggs (processed) Margarine, shortening and vegetable fats and oils
Cereal and flour preparations (flour, rice and corn snack food, cereals, noodles and pasta products)
Processed fruits (in brine, sauces or paste, pulped, pickled, dried, quick- frozen or made into purees, juices and concentrates). The most common processed fruits are: pineapple, mango, banana, calamansi, tamarinds, passion fruit, papaya, orange, guavas and soursop Processed vegetables (dried/dehydrated, vacuum dried, pickled and quick
frozen). Vegetables commonly processed are potatoes, cassava, cucumbers, green peas, mushrooms and tomatoes. Carageenan is classified under processed vegetables.
Sugar and sugar preparations Confectionary and other sugar based products (chewing gum, soft/hard
candies, gelatin and other sugar-based products) Coffee (processed into coffee and coffee mixtures)
Cocoa, tea and mate (cocoa and cocoa powder are used for bakery products, e.g. cookies and biscuits and confectionaries, e.g. candies)
Beverages Nuts and coconut products (dessicated coconut, coconut chips, coco water,
liquid/powder coco milk) Sauces, condiments, spices & mixes & manufactures Miscellaneous edible preparations (food preparations for infants, pasta, etc.) Animal feeding stuff
Processed fish and marine products (canned fish, dried/smoked fish, salted fish sardines, fish sauce, paste, and other processed marine products)
__________________________________________________________________ Source: NSO. The strong demand for processed food and the response from domestic food manufacturing is reflected in the increasing trend of the value of production index of food manufacturing (Table 1.5).
Table 1.5. Value of production index of food manufacturing in the Philippines, 1996-2005
Year Production Index
1985=100 Year Production Index
1994=100 1996 273.3 2001 129.3 1997 319.0 2002 136.5 1998 337.1 2003 145.5 1999 398.2 2004 159.1 2000 368.1 2005 161.7
Source: NSO, various years. Monthly Bulletin of Statistics.

288
1.2.2 Supply-side Drivers The Investment Climate The political and economic environment in the Philippines is generally conducive to investment since the economy has introduced economic reforms designed to encourage investment and healthy competition Some of the investment-related aspects including laws and policies governing enterprises are briefly discussed below (Deloitte, 2007). Banking System. In the financial system about 98 percent of domestic credit is channeled through the banking system which includes representative offices of foreign banks and offshore banking units. In general, there are few legal restrictions on financial institution’s lending practices; the exceptions are limits designed to protect banks from over-exposure and to channel funds to priority sector. Banks and banking institutions are regulated by the Bangko Sentral ng Pilipinas (BSP) or Central Bank. Foreign trade. On foreign trade, special economic zones, which include export processing zones (EPZs) set up under government direction and industrial estates developed by the private sector, attract export enterprises. Companies located in these zones can avail various fiscal and non-fiscal incentives. Registration and licensing. Although imports are becoming less expensive because of the economy’s import liberalization program, licensing remains a practical entry strategy for foreign companies particularly those planning to tap the domestic market. Food and beverages are one of the sectors wherein licensing is widely used. Moreover, protection of intellectual property is being reinforced to encourage technology transfers. Joint ventures with local enterprises are a common method for operating in the economy. However, Philippine laws on joint ventures limit a foreign entity’s equity participation to 40 percent. Mergers and Acquisitions. Philippine law does not restrict mergers per se. There is no legal distinction between horizontal mergers (within the same industry) and vertical mergers (between firms at different points or distribution chain). Mergers of share corporations which usually necessitate changes in the companies’ articles of incorporation, require notification to the Securities and Exchange Corporation (SEC). Foreign investment incentives and restrictions. The Philippines’ investment incentives compare favourably with those of the other members of the Association of South-East Asian (ASEAN). The general incentives extended to domestic and foreign ventures include tax holidays, credits for tax and duties on imported raw materials, and exemption from local taxes. Additional incentives are available to regional headquarters or warehouse operations and to firms establishing in less-developed areas in the economyside. The legal framework for incentives are the 1987 Omnibus Investment Code (OIC), as amended, and the Special Economic Zone Act of 1995, among others. Exchange controls. Foreign currencies maybe bought and sold freely by residents including foreign corporations and maybe brought into or sent out of the economy with minimal restrictions. Non-residents may also freely hold foreign currencies. Registered foreign companies need not convert forex into pesos. Executives of foreign firms may also retain all remuneration in foreign currency.

289
Principal forms of doing business. The most important business forms are the corporation, partnership and sole proprietorship. Multinational companies may establish and register a branch, a subsidiary, a licensing and franchising agreement, a joint venture agreement or a regional headquarters. The most popular business form is the share corporation, with a limited charter to 50 years, renewable for succeeding 5-year terms. Business taxation. Domestic corporation are subject to a 35 percent tax rate on income (to be reduced to 30 percent as from January 1, 2009) derived from worldwide sources. The same rate is also applied to resident foreign corporations including branches and non-resident foreign corporations but only on gross Philippine-source income. Losses maybe carried forward for three years except when the taxpayer is benefiting from a tax incentive or exemption. Losses may not be carried forward where the business undergoes substantial change in ownership. The carryback losses is not permitted. Turnover and other indirect taxes and duties. A general value-added tax (VAT) of 12 percent is applied to the sale of goods and property, the provision of services and the import of goods into the Philippines. A number of transactions are exempt. A zero rate applies to the export for goods and services related to processing, manufacturing or repacking of goods for export (if paid in foreign currency accounted for under the rules of the Bangko Sentral ng Pilipinas formerly known as the Central Bank). Monopolies and restraint of trade. The Philippines does not have a comprehensive anti-trust law. Competition law and regulations are implemented by different government agencies as summarized in Table 1.6.
Table 1.6. Existing anti-trust laws and regulations in the Philippines
Competition Law Description (Concerned Agency)
Article XII, Section 19 1987 Philippine Constitution
Prohibits anti-competitive practices, combinations of trade and other unfair competition practices.
Articles 186 and 187 RA 3815: Revised Penal Code
Defines and penalizes anticompetitive behavior that is criminal in nature such as monopolies and combinations in restraint of trade.
Article 28 RA 386 (1949): Civil Code of the Philippines
Allows the collection of damages arising from unfair competition as well as abuse of dominant position by a monopolist.
RA 165: Act to Prohibit Monopolies and Combina- tions in Restraint of Trade
Allows treble damages for civil liability arising from anti-competitive behavior.
RA 165: Intellectual Property Code of the Philippines
Protects patents, trademarks, and copyrights and provides corresponding penalties for infringement. (Intellectual Property Office of the Department of Trade and Industry)
BP 68 (1980): Corporation Code of the Philippines
Rules on mergers, consolidations, and acquisitions. It does not, however, address competition issues such as the possible abuse of dominant position arising from mergers and acquisitions. (Securities and Exchange Commission or SEC)
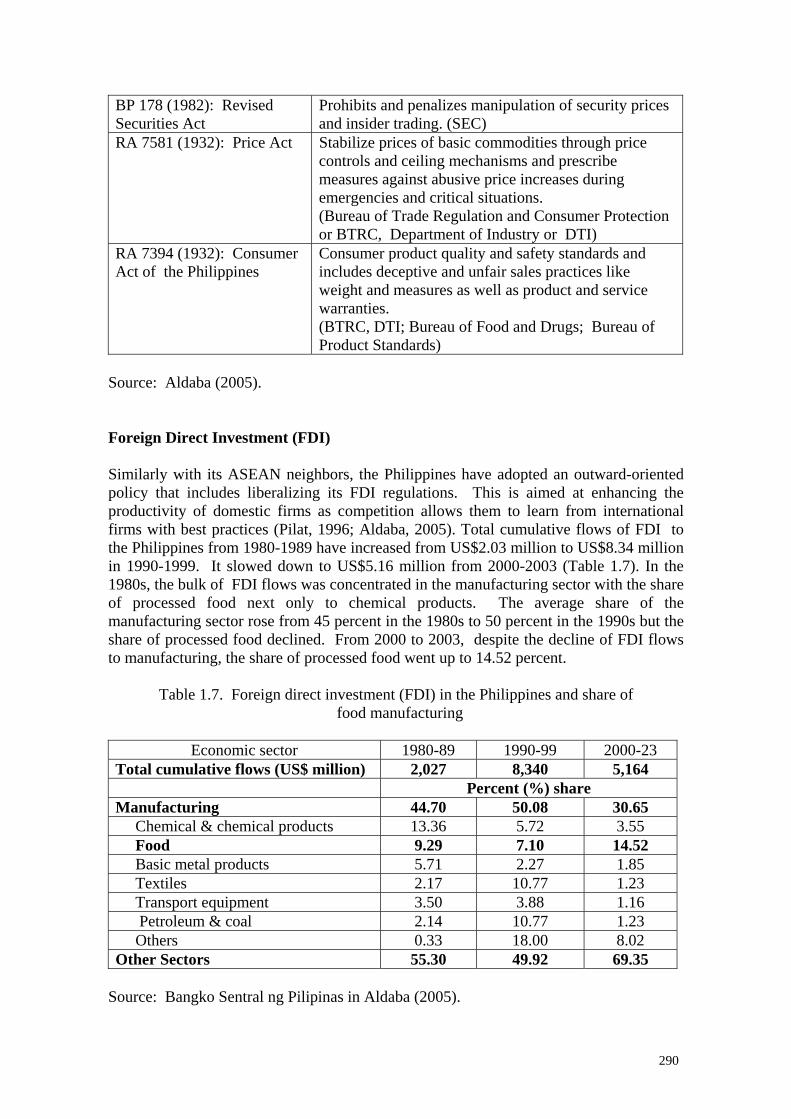
290
BP 178 (1982): Revised Securities Act
Prohibits and penalizes manipulation of security prices and insider trading. (SEC)
RA 7581 (1932): Price Act Stabilize prices of basic commodities through price controls and ceiling mechanisms and prescribe measures against abusive price increases during emergencies and critical situations. (Bureau of Trade Regulation and Consumer Protection or BTRC, Department of Industry or DTI)
RA 7394 (1932): Consumer Act of the Philippines
Consumer product quality and safety standards and includes deceptive and unfair sales practices like weight and measures as well as product and service warranties. (BTRC, DTI; Bureau of Food and Drugs; Bureau of Product Standards)
Source: Aldaba (2005). Foreign Direct Investment (FDI) Similarly with its ASEAN neighbors, the Philippines have adopted an outward-oriented policy that includes liberalizing its FDI regulations. This is aimed at enhancing the productivity of domestic firms as competition allows them to learn from international firms with best practices (Pilat, 1996; Aldaba, 2005). Total cumulative flows of FDI to the Philippines from 1980-1989 have increased from US$2.03 million to US$8.34 million in 1990-1999. It slowed down to US$5.16 million from 2000-2003 (Table 1.7). In the 1980s, the bulk of FDI flows was concentrated in the manufacturing sector with the share of processed food next only to chemical products. The average share of the manufacturing sector rose from 45 percent in the 1980s to 50 percent in the 1990s but the share of processed food declined. From 2000 to 2003, despite the decline of FDI flows to manufacturing, the share of processed food went up to 14.52 percent.
Table 1.7. Foreign direct investment (FDI) in the Philippines and share of food manufacturing
Economic sector 1980-89 1990-99 2000-23
Total cumulative flows (US$ million) 2,027 8,340 5,164 Percent (%) share Manufacturing 44.70 50.08 30.65 Chemical & chemical products 13.36 5.72 3.55 Food 9.29 7.10 14.52 Basic metal products 5.71 2.27 1.85 Textiles 2.17 10.77 1.23 Transport equipment 3.50 3.88 1.16 Petroleum & coal 2.14 10.77 1.23 Others 0.33 18.00 8.02 Other Sectors 55.30 49.92 69.35
Source: Bangko Sentral ng Pilipinas in Aldaba (2005).

291
2. FOOD PROCESSING INDUSTRY CHARACTERISTICS 2.1 Small and Medium Enterprises (SMEs) in Food Processing The Philippine food processing industry comprises firms or establishments engaged in the manufacturing and distribution of food and food products. Following the classification of establishments in the economy, those engaged in food processing vary in size based on the number of employees and value of assets or capitalization. Under the Magna Carta of Small Enterprises (Republic Act or RA 6977) in 1991 establishments were categorized into five (5), namely, micro, cottage, small-scale, medium-scale and large-scale (Table 2.1).
Table 2.1. Classification of establishments in the Philippines, 1991
Assets/Capitalization Size of establishment
Number of employees PhP* US$**
Micro 1-5 <150,000 2,765 Cottage 6-9 150,000 - 1.5M 2,765 - 27,650 Small 10-99 1.5M - 15M 27,650 - 276,500 Medium 100-199 15M - 60M 276,500 - 1.106M Large 200 or more Above 60M Above 1.106M
* Philippine peso. **US dollar equivalent. Source: Sonido, 2001. In 1997, the number of classifications of establishments was reduced from the original five (5) to four (4) categories. Micro and cottage establishments were combined into one category, Micro (Table 2.2). The number of employees under small and medium industries or SMEs1 were not changed. Another re-classification was made on January 16, 2003. The four (4) categories of establishments and the number of employees were retained but the value of assets for each category was substantially increased.
Table 2.2. Re-classification of establishments in the Philippines, 1997 and 2003
Assets 1997 2003
Size of establish-
ment
No. of employees
PhP* US$** PhP* US$** Micro 1-9 <1.5M <27,650 < 3M < 55,300 Small 10-99 1.5M - 15M 27,650 - 76,500 3M -15M 55,300 - 276,500 Medium 100-199 15M - 60M 276,500 - 1.106M 15M -100M 276,500 - 1.84M Large > 200 >60M >1.106M >100M > 1.84M
* Philippine peso. **US dollar equivalent. Sources: Mindanao Economic Development Council (MEDCo); Department of Trade
and Industry (DTI), 2007.
1 As defined by the Department of Trade and Industry, SME is any business activity or enterprise engaged in industry, agribusiness and/or services, whether single proprietorship, cooperative, partnership or corporation whose total assets, inclusive of those arising from loans but exclusive of the land on which the particular business entity’s office, plant and equipment are situated, must have value falling under categories micro, small and medium (as shown in Table 9 of this report).

292
In 1999, the National Statistics Office (NSO) reported 54,680 food processing establishments in the economy which comprised about 42 percent of the total manufacturing establishments (Table 2.3). The number of food processing establishments dropped to about 52 thousand in 2000 until 2003. Their number increased to about 55 thousand in 2004 and 2005 and their share to total manufacturing establishments increased to 47 percent. The data suggest that there were more entrants to food processing than in the other sub-sectors in manufacturing as the total manufacturing establishments decreased in 2004 and 2005.
Table 2.3. Number of food processing establishments and share to total manufacturing establishments, Philippines, 1999-2005
Year Total
Manufacturing Food
Processing Percent (%) Share of Food Processing to Manufacturing
1999 130,931 54,680 41.76 2000 125,467 52,073 41.50 2001 123,795 52,148 42.12 2002 122,977 52,046 42.32 2003 123,406 52,079 42.20 2004 118,127 55,053 46.60 2005 117,382 55,185 47.01
Source: NSO, various years. List of Establishments.
While the number of food processing establishments increased in more recent years, their structure hardly changed. The micro-scale food processing establishments remain as the predominant category, accounting for more than 90 percent of the total food processing establishments in the economy (Table 2.4). The second largest category are the small-scale food processors which account for seven (7) percent of the total food processing establishments. The rest fall under the medium and large categories. However, there are more large-sized than medium-sized establishments in food processing.
Table 2.4. Size distribution of food processing establishments, Philippines, 1999-2005
Year Total Micro Small Medium Large 1999 54,680 50,332 3,927 178 243 2000 52,073 48,045 3,652 162 214 2001 52,148 48,325 3,434 164 225 2002 52,046 48,347 3,341 176 182 2003 52,079 48,367 3,349 176 187 2004 55,053 51,038 3,654 167 194 2005 55,185 51,335 3,504 163 183
Source: NSO, various years. Lists of Establishments.

293
The above structure of size category of food processing establishments corroborates the findings of the study of Sonido (2001). For rural-based food processors, it was reported that there were more than 200 thousand which are dispersed all over the economy with only 1 to 2 percent registered with government regulatory agencies.2 In terms of employment generation, in spite of their small number the large-scale food processing establishments provide significant contribution (Table 2.5). Also, because of their large number, the micro-scale food processors generate the largest employment among the four (4) size categories of food processing establishments. Collectively, the employment contribution of SMEs which include micro-, small- and medium-sized food processors in this study, account for about two-thirds of the total employment in processed food. Large food processors contribute the other one third.
Table 2.5. Employment in food processing establishments, Philippines, 1999-2005
Number of Employees Food Processing
Year Manufacturing
Total Micro Small Medium Large 1999 1,674,472 433,956 162,956 83,629 24,823 162,548 2000 1,589,214 400,437 157,169 78,689 23,218 141,361 2001 1,634,103 398,985 158,443 69,927 23,322 147,293 2002 1,467,188 374,023 158,570 68,852 24,849 121,752 2003 1,640,042 376,248 158,622 69,006 24,795 123,825 2004 1,535,950 382,368 165,384 76,885 22,873 117,226 2005 1,463,346 378,759 164,195 71,103 24,145 119,316
Source: NSO, various years. Lists of Establishments.
The distribution of establishments engaged in the food processing industry is shown in Table 2.6. Throughout the period 1999-2005, the leading establishments in terms of their number were those engaged in rice and corn milling; baking of bread, cakes, pastries, pies, and similar perishable bakery products; manufacture of soft drinks and bottling of mineral waters; and processing and preserving of fish products and other sea foods. SMEs prevailed in number over large enterprises in each category of food processing. Establishments in slaughtering and meat packing, manufacture of wines; and manufacture of ice cream cones and wafers were mainly SMEs, except for 3 large enterprises that were registered in 2003.
2 Many are home-based food processors lacking academic training in food science and technology and operate without a formal business plan. These processors handle a wide variety of foods, mainly ethnic recipes which they sell in the local markets and also supply to exporters such as sea foods (e.g. dried fish, smoked and fermented fish, bottled Spanish sardines, frozen boneless and marinated milkfish), fruits and vegetables (e.g. banana chips, dried mango, preserved jackfruit, rootcrop powder, coconut bars), and rice-based delicacies. These rural-based processors provide employment to more than 2 million Filipinos (Sonido, 2001).
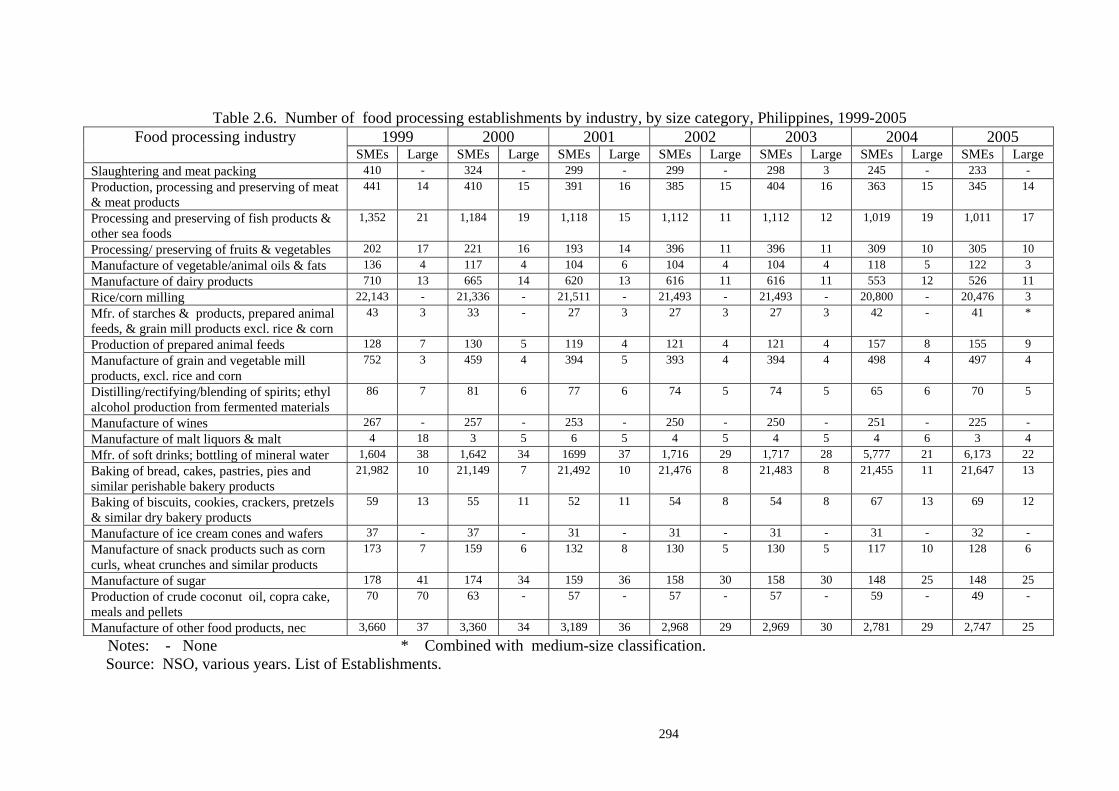
294
Table 2.6. Number of food processing establishments by industry, by size category, Philippines, 1999-2005 1999 2000 2001 2002 2003 2004 2005 Food processing industry
SMEs Large SMEs Large SMEs Large SMEs Large SMEs Large SMEs Large SMEs Large Slaughtering and meat packing 410 - 324 - 299 - 299 - 298 3 245 - 233 - Production, processing and preserving of meat & meat products
441 14 410 15 391 16 385 15 404 16 363 15 345 14
Processing and preserving of fish products & other sea foods
1,352 21 1,184 19 1,118 15 1,112 11 1,112 12 1,019 19 1,011 17
Processing/ preserving of fruits & vegetables 202 17 221 16 193 14 396 11 396 11 309 10 305 10 Manufacture of vegetable/animal oils & fats 136 4 117 4 104 6 104 4 104 4 118 5 122 3 Manufacture of dairy products 710 13 665 14 620 13 616 11 616 11 553 12 526 11 Rice/corn milling 22,143 - 21,336 - 21,511 - 21,493 - 21,493 - 20,800 - 20,476 3 Mfr. of starches & products, prepared animal feeds, & grain mill products excl. rice & corn
43 3 33 - 27 3 27 3 27 3 42 - 41 *
Production of prepared animal feeds 128 7 130 5 119 4 121 4 121 4 157 8 155 9 Manufacture of grain and vegetable mill products, excl. rice and corn
752 3 459 4 394 5 393 4 394 4 498 4 497 4
Distilling/rectifying/blending of spirits; ethyl alcohol production from fermented materials
86 7 81 6 77 6 74 5 74 5 65 6 70 5
Manufacture of wines 267 - 257 - 253 - 250 - 250 - 251 - 225 - Manufacture of malt liquors & malt 4 18 3 5 6 5 4 5 4 5 4 6 3 4 Mfr. of soft drinks; bottling of mineral water 1,604 38 1,642 34 1699 37 1,716 29 1,717 28 5,777 21 6,173 22 Baking of bread, cakes, pastries, pies and similar perishable bakery products
21,982 10 21,149 7 21,492 10 21,476 8 21,483 8 21,455 11 21,647 13
Baking of biscuits, cookies, crackers, pretzels & similar dry bakery products
59 13 55 11 52 11 54 8 54 8 67 13 69 12
Manufacture of ice cream cones and wafers 37 - 37 - 31 - 31 - 31 - 31 - 32 - Manufacture of snack products such as corn curls, wheat crunches and similar products
173 7 159 6 132 8 130 5 130 5 117 10 128 6
Manufacture of sugar 178 41 174 34 159 36 158 30 158 30 148 25 148 25 Production of crude coconut oil, copra cake, meals and pellets
70 70 63 - 57 - 57 - 57 - 59 - 49 -
Manufacture of other food products, nec 3,660 37 3,360 34 3,189 36 2,968 29 2,969 30 2,781 29 2,747 25
Notes: - None * Combined with medium-size classification. Source: NSO, various years. List of Establishments.

295
Food processing thrive but only a few dominate the food industries (Table 2.7). If there are more firms, only a small number have the majority share of the market, the rest remaining as marginal players. In the Philippines, the dominant players, namely, San Miguel Corporation, Republic Flour Mills, Universal Robina Corporation, and Purefoods are large-scale agro-industrial corporations all of which are multi-product, vertically integrated manufacturers and processors. There are also the large multinational corporations which invest in updated technologies and facilities such as Dole Philippines and Del Monte Philippines. They dominate the economy’s markets for processed pineapple products.
Table 2.7. Key Players of selected processed/packaged food, Philippines Processed food/Company/Distributor Brand/s
A. Processed fruits and vegetables Del Monte Philippines Del Monte Dole Dole T’boli Agro Industrial Dev. Corp. Valley fresh Ram Food Products RAM California Manufacturing Corp Lady’s Choice Sysu International Clara Ole B. Ready to drink juices Concentrates: 7D International Mango 7D Canned: Del Monte Philippines Del Monte, Today’s Dole Philippines Dole Zest-O Corp Zest-O Cenmaco, Inc. Gina, Luzona Quantum Foods, Inc Seasons Nutrilicious Food Corporation Nutrilicious C. Canned Tuna Century Canning Corp. Century, 555, Fresca Permex Producer and Exporter Corp. Permex Ocean Canning Corp. Ocean’s Best Swift Tuna Corp. Blue Bay Thomas Network Inc. Tommy’s Source: Mojica, 2003. 3. TRADE POLICY ENVIRONMENT The economy adopted an import substitution policy until the 1970s designed to protect domestic industries. This orientation has limited the growth of the industrial manufacturing sector as well as the other sectors of the economy. The weighted average protection rate (EPR) provided to the manufacturing sector was 44 percent in 1974 compared to the 9 percent for agriculture and mining (Cororaton, et al, 2005). As one of the consequences of protectionist policies, the employment share of the manufacturing sector stagnated at about 10-12 percent over time (Menardo, 2004).

296
The flaws and limitations of past protective policies triggered trade reforms both unilateral and partial. Several tariff reforms were undertaken since the early 1980s in an effort to transform the Philippines into a more outward-oriented economy. In the literature, these reforms were in the form of tariff reductions, simplified tariff structures, and tarrification of quantitative restrictions (QRs). The Tariff Reform Program (TRP) and an Import Liberalization Program (ILP) were carried out between 1981-1985 with the end in view of reducing or phasing out tariff protection. The range of tariffs were narrowed from 0-100% to 0-50%. Tariff adjustments were also phased out on 14 manufacturing industries including food processing. The TRP resulted in the average nominal protection rate (NPR) from 34.6% in 1981 to 27.9% in 1985. While NPR was raised down among sectors, the structure of protection remained bias against exports and the agriculture sector. A balance of payment crisis in 1983 led to the postponement of the ILP for 3 years and exchange rate and import controls were re-imposed. Import liberalization resumed in 1986, removing import licensing requirements, with more liberalized items mostly manufactured goods. After the completion of the TRP, a new round of unilateral tariff reductions followed in the 1990s. Executive Order (EO) 470 provided further tariff cuts from 1991-1995. EO 8 was also issued in mid 1992 which replaced QRs. A comprehensive tariff review was undertaken in response to the request of the private sector to look into the lowering of tariffs on capital goods and raw materials to improve their competitiveness (Menardo, 2004). The review was also in preparation of the acceleration of the implementation of the AFTA-CEPT scheme by 2003 and the ongoing GATT-Uruguay Round of Negotiations. Several Executive Orders (EOs) were issued that reduced duties on various products and simplify the tariff structure. For example, EO 264 issued in July 1995 calls for a tariff range from 3 to 10% by the year 2000 and a uniform 5 % tariff by the year 2004 (Yap, 1999). The tariff reforms were complemented by liberalization and deregulation policies in the areas of investments, foreign exchange and services. Increasing trade deficits and the inability of the local industries to compete with their foreign counterparts after the Asian financial crisis prompted another review of the tariff program. This review aimed to correct the remaining tariff distortions and to reduce tariff reductions at a gradual pace to efficient industries. This review started with selected 22 industries deemed competitive that include processed food and marine products. The pacing of tariff reductions is in consonance with the aim of arriving at a uniform tariff under the WTO in 2004. Tariff reforms in the first in the mid-2000s focused on free enterprise, market reliance and market friendly regulations. This is espoused in the economy’s Medium Term-Development Plan 2001-2004 (Menardo, 2004). The government’s role will be in terms of simplifying bureacratic procedures and promoting market-friendly regulations to reduce costs of business undertaking, protection of consumer interest and sectors vulnerable to global market integration. In line with this policy, the government implemented a four-year tariff program in 2001 designed to reduce tariff to 0 to 5% range on industrial and non-sensitive agricultural products. This was a necessary reform to achieve global competitiveness and simplify tariff structure. Due to the fiscal constraints faced by the economy and in consideration of the need to encourage the manufacturing sector, it became imperative to delay the further lowering of tariffs on locally produced agricultural and industrial products. The series of tariff reforms have resulted in lower average nominal tariffs in the Philippine economy (Table 3.1).

297
Table 3.1. Average nominal tariff by sector, Philippines, 1981-2003
Sector 1981 1985 1990 1995 2000 2005 Total economy 34.60 27.60 27.48 15.87 7.95 7.81
Agriculture 43.23 34.61 34.77 27.99 14.40 11.85 Mining 16.46 15.34 13.97 6.31 3.27 2.47 Manufacturing 33.74 27.09 27.49 13.96 6.91 7.29
Source: Philippine Tariff Commission.
While the average nominal tariffs and effective protection rates (EPRs) have been greatly reduced for over about two and a half decades, the structure of protection has remained bias for manufacturing. Exportables in this sector have received lower protection (Table 3.2). Although the EPRs are decreasing for importables there are still distortions in the tariff structure. Aldaba (2005) have computed negative EPRs for manufacturing from 1998 to 2004, reflecting that manufacturing exportables are penalized by the system of protection. Accordingly, given the strong biased against exports, only the best and efficient firms are able to export. Processed food has an average EPR for importables at 15 percent compared with 0.4 percent for exportables. It is even worst in beverages, wherein exportables have negative EPR vis-à-vis EPRs for importables.
Table 3.2. Weighted average effective protection rates, 1998-2004 In percent
Sector 1998 1999 2000 2001 2002 2003 2004
All Industries 8.59 7.80 7.06 7.09 6.14 5.89 6.33 Exportable 2.35 1.75 1.59 1.71 1.16 1.1 1.38 Importable 14.76 13.42 12.28 12.16 10.89 10.48 15.09 Manufacturing 7.01 6.36 5.86 5.79 5.04 4.82 5.13 Exportable -0.38 -0.92 -0.48 -0.45 -0.52 -0.52 -0.53 Importable 14.17 12.93 11.75 11.51 10.20 9.83 10.30 Food processing 19.61 18.32 17.47 17.42 15.57 14.49 15.36 Exportable 0.89 0.91 0.67 0.63 0.29 0.29 0.35 Importable 18.72 17.40 16.80 16.79 15.28 14.20 15.01 Beverages 9.27 7.54 3.88 3.89 1.88 1.75 3.20 Exportable -0.38 -0.34 -0.29 -0.29 -0.25 -0.26 -0.26 Importable 9.65 7.88 4.18 4.18 2.13 2.01 3.46
Source: Aldaba, 2005
3.1 Effects of Trade Policies and Reforms in Processed Foods As a result of the shift from import substitution to export orientation and import liberalization policies, both exports and imports of processed foods increased (Figure 3). Total value of imports, however, continuously surpassed the value of exports from 1992 to 2005.

298
Figure 3.1. Value of exports and imports of processed foods, Philippines, 1985-2005 Source: NSO, various years. Foreign Trade Statistics of the Philippines.
The above trend of trade is also reflected in the export and import penetration ratios (Table 3.3). During the partial trade liberalization period, in the second half of the 1980s the export ratio exceeded the import penetration ratio which may reflect the presence of competitive domestic food processing industries. Beyond this period, export ratios were lower than the import penetration ratios which may suggest weak domestic food processing industries. Due to the stringent requirements (SPS or TBTs) of some importing countries on processed foods, domestic processors are unable to meet these requirements. Export ratios declined slightly beginning 1991 up to 2005. Both export and import penetration ratios were still low which may denote the weak competition among the food processing industries in the domestic market.
Table 3.3. Export ratio and import penetration ratio3 in processed food industry, Philippines, 1986-2005
Period Export Ratio Import Penetration Ratio 1986-1990 0.1115 0.1005 1991-1995 0.0884 0.1214 1996-2000 0.0879 0.1394 2001-2005 0.0869 0.1477
The domestic processed food industries which exhibit competitiveness were processed fruits, nuts and coconut products, and processed fish and marine products. Their net terms of trade have been positive throughout the reference period (Table 3.4). The non-competitive industries with large negative net trade were dairy products and bird’s eggs, animal feeding stuff. Meat and meat preparations, cereal and flour preparations, processed vegetables, and miscellaneous edible preparations also exhibited negative net trade although at a lesser extent throughout the period.
3 Based on Aldaba (2005), Import Penetration Ratio = Imports/(Output – Exports + Imports) Export Ratio = Exports/Output
-
200
400
600
800
1,000
1,200
1,400
1,600
1,800
1985
1986
1987
1988
1989
1990
1991
1992
1993
1994
1995
1996
1997
1998
1999
2000
2001
2002
2003
2004
2005
Mill
ion
US$
ExportsImports

299
Table 3.4. Net trade of processed foods by category, Philippines, 1985-2005 (In Million US $)
Food category 1985 1986 1987 1988 1989 1990 1991 1992 1993 1994 1995 1996 1997 1998 1999 2000 2001 2002 2003 2004 2005
TOTAL 315.2 155.0 86.2 3.2 (53.2) (300.1) 98.5 (47.0) (24.4) (208.2) (387.3) (33.5) (534.0) (353.7) (488.9) (692.8) (698.0) (619.0) (522.9) (768.7) (718.5) Meat and Meat Preparations 0.01 (0.1) (0.1) (0.2) (0.2) (0.4) (0.2) (0.5) (1.7) (7.4) (6.6) (9.1) (13.6) (10.1) (22.1) (10.7) (14.0) (23.3) (10.9) (6.7) (5.1)
Dairy Products and Bird's Eggs (Processed)
(78.0) (106.7) (156.7) (168.6) (222.7) (493.4) (229.0) (271.2) (282.3) (360.1) (392.8) (402.7) (466.7) (324.0) (344.0) (409.9) (462.3) (372.2) (382.2) (492.4) (415.8)
Margarine, Shortening and Vegetable Fats & Oils
0.8 0.9 0.8 1.3 1.0 0.9 0.3 (0.4) (0.5) (0.8) (1.4) (2.9) (3.2) (5.6) (15.7) (19.8) (4.7) (6.9) (5.4) (8.4) (7.1)
Cereal and Flour Preparations (28.0) (37.8) (35.9) (48.6) (73.0) (76.3) (59.9) (66.1) (53.8) (76.9) (68.2) (107.4) (102.2) (63.8) (72.4) (71.7) (59.0) (55.5) (62.2) (70.7) (55.8)
Processed Vegetables (5.1) (12.1) (12.0) (17.9) (18.5) (19.2) (19.8) (33.7) (33.6) (59.8) (45.1) (71.5) (73.6) (62.4) (85.1) (84.3) (76.4) (58.2) (59.7) (67.6) (62.6)
Processed Fruits 130.9 128.4 129.7 133.0 140.0 148.6 172.9 164.9 185.5 170.6 161.2 179.0 169.1 159.0 151.9 180.3 200.5 179.6 213.8 224.6 256.1
Sugar and Sugar Preparations 181.9 98.1 58.6 52.8 101.5 128.3 122.2 86.7 104.6 39.7 (56.6) (1.2) 46.1 23.9 (8.9) (26.0) (21.0) (1.9) 7.7 29.5 33.2
Confectionery and Other Sugar- Based Products
0.0 3.8 4.4 5.6 2.0 2.1 2.9 (4.0) 7.7 (23.8) (19.6) 5.1 (13.7) (1.8) (13.4) (3.2) (1.4) (9.3) (11.6) (11.0) 5.3
Coffee (Processed) 1.0 1.0 1.0 0.5 0.6 0.9 1.3 1.7 1.8 2.6 3.3 3.2 0.9 1.3 0.6 (2.4) (6.7) (8.1) (10.2) (13.7) (16.5)
Cocoa, Tea and Mate 7.9 7.0 7.3 12.9 (5.2) 18.0 16.5 7.8 8.1 11.9 12.2 11.7 3.5 7.3 (7.7) (24.3) (27.4) (31.9) (24.4) (45.7) (38.9)
Beverages (8.8) (3.0) (9.8) (13.8) (20.4) (24.5) 0.5 0.4 1.2 0.9 0.8 0.1 (2.2) (10.3) (31.6) (68.8) (80.5) (88.6) (89.8) (103.7) (100.4)
Nuts and Coconut Products 77.2 45.0 75.6 79.2 77.3 61.2 70.7 92.5 88.5 75.0 73.4 92.2 93.6 80.6 97.0 77.8 72.0 103.0 104.4 113.1 133.9
Sauces, Condiments, Spices & Mixes & Manufactures
5.5 5.4 4.1 3.3 4.6 6.0 7.1 7.0 5.0 3.3 1.2 (4.6) (6.5) (1.8) (5.2) (2.4) (4.6) 0.9 (1.7) (0.7) (4.4)
Miscellaneous Edible Preparations (Food preps)
0.1 (0.8) (2.5) (5.8) (7.8) (6.8) (7.6) (9.9) (11.3) (18.5) (26.2) (51.9) (77.2) (55.5) (66.2) (71.4) (45.1) (51.0) (66.5) (79.9) (126.2)
Animal Feeding Stuff (17.9) (24.9) (35.4) (120.4) (140.9) (141.8) (114.2) (157.6) (220.4) (163.7) (202.8) (142.9) (301.1) (277.4) (198.3) (273.6) (297.8) (359.6) (319.4) (434.8) (467.4)
Processed Fish and Marine Products
47.7 50.6 57.1 89.8 108.4 96.2 134.9 135.2 176.9 198.7 179.9 189.4 212.7 187.0 132.0 117.8 130.6 164.1 195.2 199.5 153.2
Source: NSO, various years. Foreign Trade Statistics of the Philippines.

300
3.2 Trade Shares of Processed Food 3.2.1 Exports Within a 5-year period interval from 1986 to 2005, exports of processed fruits have the largest share to total exports of processed foods, it increased from about 27 percent to about 29 percent (Table 3.5). The second largest contributor was processed fish and marine products, also with increased share from 16 percent to about 21 percent. The contribution of nuts and coconut products remained at about 13 percent, that of traditional exports of sugar and sugar preparations declined continuously from 19 percent to 7 percent. This can be attributed to the effects of Agrarian Reform in sugarcane, the raw material, and the end of the preferential trading agreement for raw sugar between the Philippines and the US. The share of sauces, condiments, spices & mixes and manufactures was nearly twice as much; and more than triple for cereal and cereal preparations. The share of dairy products4 and birds eggs substantially increased, while the shares of processed coffee; margarine, shortening and vegetables fats & oils; and meat and meat preparations remained at less than one percent. The share of beverages declined from one percent to less than percent.
Table 3.5. Shares to total processed food exports, Philippines, 1986-2005
Food Category 1986-1990 1991-1995 1996-2000 2001-2005
Total exports (F.O.B. million US$) 510.5 677.7 700.4 674.3 Percent share, % 100.0 100.0 100.0 100.0 Processed fruits 27.8 27.2 27.3 28.8 Processed fish and marine products 16.2 24.9 24.2 20.7 Sugar and sugar preparations 19.4 15.5 13.3 7.4 Nuts and coconut products 13.4 12.0 12.9 13.6 Animal feeding stuff 13.2 9.5 6.9 4.6 Cereal and flour preparations 1.4 2.5 4.2 5.4 Dairy products and processed bird’s eggs 0.5 0.2 0.6 7.0 Confectionary, other sugar based products 1.5 1.8 3.1 3.2 Sauces, condiments, spices & mixes and manufactures
1.6 2.2 2.6 2.7
Cocoa, tea and mate 2.5 2.4 2.2 1.0 Miscellaneous edible food preparations 0.4 0.6 1.3 4.2 Processed vegetables 0.4 0.5 0.6 0.5 Beverages 1.3 0.2 0.3 0.1 Coffee (processed) 0.2 0.3 0.3 0.5 Margarine, shortening and vegetable fats & oils
0.2 0.1 0.1 0.03
Meat and meat preparations 0.0003 0.01 0.1 0.2 Source: NSO, various years. Foreign Trade Statistics of the Philippines.
4 Re-exports for dairy products.

301
The export performance of processed food industries is influenced by the characteristics of the firms or industries themselves. Based on the empirical study by Duenas-Caparas (2006), the skilled manpower and foreign affiliation of Philippine food processing establishments showed positive and significant influence on their export performance (Table 3.6).5 Foreign affiliation in local firms appears to be the primary source of knowledge and technology.6 While technical skills acquired through training improve productivity and quality of goods produced and hence, the propensity to export. Results of an alternative-reduced form regression model showed that an increase in the proportion of skilled workers by one (1) percent will increase export performance by 12 percent. In like manner, a one (1) percent increase in foreign equity participation will improve the proportion of export to sales by 12 percent. Other firm level characteristics such as size, age of firm, R&D expenditure, capital intensity were empirically tested but the results were contrary to expectations. Table 3.6. Empirical results of firm level characteristics of Philippine food processors
on their export performance
Variable Model 1 Model 2 Marginal Effects Constant -4.70
(-5.56) -5.04
(-6.39)
Firm size 18.06 (0.25)
4.73 (0.06)
0.165
Squared firm size -147.52 (-0.32)
-181.70 (-0.15)
-6.329
Skilled manpower 3.42* (2.20)
3.50* (2.31)
0.122
R&D expenditures/sales -54.77 (-1.14)
Skills training of workforce 1.11 (1.24)
0.76 (0.90)
0.034
Foreign affiliation 1.24* (2.10)
1.64* (2.71)
0.123
Capital intensity -0.00 (-1.15)
-0.00 (0.26)
0.000
Firm age -0.56 (-1.15)
-0.04 (-0.87)
-0.001
Squared firm age 0.00 (1.73)
0.00 (1.23)
0.000
Akaike Information Criterion (AIC)
1.82 1.81
Sample size (no. of processing firms)
189 189
* Significant at 95 percent level. Figures in parenthesis are z values.
Source: Duenas-Caparas (2006).
5 The author used data from a firm-level survey undertaken in 2002 by the Asian Development Bank in collaboration with the Word Bank and the National Statistics Office. Firm level information covered the period 2000-2002. 6 This reinforces the role of FDI in food processing industries as discussed in an earlier section.

302
3.2.2 Imports The Philippines is a net importer of dairy products. Dairy products together with processed eggs, accounted for the largest imports of processed foods. The share to total value of imports, however, dropped from about 44 percent in the early period to 33 percent in the recent period of the reference years (Table 3.7). Import share of animal feeding stuff, the second largest, scaled down from 30 percent to 28 percent. The share of cereal and cereal preparations also decreased from about 12 percent to 7 percent. On the other hand, the import share of miscellaneous edible preparations went up.
Table 3.7. Shares to total processed food imports, Philippines, 1986-2005
Food Category 1986-1990 1991-1995 1996-2000 2001-2005
Total exports (C.I.F. million US$) 532.3 791.4 1,177.0 1,482.6
Percent share, % 100.0 100.0 100.0 100.0
Dairy products and processed bird’s eggs
43.6 38.9 33.4 32.7
Animal feeding stuff 30.1 29.9 24.4 27.9
Cereal and flour preparations 11.5 10.4 9.6 7.1
Processed vegetables 3.4 5.3 6.8 4.7
Miscellaneous edible food preparations
1.3 2.4 6.2 7.3
Sugar and sugar preparations 2.1 5.7 7.4 3.5
Beverages 3.9 0.1 2.1 6.3
Confectionary and other sugar based products
0.8 2.4 2.3 2.1
Cocoa, tea and mate 0.9 0.6 1.5 2.8
Processed fruits 1.1 1.7 2.0 1.3
Sauces, condiments, mix seasonings 0.6 1.3 1.9 1.6
Meat and meat preparations 0.04 0.4 1.2 0.9
Margarine, shortening and vegetable fats & oils
0.03 0.2 0.8 0.5
Coffee (processed) 0.01 0.01 0.1 1.0
Marine and fish products 0.5 0.4 0.2 0.1
Nuts and coconut products 0.1 0.2 0.2 0.1
Source: NSO, various years. Foreign Trade Statistics of the Philippines.

303
4. ISSUES AND CHALLENGES OF THE FOOD PROCESSING INDUSTRY Some of the issues and problems which are common to the different food processing industries are continuing from the past especially with the SMEs. Because of the linkage between the agriculture and industry sectors, the issues, problems and policies that affect one sector bear impact, favorably or adversely, direct or indirectly , on the other sector. These issues and problems pose as challenges to both the public and private sectors. High transportation costs and the monopolistic nature of the shipping industry. Adoption of technology. Adoption of improved processing technology has been observed to be low especially in small enterprises. This is attributed to the cost and availability of equipment suited for their production levels, and the lack of communication between the entrepreneurs, the academics and other research institutions. Lack of support services. For small food processors who are mostly in the rural sector, the lack of postharvest facilities remain a constraint. Systems of handling contribute to postharvest losses. Accredited laboratory facilities for analysis of foods are not available in the regions. Access to financial assistance. SMEs, particular the micro and small-scale, still face difficulties in accessing credit particularly from foreign banks which in turn is attributed to accessibility problem due to branch location and the lack of information of credit facilities (Hapitan, 2005)7. Also, loans for food processors are available on a medium-term basis at an interest rate of 16-20 percent. This arrangement becomes a constraint for small and medium enterprises whose products are paid for on 30-90 days credit. Food processors are also pushing for a decrease in interest rates from 14 to 12 percent of medium-term loans and from eight (8) to six (6) percent for long-term loans. Value added tax. The tax credit method of calculating VAT liability makes the VAT not a tax on value added but a tax on gross value of the output of activities that use VAT-exempt inputs. The scheme distorts the structure of production incentives by effectively imposing a heavier burden on the agro-processing sector relative to sectors that do not use VAT-exempt inputs intensively (Elazegui, 1998). Trade restrictions. Philippine exports in general continue to face high tariffs and non-tariff barriers that restrict market access to some countries (Avila, 2005). The Philippines has to comply with the numerous SPS such as the strict biosecurity regime in New Zealand, particularly tropical fruit and vegetable sap extract and the New Zealand and Australian labeling requirements for processed seafood exports and rigorous licensing import requirements. Other technical barriers which the Philippine
7 The Magna Carta for Small Enterprises or RA 6977 required banks to set aside at least 5 percent of their net portfolio to small enterprises. RA 8289 which amended RA 6977 increased the mandatory allocation of credit resources to small enterprises from 5 percent to 6 percent and to provide a separate allocation of 2 percent to medium-sized enterprises. The Bangko Sentral ng Pilipinas reported that there was overcompliance with both the 6 percent and the 2 percent credit allocation requirements for SMEs, respectively (DTI, 2007).

304
SMEs may have difficulty in implementing are as follows: specific codes of conduct on environmental standards and certification regarding environmental management systems; and the social accountability standards on workers rights, health and safety of employees and rejection of child labor which is being promoted by the EU. Competitiveness. Related to the ongoing trade liberalization, maintaining competitiveness in the international market is a major problem of processed food exporters. Quality of a product is a critical factor in establishing a share in the world market. In spite of existing policies on the evaluation and testing procedures by the Bureau of Food and Drugs, there had been reports on detention of entries of processed food products by the US Food and Drug Administration (De la Cruz, 1995). The threat of foreign imports is seen to intensify with the imposition of the 0-50 percent tariff rates in 2004. With the opening up of the market, competition with local producers may bring down domestic prices. Most of the above issues and problems affect the micro, small and medium scale food establishments in food processing. Large scale establishments engaged in food processing integrate their downstream and upstream activities or outsource some a few of their activities or form subsidiaries to undertake specific activities. Such is the case of San Miguel Corporation which is a food and beverage conglomerate doing toll arrangements for production of their raw materials, logistics and distribution of their products. Another example is Alliance Tuna International which has a subsidiary as source of packaging materials that the company requires for its processed tuna products.

305
5. IMPACT OF TRADE LIBERALIZATION: INDUSTRY LEVEL ANALYSIS The contribution of each processed food category to total exports of processed food as shown in Table 3.5 in the previous section, served as basis in selecting the categories for analysis in this study. Six categories were selected, three major exports (fruits, fish and marine products, nuts and coconut products) each with more than 10 percent share to total value of processed food exports; two with export shares from 1 to 5 percent (cereals and flour preparations; sauces, condiments, spices & mixes and manufactures); and one with export share of less than one percent (processed vegetable). Each category is represented by one processed food industry (Table 5.1).
Table 5.1. Selected processed food category and food industry, Philippines
Category Processed Food Industry Processed fruits Mango Processed fish & marine products Tuna Nuts and Nut Products Desiccated coconut Cereal and flour preparations Noodles Sauces, condiments, spices & mixes and manufactures
Soy sauce
Processed vegetables Processed Seaweed/Carageenan The impact of trade liberalization on the performance of the six (6) food processing industries are analyzed using the market structure, conduct and performance (S-C-P) paradigm (Figure 5.1) Figure 5.1. A model of Structure-Conduct-Performance paradigm Note: direct effect feedback effect Source: Nasir, 2006
Basic Market Conditions - Demand Conditions - Supply Conditions
Market
Government Policies
Performance
Conduct

306
Due to the difficulty of securing primary financial data from these industries, data from the Securities and Exchange Commission (SEC) were heavily relied upon. But even the SEC data made available to the public do not comprise a time series that would permit industry analysis that traces performance from pre- to post-trade liberalization period (Appendix 1). A profile of each processed food industry from both primary and secondary sources, the latter using the key informant approach, precedes performance analysis. 5.1 PROCESSED MANGO INDUSTRY 5.1.1 World Mango Production and Trade The Philippines progressed from the 10th largest mango producer to its rank in 2005 as the 7th largest mango producer in the world, next to India, China and Thailand (Table 5.2). Increased area, improved technology and farm management especially in large farms, and market prospects boosted growth in the Philippine mango industry. In terms of mango exports, the economy is the 2nd top world exporter next to India and Mexico in 1995 and 2000. The distinct taste of “carabao” mango variety known in the external market as “Manila Super” puts it as a distinct Philippine fruit export (Department of Agriculture-Agricultural Marketing Assistance Service, n.d.). In 2004, the export rank of the economy dropped to 6th place due to reduced domestic supply8. This is also attributed to the inability of exporters to comply with importing the countries’ stringent sanitary and phytosanitary (SPS) requirements, especially for fresh mangoes, as a result of trade liberalization. Moreover, competition in the world market is increasing. Many producing countries are now growing and exporting the few varieties in demand. The US which is the biggest importer of mangoes buys mainly from Mexico. While the Philippines is still the biggest supplier of mangoes to Japan and Hongkong which are the biggest importers of mangoes in Asia, supplies from Australia, Thailand, Indonesia and Malaysia are slowly capturing these lucrative markets.
Table 5.2. The Philippines in world mango production and trade, various years
Production Export Year MT’000 Rank US$’000 Rank
1985 355 10 8,489 3 1990 338 9 15,324 3 1995 594 9 43,234 2 2000 848 7 39,812 2 2005 950 7 36,895* 6
*Figures in 2004. Source: FAOSTAT
8 In 2004, domestic mango production declined by about 4 percent from year ago levels due to strong winds and heavy rains that affected mango trees during flowering stage (Bureau of Agricultural Statistics, 2005).

307
5.1.2 Industry Profile Size of Operation. Commercial production of processed mango started in the late 1970s, mostly in small scale operations using home-based technologies (Pearl2, 2004). The Philippine processed mango industry is characterized by SMEs. Large corporations, however, also include processed mango in their line of products. Processed Mango. Mangoes usually processed are the excess from domestic consumption and export, and those which do not meet standards. Otherwise, the excess supply would end up as waste or would have a downward effect on prices of fresh mango. Over time, the supply requirement for quality fresh mango are no longer the excess volume. This emanated from the development of market and processing standards. Domestic processors require first-grade mangoes that are mature, free of bumps, cracks, and black spots. Due to product development, processed mango products are now diverse although dominated by dried mango (slice, diced, chopped) and mango puree. The other products are jelly jam, concentrated juice, juice other than concentrate, nectar, candies, pickles and catsup. Brand awareness is a major factor in the market and this is one of the reasons why large companies capture the market. Small processors, usually sell their products in trade fairs, gift/token centers, and specialty shops. Source of Raw Material. Mango processors source fresh mango from small, medium and large growers9 and from middlemen/assemblers (Figure 5.2). In major producing areas, buying stations are established either by middlemen or large processors. Processors are either simply processors, processors/exporters, or processors/wholesalers and/or retailers. Processed mango products are either bought from distributors or supplied directly by processors through their marketing arm. Number/Types of Mango Processors. It is not easy to determine the number of mango processors due to the ease of market entry and exit especially with micro and small enterprises. Based on the list of companies registered with the Board of Investment (BOI) and other industry listings, Digal (2005) reported that in 2000 there were about 17 mango processors in Luzon island, 11 in Visayas, and four in Mindanao. The PEARL2 Project of the Canadian International Development Agency (CIDA) reported that in 2004 there were 83 mango processors in the Philippines with the following distribution: Luzon (60), Visayas (18), and Mindanao (5). Processing Firm Characteristics. Based on a survey of 13 sample mango processors out of the 83 processors in 2004, a mango processor hires 52 persons on average (Pearl2 Project, 2004). The number of workers triple in number during peak operations. Fifty six percent of the workforce are women who dominate in production and marketing activities. Most of the processors export from 20 percent to 80 percent of their products.
9 Two-thirds of total mango farms are small farms (<3 hectares), one-fourth are medium-sized farms (3 < 10 hectares), and about 3 percent are large farms (> 10 hectares) (National Statistics Office, 2002).

308
Figure 5.2. Market flow of mango, Philippines Concerns of the industry. The concerns of the processed mango industry are related to supply of raw materials, low recovery rate of processed mango, high cost of inputs and logistics, technology development and good manufacturing practices. The peak season of mango occurs in summer and the lean season in the rainy months starting in June. SMEs are unable to take advantage of year-round supply from Mindanao island10 due to high cost of transport. Large corporations capture the fresh mango supply from contracts with mango growers. Volume and continuous supply of fresh mango are the concerns of small mango processors. In the major mango producing provinces of Zambales in Luzon island and Guimaras in the island of Visayas (Personal interview, 2007a), small processors11 either cease processing operations and resume only during the peak season or shift to processing of other fruits such as pineapple and papaya during mango off-season. In addition to the seasonality of supply, there is difficulty in assembling the volume and product standards needed by processors because of the predominance of small growers. While buying stations are established in major producing areas, mangoes are not classified. Because of this practice, growers become unaware of the requirements on size and quality of the processors/exporters.
10 The Philippines has three major islands, namely, Luzon, Visayas and Mindanao. 11 These small processors are registered with the Department of Trade and Industry (DTI). This agency provides technical assistance in the form capital investment for small processing equipment and training. Their market includes groceries, trade fairs, visitors in the province, overseas Filipinos. Some send their processed mango products in small commercial volume through international couriers. Since these volume do not pass customs, they are not part of the economy’s trade statistics.
Independent Farmers Small/Backyard /Large
Mango Processor
Middlemen/ Assemblers
Fresh Mango
Exporter
Small/Backyard/ Large contractor
Company Owned Farms Producers/
Processors/Exporters
Local Retailers
Foreign Buyers
Wholesaler/ Supermarket

309
The low recovery rate for processed mango dried mango chips and puree is attributed to the low quality of fruits grown in the economy. Good mangoes are produced only under specific agro-climatic conditions. At buying stations, poor quality mangoes are mixed with good quality mangoes until they reach processing plants. Prices of off-season fresh mango are high. Competition between fresh mango export and domestic use also raises domestic price. For example, the cooperative-processor in Guimaras complained that when this province was not yet exporting mangoes to Australia, the local price ranged from PhP10-PhP15/kg (US$0.20-US$0.30). The current price now stands at PhP25/kg (US$0.50/kg). Sugar is a major ingredient for fruit processing, thus, its price affects processing costs. Dried mango contains 58 percent to 68 percent sugar (De la Pena, 2005). In 2004, the imported price of sugar was around US$8-US$9/bag compared to the domestic retail price of US$16-US$17/bag. The high tariff of sugar at 50 percent for in-quota and 65 percent for out-quota makes imported sugar price about the same with domestic price. With mango processing recovery of 10-12 percent, makes investment very high. For a medium-sized processor producing 42 tons monthly, the costs of raw material, labor and packaging is estimated at PhP1M (US$20 thousand); and cost of a high temperature asceptic technology is estimated at PhP1.7M (US$34 thousand). The archipelagic nature of the economy, the low ship loading priority given to mango, and the losses incurred due to the perishable nature of the fruit, contribute to the high cost of transport and the product itself. Packaging materials are expensive such as imported tin sheets for cans used in fruit processing and some paper for labeling. The current tariff for packaging is 15 percent. Due to resource constraints, small processors cannot avail of good packaging and labeling materials. The Philippine Food Processors and Exporters Organization (PHILFODEX) has recommended the following: duty-free importation of packaging products and raw materials that are not available in the domestic market; and reduction in the tariff for locally available materials to 3 percent (Digal, 2005). The adoption of health and hygiene control and quality practice such as GAP/HACCP which enforced by the Bureau of Food and Drugs (BFAD) of the Department of Health, have been slow due to the resistance by food industry players especially small producers and processors. They view the guidelines as too restrictive and the process, costly. Many SMEs are unable to meet the standards set by law because of lack of technical capability and fund resources. Also, government regulating and enforcing agencies fail to apprehend violators due to manpower constraints (Angeles, 2006). An increasing concern of Philippine processed mango is the competition posed by other producing countries. Dried and pureed mangoes produced in Thailand, India Malaysia and Indonesia are considered brand competitors of Philippines processed mango while China and Vietnam are price competitors.

310
5.1.3 Trade Liberalization and Exports of Processed Mango Products With the ongoing trade liberalization among countries, competition is the rule of the game and standards are set high. Countries increase their export performance in products where they have comparative advantage and if they meet the standards. Standards. The Philippines adhere to the Codex Alimentarius Commission on Standards stated in the SPS Agreement of WTO member countries for their processed food exports. Codex Standard 79 which covers jams, fruit preserves and jellies are being followed by the economy’s processor and exporters of processed fruits (Angeles, 2006). The minimum standards quality for processed mango set by he economy’s Bureau of Product Standards (BPS) and CODEX are being harmonized (Digal, 2005). Under the Philippine National Standards (PNS), the BPS specification for dried mango are as follows: grading, sulfur dioxide residue, additives, moisture content, packaging and labeling requirements. Specifications for mango puree include grading, general requirements such as soluble solids, titratable acidity and microbiological count), sampling, methods of analysis, packing and labeling. CODEX has no specifications for dried mango and mango puree. It has specification for canned mangoes under CODEX 159-1987. Most processors conform to the PNS which is less stringent but they normally follow the standards of their buyers to ensure product entry in their specific export markets. For example, the US market requires no sugar, artificial preservatives and food coloring. For dried mango, Germany and the Netherlands specify a minimum residue level of less than 500 ppm for sulfite, while Japan requires not more than 5 ppm. Under Philippine standards, sugar content should be at least 15oBrix to conform with US and EU market requirements. Also, the US market specifies registration of food canning establishments which is the common detention case for mango puree. Japan and the US may not accept products that used sulfite-based preservatives (Pearl2 Project, 2004). Export Performance. Under a liberalized trade regime, the domestic processed mango industry benefits from lower tariffs imposed by export destinations. For example, Japan reduced its tariff on fresh and dried mangoes from 6 percent to 3 percent, pegged its tariff at 10 percent from the previous, and zero tariff rates of Australia, United Kingdom, Hongkong and New Zealand. The trend of mango exports from mid 1985 to 2005 is traced in the following section, from the economy’s partial trade liberalization to trade globalization under the WTO. Value of total mango exports (fresh and processed) accelerated from the mid 1980s to early 1990s (Figure 5.3). This was part of the period when policies shifted from import substitution to export orientation. Exports fluctuated but followed an increasing trend up to the WTO trade liberalization period in 2005. The value of processed mango exports followed this trend. Volume escalated from 320 tons in 1985 tons to a range of 8-10 thousand tons from 1991-1993, with corresponding increases in value from US$1.2M to a range of US$3M-US$16M. Processed mango exports slowed down until the early 2000s although the levels exceeded those in 1985 and 1990. During this period domestic supply gave priority to the fresh mango market. The value of fresh mango export accounted for more than 70 percent of total mango exports. In 2003, processed mango exports reached almost 20M tons valued at

311
0
10,000
20,000
30,000
40,000
50,000
60,000
70,000
1985
1990
1991
1992
1993
1994
1995
1996
1997
1998
1999
2000
2001
2002
2003
2004
2005
Total Fresh Processed
14.818.3
36.3 35.9 37.2
27.8
22.3 22.2 23.818.8
22.4 21.4
33.5
25.6
49.043.7 42.3
0.00
10.00
20.00
30.00
40.00
50.00
60.00
1985 1990 1991 1992 1993 1994 1995 1996 1997 1998 1999 2000 2001 2002 2003 2004 2005
US$30M when domestic production was at its record high level. The share of processed mango exports to total mango exports increased from 22 percent in the mid-1990s to more than 40 percent from 2003 to 2005 (Figure 5.4). Fresh mango export slowed down due to stringent SPS measures by importing countries such as the use of vapor water treatment and free from fruit flies and weevils. Decreased mango production in 2004 due to adverse weather had affected mango exports.
Figure 5.3. Value of total mango exports, fresh and processed mangoes, Philippines, 1985, 1990-2005
Source: NSO, various years. Foreign Trade Statistics of the Philippines.
Figure 5.4. Percent share of processed mango to total value of mango exports, Philippines, 1985, 1990-2005 Source: NSO, various years. Foreign Trade Statistics of the Philippines.
The structure of processed mango exports have changed over time which reflected the demand of the external market (Appendices 2 and 3). In 1985, dried mango was the top export contributing US$1.01M or almost four-fifths to total value of processed mango exports. It was overtaken by mango puree in the first half of the 1990 decade. At the start of the decade, puree export was US$3.4M which dominated the processed

312
mango export as there was no record for dried mango (Table 5.3). Its export share declined considerably from 2000 to 2003 as dried mango recovered and other processed mango export increased their shares. Mango puree took the lead again in 2004 and 2005. Juice other than concentrate is the third largest export.
Table 5.3. Distribution of processed mango exports, Philippines, various years
Year Dried
Puree Juice Other than Con-centrates
Uncooked/ Cooked by Boiling in
Water, Frozen
Others Total Value
In percent, % US$’000 1985 78.30 - - - 21.20 1,295 1990 - 98.69 - - 1.31 3,440 1995 35.78 40.70 12.80 4.99 5.73 12,433 2000 58.42 13.25 20.29 7.93 0.11 9,374 2001 56.74 13.55 23.79 4.67 1.25 14,113 2002 41.12 19.52 29.21 8.86 1.29 9,401 2003 46.11 40.01 8.52 3.78 1.58 29,742 2004 36.41 41.34 13.64 6.65 1.96 22,306 2005 32.95 36.70 17.60 11.84 1.09 19,538
Source: NSO, various years. Foreign Trade Statistics of the Philippines. Export Destinations. Hong Kong, China; and the USA were consistently the largest markets for Philippine processed mangoes in 1985 and the 1990 decade, accounting for more than 50 percent of total annual export earnings from processed mangoes (Table 5.4). The third largest market during the period was either Singapore, People’s Republic of China, Japan, Germany and Netherlands. The USA was the largest buyer in 2001, 2002 and 2004; and Korea in 2003. In 2005, the top three markets were Japan, USA and Hong Kong, China.
Table 5.4. Major markets of Philippine processed mango products, various years
1985 1990 1995 2000 2005 Rank
Economy Share
% Economy Share
% Economy Share
% Economy Share
% Econom
y Share
% Total 100 Total
100
Total 100 Total 100 Total 100
1 Hong Kong, China
32.0 Hong Kong, China
54.8 Hong Kong, China
36.8 Hong Kong, China
28.3 Japan 28.2
2 USA 26.5 USA 15.0 USA 25.7 USA 16.5 USA 25.6 3 Singapore 12.2 Singapore 13.9 New
Zealand 5.7 Japan 10.5 Hong
Kong, China
6.9
4 Canada 9.0 Canada 4.7 Singapore 4.7 Germany 10.5 Korea 5.4 5 Others 20.3 Others 11.6 Others 27.1 Others 34.3 Others 33.9

313
Source: NSO, various years. Foreign Trade Statistics of the Philippines. Processed Mango Imports. While the economy is the world’s second largest mango exporter, it also imports small amounts of processed mango (Appendices 4). In some years the imports were mainly mango juice other than concentrates. The other imports were mango juice concentrates, prepared/preserved in vinegar; and preserved edible parts. The major sources were Australia and India. 5.1.4 Market Performance Analysis Profile of Firms. Market performance analysis include 13 mango processors/ exporters 12. Their registration date as far back as 1981 and the latest in 2002. In addition to processed mango as their major product, nearly all of these firms also process other fruits. Their sales records cover all fruits that they process and trade. Based on size classification of establishments in the economy, majority or 10 of the firms are SMEs and three (3) are large scale. One medium-size firm increased its assets and operations in 2005 and hence, was classified as large firm since that year. Market Structure. The degree of market concentration of the 13 firms were measured through the concentration ratio (CR), Herfindahl-Hirschman Index (HHI), Gini coefficient and Lorenz curve. With more firms, the industry shares are spread out. With only five (5) firms in 199713, the 2-firm, 3-firm and 4-firm concentration ratios (CR2, CR3, CR4) were the highest at more than 90 percent each. The ratios decline as the number of firms increases to 9 until 13 (Figure 5.5). Nevertheless, the concentration ratios are high regardless of the number of firms. The two largest firms still control the processed mango industry. The sudden rise in their shares to C2=89.40 percent in 2001 and also of the three large firms, C3=96.20 percent, was due to the significant increase in their sales (Appendix 5). On the other hand, the lowest shares of the large firms (CR2=70.60 percent and CR3=88.70 percent) in 2004 and 2005, coincided with the downward trend in processed mango exports as shown in Figure 5.6 of the earlier section. The measure of four-firm concentration ratio where CR4 is greater than 95 percent, leaving a less than 5 percent share to the SMEs. The high concentration ratios for Philippine processed mango is corroborated by the HHI from 1997-2005 (Figure 5.6). By concept, however, the HHI takes into account the market shares of all the firms in the industry unlike in the concentration ratio. Thus, while the CR2 and CR3 in 2000 went down, respectively, to 75.70 percent and 88.40 percent, from 77.90 percent and 89.40 percent in 1999, the HHI rose instead to 3,943 from 3,455 due to significant change in market shares among the mango processing firms. In similar manner, from 2004 to 2005 the CR2 and CR3 decreased but there was no significant change in the HHI (Appendix 5).
12 The 13 firms were deemed sufficient representations of the economy’s mango processing industry. Their available SEC records refer to the more recent period. For example, one firm was registered on March 24, 1981 but available records were only for 1998-1999 and 2001-2004. A few firms had entered the market only recently. One firm was registered on December 2, 2002 such that its records are for 2003 and 2005. 13 Records of some firms are not available and some firms may not have been established yet.

314
The inequality of market shares is also shown by the Gini ratio (Appendix 5) and Lorenz Curve. The Lorenz Curve in 2004 when all 13 firms have available records are shown in Figure 5.7.
Figure 5.5. Concentration ratios of mango processing firms, Philippines, 1997-2005
Number of firms: 1997( 5), 1998( 9), 1998(11), 2000(10), 2001(11), 2002(11), 2003(12), 2004(13), 2005(11)
Figure 5.6. Herfindahl-Hirschman Index of mango processing firms, Philippines, 1997-2005
0
20
40
60
80
100
1 2 3 4 5 6 7 8 9 10 11 12 13 14
Cumulative % of Mango Processing Firms
Cum
ulat
ive %
of M
arke
t Sha
re
65.00
70.00
75.00
80.00
85.00
90.00
95.00
100.00
105.00
1997 1998 1999 2000 2001 2002 2003 2004 2005
CR2 CR3 CR4
6,313
3,9803,455
3,943
4,856
3,3844,059
3,677 3,648
-
1,000
2,000
3,000
4,000
5,000
6,000
7,000
1997 1998 1999 2000 2001 2002 2003 2004 2005

315
Figure 5.7. Lorenz curve for mango processing firms, Philippines, 2004 There is no evidence of collusion among the large firms in order for them to raise their prices. Product quality, brand and packaging contribute to the large market share and pricing. The source of raw material and location of processing also count, as in the case of Philippines dried mango where those coming from Cebu City carries with it perceived quality premium as perceived by domestic consumers. The large mango firms also source part of their requirement of fresh mango as raw material for processing from other growers/processors (Personal interview, 2007b). Market Conduct. Advertising expense is positively related to the size of firm. Large mango processing firms spent more on advertising than their SME counterparts. Two of the large firms reported large annual advertising expense from 2002 to 2005. Their yearly ad-sales ratio ranged from 0.91 percent to 4.71 percent during the period (Table 5.5). Even small and medium size firms also incur large advertising costs to beef up their market share especially when these are new entrants to the market. In 2004, one small size firm had ad-sales ratio of 3.55 percent and 6.20 for one medium size firm. Based on the records of the firms, advertising costs were more intensive from 2003 to 2005 compared to earlier years (Appendix 6). This maybe partly attributed to the increasing competition among domestic mango processing firms, and the influx of substitute fresh and processed fruits from external markets under trade liberalization.
Table 5.5. Advertising-sales ratio of mango processing firms, Philippines, 1997-2005
Company No. 1997 1998 1999 2000 2001 2002 2003 2004 2005
In Percent SMEs
1 ** ** ** ** ** ** 0.549 0.880 *2 ** ** * * * ** * * *3 ** ** * 2.669 * * ** 3.546 *4 ** * * * * * * * *5 ** 0.215 0.635 ** * * 0.146 * **6 ** * * * * * 1.403 6.195 0.139 7 * * * * * * 0.393 0.209 0.213 8 ** ** ** ** 1.042 0.618 0.090 * *9 * 0.542 0.630 0.506 0.003 0.004 * 0.026 0.028
10 0.081 0.032 0.085 0.169 0.068 0.083 0.104 0.032 Large
10 0.209 11 0.581 0.222 0.219 0.809 * * * * *12 ** * * * ** 4.707 3.271 3.984 2.526 13 * * * 0.771 1.461 1.933 1.008 0.675 0.908
* No advertising expense reported. ** No report for the year.
Note: The No. 10 firm was classified as SME from 1997 to 2004 based on its reported assets. When this firm increased its assets and operations in 2005,

316
it was classified as a large firm since that year. Measures of Market Performance. The profitability of mango processing firms were measured using three (3) methods: rate on return on assets after tax (ROA), rate on return on stockholders equity after tax (ROE), and return on sales after tax (ROS). The financial records showed losses by a few SMEs. One large firm also reported losses in 2004 and 2005 (Appendix 7). Losses, tax and interest payment were charged either to the firms’ assets or equities14, or payment of tax and interests were deferred. The ROAs fluctuated as total assets and profits also fluctuated. The third largest firm (No. 10 in Table 5.6) had the highest ROA reaching almost 55 percent in 2002. The largest firm had very low ROA at less than one percent from 1997 to 1999. SMEs not incurring losses have ROAs ranging from 0.10 percent to 15.45 percent. The performance of firms in terms of returns to equity and sales after tax are affected by losses incurred by firms. In some years, the ROEs and ROS were negative due to the reported losses and even large firms are not spared. The ROEs of firms with positive profits ranged from 7 percent to 114 percent for large firms and from 0.92 percent to 198.8 percent for SMEs (Table 5.7). Also, considering only positive profits of firms, the ROSs of SMEs ranged from 0.05 percent to 12 percent and for large firms from 0.18 percent to 74 percent (Table 5.8).
Table 5.6. Rate of return on asset (ROA) of mango processing firms, Philippines, 1997-2005
Company No. 1997 1998 1999 2000 2001 2002 2003 2004 2005
In Percent SMEs
1 ** ** ** ** ** ** (43.67) (10.64) (32.38)2 ** ** 4.10 3.76 1.32 ** 1.70 0.82 1.45 3 ** ** (15.32) (22.33) (32.53) * ** (12.24) (4.27)4 ** 1.18 1.16 0.21 1.15 (3.21) 2.14 2.19 12.99 5 ** 7.07 10.83 ** (5.65) 0.11 6.93 3.48 **6 **(120.42) (36.25) (17.76) 0.76 (25.67) 2.94 2.83 5.33 7 1.52 (6.73) 0.24 (7.65) 0.89 (3.36) 2.32 1.87 2.88 8 ** ** ** ** 3.52 1.52 1.33 0.73 0.79 9 0.10 0.92 2.53 0.90 0.53 0.45 0.42 0.27 0.26
10 0.37 1.27 (9.05) 15.45 5.34 3.97 4.58 7.20 Large
10 6.04 11 8.19 30.86 20.00 10.98 10.80 54.94 2.85 2.73 5.94 12 ** 3.12 1.96 1.75 ** 1.11 0.41 (0.09) (30.98)13 0.78 0.16 0.41 3.02 2.12 2.28 3.12 2.12 2.20
* Incomplete records for the year. ** No report for the year.
14 In case of a loss, if this is charged to the firm’s equity the latter may become negative if it is not sufficient to cover the loss. In case of a loss the computed ROA, ROE and ROS are negative.

317
Table 5.7. Rate of return on equity (ROE) after tax of mango processing firms
Philippines, 1997-2005
Company No. 1997 1998 1999 2000 2001 2002 2003 2004 2005 In Percent
SMEs 1 ** ** ** ** ** ** (112.6) (24.82) (26.98)2 ** ** (2.13) 2.07 (0.85) ** (1.58) (1.58) (4.84)3 ** ** (48.71) 36.53 30.38 * ** (5.17) (1.83)4 ** 1.53 (1.42) (0.30) (1.64) (5.28) (3.72) (5.28) (27.17)5 ** ( 5.73) (7.58) ** 2.62 (0.04) (2.14) (1.33) ** 6 ** (84.08) (55.69) 20.51 (0.90) (26.48) (3.75) (7.16) (9.34)7 30.63 ( 243.87) (27.39) 198.81 (103.72) 85.86 (73.28) (194.05) 153.34 8 ** ** ** ** 32.34 15.74 21.13 8.89 8.119 1.24 12.17 22.29 9.37 3.57 2.81 1.45 1.13 0.92
10 7.51 10.92 ( 195.04) 126.39 28.25 24.46 24.56 32.75 Large
10 24.9011 85.88 55.17 42.43 20.78 24.07 114.04 5.16 5.36 11.4712 ** 72.44 75.90 7.71 ** 22.56 21.56 (0.81)(351.78)13 15.03 6.99 13.58 56.20 28.64 23.28 20.23 14.91 14.57
* Incomplete records for the year. ** No report for the year.
Table 5.8. Rate of return on sales (ROS) after tax of mango processing firms Philippines, 1997-2005
Company No. 1997 1998 1999 2000 2001 2002 2003 2004 2005
In Percent SMEs
1 ** ** ** ** ** ** (97.92) (7.22) (111.94)2 ** ** 4.43 4.59 2.21 ** 2.30 0.22 0.40 3 ** ** (71.05) (60.99) (266.11) (278.31) ** (60.34) *4 ** 1.46 1.05 0.21 1.11 (6.30) 2.23 1.85 2.41 5 ** 8.00 12.54 ** (5.71) 0.13 4.13 2.18 **6 ** (289.19) (288.66) (48.00) 1.39 (55.67) 3.95 3.18 3.97 7 0.54 (2.84) 0.14 (5.88) 0.87 (2.48) 1.12 0.91 1.35 8 ** ** ** ** 1.58 0.71 1.04 0.51 0.609 0.45 1.28 1.46 0.56 0.37 0.28 0.30 0.20 0.20
10 0.05 0.11 (2.82) 2.32 0.87 0.98 0.88 1.52 Large
10 1.22 11 36.72 73.47 66.12 49.36 52.40 74.35 18.15 14.53 28.65 12 ** 15.77 11.24 1.10 ** 3.87 2.72 (0.23) (25.69)13 0.79 0.18 0.44 2.49 1.83 1.93 1.51 1.48 1.59
* Incomplete records for the year. ** No report for the year.

318
5.2 PROCESSED TUNA INDUSTRY In the Asia-Pacific region, the major tuna processing countries are Thailand, Philippines and Indonesia, in that order (Table 5.9). The Philippine’s volume of canned tuna exports is one third that of Thailand in 2004 and only less than one-third in 2005, but more than twice that of Indonesia.
Table 5.9. Annual canned tuna exports of Asia-Pacific countries, 2004-2005 In metric tons
Economy 2004 2005
Thailand 311,071 373,981
Philippines 108,448 100,019
Indonesia 48,347 42,462
Source: Alliance Tuna International, Inc., 2006. In the Philippines, processed tuna takes various forms, such as canned fish15, dried/smoked fish, and salted fish. Canned tuna are dominated by large firms while dried smoke/smoked, and salted tuna are products of small to medium size firms. Despite the dominance of large firms, the canned tuna industry is the focus of this study because of the existence of organized information on this sector. In addition, among the processed tuna products it is canned tuna which is most affected by the global trade liberalization. The conduct of the S-C-P analysis is, however, concentrated on the SME sector of the industry although there are only a few firms relative to the number of large canned tuna manufacturers. 5.2.1 Profile of the Philippine Canned Tuna Industry The hub of the Philippine canned tuna industry is in General Santos City in the southern part of the economy (Figure 5.8). The city is recognized as the “Tuna Capital of the Philippines” and its location is strategic as it is within access to the Western Central Pacific Ocean (WCPO) and the Western Indian Ocean. In 2004, these tuna fishing grounds accounted for nearly 40 percent and 4.91 percent, respectively, of the world tuna catch. Because of the economy’s proximity to these large fishing grounds, it is reported that buying prices for tuna range from US$50 to US$100 per metric ton lower compared to other Asian canned-tuna processing countries such as Thailand (Alliance Tuna International, Inc. 2006). Over the past decade, the development of infrastructure facilities which include the General Santos Commercial Fish Port Complex (GSCFPC), international airport, modern communication facilities, and good road network have made General Santos City competitive with Bangkok in terms of manufacturing canned tuna. Support facilities in the form of pier landings, fuel depot, cold storage, can-making facilities, label printers, product testing centers, and fabrication shops are also accessible.
15 Tuna canneries have also developed new product line such as tuna in pouch (www.alibaba.com/economy search/PH-suppliers/Tuna.html).

319
Figure 5.8. Center of tuna canneries in the Philippines There are several contributory factors to the development of the Philippine canned tuna industry. The import quota on canned fish imposed in the 1970s served as a restriction to imported canned tuna and sardines, at the same time protecting the canned fish industry. Increased tuna catch from purse seiners led to the establishment of three major tuna canneries which competed with frozen tuna exports. Fluctuating prices of frozen tuna caused by erratic demand from major markets such as the USA and Japan, boosted the growth of canned tuna exports. Large catches from American fleets reduced the demand for frozen tuna in the Philippines. Better prices for canned tuna attracted more investors and encouraged other canneries to shift to canned tuna. Tuna Canneries. By 1980, there were about 25 canneries operating in the economy. This number, however, decreased over time due to declining tuna catches, stiff competition from other processed tuna exporting countries particularly Thailand, and the difficulty in accessing new markets (Vera and Hipolito, 2006)16. At present there are 8 tuna canneries, seven in General Santos City17 and one in Zamboanga City. Their total assets and rated capacity are presented in Table 5.10. 16 These include two (2) canneries which are subsidiaries of First Dominion Prime Holdings, Inc., namely, Nautica Canning Corp., and Maranaw Canning Corp. These canneries stopped operations in 2001 and 2003, respectively, due to continuous losses and capital deficiencies. 17 With the exclusion of Miramar Fish Co., Inc., which ceased operations in 2005. In December 2003, Asia-Pacific Tuna Corp. was registered with SEC and reported as new investment by the Board of Investment for 2004 (Department of Trade and Industry, 2007). Most canneries are renting available and strategically located fish port complex facilities instead of constructing their own due to high costs. For example, Alliance Tuna Int’l, Inc. leases its facilities from Maranaw Canning Corp. when the latter company stopped its operations.
Gen Santos City
Map of the Philippines

320
Table 5.10. Selected data on Philippine canned tuna processors
Location/Company
Size of Establish-
ment
Total assets 2004, PhPM
(US$M)
Rated capacity,
2006, MTD
Rank
General Santos City General Tuna Corp.* L 1,760 (35.20) 300 1
Philippine Best Canning Corp. L 639 (12.77) 150 2
Ocean Canning Corp. L 561 (11.22) 70 6,7
Miramar Fish Company, Inc. L 314 ( 6.28) 100 4
Celebes Canning Corp. L 405 ( 8.09) 80 5
Alliance Tuna International, Inc. L 383 ( 7.65) 120 3
Seatrade Canning Corp. M 87 ( 1.75) 60 8
Asia-Pacific Tuna Canning Corp. M 54 ( 1.09) NA
Zamboanga City Permex Producer/Exporter Corp. L 420 ( 8.39) 70 6,7
* Includes Century Canning Corp. which sells canned tuna solely in the Philippines. Source: Alliance Tuna International, Inc., 2006; Board of Investment, 2004. Only two (2) of the tuna canneries, Seatrade Canning Corporation and Asia Pacific Tuna Canning Corporation, can be classified as SMEs. The reported total assets of each of the two (2) companies are less than PhP100M (<US$1.84M). Their number of permanent employees in 2004 were, 29 including 5 company officers for Asia-Pacific and 80 including 15 officers for Seatrade. The size of staff reported excludes the hundreds of contractual labor for cleaning and preparing tuna before canning. The other six (6) canneries are large scale, each of them has assets of more than PhP100M (>US$1.84M). Except for Permex Corp., whose reported total number of employees including contractuals is 1,986 with 20 of them with managerial positions, the other large canneries have permanent employees ranging from 77 to 271, the managers and officers ranging from 4 to 34. Two canneries were registered in 2003, namely, Alliance Tuna and Asia-Pacific. The oldest of these canneries is Century Canning which was registered in 1978. The others were registered in the following years, 1984 (Permex), 1990 (Celebes), 1996 (Ocean), and 2000 (Phibest)18. Tuna canneries operate year round. The supply of fresh tuna as raw material for the canneries comes from domestic sources19 and imports in the form of fresh frozen tuna.20 Skipjack and Yellowfin tuna are the main raw fish materials. Canneries buy
18 The available SEC records of Seatrade do not have a report on the company’s date of registration. 19 Grades A and B tuna are usually exported fresh frozen and part are sold to domestic high-end hotel and restaurants. Grade C is for the local market for public consumption and some are bought by canneries. 20 About 20 percent of cannery requirement (Malaya, 2006). Fish import is primarily intended for fish processors and canneries as stipulated in Section 61.c and d. of the Philippines Fisheries Code (Vera and Hipolito, 2006).

321
tuna from three sources (Personal interview at Alliance Tuna International, 2007): a) local fishermen that fish in Philippine waters;21 b) Philippine fleets that fish in international waters; and c) foreign fleets mostly Chinese Taipei and Japanese that fish in international waters. Canneries have also their own fishing fleet. For example, Seatrade Canning Corporation has seven (7) sets of fishing fleets which supply 55 percent of their raw tuna requirement and 45 percent are sourced from local fishermen (Personal interview at Seatrade Canning Corporation, 2007). According to the prospectus of one of the large tuna canneries, tuna processors in the Philippines produce two (2) can sizes: the retail pack and the institutional pack sizes. Three (3) canneries pack tuna in pouches, and another cannery produces canned tuna for pet food. The scraps or by-products of these canneries are converted into fishmeal and sold to local and foreign feed millers. About 90 percent of the canneries production are destined for the international market and the remaining 10 percent go to the domestic market. In the domestic market, General Tuna Corporation, manufacturer of the Philippine popular brand Century tuna, accounts for about 85 to 90 percent of the domestic market. Cannery Employment. In addition to the individual company records of permanent employees discussed above, it was reported that the entire tuna canning industry in the Philippines which is located in Mindanao supports about 150,000 people directly and indirectly, from fishing to canning (Department of Foreign Affairs, 2005). In General Santos City alone, an estimated 8,000 persons are employed by the tuna canning industry. Most of these are contract workers hired through employee cooperatives. Renewal of contract are based on worker performance and the labour requirement of the canning corporations. These workers are usually high school graduates between the ages 26-30 and mostly are migrants from the southern part of the economy. Since they are paid by the volume of production, these workers earn more than the minimum wage. They are also given government benefits such as health insurance and social security benefits. They get overtime pay for extra hours rendered. Workers in the production line where tuna is cleaned and loined are mostly women and work requires them to stand for 12 hours.22 Despite the high remuneration, there is a high turnover rate due to resignations especially those who cannot endure the long hours of standing. Most of those who resign are younger women who have the opportunity to find other jobs in the city. It was reported that married and older ones stay for lack of other work options (Vera and Hipolito, 2006). Concerns of the Industry. From the literature and personal interviews, the three major issues and concerns of the stakeholders of the canned tuna industry revolve around high prices of raw materials, better market access, and competition. While both large establishments and SMEs in canned tuna face the same issues and concerns, the latter are less equipped because of their size.
21 Canneries in General Santos City buy part of their raw tuna requiremens from the GSFPC where purse seiners land their catch. About 20 to 30 percent of tuna catch are unloaded at GSFPC. Tuna catch are also unloaded in private and other commercial ports. The flow of tuna is from the fishermen to traders/cooperatives to canneries (Personal interview at Seatrade Canning Corporation, 2007). 22 This was observed during a visit to tuna canneries in General Santos City. The CEO of a cannery has informed that the workers are more productive if they stand in the production line since they feel sleepy when they sit down.

322
High prices of raw materials. Tuna catch using purse seine declined and this has triggered the increase in the price of cannery-grade tuna. Tuna prices fetch US$980/mt from just $750/mt that tuna canners resort to imports (about 20 percent) to meet cannery requirements. The expanded valued added tax (VAT) have likewise increased the cost of canning material such as tin. Higher bunker fuel makes the cost of landed raw fish higher. The prices of canned tuna in the international market have not kept pace with the rate of increase of raw tuna material. While the canneries are meeting their export obligations, they are unable to adjust selling prices of canned tuna despite the increase in raw material costs (Vera and Hipolito, 2006; PIA Daily News Reader, July 2007). 5.2.2 Effects of Trade Liberalization Of the three concerns of the economy’s tuna industry, market access and competition have direct bearing from the ongoing trade liberalization. Market Access. The economy’s tuna canners have to contend against the tariffs and non-tariff barriers from the major markets of the US and EU. One of the crippling tariff barriers to international trade of canned tuna that confronted the Philippines, Thailand and Indonesia was the 24 percent tariff in the EU. The Philippines viewed the earlier 24 MFN percent tariff as inconsistent with free and fair trade. While canned tuna coming from the African Caribbean Pacific (ACP) countries were allowed to enter with zero (0) tariff as a way of helping these economies. Due to successful lobbying by Thailand and the Philippines to the GATT-WTO, the EU opened a 5-year annual quota of 25,000 MT at a reduced in-quota tariff of 12 percent ad valorem from 24 percent, which was shared by four countries (Nilaratna Xuto, 2004):23 Thailand (52% or 13,000 MT; Philippines (36% or 9,000 MT; Indonesia, (11% or 2,750 MT) and other third countries (1% or 250MT). The quota is expiring in December 2007 and there is now a move to negotiate for a single digit tariff to all volume (Personal interview at Alliance Tuna International, 2007). Thailand, Philippines and Indonesia have also lobbied for unlimited quotas at the reduced tariff of 12 percent (Alliance Tuna International, 2006). The Philippine canned tuna quota at 12 percent tariff was divided among the economy’s canneries which are all members of the Tuna Canners Association of the Philippines (TCAP). Despite being a minority in the whole tuna canning industry, the interests of the SME sector are protected by being member of this association. Among the other significant progress for the local tuna industry were the expressed willingness by the US to lower tariff on Philippine tuna shipments as part of its contribution to the peace process in Mindanao in line with the wider campaign against global terrorism and world peace. Shipments under quota for the USA are subject to a 6 percent tariff while out-quota shipments are imposed with 12.5 percent tax (www.eurofish.dk/index Sub.php.). The Philippines now enjoy a tariff parity for its
23 The tariff quota was officially adopted on June 5, 2003 based on EU Council Resolution No. 975/2003. , “Opening and Providing for the Administration of a Tariff Quota for Imports of Canned Tuna” (Department of Foreign Affairs, 2005). The Philippine share of the quota was evenly distributed among tuna canneries and a Canned Tuna Monitoring Unit was created and maintained by the Bureau of Export and Trade Promotion for a more systematic administration of the quota allocation (Ho, 2004).

323
canned tuna exports to the US with Andean-member countries, as well as the possible inclusion of tuna in the General System of Preference list of products for exports to the US (Mindanao Economic Development Council, n.d.). With the non-tariff barriers, the Philippine canned tuna industry is confronted with the imposition of more stringent SPS standards. Several specific cases can be cited. The zero-tolerance policy of examination and accreditation by the US and EU require additional capital which is very costly to canneries. The EU and Japanese ban on the Philippine smoked tuna was supposedly triggered when substances like dioxin and furan, believed to be carcinogenic, were found in the products from other countries. The ban continued despite declaration from the US Food and Drug Administration that smoked tuna do not pause any threat to health, and are thus allowed entry into the US. This ban triggered a drop in prices and resulted in the reduction of the market share of the Philippines and earnings of canneries (Vera and Hipolito, 2006). Sit was reported that some of the EU’s standards on food safety are even higher than the standards under the Codex Alimentarius, making it harder for developing countries to comply with (Avila, 2005). The EU rejected shipments of canned tuna due to detection of new contaminants such as BADGE and BFDG. Another case involved the raising of threshold level of lead in fish products from 0.40 mg./kg. wet weight or 0.40 ppm to 0.20 ppm.24 The ASEAN countries including the Philippines, have proposed a standard of 0.50 ppm to the Codex Committee on Food Additives and Contaminants (CCFAC). One of the arguments made was the results of the 53rd risk assessment study conducted by the Joint FAO/WHO Committee on Food Additives, which showed that a maximum level of 0.50 ppm lead in tuna provides the same level of health protection as 0.20 ppm. With the higher threshold, existing laboratory equipment of the Philippines’ Bureau of Fisheries and Aquatic Resources (BFAR), accordingly, could no longer detect the lead at this level. Although the agency conducts tests to all export products to ensure that stocks for shipment are within standards through Hazard Analysis Critical Control Permit (HACCP). Competition, Branding. In its bid to expand the market for canned tuna in the US, the Philippines is faced with stiff competition with the established brand name of canned tuna from Thailand, “Chicken of the Sea”, which is widely distributed in the US in retail sized cans. Philippine canneries are also cautious of Thailand’s move to seek bilateral free trade with the US (Bilaterals.org. March 21, 2007). The other competition comes from pouched tuna exported duty-free to the US by the Andean countries. The Philippines exports large sized institutional cans which compete with the cheaper large size pouched tuna25 (foodproductiondaily.com/news/ng.asp?id). 24 In comparison, the US still allow fishes with lead level content between 0.3 to 0.5 ppm. 25 Some domestic canneries have already ventured into pouch tuna in small retail size. One major producer just started a new line of canned tuna products packed in small plastic cups with an easy-to-peel foil top. The package is similar to that used for pudding (www.eurofish.dk/index_Sub.php)

324
The tariff and non-tariff barriers constrain the expansion of the economy’s share of canned tuna export market. Nevertheless, the trade liberalization process has a mechanism for airing the views and concerns of aggrieved countries. This was proven by the successful lobbying against the EU’s 24 percent tariff on canned tuna and the tariff parity with the Andean countries in the US. On the other hand, competition is a vehicle for product innovation and in improving company operations towards maintaining or expanding the market share. This was exemplified by the domestic canners move to venture into small pouch tuna in answer to external consumers. Export Performance. Processed tuna captures the economy’s total tuna exports over fresh tuna (Figure 5.9). As Figure 12 shows, processed tuna exports serve as indicator of the trend of the whole tuna trade. Except for a slump from 1999 to 2002, annual export earnings were over US$100 million (Appendix 8). The slump was attributed to the 24 percent tariff imposed by EU which is the largest market. Despite the tariff reduction to 12 percent, annual share of processed tuna to total value of tuna exports slowed to about two thirds in the post-liberalization (WTO) compared with the pre-liberalization period, 77 percent in 1985 and 80-90 percent from 1990 to 1994. Canned tuna dominates processed tuna exports. Except during the slump period, annual share of value of canned tuna export to total value of processed tuna exports was 100 percent during the pre- and post liberalizaton periods (Figure 5.10). A small portion of processed tuna exports comprised dried and smoked tuna.
Figure 5.9. Value of total tuna exports, processed and fresh, Philippines 1985, 1990-2005
Source: Philippine Foreign Trade Statistics, NSO, various years.
-
20.00
40.00
60.00
80.00
100.00
120.00
140.00
160.00
180.00
200.00
1985 1990 1991 1992 1993 1994 1995 1996 1997 1998 1999 2000 2001 2002 2003 2004 2005
Processed Tuna Fresh Tuna Total Tuna

325
100.0 100.0 100.0 100.0 100.0 100.0 100.0 100.0 100.0 100.0
99.6
98.6
98.9
99.6
99.9 99.9 100.0
97.5
98.0
98.5
99.0
99.5
100.0
100.5
1985 1990 1991 1992 1993 1994 1995 1996 1997 1998 1999 2000 2001 2002 2003 2004 2005
Figure 5.10. Percent share of canned tuna to total value of processed tuna exports,
Philippines, 1985, 1990-2005 Source: Philippine Foreign Trade Statistics, NSO, various years.
Export Markets. The two largest markets for canned tuna are the US and the EU. The US is the largest single market and it is a mature market. While the EU as a common market, is a larger and growing, accounting for 34 percent of total global consumption because of the additional 10 countries joining EU in May 2004 (Fajardo, 2002; Personal interview at Alliance Tuna International, 2007). The principal markets in EU are Spain, Italy, France, Germany and UK. Only Spain and Italy rely on their domestic production for most of their requirements vis-à-vis imports due to their strong local brands and high quality recipes on Yellowfin olive oil. The pattern of US and EU shares to the value of Philippine tuna canned exports are depicted in Table 5.11. In mid-1985, the US share was about 56 percent. Five year intervals from 1990 to 2005 showed that its share was reduced between 21 to 28 percent due to the higher intake of EU countries such as Germany and UK, other traditional market such as Canada and new markets such as Japan, Singapore and Chinese Taipei. While Philippines canned tuna exports were increasing, its market has diversified.

326
Table 5.11. Major markets of canned tuna exports, Philippines, 1985, 1990, 1995, 2000, 2005
1985 1990 1995 2000 2005
Economy Share Economy Share Economy Share Economy Share Economy ShareRank % % % % %
Total 100 Total 100 Total 100 Total 100 Total 100
1 USA 55.8 Germany 27.0 USA 27.6 USA 25.4 USA 20.5 2 Germany 15.2 USA 23.0 Canada 14.7 Singapore 23.3 Germany 16.5 3 Canada 12.7 U.K. 13.4 Germany 14.5 Canada 9.9 Canada 10.1
4 U.K. 10.7 Canada 11.6 U.K. 12.4 Japan 6.8 Chinese Taipei 7.3
5 Others 5.6 Others 25.0Others 30.8 Others 34.7 Others 45.7 Source: Philippine Foreign Trade Statistics, NSO, various years.
The Philippines is next to Thailand as the major supplier of processed or canned tuna to the US market. Other canned tuna producing countries including the Philippines are also increasing their market shares (Table 5.12). The Philippines is the top supplier of canned tuna to Germany and it produces canned tuna for the catering sector (Table 13). Among the tuna canneries in the Philippines, General Tuna Corporation is the largest exporter to the EU. All of the canned tuna products of Seatrade Canning Corporation and 75 percent of the output of Alliance Tuna International are shipped to the EU. Philippine Best Canning Corporation (Philbest), on the other hand, is the largest exporter to the US (Malaya, 2006).
Table 5.12. US imports of canned tuna, 1998-2005
Total Thailand Philippines Ecuador Indonesia Others Year
In ‘000 metric tons 1998 109.0 51.8 38.9 0.7 12.6 5.0
1999 151.7 86.3 38.6 1.9 17.4 7.5
2000 142.0 79.9 35.3 2.4 13.4 11.0
2001 132.5 64.0 28.2 14.6 15.2 10.5
2002 152.9 68.5 34.2 23.6 14.2 12.4
2003 167.5 79.9 38.4 23.4 16.9 8.9
2004 168.8 71.8 43.3 24.7 17.0 12.0
2005 169.0 77.4 43.8 15.5 18.0 14.3
Source: Globefish, 2006.

327
Table 5.13. Germany’s imports of canned tuna, 2001-2005
Total Philip- pines
Ecuador Thai-land
PNG Indo- nesia
Sey- chelles
France Others
Year In ‘000 metric tons
2001 68.5 20.5 2.2 5.1 2.0 1.3 6.9 9.2 21.3
2002 85.7 28.5 4.1 9.3 1.3 2.1 8.2 16.8 11.5
2003 91.7 29.4 4.8 9.6 6.9 2.7 10.6 13.7 12.2
2004 81.2 19.1 13.7 5.6 9.2 3.5 5.4 7.3 15.9
2005 83.8 20.3 14.6 11.5 21.3 7.0 6.6 5.7 8.5
Source: Globefish, 2007. Processed tuna imports. The Philippines also imports canned and dried smoked tuna, the latter in minimal volume and only in a few years. For canned tuna, imports were below 50 tons and below US$50 thousand prior to the WTO period. It reached the 100 tons level in 1994, 1996 and doubled in 2001 and 2002 (Appendix 9). 5.2.3 Market Performance Analysis The S-C-P analysis was undertaken for eight (9) tuna canneries, two SMEs and the rest are large scale. The financial data were also sourced from the SEC. One of the canneries, Seatrade, was classified as a large corporation based on total assets of more than PhP100M (>US$1.84) from 1995 to 1999. However, since 2000 the company’s annual total assets decreased ranging from PhP82M-PhP93M (US$1.64-US$1.86M) classifying it as medium-scale establishment. Market Structure.26 The 2-, 3- and 4-firm concentration ratios (CR2, CR3, CR4) were higher with lesser number of canneries and vice-versa. The size of cannery is directly related to the market share, the shares of the 2, 3 or 4 largest canneries are reduced with more canneries during the 2001-2005 period. The lowest shares were observed in 2004, indicating relatively equitable market shares (Figure 5.11). This pattern is confirmed by the HHI Index of 1,442 (Figure 5.12). The Gini ratio of 0.288 and Lorenz Curve (Figure 5.13) for 2004 also show a more equitable market share.
26 The annual concentration ratio (CR) of the canneries depended on the availability of records. Only three (3) and five (5) firms have available records in 1997 and from 1998 to 2000, respectively. CR2 is computed for the 3 canneries and CR2 and CR3 for the 5 canneries. Records were available for 7 canneries from 2001 to 2003; 9 canneries in 2004 and 8 canneries in 2005. For the latter set of canneries, CR2, CR3 and CR4 were computed.

328
Figure 5.11 . Concentration ratios of tuna canneries, Philippines, 1997-2005 Number of canneries: 1997(3), 1998(5), 1999(5), 2000(5), 2001(7), 2002(7), 2003(7), 2004(9), 2005(8)
4,224
2,526 2,424 2,326
1,714 1,6451,911
1,4421,760
-500
1,000
1,5002,0002,5003,0003,500
4,0004,5005,000
1997 1998 1999 2000 2001 2002 2003 2004 2005
Figure 5.12. Herfindahl-Hirschman Index, tuna canneries, Philippines, 1997-2005
Figure 5.13. Lorenz curve for tuna canneries , Philippines, 2004
0
20
40
60
80
100
1 2 3 4 5 6 7 8 9 10
Cumulative % of Tuna Canning/Processing Firms
Cum
ulative % of M
arke
t Sha
re
35
45
55
65
75
85
95
1997 1998 1999 2000 2001 2002 2003 2004 2005
CR2 CR3 CR4

329
Market Conduct Advertising-sales ratio ranged from 0.003-79.19 percent (Table, 5.14). The higher bound ratio refers to the newly registered SME cannery in 2004 which invested heavily on advertising to gain market share of canned tuna. Meanwhile, the lower bound ratio refers to one of the large canneries which was registered way back in 1984. One of the large canneries which mainly sells in the domestic market and whose brand is the most popular in the economy, continuously invested in advertising. Its ad-sales ratios ranged from 1.53 in 1998 to 29.82 in 2003. The two canneries with the largest annual sales did not report any advertising cost for all the period where they have their financial records available. Generally, sales of canneries started to pick-up following the reduction of the EU tariff imposed on Philippine canned tuna from 24 to 12 percent (Appendix 10).
Table 5.14. Advertising-sales ratio of tuna canneries, Philippines, 1997-2005
* No advertising expense reported. ** No record for the year.
Market Performance. Generally, size of canneries contribute to their market performance. One large company had the highest ROA of about 71 percent in 2005; another with an ROE of about 232 percent in 2001, and another with the highest ROS of 23 percent in 2003 (Table 5.15). Although some large canneries also reported losses (Appendix 11). The newly established SME cannery in 2004 incurred losses in its 1st and 2nd year of operations. The newly established large cannery, however, performed well in the 1st and 2nd year. The other SME cannery have positive ROA, ROE and ROS. Formerly a large cannery, it opted to operate moderately as the canned tuna export market has become very competitive due to trade liberalization.
Company No. 1997 1998 1999 2000 2001 2002 2003 2004 2005
SME 1 79.186 19.2012 0.004 0.005 0.004 0.010 0.008 0.011
Large 2 0.032 0.004 0.0063 ** 0.057 0.172 0.036 0.028 0.003 0.003 0.064 *4 * *5 * * * * * * * * 0.0316 ** ** ** ** * * 0.089 0.175 0.5647 3.454 1.532 2.397 2.212 2.633 2.964 29.826 8.654 **8 ** * * * * * * * *9 ** ** ** ** * * * * *
not yet established
not yet established
In Percent

330
Table 5.15. Market performance measures of tuna canneries, Philippines, 1997-2005
* Incomplete records for the year. ** No record for the year.
Company No. 1997 1998 1999 2000 2001 2002 2003 2004 2005
SME 1 11.35 (23.45)2 0.50 2.96 4.32 3.22 3.74 1.07
Large 2 0.61 1.11 2.293 ** 0.22 0.57 0.08 0.68 0.84 1.24 0.75 0.314 14.98 11.645 (14.45) 8.44 (18.24) 9.57 28.32 13.76 2.01 2.55 1.156 ** ** ** ** 0.03 1.78 (7.16) 16.54 71.497 0.65 3.78 0.75 0.82 0.92 1.35 1.40 1.95 **8 ** 1.09 0.58 1.22 2.02 0.87 1.07 0.47 0.109 ** ** ** ** 10.63 (2.01) 12.11 11.27 0.07
SME 1 (366.14) (1088.69)2 1.32 6.45 8.41 6.33 7.39 2.03
Large 2 2.84 3.60 7.603 ** 57.36 44.55 49.18 17.93 4.99 7.68 6.60 5.364 24.04 16.365 152.37 19.05 (632.00) (39.79) 232.89 27.52 8.93 (18.65) (9.27)6 ** ** ** ** 1.70 11.93 (14.32) (101.88) (148.17)7 13.86 19.32 12.78 9.43 2.23 3.00 2.84 3.98 **8 ** 3.87 2.20 3.41 7.73 30.42 39.25 48.38 55.549 ** ** ** ** 51.58 (19.46) 38.94 16.28 (0.14)
SME 1 (128.27) (11.51)2 0.15 0.58 0.64 0.59 0.44 0.20
Large 2 0.14 0.16 0.643 ** 4.99 6.92 9.78 4.97 1.01 0.90 0.86 0.664 6.24 4.295 8.13 1.92 (3.14) 5.36 14.14 2.91 1.02 (2.04) (1.02)6 ** ** ** ** 1.07 0.75 (0.87) 4.15 14.177 6.05 7.42 8.48 8.31 1.98 2.37 23.00 2.30 **8 ** 0.24 0.14 0.28 0.47 1.76 2.28 2.27 2.639 ** ** ** ** 2.33 (1.01) 3.44 2.54 (0.02)
In Percent
not yet established
not yet established
not yet established
Rate of Return on Assets after tax (ROA)
not yet established
Rate of Return on Sales after tax (ROS)
not yet established
not yet establishedRate of Return on Equity after tax (ROE)

331
5.3 PROCESSED SEAWEED/CARAGEENAN 5.3.1 Industry Profile Background. There are three products produced from seaweed of the eucheuma variety, namely, raw dried seaweed, alkai treated chips, and carageenan. The raw dried seaweed is processed into carageenan, a yellowish or tan to white, coarse to fine powder. It is a food and non-food or industrial additive in many meat, dairy, bakery, pharmacological and industrial products (Table 5.16). The food use accounts for nearly 70 percent of the world market demand for carageenan. Of the two types of carageenan, cottonii and spinosa, the latter has a wider range of use. The Philippines leads the other major producers of carageenan in the world, accounting for about one-third of the world total while Indonesia produces about one-fifth (Table 5.17).
Table 5.16. Types of carageenan and their applications
Type of carageenan Applications
Eucheuma Cottonii - Kappa Dairy products, meat and poultry products, water gels, processed human food/fat foods, pharma- ceutical, personal care
Eucheuma Spinosa - Iota Toothpaste, other dairy products, pharmaceutical
Source: Seaweed Industry Association of the Philippines (SIAP).
Table 5.17. Countries producinge eucheuma seaweed and by type of carageenan extracted
Economy/type of carageenan extracted Percent share
Philippines 72.0 Cottonii 97.7 Spinosum 2.3 Indonesia 22.0 Cottonii 92.3 Spinosum 7.7 Malaysia 2.7 Cottonii 100.0 Zanzibar 3.3 Cottonii 23.0 Spinosum 77.0
Source: Seaweed Industry Association of the Philippines (SIAP).

332
The emergence of seaweed processing as an industry in the economy dates back to 1966 with an initial production of 800 metric tons.27 The industry is organized into a Seaweed Industry Association of the Philippines (SIAP). As a result of extensive research and development, by 1980 the Philippines have started offering a wide product range from seaweeds of the eucheuma variety, from raw dried seaweed to semi-refined food grade carageenan or Philippine Natural Grade (PNG)28, highly-refined or conventionally purified (CP) carageenan. A semi-refined carageenan as pet food was also included in the product line. The economy is both the top producer of raw dried seaweed and PNG, the number two producer for semi-refined carageenan for pet food and ranked fourth in refined carageenan (SIAP, n.d.). Domestic Market Structure. The farmers of raw seaweed for carageenan may also double as collector or assembler for the processor (Figure 5.14). The farmers sell fresh or dried seaweeds either to village traders or small traders. From the village traders, the commodity goes to large traders and or buying stations who are mainly agents of processors. Small traders act either as middlemen or small-scale assembler or wholesaler, sells to large traders, buying stations or directly to exporters.
Figure 5.14. Marketing channels of seaweeds, Philippines Source: Pido, M., et al. 2003.
27 Marine Colloid Philippines initiated commercial eucheuma farming which led to the establishment of firms specialzing in the manufacture of carageenan from seaweed of the eucheuma variety. After two decades, Shemberg Marketing Corporation established the first full-scale carageenan refinery in the Philippines . In 1986, the company was already exporting to Western Europe, Japan and Australia (Department of Trade and Industry – Cebu Provincial Office, 2005). 28 In the early 1990s, the Philippine seaweed industry faced the possible ban of PNG in the US on its safety for human consumption. The US based International Food Additives Council (IFAC) and the French-based Marinalg lobbied against the entry of high fibrous carageenan. The US Food and Drug Administration, however, made two pronouncements in mid 1990 and 1991 in favor of PNG. Moreover, the Codex Alimentarius Commission (CAC) approved an International Numbering System (INS) – E407a- for Philippine natural grade (PNG) on July 1995, classifying carageenan in its food additive list. The Joint Expert on Food Additives and Contaminants assigned to PNG a temporary allowable daily intake (ADI) of 0-20 mg/kg of body weight (Department of Trade and Industry – Cebu Provincial Office, 2005).
Small Traders/Viajeros
Exporters
Farmers
Barangay Traders
Big Traders/ Buying
Processors
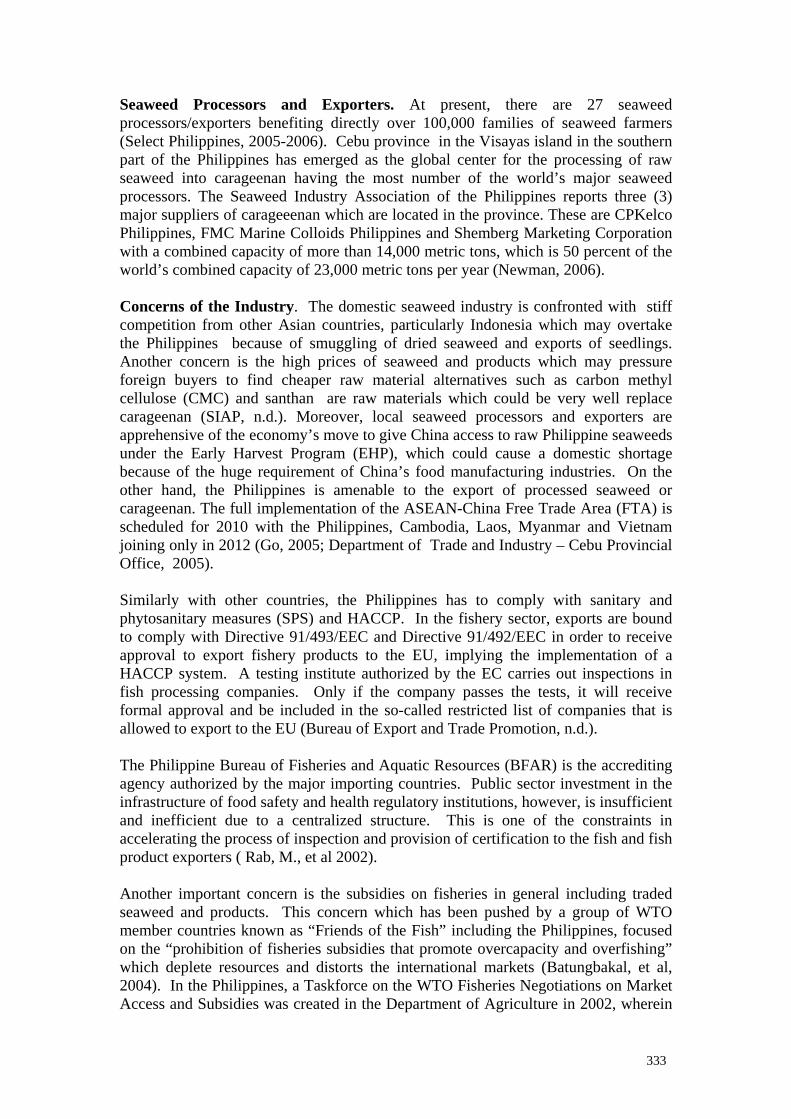
333
Seaweed Processors and Exporters. At present, there are 27 seaweed processors/exporters benefiting directly over 100,000 families of seaweed farmers (Select Philippines, 2005-2006). Cebu province in the Visayas island in the southern part of the Philippines has emerged as the global center for the processing of raw seaweed into carageenan having the most number of the world’s major seaweed processors. The Seaweed Industry Association of the Philippines reports three (3) major suppliers of carageeenan which are located in the province. These are CPKelco Philippines, FMC Marine Colloids Philippines and Shemberg Marketing Corporation with a combined capacity of more than 14,000 metric tons, which is 50 percent of the world’s combined capacity of 23,000 metric tons per year (Newman, 2006). Concerns of the Industry. The domestic seaweed industry is confronted with stiff competition from other Asian countries, particularly Indonesia which may overtake the Philippines because of smuggling of dried seaweed and exports of seedlings. Another concern is the high prices of seaweed and products which may pressure foreign buyers to find cheaper raw material alternatives such as carbon methyl cellulose (CMC) and santhan are raw materials which could be very well replace carageenan (SIAP, n.d.). Moreover, local seaweed processors and exporters are apprehensive of the economy’s move to give China access to raw Philippine seaweeds under the Early Harvest Program (EHP), which could cause a domestic shortage because of the huge requirement of China’s food manufacturing industries. On the other hand, the Philippines is amenable to the export of processed seaweed or carageenan. The full implementation of the ASEAN-China Free Trade Area (FTA) is scheduled for 2010 with the Philippines, Cambodia, Laos, Myanmar and Vietnam joining only in 2012 (Go, 2005; Department of Trade and Industry – Cebu Provincial Office, 2005). Similarly with other countries, the Philippines has to comply with sanitary and phytosanitary measures (SPS) and HACCP. In the fishery sector, exports are bound to comply with Directive 91/493/EEC and Directive 91/492/EEC in order to receive approval to export fishery products to the EU, implying the implementation of a HACCP system. A testing institute authorized by the EC carries out inspections in fish processing companies. Only if the company passes the tests, it will receive formal approval and be included in the so-called restricted list of companies that is allowed to export to the EU (Bureau of Export and Trade Promotion, n.d.). The Philippine Bureau of Fisheries and Aquatic Resources (BFAR) is the accrediting agency authorized by the major importing countries. Public sector investment in the infrastructure of food safety and health regulatory institutions, however, is insufficient and inefficient due to a centralized structure. This is one of the constraints in accelerating the process of inspection and provision of certification to the fish and fish product exporters ( Rab, M., et al 2002). Another important concern is the subsidies on fisheries in general including traded seaweed and products. This concern which has been pushed by a group of WTO member countries known as “Friends of the Fish” including the Philippines, focused on the “prohibition of fisheries subsidies that promote overcapacity and overfishing” which deplete resources and distorts the international markets (Batungbakal, et al, 2004). In the Philippines, a Taskforce on the WTO Fisheries Negotiations on Market Access and Subsidies was created in the Department of Agriculture in 2002, wherein

334
different fisheries and aquaculture stakeholders espoused for the reduction and elimination of trade distorting subsidies with a provision on special and differential treatment for developing countries. There was concern, however, if this differential treatment should be extended to high income developing countries such as Korea, Thailand, China and Chinese Taipei since these countries are heavily subsidized and some are exporting fish to the Philippines. The group considered that while non-distorting subsidies shall be allowed, there should be caps on income-related outlays so that excessive use of such measure will be avoided. 5.3.2 Effects of Trade Liberalization Export Performance. In the mid-1980s the economy was already exporting carageenan in Western Europe, Japan and Australia. The economy shipped out in 1985 about 24 thousand tons at about US$20 million and 35 thousand tons at US$50 million in 1990 (Appendix 13). In 1991 to 1993, exports were minimal when issues were raised on the safety of Philippine carageenan for human consumption. The US-based International Food Additives Council (IFAC) and the French-based Marinalg lobbied against the entry of Philippine natural grade carageenan (PNG) into their markets. As the issue was resolved by the Codex Alimentarius Commission in favor of PNG, the carageenan exports recovered although at lower volumes but higher prices. Dried seaweed export also gained its ground. When carageenan exports weakened, fresh seaweed was exported and has since outpaced the combined exports of dried seaweed and carageenan. The Philippines enjoys the GSP privilege of zero (0) tariff for seaweed exports to Japan and EU countries (Rab, 2002). As a result, exports have gone up significantly from the pre- to the post-liberalization period (Figure 5.15). The share of dried seaweed and carageenan to total value of seaweed export had been minimal at less than one percent beginning 1991 (Figure 5.16). Fresh seaweed captured the largest share. Figure 5.15. Value of seaweeds/carageenan exports, Philippines, 1985, 1990-2005 Source: NSO, various years. Foreign Trade Statistics of the Philippines.
-
10,000
20,000
30,000
40,000
50,000
60,000
70,000
80,000
90,000
100,000
1985 1990 1991 1992 1993 1994 1995 1996 1997 1998 1999 2000 2001 2002 2003 2004 2005
FOB
Val
ue ('
000
US$
)
Total Seaweeds/Carageenan Processed Seaweeds/Carageenan Fresh

335
Figure 5.16. Percent share of processed seaweed/carageenan to total value of seaweed exports, Philippines, 1985, 1990-2005 Source: Philippine Foreign Trade Statistics, NSO, various years. Export Markets. Japan and the EU countries are the traditional export markets of processed seaweed and carageenan. The market became diversified with other major markets, namely, US since 1995, Russia and Australia in 2005 (Table 5.18).
Table 5.18. Major markets of processed seaweed and carageenan, Philippines, 1985, 1990, 1995, 2000, 2005
Source: Philippine Foreign Trade Statistics, NSO, various years. Imports. As a result of market globalization, seaweed imports also increased simultaneously as exports increased (Figure 5.17). Trade data show that prior to the WTO period, in 1985 imports were very minimal at less than one metric ton. In 1990, exports reached 3.3 metric tons mainly processed seaweed products (Appendix 14). Increased imports at that time may have resulted from the overharvest of seaweeds in the economy that depleted supply. There was no record of imports of processed seaweed in 1992, only imports of fresh seaweed. In the post-liberalization period, starting in 1997 imports were more than 100 metric tons for processed seaweeds and more than 1,000 metric tons for fresh seaweed. In 2005, imports of processed seaweed products was 679 metric tons valued at US$6.55 million.
100.00 100.00
0.05 0.09 0.57 0.33 0.09 0.25 0.80 0.81 0.06 0.17 0.25 0.28 0.520.00
20.00
40.00
60.00
80.00
100.00
120.00
1985 1990 1991 1992 1993 1994 1995 1996 1997 1998 1999 2000 2001 2002 2003 2004 2005
Country Share Country Share Country Share Country Share Country Share% % % % %
Total 100.0 Total 100.0 Total 100.0 Total 100.0 Total 100.0
1 UK 27.7 UK 23.1 USA 19.8 Denmark 23.9 Russia 12.1 2 Denmark 27.2 Denmark 15.4 UK 17.6 France 15.3 France 12.0 3 Japan 9.2 France 11.7 France 10.6 UK 14.7 USA 8.6 4 France 8.8 Japan 11.2 Germany 9.6 USA 10.7 Australia 8.5 5 Others 27.1 Others 38.6 Others 42.3 Others 35.4 Others 58.8
2005Rank
1985 1990 1995 2000

336
Figure 5.17. Imports of seaweeds, Philippines,1985, 1990-2005 Source: Philippine Foreign Trade Statistics, NSO, various years.
5.3.3 Market Performance Analysis Records of a sample of five (5) corporations or firms engaged in the manufacturing and exporting of processed seaweed were sourced from the SEC. Of these corporations, three (3) were classified as SME and two (2) as large-scale. One of the SME operated on a large scale until 2000. Two of the firms were registered at SEC in 1996. Market Structure. The details of relevant statistics defining the market structure of the 5 firms are given in Appendix 15. Due to the data availability constraint, the concentration ratio was computed for CR1 from 1997-2005 and CR2 from 1999-2005. CR3 was included in 2005 since all of the 5 firms have available records in that year. As the concentration ratios show, the market for the 5 firms were highly concentrated (Figure 5.18). The large firms control the market for processed seaweed and carageenan. The market share of the two large firms comprised more than two-thirds of the total market. The three firms (2 large and one medium size) dominated the market with as high as 92 percent share. In 2005, the 3 firm concentration ratio was 95.4 percent, leaving less than 5 percent to the rest of the SMEs. The highly concentrated market is also indicated by the high Herfindahl Hirschman Index (Figure 5.19), the index decreases as there were more firms in the market. The degree of inequality of the market shares is also manifested by the Gini coefficients shown in Appendix 15 and the Lorenz Curve for the 5 firms in 2005 (Figure 5.20).
-
2,000.00
4,000.00
6,000.00
8,000.00
10,000.00
12,000.00
14,000.00
16,000.00
1985
1990
1991
1992
1993
1994
1995
1996
1997
1998
1999
2000
2001
2002
2003
2004
2005
CIF
Val
ue ('
000
US$
)
Total Seaweeds/Carageenan Processed Seaweeds/Carageenan Fresh
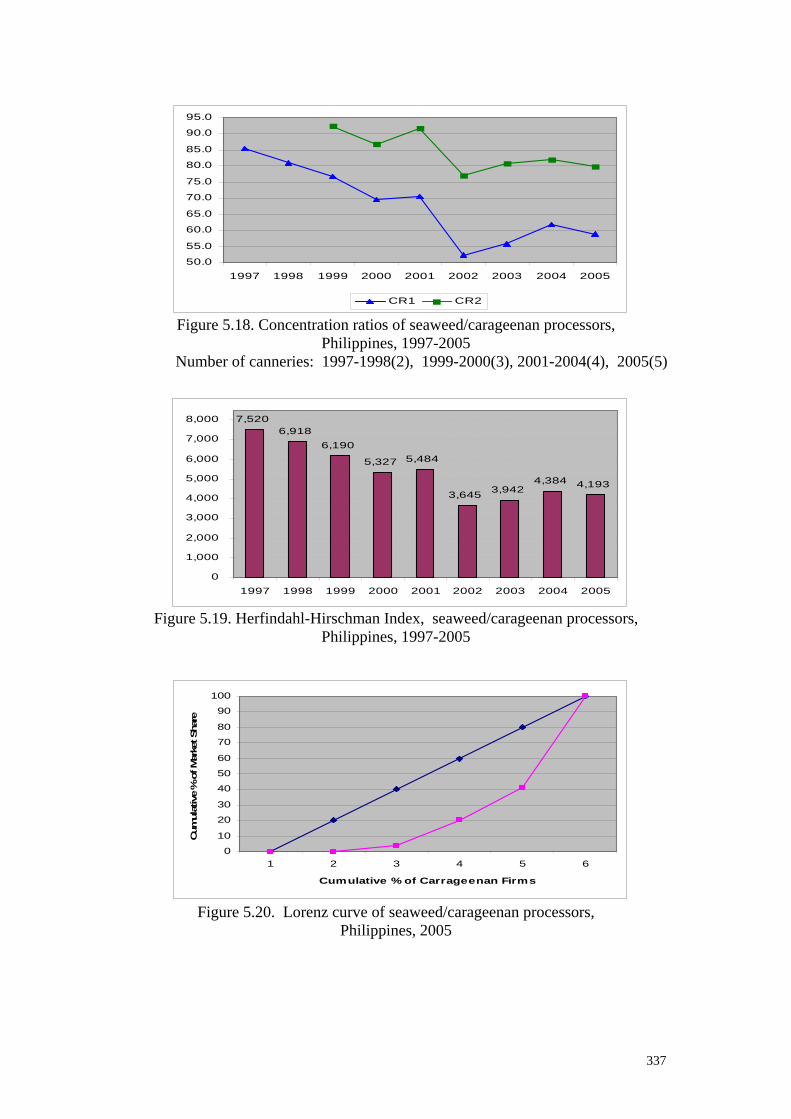
337
Figure 5.18. Concentration ratios of seaweed/carageenan processors, Philippines, 1997-2005
Number of canneries: 1997-1998(2), 1999-2000(3), 2001-2004(4), 2005(5)
Figure 5.19. Herfindahl-Hirschman Index, seaweed/carageenan processors, Philippines, 1997-2005
Figure 5.20. Lorenz curve of seaweed/carageenan processors, Philippines, 2005
50.0
55.0
60.0
65.0
70.0
75.0
80.0
85.0
90.0
95.0
1997 1998 1999 2000 2001 2002 2003 2004 2005
CR1 CR2
7,5206,918
6,190
5,327 5,484
3,645 3,9424,384 4,193
0
1,000
2,000
3,000
4,000
5,000
6,000
7,000
8,000
1997 1998 1999 2000 2001 2002 2003 2004 2005
0
10
20
30
40
50
60
70
80
90
100
1 2 3 4 5 6
Cumulative % of Carrageenan Firms
Cum
ulat
ive
% o
f Mar
ket S
hare

338
Market Conduct. Based on available records, only one of the 5 corporations, the second largest, spent for advertising in 2002, 2003 and 2005 (Appendix 16). Its advertising–sales ratio, however, were less than one percent (Table 5.19 ).
Table 5.19. Advertising-sales ratio of seaweed/carageenan processors, Philippines, 1997-2005
* No advertising expense reported. ** No record for the year.
Market Performance. The two large corporations reported positive profits, while the SMEs incurred losses in some years. The largest firm had negative annual rate of return on asset (ROA) of about more than one percent in 1997 and 1998 because the deferred tax and interest payments exceeded its profits in those years. The financial records implied that these were written off from the corporate assets (Appendix 17). Considering the positive ROAs, those of the two large corporations ranged from 0.90-7.55 percent while those of SMEs ranged from 0.06-9.37 percent (Table 41). In more recent years, the large corporations had positive ROAs while the SMEs had negative ROAs because of the losses they incurred. The negative profits reported by some of the SMEs in some years also resulted in negative rate of return on equity (ROE) as shown in Table 40. The deferred tax and interest payments have also been written off from their equities as the financial records would suggest (Appendix 17). The largest corporation had positive ROE from 1997 to 2005, while the second largest had negative ROE in 2002, 2003 and 2005. One SME had a very high ROE of almost 702 percent in 2001 because of its high profit (Appendix 14). The rate of return on sales after tax (ROS) were all positive for the two large corporations based on the available records. The smallest of the SME had a negative ROS of about 540 percent in 2001 due to its very low sales. Moreover, this company did not pay a tax on profit. This company also did not perform well in 2005 as it was the case with its ROA and ROE (Table 5.19 and Appendix 17).
Company No. 1997 1998 1999 2000 2001 2002 2003 2004 2005
SME 1 ** ** ** ** * ** ** * *2 ** ** * * * * * * *3 * * * * * *
Large 3 * * *4 ** ** ** ** ** 0.49 0.28 ** 0.145 * * * * * * * * *
In Percent

339
Table 5.20. Market performance measures of seaweed/carageenan processors, Philippines, 1997-2005
* Incomplete records for the year.
** No record for the year.
Company No. 1997 1998 1999 2000 2001 2002 2003 2004 2005
SME 1 ** ** ** ** (10.67) ** ** 0.00 (6.22)2 ** ** (1.77) (2.55) (5.67) 0.14 0.06 (0.13) (5.59)3 (7.37) 7.88 0.51 9.37 8.38 (3.72)
Large 3 (0.49) 1.88 (1.15)4 ** ** ** ** ** 1.85 2.54 ** 2.485 (1.46) (1.41) 3.90 7.55 0.90 1.97 1.04 1.30 1.67
SME 1 ** ** ** ** (170.90) ** ** 0.00 (216.79)2 ** ** (218.72) (610.19) (28.86) (118.31) (111.22) (123.34) (30.47)3 (78.81) 701.81 (4.34) 37.75 25.83 (8.94)
Large 3 231.14 (328.66) (3.36)4 ** ** ** ** ** (142.45) (254.75) ** (1266.61)5 80.82 19.85 81.69 21.02 8.60 6.93 4.17 0.98 10.55
SME 1 ** ** ** ** (540.63) ** ** 0.00 (71.92)2 ** ** 0.45 5.94 (1.15) 3.04 2.98 2.52 (3.44)3 (2.14) 3.20 (0.03) 0.44 0.30 (0.11)
Large 3 3.00 2.84 (0.06)4 ** ** ** ** ** 4.05 4.07 ** 5.655 6.89 1.04 2.71 1.87 0.76 0.80 0.40 0.10 1.12
In Percent
Rate of Return on Assets after tax (ROA)
Rate of Return on Equity after tax (ROE)
Rate of Return on Sales after tax (ROS)

340
5.4 SOY SAUCE 5.4.1 The Philippines in World Soy Sauce Market Japan is the largest exporter of soya or soy sauce in the world until the start of the global trade liberalization. China caught up as the top exporter as trade liberalization progressed. Before trade liberalization, the Philippines was ranked as 4th largest exporter in 1985 and no. 6 in 1990. Despite the increase in exports, the economy’s share to world exports for soy sauce decreased, its rank gradually slid to no. 10 in 2000. The economy was no longer among the top 10 world exporters of soy sauce in 2004 due to competition from the major suppliers (Table 5.21).
Table 5.21. The Philippines in world soy sauce trade, various years
Export Year MT Rank
1985 935 4
1990 1,985 6
1995 2,164 8
2000 4,530 10
2004 3,562* 13
* Preliminary Source: FAOSTAT
5.4.2 Non-tariff Barriers to Trade One of the major issues that have confronted the Philippine soy sauce industry was Australia’s restrictions of sauces containing benzoic acids (Avila, 2005). The economy complained about this discriminatory move by Australia since it continued to import the same type of sauces from New Zealand. The Philippines brought the issue to the WTO in late 1998. By 1999, Australia reported that their revised food code which was then scheduled for implementation in 2000 had already allowed the entry of sauces with benzoic acid from the Philippines. The revised code, however has increased the tolerance level of benzoates in sauces to 1,000 milligrams per kilogram. By 2001, Australia removed benzoic acid from its hold order list. 5.4.3 Effects of Trade Liberalization Exports. While the Philippines’ share to the world market for soy sauce had declined, its exports of this commodity has increased (Appendix 18). Exports in 1985 was only 935 metric tons with value of US$767 thousand. Volume of exports reached 2,000 metric in 1991 and increased continuously except for a decrease in 1995. It reached its highest in 2005 with 4,260 metric tons and export earnings of US$3.03 million. Exports followed an upward but at moderate growth (Figure 5.21). The annual shares of value of soy sauce exports to total value of sauces, condiments & mixed seasonings ranged from 10 percent to 16 percent (Figure 5.22).

341
Figure 5.21. Exports values of sauces, condiments & mixed seasoning and soy sauce, Philippines, 1985, 1990-2005
Figure 5.22. Share of soy sauce exports to total value of sauces, condiments & mixed seasonings, Philippines, 1985, 1990-2005
Market Destinations. From the pre- to post-liberalization period, the three major markets for Philippine soy sauce are Saudi Arabia (except in more recent years), USA and Canada (Table 5.22). In 1985, Saudi Arabia accounted for more than half or 51 percent of the total Philippine shipments of soy sauce. In succeeding years up to 2005, the USA became the Philippines’ largest soy sauce trading partner with shares ranging from 33-58 percent. Canada remained the third largest market, except at the start of the trade liberalization period in 1995 when the Russian Federation took the latter’s position in terms of market share.
10.7
14.9
16.515.5
14.6
13.2
11.4
16.2
11.3
14.7 14.9
13.412.9
10.6
12.512.0 12.1
0.0
2.0
4.0
6.0
8.0
10.0
12.0
14.0
16.0
18.0
1985 1990 1991 1992 1993 1994 1995 1996 1997 1998 1999 2000 2001 2002 2003 2004 2005
0.00
5.00
10.00
15.00
20.00
25.00
30.00
1985 1990 1991 1992 1993 1994 1995 1996 1997 1998 1999 2000 2001 2002 2003 2004 2005
FOB
Val
ue (M
illio
n U
S$)
Sauces, Condiments, Mixed Seasonings Soya (Soybean) Sauce

342
Table 5.22. Major markets of Philippine soy sauce, various years
Source: NSO, various years. Foreign Trade Statistics of the Philippines.
Imports. Imports gradually built up from the pre- to the post-liberalization era. From 185 metric tons in 1985, volume of imports doubled in 1990 and increased continuously to 1,000 metric tons a year after the implementation of the WTO in 1996 (Appendix 19). Volume fluctuated which ranged from 1.07 metric tons to 1.76 metric tons up to 2005. Value of imports also increased continuously until 1997, it dropped in 1998 and slightly fluctuated with a downward trend. This is in contrast with the value of exports which also fluctuated but followed an upward trend. In 1995, value of imports and exports were nearly the same and the former surpassed the latter in 1997. On average, value of import was about one-third of the value of export during the pre-liberalization period and about 64 percent at post-liberalization (Figure 5.23). Japan, Singapore and Hongkong are the traditional major sources of soy sauce. In 2005, People’s Republic of China became a major source.
Figure 5.23. Value of imports and exports of soy souce Philippines, 1985, 1990-2005 Source: NSO, various years. Foreign Trade Statistics of the Philippines.
0.00
1.00
2.00
3.00
4.00
5.00
1985 1990 1991 1992 1993 1994 1995 1996 1997 1998 1999 2000 2001 2002 2003 2004 2005
Val
ue (M
illio
n U
S$)
S oy a(S oy bean) S auce Imports S oy a(S oy bean) S auce E x ports
Country Share Country Share Country Share Country Share Country Share% % % % %
Total 100.0 TOTAL Total Total 100.0 Total 100.0 Total 100.0
1 Saudi Arabia 50.4 USA 59.1 USA 33.4 USA 46.3 USA 47.3 2 USA 35.4 Saudi Arabia 20.9 Saudi Arabia 28.2 Saudi Arabia 19.9 UAE 12.2 3 Canada 3.8 Canada 4.7 Russian 13.5 Canada 5.5 Canada 9.0 4 Kuwait 2.4 Australia 3.6 Canada 5.5 UAE 4.9 Kuwait 3.7 5 Others 7.9 Others 11.7 Others 19.4 Others 23.4 Others 27.7
Rank20051985 1990 1995 2000

343
5.4.4 Market Performance Analysis The market performance analysis covered six (6) manufacturers and exporters of soy sauce, three (3) SMEs and three (3) large firms. These firms carry other sauces in their product line in addition to soy sauce, such that their sales records are inclusive of all their products. The reference period is seven (7) years from 1999 to 2005. The records of two firms, however, were available only for six years. Market Structure. The high degree of concentration of the soy sauce market is shown in Figure 5.24. The share of the two largest firms ranged from 85-93 percent. The largest firm (company no. 5) alone controls two-thirds of the market in 2004-2005 and 46-66 percent the previous years (Appendix 20). SMEs have market shares of 7-15 percent in 1999-2005. The market was relatively least concentrated in 2000 as shown by both concentration ratios and Herfindahl-Hirschman Index (Figure 5.25). The Gini coefficient showed relatively less inequality in market shares in 1999-2000 (Appendix 17).
Figure 5.24. Concentration ratios of soy sauce manufacturers Philippines, 1999-2005 Number of firms: 1999(4), 2000-2003(6), 2004-2005(2)
Figure 5.25. Herfindahl-Hirschman Index, soy sauce manufacturers, Philippines, 1999-2005
80.0
82.0
84.0
86.0
88.0
90.0
92.0
94.0
96.0
98.0
1999 2000 2001 2002 2003 2004 2005
CR2 CR3 CR4
5,125
4,084
4,917 4,8405,183
5,696 5,683
0
1,000
2,000
3,000
4,000
5,000
6,000
1999 2000 2001 2002 2003 2004 2005
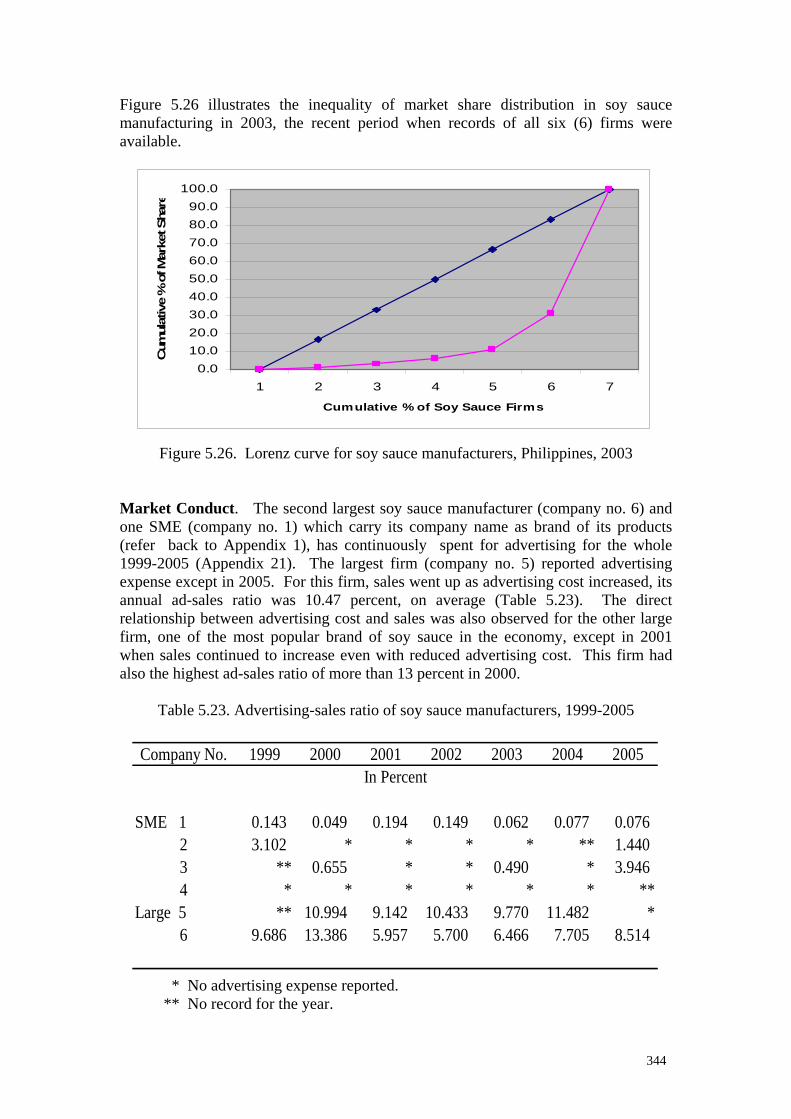
344
Figure 5.26 illustrates the inequality of market share distribution in soy sauce manufacturing in 2003, the recent period when records of all six (6) firms were available.
Figure 5.26. Lorenz curve for soy sauce manufacturers, Philippines, 2003
Market Conduct. The second largest soy sauce manufacturer (company no. 6) and one SME (company no. 1) which carry its company name as brand of its products (refer back to Appendix 1), has continuously spent for advertising for the whole 1999-2005 (Appendix 21). The largest firm (company no. 5) reported advertising expense except in 2005. For this firm, sales went up as advertising cost increased, its annual ad-sales ratio was 10.47 percent, on average (Table 5.23). The direct relationship between advertising cost and sales was also observed for the other large firm, one of the most popular brand of soy sauce in the economy, except in 2001 when sales continued to increase even with reduced advertising cost. This firm had also the highest ad-sales ratio of more than 13 percent in 2000.
Table 5.23. Advertising-sales ratio of soy sauce manufacturers, 1999-2005
* No advertising expense reported.
** No record for the year.
0.010.020.030.040.050.060.070.080.090.0
100.0
1 2 3 4 5 6 7
Cumulative % of Soy Sauce Firms
Cum
ulat
ive
% o
f Mar
ket S
hare
Company No. 1999 2000 2001 2002 2003 2004 2005
SME 1 0.143 0.049 0.194 0.149 0.062 0.077 0.0762 3.102 * * * * ** 1.4403 ** 0.655 * * 0.490 * 3.9464 * * * * * * **
Large 5 ** 10.994 9.142 10.433 9.770 11.482 *6 9.686 13.386 5.957 5.700 6.466 7.705 8.514
In Percent

345
Market Performance. Two SME companies reported losses. The larger of the SME (company no. 4) incurred net losses in 2000, 2002 and 2004 and the smaller SME (company no. 1) in 2001 and 2002. While the former SME realized positive profits in 1999, it was (Appendix 22). The profits realized by the former SME in 1999 was not sufficient to cover its tax on profits, hence, its computed ROA was negative. The two SMEs mentioned above have also negative equities in some years as their losses were apparently written off from their equities. Except for those firms, the other SMEs have positive rates of returns on assets (ROA), equity (ROE) and sales (ROS). The large firms performed favourably during the reference period as shown by the three (3) measures of market performance (Table 5.24).
Table 5.24. Market performance measures of soy sauce manufacturers, Philippines, 1999-2005
** No record for the year.
Company No. 1999 2000 2001 2002 2003 2004 2005
SME 1 0.42 0.40 (14.59) (7.13) 1.86 0.98 1.102 0.10 0.76 2.08 0.75 1.82 ** 8.233 ** 3.49 3.31 4.52 4.23 4.42 3.424 (1.23) (33.56) (22.86) (28.56) (1.02) (50.94) **
Large 5 ** 4.96 4.24 3.62 10.29 10.46 5.056 ** 6.83 8.88 9.65 9.03 9.05 8.59
SME 1 2.38 3.56 (691.32) (80.20) (21.83) (13.04) (14.96)2 5.07 38.04 51.96 16.38 27.24 ** 26.553 ** 9.91 8.60 12.62 11.71 12.34 13.454 (0.67) (23.95) (16.07) (10.42) (13.45) (10.28) **
Large 5 ** 8.51 7.41 6.72 19.94 24.15 24.006 ** 13.02 16.23 17.29 14.64 14.21 13.95
SME 1 0.31 0.38 (17.59) (7.97) 1.28 0.87 0.872 0.04 0.36 0.96 0.32 0.82 ** 0.913 ** 1.67 1.67 1.23 1.27 1.27 1.154 (0.70) (32.55) (24.13) (14.94) (1.86) (22.84) **
Large 5 ** 3.04 1.88 1.38 3.56 3.63 3.776 2.16 3.03 3.93 4.42 4.36 4.30 4.06
Rate of Return on Asset after tax (ROA)
Rate of Return on Equity after tax (ROE)
Rate of Return on Sales after tax (ROS)
In Percent

346
5.5 Noodles The expenditures for noodles by Filipino households have been increasing. Based on the Household and Income Expenditure Survey (FIES)29, the total expenditures for noodles increased by an annual compounded rate of 7.60 percent from 1994 to 1997, and by 4.08 percent from 1997 to 2000. 5.5.1 Trade Related Issue The raw materials for manufacturing noodles are wheat, rice, and beans, but mostly wheat. Soft wheat is used for noodles and cakes, while hard wheat is used for breads and loaves. It was reported, however, that companies were considering purchasing hard white wheat flour for new noodle and steamed rice production lines (USDA, 2002). Most of the economy’s wheat imports are sourced from the United States. Because of trade liberalization, tariff rate for wheat for milling is 3 percent while the tariff for flour, pasta and bread products is 5 percent (Table 5.25). Local flour millers are confronted whether to import wheat for milling or flour itself. Also, the low tariff on imported pasta and bread products puts additional pressure on the flour milling industry (Reyes, 2003).
Table 5.25. Tariff rates (%) on wheat, flour and flour-based product imports, Philippines, selected years
Year Durum
Wheat Other Wheat
Wheat Used as
Feed
Flour Pasta Products*
Bread Products
1995 10 10 30 30 30 30 2000 3 3 10 7 15 15 2001 3 3 10 7 15 15 2002 3 3 7 7 10 10 2003 3 3 7 5 7 7 2004 3 3 5 5 5 5
* Pasta, whether or not cooked or stuffed or otherwise prepared, such as spaghetti, macaroni, noodles, lasagne, gnocchi, cannelloni; couscous, whether or not prepared. Source: Senen, 2003; Tariff and Customs Code of the Philippines, 2004. 5.5.2 Effects of Trade Liberalization Exports. The economy exports noodles of various types and over the past two decades exports have grown. In 1985, outside shipments were 1.3 metric tons valued at US$2.2 million (Appendices 23 & 24). In the first half of 1990, exports doubled. It peaked during the initial period of global trade liberalization in 1996 with 3.2 thousand metric tons and export earnings of US$6.3 million. Volume and value fluctuated from 1997 to 2005 but followed an uptrend (Figure 5.27). From the pre- to the post-liberalization period until 2001, noodle exports comprised largely of uncooked canton containing egg and uncooked bihon, wheat- and rice-based noodles. These two types of noodles accounted for about 92 percent, on average, of annual
29 The FIES is undertaken by the National Statistics Office every three years.

347
volume of total noodle export. However, beginning 2002 the wheat-based uncooked miki with and without eggs, comprised 94 percent of annual export volume. There was no export of uncooked canton from 2002 to 2005, except for less than one metric ton in 2004. Shipments of bihon also dropped significantly to less than 50 metric tons in 2002 and gradually scaled up to 116 metric tons in 2005. Annual export of vermicelli which is bean-based, was mostly less than 100 tons. The other noodles with minimal volume of exports are misua (1-7 tons) and wanton wrappers (1-2 tons).
Figure 5.27. Value of noodle exports by type, Philippines, 1985, 2000-2005 Source: NSO, various years. Foreign Trade Statistics of the Philippines.
Export Markets. The US and Saudi Arabia were consistently the top buyers of Philippine noodles, particularly vermicelli (Table 5.26). From mid 1985 to 1990, the US accounted over 60 percent of the economy’s noodle exports while Saudi Arabia took in more than 10 percent. In 1995, 2000 and 2005, the US share dropped to about 45 percent, while Saudi Arabia’s intake ranged from 6 to 12 percent. From 1990 to 2000, Canada became one of the major destinations with annual market share of 3-6 percent. The UAE was next to the US as the top buyer of noodles in 2005.
Table 5.26. Major export markets of Philippine noodles, 1985, 2000-2005
Source: NSO, various years. Foreign Trade Statistics of the Philippines.
0
1,000,000
2,000,000
3,000,000
4,000,000
5,000,000
6,000,000
7,000,000
1985 1990 1991 1992 1993 1994 1995 1996 1997 1998 1999 2000 2001 2002 2003 2004 2005
FOB
Val
ue (U
S$)
TOTAL NOODLES Canton, Uncooked, Containing Eggs Bihon, Uncooked Vermicelli Other Noodles
Country Share Country Share Country Share Country Share Country Share% % % % %
Total 100.0 Total 100.0 Total 100.0 Total 100.0 Total 100.0
1 USA 61.3 USA 64.1 USA 46.6 USA 44.9 USA 44.7 2 Saudi Arabia 16.2 Saudi Arabia 11.4 Saudi Arabia 8.9 Saudi Arabia 12.4 UAE 9.5 3 Hawaii 8.7 Canada 4.9 Canada 3.2 Australia 7.5 Saudi Arabia 6.0 4 Guam 2.9 Hawaii 3.3 UAE 2.7 Canada 6.1 Australia 5.8 5 Others 10.9 Others 16.3 Others 38.6 Others 29.1 Others 33.9
2005Rank
1985 1990 1995 2000
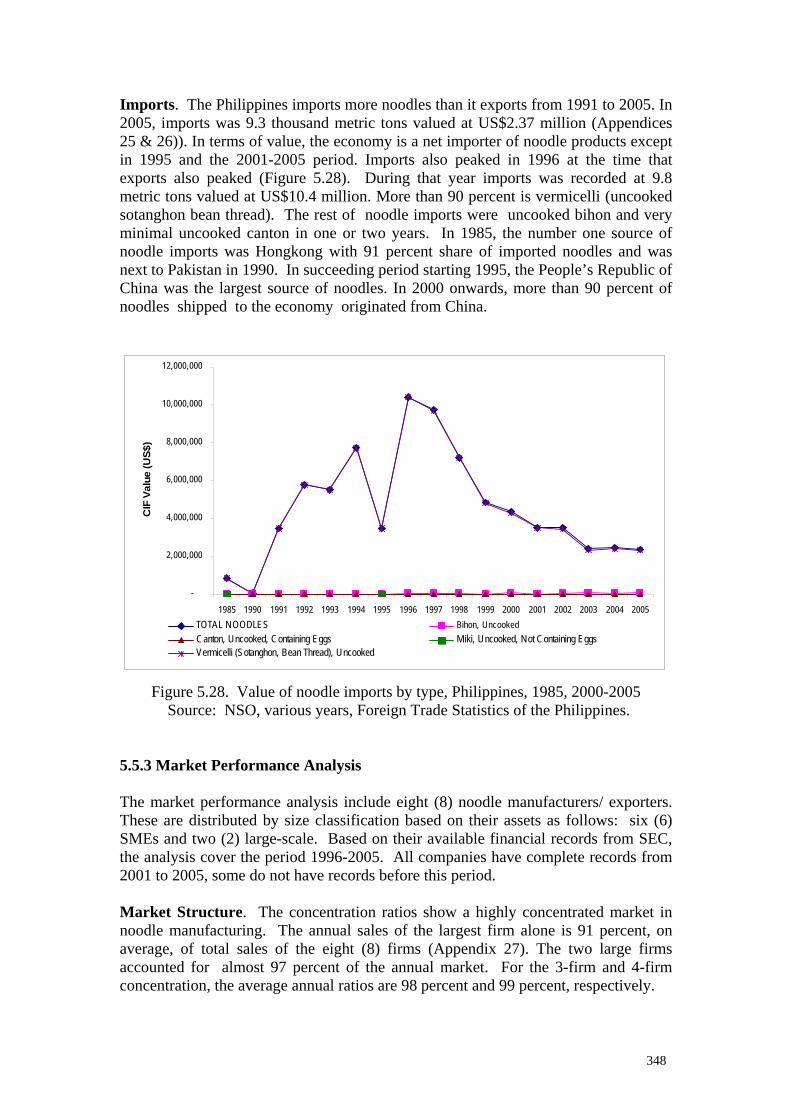
348
Imports. The Philippines imports more noodles than it exports from 1991 to 2005. In 2005, imports was 9.3 thousand metric tons valued at US$2.37 million (Appendices 25 & 26)). In terms of value, the economy is a net importer of noodle products except in 1995 and the 2001-2005 period. Imports also peaked in 1996 at the time that exports also peaked (Figure 5.28). During that year imports was recorded at 9.8 metric tons valued at US$10.4 million. More than 90 percent is vermicelli (uncooked sotanghon bean thread). The rest of noodle imports were uncooked bihon and very minimal uncooked canton in one or two years. In 1985, the number one source of noodle imports was Hongkong with 91 percent share of imported noodles and was next to Pakistan in 1990. In succeeding period starting 1995, the People’s Republic of China was the largest source of noodles. In 2000 onwards, more than 90 percent of noodles shipped to the economy originated from China.
Figure 5.28. Value of noodle imports by type, Philippines, 1985, 2000-2005 Source: NSO, various years, Foreign Trade Statistics of the Philippines.
5.5.3 Market Performance Analysis The market performance analysis include eight (8) noodle manufacturers/ exporters. These are distributed by size classification based on their assets as follows: six (6) SMEs and two (2) large-scale. Based on their available financial records from SEC, the analysis cover the period 1996-2005. All companies have complete records from 2001 to 2005, some do not have records before this period. Market Structure. The concentration ratios show a highly concentrated market in noodle manufacturing. The annual sales of the largest firm alone is 91 percent, on average, of total sales of the eight (8) firms (Appendix 27). The two large firms accounted for almost 97 percent of the annual market. For the 3-firm and 4-firm concentration, the average annual ratios are 98 percent and 99 percent, respectively.
-
2,000,000
4,000,000
6,000,000
8,000,000
10,000,000
12,000,000
1985 1990 1991 1992 1993 1994 1995 1996 1997 1998 1999 2000 2001 2002 2003 2004 2005
CIF
Val
ue (U
S$)
TOTAL NOODLES Bihon, UncookedCanton, Uncooked, Containing Eggs Miki, Uncooked, Not Containing Eggs Vermicelli (Sotanghon, Bean Thread), Uncooked

349
Figure 5.29. Concentration ratios of noodle manufacturers, Philippines, 1996-2005 Number of firms: 1996(5), 1997(3), 1998(6), 1999(7), 2000(6), 2001-2005(8) The high degree of concentration of the noodle market is also shown by the Hirschman-Herfindahl Index (Figure 5.30). Considering the number of firms reporting in a given year, the HHI hovered around a high of more than 8,000 percentage points with the presence of the largest firm which dominate the market for noodles. The Index was only about half that much in 1997 with the exclusion of the largest firm.30
Figure 5.30. Herfindahl-Hirschman Index, noodle manufacturers, Philippines, 1996-2005
Indeed, the inequality of the market shares among the eight (8) noodle manufacturers is also indicated by the annual Gini coefficients. During the 1996-2005 reference period, the coefficients ranged from 0.76 to 0.84, with the exception in 1997 when
30 The financial records of the largest firm were not available in 1997.
8,782
4,629
8,597
7,782 7,834 8,102 8,237 8,341 8,446 8,368
-
1,000
2,000
3,000
4,000
5,000
6,000
7,000
8,000
9,000
10,000
1996 1997 1998 1999 2000 2001 2002 2003 2004 2005
95.0
95.5
96.0
96.5
97.0
97.5
98.0
98.5
99.0
99.5
100.0
1996 1997 1998 1999 2000 2001 2002 2003 2004 2005
CR2 CR3 CR4

350
this was 0.29 with only 2 SMEs and the second of the large firm reporting (Appendix 27)31. The inequality of the market shares of the 8 noodle manufacturers/exporters is illustrated by the Lorenz Curve in 2005 (Figure 5.31). Figure 5.31. Lorenz curve for noodle manufacturers, Philippines, 2005 Market Conduct. The largest of the noodle manufacturers/exporters have invested a significant amount in annual advertising during the reference period, except in 1997 where there was no available record (Appendix 28). The second largest company reported advertising cost continuously from 2000-2005. The high advertising of the two large companies paid off in terms of large sales. The ad-sales ratio of these two companies ranged from 2.68 percent to 11.34 percent (Table 5.27). Several of the SMEs advertised regularly, one of these companies (no. 4) from 1996 to 2005 and another three (3) companies (nos. 2, 3 and 5) from 2001 to 2005. The ad-sales ratio of SMEs were from a low of 0.026 to a high of 9.70 percent.
Table 5.27. Advertising-sales ratio of noodle manufacturers, 1996-2005
* No advertising expense reported.
** No record for the year.
31 The financial records of these three (3) firms were the only available during the year.
Company No. 1996 1997 1998 1999 2000 2001 2002 2003 2004 2005
SME 1 * * * * * * * * * *2 ** ** ** ** ** 1.042 0.618 0.090 0.119 0.0633 ** ** ** 4.532 ** 1.814 2.273 1.093 0.329 0.0364 1.714 1.423 0.210 0.360 0.200 0.413 0.923 0.164 0.134 0.0915 0.292 ** 0.078 0.122 0.187 0.165 0.153 0.026 0.122 1.1616 ** ** 9.705 * * * * * * *
Large 7 * * * * * * 11.344 9.473 8.917 10.1088 5.694 ** 3.988 6.801 5.063 3.450 3.452 4.809 3.565 2.685
In Percent
0
20
40
60
80
100
1 2 3 4 5 6 7 8 9
Cumulative % of Noodle Manufacturers
Cum
ulat
ive %
of M
arke
t Sha
re

351
Market Performance. Except for two (2) firms which reported losses, one SME (no. 3) in 1999 and 2001 and the second largest (no. 7) from 1996-1999, the rest or five (5) firms performed favorably in terms of profits throughout the reference period (Appendix 29). The 5 companies include the largest (no. 8) which also had the highest annual rates of return on asset (ROA) of more than 14 percent to about 17 percent from 2002 to 2005 (Table 5.28). The three firms which incurred net losses have written off their losses from their equity and due to successive losses as in the case of the SME, the equity became negative in 2001. On the other hand, despite its size one of the small firms (no. 1) had the highest ROA from 1997 to 2000 which ranged from 8.73 percent to 17.63 percent.
Table 5.28. Market performance measures of noodle manufacturers, Philippines, 1996-2005
** No record for the year.
Company No. 1996 1997 1998 1999 2000 2001 2002 2003 2004 2005
SME 1 2.24 8.73 17.04 17.63 17.43 15.00 13.71 10.57 12.21 5.242 ** ** ** ** ** 3.52 1.52 1.33 0.73 0.793 ** ** ** (48.77) ** (4.06) 0.84 0.56 7.53 2.324 0.82 0.54 0.87 2.05 1.73 1.79 2.79 2.13 1.42 2.335 1.67 ** 5.84 5.76 4.61 3.49 4.22 5.00 4.46 2.206 ** ** 0.66 4.70 5.24 4.82 6.20 8.68 10.61 9.82
Large 7 (1.31) (4.72) (0.79) 3.05 5.23 7.33 7.22 5.42 5.81 5.768 4.20 ** 6.73 9.25 13.41 13.54 16.08 14.31 17.66 14.35
SME 1 12.21 26.87 32.53 23.26 19.54 17.31 17.46 11.88 18.30 20.822 ** ** ** ** ** 32.34 15.74 42.99 55.81 26.193 ** ** ** (186.14) ** (124.96) (25.94) (17.49) 9.28 3.184 45.12 44.05 26.78 21.90 21.75 20.67 46.17 16.29 19.53 25.825 3.50 ** 6.16 6.07 6.05 5.14 7.31 11.09 19.53 5.806 ** ** 2.67 13.13 13.32 12.21 10.19 14.19 16.87 18.80
Large 7 (4.42) (8.13) (1.46) 1.46 2.86 1.56 5.61 4.69 4.14 6.368 34.73 ** 52.33 37.04 48.12 35.45 23.04 20.67 28.79 15.32
SME 1 2.03 2.07 3.41 3.29 3.30 2.93 2.98 2.60 5.00 6.292 ** ** ** ** ** 1.58 0.71 2.11 3.20 1.953 ** ** ** (30.02) ** (1.97) 0.42 0.14 0.23 0.384 2.25 2.62 1.89 0.95 1.86 2.14 3.51 1.47 1.74 2.085 0.64 ** 1.03 1.00 0.97 0.86 0.96 0.56 0.46 0.326 ** ** 4.22 2.86 2.41 2.61 2.23 2.93 2.82 3.56
Large 7 (31.66) (31.47) (2.79) 1.14 2.04 1.05 3.12 2.52 2.18 2.858 2.03 ** 4.67 3.79 7.68 6.79 5.95 6.17 10.02 6.38
Rate of Return on Assets after tax (ROA)
Rate of Return on Equity after tax (ROE)
Rate of Return on Sales after tax (ROS)
In Percent

352
5.6 DESICCATED COCONUT
5.6.1 The Philippines in World Desiccated Coconut Market
The Philippines remains the number one producer and exporter of desiccated coconut (DCN) followed by Sri Lanka and Indonesia in recent periods (Table 5.29).
Table 5.29. World’s major exporters of desiccated coconut, various years
Philippines Sri Lanka Indonesia Year US$000 Rank US$000 Rank US$000 Rank
1985 75,000 1 49,327 2 4,620 5
1990 60,677 1 35,679 2 1,566 8
1995 68,286 1 45,141 2 17,533 3
2000 73,249 1 54,411 2 21,952 3
2004 99,743 1 46,469 2 21,245 3
Source: FAOSTAT
5.6.2 Effects of Trade Liberalization Exports. Exports of desiccated coconut, DCN thereafter, and other processed coconut fluctuated but moved in an upward direction. Figure 5.32 shows the cyclical fluctuations in exports wherein a two or three year growth period is preceded by a weakening of exports. The growths in volume and value of exports were more apparent at the later part of trade liberalization from 2002 to 2005. In 2005, each of export tonnage and value reached more than 100 thousand metric tons and US$100 million (Appendices 30 & 31). Other processed coconut products have similar trends.32 DCN exports had the largest share to total exports of processed coconut product. In the 2002-2005 period, DCN exports contributed about 93 percent to total value processed coconut product exports, below the 99 percent share in mid-1985 and in 1990 (Figure 5.33).
Export Markets. While the US continue as the number one buyer of DCN, its share to total value of exports of processed coconut products for food have declined since the pre-liberalization period (Table 5.30). In 1985, DCN exports was 62 percent of total value of export. This contribution declined in succeeding periods to less than 50 percent from 1990 to 2000, further down to less than 30 percent in 2005. Brazil and countries from the Commonwealth (Australia, Canada) and EU (UK, North Ireland, Netherlands) were also major markets.
32 Based on the harmonized coding system, processed coconut product food category includes the following: desiccated coconut, coconut chips, prepared/preserved, dried coconut meat, coconut milk in liquid form, coconut milk in powdered form, uncooked coconut/cook by steaming/boiling in water, frozen, and coconut flour, meal and powder.

353
Figure 5.32. Processed food coconut product exports, Philippines, 1985, 1990-2005 Source: NSO, various years. Foreign Trade Statistics of the Philippines
Figure 5.33. Share of desiccated coconut exports to total value of processed coconut exports, Philippines, 1985, 1990-2005
Source: NSO, various years. Foreign Trade Statistics of the Philippines
Table 5.30. Major export markets of Philippine desiccated coconut, 1985, 2000-2005
Source: NSO, various years. Foreign Trade Statistics of the Philippines.
99.199.8
95.295.9
94.993.7 94.1 94.3 93.9
91.5
93.094.3
88.8
92.193.5 93.3
94.7
82.0
84.0
86.0
88.0
90.0
92.0
94.0
96.0
98.0
100.0
102.0
1985 1990 1991 1992 1993 1994 1995 1996 1997 1998 1999 2000 2001 2002 2003 2004 2005
Country Share Country Share Country Share Country Share Country Share% % % % %
Total 100.0 Total 100.0 Total 100.0 Total 100.0 Total 100.0
1 USA 61.9 USA 46.7 USA 43.7 USA 47.1 USA 26.5 2 Australia 8.2 Australia 9.8 Brazil 11.0 Canada 10.0 UK 10.1 3 Canada 6.7 Netherlands 9.2 UK 7.1 UK 7.6 Netherlands 8.0 4 Germany 4.9 Canada 7.8 Australia 6.4 Australia 6.1 Belgium 7.3 5 Others 18.3 Others 26.5 Others 31.8 Others 29.2 Others 48.1
2005Rank
1985 1990 1995 2000
0.00
20.00
40.00
60.00
80.00
100.00
120.00
140.00
1985 1990 1991 1992 1993 1994 1995 1996 1997 1998 1999 2000 2001 2002 2003 2004 2005
FOB
Val
ue (M
illio
n U
S$)
Total Processed Coconut Desiccated Coconut Other Processed Coconut

354
5.6.3 Market Performance Analysis The United Coconut Association of the Philippines (UCAP) reported nine (9) DCN companies in the economy in 2006. Due to the difficulty of collecting information from these companies, SEC records were instead used as reference for the market performance analysis.33 SEC records were available for seven (7) of the dessicating companies. An assessment of their financial records indicated that six (6) of the 7 dessicators operated as large scale based on the value of their assets. The other dessicator was classified as medium sized based on SME classification, e.g. value of assets, for most of its operations from 1999 to 2005. The reference period for the performance analysis was 1998-2005. The rated capacities of the seven DCN companies ranged from a low of 4.32 thousand metric tons to 32.64 thousand metric tons. The upper bound is the combined capacity of the two branches of company no. 7, making it the largest coconut desiccating company (Table 5.31).
Table 5.31. Production capacities of six desiccated coconut companies, Philippines, May 2006
Name of company Rated production capacity*
MT/year 1. Celebes Coconut Corp. 4,324.80
2. Pacific Royal Basic Food 13,600.00
3. Peter Paul Philippine Corp. 24,480.00
4. Coco Davao, Inc. 12,240.00
5. Primex Coco Products 19,040.00
6. Fiesta Brands 20,200.00
7. Franklin Baker Co., Phil
a. San Pablo City Laguna 16,592.00
b. Sta. Cruz, Laguna 16,048.00
* 100 bags DCN = 4.53 MT/day or 1,360 MT/year based on
300 days of operation. Source: United Coconut Association of the Philippines (UCAP), July 2006. Market Structure. Sales of the largest desiccator alone comprise almost one-fourth or 24 percent of the total sales of the seven (7) DCN companies in 2004 and 2005 (Appendix 32). The 2-firm, 3-firm and 4-firm concentration ratios decreased as there
33 Only one of these companies responded to the questionnaire sent to each of them.

355
were more desiccators reporting.34 Considering the two desiccators, the concentration ratio of the market ranged from about 40 percent to about 73 percent; from about 56 percent to 82 percent for the largest 3 desiccators (Figure 5.34). This is clearly illustrated by the HH index which decreased from more than 3.5 thousand percentage points to about half or about 3.6 thousand percentage points (Figure 5.35). This showed a more even distribution of the market sales with more desiccators, which was also reflected by the by the Gini ratios ranging from 0.12 to 0.27 (Appendix 32) and the Lorenz curve for 2004 (Figure 5.36).
Figure 5.34. Concentration ratios of desiccators, Philippines, 1998-2005 Number of firms: 1998(3), 1999-2000(4), 2001(5), 2002(6),
2003-2004(7), 2005(6)
Figure 5.35. Herfindahl-Hirschman Index of desiccators, Philippines, 1998-2005
34 The number of companies varied per year depending upon the availability of company records.
30.00
40.00
50.00
60.00
70.00
80.00
90.00
1998 1999 2000 2001 2002 2003 2004 2005
CR2 CR3 CR4
3,535
2,660 2,731
2,1171,922
1,7641,568
1,823
-
500
1,000
1,500
2,000
2,500
3,000
3,500
4,000
1998 1999 2000 2001 2002 2003 2004 2005

356
Figure 5.36. Lorenz curve for desiccators, Philippines, 2004 Market Conduct. The lone SME (no. 5) advertised in 2001, 2002, 2004 which contributed to its increments in its sales for these years, although the ad-sales ratios were only less than one percent, from 0.0002 to 0.007 percent (Appendix 33). Only three (3) of the large desiccators advertised but there is no continuity every year. There ad-sales ration, nevertheless, were 0.001 to 1.40 percent (Table 5.32). One of the large desiccators (no. 1) was classified as SME in 2002 based on its value of assets.
Table 5.32. Advertising-sales ratio of desiccators, Philippines, 1998-2005
Note: One large desiccators (no. 1) was classified as SME in 2002 based on its value of assets.
* No advertising expense reported.
** No record for the year
0.000
20.000
40.000
60.000
80.000
100.000
1 2 3 4 5 6 7 8Cumulative % of Desiccating Firms
Cum
ulat
ive
% o
f Mar
ket S
hare
Company No. 1998 1999 2000 2001 2002 2003 2004 2005
SME 1 ** ** ** ** 0.1444 ** ** ** ** ** *5 ** * * 0.007 0.000 0.001
Large 1 ** ** ** ** 0.034 * 0.0012 * * * * * * * 1.4013 ** ** ** * 0.032 0.410 0.267 **4 ** ** ** ** ** * *5 ** 0.003 *6 * * * * * * * *7 * * * * * * * *
In Percent

357
Market Performance. Except for two large-scale (nos. 2 and 7, the largest) which declared net losses in 2004, all of the desiccators fared very well in their net profits. (Appendix 34). For the lone SME, its highest market performance were in 2002 for its ROA of almost 5 percent , in 2004 for ROE of more than 27 percent. Its ROS, however was low at less than one percent (Table 5.33). Among the large desiccators, the largest of the desiccators had the highest ROA in 1998 at more than 11 percent and in 2000 at more than 10 percent. One company (no. 2) had the highest ROE of 5,883 percent in 1998 because of a low equity relative to a very large amount of sales (Appendix 34). This company had also the highest ROS at 7.53 percent also in 1998.
Table 5.33. Market performance measures of desiccators, Philippines, 1998-2005
** No record for the year.
Company No. 1998 1999 2000 2001 2002 2003 2004 2005
SME 1 ** ** ** ** 3.704 ** ** ** ** ** 1.165 ** 2.46 3.48 4.25 4.91 2.69
Large 1 ** ** ** ** 5.97 5.49 7.002 6.71 2.37 8.45 0.08 1.78 2.89 (15.60) 3.703 ** ** ** 0.57 0.64 0.11 (1.16) **4 ** ** ** ** ** 3.67 15.155 ** 2.60 1.816 1.25 1.30 1.12 1.21 1.52 0.78 0.56 0.467 11.69 3.28 10.18 6.21 6.00 0.33 (2.11) 1.33
SME 1 ** ** ** ** 13.514 ** ** ** ** ** 1.885 ** 6.33 7.56 1.29 8.63 27.36
Large 1 ** ** ** ** 13.99 25.07 35.862 5883.32 364.72 107.43 72.65 82.72 50.08 (506.39) 37.363 ** ** ** 122.43 28.57 20.32 9.20 **4 ** ** ** ** ** 16.73 27.385 ** 7.95 44.246 28.48 27.00 18.62 16.23 19.41 10.88 12.12 13.777 12.84 2.90 11.56 7.48 7.67 1.56 (2.62) 1.71
SME 1 ** ** ** ** 2.664 ** ** ** ** ** 1.535 ** 0.19 0.25 0.04 0.23 1.09
Large 1 ** ** ** ** 1.89 1.75 2.712 7.53 4.29 6.84 5.32 4.77 4.00 (11.09) 1.423 ** ** ** 6.50 3.37 2.49 1.39 **4 ** ** ** ** ** 1.92 3.715 ** 0.24 1.406 2.05 2.18 1.87 1.94 1.86 1.38 1.62 1.677 4.13 0.95 4.48 3.74 3.06 0.64 (1.02) 0.61
Rate of Return on Asset after tax (ROA)
Rate of Return on Equity after tax (ROE)
Rate of Return on Sales after tax (ROS)
In Percent

358
6. POLICY IMPLICATIONS This section deals on the policy implications of the findings of this study, for the Philippines and for the ASEAN in general. 6.1 Implications for the Philippines Several findings stand out from this study. First, world trade liberalization has reinforced previous unilateral efforts of the Philippines towards reforms in trade policies in agriculture and manufacturing, in particular, the food processing sector which is the focus of this study. Despite these efforts, however, based on the literature there are still some distortions in the tariff structure that are biased against manufacturing exports wherein food processing importables receive higher protection than exportables. Thus, while total exports of processed food are increasing under a free trade environment, imports are also increasing at a faster rate. The most efficient food processors maintain or expand their market while the less competitive either leave the market or experience output contraction. While it is the essence of trade liberalization, that the resources of uncompetitive industries should be channeled to where they would be more efficient, there are small opportunities for them to venture into new undertakings because of barriers to entry, including established brands of products, limited resources and the risk they face. Some of the contributory factors to competitiveness are the size of the firm and resources required in R&D or upgrading of facilities in order to conform with the standards of the market. This observation applies especially to SMEs in food processing firms or enterprises. Addressing their concern requires appropriate policies that would enhance access to financing and technical assistance in the form of training. The restructuring process of SMEs that may have been displaced as a result of stiff competition resulting from trade liberalization requires a transition period. For the large enterprises and even those efficiently operating on medium scale, they require some more reforms in the tariff structure and domestic market environment. Furthermore, vertical and horizontal linkages between the SMEs and large enterprises should be encouraged so that the former could have a share of the advantaged position of large enterprises. The second related finding is that while tariff reforms are the major highlights of liberalization, other complementary areas that deserve attention are the non-tariff barriers. The stringent SPS measures of the economy’s major markets for its processed food products is a common constraint faced by all selected food processing industries covered in the present study. Product standards in the economy take several forms, those that has yet to be developed, to be strengthened. GAP/HACCP must be strictly enforced and monitored. In addition, the structural requirements in developing and improving these standards by the concerned agencies needs increased government support. The third finding is that while the economy has adopted an outward looking trade policy backed up by economic reforms in financing, foreign investment, business competition, its anti-trust laws are somewhat dispersed to several regulatory agencies. There is no central agency that monitors unfair competition practices. Strict implementation and monitoring along this area should be ensured. This is also true with the enforcement of GAP/HACCP and other product standards.
359
Based on the performance analysis of specific food processing industries, the SCP paradigm showed that the industries with predominant number of SMEs have higher degree of concentration which is biased towards the large enterprises. This is true for processed mango, noodles and soy sauce. Soy sauce industry has moderate concentration while canned tuna and desiccated coconut which are dominated by large corporations have lesser extent of market concentration, lower HHI index and Gini ratios. This is expected because the degree of competitiveness in a particular industry can be attributed to the size of the firm, expenditures on advertising and access to improved technology. Due to data constraints, the impact of competition on mark-ups was not empirically tested using the price cost margin approach or PCM. On another perspective, the effect of hurdling the tariff barrier imposed by the EU market on the competitiveness and hence, export performance of the domestic canned tuna industry as a whole was very apparent. To some extent, the bottom line of industry performance under trade liberalization environment is that policy reforms should be credible and consistent. 6.2 Implications for ASEAN There were five (5) countries out of the present number of nine (9) ASEAN member economies which participated in the present study. Similarities were seen in terms of the trade and market reforms including investment, initiated internally by each economy in line with the regional and global trade liberalization. These countries have also development programs for their SMEs in processed foods. Except for Brunei Darussalam which is a net importer because of high production and processing costs, the other countries such as Malaysia, Philippines, Thailand and Vietnam have experienced increased exports in processed food products which they have comparative advantage. The effects of trade liberalization in processed food vary among the 5 ASEAN. In Malaysia, the growth of exports exceeded imports while the reverse is true in the case of the Philippines. In Indonesia, imports of flour also increased which has reduced the 4-firm market concentration of the Indonesian domestic flour industry. Their fish-based industries, however, did not show significant increase. In Thailand, fishery product exports went up; rice and cereals fluctuated with an upward movement. The share of large companies in the market for canned fruits and vegetables and seafood processing predominate with a small share by the SMEs, as in the case of the Philippines. In Vietnam, exports of coffee, cashew nuts and rice increased. In the case of coffee, joint ventures helped propelled exports. While there is intra-ASEAN competition in terms of exports, member countries also cooperate with each other in extra-ASEAN trade related matters. One example was the joint effort between Thailand, Philippines and Indonesia, with Thailand leading the group, in negotiations with the WTO for the reduction of the discriminatory EU tariff imposed on canned tuna from these three countries. Their concerted effort resulted in the reduction of the tariff from 25 percent to 12 percent on a 5-year annual quota of 25,000 MT. This quota was allocated to the three lobbying countries with a minimal share to other third countries. ASEAN has progressed from an organization that is political in nature to a market-driven economic cooperation and integration, given the proliferation of regional trading agreements. Complementation and cooperation are underway under the AFTA-CEPT Scheme, wherein tariffs will be reduced within a range of zero to 5

360
percent in addition to reduction of products in the exclusion list under the CEPT Scheme. The AFTA-CEPT Scheme can be viewed as an initial step to the ASEAN goal of economic integration, wherein member countries become more efficient and competitive, with free flow of goods and services, investment and capital. This in itself is a big challenge for ASEAN which require streamlining of member countries based on their competitiveness, capacity building in meeting the demands of world competition, strengthening the position of ASEAN in international trade negotiations with a common and consistent stand on concerns and issues.

361
7. REFERENCES Prospectus of the Alliance Tuna International, Inc. October 17, 2006. Aldaba, Rafaelita M. 2005. The Impact of Market reforms on Competition, Structure
and Performance of the Philippine Economy. Paper presented at the Workshop on Policies to Strengthen Productivity in the Philippines sponsored by the Asia-Europe Meeting (ASEM) Trust Fund, Asian Institute of Management (AIM)Policy Center, Foreign Advisory Service, Philippine Institute of Development Studies and the World Bank. AIM Policy Center, Makati City.
Avila, John L. 2005. Non-Tariff Barriers Facing Philippine Exporters. Institute of Political Economy, University of Asia and the Pacific, Philippines.
Batungbakal, E.P.T et al, 2004. Subsidies in Philippine Fisheries. Research Unit, Tambuyog Development Center, 91 V. Luna Road, Sikatuna Village, Quezon City, Philippines.
Bilaterals.org. March 21, 2007. Thailand bilateral free trade with US alarms tuna
industry key players.
Bureau of Agricultural Statistics. 2005. Mango: Trends in Production, Prices and Exports. Vol. II, No. 3.
Bureau of Export and Trade Promotion, n.d.Trade Information, Non-tariff Barriers. Tradelinephil.dti.gov.ph/betp/Italy2. Cororaton, C.B., J.Cockburn and E. Corong. 2005. Doha Scenarios, Trade Reforms,
and Poverty in the Philippines: A CGE Analysis. In Chapter 13, Putting Development Back into the Doha Agenda: Poverty Impacts of a WTO Agreement, T. W. Hertel and L.A. Winters (eds.), forthcoming from the World Bank. Washington, D.C.
De la Cruz, P. A. 1995. Facts and Figures about Philippine Products Exported to United States. Paper presented at the National Food Producers and Manufacturers Convention, November 13-15, Manila Diamond Hotel, Metro Manila.
De la Pena, C. 2005. Rural Growth and Development Revisited Policy Issues. A
Report submitted to the World Bank.
Deloitte, 2007. Philippines: International Tax and Business Guide. Report updated in February 2007. www.deloittetaxguides.com/index.asp?country_id
Department of Agriculture-Agribusiness and Marketing Assistance Service. n.d.
Mango Industry Situationer Report. www.philonlinw.ph_webdev/da-amaa/mango.html
362
Department of Foreign Affairs. Press Release. 2330 Roxas blvd., Pasay City, Philippines. March 21, 2005. Decision of European Court of Justice on Tariff Quota for Canned Tuna favors RP tuna Exports. www.dfa.gov.ph
Department of Health, 2005. Draft of Administrative Order on Bureau of Food and
Drugs, Philippine National Standards on Ethnic Food Products – Dried Whole Fish and Dried Split/Filleted Fish. February 17, 2005.
Department of Trade and Industry-Cebu Provincial Office, 2005. Profile of Key
Industries: Seaweeds or Carageenan Industry Profile.
Department of Trade and Industry, 2007. Small and Medium Enterprises, Statistical Report, 2000-2004.
Digal, Larry N. 2005. Benefit Diffusion and Linkage Development in the Philippine Tropical Fruits Sector. Paper presented during the conference, “Closing the Productivity Gap” sponsored by the World Bank and the National Economic Development Authority, June 27, Asian Institute of Management Policy Center, Makati City, Philippines.
Duenas-Caparas, Ma. Theresa S., 2006. Determinants of Export Performance in the Philippine Manufacturing Sector. Discussion Paper Series No. 2006-18. Philippine Institute of Development Studies, 3rd Floor NEDA sa Makati Building, Makati City, Philippines.
Elazegui, Dulce D., 1998. Food Processing in the Philippines: Issues and
Challenges. Institute of Strategic Planning and Policy Studies, College of Public Affairs, University of the Philippines at Los Banos, College, Laguna. serp-p.pids.gov.ph/details.php3?tid=1648
Fajardo, Sarah J. 2002. A Tuna Trade Controversy: The issue of High tariff (24% and 35%) being imposed by the EU members and US on Philippine Canned Tuna Products. www.globefish.org/index.php?
Filipino canners urge rethink on US law. August 29, 2002.
foodproductiondaily.com/news/ng.asp?id.
FAOSTAT. www.fao.org Go, Marianne V., March 5, 2005. Vegetables Not Included I ‘Early Harvest” Deal
With China. Philippine Star in Bilaterals.Org. Hapitan, R. 2005. Competitive Policy and Access of Small and Medium Enterprises
(SMEs) to Financial Services: A Review of Selected SMEs. Philippine Institute of Development Studies, Makati City.
Ho, Abigail. September 22, 2004. Tuna firms invest P347M in new facilities. www.inq7money.net

363
M Nasir Shamsudin. 2006. APEC Project Meeting on Market liberalization & Its Relationship with Market Structure, Conduct and Performance, Conduct and Performance of Selected Food Processing Industry of APEC Member Economies. December 13-14, 2006, Kuala Lumpur, Malaysia.
Malaya, September 25, 2006. Locals prefer sardines, tuna destined for exports. Menardo, Amelia A. 2004. Tariff Reforms in the Philippines. Paper prepared for the
APEC High-Level Conference on Structural Reform, September 8-9, 2004 Tokyo, Japan.
Mindanao Economic Development Council (MEDCo), 2006. Small and Medium Enterprises in the Philippines. http://www.medco.gov.ph/medcoweb/smeprofl.asp
Mindanao Economic Development Council (MEDCo). GenSan business leaders laud Arroyo for support to tuna industry. www.medco.gov.ph/medcobweb/newsfeatl.as?News Mode
Mojica, Florence E. 2003. The Improving Market for Packaged Food. Agri-Food Trade Service. http://www.ats.agr.gc.ca/asean/e3467.htm
National Statistical Coordination Board, various years. National Income Accounts Report. National Statistical Coordination Board. GDP at constant 1985 prices. National Statistics Office, 2002. Philippine Census of Agriculture.
National Statistics Office, various years. Foreign Trade Statistics of the Philippines. National Statistics Office. Harmonized System (HS) and the Philippine Standard
Commodity Classification (PSCC).
National Statistics Office. Lists of Establishments, 1999 and 2005. National Statistics Office, various years. Monthly Bulletin of Statistics. National Statistics Office. Family Income and Expenditure Survey (FIES), 1997, 2000.
Newman, Minerva BC., January 30, 2006. Cebu Emerges as Global Center for Carageenan. PIA Daily News Reader. Nilaratna Xuto. 2004. World Trade Organization, 2004 Conciliating a dispute on tuna exports to the EC www.wto.org/english/res_e bookshop
Pearl2 Project, 2004. State of the Sector Report on Philippine Processed Mango, 2004.

364
A project funded by the Canadian International Development Agency (CIDA). Antel 2000 Corporate Center, Makati City, Metro Manila, Philippines.
Philippine Tariff Commission. Tariff rates, various years. Philippine Tariff Commission. Tariff and Customs Code of the Philippines, 2004. PIA Daily News Reader, July 2007. Lead level contents may affect tuna export
industry). www.tariffcommission.gov.ph Pilat, D. Oct., Nov. 1996. From Competition to Growth. The OECD Observer.
Pido, M., E.M. et al. 2003. A backgrounder on Puerto Princesa City, Its SMEI Micro Enterprises and Seaweeds Industry in Palawan. Center for Strategic Policy and Governance. Palawan State University, Puerto Princesa City, Palawan www.tariffcommission.gov.ph Rab, Mohammed, et al, 2002. Socio-economics of Freshwater Fish in Asia. Reyes, Senen U., 2003. Wheating the Filipino Appetite. Agriculture and Agri-Food Canada. Market Information, Southeast Asia. Seaweed Industry Association of the Philippines n.d. Prospect and Perspective of the Seaweed Industry for Building Capacities to Cope with Globalization. A Powerpoint presentation. Select Philippines, 2005-2006. Cebu Philippines – Global processing Center for
Seaweed or Carageenan. Sonido, 2001. Philippines: Rural Food Processing. Food Development and Training
System, University of the Philippines, Diliman, Quezon City. Tuna: 10 selling leads, 22 Products, 72 Companies. www.alibaba.com/country search/PH-
suppliers/Tuna.html). USDA, 2002. Competition Intensifies in a Growing Philippine Wheat Market.
International Agricultural Trade Report. Vera, C. A. and Z. Hipolito. 2006. The Philippine Tuna Industry: A Profile. SAMUDRA Monograph. International Collective in Support of Fishworkers. ww.icsf.net
Yap, Jose T. 1999. Trade, Competitiveness and Finance in the Philippine Manufacturing Sector, 1980-1985. Discussion Series Paper No. = 99-12. Philipine Institute of Development Studies, 3rd Floor NEDA sa Makati Building, Makati City, Philippines.
www.eurofish.dk/index Sub.php. Fish INFOnetwork Market Report on Tuna.

365
8. APPENDICES Appendix 1. Companies included in the market performance analysis
Company Date No. of EmployeesNo. Registered (mgrs, officers) 1996 1997 1998 1999 2000 2001 2002 2003 2004 2005
Mango Processors1 Dec 2, 2002 SME SME SME2 Mar 4, 1981 ∗∗ ∗∗ SME SME SME ∗∗ SME SME SME3 ∗∗ ∗∗ SME SME SME SME ∗∗ SME SME4 ∗∗ SME SME SME SME SME SME SME SME5 Jan 1, 2001 ∗∗ SME SME ∗∗ SME SME SME SME ∗∗6 ∗∗ SME SME SME SME SME SME SME SME7 Jun 8, 1995 SME SME SME SME SME SME SME SME SME8 Jul 4, 1994 ∗∗ ∗∗ ∗∗ ∗∗ SME SME SME SME SME9 SME SME SME SME SME SME SME SME L10 L L L L L L L L L11 L L L L L L L L L12 ∗∗ L L L ∗∗ L L L L13 L L L L L L L L L
Tuna Canning Firms1 Dec 23, 2003 29 (5) SME SME2 80 (15) L L L SME SME SME SME SME SME3 Apr 23, 1984 1,986 (20) ∗∗ L L L L L L L L4 Sep 1, 2003 75 (19) L L5 Dec 31, 1990 79 (4) L L L L L L L L L6 ∗∗ ∗∗ ∗∗ ∗∗ L L L L L7 Dec 12, 1978 271 (34) L L L L L L L L ∗∗8 Mar 18, 1996 77 (14) ∗∗ L L L L L L L L9 Dec 26, 2000 82 (15) L L L L L
Seaweeds Processors/Carageenan Manufacturers1 9 (3) ∗∗ ∗∗ ∗∗ ∗∗ SME ∗∗ ∗∗ SME SME2 May 30, 1996 ∗∗ ∗∗ SME SME SME SME SME SME SME3 Sep 19, 1967 L SME L L SME SME SME SME SME4 86 (8) ∗∗ ∗∗ ∗∗ ∗∗ ∗∗ L L ∗∗ L5 Jan 10, 1966 L L L L L L L L L
Source : Securities and Exchange Commission (SEC)
∗∗ No report for the year.Year not included in the study.Year with report.
SME Small Medium EnterpriseL Large Enterprise
Year
not yet established
not yet established
not yet established
not yet established

366
continuation …..
Appendix 1. Companies included in the market performance analysis
Company Date No. of EmployeesNo. Registered (mgrs, officers) 1996 1997 1998 1999 2000 2001 2002 2003 2004 2005
Noodle Manufacturers1 SME SME SME SME SME SME SME SME SME SME2 Jul 4, 1994 ∗∗ ∗∗ ∗∗ ∗∗ ∗∗ SME SME SME SME SME3 Feb 4, 1997 SME ∗∗ SME SME SME SME SME4 Apr 27, 1966 SME SME SME SME SME SME SME SME SME SME5 Nov 1956 SME ∗∗ SME SME SME SME SME SME SME SME6 Aug 18, 1998 46 (8) ∗∗ ∗∗ SME SME SME SME SME SME SME SME7 Sep 28, 1954 L L L L L L L L L L8 May 23, 1979 (6) L ∗∗ L L L L L L L L
Soy Sauce Manufacturers1 SME SME SME SME SME SME SME2 Apr 15, 1982 SME SME SME SME SME ∗∗ SME3 Mar 10, 1980 ∗∗ SME SME SME SME SME SME4 Mar 21, 1972 SME SME SME SME SME SME ∗∗5 L L L L L L L6 Aug 18, 1953 L L L L L L L
Coconut Desiccating Firms1 Sep 27, 1999 ∗∗ ∗∗ ∗∗ ∗∗ SME L L L2 Feb 1, 1988 L L L L L L L L3 ∗∗ ∗∗ ∗∗ L L L L ∗∗4 Jul 10, 2002 192 (2) SME L L5 Apr 25, 1990 ∗∗ SME SME SME SME L SME L6 L L L L L L L L7 L L L L L L L L
Source : Securities and Exchange Commission (SEC)
∗∗ No report for the year.Year not included in the study.Year with report.
SME Small Medium EnterpriseL Large Enterprise
not yet established
not yet established
Year

367
Year Mangoes, Dried
Mangoes/ Edible Parts
Thereof, Prepared/ Preserved,
Nes
Mangoes, Prepared Or Preserved By
Vinegar Or Acetic Acid
Mango PureeMango Juice, Other Than
Concentrates
Mango, Uncooked/C
ooked By Steaming/ Boiling In
Water, Frozen
Mangoes, Drained, Glace/
Crystallized
Mango Juice Concentrates
Mango, In Brine, Sulphur Water/Other
Tempo Preservative, Unsuitable In
That State
TOTAL
1985 182 136 1 3201990 17 548 2 5661991 617 22 1 4,235 3,100 289 1 40 1 8,3061992 736 28 a/ 7,105 2,217 336 3 24 2 10,4511993 760 7 7,963 994 284 1 47 1 10,0571994 624 32 4,857 1,033 352 63 9 0 6,9711995 620 58 4,598 1,474 269 99 430 10 7,5581996 614 9 3,553 1,584 278 181 23 6,2421997 614 46 4,036 1,696 286 59 2,959 9,6951998 671 27 2,647 1,474 450 77 2 5,3461999 787 9 2,301 1,635 224 7 10 4,9722000 870 3 1,200 1,804 305 2 4,1842001 1,341 44 1,663 3,872 347 3 7,2712002 674 5 1,781 2,671 318 86 5,5352003 2,522 183 12,964 2,639 731 851 19,8912004 1,912 7 9,292 3,360 593 1,220 16,3842005 1,164 11 6,831 3,880 885 565 13,336
Source: NSO, various years. Foreign Trade Statistics of the Philippines.a/ - less than 1 MT
Appendix 2. Volume (MT) of processed mango exports, by type, Philippines 1985, 1990-2005
Year Mangoes, Dried
Mangoes/ Edible Parts
Thereof, Prepared/ Preserved,
Nes
Mangoes, Prepared Or Preserved By
Vinegar Or Acetic Acid
Mango PureeMango Juice, Other Than
Concentrates
Mango, Uncooked/C
ooked By Steaming/ Boiling In
Water, Frozen
Mangoes, Drained, Glace/
Crystallizd
Mango Juice Concentrates
Mango, In Brine, Sulphur Water/Other
Tempo Preservative, Unsuitable In
That State
TOTAL
1985 1,014 278 3 1,2951990 39 3,395 6 3,4401991 4,120 56 1 5,272 3,501 873 6 75 2 13,9051992 4,468 44 b/ 8,032 2,397 1,038 23 43 3 16,0481993 4,679 15 9,266 900 825 11 75 1 15,7721994 4,159 46 5,212 1,052 874 34 17 1 11,3951995 4,449 63 5,061 1,591 620 34 611 5 12,4331996 4,551 20 4,208 1,757 733 61 38 11,3691997 4,528 85 4,681 1,911 871 17 576 12,6681998 4,247 60 2,740 1,505 1,052 29 5 9,6381999 4,502 20 2,471 1,710 587 14 5 9,3102000 5,477 5 1,242 1,902 743 6 9,3742001 8,008 170 1,912 3,357 659 7 14,1132002 3,866 15 1,835 2,746 833 106 9,4012003 13,713 225 11,900 2,533 1,123 248 29,7422004 8,121 13 9,221 3,042 1,483 426 22,3062005 6,437 35 7,170 3,438 2,314 144 19,538
Source: NSO, various years. Foreign Trade Statistics of the Philippines.b/ - less than 1 thousand US$
Appendix 3. Value (FOB '000 US$) of processed mango exports, by type, Philippines 1985, 1990-2005

368
Appendix 5. Market structure of mango processing, Philippines, 1997-2005
Year Sample Herfindahl GiniSize, n CR2 CR3 CR4 Hirschman Index Coefficient
1997 5 91.2 98.5 99.5 6,313 0.671998 9 80.7 89.4 97.2 3,980 0.721999 11 77.9 89.4 95.1 3,455 0.742000 10 75.7 88.4 96.3 3,943 0.732001 11 89.4 96.2 97.4 4,856 0.812002 11 76.2 91.8 97.0 3,384 0.752003 12 80.3 88.7 96.7 4,059 0.782004 13 76.1 85.7 95.3 3,677 0.772005 11 70.6 83.5 95.5 3,648 0.72
Concentration Ratio
Year
Volume Value Volume Value Volume Value Volume Value Volume Value
198519901991 12 4 8 2 24 6 1992 14 5 20 5 1993 a/ b/ 11 5 a/ b/ 15 5 1994 2 3 9 12 a/ 4 27 19 1995 35 42 77 42 1996 23 29 1 2 55 31 1997 18 27 45 27 1998 18 24 4 4 49 27 1999 5 3 14 15 37 18 2000 23 18 41 18 2001 24 20 3 3 50 23 2002 2 2 11 6 20 7 2003 1 1 2 1 2004 21 17 a/ 1 39 18 2005 1 1 2 1 4 1
Source: NSO, various years. Foreign Trade Statistics of the Philippines.a/ - less than 1 MTb/ - less than 1 thousand US$
Appendix 4. Volume (MT) and value (CIF '000 US$) of processed mango imports, by type, Philippines, 1985, 1990-2005
Mango Juice Concentrates
Mango Juice, Other than Concentrates
Mangoes, Prepared/ Preserved By
Vinegar/ Acetic Acid
Mangoes/ Edible Parts Thereof,
Prepared/ Preserved, Nes
TOTAL

369
Appendix 6. Advertising expenses, annual total sales and advertising-sales ratio of mango processors/manufacturers, 1997-2005
Mango Processors/ Annual Total Sales AdvertisingManufacturers (S) Expenses (AD) Ads-Sales Ratio(Company No.) (AD/S)
20051 232,048 2 9,987,961 3 * * *4 13,978,998 5 ** ** **6 13,077,790 18,182 0.13907 27,161,180 57,807 0.21288 20,300,647 9 23,026,005 6,486 0.0282
10 290,934,951 608,511 0.209211 310,003,106 12 357,988,294 9,043,677 2.526213 1,347,041,983 12,233,557 0.9082
20041 2,417,809 21,269 0.87972 6,226,365 3 1,381,724 49,000 3.54634 4,505,957 5 7,036,916 6 13,671,324 846,992 6.19547 27,210,641 56,746 0.20858 22,522,228 9 27,557,176 7,053 0.0256
10 227,782,025 73,246 0.032211 230,249,622 12 495,833,115 19,754,221 3.984013 1,318,093,053 8,896,934 0.6750
20031 638,994 3,506 0.54872 603,684 3 ** ** **4 2,772,164 5 6,035,939 8,786 0.14566 6,182,483 86,765 1.40347 24,431,048 95,893 0.39258 22,908,098 20,662 0.09029 15,619,800
10 196,173,974 204,620 0.104311 203,560,881 12 524,057,202 17,143,724 3.271313 1,431,874,290 14,439,584 1.0084
* Incomplete records for the year. ** No report for the year.
(in Philippine Peso)

370
continuation..
Appendix 6. Advertising expenses, annual total sales and advertising-sales ratio of mango processors/manufacturers, 1997-2005
Mango Processors/ Annual Total Sales AdvertisingManufacturers (S) Expenses (AD) Ads-Sales Ratio(Company No.) (AD/S)
20021 ** ** **2 ** ** **3 329,730 4 1,443,590 5 3,534,078 6 3,212,952 7 22,458,039 8 18,305,395 113,141 0.61819 23,210,759 960 0.0041
10 127,245,583 105,880 0.083211 674,829,276 12 376,768,853 17,735,857 4.707413 1,170,525,869 22,622,200 1.9327
20011 ** ** **2 347,318 3 1,308,924 4 2,404,805 5 5,467,353 6 3,225,177 7 19,009,424 8 13,828,536 144,073 1.04199 21,364,075 700 0.0033
10 120,131,179 81,874 0.068211 435,813,040 12 ** ** **13 1,147,094,093 16,756,149 1.4607
20001 ** ** **2 410,354 3 5,452,518 145,521 2.66894 2,339,889 5 ** ** **6 2,147,461 7 17,745,297 8 ** ** **9 35,577,273 180,101 0.5062
10 136,758,563 231,427 0.169211 299,836,705 2,426,252 0.809212 219,608,992 13 1,011,994,207 7,806,375 0.7714
* Incomplete records for the year. ** No report for the year.
(in Philippine Peso)
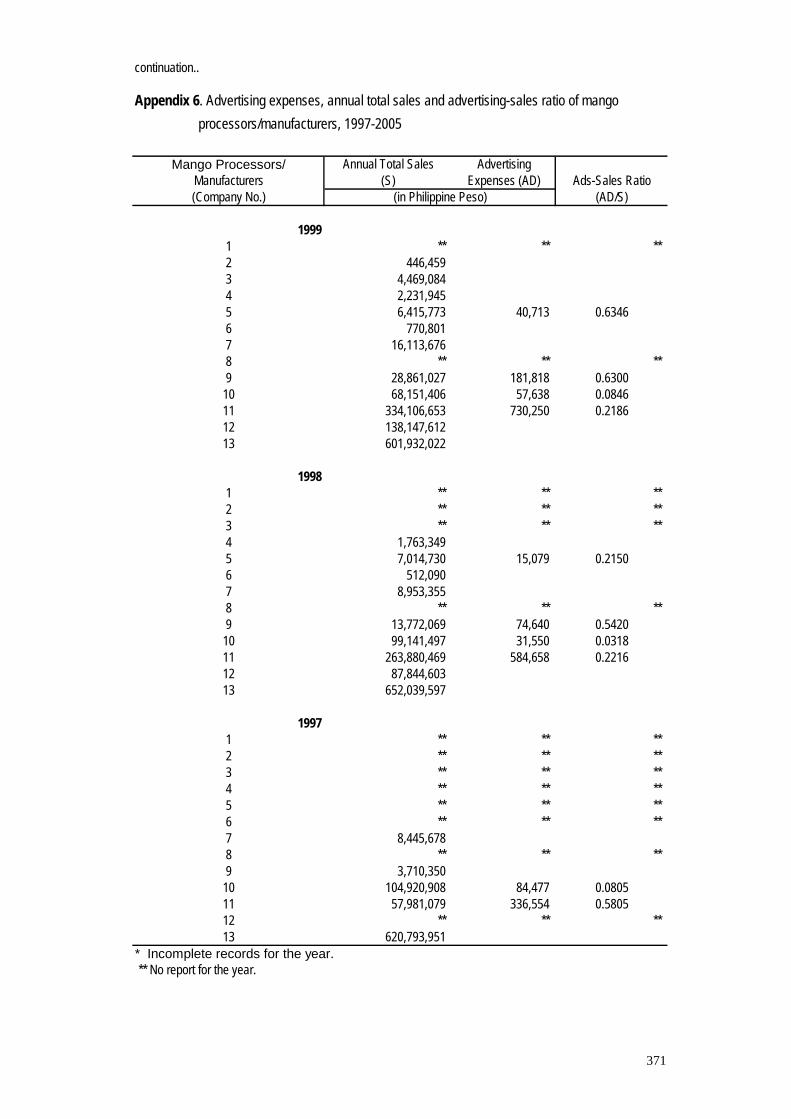
371
continuation..
Appendix 6. Advertising expenses, annual total sales and advertising-sales ratio of mango processors/manufacturers, 1997-2005
Mango Processors/ Annual Total Sales AdvertisingManufacturers (S) Expenses (AD) Ads-Sales Ratio(Company No.) (AD/S)
19991 ** ** **2 446,459 3 4,469,084 4 2,231,945 5 6,415,773 40,713 0.63466 770,801 7 16,113,676 8 ** ** **9 28,861,027 181,818 0.6300
10 68,151,406 57,638 0.084611 334,106,653 730,250 0.218612 138,147,612 13 601,932,022
19981 ** ** **2 ** ** **3 ** ** **4 1,763,349 5 7,014,730 15,079 0.21506 512,090 7 8,953,355 8 ** ** **9 13,772,069 74,640 0.5420
10 99,141,497 31,550 0.031811 263,880,469 584,658 0.221612 87,844,603 13 652,039,597
19971 ** ** **2 ** ** **3 ** ** **4 ** ** **5 ** ** **6 ** ** **7 8,445,678 8 ** ** **9 3,710,350
10 104,920,908 84,477 0.080511 57,981,079 336,554 0.580512 ** ** **13 620,793,951
* Incomplete records for the year. ** No report for the year.
(in Philippine Peso)

372
Appendix 7. Rates of return on asset after tax (ROA), on equity after tax (ROE) and on sales after tax (ROS) of mango processors/manufacturers, 1997-2005
NET TAX ON INTEREST TOTAL STOCKHOLDER'S TOTAL Rate of Return Rate of Return Rate of ReturnCompany No. PROFITS (P) PROFITS (T) PMENTS (I) ASSETS (A) EQUITY (E) SALES (S) on Asset (ROA) on Equity (ROE) on Sales (ROS)
(P - T + I) / (A) (P - T) / (E) (P - T) / (S)
20051 (259,745) 802,123 (962,885) 232,048 (32.38) (26.98) (111.94)2 62,348 22,377 2,765,328 (825,584) 9,987,961 1.45 (4.84) 0.403 (299,599) 7,022,280 (16,341,949) (4.27) (1.83) *4 499,097 162,207 2,593,973 (1,239,906) 13,978,998 12.99 (27.17) 2.415 ** ** ** ** ** ** ** ** **6 769,258 250,009 9,746,304 (5,556,824) 13,077,790 5.33 (9.34) 3.977 541,292 175,920 12,697,659 238,279 27,161,180 2.88 153.34 1.358 491,085 368,581 97,439 27,752,282 1,511,293 20,300,647 0.79 8.11 0.609 75,976 30,494 21,102 25,184,887 4,947,956 23,026,005 0.26 0.92 0.20
10 5,306,053 1,762,459 116,898 60,639,433 14,231,698 290,934,951 6.04 24.90 1.2211 99,534,456 10,706,201 1,494,533,467 774,274,778 310,003,106 5.94 11.47 28.6512 (114,726,820) (22,768,309) (22,600,307) 369,733,245 26,141,180 357,988,294 (30.98) (351.78) (25.69)13 90,660,661 69,284,027 4,488,993 1,175,918,499 146,724,507 1,347,041,983 2.20 14.57 1.59
20041 (166,929) 7,617 27,053 1,386,591 (703,141) 2,417,809 (10.64) (24.82) (7.22)2 32,901 19,207 1,673,827 (865,555) 6,226,365 0.82 (1.58) 0.223 (833,728) 16,839 6,673,646 (16,112,350) 1,381,724 (12.24) (5.17) (60.34)4 122,434 39,179 3,796,857 (1,576,797) 4,505,957 2.19 (5.28) 1.855 225,864 72,277 4,407,263 (11,520,803) 7,036,916 3.48 (1.33) 2.186 639,639 204,684 15,353,667 (6,076,073) 13,671,324 2.83 (7.16) 3.187 362,683 116,059 13,188,410 (127,093) 27,210,641 1.87 (194.05) 0.918 794,575 679,800 51,701 22,699,415 1,291,350 22,522,228 0.73 8.89 0.519 86,783 30,786 2,421 21,908,643 4,950,140 27,557,176 0.27 1.13 0.20
10 5,091,035 1,629,131 117,519 49,710,390 10,571,206 227,782,025 7.20 32.75 1.5211 36,410,925 2,950,359 1,227,371,032 624,389,638 230,249,622 2.73 5.36 14.5312 (969,518) 171,859 1,509,013 415,352,228 140,699,998 495,833,115 0.09 (0.81) (0.23)13 85,202,825 65,687,187 4,117,026 1,112,278,274 130,852,881 1,318,093,053 2.12 14.91 1.48
* Incomplete records for the year.** No record for the year.Note: ( ) losses in terms of net profit; deferred provision of income tax in terms of tax on profits; finance costs or charges in terms of interest payments; resulting from deficit retained earnings at end of the year in terms of stockholder's equity.
in Philippine Peso (PhP)

373
continuation …
Appendix 7. Rates of return on asset after tax (ROA), on equity after tax (ROE) and on sales after tax (ROS) of mango processors/manufacturers, 1997-2005
NET TAX ON INTEREST TOTAL STOCKHOLDER'S TOTAL Rate of Return Rate of Return Rate of ReturnCompany No. PROFITS (P) PROFITS (T) PMENTS (I) ASSETS (A) EQUITY (E) SALES (S) on Asset (ROA) on Equity (ROE) on Sales (ROS)
(P - T + I) / (A) (P - T) / (E) (P - T) / (S)
20031 (625,276) 400 5,028 1,421,290 (555,648) 638,994 (43.67) (112.60) (97.92)2 20,395 6,527 818,154 (879,249) 603,684 1.70 (1.58) 2.303 ** ** ** ** ** ** ** ** **4 90,816 29,061 2,890,043 (1,660,052) 2,772,164 2.14 (3.72) 2.235 367,003 117,441 3,602,597 (11,674,391) 6,035,939 6.93 (2.14) 4.136 359,125 114,920 8,311,699 (6,511,027) 6,182,483 2.94 (3.75) 3.957 1,483,586 1,209,735 11,802,121 (373,718) 24,431,048 2.32 (73.28) 1.128 612,802 375,130 55,752 22,000,879 1,124,875 22,908,098 1.33 21.13 1.049 68,681 21,978 5,553 12,562,615 3,216,721 15,619,800 0.42 1.45 0.30
10 2,525,054 808,017 194,300 41,738,566 6,991,783 196,173,974 4.58 24.56 0.8811 49,278,362 12,339,761 1,297,151,541 716,074,415 203,560,881 2.85 5.16 18.1512 15,000,692 757,804 (12,834,290) 342,862,669 66,047,004 524,057,202 0.41 21.56 2.7213 49,467,705 27,775,132 16,301,721 1,217,363,538 107,220,216 1,431,874,290 3.12 20.23 1.51
20021 ** ** ** ** ** ** ** ** **2 ** ** ** ** ** ** ** ** **3 (917,688) 293,660 329,730 * * (278.31)4 (90,886) 2,830,454 (1,721,807) 1,443,590 (3.21) (5.28) (6.30)5 4,448 4,224,894 (11,923,953) 3,534,078 0.11 (0.04) 0.136 (1,788,788) 6,968,038 6,755,232 3,212,952 (25.67) (26.48) (55.67)7 524,883 1,080,864 16,564,470 (647,569) 22,458,039 (3.36) (85.86) (2.48)8 196,091 65,256 25,678 10,299,852 831,452 18,305,395 1.52 15.74 0.719 95,540 31,145 13,011 17,112,899 2,289,466 23,210,759 0.45 2.81 0.28
10 1,827,195 584,702 136,478 34,704,032 5,080,447 127,245,583 3.97 24.46 0.9811 511,714,922 9,984,521 913,181,050 439,957,395 674,829,276 54.94 114.04 74.3512 15,556,465 973,615 (11,542,847) 274,119,723 64,638,406 376,768,853 1.11 22.56 3.8713 35,351,162 12,712,510 2,503,573 1,102,053,809 97,225,923 1,170,525,869 2.28 23.28 1.93
* Incomplete records for the year.** No record for the year.Note: ( ) losses in terms of net profit; deferred provision of income tax in terms of tax on profits; finance costs or charges in terms of interest payments; resulting from deficit retained earnings at end of the year in terms of stockholder's equity.
in Philippine Peso (PhP)

374
continuation …
Appendix 7. Rates of return on asset after tax (ROA), on equity after tax (ROE) and on sales after tax (ROS) of mango processors/manufacturers, 1997-2005
NET TAX ON INTEREST TOTAL STOCKHOLDER'S TOTAL Rate of Return Rate of Return Rate of ReturnCompany No. PROFITS (P) PROFITS (T) PMENTS (I) ASSETS (A) EQUITY (E) SALES (S) on Asset (ROA) on Equity (ROE) on Sales (ROS)
(P - T + I) / (A) (P - T) / (E) (P - T) / (S)
20011 ** ** ** ** ** ** ** ** **2 11,298 3,615 580,167 (901,733) 347,318 1.32 (0.85) 2.213 (3,483,206) 1,119,258 7,266,643 (11,466,306) 1,308,924 (32.53) (30.38) (266.11)4 39,272 12,506 2,321,339 (1,630,021) 2,404,805 1.15 (1.64) 1.115 (312,402) 5,531,846 (11,930,704) 5,467,353 (5.65) (2.62) (5.71)6 88,185 43,312 5,923,390 (4,966,445) 3,225,177 0.76 (0.90) 1.397 1,441,809 1,276,652 18,555,501 (159,238) 19,009,424 0.89 (103.72) 0.878 321,030 102,729 18,051 6,722,223 674,940 13,828,536 3.52 32.34 1.589 116,081 37,146 23,007 19,236,881 2,212,059 21,364,075 0.53 3.57 0.37
10 1,537,678 492,057 143,891 22,284,989 3,701,476 120,131,179 5.34 28.25 0.8711 248,585,193 20,221,543 2,115,254,644 948,786,228 435,813,040 10.80 24.07 52.4012 ** ** ** ** ** ** ** ** **13 23,978,102 2,981,124 992,021,248 73,319,749 1,147,094,093 2.12 28.64 1.83
20001 ** ** ** ** ** ** ** ** **2 27,699 8,864 501,221 909,415 410,354 3.76 2.07 4.593 (3,325,229) 1,066,682 10,113,254 (9,102,357) 5,452,518 (22.33) (36.53) (60.99)4 7,249 2,320 2,311,896 (1,657,688) 2,339,889 0.21 (0.30) 0.215 ** ** ** ** ** ** ** ** **6 (1,030,846) 5,803,533 (5,026,410) 2,147,461 (17.76) (20.51) (48.00)7 1,956,763 2,999,325 13,626,836 (524,395) 17,745,297 (7.65) (198.81) (5.88)8 ** ** ** ** ** ** ** ** **9 295,928 97,511 28,664 25,093,422 2,118,128 35,577,273 0.90 9.37 0.56
10 3,821,193 646,270 210,796 21,911,270 2,511,964 136,758,563 15.45 126.39 2.3211 149,355,281 1,361,482 1,348,446,265 712,323,265 299,836,705 10.98 20.78 49.3612 3,501,715 1,084,982 89,175 143,320,226 31,342,154 219,608,992 1.75 7.71 1.1013 29,467,816 4,278,881 834,675,465 44,822,771 1,011,994,207 3.02 56.20 2.49
* Incomplete records for the year.** No record for the year.Note: ( ) losses in terms of net profit; deferred provision of income tax in terms of tax on profits; finance costs or charges in terms of interest payments; resulting from deficit retained earnings at end of the year in terms of stockholder's equity.
in Philippine Peso (PhP)
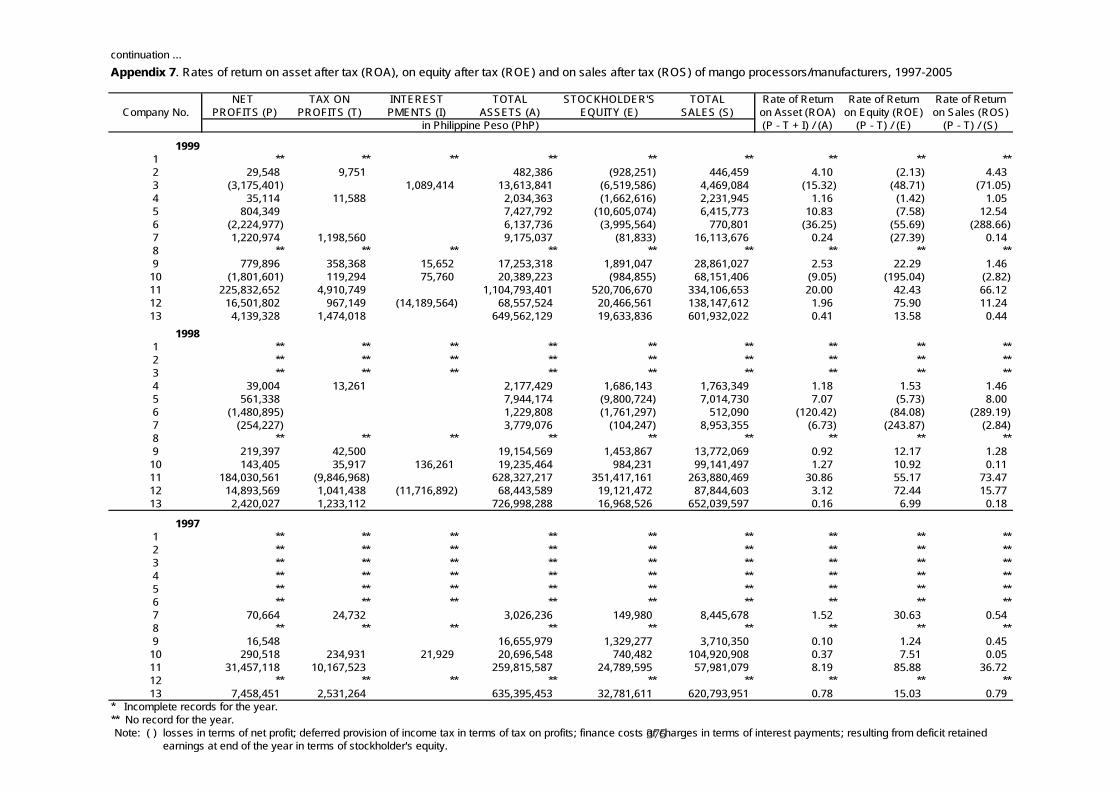
375
continuation …Appendix 7. Rates of return on asset after tax (ROA), on equity after tax (ROE) and on sales after tax (ROS) of mango processors/manufacturers, 1997-2005
NET TAX ON INTEREST TOTAL STOCKHOLDER'S TOTAL Rate of Return Rate of Return Rate of ReturnCompany No. PROFITS (P) PROFITS (T) PMENTS (I) ASSETS (A) EQUITY (E) SALES (S) on Asset (ROA) on Equity (ROE) on Sales (ROS)
(P - T + I) / (A) (P - T) / (E) (P - T) / (S)
19991 ** ** ** ** ** ** ** ** **2 29,548 9,751 482,386 (928,251) 446,459 4.10 (2.13) 4.433 (3,175,401) 1,089,414 13,613,841 (6,519,586) 4,469,084 (15.32) (48.71) (71.05)4 35,114 11,588 2,034,363 (1,662,616) 2,231,945 1.16 (1.42) 1.055 804,349 7,427,792 (10,605,074) 6,415,773 10.83 (7.58) 12.546 (2,224,977) 6,137,736 (3,995,564) 770,801 (36.25) (55.69) (288.66)7 1,220,974 1,198,560 9,175,037 (81,833) 16,113,676 0.24 (27.39) 0.148 ** ** ** ** ** ** ** ** **9 779,896 358,368 15,652 17,253,318 1,891,047 28,861,027 2.53 22.29 1.46
10 (1,801,601) 119,294 75,760 20,389,223 (984,855) 68,151,406 (9.05) (195.04) (2.82)11 225,832,652 4,910,749 1,104,793,401 520,706,670 334,106,653 20.00 42.43 66.1212 16,501,802 967,149 (14,189,564) 68,557,524 20,466,561 138,147,612 1.96 75.90 11.2413 4,139,328 1,474,018 649,562,129 19,633,836 601,932,022 0.41 13.58 0.44
19981 ** ** ** ** ** ** ** ** **2 ** ** ** ** ** ** ** ** **3 ** ** ** ** ** ** ** ** **4 39,004 13,261 2,177,429 1,686,143 1,763,349 1.18 1.53 1.465 561,338 7,944,174 (9,800,724) 7,014,730 7.07 (5.73) 8.006 (1,480,895) 1,229,808 (1,761,297) 512,090 (120.42) (84.08) (289.19)7 (254,227) 3,779,076 (104,247) 8,953,355 (6.73) (243.87) (2.84)8 ** ** ** ** ** ** ** ** **9 219,397 42,500 19,154,569 1,453,867 13,772,069 0.92 12.17 1.28
10 143,405 35,917 136,261 19,235,464 984,231 99,141,497 1.27 10.92 0.1111 184,030,561 (9,846,968) 628,327,217 351,417,161 263,880,469 30.86 55.17 73.4712 14,893,569 1,041,438 (11,716,892) 68,443,589 19,121,472 87,844,603 3.12 72.44 15.7713 2,420,027 1,233,112 726,998,288 16,968,526 652,039,597 0.16 6.99 0.18
19971 ** ** ** ** ** ** ** ** **2 ** ** ** ** ** ** ** ** **3 ** ** ** ** ** ** ** ** **4 ** ** ** ** ** ** ** ** **5 ** ** ** ** ** ** ** ** **6 ** ** ** ** ** ** ** ** **7 70,664 24,732 3,026,236 149,980 8,445,678 1.52 30.63 0.548 ** ** ** ** ** ** ** ** **9 16,548 16,655,979 1,329,277 3,710,350 0.10 1.24 0.45
10 290,518 234,931 21,929 20,696,548 740,482 104,920,908 0.37 7.51 0.0511 31,457,118 10,167,523 259,815,587 24,789,595 57,981,079 8.19 85.88 36.7212 ** ** ** ** ** ** ** ** **13 7,458,451 2,531,264 635,395,453 32,781,611 620,793,951 0.78 15.03 0.79
* Incomplete records for the year.** No record for the year.Note: ( ) losses in terms of net profit; deferred provision of income tax in terms of tax on profits; finance costs or charges in terms of interest payments; resulting from deficit retained earnings at end of the year in terms of stockholder's equity.
in Philippine Peso (PhP)

376
Appendix 8. Volume (MT) and value (FOB '000 US$) of processed tuna exports by type, Philippines, 1985, 1990-2005
YearQuantity FOB Value Quantity FOB Value Quantity FOB Value
1985 25,467 47,096 25,467 47,0961990 44,696 95,181 44,696 95,1811991 46,120 104,472 46,120 104,4721992 47,043 94,271 47,043 94,2711993 55,489 121,455 55,489 121,4551994 58,075 138,850 58,034 138,802 41 481995 46,738 111,118 46,738 111,1181996 58,358 130,798 58,358 130,7981997 56,164 134,332 56,164 134,3321998 53,120 130,121 53,120 130,1211999 36,938 78,429 36,857 78,113 81 3162000 36,723 65,392 36,458 64,493 265 8992001 34,156 69,580 33,909 68,803 246 7782002 48,286 93,641 48,070 93,251 215 3912003 56,903 111,836 56,854 111,752 48 842004 53,896 114,130 53,873 114,056 23 742005 30,689 65,449 30,689 65,449
Source: NSO, various years. Foreign Trade Statistics of the Philippines.
* Canned Tuna includes Eastern little tuna (bonito), salted but not dried or smoked and in brine (PSCC 0352908);Tuna, salted but not dried or smoked and in brine (PSCC 0352911); Tuna, whole or in pieces, not minced
(PSCC 0371301); and Skipjack and atlantic bonito, whole or in pieces, not minced (PSCC 0371302)
** Dried Smoked Tuna includes Eastern little tuna (bonito), dried whether or not salted (PSCC 0351311); Tunadried, whether or not salted (PSCC 0351312); and Eastern little tuna (bonito), smoked, whether or not cooked before or during the smoking process (PSCC 0353011)
PROCESSED TUNATOTAL Canned Tuna* Dried Smoked Tuna**

377
Appendix 10. Market structure of tuna canning, Philippines, 1997-2005
Year Sample Herfindahl GiniSize, n CR2 CR3 CR4 Hirschman Index Coefficient
1997 3 83.2 4,223.9 0.271998 5 58.8 74.6 2,526.5 0.251999 5 61.8 75.2 2,423.9 0.242000 5 58.5 77.0 2,326.2 0.222001 7 43.0 61.2 77.2 1,714.1 0.252002 7 43.7 59.1 72.3 1,645.2 0.222003 7 49.8 66.0 79.3 1,911.2 0.332004 9 38.4 52.4 64.1 1,442.3 0.292005 8 46.5 59.4 71.6 1,759.7 0.33
Concentration Ratio
Appendix 9. Volume (MT) and value (CIF '000 US$) of processed tuna imports by type, Philippines, 1985, 1990-2005
YearQuantity CIF Value Quantity CIF Value Quantity CIF Value
1985 15 36 15 361990 23 23 23 231991 15 18 15 181992 36 52 36 521993 11 50 10 36 1 141994 101 295 100 277 2 181995 47 128 46 123 1 51996 122 206 122 2061997 49 88 49 881998 59 41 59 411999 26 131 26 1312000 65 72 65 722001 214 236 214 235 a/ 12002 286 153 286 1532003 53 81 53 812004 47 179 47 1792005 100 236 100 236
Source: NSO, various years. Foreign Trade Statistics of the Philippines.a/ - less than 1 MT
* Canned Tuna includes Eastern little tuna (bonito), salted but not dried or smoked and in brine (PSCC 0352908); Tuna, salted but not dried or smoked and in brine (PSCC 0352911); Tuna, whole or in pieces, not minced
(PSCC 0371301); and Skipjack and atlantic bonito, whole or in pieces, not minced (PSCC 0371302)
** Dried Smoked Tuna includes Eastern little tuna (bonito), dried whether or not salted (PSCC 0351311); Tunadried, whether or not salted (PSCC 0351312); and Eastern little tuna (bonito), smoked, whether or not cooked before or during the smoking process (PSCC 0353011)
Canned Tuna* Dried Smoked Tuna**PROCESSED TUNA
TOTAL
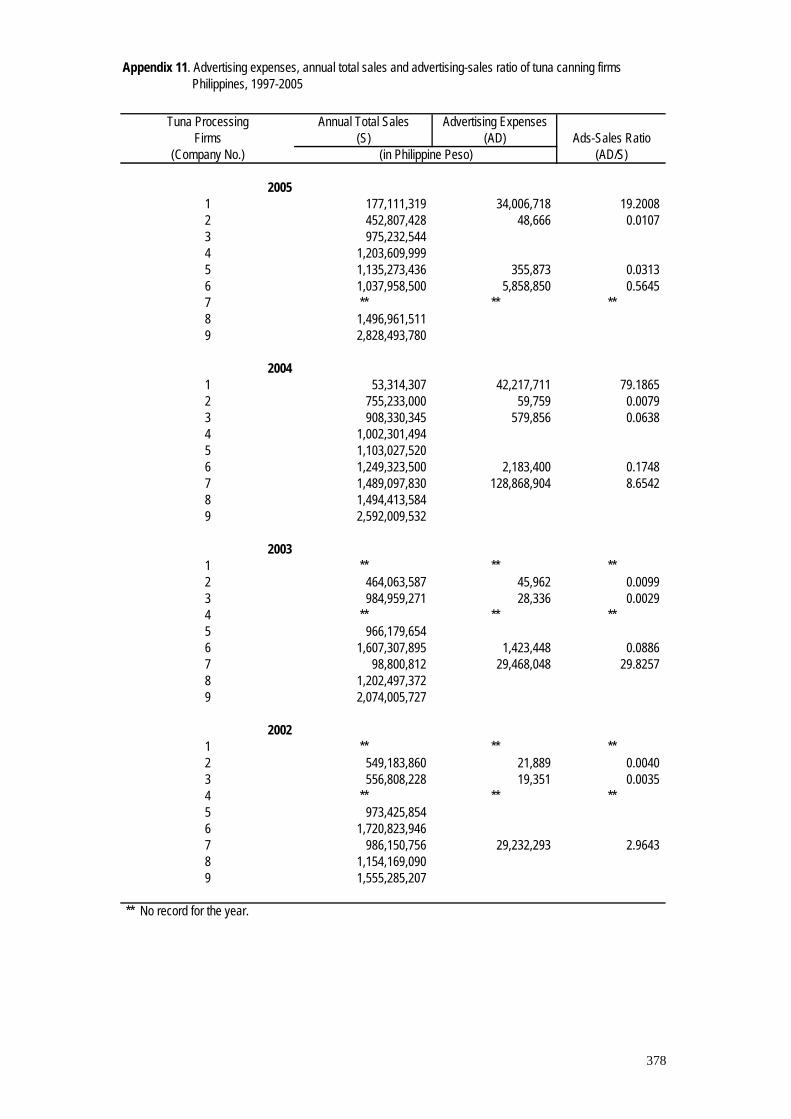
378
Appendix 11. Advertising expenses, annual total sales and advertising-sales ratio of tuna canning firms Philippines, 1997-2005
Tuna Processing Annual Total Sales Advertising ExpensesFirms (S) (AD) Ads-Sales Ratio
(Company No.) (AD/S)
20051 177,111,319 34,006,718 19.2008 2 452,807,428 48,666 0.0107 3 975,232,544 4 1,203,609,999 5 1,135,273,436 355,873 0.0313 6 1,037,958,500 5,858,850 0.5645 7 ** ** **8 1,496,961,511 9 2,828,493,780
20041 53,314,307 42,217,711 79.1865 2 755,233,000 59,759 0.0079 3 908,330,345 579,856 0.0638 4 1,002,301,494 5 1,103,027,520 6 1,249,323,500 2,183,400 0.1748 7 1,489,097,830 128,868,904 8.6542 8 1,494,413,584 9 2,592,009,532
20031 ** ** **2 464,063,587 45,962 0.0099 3 984,959,271 28,336 0.0029 4 ** ** **5 966,179,654 6 1,607,307,895 1,423,448 0.0886 7 98,800,812 29,468,048 29.8257 8 1,202,497,372 9 2,074,005,727
20021 ** ** **2 549,183,860 21,889 0.0040 3 556,808,228 19,351 0.0035 4 ** ** **5 973,425,854 6 1,720,823,946 7 986,150,756 29,232,293 2.9643 8 1,154,169,090 9 1,555,285,207
** No record for the year.
(in Philippine Peso)

379
continuation …
Appendix 11. Advertising expenses, annual total sales and advertising-sales ratio of tuna canning firms Philippines, 1997-2005
Tuna Processing Annual Total Sales Advertising ExpensesFirms (S) (AD) Ads-Sales Ratio
(Company No.) (AD/S)
20011 ** ** **2 427,939,871 21,245 0.0050 3 397,323,814 111,717 0.0281 4 ** ** **5 706,799,000 - 6 182,647,949 7 846,923,409 22,297,267 2.6327 8 1,053,458,701 9 803,899,647
20001 ** ** **2 319,198,202 12,930 0.0041 3 296,638,265 106,830 0.0360 4 ** ** **5 497,555,000 - 6 ** ** **7 836,292,790 18,499,429 2.2121 8 733,051,986 9 ** ** **
19991 ** ** **2 423,252,464 26,094 0.0062 3 379,034,483 653,589 0.1724 4 ** ** **5 401,775,629 - 6 ** ** **7 1,089,080,767 26,100,981 2.3966 8 860,049,061 9 ** ** **
** No record for the year.
(in Philippine Peso)

380
continuation …
Appendix 11. Advertising expenses, annual total sales and advertising-sales ratio of tuna canning firms Philippines, 1997-2005
Tuna Processing Annual Total Sales Advertising ExpensesFirms (S) (AD) Ads-Sales Ratio
(Company No.) (AD/S)
19981 ** ** **2 730,615,604 28,445 0.0039 3 653,636,331 374,543 0.0573 4 ** ** **5 520,327,584 - 6 ** ** **7 1,846,181,485 28,284,744 1.5321 8 874,577,004 9 ** ** **
19971 ** ** **2 633,414,536 204,167 0.0322 3 ** ** **4 ** ** **5 407,638,649 6 ** ** **7 1,385,674,783 47,856,359 3.4537 8 ** ** **9 ** ** **
** No record for the year.
(in Philippine Peso)

381
Appendix 12. Rates of return on asset after tax (ROA), on equity after tax (ROE) and on sales after tax (ROS) of tuna canning firms, Philippines, 1997-2005
NET TAX ON INTEREST TOTAL STOCKHOLDER'S TOTAL Rate of Return Rate of Return Rate of ReturnCompany No. PROFITS (P) PROFITS (T) PMENTS (I) ASSETS (A) EQUITY (E) SALES (S) on Asset (ROA) on Equity (ROE) on Sales (ROS)
(P - T + I) / (A) (P - T) / (E) (P - T) / (S)
20051 (20,378,032) (171,365) 87,638,264 (1,871,786) 177,111,319 (23.45) (1088.69) (11.51)2 10,318,536 9,396,748 74,042 92,969,875 45,444,562 452,807,428 1.07 2.03 0.203 7,228,845 819,619 (5,138,285) 403,764,308 119,543,340 975,232,544 0.31 5.36 0.664 51,583,094 (58,294) 3,679,939 475,397,066 315,657,149 1,203,609,999 11.64 16.36 4.295 (8,013,983) 3,591,666 16,442,640 421,834,430 125,262,764 1,135,273,436 1.15 (9.27) (1.02)6 147,082,850 3,132,500 210,131,050 (99,266,700) 1,037,958,500 71.49 (148.17) 14.177 ** ** ** ** ** ** ** ** **8 40,788,008 1,474,324 (38,583,464) 728,033,049 70,780,521 1,496,961,511 0.10 55.54 2.639 63,621,251 64,201,343 1,324,852 1,043,987,989 405,649,810 2,828,493,780 0.07 (0.14) (0.02)
20041 (68,387,016) 74,564,627 54,438,958 18,677,611 53,314,307 11.35 (366.14) (128.27)2 4,933,597 1,578,751 89,649,543 45,379,644 755,233,000 3.74 7.39 0.443 9,330,859 1,515,470 (4,595,015) 428,299,610 118,329,250 908,330,345 0.75 6.60 0.864 71,790,165 9,202,436 (5,263,178) 382,712,297 260,324,551 1,002,301,494 14.98 24.04 6.245 (18,663,073) 3,792,280 32,755,287 404,594,791 120,425,773 1,103,027,520 2.55 (18.65) (2.04)6 51,904,900 313,764,800 (50,948,650) 1,249,323,500 16.54 (101.88) 4.157 90,738,906 56,446,240 1,759,932,392 861,485,433 1,489,097,830 1.95 3.98 2.308 35,089,494 1,197,465 (31,252,120) 562,073,065 70,050,303 1,494,413,584 0.47 48.38 2.279 102,312,254 36,392,941 5,996,293 638,369,484 404,905,050 2,592,009,532 11.27 16.28 2.54
20031 ** ** ** ** ** ** ** ** **2 4,001,145 1,280,366 84,603,725 42,972,886 464,063,587 3.22 6.33 0.593 10,086,554 1,242,189 (6,082,188) 222,782,638 115,148,121 984,959,271 1.24 7.68 0.904 ** ** ** ** ** ** ** ** **5 9,831,630 (2,057,395) 386,444,883 110,125,841 966,179,654 2.01 8.93 1.026 (14,033,088) (7,475,349) 300,317,165 98,008,806 1,607,307,895 (7.16) (14.32) (0.87)7 79,959,202 57,239,387 1,621,369,741 799,745,877 98,800,812 1.40 2.84 23.008 27,374,655 (24,498,427) 268,154,428 69,740,240 1,202,497,372 1.07 39.25 2.289 94,963,299 23,713,597 451,973 591,849,664 182,989,444 2,074,005,727 12.11 38.94 3.44
** No record for the year.Note: ( ) losses in terms of net profit; deferred provision of income tax in terms of tax on profits; finance costs or charges in terms of interest payments; resulting from deficit retained earnings at end of the year in terms of stockholder's equity.
in Philippine Peso (PhP)

382
continuation…
Appendix 12. Rates of return on asset after tax (ROA), on equity after tax (ROE) and on sales after tax (ROS) of tuna canning firms, Philippines, 1997-2005
NET TAX ON INTEREST TOTAL STOCKHOLDER'S TOTAL Rate of Return Rate of Return Rate of ReturnCompany No. PROFITS (P) PROFITS (T) PMENTS (I) ASSETS (A) EQUITY (E) SALES (S) on Asset (ROA) on Equity (ROE) on Sales (ROS)
(P - T + I) / (A) (P - T) / (E) (P - T) / (S)
20021 ** ** ** ** ** ** ** ** **2 5,206,687 1,666,140 81,986,380 42,078,561 549,183,860 4.32 8.41 0.643 6,706,965 1,094,394 (3,204,648) 287,056,781 112,432,588 556,808,228 0.84 4.99 1.014 ** ** ** ** ** ** ** ** **5 29,257,208 965,125 31,611,604 435,469,500 102,814,243 973,425,854 13.76 27.52 2.916 14,047,840 1,087,191 (7,951,568) 281,023,578 108,642,243 1,720,823,946 1.78 11.93 0.757 83,065,741 59,721,029 1,724,639,204 777,026,062 986,150,756 1.35 3.00 2.378 20,339,485 (18,102,256) 256,957,537 66,864,012 1,154,169,090 0.87 30.42 1.769 (3,438,997) 12,252,092 5,632,298 501,226,470 80,639,769 1,555,285,207 (2.01) (19.46) (1.01)
20011 ** ** ** ** ** ** ** ** **2 3,654,564 1,169,460 84,090,366 38,551,655 427,939,871 2.96 6.45 0.583 20,505,991 771,472 (17,933,371) 264,168,406 110,055,953 397,323,814 0.68 17.93 4.974 ** ** ** ** ** ** ** ** **5 101,649,000 1,717,000 352,888,000 42,910,000 706,799,000 28.32 232.89 14.146 2,011,845 59,707 (1,871,759) 252,035,064 115,078,696 182,647,949 0.03 1.70 1.077 70,103,421 53,333,941 1,814,472,483 753,681,350 846,923,409 0.92 2.23 1.988 25,495,634 20,501,794 114,253 252,590,891 64,626,783 1,053,458,701 2.02 7.73 0.479 23,409,316 4,663,289 2,600,533 200,868,559 36,346,560 803,899,647 10.63 51.58 2.33
20001 ** ** ** ** ** ** ** ** **2 702,389 224,764 96,302,868 36,066,551 319,198,202 0.50 1.32 0.153 29,100,135 82,624 (28,750,293) 320,384,682 58,999,177 296,638,265 0.08 49.18 9.784 ** ** ** ** ** ** ** ** **5 47,843,000 21,175,000 278,598,000 (67,021,000) 497,555,000 9.57 (39.79) 5.366 ** ** ** ** ** ** ** ** **7 73,097,327 3,602,976 (55,063,423) 1,764,297,593 736,911,870 836,292,790 0.82 9.43 8.318 24,875,833 22,848,951 1,465,100 286,610,449 59,518,690 733,051,986 1.22 3.41 0.289 ** ** ** ** ** ** ** ** **
** No record for the year.Note: ( ) losses in terms of net profit; deferred provision of income tax in terms of tax on profits; finance costs or charges in terms of interest payments; resulting from deficit retained earnings at end of the year in terms of stockholder's equity.
in Philippine Peso (PhP)

383
continuation…
Appendix 12. Rates of return on asset after tax (ROA), on equity after tax (ROE) and on sales after tax (ROS) of tuna canning firms, Philippines, 1997-2005
NET TAX ON INTEREST TOTAL STOCKHOLDER'S TOTAL Rate of Return Rate of Return Rate of ReturnCompany No. PROFITS (P) PROFITS (T) PMENTS (I) ASSETS (A) EQUITY (E) SALES (S) on Asset (ROA) on Equity (ROE) on Sales (ROS)
(P - T + I) / (A) (P - T) / (E) (P - T) / (S)
19991 ** ** ** ** ** ** ** ** **2 4,038,919 1,332,843 118,144,714 35,588,926 423,252,464 2.29 7.60 0.643 27,104,258 885,430 (24,289,439) 340,913,407 58,854,616 379,034,483 0.57 44.55 6.924 ** ** ** ** ** ** ** ** **5 (6,870,429) 5,750,384 (38,011,079) 277,608,265 1,996,964 401,775,629 (18.24) (632.00) (3.14)6 ** ** ** ** ** ** ** ** **7 98,630,141 6,283,065 (78,576,374) 1,844,586,110 722,480,942 1,089,080,767 0.75 12.78 8.488 25,630,755 24,397,558 334,725 268,539,518 56,026,708 860,049,061 0.58 2.20 0.149 ** ** ** ** ** ** ** ** **
19981 ** ** ** ** ** ** ** ** **2 1,792,267 609,371 106,671,757 32,882,850 730,615,604 1.11 3.60 0.163 32,901,866 268,224 (31,921,612) 321,434,543 56,889,732 653,636,331 0.22 57.36 4.994 ** ** ** ** ** ** ** ** **5 11,455,702 1,473,555 20,646,884 362,856,010 52,388,856 520,327,584 8.44 19.05 1.926 ** ** ** ** ** ** ** ** **7 145,036,032 8,126,353 (62,897,103) 1,959,512,856 708,710,239 1,846,181,485 3.78 19.32 7.428 29,134,224 27,028,865 274,125 217,975,474 54,458,786 874,577,004 1.09 3.87 0.249 ** ** ** ** ** ** ** ** **
19971 ** ** ** ** ** ** ** ** **2 1,384,907 484,718 146,773,595 31,699,954 633,414,536 0.61 2.84 0.143 ** ** ** ** ** ** ** ** **4 ** ** ** ** ** ** ** ** **5 2,678,636 (30,477,634) (80,376,487) 326,711,183 21,759,825 407,638,649 (14.45) 152.37 8.136 ** ** ** ** ** ** ** ** **7 90,581,257 6,767,523 (71,165,318) 1,932,477,964 604,697,663 1,385,674,783 0.65 13.86 6.058 ** ** ** ** ** ** ** ** **9 ** ** ** ** ** ** ** ** **
** No record for the year.Note: ( ) losses in terms of net profit; deferred provision of income tax in terms of tax on profits; finance costs or charges in terms of interest payments; resulting from deficit retained earnings at end of the year in terms of stockholder's equity.
in Philippine Peso (PhP)

384
Appendix 13. Volume (MT) and value (FOB '000 US$) of seaweeds/carageenanexports, Philippines, 1985, 1990-2005
Year 1/
Quantity FOB Value Quantity FOB Value
1985* 23,749 19,699 23,749 19,6991990* 35,346 49,883 35,346 49,8831991** 26,830 21,242 2 101992** 20,529 18,550 a/ b/1993** 21,668 18,141 6 161994 23,613 22,109 56 1261995 37,579 82,826 8,658 43,7211996 36,786 94,071 10,372 52,0781997 40,348 94,937 12,686 61,5441998 34,463 64,707 7,741 34,0301999 41,050 86,283 8,739 42,2382000 56,086 84,868 7,703 38,3542001 40,231 71,164 8,670 38,6612002 39,162 72,368 8,098 38,5082003 41,313 80,504 10,213 47,3702004 44,262 89,893 12,081 54,0752005 30,813 71,905 9,548 43,649
Source: NSO, various years. Foreign Trade Statistics of the Philippines.a/ - less than 1 MTb/ - less than 1 thousand US$
* 1985 & 1990 trade statistics on seaweeds/carageenan in accordance with 1977 PSCCwere classified under the vegetable materials and vegetable products, nes with productdescription as SEAWEEDS, DRIED
** 1991 to 1993 trade statistics on seaweeds/carageenan in accordance with 1989 PSCCwere classified under the vegetable materials and vegetable products, nes with productdescription as SEAWEEDS AND OTHER ALGAE, FRESH, CHILLED, FROZEN ORDRIED W/ OR NOT GROUND, OF A KIND USED FOR HUMAN
1/ 1994 to current trade statistics on seaweeds/carageenan (processed) in accordance with the 1993 PSCC were classified under processed vegetables (dried vegetables) with productdescription SEAWEEDS AND ALGAE, USED FOR FOODS
Processed Seaweeds/CarageenanTotal Carageenan/Seaweeds

385
Appendix 15. Market structure of seaweeds processors, Philippines, 1997-2005
Year Sample Herfindahl GiniSize, n CR1 CR2 CR3 Hirschman Index Coefficient
1997 2 85.5 7,519.6 0.361998 2 81.0 6,917.9 0.311999 3 76.7 92.5 6,190.0 0.462000 3 69.7 86.9 5,326.5 0.382001 4 70.5 91.7 5,484.1 0.562002 4 52.4 77.1 3,645.2 0.362003 4 55.8 80.7 3,941.9 0.402004 4 61.8 82.0 4,384.0 0.422005 5 59.0 79.9 96.2 4,193.1 0.54
Concentration Ratio
Appendix 14. Volume (MT) and value (CIF '000 US$) of seaweeds/carageenan imports,Philippines, 1985, 1990-2005
Year 1/
Quantity CIF Value Quantity CIF Value
1985* a/ b/ a/ b/1990* 3,388 58 3,388 581991** 143 211992** 3 10 1 11993** 627 135 4 201994 1,505 1,309 21 321995 470 460 19 1341996 1,063 1,019 100 1951997 1,954 2,499 151 8871998 1,211 1,105 763 7471999 1,975 2,873 680 1,8382000 1,746 4,107 349 2,7292001 3,705 5,536 908 3,4472002 2,768 4,856 601 3,1002003 6,275 8,206 767 4,4842004 5,879 8,554 577 3,8042005 10,245 14,329 679 6,552
Source: NSO, various years. Foreign Trade Statistics of the Philippines.a/ - less than 1 MTb/ - less than 1 thousand US$
* 1985 & 1990 trade statistics on seaweeds/carageenan in accordance with 1977 PSCCwere classified under the vegetable materials and vegetable products, nes with productdescription as SEAWEEDS, DRIED
** 1991 to 1993 trade statistics on seaweeds/carageenan in accordance with 1989 PSCCwere classified under the vegetable materials and vegetable products, nes with productdescription as SEAWEEDS AND OTHER ALGAE, FRESH, CHILLED, FROZEN ORDRIED W/ OR NOT GROUND, OF A KIND USED FOR HUMAN
1/ 1994 to current trade statistics on seaweeds/carageenan (processed) in accordance with the 1993 PSCC were classified under processed vegetables (dried vegetables) with productdescription SEAWEEDS AND ALGAE, USED FOR FOODS
Processed Seaweeds/CarageenanTotal Seaweeds/Carageenan

386
Appendix 16. Advertising expenses, annual total sales and advertising-sales ratio of seaweeds/carageenan processorsmanufacturers, Philippines, 1997-2005
Seaweeds/Carageenan Annual Total Sales Advertising ExpensesProcessors/Manufacturers (S) (AD) Ads-Sales Ratio
(Company No.) (AD/S)
20051 1,695,534 2 57,628,865 3 251,234,484 4 322,216,841 458,441 0.14235 909,335,200
20041 129,736,322 2 129,736,322 3 290,724,231 4 ** ** **5 888,124,050
20031 ** ** **2 95,868,681 3 205,013,811 4 387,707,233 1,096,347 0.28285 868,279,367
20021 ** ** **2 101,153,874 3 199,891,387 4 323,979,232 1,572,357 0.48535 687,861,702
20011 177,815 2 97,946,348 3 251,730,645 4 ** ** **5 834,219,023
* Incomplete records for the year.** No record for the year.
(in Philippine Peso)

387
continuation…
Appendix 16. Advertising expenses, annual total sales and advertising-sales ratio of seaweeds/carageenan processorsmanufacturers, Philippines, 1997-2005
Seaweeds/Carageenan Annual Total Sales Advertising ExpensesProcessors/Manufacturers (S) (AD) Ads-Sales Ratio
(Company No.) (AD/S)
20001 ** ** **2 145,062,598 3 190,290,024 4 ** ** **5 771,772,713
19991 ** ** **2 100,226,768 3 210,917,359 4 ** ** **5 1,024,809,415
19981 ** ** **2 ** ** **3 124,309,984 4 ** **5 528,805,359
19971 ** **2 ** **3 59,478,384 4 ** **5 350,531,307
* Incomplete records for the year.** No record for the year.
(in Philippine Peso)
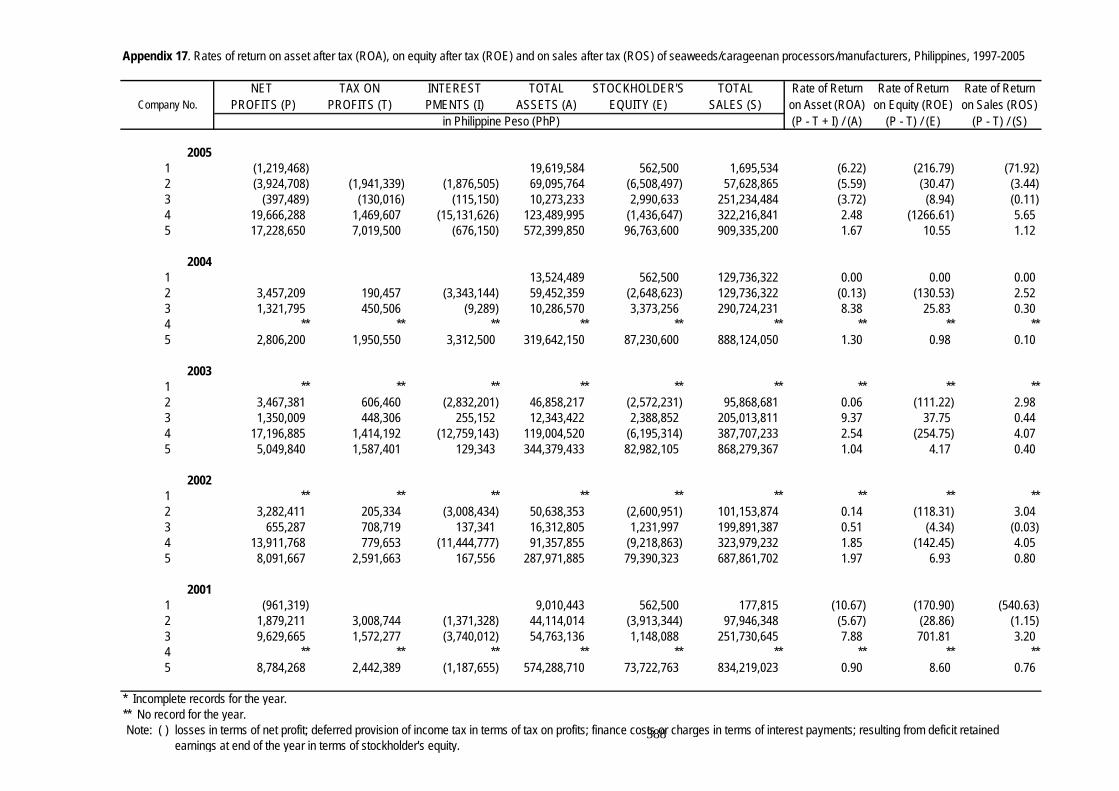
388
Appendix 17. Rates of return on asset after tax (ROA), on equity after tax (ROE) and on sales after tax (ROS) of seaweeds/carageenan processors/manufacturers, Philippines, 1997-2005
NET TAX ON INTEREST TOTAL STOCKHOLDER'S TOTAL Rate of Return Rate of Return Rate of ReturnCompany No. PROFITS (P) PROFITS (T) PMENTS (I) ASSETS (A) EQUITY (E) SALES (S) on Asset (ROA) on Equity (ROE) on Sales (ROS)
(P - T + I) / (A) (P - T) / (E) (P - T) / (S)
20051 (1,219,468) 19,619,584 562,500 1,695,534 (6.22) (216.79) (71.92)2 (3,924,708) (1,941,339) (1,876,505) 69,095,764 (6,508,497) 57,628,865 (5.59) (30.47) (3.44)3 (397,489) (130,016) (115,150) 10,273,233 2,990,633 251,234,484 (3.72) (8.94) (0.11)4 19,666,288 1,469,607 (15,131,626) 123,489,995 (1,436,647) 322,216,841 2.48 (1266.61) 5.655 17,228,650 7,019,500 (676,150) 572,399,850 96,763,600 909,335,200 1.67 10.55 1.12
20041 13,524,489 562,500 129,736,322 0.00 0.00 0.002 3,457,209 190,457 (3,343,144) 59,452,359 (2,648,623) 129,736,322 (0.13) (130.53) 2.523 1,321,795 450,506 (9,289) 10,286,570 3,373,256 290,724,231 8.38 25.83 0.304 ** ** ** ** ** ** ** ** **5 2,806,200 1,950,550 3,312,500 319,642,150 87,230,600 888,124,050 1.30 0.98 0.10
20031 ** ** ** ** ** ** ** ** **2 3,467,381 606,460 (2,832,201) 46,858,217 (2,572,231) 95,868,681 0.06 (111.22) 2.983 1,350,009 448,306 255,152 12,343,422 2,388,852 205,013,811 9.37 37.75 0.444 17,196,885 1,414,192 (12,759,143) 119,004,520 (6,195,314) 387,707,233 2.54 (254.75) 4.075 5,049,840 1,587,401 129,343 344,379,433 82,982,105 868,279,367 1.04 4.17 0.40
20021 ** ** ** ** ** ** ** ** **2 3,282,411 205,334 (3,008,434) 50,638,353 (2,600,951) 101,153,874 0.14 (118.31) 3.043 655,287 708,719 137,341 16,312,805 1,231,997 199,891,387 0.51 (4.34) (0.03)4 13,911,768 779,653 (11,444,777) 91,357,855 (9,218,863) 323,979,232 1.85 (142.45) 4.055 8,091,667 2,591,663 167,556 287,971,885 79,390,323 687,861,702 1.97 6.93 0.80
20011 (961,319) 9,010,443 562,500 177,815 (10.67) (170.90) (540.63)2 1,879,211 3,008,744 (1,371,328) 44,114,014 (3,913,344) 97,946,348 (5.67) (28.86) (1.15)3 9,629,665 1,572,277 (3,740,012) 54,763,136 1,148,088 251,730,645 7.88 701.81 3.204 ** ** ** ** ** ** ** ** **5 8,784,268 2,442,389 (1,187,655) 574,288,710 73,722,763 834,219,023 0.90 8.60 0.76
* Incomplete records for the year.** No record for the year.Note: ( ) losses in terms of net profit; deferred provision of income tax in terms of tax on profits; finance costs or charges in terms of interest payments; resulting from deficit retained earnings at end of the year in terms of stockholder's equity.
in Philippine Peso (PhP)

389
continuation…..
Appendix 17. Rates of return on asset after tax (ROA), on equity after tax (ROE) and on sales after tax (ROS) of seaweeds/carageenan processors/manufacturers, Philippines, 1997-2005
NET TAX ON INTEREST TOTAL STOCKHOLDER'S TOTAL Rate of Return Rate of Return Rate of ReturnCompany No. PROFITS (P) PROFITS (T) PMENTS (I) ASSETS (A) EQUITY (E) SALES (S) on Asset (ROA) on Equity (ROE) on Sales (ROS)
(P - T + I) / (A) (P - T) / (E) (P - T) / (S)
20001 ** ** ** ** ** ** ** ** **2 6,016,568 (2,602,219) (9,930,538) 51,408,731 (1,412,483) 145,062,598 (2.55) (610.19) 5.943 (1,016,852) (910,219) (1,237,674) 117,338,534 (3,169,288) 190,290,024 (1.15) (3.36) (0.06)4 ** ** ** ** ** ** ** ** **5 29,358,457 14,945,348 20,191,568 458,545,990 68,568,539 771,772,713 7.55 21.02 1.87
19991 ** ** ** ** ** ** ** ** **2 409,407 (41,473) (759,712) 17,485,618 (206,141) 100,226,768 (1.77) (218.72) 0.453 6,875,513 877,448 (4,452,914) 82,273,440 (1,824,981) 210,917,359 1.88 (328.66) 2.844 ** ** ** ** ** ** ** ** **5 30,883,854 3,138,296 (21,368,984) 163,578,654 33,963,862 1,024,809,415 3.90 81.69 2.71
19981 ** ** ** ** ** ** ** ** **2 ** ** ** ** ** ** ** ** **3 (4,549,641) (1,893,692) (1,485,445) 56,162,788 (3,370,132) 124,309,984 (7.37) (78.81) (2.14)4 ** ** ** ** ** ** ** ** **5 4,450,720 (1,025,623) (7,765,882) 161,855,703 27,587,288 528,805,359 (1.41) 19.85 1.04
19971 ** ** ** ** ** ** ** ** **2 ** ** ** ** ** ** ** ** **3 1,683,927 (98,775) (2,089,526) 62,584,181 771,262 59,478,384 (0.49) 231.14 3.004 ** ** ** ** ** ** ** ** **5 21,480,569 (2,665,757) (26,723,927) 176,918,537 29,876,827 350,531,307 (1.46) 80.82 6.89
* Incomplete records for the year.** No record for the year.Note: ( ) losses in terms of net profit; deferred provision of income tax in terms of tax on profits; finance costs or charges in terms of interest payments; resulting from deficit retained earnings at end of the year in terms of stockholder's equity.
in Philippine Peso (PhP)

390
Appendix 18. Volume (MT) and value (FOB '000 US$) of soy sauce exports, Philippines, 1985, 1990-2005
YearQuantity FOB Value Quantity FOB Value Quantity FOB Value
1985 935 767 935 7671990 1,985 1,498 1,985 1,4981991 2,537 1,950 2,537 1,9501992 2,565 2,072 2,565 2,0721993 2,729 2,209 2,729 2,2091994 2,975 2,509 2,975 2,5091995 2,164 1,873 2,164 1,8731996 3,209 3,017 3,209 3,0171997 2,216 2,083 2,216 2,0831998 2,722 2,574 2,722 2,5741999 2,889 2,668 2,889 2,6682000 2,987 2,619 2,632 2,312 355 3072001 2,773 2,382 2,773 2,3822002 2,599 2,230 2,599 2,2302003 3,008 2,567 3,008 2,5672004 3,563 2,770 3,563 2,7702005 4,260 3,026 4,260 3,026
Source: NSO, various years. Foreign Trade Statistics of the Philippines.
OTHER SOYA (SOYBEAN) SAUCE
TOTAL SOYA (SOYBEAN) SAUCE SOYA (SOYBEAN) SAUCE

391
Appendix 20. Market structure of soy sauce manufacturers, Philippines, 1999-2005
Year Sample Herfindahl GiniSize, n CR2 CR3 CR4 Hirschman Index Coefficient
1999 4 89.0 96.2 5,124.8 0.522000 6 84.5 92.2 95.5 4,083.9 0.592001 6 89.1 94.5 97.1 4,917.3 0.652002 6 87.6 92.9 96.5 4,839.7 0.642003 6 88.9 93.6 96.8 5,182.6 0.662004 5 91.8 95.9 5,695.9 0.642005 5 92.9 97.0 5,683.2 0.65
Concentration Ratio
Appendix 19. Volume (MT) and value (CIF '000 US$) of soy sauce imports,Philippines, 1985, 1990-2005
YearQuantity FOB Value Quantity FOB Value
1985 1,133 1,665 185 1311990 3,441 4,081 408 3521991 4,717 4,704 484 4931992 4,771 6,343 463 7501993 5,685 10,164 599 9551994 8,086 15,716 925 1,7191995 7,433 15,333 949 1,7711996 10,217 23,183 1,263 2,3031997 10,991 24,896 1,199 2,3311998 8,998 19,337 1,170 1,3471999 11,776 23,094 1,266 1,1572000 12,050 21,925 1,379 1,4872001 14,681 23,045 1,052 1,2682002 15,914 20,161 1,133 1,2792003 18,180 22,301 1,601 1,5512004 18,027 23,793 1,764 1,5412005 20,778 29,443 1,392 1,183
Source: NSO, various years. Foreign Trade Statistics of the Philippines.
SOYA (SOYBEAN) SAUCE SAUCES, CONDIMENTS, MIXED SEASONINGS

392
Appendix 21. Advertising expenses, annual total sales and advertising-sales ratio of soy sauce processing/manufacturing firms, Philippines, 1999-2005
Soy Sauce Annual Total Sales AdvertisingProcessors (S) (AD) Ads-Sales Ratio
(Company No.) (AD/S)
20051 28,101,143 21,448 0.07632 82,132,786 1,182,471 1.43973 152,314,004 6,010,304 3.94604 ** ** **5 2,690,444,194 6 764,381,247 65,077,090 8.5137
20041 27,950,131 21,464 0.07682 ** ** **3 111,286,295 4 136,740,715 5 2,461,057,618 282,577,926 11.48206 640,975,613 49,386,129 7.7048
20031 36,155,305 22,460 0.06212 54,578,820 3 92,825,882 454,822 0.49004 134,953,805 5 1,967,298,258 192,206,543 9.77016 569,759,128 36,838,845 6.4657
20021 25,960,425 38,743 0.14922 60,561,905 3 90,891,378 4 130,301,889 5 1,633,250,243 170,400,059 10.43326 547,403,949 31,202,049 5.7000
** No record for the year.
(in Philippine Peso)

393
continuation …
Appendix 21. Advertising expenses, annual total sales and advertising-sales ratio of soy sauce processing/manufacturing firms, Philippines, 1999-2005
Soy Sauce Annual Total Sales AdvertisingProcessors (S) (AD) Ads-Sales Ratio
(Company No.) (AD/S)
20011 20,083,233 39,000 0.19422 53,856,405 3 40,042,840 4 111,475,924 5 1,365,518,467 124,840,048 9.14236 483,151,060 28,783,641 5.9575
20001 28,212,041 13,817 0.04902 50,851,353 3 42,113,360 275,734 0.65474 119,243,022 5 883,083,751 97,083,962 10.99376 426,372,387 57,072,710 13.3856
19991 22,338,904 31,896 0.14282 41,693,757 1,293,240 3.10183 ** ** **4 122,606,470 5 ** ** **6 395,408,838 38,298,703 9.6858
** No record for the year.
(in Philippine Peso)

394
Appendix 22. Rates of return on asset after tax (ROA), on equity after tax (ROE) and on sales after tax (ROS) of soy sauce processing/manufacturing firms, Philippines, 1999-2005
NET TAX ON INTEREST TOTAL STOCKHOLDER'S TOTAL Rate of Return Rate of Return Rate of ReturnCompany No. PROFITS (P) PROFITS (T) PMENTS (I) ASSETS (A) EQUITY (E) SALES (S) on Asset (ROA) on Equity (ROE) on Sales (ROS)
(P - T + I) / (A) (P - T) / (E) (P - T) / (S)
20051 365,910 122,032 22,249,489 (1,629,776) 28,101,143 1.10 (14.96) 0.872 1,103,596 353,151 9,113,337 2,826,540 82,132,786 8.23 26.55 0.913 2,588,123 841,140 51,017,837 12,986,446 152,314,004 3.42 13.45 1.154 ** ** ** ** ** ** ** ** **5 166,258,812 64,888,596 2,006,655,451 422,386,599 2,690,444,194 5.05 24.00 3.776 45,962,770 14,907,724 361,433,597 222,592,996 764,381,247 8.59 13.95 4.06
20041 359,286 114,972 25,021,406 (1,873,654) 27,950,131 0.98 (13.04) 0.872 ** ** ** ** ** ** ** ** **3 2,084,872 667,159 32,063,751 11,486,506 111,286,295 4.42 12.34 1.274 (7,652,758) 23,580,334 61,308,314 (303,784,425) 136,740,715 (50.94) (10.28) (22.84)5 133,678,574 44,391,350 11,161,159 960,534,843 369,772,529 2,461,057,618 10.46 24.15 3.636 40,541,165 12,973,173 83,364 305,411,550 193,988,122 640,975,613 9.05 14.21 4.30
20031 680,085 217,627 24,875,465 (2,117,969) 36,155,305 1.86 (21.83) 1.282 658,182 210,618 24,580,836 1,642,958 54,578,820 1.82 27.24 0.823 1,734,327 554,985 27,872,069 10,071,793 92,825,882 4.23 11.71 1.274 18,459,320 20,969,631 247,066,731 *** (18,662,443) 134,953,805 (1.02) (13.45) (1.86)5 104,287,217 34,211,115 680,905,118 351,516,628 1,967,298,258 10.29 19.94 3.566 36,513,989 11,684,476 58,404 275,749,961 169,608,107 569,759,128 9.03 14.64 4.36
20021 (2,069,545) 29,036,350 (2,580,427) 25,960,425 (7.13) (80.20) (7.97)2 288,011 92,163 26,030,872 1,195,394 60,561,905 0.75 16.38 0.323 1,649,889 527,965 24,806,875 8,892,451 90,891,378 4.52 12.62 1.234 (3,899,320) 15,574,051 68,188,113 (186,857,439) 130,301,889 (28.56) (10.42) (14.94)5 65,185,036 42,707,041 885,853 645,479,251 334,540,313 1,633,250,243 3.62 6.72 1.386 35,543,122 11,373,799 88,543 251,322,992 139,773,780 547,403,949 9.65 17.29 4.42
** No record for the year. *** Reported total asset was based on the unaudited financial statement submitted by Company 4 to SEC .Note: ( ) losses in terms of net profit; deferred provision of income tax in terms of tax on profits; finance costs or charges in terms of interest payments; resulting from deficit retained earnings at end of the year in terms of stockholder's equity.
in Philippine Peso (PhP)

395
continuation…
Appendix 22. Rates of return on asset after tax (ROA), on equity after tax (ROE) and on sales after tax (ROS) of soy sauce processing/manufacturing firms, Philippines, 1999-2005
NET TAX ON INTEREST TOTAL STOCKHOLDER'S TOTAL Rate of Return Rate of Return Rate of ReturnCompany No. PROFITS (P) PROFITS (T) PMENTS (I) ASSETS (A) EQUITY (E) SALES (S) on Asset (ROA) on Equity (ROE) on Sales (ROS)
(P - T + I) / (A) (P - T) / (E) (P - T) / (S)
20011 (3,531,814) 24,204,589 (510,881) 20,083,233 (14.59) (691.32) (17.59)2 763,790 244,413 24,910,762 999,547 53,856,405 2.08 51.96 0.963 982,416 314,373 20,207,760 7,770,526 40,042,840 3.31 8.60 1.674 4,223,899 31,124,838 7,995,737 82,687,837 (167,384,068) 111,475,924 (22.86) (16.07) (24.13)5 48,072,862 22,377,781 5,387,206 732,467,365 346,712,997 1,365,518,467 4.24 7.41 1.886 27,925,080 8,936,026 112,145 215,025,821 117,016,697 483,151,060 8.88 16.23 3.93
20001 158,332 50,666 27,047,888 3,020,932 28,212,041 0.40 3.56 0.382 268,595 85,950 23,958,559 480,170 50,851,353 0.76 38.04 0.363 1,034,645 331,086 20,161,601 7,102,483 42,113,360 3.49 9.91 1.674 (19,654,610) 19,157,712 12,201,121 79,299,611 (162,057,126) 119,243,022 (33.56) (23.95) (32.55)5 42,838,686 15,973,186 7,580,537 694,370,690 315,630,710 883,083,751 4.96 8.51 3.046 12,983,640 43,678 189,497,057 99,410,058 426,372,387 6.83 13.02 3.03
19991 103,457 34,141 16,431,498 2,913,267 22,338,904 0.42 2.38 0.312 22,530 7,435 14,787,091 297,525 41,693,757 0.10 5.07 0.043 ** ** ** ** ** ** ** ** **4 22,088,399 22,952,129 70,014,060 (128,525,689) 122,606,470 (1.23) (0.67) (0.70)5 ** ** ** ** ** ** ** ** **6 12,743,132 4,205,234 64,279 395,408,838 2.16
** No record for the yearNote: ( ) losses in terms of net profit; deferred provision of income tax in terms of tax on profits; finance costs or charges in terms of interest payments; resulting from deficit retained earnings at end of the year in terms of stockholder's equity.
in Philippine Peso (PhP)

396
YEAR TOTAL NOODLES
CANTON, UNCOOKED,
NOT STUFFED,
CONTAINING EGGS
BIHON, UNCOOKED,
NOT STUFFED
VERMICELLI (SOTANGHON,
BEAN THREAD),
UNCOOKED, NOT STUFFED
MISUA, UNCOOKED,
NOT STUFFED,
NOT CONTAINING
EGGS
MISUA, UNCOOKED,
NOT STUFFED,
CONTAINING EGGS
WANTON/ SIOMAI
WRAPPERS
MIKI, UNCOOKED,
NOT STUFFED,
NOT CONTAINING
EGGS
MIKI, UNCOOKED,
NOT STUFFED,
CONTAINING EGGS
1985 1,302 456 662 35 65 841990 2,013 1,062 782 35 71 631991 2,273 1,110 976 59 88 5 27 81992 2,348 1,196 987 37 89 3 19 17 11993 2,639 1,354 1,038 58 60 29 74 23 31994 2,677 1,308 1,167 47 77 15 55 6 21995 2,444 1,198 1,062 45 71 6 56 4 21996 3,215 1,594 1,316 61 125 38 74 5 31997 2,552 1,318 1,033 82 74 12 29 3 11998 2,592 1,319 1,137 30 73 15 11 71999 2,448 1,180 1,099 36 93 15 13 10 12000 2,404 1,134 1,112 40 79 10 26 2 12001 2,590 1,313 1,167 28 49 6 23 3 12002 3,050 37 27 98 3 2 1,370 1,5122003 2,986 47 39 103 1 2 1,341 1,4532004 3,365 a/ 72 11 84 7 1 1,458 1,7332005 3,164 116 31 131 4 1 1,272 1,609
Source: NSO, various years. Foreign Trade Statistics of the Philippines.a/ - less than 1 MT
Appendix 23. Volume (MT) of noodles exports, by type, Philippines 1985, 1990-2005
YEAR TOTAL NOODLES
CANTON, UNCOOKED,
NOT STUFFED,
CONTAINING EGGS
BIHON, UNCOOKED,
NOT STUFFED
VERMICELLI (SOTANGHON,
BEAN THREAD),
UNCOOKED, NOT STUFFED
MISUA, UNCOOKED,
NOT STUFFED,
NOT CONTAINING
EGGS
MISUA, UNCOOKED,
NOT STUFFED,
CONTAINING EGGS
WANTON/ SIOMAI
WRAPPERS
MIKI, UNCOOKED,
NOT STUFFED,
NOT CONTAINING
EGGS
MIKI, UNCOOKED,
NOT STUFFED,
CONTAINING EGGS
1985 2,203 803 1,074 105 95 1261990 3,490 1,843 1,321 120 108 971991 3,965 1,894 1,682 196 135 7 39 131992 4,121 2,069 1,719 139 134 4 29 25 21993 4,664 2,349 1,831 211 91 49 93 34 51994 4,785 2,298 2,089 193 116 24 52 9 41995 4,391 2,103 1,914 192 109 11 52 6 31996 6,332 2,930 2,734 252 196 35 172 7 51997 5,008 2,643 1,844 340 112 25 35 6 31998 4,683 2,388 2,009 121 111 18 19 171999 4,430 2,093 1,992 144 140 18 24 16 12000 4,284 2,006 1,940 154 117 19 43 3 22001 4,581 2,272 2,066 104 70 17 45 4 12002 5,305 134 52 146 6 3 2,387 2,5782003 4,975 125 68 152 1 3 2,214 2,4132004 5,398 b/ 134 17 122 9 2 2,378 2,7362005 5,203 183 49 188 6 2 2,130 2,646
Source: NSO, various years. Foreign Trade Statistics of the Philippines.b/ - less than 1 thousand US$
Appendix 24. Value (FOB '000 US$ ) of noodles exports, by type, Philippines 1985, 1990-2005

397
YEAR TOTAL NOODLES
VERMICELLI (SOTANGHON,
BEAN THREAD), UNCOOKED, NOT
STUFFED
BIHON, UNCOOKED, NOT STUFFED
CANTON, UNCOOKED, NOT
STUFFED, CONTAINING EGGS
MIKI, UNCOOKED, NOT CONTAINING
EGGS
1985 515 5151990 79 41 381991 4,567 4,554 131992 6,829 6,8291993 5,947 5,9471994 9,385 9,3851995 6,277 6,276 a/1996 9,826 9,774 521997 8,533 8,479 551998 7,864 7,826 381999 5,765 5,764 12000 6,239 6,122 117 a/2001 7,393 7,375 182002 8,720 8,568 1532003 7,590 7,484 1052004 9,396 9,311 63 222005 9,306 9,158 149
Source: NSO, various years. Foreign Trade Statistics of the Philippines.a/ - less than 1 MT
Appendix 25. Volume (MT) of noodles imports, by type, Philippines, 1985, 1990-2005
YEAR TOTAL NOODLES
VERMICELLI (SOTANGHON,
BEAN THREAD), UNCOOKED, NOT
STUFFED
BIHON, UNCOOKED, NOT STUFFED
CANTON, UNCOOKED, NOT
STUFFED, CONTAINING EGGS
MIKI, UNCOOKED, NOT CONTAINING
EGGS
1985 824,189 824,1891990 45,050 28,551 16,4991991 3,458,367 3,456,379 1,9881992 5,783,418 5,783,4181993 5,495,170 5,495,1701994 7,725,524 7,725,5241995 3,469,066 3,468,185 8811996 10,408,781 10,382,191 26,5901997 9,715,347 9,689,004 26,3431998 7,208,164 7,180,691 27,4731999 4,822,771 4,821,690 1,0812000 4,350,176 4,281,593 68,312 2712001 3,507,642 3,491,404 16,2382002 3,497,344 3,431,804 65,5402003 2,394,993 2,318,091 76,9022004 2,427,860 2,380,718 38,590 8,5522005 2,368,833 2,292,605 76,228
Source: NSO, various years. Foreign Trade Statistics of the Philippines.
Appendix 26. Value (CIF '000 US$) of noodles imports, by type, Philippines, 1985, 1990-2005

398
Appendix 27. Market structure measures of noodle manufacturers, Philippines, 1996-2005
Year Sample Herfindahl GiniSize, n CR2 CR3 CR4 Hirschman Index Coefficient
1996 5 97.0 8,782.5 0.761997 3 96.1 4,628.6 0.291998 6 97.2 98.7 99.6 8,597.0 0.791999 7 95.5 97.6 99.2 7,781.8 0.802000 6 96.3 98.2 99.2 7,833.7 0.772001 8 97.1 98.5 99.2 8,101.5 0.842002 8 97.1 98.2 99.1 8,237.1 0.842003 8 96.5 97.9 99.0 8,340.6 0.842004 8 96.3 97.6 98.9 8,446.1 0.842005 8 96.4 97.6 98.7 8,368.3 0.83
Concentration Ratio

399
Appendix 28. Advertising expenses, annual total sales and advertising-sales ratio of noodles processors, Philippines, 1996-2005
Noodles Processors/ Annual Total Sales Advertising ExpensesManufacturers (S) (AD) Ads-Sales Ratio(Company No.) (AD/S)
20051 8,010,878 2 20,300,647 12,847 0.06333 74,268,438 26,816 0.03614 123,925,338 112,190 0.09055 187,598,951 2,177,716 1.16086 203,332,785 7 852,553,750 86,175,933 10.10808 15,467,776,880 415,291,447 2.6849
20041 7,673,627 2 22,522,228 26,865 0.11933 41,552,702 136,782 0.32924 98,932,643 132,486 0.13395 202,244,855 247,011 0.12216 203,045,368 7 715,845,513 63,832,967 8.91718 14,401,652,129 513,475,779 3.5654
20031 8,278,240 2 22,908,098 20,662 0.09023 7,954,632 86,981 1.09354 88,820,141 145,669 0.16405 176,762,738 46,415 0.02636 147,211,839 7 695,069,585 65,846,802 9.47348 11,812,045,243 568,072,261 4.8093
20021 8,814,198 2 18,305,395 113,141 0.61813 4,514,979 102,606 2.27264 95,692,100 883,172 0.92295 60,797,558 92,947 0.15296 126,798,218 7 702,455,234 79,687,343 11.34418 9,700,003,549 334,890,419 3.4525
** No record for the year.
(in Philippine Peso)

400
continuation…
Appendix 28. Advertising expenses, annual total sales and advertising-sales ratio of noodles processors, Philippines, 1996-2005
Noodles Processors/ Annual Total Sales Advertising ExpensesManufacturers (S) (AD) Ads-Sales Ratio(Company No.) (AD/S)
20011 7,739,504 2 13,828,536 144,073 1.04193 5,884,381 106,741 1.81404 64,815,887 267,393 0.41255 44,651,951 73,537 0.16476 124,899,407 7 662,383,775 8 8,039,266,744 277,329,311 3.4497
20001 6,563,0202 ** ** **3 ** ** **4 72,052,794 144,368 0.20045 44,656,608 83,351 0.18666 126,635,540 7 560,559,588 8 5,997,928,979 303,670,627 5.0629
19991 6,537,950 2 ** ** **3 2,498,419 113,220 4.53174 129,626,704 467,273 0.36055 40,831,479 49,703 0.12176 98,625,940 7 473,635,892 8 5,429,939,007 369,289,323 6.8010
19981 6,773,575 2 ** ** **3 ** ** **4 70,094,001 147,448 0.21045 37,713,653 29,528 0.07836 12,774,666 1,239,833 9.70547 206,225,494 8 4,167,849,061 166,228,955 3.9884
** No record for the year.
(in Philippine Peso)

401
continuation…
Appendix 28. Advertising expenses, annual total sales and advertising-sales ratio of noodles processors, Philippines, 1996-2005
Noodles Processors/ Annual Total Sales Advertising ExpensesManufacturers (S) (AD) Ads-Sales Ratio(Company No.) (AD/S)
19971 6,219,769 2 ** ** **3 ** ** **4 75,810,366 1,078,609 1.42285 ** ** **6 ** ** **7 75,528,991 8 ** ** **
19961 2,145,955 2 ** ** **3 ** ** **4 87,168,701 1,494,251 1.71425 30,892,146 90,174 0.29196 ** ** **7 42,879,604 8 2,397,260,349 136,488,047 5.6935
** No record for the year.
(in Philippine Peso)

402
Appendix 29. Rates of return on asset after tax (ROA), on equity after tax (ROE) and on sales after tax (ROS) of noodles processors/manufacturers, Philippines, 1996-2005
NET TAX ON INTEREST TOTAL STOCKHOLDER'S TOTAL Rate of Return Rate of Return Rate of ReturnCompany No. PROFITS (P) PROFITS (T) PMENTS (I) ASSETS (A) EQUITY (E) SALES (S) on Asset (ROA) on Equity (ROE) on Sales (ROS)
(P - T + I) / (A) (P - T) / (E) (P - T) / (S)
20051 718,715.62 214,862.00 (57,600) 8,521,228 2,420,506.92 8,010,878 5.24 20.82 6.292 491,085 95,215 (175,927) 27,752,282 1,511,293 20,300,647 0.79 26.19 1.953 414,591 134742 12,071,923 8,793,337 74,268,438 2.32 3.18 0.384 3,149,503.35 573,142.94 (1,356,403) 52,410,757 9,979,058 123,925,338 2.33 25.82 2.085 892,905.75 290,194.00 27,338,415 10,389,314 187,598,951 2.20 5.80 0.326 10,420,667 3,189,246 (454,273) 68,993,435 38,459,109 203,332,785 9.82 18.80 3.567 39,418,761 15,104,799 11,745,154 625,537,197 382,225,072 852,553,750 5.76 6.36 2.858 1,563,374,767 576,215,995 442,958,899 9,968,380,976 6,445,179,021 15,467,776,880 14.35 15.32 6.38
20041 564,761 180,723 3,145,386 2,098,566 7,673,627 12.21 18.30 5.002 794,575 73,933 (554,166) 22,699,415 1,291,350 22,522,228 0.73 55.81 3.203 140,917 45,093 1,272,892 1,033,004 41,552,702 7.53 9.28 0.234 2,122,185 400,238 (838,145) 62,293,416 8,819,101 98,932,643 1.42 19.53 1.745 1,370,339 438,508 20,906,163 9,786,602 202,244,855 4.46 9.52 0.466 8,232,474 2,509,460 (390,412) 50,275,965 33,919,613 203,045,368 10.61 16.87 2.827 28,655,584 13,082,932 17,853,293 575,734,239 376,165,956 715,845,513 5.81 4.14 2.188 1,948,344,401 504,584,568 44,283,568 8,424,504,220 5,015,275,155 14,401,652,129 17.66 28.79 10.02
20031 363,923 148,430 2,038,997 1,814,528 8,278,240 10.57 11.88 2.602 612,802 129,209 (190,169) 22,000,879 1,124,875 22,908,098 1.33 42.99 2.113 16,158 5,171 1,945,548 (62,820) 7,954,632 0.56 (17.49) 0.144 1,662,281 355,043 (511,728) 37,425,654 8,022,574 88,820,141 2.13 16.29 1.475 1,467,066 469,461 19,965,682 8,995,300 176,762,738 5.00 11.09 0.566 6,035,942 1,718,431 (665,846) 42,058,921 30,416,668 147,211,839 8.68 14.19 2.937 30,273,078 12,775,112 14,034,938 581,669,940 372,740,011 695,069,585 5.42 4.69 2.528 1,117,062,402 387,958,981 297,778,947 7,177,567,978 3,527,231,753 11,812,045,243 14.31 20.67 6.17
20021 386,535 123,691 1,917,131 1,504,987 8,814,198 13.71 17.46 2.982 196,091 65,256 25,678 10,299,852 831,452 18,305,395 1.52 15.74 0.713 28,160 9,011 2,289,532 (73,807) 4,514,979 0.84 (25.94) 0.424 3,715,588 360,199 (2,507,169) 30,438,133 7,266,960 95,692,100 2.79 46.17 3.515 859,440 275,021 13,859,781 7,997,695 60,797,558 4.22 7.31 0.966 4,765,306 1,936,748 29,050 46,107,731 27,770,764 126,798,218 6.20 10.19 2.237 40,376,514 18,435,480 21,136,053 596,901,808 391,207,107 702,455,234 7.22 5.61 3.128 892,525,884 315,172,912 293,909,818 5,416,758,027 2,505,364,993 9,700,003,549 16.08 23.04 5.95
** No record for the year.Note: ( ) losses in terms of net profit; deferred provision of income tax in terms of tax on profits; finance costs or charges in terms of interest payments; resulting from deficit retained earnings at end of the year in terms of stockholder's equity.
in Philippine Peso (PhP)

403
continuation …
Appendix 29. Rates of return on asset after tax (ROA), on equity after tax (ROE) and on sales after tax (ROS) of noodles processors/manufacturers, Philippines, 1996-2005
NET TAX ON INTEREST TOTAL STOCKHOLDER'S TOTAL Rate of Return Rate of Return Rate of ReturnCompany No. PROFITS (P) PROFITS (T) PMENTS (I) ASSETS (A) EQUITY (E) SALES (S) on Asset (ROA) on Equity (ROE) on Sales (ROS)
(P - T + I) / (A) (P - T) / (E) (P - T) / (S)
20011 333,762 106,804 1,512,601 1,311,324 7,739,504 15.00 17.31 2.932 321,030 102,727 18,051 6,722,223 674,940 13,828,536 3.52 32.34 1.583 (116,154) 2,862,456 (92,955) 5,884,381 (4.06) (124.96) (1.97)4 1,597,850 207,804 (825,653) 31,560,371 6,724,537 64,815,887 1.79 20.67 2.145 563,325 180,264 10,960,880 7,456,223 44,651,951 3.49 5.14 0.866 4,218,825 960,662 (1,216,756) 42,333,429 26,673,829 124,899,407 4.82 12.21 2.617 27,145,842 20,163,221 42,061,532 669,378,517 448,130,020 662,383,775 7.33 1.56 1.058 819,775,314 274,204,015 42,414,831 4,341,776,127 1,538,939,516 8,039,266,744 13.54 35.45 6.79
20001 318,239 101,836 1,241,623 1,107,630 6,563,020 17.43 19.54 3.302 ** ** ** ** ** ** ** ** **3 ** ** ** ** ** ** ** ** **4 1,562,382 222,746 (751,967) 34,058,758 6,160,144 72,052,794 1.73 21.75 1.865 635,570 203,383 9,375,341 7,143,825 44,656,608 4.61 6.05 0.976 4,026,579 972,984 (985,814) 39,435,112 22,925,815 126,635,540 5.24 13.32 2.417 22,702,377 11,291,613 17,735,951 557,413,194 399,085,867 560,559,588 5.23 2.86 2.048 650,986,818 190,358,055 (48,107,038) 3,075,863,991 957,171,956 5,997,928,979 13.41 48.12 7.68
19991 320,815 105,869 1,219,172 923,959 6,537,950 17.63 23.26 3.292 ** ** ** ** ** ** ** ** **3 (749,905) 1,537,740 402,880 2,498,419 (48.77) (186.14) (30.02)4 1,453,746 220,199 (533,893) 34,185,354 5,632,487 129,626,704 2.05 21.90 0.955 608,424 200,780 7,073,962 6,714,928 40,831,479 5.76 6.07 1.006 3,666,026 842,420 (1,113,238) 36,386,412 21,509,169 98,625,940 4.70 13.13 2.867 13,948,450 8,540,700 10,467,338 519,934,354 369,939,152 473,635,892 3.05 1.46 1.148 296,870,745 91,333,036 (20,103,970) 2,004,610,961 554,940,147 5,429,939,007 9.25 37.04 3.79
19981 349,477 118,822 1,353,345 709,011 6,773,575 17.04 32.53 3.412 ** ** ** ** ** ** ** ** **3 ** ** ** ** ** ** ** ** **4 1,503,299 177,587 (882,320) 50,729,089 4,949,674 70,094,001 0.87 26.78 1.895 589,104 200,295 6,658,390 6,307,284 37,713,653 5.84 6.16 1.036 433,565 (105,328) (309,787) 34,615,853 20,204,460 12,774,666 0.66 2.67 4.227 (4,965,774) 796,379 8,588,015 358,301,019 395,064,064 206,225,494 0.79 (1.46) (2.79)8 264,120,616 69,492,801 (59,730,025) 2,004,610,961 371,913,614 4,167,849,061 6.73 52.33 4.67
** No record for the year.Note: ( ) losses in terms of net profit; deferred provision of income tax in terms of tax on profits; finance costs or charges in terms of interest payments; resulting from deficit retained earnings at end of the year in terms of stockholder's equity.
in Philippine Peso (PhP)

404
continuation …
Appendix 29. Rates of return on asset after tax (ROA), on equity after tax (ROE) and on sales after tax (ROS) of noodles processors/manufacturers, Philippines, 1996-2005
NET TAX ON INTEREST TOTAL STOCKHOLDER'S TOTAL Rate of Return Rate of Return Rate of ReturnCompany No. PROFITS (P) PROFITS (T) PMENTS (I) ASSETS (A) EQUITY (E) SALES (S) on Asset (ROA) on Equity (ROE) on Sales (ROS)
(P - T + I) / (A) (P - T) / (E) (P - T) / (S)
19971 193,109 64,588 1,471,718 478,356 6,219,769 8.73 26.87 2.072 ** ** ** ** ** ** ** ** **3 ** ** ** ** ** ** ** ** **4 2,100,110 115,314 (1,770,640) 39,623,363 4,506,282 75,810,366 0.54 44.05 2.625 ** ** ** ** ** ** ** ** **6 ** ** ** ** ** ** ** ** **7 (22,775,958) 996,069 9,098,304 310,806,886 292,238,202 75,528,991 (4.72) (8.13) (31.47)8 ** ** ** ** ** ** ** ** **
19961 66,884 23,410 1,938,833 355,974 2,145,955 2.24 12.21 2.032 ** ** ** ** ** ** ** ** **3 ** ** ** ** ** ** ** ** **4 2,111,853 154,283 (1,671,044) 35,037,448 4,338,782 87,168,701 0.82 45.12 2.255 306,124 107,143 11,937,744 5,678,285 30,892,146 1.67 3.50 0.646 ** ** ** ** ** ** ** ** **7 (13,576,393) 17,754,416 318,528,512 306,911,925 42,879,604 1.31 (4.42) (31.66)8 74,381,321 25,716,142 (906,630) 1,135,961,706 140,117,207 2,397,260,349 4.20 34.73 2.03
** No record for the year.Note: ( ) losses in terms of net profit; deferred provision of income tax in terms of tax on profits; finance costs or charges in terms of interest payments; resulting from deficit retained earnings at end of the year in terms of stockholder's equity.
in Philippine Peso (PhP)

405
Appendix 30. Volume ('000 MT) of processed coconut exports by type, Philippines, 1985, 1990-2005
YEARTOTAL
PROCESSED COCONUT
DESICCATED COCONUT
COCONUT CHIPS,
PREPARED/ PRESERVD
COCONUT MEAT, DRIED
COCONUT MILK , IN LIQUID
FORM
COCONUT MILK,IN
POWDER FORM
COCONUT, UNCOOKED/ COOKED BY STEAMING/ BOILING IN
WATER, FROZEN
FLOUR, MEAL & POWDER, OF
COCONUT
1985 65.12 64.75 0.17 0.191990 75.41 75.34 0.071991 82.38 80.74 0.31 0.10 0.53 0.51 0.20 0.00041992 86.98 85.22 0.31 0.08 0.70 0.54 0.151993 95.55 93.34 0.15 0.08 1.07 0.73 0.181994 77.27 75.11 0.17 0.09 0.85 0.82 0.17 0.071995 75.01 73.06 0.16 0.07 0.85 0.76 0.10 0.031996 71.75 69.58 0.08 0.05 0.73 1.06 0.16 0.071997 79.34 76.79 0.18 0.08 0.80 1.21 0.15 0.131998 74.94 71.89 0.16 0.06 1.16 1.46 0.13 0.081999 79.88 76.22 0.14 0.06 1.49 1.01 0.37 0.602000 76.37 73.69 0.20 0.08 1.10 0.56 0.16 0.582001 84.49 79.67 0.14 0.11 1.87 1.92 0.19 0.592002 112.23 106.96 0.48 0.21 1.96 1.60 0.17 0.862003 111.35 106.80 0.66 0.34 1.96 1.00 0.20 0.392004 110.59 105.83 0.42 0.10 2.06 1.14 0.23 0.822005 130.34 125.54 0.43 0.17 2.08 1.10 0.22 0.81
Source: NSO, various years. Foreign Trade Statistics of the Philippines.
Appendix 31. Value (FOB, Million US$) of processed coconut exports by type, Philippines, 1985, 1990-2005
YEARTOTAL
PROCESSED COCONUT
DESICCATED COCONUT
COCONUT CHIPS,
PREPARED/ PRESERVD
COCONUT MEAT, DRIED
COCONUT MILK , IN LIQUID
FORM
COCONUT MILK,IN
POWDER FORM
COCONUT, UNCOOKED/ COOKED BY STEAMING/ BOILING IN
WATER, FROZEN
FLOUR, MEAL & POWDER, OF
COCONUT
1985 76.36 75.67 0.22 0.481990 60.79 60.68 0.111991 69.60 66.24 0.45 0.12 0.85 1.60 0.34 0.00021992 91.30 87.56 0.44 0.12 1.09 1.86 0.241993 88.19 83.74 0.20 0.11 1.54 2.31 0.301994 74.85 70.15 0.24 0.12 1.25 2.74 0.28 0.061995 72.47 68.18 0.29 0.10 1.32 2.39 0.17 0.021996 90.02 84.90 0.19 0.08 1.22 3.30 0.28 0.061997 93.99 88.29 0.32 0.13 1.20 3.65 0.27 0.131998 79.49 72.76 0.22 0.09 1.64 4.50 0.23 0.051999 95.89 89.18 0.19 0.10 2.13 3.19 0.69 0.412000 77.65 73.25 0.24 0.12 1.50 1.74 0.30 0.502001 71.29 63.31 0.17 0.14 2.28 4.83 0.33 0.242002 102.95 94.79 0.52 0.26 2.50 4.18 0.28 0.412003 102.42 95.74 0.78 0.39 2.34 2.64 0.31 0.222004 106.86 99.74 0.50 0.15 2.72 2.86 0.38 0.512005 134.22 127.14 0.60 0.24 2.37 2.92 0.36 0.59
Source: NSO, various years. Foreign Trade Statistics of the Philippines.

406
Appendix 32. Market structure measures of coconut dessicating firms, Philippines, 1998-2005
Year Sample Herfindahl GiniSize, n CR2 CR3 CR4 Hirschman Index Coefficient
1998 3 72.70 3,535.2 0.121999 4 58.51 80.02 2,659.9 0.122000 4 60.36 82.10 2,730.8 0.152001 5 49.83 67.92 2,116.9 0.132002 6 46.92 64.55 81.23 1,921.9 0.212003 7 44.04 61.02 77.39 1,763.6 0.272004 7 39.69 55.59 67.90 1,567.9 0.162005 6 46.14 63.50 77.35 1,823.2 0.17
Concentration Ratio

407
Appendix 33. Advertising expenses, annual total sales and advertising-sales ratio of desiccated coconut processing/manufacturing firms, Philippines, 1998-2005
Desiccated Coconut Annual Total Sales Advertising Expenses Processors (S) (AD) Ads-Sales Ratio
( Company No.) (AD/S)
20051 433,809,524 2,622 0.00062 501,586,384 7,029,447 1.40143 ** **4 571,731,540 5 871,388,296 6 717,078,588 7 1,033,664,352
20041 384,746,118 2 420,475,044 3 464,314,528 1,239,055 0.26694 486,957,176 5 628,805,416 5,760 0.00096 630,713,599 7 939,024,523
20031 330,748,765 112,050 0.03392 457,828,354 3 616,020,149 2,523,285 0.40964 62,524,613 5 746,239,600 24,796 0.00336 638,827,683 7 911,426,198
20021 171,590,185 247,412 0.14422 504,821,250 3 635,485,306 202,744 0.03194 ** **5 752,512,100 1,685 0.00026 600,877,539 7 938,063,082
** No record for the year.
(in Philippine Peso)

408
continuation…
Appendix 33. Advertising expenses, annual total sales and advertising-sales ratio of desiccated coconut processing/manufacturing firms, Philippines, 1998-2005
Desiccated Coconut Annual Total Sales Advertising Expenses Processors (S) (AD) Ads-Sales Ratio
( Company No.) (AD/S)
20011 ** **2 334,717,335 3 426,186,922 4 ** **5 505,131,634 37,873 0.00756 428,990,233 7 676,732,744
20001 ** **2 381,877,617 3 ** **4 ** **5 481,232,479 6 463,740,034 7 806,321,408
19991 ** **2 504,123,985 3 ** **4 ** **5 468,445,737 6 531,871,767 7 839,824,488
19981 ** **2 497,432,656 3 ** **4 ** **5 ** **6 506,112,715 7 818,822,489
** No record for the year.
(in Philippine Peso)

409
Appendix 34. Rates of return on asset after tax (ROA), on equity after tax (ROE) and sales ratio of desiccated coconut processors/manufacturing, Philippines, 1998-2005
NET TAX ON INTEREST TOTAL STOCKHOLDER'S TOTAL Rate of Return Rate of Return Rate of ReturnCompany No. PROFITS (P) PROFITS (T) PMENTS (I) ASSETS (A) EQUITY (E) SALES (S) on Asset (ROA) on Equity (ROE) on Sales (ROS)
(P - T + I) / (A) (P - T) / (E) (P - T) / (S)
20051 14,802,613 3,049,694 40,824 168,499,302 32,778,112 433,809,524 7.00 35.86 2.712 9,389,431 2,253,943 3,722,175 293,736,774 19,100,586 501,586,384 3.70 37.36 1.423 ** ** ** ** ** ** ** ** **4 28,352,353 7,163,727 377,842 142,368,772 77,385,724 571,731,540 15.15 27.38 3.715 13,418,189 1,235,277 (9,617,338) 141,799,099 27,541,330 871,388,296 1.81 44.24 1.406 13,136,772 1,191,023 (9,207,906) 597,645,955 86,773,791 717,078,588 0.46 13.77 1.677 9,070,573 2,719,643 (382,852) 447,478,003 370,346,433 1,033,664,352 1.33 1.71 0.61
20041 11,137,389 4,399,962 488,462 131,527,060 26,878,761 384,746,118 5.49 25.07 1.752 (36,018,972) 10,597,584 3,242,453 278,050,642 (9,205,642) 420,475,044 (15.60) (506.39) (11.09)3 7,389,589 920,013 (11,461,967) 428,734,968 70,354,823 464,314,528 (1.16) 9.20 1.394 10,800,211 1,459,115 (4,933,031) 120,141,292 55,819,256 486,957,176 3.67 16.73 1.925 7,839,469 1,006,868 (4,693,008) 79,660,029 24,975,756 628,805,416 2.69 27.36 1.096 10,776,794 589,537 (7,370,947) 498,732,646 84,035,948 630,713,599 0.56 12.12 1.627 (14,819,343) (5,272,214) (1,534,137) 524,567,849 364,378,355 939,024,523 (2.11) (2.62) (1.02)
20031 10,529,024 4,292,903 409,643 111,269,104 44,563,058 330,748,765 5.97 13.99 1.892 22,225,033 3,897,402 (10,815,963) 260,329,754 36,596,601 457,828,354 2.89 50.08 4.003 18,898,415 3,584,618 (14,905,581) 368,123,938 75,347,214 616,020,149 0.11 20.32 2.494 1,411,192 451,581 82,842,514 50,959,611 62,524,613 1.16 1.88 1.535 3,165,104 1,349,876 1,001,146 108,135,954 22,836,163 746,239,600 2.60 7.95 0.246 9,867,964 1,031,792 (5,230,739) 459,497,989 81,219,638 638,827,683 0.78 10.88 1.387 6,578,051 721,272 (4,170,862) 510,449,174 375,459,621 911,426,198 0.33 1.56 0.64
20021 4,565,576 (1,648,282) 78,949,309 33,788,794 171,590,185 3.70 13.51 2.662 26,151,998 2,091,656 (19,489,155) 256,315,662 29,084,933 504,821,250 1.78 82.72 4.773 24,744,745 3,336,573 (19,111,807) 359,970,727 74,938,998 635,485,306 0.64 28.57 3.374 ** ** ** ** ** ** ** ** **5 2,945,133 1,222,534 1,064,027 56,703,963 19,967,676 752,512,100 4.91 8.63 0.236 12,667,739 1,481,977 (4,802,082) 420,934,718 57,614,195 600,877,539 1.52 19.41 1.867 42,289,088 13,630,177 532,286 486,418,682 373,773,704 938,063,082 6.00 7.67 3.06
** No record for the year.Note: ( ) losses in terms of net profit; deferred provision of income tax in terms of tax on profits; finance costs or charges in terms of interest payments; resulting from deficit retained earnings at end of the year in terms of stockholder's equity.
in Philippine Peso (PhP)

410
continuation…
Appendix 34. Rates of return on asset after tax (ROA), on equity after tax (ROE) and sales ratio of desiccated coconut processors/manufacturing, Philippines, 1998-2005
Desiccated Coconut NET TAX ON INTEREST TOTAL STOCKHOLDER'S TOTAL Rate of Return Rate of Return Rate of ReturnProcessors PROFITS (P) PROFITS (T) PMENTS (I) ASSETS (A) EQUITY (E) SALES (S) on Asset (ROA) on Equity (ROE) on Sales (ROS)
(Company No.) (P - T + I) / (A) (P - T) / (E) (P - T) / (S)
20011 ** ** ** ** ** ** ** ** **2 17,707,675 (100,617) (17,593,521) 255,194,672 24,513,746 334,717,335 0.08 72.65 5.323 28,748,418 1,026,028 (25,969,357) 305,838,038 22,642,633 426,186,922 0.57 122.43 6.504 ** ** ** ** ** ** ** ** **5 1,030,157 805,741 1,501,327 40,589,660 17,369,790 505,131,634 4.25 1.29 0.046 10,367,725 2,053,811 (3,707,194) 380,222,502 51,230,515 428,990,233 1.21 16.23 1.947 37,632,005 12,288,670 1,033,173 424,975,148 338,989,325 676,732,744 6.21 7.48 3.74
20001 ** ** ** ** ** ** ** ** **2 34,704,997 8,600,315 (7,734,734) 217,326,558 24,298,975 381,877,617 8.45 107.43 6.843 ** ** ** ** ** ** ** ** **4 ** ** ** ** ** ** ** ** **5 1,872,480 689,042 273,864 41,853,271 15,657,590 481,232,479 3.48 7.56 0.256 10,290,796 1,611,165 (4,947,590) 332,610,337 46,623,795 463,740,034 1.12 18.62 1.877 53,696,200 17,559,617 1,583,215 370,674,217 312,612,817 806,321,408 10.18 11.56 4.48
19991 ** ** ** ** ** ** ** ** **2 24,326,316 2,702,256 (16,331,813) 223,433,758 5,929,027 504,123,985 2.37 364.72 4.293 ** ** ** ** ** ** ** ** **4 ** ** ** ** ** ** ** ** **5 1,338,101 437,142 36,652,420 14,235,875 468,445,737 2.46 6.33 0.196 13,177,946 1,597,362 (8,047,516) 272,794,229 42,891,754 531,871,767 1.30 27.00 2.187 13,569,567 5,606,185 3,558,373 351,766,552 274,893,019 839,824,488 3.28 2.90 0.95
19981 ** ** ** ** ** ** ** ** **2 45,017,477 7,553,686 (22,912,494) 216,938,992 636,780 497,432,656 6.71 5883.32 7.533 ** ** ** ** ** ** ** ** **4 ** ** ** ** ** ** ** ** **5 ** ** ** ** ** ** ** ** **6 12,806,847 2,451,639 (7,168,355) 254,094,312 36,358,686 506,112,715 1.25 28.48 2.057 53,990,853 20,187,100 5,727,457 338,178,498 263,371,264 818,822,489 11.69 12.84 4.13
** No record for the year.Note: ( ) losses in terms of net profit; deferred provision of income tax in terms of tax on profits; finance costs or charges in terms of interest payments; resulting from deficit retained earnings at end of the year in terms of stockholder's equity.
in Philippine Peso (PhP)

411

411
Market Liberalization and Its Relationship with Market Structure, Conduct and Performance of the Food Processing Industry in Viet Nam by Pham Quang Dieu
Table of Contents Page No 1 Overview of agricultural and food processing in Viet Nam 413 1.1 Overview of Agricultural sector in Viet Nam 413 1.2 Food processing in Viet Nam 415 1.3 Policies relating to enterprises 421 1.4 Impact of trade liberalization on food processing 422
2 Tea Processing 427 2.1 Overview of Tea Sector in Viet Nam 427 2.2 Structure of tea processing in the market 428 2.3 The Conduct and Performance of tea processing 429 2.4 Tea Industry Development Policy 432
3 Coffee Processing 433 3.1 Overview of Coffee sector 433 3.2 Technology and degree of impact by some factors on coffee
processing 435
3.3 The Conduct and the Performance of the coffee processing 436 4 Cashew Nuts Processing 440 4.1 Overview of Cashew nuts in Viet Nam 440 4.2 Structure of cashew nuts in the market 442 4.3 The Conduct and the Performance of Cashew nuts processing 445
5 Rice Processing 450 5.1 Overview of Rice sector in Viet Nam 450 5.2 Government policy on rice production 451 5.3 The Conduct and the Performance of the rice processing industry 453
6 Conclusions And Implications 459 7 References 460
List of Tables
Table 1.1: GDP share by industries (%), 1990-2006 413 Table 1.2: GDP at current prices of the agricultural sector 414 Table 1.3. Agricultural GDP growth rate 1995-2006 414 Table 1.4: Value export of some agricultural products (million USD), 1995-2006
414
Table 1.5: FDI in agriculture and other sectors, 1988-2005 415 Table 1.6: Contribution of the processing industry to the GDP, 2000-2005 (%)
415
Table 1.7. Population in urban and rural areas during 1995-2005 416 Table 1.8. Number of supermarkets in Hanoi and Ho Chi Minh city, 1990- 417

412
2005 Table 1.9. Income and expenditure of five groups 418 Table 1.10: Number of enterprises in food processing, 2002-2005 418 Table 1.11: Number of enterprise by size of labor (31/12), 2002-2005 419 Table 1.12: Number of enterprises by size of capital in food processing industry, 2000 - 2005
419
Table 1.13: The number of enterprises gaining or losing profits, 2002-2005 420 Table 1.14: Assets of enterprises, 2002-2005 421 Table 1.15: FDI into food processing industry, 1988 – 2007 421 Table 1.16: Viet Nam’s export turnover to ASEAN, 1995-2006 423 Table 1.17: Value export of some agricultural products from Viet Nam to ASEAN, 1999-2005
424
Table 1.18: The average growth in export to ASEAN countries (2002-2006)
424
Table 1.19: Viet Nam’s major agro-forestry and fishery commodities exported to America
425
Table 1.20: Import taxes applied to Viet Nam’s agricultural commodities before and after VATA (%).
425
Table 1.21. Tax reduction applied to a number of commodities as committed with WTO
426
Table 2.1. Allocated tea producing area in Viet Nam (%), 1995-2005 427 Table 2.2. Tea area, yield and production, 1995-2006 427 Table 2.3: The quantity and value of Viet Nam’s tea export, 1999-2007 428 Table 2.4: Viet Nam’s tea export price (2001-2007) 428 Table 2.5: Market share of some leading tea export companies, 2004-2006 431 Table 3.1. Coffee area, yield and production, 1991-2005 433 Table 3.2. The quantity and value of Viet Nam’s coffee export, 1991-2006 434 Table 3.3. Ten largest importers of coffee from Viet Nam 434 Table 3.4. Viet Nam’s coffee export prices, 1988-2006 435 Table 3.5: Market share of some leading coffee export companies, 2004-2006
438
Table 4.1: Cashew nut area and production, 1975-2007 440 Table 4.2: Projected cashew nut area, 1997-2010 441 Table 4.3 : The export price and changes in cashew nut area, yield and output, 1995-2006
442
Table 4.4: Cashew nut export in Viet Nam, 1995 – 2007 447 Table 4.5: Viet Nam’s cashew nut export market structure, 2006 - 2007 448 Table 5.1 Export quantity and export value during 1989 – 2007 451 Table 5.2: The number of rice export companies of the 1997-2000 periods 455 Table 5.3: Rice export of Vinafood 2 during the 2001 – August, 2007 period.
455
Table 5.4: Market shares of some leading export companies in rice, (2004) 456 Table 5.5: The number of VFA’s members, 2007 457

413
1. Overview of Agricultural and Food Processing In Viet Nam 1.1 Overview of Agricultural sector in Viet Nam Viet Nam is located in the South East Asia with the total land area 329,240 km2. The economy’s population is about 85 million by year 2006, of which 75% of the population (60 million) live in rural areas. Viet Nam’s labor force is about 37.7 million, including 24.5 million (or 65%) laborers working in agricultural sector. Since the late 80s, Viet Nam started reforming the economy toward market system and opening to the world economy. Due to the positive effects of reform over the past 10 years, the GDP growth rate has been very encouraging averaging over 7 per cent p.a., despite periodic slowdowns due to the Asian crisis in 1998-99 and global recession in 2001. The rate implies a growth in per capita GDP of over 5% p.a. over a 15 year period. Total export and import turnover has also grown rapidly. Compared to the 1980s, when Viet Nam could be described as a closed economy, by 2003 the turnover was 44.9 billion USD (CIEM 2004), or 115 per cent of GDP in that year (World Bank 2004). The Vietnamese economy is therefore now a very open one. During the early stage of reform, from 1988 to 1989, the policies of market liberalization increased agricultural commodity prices, improved farmers’ profits, and led to high growth in the agricultural sector. In the period 1991-1995, rapid devaluation of the VND currency, a 50 per cent reduction in agricultural tax applied in 1991-1992, foreign and domestic market promotion and increasing investment due to the high growth rate of the whole economy further stimulated agricultural growth. Since 1995, despite rather low levels of investment and harsh competition, the agricultural sector has continued to grow rapidly as farmers have adjusted their production structure according to market signals. However, in recent years, the profitability of agricultural production has declined. Relentless changes in agricultural policies are therefore required in order to continue mobilizing farmers’ inner force to maintaining a desirable growth rate.
Table 1.1: GDP share by industries (%), 1990-2006 Year Agro-forestry
and aquatic products Industry and construction Services
1990 38.74 22.67 38.59 1995 27.18 28.76 44.06 2000 24.53 36.73 38.74 2001 23.24 38.13 38.63 2002 23.00 38.55 38.46 2003 22.54 39.47 37.99 2004 21.81 40.21 37.98 2005 20.89 41.04 38.07 2006 20.36 41.56 38.08 Source: Statistical Yearbook of Vietnam, GSO 2006

414
Table 1.2: GDP at current prices of the agricultural sector
Year (Billions USD) 1995 4.79 1997 5.89 1998 6.19 1999 6.08 2000 6.17 2002 6.32 2003 9.85 2004 7.56 2005 8.39 2006 9.31
Source: GSO, 2001-2006 During the reform process, Viet Nam agriculture has recorded a rapid growth comparing to other countries in the world. However, the increase in agricultural GDP has a signal of slowing down with only 4% annually in 1995, 3.7% in 2005 and 2.8% in 2006 (Dang Kim Son, 2006)
Table 1.3. Agricultural GDP growth rate 1995-2006 Year The growth in agricultural
GDP (%/year) 1995 4.0 2000 4.2 2003 3.4 2005 3.7 2006 2.8
Source: Dang Kim Son “Vietnam Agriculture and Rural: 20 years of Renovation and Development”, 2006 Since reform, agricultural exports have contributed significantly to Viet Nam’s overall economic performance. In 1995, exports accounted for 31 per cent of agricultural GDP, rising to 35 per cent in 2001 and 38 per cent in 2003 (MARD 2004). Exported rice accounts for around 20 per cent of total rice output annually. The figure for coffee is 95 per cent, tea 60 per cent and rubber 85 per cent. Export value of agriculture, forestry and fisheries products increases by an average of 15 per cent annually and accounts for about 30 per cent of total exports. Table 1.4: Value export of some agricultural products (million USD), 1995-2006 1995 1998 2000 2004 2006 Pepper 39 64 146 148 198 Coffee 598 594 501 616 1080 Rice 530 1024 672 947 1300 Tea 25 51 70 92 108 Cashew nuts 89 117 167 425 504 Source: MARD, 2006

415
Rice, coffee, rubber, tea, cashew nuts and pepper are Viet Nam’s major agricultural exports... The economy is the world’s second largest rice exporter and among the largest exporters of coffee, pepper, rubber. Growth rates in both the volume and value of agricultural exports has been remarkable over the past decade: rice exports have doubled in volume, rubber exports have more than trebled, coffee exports have quadrupled, and tea and pepper exports have increased five-fold. In value terms, the growth has been less spectacular, particularly for coffee which has suffered from fluctuation of world market price since 1997. Only in the case of cashew nuts has the growth rate in value terms outstripped expansion of export volume. Foreign investment in agriculture has increased through the period 1988-2006 (FDI projects licensed, up to 18/12/2006). However, the FDI flowing into agriculture account a small number comparing to other sectors meaning that the business environment in rural areas is still limited. Table 1.5: FDI in agriculture and other sectors, 1988-2005
FDI (mill USD) FDI (%) No of projects Total No of projects Total
Agriculture and forestry
718 3.558.3 10.54 5.88
Industry 4.602 38.010.6 67.55 62.85 Services 1.380 18.578.1 20.26 30.72
Total 6.813 60.473.6 100 100 Source: Ministry of Planning and Investment 1.2 Food processing in Viet Nam Although using the inputs from agricultural sector the food processing sector is categorized as sub-sector of the manufacturing industry. Processing industry covers several manufacturing activities such as producing food and beverage, tobacco, textile, wood processing, paper. It is observed that the processing industry in general plays an important role in the Viet Nam’s economy. The contribution of mining and processing industries and electricity and gas production and distribution sector to the GDP (by 1994 price) in years 2000, 2002, 2003, 2004 and 2005 was respectively 27,87%; 29,17%; 30,01%; 30,78% and 31,4%. This indicates that the contribution of processing industry in particular and of the two remaining sectors in general to the GDP had increased gradually. Table 1.6: Contribution of the processing industry to the GDP, 2000-2005 (%) No. 2000 2002 2003 2004 2005 1 Processing industry
in which including: food and beverage, tobacco, textile, wood processing and paper.
18.8 20.4 21.2 21.8 22.7
2 Mining industry 6.7 6.1 6.1 6.1 5.7 3 Electricity, gas and water
production and distribution 2.3 2.5 2.6 2.7 2.8
4 Construction 7.5 8.2 8.4 8.5 8.7 5 Transportation 3.9 3.9 3.8 3.8 3.8 Source: Statistical Yearbook of Vietnam, GSO 2005

416
In period 1995-2000, the processing industry recorded an annual growth rate of more than 12%. In the two years 1998-1999, as affected by the economic crises, the growth rate reduced to 10.2% and 7.48% respectively. Since 2000, the processing industry recovered and its growth rate constantly maintained at 10.4% contributing to the growth of industrial sector by 56-65%. In period 2001-2005, the average growth rate of this sector reached 17% and its contribution to the growth of industrial sector was by more than 80%. (Nguyen Khac Minh 2005).
Box 1: Processing technology applicable to some agricultural products Rice processing: Rice processing capacity has reached 20 million tons/year. Processing capacity of rice for export (milling, polishing, grading) has reached 5 million tons, achieving international standards. Products processed from rice, however share a low proportion and processing is mainly carried out in manual or semi-manual forms as for products like noodle, cakes… in order to meet the domestic demands. Coffee processing: Coffee processing capacity, where coffee is processed from fresh to seed form has met part of export demand. Coffee processing in milling and drying... shares a low rate (about 7-8% of the production). Tea processing: The economy has about 75 tea processing factories having a capacity of 1,200 tons of fresh bud tea a day. These factories have processed about 70% of the total tea output with such products as green tea and black tea. The remaining percentage of the output has been processed in hundreds of other small tea processing units across the economy (the products are mainly green tea). Source: CIEM, 2006 Demand drivers for the food processing industries It is widely reorganized that over the past 10 years the tendency toward industrialization and urbanization is the dominant factor affecting the Viet Nam’s economy. Industrial and urban development has created new demands for the development of food processing industries in terms of the rising of the middle class with changes in life style, income increase. During the period 1995 to 2005, the percentage of population living in urban areas has increased from 20% to 26%. In fact, the actual number may be higher as statistic number cannot count for a substantial proportion of informal groups migrated from rural areas to find high earning jobs in urban areas during the non-harvested time. Table 1.7. Population in urban and rural areas during 1995-2005
1995 2000 2003 2004 2005 Population in urban (%) 20.75 24.18 25.80 26.50 26.97 Population in rural (%) 79.25 75.82 74.20 73.50 73.03 Source: Statistical Yearbook of Vietnam, 1995-2005

417
The urbanization process with the rising-up of middle class living toward industrial tendency led to the changes of food demand to using more processed food. Consequently, supermarket chains have been in increasing trend, especially in the big cities such as Hanoi and Ho Chi Minh City. The number of supermarkets in Hanoi and Ho Chi Minh City in period 1990 – 2004 had increased considerably. During 1990-2004 the number of supermarkets in Ho Chi Minh City increased by 17% per year and 14% in Hanoi. According to the surveyed data of ADB, up to 2005, there had been 55 supermarkets in Hanoi and 71 supermarkets in Ho Chi Minh City. Table 1.8. Number of supermarkets in Hanoi and Ho Chi Minh city, 1990-2005
Year 1990 1993 2000 2001 2002 2004 2005 Hanoi 0 3 25 32 na na 55 Ho Chi Minh city 0 0 24 38 46 na 71 Note: Supermarket is defined as a shop that has an area of more than 250 m2 Source: ADB, supermarket and the poor in Vietnam, http://www.markets4poor.org Income increase also led to the changes in food consumption structure. Currently, the growth rate of income achieved by a rural household is only 28% comparing to 35% achieved by an urban household in 2002. This has been further widening the gaps in incomes and living conditions between rural and urban regions as well as between delta and mountainous regions (GSO, 2002). The average income (person/month) of a household by the year 2002 increased by 21.1% comparing to 1999 (with an increase of 10%/year). Also during the same period, the average income per person in urban area was 41 USD per month ((increased by 21.1%), and in rural area 18 USD per month (increased by 22.5% - which is higher than that level in urban area) (GSO, 2002). For low income groups, people commonly use a large part of income for food. When life is physically improved, the expenditure for food by people shall increase in absolute number but its proportion in the general expenditure shall reduce as families would spend more on other aspects such as clothing, housing, traveling, health-care and education… In 2001-02, expenditure for food by an urban household shared 52% and by a rural household shared 60% of the total expenditure; expenditure for food in group 5, which comprises richest families took 50% and in group 1, which comprises poorest families took 70% (GSO, 2002).However, there was a difference in expenditure for non-food items when comparisons were made between rich and poor groups. Expenditure for non-food items by group 5 – the richest group – was 7.5 times higher than the group 1 – the poorest group (GSO, 2002).

418
Table 1.9. Income and expenditure of five groups Group 1 Group 2 Group 3 Group 4 Group 5 Income Income (1 person/1month) (USD) 7.08 11.73 16.52 20.23 57.42 Expenditures Expenditure on food (1 person/1month) (USD) 5.68 7.18 8.55 10.83 17.91
Expenditure on other goods and services ((1 person/1month)) (USD) 2.43 3.99 5.51 8.27 18.18
Percentage of expenditure over income Food 80% 61% 52% 54% 31% Other goods and services 34% 34% 33% 41% 32%
Referred exchange rate 2002: 1 USD = 15,200 VND Source: VLSS, 2002 Notes: The population is divided into 5 groups of income level with the same number of people. Group 1(Quintile 1): The group has lowest income (poorest); Group 2(Quintile 2): The group has under average income; Group 3(Quintile 3): The group has average income; Group 4(Quintile 4): The group has rather rich; Group 5(Quintile 5): The group has highest income (richest) Food processing industry is still in the small size Since the enterprise law took effective in 2000, the number of food processing enterprises has increased rapidly. In 2005, there were 24068 enterprises operating in the processing industry, in which, food processing have 5086 enterprises, accounting for nearly 30%.The number of enterprises on food processing in 2005 was nearly 1.5 times higher than 2000. The number of enterprises by size of capital resources has increased gradually although the growth rate is still low. It is realized that most of food processing companies are in the small size. In 2005, only 36 enterprises have capital over 30 million USD, account for only 7% of the total sector. Table 1.10: Number of enterprises in food processing, 2002-2005 2002 2003 2004 2005
Kind of enterprises
No of enterprise
No of enterprise
Growth rate (%)
(2003/2002)
No of enterprise
Growth rate (%) (2004/2003)
No of enterprise
Growth rate (%)
(2005/2004) Agricultural and Forestry
972 939 -4.34% 1015 8.09% 1071 5.52%
Processing industry
14794 16916 14.34% 20531 1.37% 24068 7.23%
In which: Food processing and beverages
3954 4114 4.05% 4484 8.99% 5086 3.43%
Source: The situation of enterprises through the results of survey conducted in 2001-2006, GSO. About labor use: almost all enterprises in the field of food business are small and medium ones. Nearly 90% of them have less than 200 labors while the percentage of those who have more than 200 labors is just approximately 10%. Up to the year 2005, there is only one enterprise in food business having more than 5000 labors. (GSO, 2006).

419
Table 1.11: Number of enterprise by size of labor (31/12), 2002-2005 Unit: Enterprise
Total number of enterprises
By employees size
<5 person 5-9 10-49 50-199 200-299 300-499 500-999 1000-4999
>5000
Agricultural and Forestry
Year 2002 972 36 84 316 329 56 60 51 35 5
Year 2003 939 60 99 293 289 47 65 45 35 6
Year 2004 1015 60 123 346 288 54 54 47 38 5
Year 2005 1071 72 164 364 284 51 45 47 38 6
Industry processing
Year 2002 14794 870 2872 5659 3106 636 682 559 389 21
Year 2003 16916 982 3118 6739 3483 681 744 703 437 29
Year 2004 20531 1306 3850 8411 4071 796 839 737 491 30
Year 2005 24068 1777 4834 9838 4575 867 878 753 508 38
In which: Food and beverages processing
Year 2002 3954 518 1325 1267 472 81 115 103 73
Year 2003 4114 498 1269 1419 515 90 130 122 71
Year 2004 4484 540 1298 1612 589 117 124 126 78
Year 2005 5086 624 1505 1802 695 119 130 131 79 1
Source: The situation of enterprises through the results of survey conducted in 2001-2006, GSO. Similarly, the number of food processing enterprises with small scale of capital is less than that number with larger scale. There is approximately 33% of enterprise having charter capital of around 2-3 billion USD, 22% is 1.3-1.9 million USD while only 11% of those has more than 3 billion USD. Table 1.12: Number of enterprises by size of capital in food processing industry,
2000 - 2005 Unit: Enterprise
By size of capitals (million USD) Year Total number of enterprises
< 0.03 million USD
0.03 -0.06
0.06 - 0.3
0.3 - 0.6
0.6 -3.17
3.17 - 12.7
12.7-31.7
31.7 and above
2000 3485 1580 640 695 154 247 126 22 21 2001 3592 1380 678 863 179 299 145 29 19 2002 3954 1261 800 1049 229 389 162 41 23 2003 4114 1171 793 1214 240 426 198 47 25 2004 4484 1130 879 1380 295 483 230 56 31 2005 5086 1156 989 1651 348 575 269 62 36 Source: The situation of enterprises through the results of survey conducted in 2001-2006, GSO. Note: 1 USD = 15.875 VND (in 2005)

420
The number of food processing and beverage enterprises getting profits is higher than the number of enterprises in agricultural sector. For example, in 2005, 676 agricultural enterprises made profits while this number in food processing and beverage field is 3307. (Table 13) Table 1.13: The number of enterprises gaining or losing profits, 2002-2005
Unit: Million USD Kind of
enterprises Enterprises gaining profits Enterprises losing profits
Proportion to total enterprises (%)
No
Enterprises Total gains
(*)1
Average gain per 1
enterprises(*)
No Enterprises
Total lost (*)
Average loss per 1
enterprises(*)
No. of enterprises
gaining profits
No of enterprises
loosing profits
Agricultural and Forestry
Year 2002 612 68.8 0.11 245 -16.7 -0.06 62.96 25.21 Year 2003 590 125.0 0.21 242 -12.5 -0.05 62.83 25.77 Year 2004 645 173.3 0.26 242 -12.3 -0.05 63.55 23.84
Year 2005 676 220.5 0.32 229 -17.9 -0.07 63.12 21.38 Industry processing
Year 2002 10515 1297.9 0.12 3787 -370.8 -0.09 71.08 25.60 Year 2003 11454 1609.5 0.14 4592 -428.5 -0.09 67.71 27.15
Year 2004 13433 1975.0 0.14 5920 -471.1 -0.07 65.43 28.83 Year 2005 15182 2106.5 0.13 7426 -624.7 -0.08 63.08 30.85 In which: Food and beverages processing
Year 2002 3000 314.3 0.10 862 -114.0 -0.13 75.87 21.80 Year 2003 2981 372.1 0.12 982 -161.0 -0.16 72.46 23.87
Year 2004 3191 482.565 0.151 1067 -97.3 -0.091 71.16 23.80 Year 2005 3307 545.878 0.165 1464 -110.1 -0.075 65.02 28.78
Source: The situation of enterprises through the results of survey conducted in 2001-2006, GSO. The scale of food processing enterprise is growing alongside with the increase in capital investments on liquid assets, short-term investment as well as in fixed assets and long-term investment. Briefly, in 2002, food-processing enterprises have invested 2.41 million USD on movable assets and short-term investment and 3.68 million USD in 2005, while the numbers on fixed assets and long-term investment in 2002 is 2.09 million USD and 2.98 million USD for the year 2006. The amount is 1, 5 times greater than the overall capital invested in agriculture and forestry.
1 Exchange rate: 2002: 1 USD = 14806 2003: 1 USD = 15514 2004: 1 USD = 15745 2005: 1 USD = 15875

421
Table 1.14: Assets of enterprises, 2002-2005 Unit: Million USD
31/12/2002 32/12/2003 31/12/2004 31/12/2005
Current asset and short term investment(*)
Fixed asset and long term investment (*)
Current asset and short term investment(*)
Fixed asset and long term investment (*)
Current asset and short term investment(*)
Fixed asset and long term investment (*)
Current asset and short term investment(*)
Fixed asset and long term investment (*)
Agricultural and Forestry
0.50 1.60 0.60 1.65 0.71 1.78 0.83 1.97
Processing industry
11.53 11.45 13.67 13.58 17.71 16.60 22.37 18.94
In which: Food processing and beverages
2.41 2.09 2.80 2.35 3.23 2.56 3.78 2.98
Source: The situation of enterprises through the results of survey conducted in 2001-2006, GSO. (*) Exchange rate: 2002: 1 USD = 14806; 2003: 1 USD = 15514; 2004: 1 USD = 15745; 2005: 1 USD = 15875 FDI into food processing industry Investment projects into food industry is somehow less than in heavy industry and light industry, however, the scale of capital is larger. There are 235 projects in heavy industry with 2.5 billion USD while only 14 projects are in food industry with 4.8 billion USD already. Table 1.15: FDI into food processing industry, 1988 – 2007 1988-2005 2006 6 months/2007 No
Project Capital (USD) No
Project Capital (USD) No
Project Capital (USD)
Heavy industry 2007 18.897.265.482 235 2.561.278.105 144 77.966.747 Light industry 1933 9.702.132.768 237 4.759.947.676 175 698.527.933 Food processing industry
275 3.252.939.416 14 8.686.427.457 6 8.604.277
Agricultural and Forestry
831 3.884.827.395 53 6.170.222 28 6.111.868
Source: Ministry of Planning and Investment, 2007 1.3 Policies relating to enterprises Early policies focusing on land issues and trade liberalization had encouraged agriculture production, boosted trade and narrowed the gap between international and domestic prices of agricultural inputs and outputs. Further reforms in the 1990s have consolidated these gains, especially company law and competition law.

422
Enterprise law was promulgated on 12/6/19992. This law guarantees for the freedom, equality in running business by enterprises belonging to different economic components, strengthen effectiveness of state management over business activities, contributes to putting into full use the internal resources serving the economy’s industrialization and modernization and promotes the reform of national economy. The enterprise law has shifted from delivering licenses to making registrations for establishing enterprises, which has alleviated “hundreds” of small licenses and created opener business environment. Under the law, enterprises are free to select types of businesses (except the prohibited ones) as well as business locations. The law also stipulates conditions for running businesses. Since Enterprise Law was enacted, the business environment has created a booming for enterprise development. The number of enterprises registering for running businesses has remarkably increased. If in 2001, Viet Nam had 51,680 enterprises (in which the number of agricultural enterprises was 875), this figure raised to 91,755 in 2004 (in which the number of agricultural enterprises was 1015) (Dang Kim Son, Pham Minh Tri 2005 – based on surveyed data of GSO, 2003-2005). Competition Law A Competition Law had been adopted on 3 December 2004. The Law had entered into force on 1 July 200053. The Law applied to all enterprises, whether State-owned, private, State-controlled, equities or foreign-invested, and to trade associations. It is recognized that enterprise’s freedom to compete and protected the right to business competition. The Law prohibited anti-competitive acts and unfair competition. It also prohibited State management agencies from performing certain acts, such as forcing enterprises, organizations of individuals to buy or sell goods of provide services to designated enterprises (except for areas where the State held a monopoly or in emergency cases); discriminating between enterprises; forcing enterprises of trade associations to align with one another with a view to precluding, restricting, or preventing other enterprises from competing on the market; and performing any other act preventing the lawful business activities of enterprises. 1.4 Impact of trade liberalization on food processing ASEAN’s trade agreement Viet Nam officially became a member of ASEAN in 1997 and since then has actively participated into AFTA. AFTA: Up to 1 January, 2004, 91.3% of tax lines as applied to farm products have joined CEPT. The highest level (applied to processed farm products) is currently at 10% and was 5% in 2006. The CEPT’s average tax level is approximately at 7% (2004), 4.9% (2005) and 3, 7% (2006) comparing to the current MFN tax of 24, 5%. Following its commitment, Viet Nam 2 Enterprise Law 1999 (13/1999/QH10/12 June 1999) approved by The Ninth National Assembly of Vietnam on June 1999. 3 A Competition Law (23/2004/L/CTN) approved by The Ninth National Assembly of Vietnam on 14 February 2004.

423
will reduce taxes to 0-15% in years of 2011 and 2015. In the committed tax table, taxes to most of agricultural processed products will be reduced to 20-25% in 2009, 5-10% in 2013 and 0% in 2015 from their current MFN level of 40-50%. Vietnam’s agricultural trade to ASEAN countries Markets of ASEAN countries with population of more than 520 million, GDP of 542. 9 billion USD, consumption power of 320 billion USD in 2000 and a high and rapid economic growth, ASEAN has a high potentiality for further development and can attract a lot of investment and trade activities. Over the last few years, trade between Viet Nam and other ASEAN countries has been vigorously promoted. In period 1995-2004, export of Viet Nam’s goods and commodities to ASEAN’s market increased from 1.1 to 3.8 billion USD while import increased from 2.3 to 7.7 billion USD. However, in relative term there is a decline in the proportion in total trade. In period 1995-2004, the export to ASEAN over the total trade reduced from 20 to 14% and import dropped from 29 to 24% even though there was a slight growth in 2005 and 2006. AFTA has boosted Viet Nam’s export to ASEAN and that Viet Nam’s business enterprises have diversifying markets, promoting export to USA, Japan, EU, thus making export proportion to ASEAN declined. Table 1.16: Viet Nam’s export turnover to ASEAN, 1995-2006
Year Export (billion USD) Import (billion USD) Turnover Proportion Turnover Proportion
1995 1.1 20.4% 2.3 29.1% 1996 1.3 18.8% 2.7 24.0% 1997 1.9 20.8% 3.1 27.3% 1998 2.3 25.3% 3.7 32.6% 1999 2.4 21.3% 3.2 28.0% 2000 2.6 18.0% 4.5 29.0% 2001 2.5 17.0% 4.2 26.1% 2002 2.4 14.5% 4.7 24.2% 2003 2.9 14.7% 5.9 24.0% 2004 3.8 14.6% 7.7 24.7% 2005 5.4 na na na 2006 6.3 20% na na
na: not available Source: Ministry of Trade The figures in table 17 indicate that in period 1999-2003, export turnovers of some agricultural products such as coffee, pepper… exporting to ASEAN market have reduced even though for rice, ASEAN continues to be an important market. In 1998, due to financial crisis and difficulties in domestic production, Indonesia was forced to promote rice import. Export of Viet Nam’s agricultural products to ASEAN market had therefore significantly went up, achieving a value of 569 million USD. In the following years, the export value was maintained at 200 to 300 million USD. In 2005, rice export turnover rose sharply to 616 million USD.

424
Table 1.17: Value export of some agricultural products from Viet Nam to ASEAN, 1999-2005 1999 2000 2001 2002 2003 2004 2005 Coffee 96.3 58.9 22.7 20.4 40.0 24.6 31.3 Rubber 38.5 21.6 23.2 54.3 38.7 20.6 18.9 Tea 1.7 2.9 2.6 2.3 1.9 2.7 3.2 Rice 569.6 276.9 276.9 295.5 388.7 318.2 616.8 Cashew nuts 0.3 0.9 0.9 2.0 5.2 6.5 8.6 Pepper 83.4 83.4 57.5 13.7 11.0 11 9.4 Fruits and vegetables
21.0 21.0 7.6 19.0 20.5 19.6 20.8
Peanuts 31.8 31.8 36.0 50.7 46.4 26.3 32.5 Source: Ministry of Trade Within 5 years (2002-2006), the yearly growth in export has reached a high rate (Table 4). Singapore is Viet Nam’s major exporting market but the growth in export turnover to this economy is just above Laos. The main reason is that the export to Singapore has just started growing since 2004 with crude oil as a major exporting category. In 2006, crude oil exported to Singapore fell both in terms of value and volume, reflecting a sharp reduction comparing to other ASEAN nations (-16,5%). Table 1.18: The average growth in export to ASEAN countries (2002-2006)
Countries Average (period 2002-2006) growth in export (%) Cambodia 39,8% Indonesia 36,1% Lao 9,5% Malaysia 30,8% Myanmar 28,8% Philippine 20,7% Singapore 9,6% Thailand 28,9% Source: Ministry of Trade Viet Nam – American Trade Agreement Viet Nam officially signed Vietnam-American Trade Agreement (VATA) on 13 July, 2000 which in reality has enhanced export of a number of Viet Nam’s agricultural commodities to American market. Before signing VATA, the amount of Viet Nam’s agricultural products exported to America though increased through the years but faced difficulties due to the impacts of tariff and non-tariff barriers. In period 1995-1999, coffee export to America reached 100 million USD followed by sea products, such a shrimp (52 million USD), cashew nut (22.7 million USD) per year. In period 1996-1999, the commodity which earned higher export turnover was pepper with value rose from 84 thousand to 15 million USD. In this period, although export of Viet Nam’s farm products to American market had increased considerably, the potentiality as well as the strength of Viet Nam’s agriculture was not fully utilized as VATA had not been signed by the two countries.
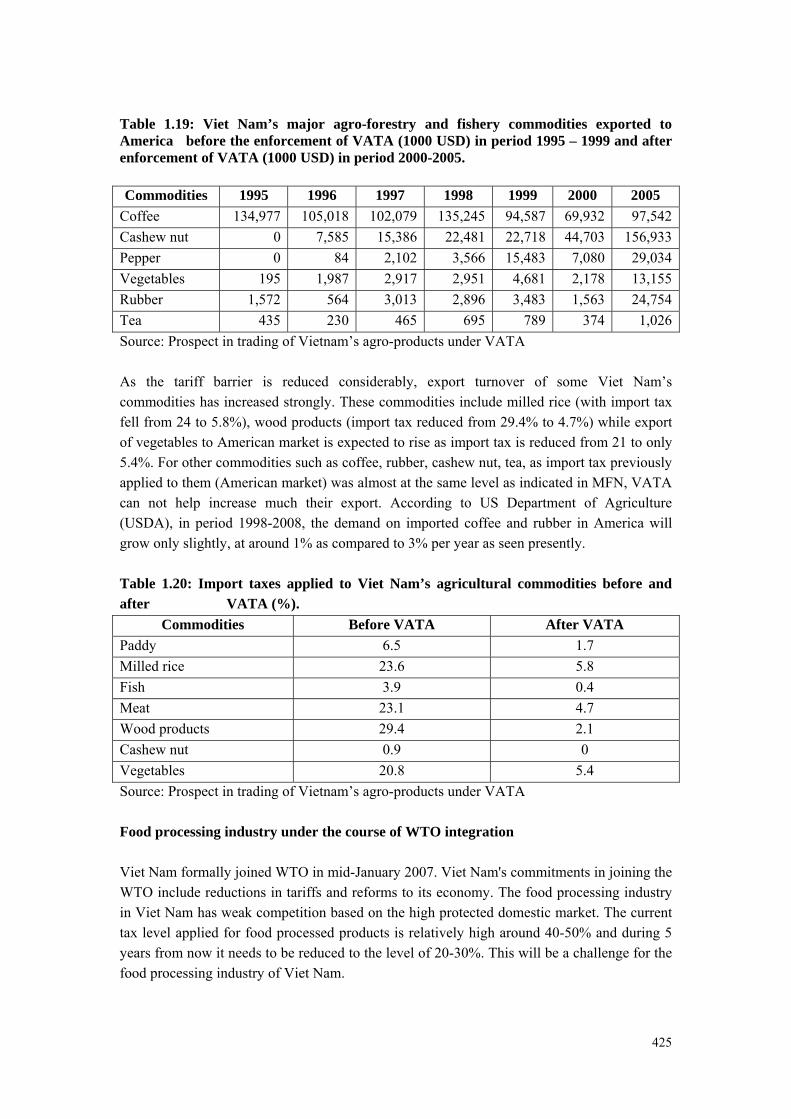
425
Table 1.19: Viet Nam’s major agro-forestry and fishery commodities exported to America before the enforcement of VATA (1000 USD) in period 1995 – 1999 and after enforcement of VATA (1000 USD) in period 2000-2005. Commodities 1995 1996 1997 1998 1999 2000 2005
Coffee 134,977 105,018 102,079 135,245 94,587 69,932 97,542Cashew nut 0 7,585 15,386 22,481 22,718 44,703 156,933Pepper 0 84 2,102 3,566 15,483 7,080 29,034Vegetables 195 1,987 2,917 2,951 4,681 2,178 13,155Rubber 1,572 564 3,013 2,896 3,483 1,563 24,754Tea 435 230 465 695 789 374 1,026Source: Prospect in trading of Vietnam’s agro-products under VATA As the tariff barrier is reduced considerably, export turnover of some Viet Nam’s commodities has increased strongly. These commodities include milled rice (with import tax fell from 24 to 5.8%), wood products (import tax reduced from 29.4% to 4.7%) while export of vegetables to American market is expected to rise as import tax is reduced from 21 to only 5.4%. For other commodities such as coffee, rubber, cashew nut, tea, as import tax previously applied to them (American market) was almost at the same level as indicated in MFN, VATA can not help increase much their export. According to US Department of Agriculture (USDA), in period 1998-2008, the demand on imported coffee and rubber in America will grow only slightly, at around 1% as compared to 3% per year as seen presently. Table 1.20: Import taxes applied to Viet Nam’s agricultural commodities before and after VATA (%).
Commodities Before VATA After VATA Paddy 6.5 1.7 Milled rice 23.6 5.8 Fish 3.9 0.4 Meat 23.1 4.7 Wood products 29.4 2.1 Cashew nut 0.9 0 Vegetables 20.8 5.4 Source: Prospect in trading of Vietnam’s agro-products under VATA Food processing industry under the course of WTO integration Viet Nam formally joined WTO in mid-January 2007. Viet Nam's commitments in joining the WTO include reductions in tariffs and reforms to its economy. The food processing industry in Viet Nam has weak competition based on the high protected domestic market. The current tax level applied for food processed products is relatively high around 40-50% and during 5 years from now it needs to be reduced to the level of 20-30%. This will be a challenge for the food processing industry of Viet Nam.

426
Table 1.21. Tax reduction applied to a number of commodities as committed with WTO
Commodities Committed tax at time
of joining WTO (%) Taxes committed to
reduce (%) Implementation
(year)
Coffee with caffeine 20 15 2010
Meat (not processed) 20 10 2012
Processed cashew nut
40 35 2012
Processed meat 30 25 2011
Milk products 30 25 2011
Cakes 34,4 25,3 2009-2011
Beer 65 35 2011
Wine 65 45-50 2011-2012
Processed fruits and vegetables
40 35 2011
Instant coffee 50 40 2010
Dried coffee
- Unmilled 40 30 2011
- Milled 40 30 2011
Packed green tea
- Leaf 40 - -
- Other categories 40 - -
Black tea
- Leaf 40 - -
- Other categories 40 - -
Sources: Taxes committed with WTO by Vietnam – Ministry of Finance (2006)

427
2 Tea Processing
2.1 Overview of Tea Sector in Viet Nam Commercialized tea production in Viet Nam developed strongly in the decades after independence with the establishment of state farms specializing in tea growing. Total production of fresh tea in Viet Nam was more than 400,000 tons in 2003, more than double the volume produced 10 years earlier. The sector is estimated to contribute more than USD 100 million to Viet Nam’s economy. Producers are concentrated largely in the southeast (65%), north central (9%), northwest (8%) and central highlands (8%), (Table 2.1). Tea production systems are fundamentally smallholder-based, with small farmers farming about 70% of cultivated area, and estates and factories cultivate tea on less than 0.2 ha of land (ADB, 2005). Table 2.1. Allocated tea producing area in Viet Nam (%), 1995-2005 Southeast 65 North Central 9 Northwest 8 Central Highlands 8 Source: ADB, The value chain for tea in Vietnam: Prospects for participation of the poor, 2005 The production of fresh tea in 1995-2006 increased from 187 thousand tons to 550 thousand, making annual average increased 11.4%, doubling the growth rate in the area. Renewing plantation, introducing new, high-yield and quality seedlings made this up. Tea productivity has increased by twice, from 2.9 ton/ha in 1995 to 5.0 ton/ha in 2006, making annual average increase of 3.84% yearly, (Table 2.2) (CIEM 2006). Table 2.2. Tea area, yield and production, 1995-2006
Year Planted area (1000ha) Yield (100kgs/ha) Production (1000 tons) 1995 70 29 187 1996 75 30 210 1997 80 32 245 1998 80 34 270 1999 85 39 330 2000 85 38 327 2001 100 37 345 2002 110 40 420 2003 120 40 450 2004 125 45 510 2005 120 47 530 2006 112 50 550
Source: CIEM, 2006 Currently there are two types of tea products in Viet Nam: black and green. The popular forms of processing black tea using equipment was bought mainly from India in 1987-1999, comprising of incomprehensive, incomplete production lines and insufficient to ensure high

428
quality. These production lines and equipment allow making higher quality products to meet the demand of the market. Tea export Tea export of Viet Nam accounts for 80-85% of the total output and it is mainly black tea of low quality and processed by orthodox technology. Most of Viet Nam’s tea is sold in form of primary products, without any trademarks, brand or origin. Table 27 shows that Viet Nam’s export volume of tea increased significantly, from 36,440 ton in 1999 to 89,000 ton in 2005 and it reached 95,000 ton in 2006. Tea export value increased from US$ 45 million to 100 million in 1999-2005. Therefore, growth rate of tea exports volume increased by 16.1% annually, higher than of its value, 14.2% (CIEM 2005). This implies that tea production effectives in not high, that is mainly of poor and leads to losses and waste of local resources.
Table 2.3: The quantity and value of Viet Nam’s tea export, 1999-2007
1999 2000 2001 2002 2003 2004 2005 2006 Estimated 2007
1000 tons 38 57 65 72 60 95 87 95 110
Million USD 43 68 79 81 60 95 95 98 140Source: CIEM, 2007 There have been positive changes in the tea export structure in recent years, though orthodox black tea still shares a greater portion, Viet Nam has been exporting green tea such as Oolong, Suchong of higher value. Most of tea exports are of poor quality. Therefore, tea export of Viet Nam does not have any influence on the prices of the world market. In this condition, it is unavoidable for Vietnamese tea exporters to be suffered from price fluctuations.
Table 2.4: Viet Nam’s tea export price (2001-2007)
Year Price (USD/ton) 2001 1190 2002 1200 2003 1010 2004 1000 2005 1100 2006 750
Estimated 2007 1200 Source: CIEM, 2007 2.2 Structure of tea processing in the market At present, the number of private tea processing companies has increased in tea growing regions. This has further promoted the development of a competitive fresh tea market with

429
participation of major actors who are farm households and processing companies. Due to the development of tea export, the entrance of private enterprises makes tea market become more competitive. Viet Nam now has five different types of processors identified as: non-registered households, registered households, private companies, State-owned and Joint-venture foreign company. More buyers make the market more and more competitive, providing more opportunities for tea farmers. Fresh tea markets are not limited within certain localities but they are open up to other localities and regions. There were 630 tea processing entities of different economic sectors, of them 49 SOEs (including 28 equities ones) with average capacity of 800-2000 tons yearly; 5 foreign with 100% foreign capital with total capacity of 50-500 tons product a year (to produce black tea and high-value green tea such as Oolong, Pouchung); 2 joint ventures with foreign companies with the capacity of 2000-3000 tons products yearly. In addition, there are 10 thousand processing units’ primitive technologies. The total tea capacity is 550 thousand tons a year. (CIEM, 2006)
Box 2: Actors involve in tea processing Processing household Household process is mainly green tea. Their average capacity is small, less than 200 kilograms fresh tea a day, using simple technologies and primitive equipment, using mainly their own fresh tea, some households buys fresh tea from other farmers. SOEs Tea SOEs presently maintain an important role in tea industry, especially in processing and export. Table 2.2 provides some information of SOEs’ scale in term of processing and labor. Most of SOEs have small scale with less than 500 ton dry tea capacity annually (accounting for about 42%); those that have the capacity of over 5 thousand ton share just 2.4%. In term of labor, most of them use less than 50 workers (accounting for 37%), those that use over 250 workers account for 14.6% Joint venture in tea sector Tea joint ventures were created in 1990s of the last century. By 2004, there were 2 joint ventures, with 100% foreign capital in the North. There were 11 joint ventures with Chinese Taipei in the South of Viet Nam. They enter contracts with farmers to grow and use workers to process tea. Most of their products are for exports. Source: CIEM, 2006 2.3 The Conduct and Performance of tea processing The tea value chain in Viet Nam has two main channels, although there is some overlap between them. The first channel, dominant in the past, is centered on wage farmers (called

430
“worker farmers” in our analysis) or contract farmers affiliated with large plantation-based factories producing tea that is directed mainly toward export markets (through VINATEA in the case of state-owned or ‘joint-stock’ companies). The second channel – encompassing the majority of farmers – involves smallholders producing tea along with other crops and livestock. In this channel, smallholders is what we term “unlinked”, meaning that tea sales are derived solely through market-based relationships rather than any formal integrative linkages with other actors in the chain. The two channels continue to be largely separate, though less so than in the past as large plantations have begun in small measure to source tea from contracted smallholders who largely retain their independence and engage in a mix of market and contracted sales. However, contracted sales remain small in general, due to problems among both producers and processors in keeping to the terms of the contract in the event that the market price changes In the first channel, worker farmers and contract farmers have a closed contractual relationship with factories under the framework of the 1995 Decree 01 of the Government which granted them land rights to produce tea for up to 50 years. These farmers must provide all or a large proportion of their output to factories. In return, the factory provides them with stable demand, credit for inputs and technical training. However, the tea price is not addressed in the contracts and may fluctuate below the market price (particularly with SOEs). Moreover, these farmers do not have land certification, limiting their access to credit. When factories face difficulties, it affects these farmers particularly since they depend solely on the factory and their income derives mainly from tea. In the second channel, unlinked farmers sell fresh tea mostly to assemblers (who may sell to large or small processors) or directly to small-scale processors. Alternatively, they may process tea leaf at home then sell dry tea to assemblers. The development of private sector traders and processors, along with improvements in technology and transport infrastructure and reductions in the cost of processing equipment, has enlarged the size of the market, creating large scope for farmers to improve employment and income. With the establishment of processing units, especially since 1998, farmers have many more choices for their sale. While the development of private processors has increased competition in the tea market and reduced the monopoly power of state companies, their scale remains small. Until the 1990s, the most common drink for Vietnamese families has been green tea. However during the past 10 years, the tea market in Viet Nam has experienced substantial change, especially in big cities. On the supply side, foreign corporations such as Dilmah and Lipton have entered the domestic market with black flavored teas. Subsequently, the appearance of domestic rivals such as Kim Anh, Hong Tra and Cozy has expanded consumer choice. Further, advertisement campaigns and the emergence of many tea bars have changed the attitudes and behaviors of the younger generation of consumers to diversify their drinking patterns. On the demand side, increasing incomes coupled with busy lifestyles in urban areas have generated demand for instant tea and tea bags. Concentration ratio (CR)

431
Concentration ratio (CR) is the cumulative share of the k largest firms in the market, where typical values of k are 3 in year 2004; k are 6 in year 2005 and k are 5 in year 2006. Thus, the third-firm concentration ratio is the sum of market shares of the third largest firms in the industry to the total market share. Similarly, the sixth-firm concentration ratio is the sum of market shares of the sixth largest firms in the industry to the total market share. And the fifth-firms concentration ratio is the sum of market shares of the fifth largest firms in the industry to the total market share. The most common measures of market size is sales. Concentration ratios have the advantage of being relatively easy to understand. It ranges from a value of zero percent for a perfectly competitive industry to a value of 100 percent of market share, for a monopoly. Thus, if CR3, CR6 and CR5 fall in the quartiles of 75-100 percent, the industry is considered as highly concentrated, moderately concentrated if in quartile 50-75%, slightly concentrated if 25-50%, and atomistic if in the quartile of 0-25%. Let CR represents the concentration ratio. Therefore, CR = Σ Si Where, Si = the market share of firm I, belonging to the k largest firms. Applying CR in calculating for third, sixth and fifth largest firms in tea during the year from 2004 to 2006, we have the results as follows: Table 2.5: Market share of some leading tea export companies, 2004-2006 No Year 2004 Year 2005 Year 2006
Name of enterprise
Value (mill.USD)
(%) with total economy export
Name of enterprise
Value (mill.USD)
(%) with total economy export
Name of enterprise
Value (mill.USD)
(%) with total economy export
1 Vinatea* 6.4 6.76 Vinatea* 8.1 8.54 Vinatea* 15.9 16.24
2 Nghe An Tea*
3.1 3.26 Phu Da 5.0 3.21 Nghe An Tea*
3.5 3.63
3 Red Tea* 2.9 3.06 Red Tea* 4.5 4.82 Ladotea* 2.1 2.24
4 Phu Ben 4.3 4.608 Thang Long
2.0 2.10
5 Nghe An Tea*
3.4 3.58 Hoang Binh
1.4 1.51
6 Ladotea* 3. 3.21 Total
economy export
95 95 98
% of 3 leading enterprises
13.08 16.57 22.11
Source: Ministry of Trade, www.mot.gov.vn Note: * describes a State Own Company (some enterprises are privatization; the others are on the process of privatization). Government owned enterprises still control the tea export market. VINATEA (Vietnam Tea Corporation) control the largest percentage (approximate 7% in 2004). Their market share has grown to 16% on 2006. Moreover, on 2005, another two FDI enterprises (Phu Da Tea

432
Corporation and Phu Ben Tea Corporation) entered the market. Phu Da Tea Corporation is a join-venture of Vietnam Tea Corporation and Foodstuff Group of Iraq. Phu Da’s market share is about 5%. Phu Ben Tea Corporation is a 100% foreign owned enterprise of Sipel Group, from Belgium, with 4.5% market share. Unfortunately, the appearance of foreign owned enterprises did not affect the market much. For example, Nghe An Investment and Development Tea Company’s market share is still at the level of 3% in the period of 2004-2006. The share of export of 3 leading companies over total export in the economy has also increased by time. In 2004, the 3 leading companies accounting for 13.08% of total share market in whole economy. In 2006, this number is 22.11%. (Table 26) According to the result below, tea industry is slightly growth during the year from 2004 to 2006. However, due to the CR index, tea industry is belong in the quartile 0-25%. It means that the tea industry is atomistic. 2.4 Tea Industry Development Policy Ministry of Agricultural and Rural Development have prepared the tea industry development plan to reach the target of export 120.000 ton in 2010 with the income of 200 million USD. The solution included: marking off tea development; strengthening international cooperation and trading promotion, widening tea market, encouraging every partners in the economy invest on tea processing industry and partly modernizing concurrent company, guaranteeing the capacity of high quality tea processing, diversifying tea products as well as reconstructing the tea industry. Ministry of Agricultural and Rural Development have requested Vietnam Tea Corporation join with National Institute of Agricultural Planning and Projection in planning a development policy in tea producing and processing in all over the economy, estimating the appropriate cultivated surface for each area and building high quality and quantity seeds. Provinces should concentrate on developing farm of tea near the processing factory. Up to 2010, the black tea and green tea products should have the same percentages (50% each). Orientation for market export: strengthen main markets such as: Pakistan, Chinese Taipei, Iraq, Russia... and increasing export to potential market like Philippines, Kenya, Iran, Laos, and New Zealand. Most of all, exporting tea enterprise should pay more attention about quality issue. Tea processing factory should strictly follow quality control rule of Viet Nam. Besides, Government should support and encourage these enterprises apply ISO and HACCP into their production; concentrating on tea-related foodstuff in order to meet the consumers’ demand.

433
3 Coffee Processing
3.1 Overview of Coffee sector
Coffee area, production and productivity
Coffee trees were planted for the first time in Viet Nam in 1888. In 1994, hoarfrost in Brazil destroyed a large part of coffee area of this economy, causing a sharp reduction in world coffee supply and an increase in coffee prices. All these factors encouraged the coffee planters in Viet Nam to extend coffee area and intensify coffee plantation. The coffee area increased by 23.9%/year on average, bringing the total coffee area in 2000 to 516.7 thousand ha. Comparing to 1980, the coffee area has increased by 23 times. However, the coffee area in Viet Nam, within 5 years (2000-2005), had reduced by 70 thousand ha and will continue to reduce especially in the regions having unfavorable planting conditions. The growth in coffee production in early years of 90s was mainly attributed to the increase in area. In the following years, the increase was mainly attributed to the increase in productivity. In period 1994-2002, the productivity and area contributed to the growth of coffee production by 38% and 62% respectively.
Table 3.1. Coffee area, yield and production, 1991-2005 Year Area (1000 ha) Production (1000 tons) 1991 115.1 100 1992 103.7 119.2 1993 101.3 136.1 1994 123.9 180 1995 186.4 218 1996 254.2 316.9 1997 340.3 420.5 1998 370.6 427.4 1999 477.7 553.2 2000 561.9 802.5 2001 565.0 840.6 2002 535.5 776.4 2003 513.7 771.2 2004 503.2 834.6 2005 491.4 767.7
Source: Tran Quynh Chi (2007), Vietnam’s Coffee Profile Coffee is Viet Nam’s important export commodity. For 25 years now, coffee production in Viet Nam has grown rapidly in planting area, productivity and export. From only an output of less than 10,000 tons each year, Viet Nam has quickly become the second largest coffee producer in the world with an output of more than 800,000 tons or approximately 1 million tons each year. And from a economy having a small amount of coffee for export with about 90 thousand tons in 1990, Viet Nam gradually became one of the largest coffee exporters in the world with an export volume of 900 thousand tons in years 2005/2006. Currently, the export value fluctuates between 400 and 600 million USD/year.

434
Table 3.2. The quantity and value of Viet Nam’s coffee export, 1991-2006 Year Quantity (1000 tons) Value (million USD)
1991 93.50 76.30 1992 116.20 91.50 1993 122.60 110.80 1994 176.20 330.30 1995 248.10 598.10 1996 283.70 400.26 1997 391.80 493.71 1998 381.80 593.80 1999 482.46 585.30 2000 733.94 501.45 2001 910.00 385.00 2002 719.00 317.00 2003 749.24 504.81 2004 974.80 641.02 2005 892.37 735.48 2006 775.46 826.99
Source: Tran Quynh Chi (2007), Vietnam’s Coffee Profile Viet Nam’s coffee is sold to 60 markets in the world focusing on Germany, USA and UK. For 5 years, (2001-2005) coffee exports to these three markets were about 39.8% of the total export volume, of which 15.9% to Germany, 15.5% to USA and 8.8% to the UK. Export of coffee have increased strongly to UK, Spain and Italy and decreased to Switzerland, Japan, Netherlands and France. For example, export to Switzerland was 106 thousand ton in 2001 and it was down to 27.1 thousand in 2005. Similarly to Japan, it was 40.7 thousand ton down to 29.4 thousand; for France, 35.3 thousand down to 27.5 thousand and for the Netherlands 46.9 thousand down to 19.4 thousand for the same period. Table 3.3. Ten largest importers of coffee from Viet Nam
Unit: 1000 tons Countries 2001 2002 2003 2004 2005 Total five
years Germany 123 111 115 173 92 614 USA 147.1 90.1 109.4 135.4 117.7 599.7 UK 63.2 37.5 69.2 125.6 46.4 342.0 Spain 56.3 49.3 58.7 67.8 63.9 295.9 Belgium 91.3 56.7 27.8 71.0 23.4 270.3 Italy 46.8 44.4 49.7 53.7 62.6 257.0 Switzerland 106.0 37.8 29.4 41.8 27.1 242.2 Japan 40.7 34.8 24.7 29.0 29.4 158.6 France 35.3 28.0 35.3 29.4 27.5 155.6 Netherlands 46.9 29.0 24.7 25.1 19.4 145.1 Source: CIEM, 2006 Coffee price The data of coffee export during 1991-2004 shows that Viet Nam’s coffee export prices are often lower than the world average prices. This again indicates Viet Nam has not paid sufficient attention to coffee export strategy in terms of its quality; categories and markets in

435
order to gradually increase it export prices. Low export prices are identical to the rate of domestic resources that are used for coffee production and export.
Table 3.4. Viet Nam’s coffee export prices, 1988-2006 Year Export prices
(USD/ton) Robusta price in world market
(USD/ton) 1988 1.750 2.080 1989 1.420 1.656 1990 1.030 1.182 1991 820 1.072 1992 790 941 1993 1.340 1.158 1994 1.590 2.621 1995 1.400 2.771 1996 1.539 1.806 1997 1.270 1.736 1998 1.555 1.823 1999 1.213 1.489 2000 681 913 2001 423 607 2002 428 662 2003 644 853 2004 613 828 2005 921 1.000 2006 1.106 1.350
Source: Tran Quynh Chi (2007), Vietnam’s coffee profile 3.2 Technology and degree of impact by some factors on coffee processing There are two ways of industrial processing: dry4 and wet5. Coffee seeds are sorted by dimension and color and packaged to be sold to factories to make coffee powder or export companies. Since 1994-1995, some coffee processing and sorting lines had been imported from Brazil, Germany and UK for coffee SOEs. From 2000 up to now, in 17 SOEs 15 have newly equipped, of them 80 - 100% are wet processing lines and 70 – 100% of reprocessing lines are locally made. But all color sorting equipment is imported. The scope and role of processing industries are still weak in the position of coffee in terms of production and exports. Processed coffee still shares about 30% of total exported coffee. Growing is an important activity in coffee production and marketing process. Growing consist of activities of new planting, taking care of, harvesting fresh coffee. The quality of fresh coffee is very critical for its processing and final products.
4 Dry technique is used to process Robusta when and where the sun is strong and less humidity. This drying technique is simple and can be done by farm households and it is very commonly applied. 5 Wet processing technique is used for processing Arabica when there is little sun. The advantage of this method is the one can be active and does not require large grounds, ensuring good quality of dry seeds, then higher price (US$ 60 -70 a ton) than coffee seeds dried by the first technique.

436
Most of coffee areas have been allocated to farms households and coffee SOEs by the Land Law; there is no more land area that can fit coffee and clearing forestry land is strictly controlled. An increase in price of fuel and other inputs is direct element to push up expenses in production cost, reducing much of marginal profits of farmers and undermines the motivation of making intensive production coffee. Changes in prices of some agricultural inputs, fuels used for coffee growing and production have been big effected on coffee processing. For example, the price of oil that used for irrigation, increased by 122% and 86,7% respectively, those of fertilizer, insecticides that are used directly for growing and taking care of coffee such as urea and kali increased 100%, the latest growth rate is still equal to the increased of price at which fresh coffee is sold (25%). Furthermore, the coffee grower’s access to formal credits is difficult. They must spend a lot of time to go to banks and also spend a lot for travel. It is usually that when they get loans investment opportunity is over. And the last, in the condition of Viet Nam manual processing by simple technique at household level is popular and it still has an important role coffee processing sector. 3.3 The Conduct and the Performance of the coffee processing
Actors involve in coffee processing The primary actors involving in coffee plantation are households, worker farmers who sign contracts with state farms, state forestry enterprises or other state own companies. Formerly, the state played a key role in purchasing and processing coffee. However, raw coffee that farmers sold directly to the state processing units through contracts accounted only for 10 – 15% of the total coffee produced by farmers. The rest was mainly sold through the medium channel. Some households processing coffee at small scale and with low capacity usually attained from 500 kg to one ton per hour. Small and handy processing shared about 70% of the total sector’s coffee output. This indicates that the role of the General Coffee Company and SOEs has not been put into full play, especially under the current international economic integration situation and that there is not a strong linkage between coffee plantation and coffee marketing. The poor connection between processing and production also leads to the fact that coffee material is surplus in this place but in shortage in others. Almost all processing units do not pay due attention to building and developing coffee production regions for them. Under the increased integration process, the emergence of new actors such as private and Ltd. Companies has positively impacted on and created “new waves” to the market.

437
Box 3: The success of Trung Nguyen coffee
As one of the ten strongest trade marks in 2005, “Trung Nguyen Coffee” has brought about a new atmosphere to coffee consumption in Viet Nam and many other countries in the world. In 2002, the Trung Nguyen coffee company officially introduced to the public the G7 instant coffee. This was the first time Trung Nguyen produced instant coffee after it had successfully produced dried coffee. Trung Nguyen has also developed many lines of products to meet the demands of different clients. After some periods, Trung Nguyen coffee has won the confidence of both local and oversea consumers.
Source: www. agro.gov.vn Marketing channels In the past, almost all coffee in Viet Nam was grown on state farms and delivered to the state farm processing plant. State farms processing plants generally have capacities of around 3000 tons, making them appropriate for farms of around1000 to 1500 hectares. And the coffee would then be delivered to the port for export under a government to government contract. Since Doi Moi, the marketing channels have become much more complex. Farmers associated with a state farm generally sell their output to the state farm processing plant, though they have the option of selling some outsides provided fulfill their financial responsibilities to the state farm. Independent farmers may sell the coffee to a private trader, to an agent of a processing plant, or directly to a processing plant. State-owned enterprises with processing plants, including both state farms and specialized processor-exporters, are allowed to export directly. According to the surveyed data of VLSS 2002, there were not many Vietnamese people consuming coffee in their families. In normal days, about 19.2% of people used coffee, of whom 47% used instant coffee and 53% used powder coffee. In 2002, one Vietnamese people consumed 1.25kg of coffee/year on average. The coffee consumption value in 2002 was 9,130 VND per person per year. As assessed by many specialists, coffee consumed locally in Viet Nam is at small number. While one person in North Europe and West Europe consumes 10kg and 5-6 kg of coffee respectively each year, one person in Viet Nam consumes only 500 gr6. At present, Viet Nam has some big coffee production, processing and export establishments such as Trung Nguyen coffee company, Nescafe, Vinacafe, Thu Ha, Highland…. Most of coffee processed by these companies is used for export. For example, in Thu Ha coffee company in Pleiku, more than 300,000 tons of powder coffee produced by the company was used for export.7
6 www.vnexpress.net, 10/2005 7 According to the report: “Study on coffee marketing in Hanoi and Ho Chi Minh city”, 2006

438
With regard to domestic coffee consumption, recent studies of World Bank (WB) indicate that the domestic market in Viet Nam will potentially consume 70,000 tons of coffee each year, taking almost 10% of the total output. According to the statistic figures of VLSS, if coffee consumption per person in Viet Nam was 1.25kg per year, then in 2002, the total coffee amount consumed locally across the economy must have been about 95.000 tons. Based on data developed by Institute of Policy and Strategy for Agriculture and Rural Development (IPSARD) on domestic coffee consumption, coffee consumed in Hanoi was 700 gr/person and in Ho Chi Minh City 1.3kg/person. Therefore, on average, the total coffee amount consumed locally according to this survey accounted for 10% of the total output. Meanwhile, according to the International Coffee Association, the local coffee consumption in Viet Nam accounted only 5% of the output, the lowest level compared to other coffee production countries. This difference becomes more “limping” if it is compared to the domestic consumption of 25.16% of member countries of the International Coffee Association. Concentration Ratio Similarly calculating the CR index in tea industry for calculating for fifth largest firms in tea during the year from 2004 to 2006, we have the results as follows: Table 3.5: Market share of some leading coffee export companies, 2004-2006
No Year 2004 Year 2005 Year 2006 Name of
enterprise Value (mill. USD)
(%) with total export
in whole economy
Name of enterprise
Value (mill. USD)
(%) with total
export in whole
economy
Name of enterprise
Value (mill.USD)
(%) with total export
in whole economy
1 INTIMEX* 88 13.86 INEXIM-Dak Lak*
36 4.90 Vinacafe Buon Ma Thuot*
145 17.54
2 Simexco *Dak Lak
50 7.93 Generale-xim 22 3.05 ACOM 34 4.22
3 Vinacafe Buon Ma Thuot*
50 7.88 Dakman Company
19 2.65 Dakman Company
21 2.62
4 Nothern Foodstuff
38 5.92 IASAOCO 6 0.84 IASAOCO 10 1.21
5 INEXIM*Dak Lak
36 5.63 Thang Loi Company
5 0.72 Phuoc An 5 0.61
6 Mascopex 20 3.16 Trung Nguyen
2. 5 0.34 Vinacafe Bien Hoa*
2.1 0.25
7 TIMEX 17 2.78 Vinacafe Bien Hoa*
2.3 0.32
8 Thai Hoa 10 1.59 Vinacafe Buon Ma Thuot*
2.2 0.30
9 Bien Hoa* Coffee Factory
2 0.37
Total whole economy export
641 735 826
% of 6 leading companies with total export in whole economy
44.38 12.5 26.45

439
Source: Ministry of Trade, www.mot.gov.vn *describes a State Own Company (some enterprises are privatization; the others are on the process of privatization). In 2004, the fifth-firms largest in coffee industry is belong in the quartile, it means that the coffee industry is slightly concentrated. However, in 2005, fifth-firms largest in coffee industry is only account 12.5%. It means these firms is atomistic. In 2006, the situation is similarly in year 2004, the fifth-firms is slightly concentrated.
In recent years, joint-venture enterprises like Vinacafe Bien Hoa, Vinacafe Buon Ma Thuot as well as private enterprise like Trung Nguyen has made a great advantage in coffee producing and exporting activities. The market share of those enterprises is growing. In 2004, Vinacafe Buon Ma Thuot’s market share is 8% and it grew rapidly to 18% in 2006. The share of 6 leading companies over total export in the economy has fluctuated by time. In 2004, 6 leading companies accounting for 44.38% of total share market in whole economy. However, in 2005, this number decrease, only reach 12.5%. And in 2006, the number is 26.45%. The reason is that, more and more private companies entering into the market, leading to the reduction in the market share of SOEs enterprise and others big companies. (Table No. 31) Coffee industry policy On 20 June 2005, the Prime Minister issued Decision No.150/2005/QD_TT approving the plan to restructure the agriculture, aquaculture and forestry nationwide by 2010 and the 2020 outlook. Regarding planning to restructure agriculture, aquaculture and forestry by 20 10 and the 2020 Outlook, the decision stated land planning for coffee trees as follows: Continuing to cut down the cultivation area in regions with less suitable conditions for coffee growing; sustain the area of 450-500 thousand hectares, specifying proper structure for coffee trees in regions with suitable conditions for growing coffee, reserving more area for the Central Highlands, South-Eastern Viet Nam, and North Central Coast. Grasping the Resolution 150 of the Prime Minister, the Ministry of Agriculture and Rural Development issued decision No. 150 of the Prime Minister, the Ministry of Agriculture and Rural Development issued decision No.3988/QD_BNN_TT dated 26 December 2006 approving the Project on Intensive Farming of long-term crops by 2010, including coffee, rubber, cashew, pepper and tea. The decision clearly addressed the area for coffee of 460,000 hectares, of which 45% is for specialized coffee regions with expected productivity of 2.4 tons per hectare and average productivity of 2.0 tons per hectare. Exported coffee products are 850,000 tons.

440
4 Cashew Nuts Processing
4.1 Overview of Cashew nuts in Viet Nam
Cashew nut started to be known as a high economic value crop in Viet Nam 20 years ago. For 7 years now (2000-2007), the crop has been planted widely and on large scale. Formerly, cashew nut was planted without projection, in spontaneous manner and mainly by the poor and could not return high yield and high economic value. Cashew nut plantation started in Viet Nam in the 18th century, but the exploitation of its economic value could only begin in the year 80’s when farmers were encouraged to produce cashew nut for export. In 1975, Viet Nam had only 500 ha of cashew nut. The area after that was extended to 187,000 ha in 1995, and 342, 2 thousand ha in 2006. In 2006, cashew nut output reached 227.4 tons with an increase by 4.8 times in area and 8.1 times in volume (compared to 1990); the yield was recorded at 2.92 tons per ha on average (Report on cashew nut commodity for the first 6 months of 2007 – Agroinfo).
Table 4.1: Cashew nut area and production, 1975-2007
Year Area (ha) Production (ton) 1975 500 na 1990 7.000 28.000 1991 75.000 31.000 1992 78.973 32.004 1993 122.530 69.089 1994 172.740 87.957 1995 187.553 92.512 1996 194.900 59.200 1997 202.500 70.100 1998 191.800 54.000 1999 189.102 55.028 2000 195.576 67.599 2001 198.914 70.006 2002 240.300 128.800 2003 257.900 159.300 2004 282.113 206.407 2005 327.800 232.000 2006 342.200 227.400 Source: Report on cashew nut commodity, 2007 – AGROINFO, www.agro.gov.vn
A national plan for cashew nut production was set up in 2000 following the Decision 120/1999/QĐ-TTG of Prime Minister on cashew nut development up to 2010. The plan sets out targets to be achieved on area, raw and kernel outputs and export up to 2010. Based on this projection, guidance of the central and local authorities has been released instructing on cashew nut production towards extending and stabilizing planting area and setting up material locations by putting into full use the regional advantages and applying advance science and technology. Provinces have favorable conditions for cashew nut growing has also developed
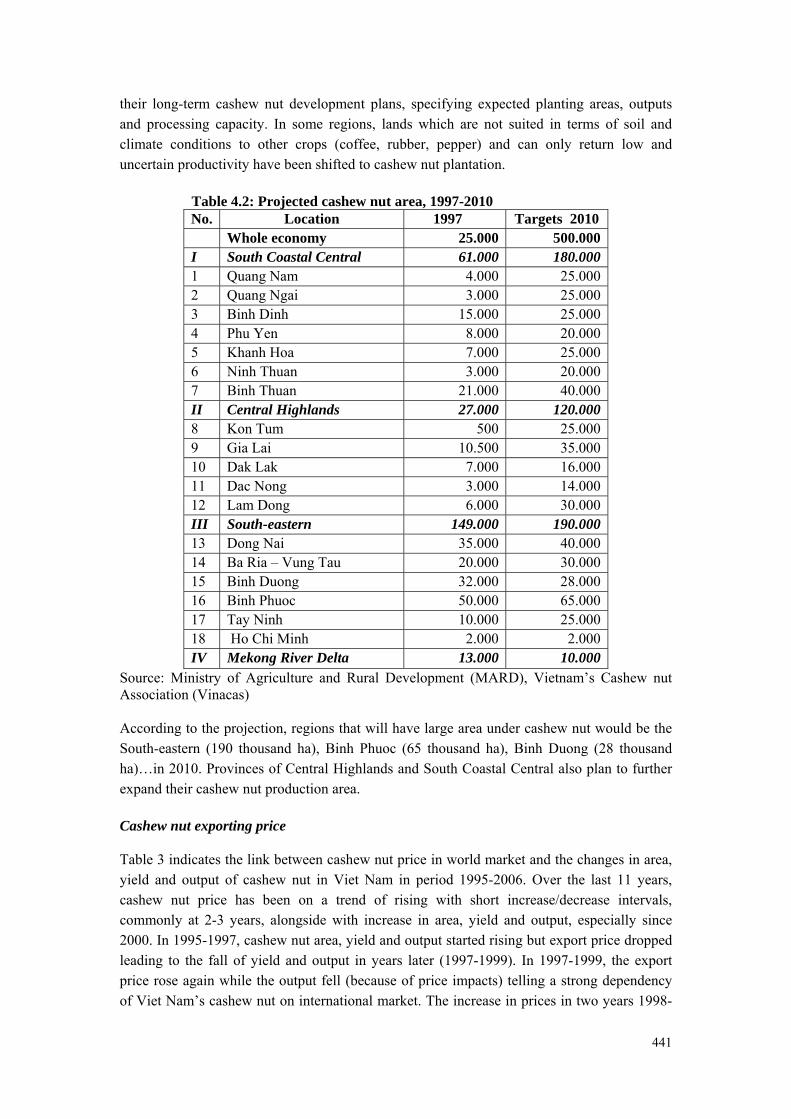
441
their long-term cashew nut development plans, specifying expected planting areas, outputs and processing capacity. In some regions, lands which are not suited in terms of soil and climate conditions to other crops (coffee, rubber, pepper) and can only return low and uncertain productivity have been shifted to cashew nut plantation.
Table 4.2: Projected cashew nut area, 1997-2010 No. Location 1997 Targets 2010 Whole economy 25.000 500.000 I South Coastal Central 61.000 180.000 1 Quang Nam 4.000 25.000 2 Quang Ngai 3.000 25.000 3 Binh Dinh 15.000 25.000 4 Phu Yen 8.000 20.000 5 Khanh Hoa 7.000 25.000 6 Ninh Thuan 3.000 20.000 7 Binh Thuan 21.000 40.000 II Central Highlands 27.000 120.000 8 Kon Tum 500 25.000 9 Gia Lai 10.500 35.000 10 Dak Lak 7.000 16.000 11 Dac Nong 3.000 14.000 12 Lam Dong 6.000 30.000 III South-eastern 149.000 190.000 13 Dong Nai 35.000 40.000 14 Ba Ria – Vung Tau 20.000 30.000 15 Binh Duong 32.000 28.000 16 Binh Phuoc 50.000 65.000 17 Tay Ninh 10.000 25.000 18 Ho Chi Minh 2.000 2.000 IV Mekong River Delta 13.000 10.000
Source: Ministry of Agriculture and Rural Development (MARD), Vietnam’s Cashew nut Association (Vinacas) According to the projection, regions that will have large area under cashew nut would be the South-eastern (190 thousand ha), Binh Phuoc (65 thousand ha), Binh Duong (28 thousand ha)…in 2010. Provinces of Central Highlands and South Coastal Central also plan to further expand their cashew nut production area. Cashew nut exporting price Table 3 indicates the link between cashew nut price in world market and the changes in area, yield and output of cashew nut in Viet Nam in period 1995-2006. Over the last 11 years, cashew nut price has been on a trend of rising with short increase/decrease intervals, commonly at 2-3 years, alongside with increase in area, yield and output, especially since 2000. In 1995-1997, cashew nut area, yield and output started rising but export price dropped leading to the fall of yield and output in years later (1997-1999). In 1997-1999, the export price rose again while the output fell (because of price impacts) telling a strong dependency of Viet Nam’s cashew nut on international market. The increase in prices in two years 1998-

442
1999 made cashew nut area, yield and output going up, especially in the crop season of 1999-2000.
Table 4.3 : The export price and changes in cashew nut area, yield and output, 1995-2006
Year Export price (USD/ton) 1995 49301996 46241997 40031998 46391999 59652000 48922001 34712002 33602003 34112004 41482005 46102006 3976
Source: Report on cashew nut commodity – AGROINFO, www.agro.gov.vn In period 2000-2006, Viet Nam’s cashew nut output grew steadily due largely to the increase in yield and area but the export price dropped and could only be recovered after the year 2000 when both yield and area went down. Since then, Viet Nam has become one of the largest cashew nut producers and exporters in the world and this implies that any changes in cashew nut production have special links with international cashew nut prices. 4.2 Structure of cashew nuts in the market Actors involve in raw cashew nut production (plantation) Cashew nut processors is defined into two groups. This group mainly includes farm households who produce cashew nut through contracting with state-owned agro-forestry enterprises. These farm households are generally poor, have low levels of education and almost no opportunities to access technical training on cashew nut plantation, lack market information and investment funds and are incapable to access the formal lending sources (commercial banks, people’s credit funds etc.). These constraints adversely impact their production; limit their ability in making investment for developing new high yield cashew nut varieties that require higher technical farming standards. In broaden views, Viet Nam’s cashew nut producers have benefited considerably from cashew nut production and marketing. However, lacking knowledge in trade and production under strong competitive environment and lacking market and pricing information has prevented them from obtaining higher benefits. For instance, the increase of input price (influenced by the rise of oil prices) in the last few years, especially in late 2006 and early 2007, has made the production cost higher and reduced net incomes of cashew nut producers. According to the National Institute for Agricultural Planning and Projection (NIAPP) of Ministry of Agriculture and Rural Development (MARD, the total basic investment cost (for

443
planting and tending 1 ha of cashew nut in the first 4 years) is up to 8 million VND (~500 USD)8, of which 50% of the investment is for procuring input and 50% for labor. In the fifth year, the cashew nut starts giving fruits and returns a yield of about 500 kg per ha. In the subsequent years, the yield is normally at 1 ton per ha on average. One cashew nut tree can be exploited for duration of 20 years. This calculation tells that the value-added per ha of cashew nut could reach 13 million VND (~805 USD) with a net income of 3.6 million VND/ha/year (~223 USD per ha per year). (CIEM, 2006) Actors involve in cashew nut processing and marketing After harvesting, cashew nut fruits are collected and transported to processing units. Currently, cashew nut is collected through the three following ways: First, processing units purchase fresh cashew nut right at their locations or through their agents located close to cashew nut growing areas. This means that processing units establish relationship with growers who sell raw cashew nut at their homes, in field or at processing units. Second, processing units purchase dried cashew nut from growers and process them into normal standard kernels. Third, processing units purchase cashew nut kernels dried or steamed up (with spice) by growers before packing for sale (cashew kernels are commonly sold at retail outlets, supermarkets or directly to consumers). Cashew nut (as raw material) is usually purchased at harvesting time and quickly processed or stored for better prices. A network of cashew collectors is established and involved by different actors with a main role played by agents or general agents. Agents procure different kinds of cashew products ranging from raw, fresh to semi-processed. In addition to agents set up by processing units, a large number of independent collecting points are also established by private sector at commune, district and provincial levels. These points purchase and sell raw cashew nut to general agents of processing units to get commission. The network is also involved by “mobile” collectors, who with limited funds often buy cashew nut in small quantities to sell to agents to get profits from price differences. Cashew nut is also collected through contracts signed between farmers and processing factories. This mode of collection is executed following the Decision 80/CP of the government and has been carried out more commonly since 2004-2005. However, the drawback of this mode is that the contracts are often interrupted due to the poor relationship among contract implementers. Breaking contracts often occurs especially when there are changes in cashew nut price. So far, this problem has not been addressed since effective solutions are still absent. Furthermore, contract failures usually come from terms and conditions set up by the contractors themselves. Up to present, no laws have been set up to
8 Exchange rate on August 27, 2007: 1 USD = 16144 VND

444
solving this problem. (Refer to a case study: Da HUOAI Cashew nut Processing and Exporting Factory). Raw cashew nut collection totally depends on “supply-demand” factor of the market and can be changed vigorously due to changes in demand of processing units and export prices. The diagram below demonstrates the impacts of prices on domestic cashew nut production and marketing. Case study: Da HUOAI Cashew nut Processing and Exporting Factory Đạ Huoai cashew nut factory belongs to Lam Dong 51% state-funded Food Joint-stock Company. The factory was established in late 1994 in Đa Huoai district, a center of cashew nut growing of Lam Dong province. Initially, the factory operated with a processing capacity of 1000 tons of raw cashew nut per year. Currently, the processing capacity has extended to more than 6000 tons/year. Raw cashew nut is collected from different sources: through contracts with farmers or purchasing from retail outlets or individual households. However, this amount can only meet 60% of the processing capacity annually. Majority of the products processed from the factory are for export while a small quantity of low standard (5%) is sold in domestic market. Contracts to marketing products are signed between the factory and cashew nut farmers on a yearly basic at pre-harvesting season. According to the Decision 80 of the government, the factory only purchases raw cashew kernels. In period 2003-2005, the factory had executed 10 marketing contracts with individuals and collectives totaling 251,000.000 VND in value. Also in this period, the factory purchased 42,363 kg of fresh cashew nut costing 438,106.000 VND with a high percentage collected without contracts. In 2005, cashew nut procured through contracts shared only a small proportion ranging at 5-6 tons out of the total 7,000 tons. The contract violations are commonly attributed to traditional customs and small production scale of farmers. For long, cashew nut farmers have a habit of selling cashew nut to private traders, commonly to those who live in the same region. The small production scale makes them difficult in marketing products and implementing contracts. In the main cashew nut season, the factory makes investment in constructing drying grounds and storage facilities in each key cashew nut growing areas (a commune or some villages) before buying products. This helps to reduce transportation cost for farmers and maintain product quality. However, at early or ending season, the factory does not buy products from farmers because of product scarcity. Farmers then have to sell products to private traders. This has worsened the relationship between farmers and the factory and created a number of other sale channels. Farmers often sign contracts containing unreal outputs and fail in selling products according to the amounts they committed. This violation stems from the two main reasons: the failure of cashew nut crop; farmers sold products to private traders and other factories. Although strong efforts are being made by the factory to fulfill its contracts with farmers, the factory continues to face problems in implementing contracts because of lacking of investment fund, which would enable them to procure all committed products. Another reason is attributed to the fact that the existing cashew nut growing area across the economy can not satisfy processing demands of the factories. The collectors (private traders and companies) therefore caused fierce competition in cashew nut trading resulting in poor contract performance. Cashew nut collection is poorly managed by the factory and can not attract farmers to sell products to them. The number of collection points established by the factory is limited and located scattered among the regions making transportation difficult and bear with higher cost. Finally, the factory has so far not been given with any technical and credit supports from the government or local authorities and no institution and legal measures have been established to address cases of changing cashew nut quality (soaked cashew nut …).
Source: 30 study cases on contracts in farm product marketing

445
4.3 The Conduct and the Performance of Cashew nuts processing
The cashew nut processing industry has been steadily growing during the last two decades. More enterprises engaging in cashew nut processing and export have been set up following the Enterprise Law of the government in provinces of Binh Phuoc, Dong Nai, Binh Duong, Dak Lak, Gia Lai, Ninh Thuan, Quang Nam…The growth in number of cashew nut processing enterprises has generated a lot of employment for local labor, improved cashew marketing and raised incomes of cashew nut growers. However, the expansion of processing units has not followed the set-out projection, in which enterprises should be located close to growing areas. This has led to a situation that some factories faced shortages in raw materials and there appeared unfair competitions in trading. As the scarcity of raw materials became more severe, some farmers mixed pre-processed cashew nut kernels with cement and nut shells to increase weighs and raise incomes, causing big losses to processing factories and loosing the credibility of cashew nut products in market. According to MARD, there are currently about 100 cashew nut processing factories with a total capacity of 500,000 tons (of raw cashew nut) per year (2006). In 2004, about 385,000 tons of raw cashew nut were processed (300,000 tons produced domestically and 85,000 tons imported). In 2005, 450,000 tons (350,000 tons produced domestically and 100,000 tons imported) were processed. Equipment and facilities of these factories are in good conditions and of high quality. However, some forms of processing (shelling, peeling) are still carried out in traditional methods and bear with high labor cost. According to the Department of Science and Investment (DSI) of Binh Phuoc province, in 2005, Binh Phuoc had 89 enterprises registering for cashew nut processing and trading located mostly in districts of Phuoc Long (47 enterprises), Bu Dang (23 enterprises), Chon Thanh and Dong Xoai. Some of these enterprises have large processing capacities such as Nam Son, Mai Huong, My Le, Hoang Son and Son Long. In 2005, there were 219 cashew nut processing units having a capacity of 674 thousand tons/year with 3000 people involving in cashew nut trade (NIAPP) and 210 thousand in exporting (CIEM, 2006). Cashew nut processing and marketing are not only involved by enterprises of cashew nut growing provinces but also by those from provinces that do not plant cashew nut such as Hanoi and Ho Chi Minh cities. Many enterprises lack their own raw material supply locations, causing material shortages and unfair trade competitions, especially as the case in Binh Phuoc, meanwhile taking this advantage, farmers harvested cashew nuts that could not meet the required standards of quality. Some enterprises were forced to import raw materials from other countries (Cambodia).

446
Marketing channels Domestic marketing Domestic cashew nut marketing and export are outlined in the following diagram based on the results of studies conducted to a number of cashew nut growing areas and cashew nut processing units (CIEM). Figure 4.1: Marketing channel and export The domestic cashew nut market has undergone strong fluctuations during the recent years especially since 1999 and linked more closely to international prices. The changes in international cashew nut price have vigorously influenced behaviors of all actors participating in domestic marketing process. Cashew nut products are generally marketed in three major channels: selling directly to consumers in local markets, to candy/cake processors and for export. Cashew nut products sold in domestic market are traditional ones in the forms of roasted, steamed with spice such as garlic and oil to be used for processing cakes. The products are packed in plastic or paper bags or canned in a simple way bearing names of shop or enterprise owners. Marketing through supermarkets has started and been growing. However, selling products at festival occasions in order to advertise their multi-functional uses has still not been paid with due attention. The advertisement is just in the form of small activities or orally done among the consumers. Though being found with high potentiality, the domestic market for cashew nut has not been adequately invested to enhance its growth. The taste of domestic consumers has not been taken into account in the cashew nut development strategy while a number of products produced from cashew nut will possibly be replaced by food or drinks produced from other farm commodities and imported products.
Growers
Agents
Collectors
General agents
Private processing
units
Candy/cake processing factories
State-owned
processing factories
Domestic consumers
Exporting to international
market

447
Cashew nut export Cashew nut export in Viet Nam has recorded important results over the last ten years in both quantity and value. In 2006, the cashew nut sub-sector exported 127 thousand tons of kernels achieving a total value of 505 million USD. Compared to 2005, kernel export has increased by more than 20% in volume and 3% in value. However, in 2006 the average kernel export price dropped by 13-14% comparing to 2005. The latest data of General Statistic Office (GSO) indicates that the cashew nut export price in the first 6 months of 2007 stayed at 4,100 USD/ton, up by 2% compared to the same period of 2006, reaching a total turnover of 273 million USD. Table 4.4: Cashew nut export in Viet Nam, 1995 – 2007
Year Export (thousand
tons)
Value (million
USD)
Export price
(USD/ton)
Import kernels (tons)
1995 18.3 90 4930 - 1996 23.8 110 4624 - 1997 33.3 133 4003 - 1998 25.2 117 4639 10,000 1999 18.4 110 5965 20,000 2000 34.2 167 4892 35,000 2001 43.7 152 3471 50,000 2002 62.2 209 3360 50,000 2003 83.4 285 3411 60,000 2004 105.1 436 4148 75,000 2005 108.8 502 4610 110,000 2006 127.0 505 3976 50,000 8 months of 2007
92 375 3955 -
Source: Report on cashew nut commodity, 2007– AGROINFO – www.agro.gov.vn Note: data for 1995, 1996, 1997 and 8 months of 2007 are not available. Viet Nam’s cashew nut has been exported to about 30 markets world wide. The number of markets and market-share has grown continuously since the economy started opening more markets outside the traditional regions. For example, before 1995, the cashew nut export volume of Viet Nam was as much as 60% of Brazil and 25% of India. Up to 2004, with extensive market penetration, Viet Nam became the second largest cashew nut exporter in the world with the export volume doubling the level of Brazil, which was then the third largest cashew nut exporter. In 2006, Viet Nam’s cashew nut was exported to America, China, Australia and Holland with respective market shares of 35%, 20%, 11% and 10%. The remaining 25% was exported to other countries. In comparison with 2005, cashew nut market was mainly extended to America, Italia, France, Australia, Saudi Arabic, Hong Kong and Norway. However, export to Spain, Canada and New Zealand shared only a small proportion and is on a trend of declination.

448
Table 4.5: Viet Nam’s cashew nut export market structure, 2006 - 2007
Markets Market shares (2006) Market shares in the first 6 months of 2007
America 35% 32% China 20% 19%
Australia 11% 8% Holland 10% 13%
Other countries 25% 28%
Source: Report on cashew nut commodity, 2007 – AGROINFO – www.agro.gov.vn Cashew nut export market in the first 8 months of 2007 has further been extended. Although exporting to America was reduced by 2%, this market continues to be the Number One, sharing with 32% of the overall export volume. Alongside with America, China’s market was also reduced by 1% but ranks the Number Two. In 2006, Holland market ranked the forth and rose by 3.5% during the first 6 months of 2007, taking 13.5% of the total market share and moving into the third position. Australia market dropped by 3% ranking the forth and sharing 8%. Policy to develop cashew nut production National and international policies, overall agreements supporting the growth of cashew nut production (supporting agriculture, taxation, quota, quality control…) Up to present, no institution representing for cashew nut growing countries has been established. Therefore, all information on cashew nut price, quality, trade, marketing and reserves is difficult to access. At the same time, the existing information system can not provide accurate knowledge on cashew nut production situation and trade policies of different countries. Recently, in connection with trading, Viet Nam’s cashew nut quality and standards became a focal topic. So far, cashew nut kernel standards have been applied to European market since they were developed and enacted by UNECE (United Nations Economics Commission for Europe) (UNECE DF-17 Standards) meanwhile, for American market, AFI’s standards (Association of Food Industries, Inc) are applied as requested by FDA (Food and Drug Administration). As demand on imported cashew nut kernels in American market is rising, AFI begins to pay more attention to product quality. This body drafted standards on imported cashew nut (in April, 2007) in order to get more comments. New standards on cashew nut will require cashew nut exporters in Viet Nam to be more cautious on such stages as post-harvest technology, processing and storage. National policies: invest in developing infrastructure, support trade policy transformation.

449
Cashew nut plays a vital role in accelerating the development of social economic conditions of provinces of Central Highlands, Central Coastal and South-eastern regions. For this reason, the government recently approved the cashew nut development projection up to the year 2010 based on the Decision 120/1999/QĐ-TTg dated May 7, 1999. To implement the mentioned decision, several policies have been formulated to support cashew nut production, which include: - Zoning up production areas, formulating cashew nut material supply locations to meet
processing and exporting demands. - Implementing Cashew nut Variety Development Project in which cashew nut nurseries
will be established in project provinces. - Providing funds to subsidize the cost of seedlings (grafted ones) for households planting
cashew nut in project and border areas, for poor households and ethnic minority families planting cashew nut under the protection forest development project (PFDP)…
- Providing fund supports to planting cashew nut in PFDP - Accelerating investment in conducting scientific research and technology transfer to
promote cashew nut production. The decision 39/2007/QĐ-BNN, dated May 2, 2007 on Approval of Cashew nut Projection up to 2010 and cashew nut production orientation to 2020 estimated that the total cashew nut growing area of the economy in 2010 would reach 450,000 ha, the area under harvest would be 360,000 ha, the average and highest yields would be 1.4 and 2 tons per ha respectively and raw cashew nut output would be 500,000 tons. The decision also projected that the total processing capacity would continue to be at 715,000 tons/year as it currently is and the amount actually to be processed would be 625,000 tons with 125,000 tons imported. The cashew nut output is expected to reach 140,000 tons with the export turnover of 670 million USD. In 2020, cashew nut area is projected at around 400,000 ha and export turnover reach 820 million USD. The decision confirms ability to extending cashew nut area in localities having good conditions for cashew nut growing especially in Central Highlands, South-eastern, South Coastal Central, as well as ability to replace old varieties by high yield ones and renovate equipment and technology in order to raise economic value and processing efficiency. In this sense, people’s committees of cashew nut growing provinces are required to review the production situation and develop planting objectives based on market demands. Cashew nut provinces should also re-arrange the structure of processing units toward stabilizing processing capacity, reducing the number of mini-processing units and replacing them with sizable and modernized ones in 2010. The government and MARD should encourage and support processing enterprises to establish themselves into big, financially strong and high-tech co operations to participate into world market. The cashew nut processing sector should develop plans to upgrading equipment and technology in order to raise product quality and guarantee for product safety conditions.

450
5 Rice Processing 5.1 Overview of Rice sector in Viet Nam
Area, yield and output Rice production keeps a central role in enhancing the growth of agricultural sector and Viet Nam’s economy. In years of 1970s and early 1980s, under the centrally planning economy, rice production was lagged behind with low yield and poor utilization of natural resources to serve for production. Since 1986, Viet Nam embarked the economic reform under which households started being recognized as key production units in rural regions and given with power to make decisions on production as well as product marketing. The household-based contract together with reform of land use and trade liberalization has promoted growth in agricultural production. Since the late 80s, rice production began growing up and Viet Nam has made a shift from a rice importer to one of the largest rice exporter in the world. Rice production achieved an impressive annual growth rate with 5.3% during the period 1990-2007, which was mainly attributed to the increase in paddy yield (2.8%/year) and rice planting area (1.8%/year). Up to present, the total paddy land has extended to 7.5 million ha with 16.1% shared by the Red River Delta and 50.5% by the Mekong River Delta. Though keeping a dominant role across the economy’s territory, rice yields and rice planting timetables are varied among the regions. The average paddy yield in Viet Nam is currently at 4.3 tons per ha and the yield in the Mekong River Delta is 4.2 tons/ha and in the Red River Delta 5.3 tons per ha. While paddy yield in the Mekong Delta is expected to reach 10-12 tons per ha, the yield in other localities is usually maintained at 2.4 tons/ha. High paddy yields in the Mekong and Red river deltas have further highlighted the important role of these two regions in rice production which not only guarantee for national food security but also for export. However, rice production and the increase of surplus volumes still depend much on climate conditions. Export During the period 1989 – 1995, each year Viet Nam exported 1-2 million tons of rice. In the following years (1996-2004), with the freer mechanism for rice export, the export increased more sharply with around 3 – 4 million tons/year. In 2005, rice export reached 5.2 million tons with a value of 1.4 billion USD and an increase of nearly 50% comparing to 2004 after 17 years the economy participated in international rice market. In 2006, 4.69 million tons of rice was exported, fell by 9% as compared to 2005. However, the price of exported rice in this year rose by 9 USD and 43.46 USD per ton comparing to 2005 and 2004.

451
Table 5.1 Export quantity and export value during 1989 – 2007
Year Export quantity
(million tons) Export value (million USD)
1989 1.37 310.29 1990 1.46 274.52 1991 1.01 230.50 1992 1.92 405.53 1993 1.66 335.06 1994 1.96 420.86 1995 2.05 538.84 1996 3.06 868.42 1997 3.68 891.34 1998 3.79 1005.48 1999 4.56 1008.96 2000 3.39 615.82 2001 3.53 544.11 2002 3.25 608.12 2003 3.92 693.53 2004 4.06 859.18 2005 5.20 1279.27 2006 4.69 1298.00
Source: Vietnam’s Food Association, 2007 5.2 Government policy on rice production Since launching a renovation program in 1986, the government of Viet Nam has developed and put into application a large number of market-oriented policies. These policies on land-use, trade, investment and market have generated positive impacts on rice production and encouraged farmers to promote agricultural production. Land policy In the process of moving from a centrally planning to market economy, Viet Nam’s government started handling land use right to farmers. The Land Law enacted in 1988 is considered as one of the most important supports given to farmers. Under the Law, farmers have right to use land for 10 to 15 years, select suitable crops to plant and decide on amounts of products to be marketed. The revised Land Law in 1993 allowed farmers to select types of land-use with a duration up to 20 years for annual crops and 50 years for perennial trees; to “exchange, transfer, lease and mortgage” the right of land-use. The positive reactions of farmers are reflected through constant increases of rice outputs during the last decade. Investment and credit policy Viet Nam’s government has made strong efforts in upgrading irrigation system. Investment into agricultural sector has mainly focused on improving infrastructure bases supporting

452
agriculture and rural development. In the decade 90, investment into irrigation accounted for 70% of the total investment into agriculture. On rural credit, the institutions that support rural finance include Vietnam Bank for Agriculture and Rural Development (VBARD), Vietnam Bank for the Poor (VBP) and People’s Credit Fund (PCF). The primary objective of the official rural supporting system is to (i) ensure a sufficient provision of inputs for agricultural production; (ii) strengthen post-harvest technology and promote farm product export; (iii) support agricultural diversification; (iv) upgrade rural infrastructure; (v) reduce poverty and mitigate natural disasters. The credit policy also aims at helping farmers to access different sources of loans and providing supports to poor farmers living in high land and remote regions. Under the policy, paddy household can borrow 5-10 million VND without mortaring. Agricultural input policy Prior to Doi Moi (renovation), agricultural inputs were allocated for farmers through cooperatives. During Doi Moi, the role of cooperatives is being weakened while the role of private sector regarding input allocation is further highlighted. While the government continues to control input supplies through setting up quotas and maintain the monopoly of state-own enterprises (SOEs) over the importation, the import tax as applied to fertilizer still does not mean much. The government encourages farmers to improve paddy varieties through abolishing taxes charged to rice-breed importation so as to gain 70% new paddy varieties. Rice distribution policy In Viet Nam, rice distribution system is complicated comprising a lot of linkages among such actors as sale agents, farmers, collectors, millers, wholesalers, retailers and SOEs. Since the year 80s, with new policies, great contributions have been made to renovating and developing the rice distribution system. All barriers to rice market and rice marketing have been abolished to allow fair and free competition among rice agents. Currently, the private sector has become more important and represented for 95% of domestic market-share and is outweighing the role of SOEs in rice market. International trade policy At the beginning of decade 90, in order to guarantee for national food security, the government totally controlled over rice export through setting out licenses and quotas and only allowed SOEs to participate in rice export. From 1991 to 1993, Viet Nam had only 40 rice exporting companies with the majority located in the South. The rice export system then proved ineffective and caused adverse impacts on farmers preventing them from attaining higher incomes. In 1997, there were only 17 rice exporting companies. Since 1998, the government has encouraged the expansion of exporting enterprises and established opener mechanisms to support trade activities. The number of private companies involved in rice export has therefore further enlarged. In 1999, the government started allowing joint-stock companies to participate in rice export if they could find their counterparts.

453
The government has also applied a “quota” mechanism to control rice export. Since 1997, the government has right to establishing export amount based on the surplus gained from production. In reality, private companies do not have to depend on quotas since they can be freely transferred. Export quotas are regularly readjusted depending on the situation of rice production and international rice prices. To accelerate rice export, the government has implemented a number of incentive measures to encourage local and central exporting companies. 5.3 The Conduct and the Performance of the rice processing industry Rice marketing and distribution channels The rice marketing system in Viet Nam is complicated comprising many different actors: paddy farmers, paddy collectors, millers, wholesalers, retailers, SOEs and private companies. The rice marketing channel can be summed up as follows:
Since 1980, policy reform has brought about good results in improving Viet Nam’s rice distribution system. The domestic rice market has been totally freed from a number of barriers and dependences while a large number of entities and economic components have participated in the rice marketing and distribution system. Due to the lack of data, the relationship between actors participating in rice market can not be quantified in the form of market-share. However, through a number of field-trips, it is discovered that private sector is keeping an important position in domestic market and holding 95% of the market-share while the role of SOEs is less important and holding just 5% of market-share. However, in terms of foreign trade, SOEs have represented a large market-share, with 96%. Trade activities of SOEs have usually concentrated on rice export and agricultural input importation. It is also discovered that the participation of private sector into
Farmer
Collector
SOEs without export
contracts
Wholesaler
SOEs with exportation contracts
Retailer Consumer
Exportation
Miller

454
international trade activities on rice export has remarkably increased (through direct export contracts). Mekong and Red river deltas are the two major paddy production regions of Viet Nam with a total sale value representing up to 60% of the economy’s rice value. However, rice production in the Mekong is more commercialized than in the Red river due partly to the fact that agricultural land per capita in this region is larger. There is also a big difference in terms of rice distribution between these two regions: in the Mekong delta, rice distribution mainly focuses on export through the contracts between SOEs and farmers while in the Red river delta, the rice distribution mainly focuses on domestic consumption.
Actors participating in rice-commodity value chain
Producers participating in rice-commodity chain have a tendency of using paddy land for planting other crops or raising aquatic species as seen in many ‘rice-bowl” provinces in the Mekong delta or for developing industrial zones as seen in northern provinces. Farmers in these regions also face difficulties which prevent them from accessing high quality inputs such as fertilizer and pesticide etc. Almost all categories of inputs are purchased from illegal importation sources with no clear implications on input origins and quality. Farmers also face constraints in accessing credit loans especially through the official borrowing network such as banks. Rice collectors and millers under both private and state ownership, traders, retailers and exporters are encountering some challenges and difficulties. Rice milling and processing are mainly carried out manually through a lot of stages, adversely impacting rice quality and rice export. Since the majority of rice millers are small-holders, it is difficult to guarantee for high-quality rice. Constraints are also found in signing contracts between state-own and small companies. In reality, the current government contracts are based on negotiations made one year in advance by VINAFOOD 2 before handling to provincial food companies for the implementation. These companies sometimes faced heavy losses due to price fluctuations and high interest rates they had to pay for purchasing rice for export. Rice supply for export also meets difficulty and can only be carried out when conditions on rice supply-demand in the economy are guaranteed. The fact shows that rice supply for export is done on a seasonal basic rather than aiming at meeting the world condition and demand. Further more, the structure that sets out export prices has put pricing system into a lot of risks. It should be noted that private companies also face a lot of problems when participating in rice export especially since rice export contracts of the government are implemented through VINAFOOD 2 and 1. As these contracts account for a high percentage of rice quantity, private companies can not participate much in export. They also face difficulties in export if they are not members of VINAFOOD and in accessing official credits. As a result, they often lack funds to buy paddy from farmers. Private companies are allowed to borrow only 70% of

455
the funds needed for export while SOEs can borrow up to 100%. This helps SOEs to have more power in rice collection and export.

456
Market share of some export companies The improvement of international trade policy and mechanism to controlling rice export of the government has further encouraged and extended the number of enterprises participating in rice export. In 1997, there were only 17 companies participating in rice export and in 2000, this number extended to 47 including both state and private ones.
Table 5.2: The number of rice export companies of the 1997-2000 periods Year No. of
companies Export tax Reserve (million
ton) 1997 17 1%-2%-3% 1 1998 19 0%-1% 1 1999 41 0% 2,3 2000 47 0% 1 Source: Nguyen Ngoc Que, Tran Ngoc Thao (2004), Vietnam’s Overview Rice Report, Ministry of Agriculture and Rural Development (MARD).
With specific conditions on production, quality and marketing, rice in Mekong river delta is produced mainly for export while rice in the North and Central regions produced mainly for domestic consumption. This characteristic has determined the size of market-share as taken by Northern General Food Company (Vinafood 1) and Southern General Food Company (Vinafood 2). Vinafood 2 has currently held more than 50% of Viet Nam’s rice export market including such countries in Southeast Asia as Malaysia, Philippines, and Indonesia... (Table 3). The remaining 50% is shared by other joint-stock and private companies. Since 2001, Vinafood 2 has continued to maintain its leading role in rice export especially in fulfilling the government’s rice exporting contracts. Table 5.3: Rice export of Vinafood 2 during the 2001 – August, 2007 period. Unit: Quantity: 1000 ton Value: 1000 USD 2001 2002 2003 2004 2005 2006 8 months of
2007 Quan
tity Value
Quantity
Value
Quantity
Value
Quantity
Value
Quantity
Value
Quantity
Value
Quantity
Value
VINAFOOD 2
1869 272 1614 281 1858 320 1977 413 2821
692 2572
652 2103 597
Whole economy
3530 544 3250 608 3920 693 4060 859 5200
1279 4690
1194 3320 969
Percentage (%)
52.96
50.15 49.69 46.23 47.42 46.24 48.71 48.18
54.26
54.16
54.85
54.59
63.36 61.64
Source: Southern General Food Company (VINAFOOD 2) Companies having large market shares normally are the state own companies (SOEs). Recently, following the government policies, some companies under this group have been or are being equities. Companies exporting rice and with large market shares are mainly located

457
in key rice production provinces of the Mekong delta such as An Giang, Can Tho, Vinh Long…where land and climate conditions are favorable for rice production. In 2004, Vinh Long Food Company shared 5% and in 2005 An Giang Food Company shared 4.3% of the economy’s rice export market. In 2006, the rice market-share of An Giang Company increased considerably, up to nearly 30%. Concentration ratio Vinafood 2 usually holds a first position among the 8 leading rice exporting companies and shares with more than 7% of the economy’s rice and food market. Vinafood 1 held the second position in 2004 (with 2 % of market share) and the third position in 2006. An Giang Tourimex company advanced to the second position in 2006 sharing 4.38% of the economy’s rice and food market. The market share of the 8 leading companies in 2004 was as much as 83% of the economy’s market and slightly decreased to 72.5% in 2005. In 2006, market share of the 8 companies continued to grow, achieving nearly 95% of the economy’s market.
Table 5.4: Market shares of some leading export companies in rice, (2004-2006) No 2004 2005 2006 Company Value
(mill. USD)
Percentage (%)
Company Value (mill. USD)
Percentage (%)
Company Value (mill. USD)
Percentage (%)
1 Vinafood 2* 413.9 48.17 Vinafood 2* 692.8 54.15 Vinafood 2* 652.1 54.59 2 Vinafood 1* 122.6 14.27 Thot Not
General Commerce (GENTRACO) *
73.5 5.74 An Giang Tourimex
179.3 15.01
3 Dong Thap Foods-Agriculture (DARGIMEX)*
49.6 5.78 An Giang Import-Export (ANGIMEX)*
55.1 4.31 Vinafood 1* 178.4 14.93
4 Vinh Long Food*
41.7 4.85 Dong Thap Foods-Agriculture (DARGIMEX)*
30.4 3.38 Dong Thap Foods-Agriculture (DARGIMEX)*
37.6 3.14
5 Thot Not General Commerce (GENTRACO)*
34.2 3.98 Kien Giang Trading (KIGITRACO
28.2 2.2 Long An Food *
36.7 3.07
6 Long An Food*
29.3 3.41 An Giang Tourimex
15.1 1.18 Kien Giang Trading (KIGITRACO
35.5 2.97
7 Kien Giang Trading (KIGITRACO)
17.4 2.03 Techno-agricultural Supplying Joint Stock (TSC)
10.0 0.78 Binh Dinh Food Co Limited (BIDIFOOD)
14.7 1.23
8 Techno-agricultural Supplying Joint Stock (TSC)
12.5 1.45 Can Tho Agricultural Products and Foodstuff Export Co (MEKONIMEX)
9.8 0.76 Me Kong Company (MKC)
7.7 0.64

458
9 Can Tho Agricultural Products and Foodstuff Export Co (MEKONIMEX)*
9.9 1.16
10 Vinh Phat Trading
6.5 0.76
11 Me Kong Company (MKC)
3.0 0.35
Total export of whole economy*
859.1 83.91 1279 72.5 1194 95.58
% of 8 leading export companies
Source: Ministry of Trade, www.mot.gov.vn
Note: * describes a State Own Company (some enterprises are equalized; the others are under the equalization process). According to calculating CR index for 2004, 2005 and 2006, the CR for rice industry almost representative about 90%. It means that the rice industry is considered as highly concentrated. Companies either under state or private ownership before participating in rice export must be subjected to the approval of Viet Nam’s Food Association (VFA). The main task of VFA is to regulate the rice export in such way that it guarantees not only for food security but also for effective rice export. With its given functions and tasks, the members of VFA have belonged to different economic components: state-own (Vinafood 1 and 2) and private-own (Song Hau, Co Do farms). Table 5.5: The number of VFA’s members, 2007
Members No. of enterprises Percentage (%) Official members: 100 98% - State own enterprises 55 55% - Joint-stock, Ltd. and private
companies 45 45%
Aligned members 2 2% Total 102 Source: VFA, 2007 Any enterprise who wishes to become members of VFA must have exported at least 5000 tons of rice each year. The statutes of VFA stipulate that “to become members of VFA, enterprises, in addition to having personal legal status, being established in accordance with laws of Viet Nam, accepting the regulations of VFA and making application to join VFA on a voluntary basic, must have suitable technical bases, participated in rice export and have a sound financial basic”.

459
After becoming members of VFA, enterprises shall begin implementing business activities. Rice export by enterprises must base on the “application forms” approved by VFA. It means that VFA continues to maintain its central role in rice export. Rice development policy Viet Nam’s government is making strong efforts to raise efficiency in rice trading and production through carrying out several measures to mitigate the post-harvest losses; upgrade rice quality and its competitive power; enhance transforming the structure of agriculture and rural economy; generate employment and raise farmers’ incomes; make contributions to guaranteeing national food security as well as improving food safety and hygiene conditions. Effort is also being made by the government to promote scientific researches, innovation of machinery equipment, and mechanization of rice production, upgrade post harvest technology for rice processing and export. At the same time, attention is being paid to improving rice storage technology in order to produce high quality rice for export. For Mekong river delta, it is projected that in the period 2006-2010, about 30 rice processing centers shall be established and one million ha of high quality rice for export be created alongside with the establishment of a number of wholesale rice markets. For period 2011 - 2020, in each processing center, one rice milling and processing unit with a capacity of 20-40 tons/hour shall be established. This unit will be equipped with modern facilities and operate in a close technology cycle covering different stages such as product-cleaning, pre-processing, drying, mechanised loading/unloading, milling, packaging etc. In the Red rive delta, rice milling and processing for domestic consumption shall be mainly carried out by private sector. It is projected that 3 milling and processing centers shall be established and 300 thousand ha of high quality and special rice constructed. Invesment shall be made to building up 2 wholesale markets in areas having high amounts of rice commodity. The rate of automation in processing units shall be 5-10% in year 2010 and 20% in year 2020.

460
6 Conclusions and Implications
Viet Nam has comparative advantages in several major agricultural products such as rice, coffee, cashew nut, pepper….however it still not maximize this favorable condition in term of stimulating the production structure toward high value added and processed product. The success of the food processing sector hinges on nature of the value chain and the policy environment in which it operates. First, the ability of farmers to make continual progress in productivity is the first and essential condition. This implies a need for higher yields, more efficient use of inputs, and reduction in post-harvest losses. This message is reinforced by international experience: cases of successful expansion of high-value agricultural commodities are almost always based, at least in part, on lower costs of commodity production. Second, given the highly exported industry to ensure the sustainable development of the food processing industry the government should facilitate strengthening of business associations. These associations should be voluntary and open to all participants in the sector. It is important that these organizations not become involved in setting prices or other anticompetitive behavior nor should they be a regulatory body with the power to sanction members. Making them open to all would reduce this risk since each group (exporters, processors, wholesalers, etc.) could monitor the others. These groups could also serve an important function of proposing standards for certification of quality. The standards would have to be approved by the relevant authorities, but it is important to get input from those the system is designed to serve. Third, the food processing sector is rapidly growing industry in the Vietnamese economy. However, given its small size and backward manufacturing technology should be defined broadly to include any improved method using resources to produce and market a good or service, rather than narrowly as industrial machinery. Four, the rapid changes in industrial and urban development have a very important implication for the development of the food processing industry. Food processing companies need to capture the big opportunities for rising food processed product consumption created by the middle class. This relates to investment activities through out the value chain such as from raw material zone development, technology investment to setting up the storing system or distribution channel development. Five, the case studies of 4 commodities rice, coffee, cashew, tea have given evidences that there is a room for further improvement to raise the competitiveness. In the case of rice and tea there is an urgent need to improve more efficient use of inputs and higher yields leading to policy to strengthen the research and extension system. The difficulties of agricultural export such as rice, coffee and cashewnut facing the world market have raised the issue of stronger role of business associations in supporting the sector in information provision and trade promotion. The case of cashewnut and tea have suggested that companies need to pay attention to invest in material development. This will help to improve the product quality and active capacity for companies.

461
7 References 1. ADB (2006), “Supermarkets and the poor in Vietnam”, htpp://www.markets4poor.org,
accessed on May 7, 2006. 2. Dang Kim Son (2006), “Vietnam Agricultural: 20 years Renovation and Development”,
National Political Publishing House, 2006 3. Dang Kim Son and Pham Minh Tri (2006), “International Economic Integration
Capacity of Agriculture’s Enterprises”, Institute of Policy and Strategy for Agriculture and Rural Development – Ministry of Agriculture and Rural Development, Hanoi 2006.
4. DPI of Dak Lak (2005), “The development of coffee and cashew nuts in Dak Lak,
challenges in the process of IEI and measure for their sustainable development”, Workshop working paper.
5. GSO (1995-2005), Yearbook, Publish of Statistics, Hanoi. 6. MARD (2005), “Project of survey, assement of agricultural processing technological
capacity to 2010 and measure”, Hanoi 2005. 7. Ministry of Finance: http:// www.mof.gov.vn - WTO document
WT/ACC/SPEC/VNM/3/Rev.5, Bénédicte Hermelin(2005) 8. Ministry of Finance: http://www.mof.gov.vn 9. Ministry of Planning and Investment: htpp://www.mpi.gov.vn 10. Ngo Le Dung, Nguyen Thi Xuyen, Pham Duc Minh (2001), “Solution to develop tea and
coffee processing in Vietnam”, Institute of Economic Agricultural, Hanoi 2001. 11. Nguyen Xuan Trinh, Chu Tien Quang, Nguyen Thi Hien, Luu Duc Khai, Nguyen Huu
Tho (2005), “The Impact of international economic integration on the production, processing and marketing agricultural products in Vietnam: via coffee, tea and cashew nut”, Political Argument Publishing House, Hanoi 2006.
12. Pham Anh Tuan, Nguyen Do Anh Tuan, Nguyen Thi Kim Dung (2005), “Competition of
Vietnam’s Agriculture in AFTA”, Institute of Policy and Strategy of Agriculture and Rural Development”, Hanoi 2005.
13. The CEG Facility/AUSAID - MARD (2004), “Conditions of establishing commodity
exchange models for Agricultural products in Vietnam”, Hanoi December 2004. 14. Tran Cong Thang, Emma Samman, Karl Rich, Pham Quang Dieu, Nguyen Do Anh Tuan,
Nguyen Van Thanh, Dang Van Thu (2004), “The Poor’s participation in farm value-chain: case study of tea”, ADB.
15. Tran Thi Quynh Chi, Muriel Figue and Tran Thi Thanh Nhan (2006), “Research on
coffee consumption in Hanoi and Ho Chi Minh city”, Hanoi 2006 16. Nguyen Ngoc Que, Tran Dinh Thao (2004), “Vietnam Rice Report”, Ministry of
Agricultural and Rural Development (MARD). 17. ADB (2005), “Linking the Poor with Rice Value Chains”, Making market work better for
the poor, www.markets4poor.org.

462
18. Information Center for Agriculture and Rural Development (2007), “ Rice Report for 6 months in 2007”, www.agro.gov.vn
19. Statistics from Vietnam Food Association (VFA), 2007 20. Statistics from Vietnam Food Corporation (VINAFOOD 2), 2007 21. Ministry of Trade, www.mot.gov.vn

i) Lessons Learnt
ii) Next Steps
78
10 Lessons Learnt from Undertaking the “Study on Market Liberalization and its relationship with Market Structure, Conduct and Performance of The Food Processing Industry of ASEAN Member Economies” • Duration of project - Being a research project which involved six economies, the
coverage of work are extensive at times highly intensive. Apart from the use of secondary data, the methodology of the project required field surveys and primary data collection through personal interviews, discussions and observations with respondents who were mainly “captains” of industries. The extensive work needed for methodological and theoretical deliberations amongst project leader, project consultant and economy researchers, to cater for different database availability, field work and the varying geographical coverage within each economy, writing-up of reports that need to match with the expectations of the Project Overseer (which sometimes involved several drafts before acceptance) made it difficult to complete the project within the original plan period of 12 months. Future similar projects need to be plan along a longer time frame to provide more reasonable deadlines for researchers.
• APEC’s “pay-by-reimbursement” policy - This policy posed difficulties in project
execution and implementation. As versus other “one-off” projects like workshops and training programs where timing, expense requirements and other activities are definite and discrete, a research project is a continuously on-going activity within the time frame its inception and finalization. The need for expenses are also continuous and not on a discretionary basis. It is important that project participants have access to funds as and when they require it. As with other research-based organization world-wide, the best practice for efficiency is to provide funds on advance basis, where proof of expenses are then required as repayment of the advancement of the fund.
- The reimbursement policy practiced by APEC also put financial stress on
researchers who are required to undertake extensive traveling in doing their field work and attending discussions among the project team members. This was more so in economies where the industry study areas were all over the country. This case was particularly true for Indonesia, the Philippines and Viet Nam. It is also unfair practice considering that these are developing economy researchers whose remuneration are low and are advancing their private limited financial pool for APEC.
• Data and information availability - The availability of data that were required for
the study greatly varied from economy to economy. As such the breadth and depth of the analysis and the number of industries covered also varies depending on data availability in each of the economy. Data required for the Brunei and Viet Nam studies were most limiting. Future research work needs to consider this data availability factor in project formulation. A pre-project fund by APEC would facilitate further formulation work before its full implementation.
79
11 Next Steps
All economy researchers as well as participants of a symposium held in conjunction with this research project agreed that this research was extremely useful in providing the required information on the workings of trade liberalization in influencing the structure, conduct and performance of industries that are important to the ASEAN economies. The study could provide a based for further policy formulation in response to the trade liberalization process that is continuously on-going.
Members of the project team also agreed that information obtained from this study be as far possible be disseminated as extensively as possible in seminars, workshops and conferences both in their respective economies as well as at regional level fora. More importantly, they are encouraged to present and participate in their respective government policy forums to help chart the development of future policy response to trade liberalization in their economies
Other initiatives that are proposed include:
• Encourage APEC member economies to further their research in this and other related subject matters and foster competency development among researchers in developing APEC economies through this sort of team work, and
• To continue to network among project team members and other players involved in this study such as respondents, captain of industries and research assistants to further pursue research collaboration and seek funding from APEC and/or other international funds to further common research needs of developing APEC member economies
Project team members fully agreed that APEC and specifically ATCWG to not only continue to support similar research initiatives but also to promote and encourage such research endeavors by APEC member economies. ATCWG should also seek for more funds to finance this nature of work