market information bulletin 2009.pdf($1.3068 per pound). class iii use, mostly milk used to produce...
TRANSCRIPT

Uniform Price Tumbles The uniform price in Fulton County, GA, was
$16.85 per hundredweight of milk at 3.5 percent butterfat for the month of December. The uniform price is $2.36 lower than the previous month and is $5.59 less than December of last year.
Class I utilization was 66.68 percent in De-cember, a decrease of 1.28 percent compared with the previous month and an increase of 0.51 percent compared to December of last year.
National Dairy Situation The USDA estimates that the total U.S.
production of milk in November was 15.18 billion pounds, an increase of 1.1 percent from Novem-ber 2007 and an increase of 0.7 percent when compared with October 2008 on a daily average basis. Total cheese output (excluding cottage cheese) was 826 million pounds, 1.3 percent above November 2007 but 2.1 percent below Oc-tober 2008. Butter production was 134 million pounds, 2.2 percent above November 2007 and 2.8 percent above October 2008.
Nonfat dry milk powder production was 135 million pounds in November, 34.8% percent higher than November 2007 and 15.3% percent higher than October 2008 on a daily average ba-sis. Dry whey production was 84.6 million pounds in November, a 9.7 percent decrease from No-vember of last year and a 2.6 percent increase from last month on a daily average basis. The milk-feed price ratio was 1.97 in December.
Market Information BULLETIN
ISSUED FOR THE INFORMATION OF PRODUCERS WHO ARE NOT MEMBERS OF COOPERATIVE ASSOCIATIONS
Sue L. Mosley, Market Administrator
www.fmmatlanta.com
Southeast Marketing Area Federal Order 7
Volume 10—No. 1 January 2009
Southern Dairy Conference Announcement The 35th Annual Southern Dairy Conference
is scheduled for January 28-29, 2009 in Atlanta, Georgia. For additional conference information, visit www.areg.caes.uga.edu.
USDA Issues Recommended Decision to Adjust Mideast Order
The USDA has announced a recommended decision to adopt amendments to the Class I price surface of the Mideast milk marketing order. This decision is based on testimony and evidence given at a public hearing held in Cincinnati, Ohio, on August 19-20, 2008. This decision recom-mends adoption of amendments that would adjust the Class I pricing surface in certain counties within the geographical marketing area of the Mideast order.
Interested persons have until March 16, 2009 to file comments in response to this decision, which was published in the January 14, 2009 edi-tion of the Federal Register. You may send your comments via the Federal eRulemaking portal at www.regulations.gov. USDA Terminates Price Formula Proceedings
The USDA has announced the termination of a proceeding on proposed amendments to modify the formulas used to determine Class I and Class II prices in all Federal milk marketing orders.
The USDA held a hearing in December 2006 to consider a proposal by the National Milk Pro-ducers Federation. The USDA has terminated the proceeding because the evidence presented at the hearing was neither compelling nor provided a basis to make a reasoned decision for recom-mending adoption or denial of the proposal.
The termination notice was published in the December 24, 2008 Federal Register and is avail-able at www.fmmatlanta.com under ‘What’s New’. Transportation Credit Update
Preliminary claims on the Federal Order 7 trans-portation credit balancing fund for December 2008 were made for $2,154,031.59. Since the available balance was $1,213,477.66, eligible claims were paid at the rate of approximately $0.56 on the dollar.

Calculation of Uniform Butterfat Price:Utilization Pounds Price/lb. Value
Class I Butterfat 38.26% 8,819,703 $1.7925 $ 15,809,317.69 Class I Differential at Location 293,811.00 Class II Butterfat 19.22% 4,430,298 $1.3068 5,789,513.41 Class III Butterfat 15.87% 3,657,359 $1.2998 4,753,835.23 Class IV Butterfat 26.65% 6,144,421 $1.2998 7,986,518.44
Total Butterfat 100.00% 23,051,781 $ 34,632,995.77
Uniform Butterfat Price per lb. (Fulton County, Georgia): $1.5024
Calculation of Uniform Skim Milk PriceProducer Milk Utilization Pounds ValueClass I Skim Milk 67.80% 395,538,649 $9.49 /cwt. $ 37,536,617.80 Class I Butterfat 38.26% 8,819,703 $1.7925 /lb. 15,809,317.69 Class I Differential at Location 404,358,352 13,482,398.62 Total Class I Milk 66.68% 404,358,352 $ 66,828,334.11 Class II Skim Milk 8.43% 49,201,312 $6.88 /cwt. $ 3,385,050.26 Class II Butterfat 19.22% 4,430,298 $1.3068 /lb. 5,789,513.41 Total Class II Milk 8.84% 53,631,610 $ 9,174,563.67 Class III Skim Milk 12.29% 71,692,480 $11.12 /cwt. $ 7,972,203.76 Class III Butterfat 15.87% 3,657,359 $1.2998 /lb. 4,753,835.23 Total Class III Milk 12.42% 75,349,839 $ 12,726,038.99 Class IV Skim Milk 11.48% 66,981,465 $6.01 /cwt. $ 4,025,586.03 Class IV Butterfat 26.65% 6,144,421 $1.2998 /lb. 7,986,518.44 Total Class IV Milk 12.06% 73,125,886 $ 12,012,104.47
Producer Milk 100.00% 606,465,687 $ 100,741,041.24 Adjustments
Overage and Other Source $2,363.60Inventory Adjustments $137,434.56Producer butterfat at uniform butterfat price ($34,632,995.77)Location Adjustments to Producers $3,846,319.741/2 Unobligated Balance in P.S.F $231,099.81
Adjusted Pool Value $ 12.05409 $70,325,263.18Reserve for Producer Settlement Fund $ 0.04409 $257,253.04
Uniform Skim Milk Price per cwt. (Fulton County, Georgia): $12.01
Uniform Price per cwt. (Fulton County, Georgia) $16.85** At 3.5% butterfat test; for information purposes.
OTHER FEDERAL ORDERS: CLASS I AND UNIFORM PRICES (At 3.5% Butterfat)MARKET NAME CLASS I %
(Priced at) DEC 2008 JAN 2009 DEC 2008 DEC 2008Appalachian (Charlotte) $ 18.83 $ 19.14 $ 16.23 69.19%Arizona (Phoenix $ 17.78 $ 18.09 $ 13.97 33.65%Central (Kansas City) $ 17.43 $ 17.74 $ 13.63 40.51%Florida (Tampa) $ 20.83 $ 21.14 $ 18.88 84.48%Mideast (Cleveland) $ 17.43 $ 17.74 $ 14.42 47.90%Northeast (Boston) $ 18.68 $ 18.99 $ 16.02 46.30%Pacific Northwest (Seattle) $ 17.33 $ 17.64 $ 13.00 43.09%Southeast (Atlanta) $ 19.23 $ 19.54 $ 16.85 66.68%Southwest (Dallas) $ 18.43 $ 18.74 $ 14.75 60.77%Upper Midwest (Chicago) $ 17.23 $ 17.54 $ 15.04 17.00%
Page 2
F.O. 7 - SOUTHEAST: CALCULATION OF UNIFORM PRICES - DECEMBER 2008
Price per unit
CLASS I
$ 18.75
UNIFORM NOV 2008
$ 16.89$ 15.85
$ 19.21
$ 15.83$ 15.61$ 21.25$ 16.32$ 17.09$ 15.29

Receipts: December 2008 December 2007Producer Milk
Class I 404,358,352 392,848,589Class II 53,631,610 59,990,171Class III 75,349,839 97,736,994Class IV 73,125,886 43,013,946
Total Producer Milk 606,465,687 593,589,700Average Butterfat Test 3.80% 3.81%
Percent of Producer Milk in Class I 66.68% 66.17%Daily Average Receipts 19,563,409 19,148,055
Other Source MilkClass I 6,729,978 9,289,642Class II 4,052,216 10,514,307Class III 3,659,525 2,307,459Class IV 8,577,389 13,355,149
Total Other Source Milk 23,019,108 35,466,557Overage
Class I 17,775 0Class II 0 0Class III 0 0Class IV 1 0
Total Overage 17,776 0Opening Inventory
Class I 34,670,435 38,284,809Class II 3,011,735 730,746Class III 2,416,088 164,055Class IV 22,768,343 11,048,730
Total Opening Inventory 62,866,601 50,228,340Total Receipts 692,369,172 679,284,597
Utilization:Class I Utilization
Inventory of Packaged FMP 32,602,205 30,947,741Route Disposition Class I 401,703,958 398,922,173Shrinkage 2,505,412 4,238,961Transfers & Diversions to Nonpool 8,964,965 6,314,165
Total Class I Utilization 445,776,540 440,423,040Average Butterfat Test 2.17% 2.18%
Daily Average Utilization 14,379,888 14,207,195Class II Utilization
Nonfluid Used To Produce 1,433,861 1,357,877Shrinkage 1,515 112,329Transfers & Diversions to Nonpool/Commercial Foods 37,143,869 40,265,741Used To Produce/Other Uses 22,116,316 29,499,277
Total Class II Utilization 60,695,561 71,235,224Average Butterfat Test 9.12% 8.16%
Class III UtilizationShrinkage 719,013 0Transfers & Diversions to Nonpool 80,706,439 100,208,508Used To Produce/Other Uses 0 0
Total Class III Utilization 81,425,452 100,208,508Average Butterfat Test 4.69% 4.68%
Class IV UtilizationInventory 19,299,248 19,130,273Nonfluid Used To Fortify 2,865,984 2,558,015Shrinkage 7,160,479 7,124,692Transfers & Diversions to Nonpool 69,696,846 33,083,229Used To Produce/Other Uses 5,449,062 5,521,616
Total Class IV Utilization 104,471,619 67,417,825Average Butterfat Test 7.38% 9.32%
Total Utilization 692,369,172 679,284,597
SOUTHEAST MILK MARKETING AREA-FEDERAL ORDER 7STATISTICAL SUMMARY
Page 3

Page 4
Packaged Class I Route Sales in Marketing Area Product Description Pounds Percent
November 2008 Whole Milk 134,316,262 31.68%Fat Free Milk 49,097,005 11.58%Lowfat Milk (incl. 1%) 34,137,593 8.08%Reduced Fat Milk (incl. 2%) 151,060,417 35.62%Cultured Fluid Milk (incl. Buttermilk) 10,462,063 2.47%Flavored Drinks and Milk 44,956,071 10.60%Total Disposition in Marketing Area 424,029,411 100.00% Total Disposition by Pool Plants 333,404,292 78.63%Total Disposition by Nonpool Plants 90,625,119 21.37%Total Disposition in Marketing Area 424,029,411 100.00%
Southeast Market Summary The minimum order uniform price for payment to producers supplying the Southeast Order marketing
area during December 2008 is $16.85 per hundredweight for milk with a 3.5% butterfat test in Fulton County, Georgia. This is .965 times the uniform skim milk price of $12.01 per hundredweight plus 3.5 times the uniform butterfat price of $1.5024 per pound. Payment to producers may be reduced by location differentials, if applicable, and by properly authorized deductions.
Uniform prices are the result of marketwide pooling; all producer milk was classified and priced according to the milk's use. In December, Class I use, which is primarily bottled or packaged fluid milk, accounted for 67.80% of all producer skim milk (priced to handlers at $9.49 per hundredweight, plus the Class I differential, see page 2) and 38.26% of producer butterfat (priced to handlers at $1.7925 per pound plus Class I differential). Class II use, which is milk used in fluid cream products and miscellaneous manufacturing, accounted for 8.43% of all producer skim milk ($6.88 per hundredweight) and 19.22% of producer butterfat ($1.3068 per pound). Class III use, mostly milk used to produce cheese, accounted for 12.29% of all producer skim milk ($11.12 per hundredweight) and 15.87% of producer butterfat ($1.2998 per pound). Class IV use, generally milk processed into butter and powder, accounted for 11.48% of all producer skim milk ($6.01 per hundredweight) and 26.65% of producer butterfat ($1.2998 per pound).
Receipts of producer milk during December 2008 totaled 606.5 million pounds. There were 26 regulated pool distributing plants, 3 pool supply plant and 11 cooperative associations submitting reports of receipts and utilization that were included in the computation of the uniform prices for December 2008. Class I route disposition in the area totaled 424.0 million pounds in November 2008.
Mailbox Milk Prices, January through September 2008 Reporting Area 1/ Jan-08 Feb Mar Apr May Jun Jul Aug Sep-08 New England States 3/ $21.78 $20.09 $18.56 $18.95 $18.51 $19.60 $20.34 $19.53 $19.34 Eastern Pennsylvania 4/ $21.30 $19.61 $17.93 $18.44 $18.00 $18.97 $19.85 $19.09 $18.85 Appalachian States 5/ $22.21 $21.26 $18.84 $20.21 $19.25 $20.23 $22.36 $21.05 $20.66 Southeast States 6/ $22.94 $21.70 $19.36 $20.48 $20.29 $21.10 $23.53 $22.36 $21.76 Southern Missouri 7/ $21.15 $19.77 $17.91 $18.96 $17.97 $19.00 $20.85 $19.58 $19.16 Florida $23.87 $22.63 $20.26 $21.64 $21.80 $22.31 $24.98 $24.33 $23.73 Western Pennsylvania 8/ $21.14 $19.71 $18.25 $18.69 $18.23 $19.23 $19.87 $18.92 $18.77 Indiana $21.23 $19.98 $18.47 $18.79 $18.18 $19.02 $20.03 $18.99 $18.68 Wisconsin $20.79 $18.85 $18.86 $18.11 $18.87 $20.22 $19.14 $18.22 $17.78 Corn Belt States 9/ $19.97 $18.45 $17.35 $17.80 $17.56 $18.42 $18.66 $18.05 $17.80 Western Texas 10/ $19.53 $17.43 $16.70 $17.20 $16.90 $17.91 $18.24 $17.74 $17.03 Northwest States 11/ $19.59 $17.80 $16.60 $17.17 $16.87 $17.91 $18.51 $17.86 $17.26 All Federal Orders 12/ $20.70 $19.03 $18.01 $18.19 $18.09 $19.12 $19.43 $18.58 $18.25 California 13/ $17.97 $17.05 $16.04 $15.88 $16.79 $17.35 $17.19 $16.25 $16.29
Source: Dairy Market News; 1/ Information is shown for those areas for which prices are reported for at least 75% of the milk marketed under Federal milk orders. 2/ Net pay price received by dairy farmers for milk. 3/ Includes Connecticut, Maine, Massachusetts, New Hampshire, Rhode Island, and Vermont. 4/ All the counties to the east of those listed in 8/. 5/ Includes Kentucky, North Carolina, South Carolina, Tennessee, and Virginia. 6/ Includes Alabama, Arkansas, Georgia, Louisiana, and Mississippi. 7/ The counties of Vernon, Cedar, Polk, Dallas, Laclede, Texas, Dent, Crawford, Washington, St. Francois, and Perry and all those to the south of these. 8/ The counties of Warren, Elk, Clearfield, Indiana, Westmoreland, and Fayette, and all those to the west of these. 9/ Includes Kansas, Nebraska and the Missouri counties to the north of those listed in 7/. 10/ All counties to the west of Fanin, Hunt, Van Zandt, Henderson, Anderson, Houston, Cherokee, Nacogdoches, and Shelby. 11/ Includes Oregon and Washington. 12/ Weighted average of the information for all selected reporting areas in Federal milk orders. 13/ Calculated by California Department of Food and Agriculture.

FEDERAL ORDER 7 - SOUTHEAST: CLASS AND UNIFORM PRICESPool CLASS I* CLASS II CLASS III CLASS IV UNIFORM*
Period Skim/cwt Bfat/lb @ 3.5 Skim/cwt Bfat/lb @ 3.5 Skim/cwt Bfat/lb @ 3.5 Skim/cwt Bfat/lb @ 3.5 Skim/cwt Bfat/lb @ 3.5Nov 2007 $20.14 $1.4628 $24.55 $17.74 $1.4147 $22.07 $14.81 $1.4077 $19.22 $ 16.03 $1.4077 $20.40 $ 19.12 $1.4310 $23.46Dec $18.75 $1.4430 $23.14 $16.35 $1.4418 $20.82 $16.14 $1.4348 $20.60 $ 14.67 $1.4348 $19.18 $ 18.03 $1.4389 $22.44Jan 2008 $19.63 $1.4643 $24.07 $15.61 $1.3389 $19.75 $15.19 $1.3319 $19.32 $ 12.05 $1.3319 $16.29 $ 18.26 $1.3813 $22.46Feb $18.54 $1.3970 $22.78 $14.39 $1.3080 $18.46 $12.93 $1.3010 $17.03 $ 10.48 $1.3010 $14.67 $ 16.81 $1.3355 $20.90Mar $15.64 $1.3448 $19.80 $11.24 $1.3674 $15.63 $13.72 $1.3604 $18.00 $ 9.75 $1.3604 $14.17 $ 14.55 $1.3561 $18.79Apr $17.49 $1.3793 $21.71 $10.47 $1.4818 $15.29 $12.02 $1.4748 $16.76 $ 9.74 $1.4748 $14.56 $ 15.46 $1.4418 $19.97May $15.70 $1.5043 $20.42 $10.40 $1.5632 $15.51 $13.20 $1.5562 $18.18 $ 10.17 $1.5562 $15.26 $ 14.74 $1.5368 $19.60June $16.97 $1.6005 $21.98 $10.89 $1.6230 $16.19 $15.12 $1.6160 $20.25 $ 10.64 $1.6160 $15.92 $ 15.72 $1.6095 $20.80July $19.50 $1.6466 $24.58 $11.31 $1.6844 $16.81 $12.82 $1.6774 $18.24 $ 11.12 $1.6774 $16.60 $ 17.46 $1.6650 $22.68Aug $16.85 $1.7184 $22.27 $11.74 $1.7483 $17.45 $11.63 $1.7413 $17.32 $ 10.93 $1.7413 $16.64 $ 15.74 $1.7316 $21.25Sep $15.78 $1.7791 $21.45 $11.59 $1.8266 $17.58 $10.27 $1.8196 $16.28 $ 9.41 $1.8196 $15.45 $ 14.84 $1.8024 $20.63Oct $13.56 $1.7831 $19.33 $10.46 $1.8577 $16.60 $10.97 $1.8507 $17.06 $ 7.40 $1.8507 $13.62 $ 13.03 $1.8230 $18.95Nov $15.09 $1.8768 $21.13 $8.52 $1.7800 $14.45 $9.64 $1.7730 $15.51 $ 6.26 $1.7730 $12.25 $ 13.33 $1.8125 $19.21Dec $13.29 $1.8305 $19.23 $6.88 $1.3068 $11.21 $11.12 $1.2998 $15.28 $ 6.01 $1.2998 $10.35 $ 12.01 $1.5024 $16.85Jan 2009 $15.04 $1.4363 $19.54 $6.74
Pool CLASS I CLASS II CLASS III CLASS IVPeriod 1000 lbs. % 1000 lbs. % 1000 lbs. % 1000 lbs. %
Nov 2007 409,617 70.33% 48,795 8.38% 105,214 18.06% 18,794 3.23%Dec 392,849 66.17% 59,990 10.11% 97,737 16.47% 43,014 7.25%Jan 2008 427,443 66.56% 54,698 8.52% 109,863 17.11% 50,144 7.81%Feb 389,276 64.22% 69,259 11.43% 94,584 15.61% 52,992 8.74%Mar 398,126 64.80% 83,411 13.58% 82,833 13.48% 49,999 8.14%Apr 388,115 63.76% 81,108 13.33% 100,604 16.53% 38,804 6.38%May 386,639 64.74% 79,323 13.28% 96,547 16.17% 34,668 5.81%June 346,682 70.25% 71,361 14.46% 27,363 5.54% 48,094 9.75%July 365,692 67.73% 64,438 11.94% 68,086 12.61% 41,668 7.72%Aug 398,922 72.09% 57,441 10.38% 51,033 9.22% 45,981 8.31%Sep 400,017 74.55% 52,644 9.81% 61,540 11.47% 22,397 4.17%Oct 414,863 73.62% 58,955 10.46% 64,708 11.48% 25,002 4.44%Nov 381,264 67.96% 59,573 10.62% 63,744 11.36% 56,464 10.06%Dec 404,358 66.68% 53,632 8.84% 75,350 12.42% 73,126 12.06%606,466 2,900**
561,045 2,906
553,377 3,073
493,500 2,6662,936
563,528
* Class I and uniform prices are at Fulton County (Atlanta), Georgia;** Estimated
2,948606,111 2,989
608,631 2,943
539,885
597,176 2,956
FEDERAL ORDER 7 - SOUTHEAST: POOLED RECEIPTS AND UTILIZATION OF PRODUCER MILKProducer Milk
1000 lbs. FarmsNumber of
2,9052,933
582,419
642,148 3,068
614,369
593,590 3,1433,097
536,598
Class I Utilization
64%
66%
68%
70%
72%
Dec-07 Nov-08Dec-08
Page 5

** The base rate for making partial payments in Fulton County, GA for January will be $15.17 per hundredweight. This is 90 percent of the preceding month’s uniform price of $16.85 per hundredweight.
Producer Touch Base Requirements & Handler Diversion Limits [per Order Amendment issued March 17, 2008]
Jan Feb Mar Apr May Jun Jul Aug Sep Oct Nov Dec Producer Touch Base Days 1 1 1 1 1 1 1 1 1 1 1 1 Diversion Percentage Limits 25% 25% 35% 35% 35% 35% 25% 25% 25% 25% 25% 35%
WASDE Dairy Report 1/ WASDE-466 January 12, 2009
Milk production forecasts for 2008 are lowered from last month. Based on monthly milk production data through November, higher expected cow numbers are more than offset by lower expected milk per cow. Production forecasts for 2009 are reduced from last month as poor returns are expected to manifest themselves in a more rapid decline in cow numbers and slower growth in milk per cow. Commercial export forecasts for 2008 and 2009 are unchanged from last month. Exports for 2009 remain below last year as global demand reflects economic weakness. Ending stocks for both 2008 and 2009 are expected to be above levels forecast last month as weak demand is expected to slow domestic use. Sales of nonfat dry milk (NDM) to CCC during 2009 are forecast higher and small sales of cheese and butter to CCC are now forecast for the year.
Milk and dairy product prices for 2008 are adjusted from last month reflecting December data. Class III and Class IV prices for 2009 are reduced from last month as product price forecasts are lowered. Economic uncertainties have reduced demand for dairy products and prices have declined sharply for cheese, with lesser declines in butter, NDM, and whey. Price forecasts for cheese and butter in 2009 are reduced, with the sharpest declines in the first half of the year as supplies of these products are large. However, the reduction is less later in the year as lower forecast milk production results in declines in stocks of fat-based products. Although forecast weaker than last month, tightening supplies of NDM later in the year are expected to help support NDM prices. The all milk price is also forecast lower, $11.80 to $12.60 per cwt in 2009.
1/The World Agricultural Supply and Demand Estimates (WASDE) report provides USDA's comprehensive forecasts of supply and demand for major U.S. and global crops and U.S. livestock, including dairy. The most recent WASDE report is available at www.usda.gov/oce/commodity/wasde/index.htm.
Southeast Marketing Area - Federal Order 7 Pool and Payment Dates for the Pooling Periods
January through March 2009 MA Payment Dates Payments for Producer Milk
Due to: Due From: Partial Payment** Due Final Payment Due Pool Month
Pool & Uniform Price Release
Date All Funds P/S & T-Credit Coop Nonmember Coop Nonmember
JAN 2009 02/11/09 02/12/09 02/13/09 01/26/09 01/26/09 02/13/09 02/17/09 FEB 2009 03/11/09 03/12/09 03/13/09 02/25/09 02/26/09 03/13/09 03/16/09 MAR 2009 04/11/09 04/13/09 04/14/09 03/25/09 03/26/09 04/14/09 04/15/09
"The U.S. Department of Agriculture (USDA) prohibits discrimination in all its programs and activities on the basis of race, color, national origin, age, disability, and where applicable, sex, marital status, familial status, parental status, religion, sexual orientation, genetic information, political beliefs, reprisal, or because all or a part of an individual's income is derived from any public assistance program. (Not all prohibited bases apply to all programs.) Persons with disabilities who require alternative means for communication of program information (Braille, large print, audiotape, etc.) should contact USDA's TARGET Center at (202) 720-2600 (voice and TDD). To file a complaint of discrimination write to USDA, Director, Office of Civil Rights, 1400 Independence Avenue, S.W., Washington, D.C. 20250-9410 or call (800) 795-3272 (voice) or (202) 720-6382 (TDD). USDA is an equal opportunity provider and employer."
MILK MARKET ADMINISTRATORU.S. Department Of Agriculture 1550 North Brown Road, Suite 120Lawrenceville, Georgia 30043
www.fmmatlanta.com

Uniform Price Lower The uniform price in Fulton County, GA, was
$16.62 per hundredweight of milk at 3.5 percent butterfat for the month of January. The uniform price is $0.23 lower than the previous month and is $5.84 less than January of last year.
Class I utilization was 68.14 percent in Janu-ary, an increase of 1.46 percent compared with the previous month and an increase of 1.58 per-cent compared with January of last year.
National Dairy Situation The USDA estimates that the total U.S.
production of milk in December was 15.85 billion pounds, an increase of 1.4 percent from Decem-ber 2007 and an increase of 1.0 percent when compared with November 2008 on a daily aver-age basis. Total cheese output (excluding cottage cheese) was 857 million pounds,1.1 percent above December 2007 and 4.0 percent above November 2008. Butter production was 156 mil-lion pounds, 10.1 percent above December 2007 and 16.5 percent above November 2008.
Nonfat dry milk powder production was 155 million pounds in December, 42.6% percent higher than December 2007 and 11.1% percent higher than November 2008 on a daily average basis. Dry whey production was 91.2 million pounds in December, a 6.5 percent decrease from December of last year and a 4.3 percent in-crease from last month on a daily average basis. The milk-feed price ratio was 1.69 in January.
Market Information BULLETIN
ISSUED FOR THE INFORMATION OF PRODUCERS WHO ARE NOT MEMBERS OF COOPERATIVE ASSOCIATIONS
Sue L. Mosley, Market Administrator
www.fmmatlanta.com
Southeast Marketing Area Federal Order 7
Volume 10—No. 2 February 2009
USDA Invites Proposals Regarding Producer-Handlers
National Milk Producers Federation and Inter-national Dairy Foods Association have requested that the Department of Agriculture (USDA) hold a public hearing to consider a proposal to eliminate the producer-handler provision in all Federal milk marketing orders. Additionally, National Milk Pro-ducers Federation and International Dairy Foods Association have requested that USDA consider revision of the exempt plant provision in all Fed-eral milk marketing orders in the same rulemaking proceeding. The proposals would eliminate the provision exempting producer-handlers from pric-ing and pooling provisions; and would revise the current limit on monthly route disposition of pack-aged fluid milk required for exemption from pricing and pooling provisions as an exempt plant.
The proposals may be viewed at the Dairy Pro-grams website at www.ams.usda.gov/dairy.
The proposals have not yet been approved for inclusion in a Notice of Hearing. Before deciding whether a hearing will be held, USDA is providing the opportunity for interested parties to submit ad-ditional proposals regarding the elimination of the producer-handler provision and the revision of the exempt plant provision in all Federal milk market-ing orders.
The preferred method of submission is via email. Electronic submissions should be emailed to [email protected]. Proposals can also be mailed to: Deputy Administrator, USDA/AMS/Dairy Programs, STOP-0231-Room 2971, 1400 Independence Ave., SW, Washington, DC 20250-0225. Proposals must be received by March 9, 2009.
Each proposal should be accompanied by a comprehensive statement on the need for the pro-posal. The statement will be (continued on pg. 4)
Transportation Credit Update Preliminary claims on the Federal Order 7 trans-
portation credit balancing fund for January 2009 were made for $1,932,783.74. Since the available balance was $1,240,999.62, eligible claims were paid at the rate of approximately $0.64 on the dollar.

Calculation of Uniform Butterfat Price:Utilization Pounds Price/lb. Value
Class I Butterfat 36.81% 8,363,921 $1.3983 $ 11,695,270.73 Class I Differential at Location 277,213.49 Class II Butterfat 20.80% 4,724,068 $1.1154 5,269,225.50 Class III Butterfat 14.54% 3,302,284 $1.1084 3,660,251.57 Class IV Butterfat 27.85% 6,325,530 $1.1084 7,011,217.44
Total Butterfat 100.00% 22,715,803 $ 27,913,178.73
Uniform Butterfat Price per lb. (Fulton County, Georgia): $1.2288
Calculation of Uniform Skim Milk PriceProducer Milk Utilization Pounds ValueClass I Skim Milk 69.35% 405,139,064 $11.24 /cwt. $ 45,537,630.80 Class I Butterfat 36.81% 8,363,921 $1.3983 /lb. 11,695,270.73 Class I Differential at Location 413,502,985 13,818,945.87 Total Class I Milk 68.14% 413,502,985 $ 71,051,847.40 Class II Skim Milk 9.14% 53,383,390 $6.74 /cwt. $ 3,598,040.49 Class II Butterfat 20.80% 4,724,068 $1.1154 /lb. 5,269,225.50 Total Class II Milk 9.57% 58,107,458 $ 8,867,265.99 Class III Skim Milk 12.05% 70,388,725 $7.15 /cwt. $ 5,032,793.84 Class III Butterfat 14.54% 3,302,284 $1.1084 /lb. 3,660,251.57 Total Class III Milk 12.14% 73,691,009 $ 8,693,045.41 Class IV Skim Milk 9.46% 55,249,205 $5.92 /cwt. $ 3,270,752.90 Class IV Butterfat 27.85% 6,325,530 $1.1084 /lb. 7,011,217.44 Total Class IV Milk 10.15% 61,574,735 $ 10,281,970.34
Producer Milk 100.00% 606,876,187 $ 98,894,129.14 Adjustments
Overage and Other Source $23,307.40Inventory Adjustments $545.11Producer butterfat at uniform butterfat price ($27,913,178.73)Location Adjustments to Producers $3,639,827.601/2 Unobligated Balance in P.S.F $201,586.95
Adjusted Pool Value $ 12.81261 $74,846,217.47Reserve for Producer Settlement Fund $ 0.04261 $248,936.44
Uniform Skim Milk Price per cwt. (Fulton County, Georgia): $12.77
Uniform Price per cwt. (Fulton County, Georgia) $16.62** At 3.5% butterfat test; for information purposes.
OTHER FEDERAL ORDERS: CLASS I AND UNIFORM PRICES (At 3.5% Butterfat)MARKET NAME CLASS I %
(Priced at) JAN 2009 FEB 2009 JAN 2009 JAN 2009Appalachian (Charlotte) $ 19.14 $ 14.12 $ 16.41 70.29%Arizona (Phoenix $ 18.09 $ 13.07 $ 12.49 31.55%Central (Kansas City) $ 17.74 $ 12.72 $ 12.49 34.68%Florida (Tampa) $ 21.14 $ 16.12 $ 18.92 81.64%Mideast (Cleveland) $ 17.74 $ 12.72 $ 13.22 42.50%Northeast (Boston) $ 18.99 $ 13.97 $ 14.14 44.20%Pacific Northwest (Seattle) $ 17.64 $ 12.62 $ 12.12 28.23%Southeast (Atlanta) $ 19.54 $ 14.52 $ 16.62 68.14%Southwest (Dallas) $ 18.74 $ 13.72 $ 13.50 34.82%Upper Midwest (Chicago) $ 17.54 $ 12.52 $ 11.60 14.10%
Page 2
F.O. 7 - SOUTHEAST: CALCULATION OF UNIFORM PRICES - JANUARY 2009
Price per unit
CLASS I
$ 16.23
UNIFORM DEC 2008
$ 14.75$ 15.04
$ 16.85
$ 13.97$ 13.63$ 18.88$ 14.42$ 16.02$ 13.00

Receipts: January 2009 January 2008Producer Milk
Class I 413,502,985 427,442,652Class II 58,107,458 54,698,296Class III 73,691,009 109,862,963Class IV 61,574,735 50,144,148
Total Producer Milk 606,876,187 642,148,059Average Butterfat Test 3.74% 3.78%
Percent of Producer Milk in Class I 68.14% 66.56%Daily Average Receipts 19,576,651 20,714,454
Other Source MilkClass I 7,308,172 9,526,630Class II 2,808,191 11,760,414Class III 13,104,226 244,868Class IV 8,646,598 14,788,527
Total Other Source Milk 31,867,187 38,520,439Overage
Class I 0 0Class II 0 279,611Class III 0 1,892Class IV 294,422 9,276
Total Overage 294,422 290,779Opening Inventory
Class I 31,831,683 32,690,024Class II 599,666 3,727,470Class III 2,694,908 576,107Class IV 16,004,680 13,133,353
Total Opening Inventory 51,130,937 50,126,954Total Receipts 690,168,733 731,086,231
Utilization:Class I Utilization
Inventory of Packaged FMP 26,214,409 36,641,462Route Disposition Class I 414,751,960 423,225,692Shrinkage 3,141,456 1,916,819Transfers & Diversions to Nonpool 8,535,015 7,875,333
Total Class I Utilization 452,642,840 469,659,306Average Butterfat Test 2.02% 2.07%
Daily Average Utilization 14,601,382 15,150,300Class II Utilization
Nonfluid Used To Produce 1,670,185 2,656,995Shrinkage 421,019 0Transfers & Diversions to Nonpool/Commercial Foods 39,328,862 34,601,655Used To Produce/Other Uses 20,095,249 33,207,141
Total Class II Utilization 61,515,315 70,465,791Average Butterfat Test 8.74% 9.23%
Class III UtilizationShrinkage 0 0Transfers & Diversions to Nonpool 89,490,143 112,885,830Used To Produce/Other Uses 0 0
Total Class III Utilization 89,490,143 112,885,830Average Butterfat Test 4.05% 4.12%
Class IV UtilizationInventory 21,810,248 17,880,070Nonfluid Used To Fortify 1,220,101 1,464,850Shrinkage 7,896,148 7,857,016Transfers & Diversions to Nonpool 50,740,367 45,438,302Used To Produce/Other Uses 4,853,571 5,435,066
Total Class IV Utilization 86,520,435 78,075,304Average Butterfat Test 9.08% 9.41%
Total Utilization 690,168,733 731,086,231
SOUTHEAST MILK MARKETING AREA-FEDERAL ORDER 7STATISTICAL SUMMARY
Page 3

Page 4
Packaged Class I Route Sales in Marketing Area Product Description Pounds Percent
December 2008 Whole Milk 146,331,532 32.87%Fat Free Milk 50,097,320 11.25%Lowfat Milk (incl. 1%) 33,591,137 7.55%Reduced Fat Milk (incl. 2%) 161,249,120 36.22%Cultured Fluid Milk (incl. Buttermilk) 10,135,507 2.28%Flavored Drinks and Milk 43,737,264 9.83%Total Disposition in Marketing Area 445,141,880 100.00% Total Disposition by Pool Plants 350,590,605 78.76%Total Disposition by Nonpool Plants 94,551,275 21.24%Total Disposition in Marketing Area 445,141,880 100.00%
Southeast Market Summary The minimum order uniform price for payment to producers supplying the Southeast Order marketing
area during January 2009 is $16.62 per hundredweight for milk with a 3.5% butterfat test in Fulton County, Georgia. This is .965 times the uniform skim milk price of $12.77 per hundredweight plus 3.5 times the uniform butterfat price of $1.2288 per pound. Payment to producers may be reduced by location differentials, if applicable, and by properly authorized deductions.
Uniform prices are the result of marketwide pooling; all producer milk was classified and priced according to the milk's use. In January, Class I use, which is primarily bottled or packaged fluid milk, accounted for 69.35% of all producer skim milk (priced to handlers at $11.24 per hundredweight, plus the Class I differential, see page 2) and 36.81% of producer butterfat (priced to handlers at $1.3983 per pound plus Class I differential). Class II use, which is milk used in fluid cream products and miscellaneous manufacturing, accounted for 9.14% of all producer skim milk ($6.74 per hundredweight) and 20.80% of producer butterfat ($1.1154 per pound). Class III use, mostly milk used to produce cheese, accounted for 12.05% of all producer skim milk ($7.15 per hundredweight) and 14.54% of producer butterfat ($1.1084 per pound). Class IV use, generally milk processed into butter and powder, accounted for 9.46% of all producer skim milk ($5.92 per hundredweight) and 27.85% of producer butterfat ($1.1084 per pound).
Receipts of producer milk during January 2009 totaled 606.9 million pounds. There were 26 regulated pool distributing plants, 3 pool supply plant and 11 cooperative associations submitting reports of receipts and utilization that were included in the computation of the uniform prices for January 2009. Class I route disposition in the area totaled 445.1 million pounds in December 2008.
USDA Invites Proposals Regarding Producer-Handlers (cont.) (continued from pg. 1) evaluated to determine whether the proposal will be accepted if a hearing to amend all orders is held. In accordance with 7 CFR 900.22 and adoption of the final rule published in the Federal Register on August 20, 2008 (73 FR 49085), proposal submissions must include detailed explanations of the following seven items:
1.) Explain the proposal. What is the disorderly marketing condition that the proposal is intended to address? 2.) What is the purpose of the proposal? 3.) Describe the current Federal order requirements or industry practices relative to the proposal. 4.) Describe the expected impact on the industry, including on producers and handlers, and on consumers. Explain/Quantify.
5.) What are the expected effects on small businesses as defined by the Regulatory Flexibility Act (5 U.S.C. 601-612)? Explain/Quantify. 6.) How would the proposal increase or decrease costs to producers, handlers, others in the marketing chain, consumers, the Market Administrator offices and/or the Secretary? Explain/Quantify? 7.) Would a pre-hearing information session be helpful to explain the proposal?
If USDA determines that a hearing will be held, all known interested parties will be mailed a copy of the Notice of Hearing. Anyone who desires to present evidence on proposals set forth in the Notice of Hearing will have an opportunity to do so at the hearing. Once a Notice of Hearing is issued and until the issuance of a Final Decision, USDA employees involved in the decisional process may not discuss the merits of a proceeding on an “ex parte” basis. Accordingly, it is suggested that any discussions you may wish to have with USDA personnel, including Market Administrator employees, be initiated as soon as possible. Procedural matters may be discussed at any time throughout the proceeding. For additional information on this announcement, visit www.fmmatlanta.com and click ‘What’s New’.

FEDERAL ORDER 7 - SOUTHEAST: CLASS AND UNIFORM PRICESPool CLASS I* CLASS II CLASS III CLASS IV UNIFORM*
Period Skim/cwt Bfat/lb @ 3.5 Skim/cwt Bfat/lb @ 3.5 Skim/cwt Bfat/lb @ 3.5 Skim/cwt Bfat/lb @ 3.5 Skim/cwt Bfat/lb @ 3.5Nov 2007 $20.14 $1.4628 $24.55 $17.74 $1.4147 $22.07 $14.81 $1.4077 $19.22 $ 16.03 $1.4077 $20.40 $ 19.12 $1.4310 $23.46Dec $18.75 $1.4430 $23.14 $16.35 $1.4418 $20.82 $16.14 $1.4348 $20.60 $ 14.67 $1.4348 $19.18 $ 18.03 $1.4389 $22.44Jan 2008 $19.63 $1.4643 $24.07 $15.61 $1.3389 $19.75 $15.19 $1.3319 $19.32 $ 12.05 $1.3319 $16.29 $ 18.26 $1.3813 $22.46Feb $18.54 $1.3970 $22.78 $14.39 $1.3080 $18.46 $12.93 $1.3010 $17.03 $ 10.48 $1.3010 $14.67 $ 16.81 $1.3355 $20.90Mar $15.64 $1.3448 $19.80 $11.24 $1.3674 $15.63 $13.72 $1.3604 $18.00 $ 9.75 $1.3604 $14.17 $ 14.55 $1.3561 $18.79Apr $17.49 $1.3793 $21.71 $10.47 $1.4818 $15.29 $12.02 $1.4748 $16.76 $ 9.74 $1.4748 $14.56 $ 15.46 $1.4418 $19.97May $15.70 $1.5043 $20.42 $10.40 $1.5632 $15.51 $13.20 $1.5562 $18.18 $ 10.17 $1.5562 $15.26 $ 14.74 $1.5368 $19.60June $16.97 $1.6005 $21.98 $10.89 $1.6230 $16.19 $15.12 $1.6160 $20.25 $ 10.64 $1.6160 $15.92 $ 15.72 $1.6095 $20.80July $19.50 $1.6466 $24.58 $11.31 $1.6844 $16.81 $12.82 $1.6774 $18.24 $ 11.12 $1.6774 $16.60 $ 17.46 $1.6650 $22.68Aug $16.85 $1.7184 $22.27 $11.74 $1.7483 $17.45 $11.63 $1.7413 $17.32 $ 10.93 $1.7413 $16.64 $ 15.74 $1.7316 $21.25Sep $15.78 $1.7791 $21.45 $11.59 $1.8266 $17.58 $10.27 $1.8196 $16.28 $ 9.41 $1.8196 $15.45 $ 14.84 $1.8024 $20.63Oct $13.56 $1.7831 $19.33 $10.46 $1.8577 $16.60 $10.97 $1.8507 $17.06 $ 7.40 $1.8507 $13.62 $ 13.03 $1.8230 $18.95Nov $15.09 $1.8768 $21.13 $8.52 $1.7800 $14.45 $9.64 $1.7730 $15.51 $ 6.26 $1.7730 $12.25 $ 13.33 $1.8125 $19.21Dec $13.29 $1.8305 $19.23 $6.88 $1.3068 $11.21 $11.12 $1.2998 $15.28 $ 6.01 $1.2998 $10.35 $ 12.01 $1.5024 $16.85Jan 2009 $15.04 $1.4363 $19.54 $6.74 $1.1154 $10.41 $7.15 $1.1084 $10.78 $ 5.92 $1.1084 $9.59 $ 12.77 $1.2288 $16.62Feb $10.87 $1.1520 $14.52 $6.63
Pool CLASS I CLASS II CLASS III CLASS IVPeriod 1000 lbs. % 1000 lbs. % 1000 lbs. % 1000 lbs. %
Nov 2007 409,617 70.33% 48,795 8.38% 105,214 18.06% 18,794 3.23%Dec 392,849 66.17% 59,990 10.11% 97,737 16.47% 43,014 7.25%Jan 2008 427,443 66.56% 54,698 8.52% 109,863 17.11% 50,144 7.81%Feb 389,276 64.22% 69,259 11.43% 94,584 15.61% 52,992 8.74%Mar 398,126 64.80% 83,411 13.58% 82,833 13.48% 49,999 8.14%Apr 388,115 63.76% 81,108 13.33% 100,604 16.53% 38,804 6.38%May 386,639 64.74% 79,323 13.28% 96,547 16.17% 34,668 5.81%June 346,682 70.25% 71,361 14.46% 27,363 5.54% 48,094 9.75%July 365,692 67.73% 64,438 11.94% 68,086 12.61% 41,668 7.72%Aug 398,922 72.09% 57,441 10.38% 51,033 9.22% 45,981 8.31%Sep 400,017 74.55% 52,644 9.81% 61,540 11.47% 22,397 4.17%Oct 414,863 73.62% 58,955 10.46% 64,708 11.48% 25,002 4.44%Nov 381,264 67.96% 59,573 10.62% 63,744 11.36% 56,464 10.06%Dec 404,358 66.68% 53,632 8.84% 75,350 12.42% 73,126 12.06%Jan 2009 413,503 68.14% 58,107 9.57% 73,691 12.14% 61,575 10.15%
3,073
493,500 2,6662,936
* Class I and uniform prices are at Fulton County (Atlanta), Georgia;** Estimated
2,948606,111 2,989
608,631 2,943
539,885
597,176 2,956
553,377
FEDERAL ORDER 7 - SOUTHEAST: POOLED RECEIPTS AND UTILIZATION OF PRODUCER MILKProducer Milk
1000 lbs. FarmsNumber of
582,419
642,148 3,068
614,369
593,590 3,1433,097
606,876 2,900**
2,9052,933536,598
563,528
606,466 2,974561,045 2,906
Class I Utilization
64%
66%
68%
70%
72%
Jan-08 Dec-08Jan-09
Page 5

** The base rate for making partial payments in Fulton County, GA for February will be $14.96 per hundredweight. This is 90 percent of the preceding month’s uniform price of $16.62 per hundredweight.
Producer Touch Base Requirements & Handler Diversion Limits [per Order Amendment issued March 17, 2008]
Jan Feb Mar Apr May Jun Jul Aug Sep Oct Nov Dec Producer Touch Base Days 1 1 1 1 1 1 1 1 1 1 1 1 Diversion Percentage Limits 25% 25% 35% 35% 35% 35% 25% 25% 25% 25% 25% 35%
WASDE Dairy Report 1/ WASDE - 467 February 10, 2009 Milk production forecasts for 2009 are lowered from last month. The January 30 Cattle report estimated that dairy cow inventories on January 1, 2009, were almost 1 percent above a year earlier and only fractionally fewer heifers were being retained for addition to dairy herds. Assuming no significant herd reductions in the first part of the year, producer returns are expected to be heavily pressured resulting in a relatively sharp reduction in inventories during the latter part of the year. Output per cow is unchanged from last month. Both domestic and export demand is forecast to remain weak due to economic uncertainty. Commercial export forecasts for 2009 are reduced from last month as weak international demand and expected competition from recently announced subsidized EU-27 exports limit opportunities for commercial exports. Conversely, lower international prices are expected to result in slightly higher U.S. imports of dairy products, primarily cheese. Fat basis ending stocks are forecast lower as supplies tighten later in the year on lower milk production, but skim-solids stocks are raised as exports of nonfat dry milk (NDM) are limited and supplies burden the market. Sales of butter and NDM to the CCC are forecast higher. Milk and dairy product price estimates for 2009 are reduced as first-half product prices are expected to be pressured by the confluence of weak demand and burdensome supplies. As milk production is reduced, especially in the latter part of the year, tighter milk supplies are expected to help lift second half prices from their midyear lows. However, weaker forecast exports and continued weakness in domestic demand keep prices later in the year lower than forecast last month. As a result, the annual average product and Class prices are forecast below last month. The all milk price is also forecast lower, $10.95 to $11.65 per cwt in 2009.
1/ The World Agricultural Supply and Demand Estimates (WASDE) report provides USDA's comprehensive forecasts of supply and demand for major U.S. and global crops and U.S. livestock, including dairy. The most recent WASDE report is available at www.usda.gov/oce/commodity/wasde/index.htm.
Southeast Marketing Area - Federal Order 7 Pool and Payment Dates for the Pooling Periods
February through April 2009 MA Payment Dates Payments for Producer Milk
Due to: Due From: Partial Payment** Due Final Payment Due Pool Month
Pool & Uniform Price Release
Date All Funds P/S & T-Credit Coop Nonmember Coop Nonmember
FEB 2009 03/11/09 03/12/09 03/13/09 02/25/09 02/26/09 03/13/09 03/16/09 MAR 2009 04/11/09 04/13/09 04/14/09 03/25/09 03/26/09 04/14/09 04/15/09 APR 2009 05/11/09 05/12/09 05/13/09 04/27/09 04/27/09 05/13/09 05/14/09
"The U.S. Department of Agriculture (USDA) prohibits discrimination in all its programs and activities on the basis of race, color, national origin, age, disability, and where applicable, sex, marital status, familial status, parental status, religion, sexual orientation, genetic information, political beliefs, reprisal, or because all or a part of an individual's income is derived from any public assistance program. (Not all prohibited bases apply to all programs.) Persons with disabilities who require alternative means for communication of program information (Braille, large print, audiotape, etc.) should contact USDA's TARGET Center at (202) 720-2600 (voice and TDD). To file a complaint of discrimination write to USDA, Director, Office of Civil Rights, 1400 Independence Avenue, S.W., Washington, D.C. 20250-9410 or call (800) 795-3272 (voice) or (202) 720-6382 (TDD). USDA is an equal opportunity provider and employer."
MILK MARKET ADMINISTRATORU.S. Department Of Agriculture 1550 North Brown Road, Suite 120Lawrenceville, Georgia 30043
www.fmmatlanta.com

Uniform Price Lower The uniform price in Fulton County, GA, was
$13.22 per hundredweight of milk at 3.5 percent butterfat for the month of February. The uniform price is $3.40 lower than the previous month and is $7.68 less than February of last year.
Class I utilization was 67.93 percent in Febru-ary, a decrease of 0.21 percent compared with the previous month and an increase of 3.71 per-cent compared with February of last year.
National Dairy Situation The USDA estimates that the total U.S.
production of milk in January was 16.1 billion pounds, an increase of 0.8 percent from January 2008 and an increase of 1.3 percent when compared with December 2008 on a daily aver-age basis. Total cheese output (excluding cottage cheese) was 821 million pounds, 1.0 percent above January 2008 but 4.4 percent below De-cember 2008. Butter production was 175 million pounds, 3.5 percent above January 2008 and 11.8 percent above December 2008.
Nonfat dry milk powder production was 156 million pounds in January, 31.1 percent higher than January 2008 and 0.6 percent higher than December 2008 on a daily average basis. Dry whey production was 88.6 million pounds in Janu-ary, a 3.6 percent decrease from January of last year and a 3.1 percent decrease from last month. The milk-feed price ratio was 1.44 in February, down 0.15 points from January’s revised ratio.
Market Information BULLETIN
ISSUED FOR THE INFORMATION OF PRODUCERS WHO ARE NOT MEMBERS OF COOPERATIVE ASSOCIATIONS
Sue L. Mosley, Market Administrator
www.fmmatlanta.com
Southeast Marketing Area Federal Order 7
Volume 10—No. 3 March 2009
Public Information Session Announced The U.S. Department of Agriculture (USDA)
will hold a public information session March 20, 2009, to address proposals received to amend Federal milk marketing order producer-handler and exempt plant provisions. Please read the no-tice inserted for additional information.
Market News Web Portal to Include Dairy The USDA has announced that its Market
News Portal has been expanded to include Dairy Market News. The portal, operated by USDA’s Agricultural Marketing Service (AMS), significantly enhances Market News web site services. The Market News web portal provides instant, real-time access to daily and historical reports on agri-cultural commodity markets. The system came on line in 2005, beginning with Fruits and Vegetables and Livestock and Grain. The portal can be ac-cessed at http://www.marketnews.usda.gov/.
The expanded web portal will help more busi-nesses make marketing decisions with instant ac-cess to Market News data bases. The portal makes customized current and historical data available almost instantly.
Registered users can log into the portal, ac-cess information, download it in several user-defined formats, and establish electronic book-marks to quickly locate specific data. Users can create their own market summary charts to pro-vide snapshots of commodity prices based on lo-cation and dates for many commodities. The por-tal also offers additional features, such as nation-wide weather reports and metric and currency conversions. There is no cost (continued on pg. 4) Transportation Credit Update
Preliminary claims on the Federal Order 7 trans-portation credit balancing fund for February 2009 were made for $1,511,178.37. Since the available balance was $1,112,760.76, eligible claims were paid at the rate of approximately $0.74 on the dollar.
Reminder: Our Address Has Changed Our P.O. Box is no longer in use. Please direct all written communications to: 1550 North Brown Road, Suite 120, Lawrenceville, GA 30043.

Calculation of Uniform Butterfat Price:Utilization Pounds Price/lb. Value
Class I Butterfat 36.90% 7,442,768 $1.1140 $ 8,291,243.54 Class I Differential at Location 247,329.29 Class II Butterfat 25.66% 5,177,124 $1.1011 5,700,531.26 Class III Butterfat 20.82% 4,199,113 $1.0941 4,594,249.54 Class IV Butterfat 16.62% 3,352,970 $1.0941 3,668,484.48
Total Butterfat 100.00% 20,171,975 $ 22,501,838.11
Uniform Butterfat Price per lb. (Fulton County, Georgia): $1.1155
Calculation of Uniform Skim Milk PriceProducer Milk Utilization Pounds ValueClass I Skim Milk 69.12% 363,473,569 $7.07 /cwt. $ 25,697,581.33 Class I Butterfat 36.90% 7,442,768 $1.1140 /lb. 8,291,243.54 Class I Differential at Location 370,916,337 12,424,244.16 Total Class I Milk 67.93% 370,916,337 $ 46,413,069.03 Class II Skim Milk 9.88% 51,948,001 $6.63 /cwt. $ 3,444,152.49 Class II Butterfat 25.66% 5,177,124 $1.1011 /lb. 5,700,531.26 Total Class II Milk 10.46% 57,125,125 $ 9,144,683.75 Class III Skim Milk 17.82% 93,675,862 $5.68 /cwt. $ 5,320,788.99 Class III Butterfat 20.82% 4,199,113 $1.0941 /lb. 4,594,249.54 Total Class III Milk 17.93% 97,874,975 $ 9,915,038.53 Class IV Skim Milk 3.18% 16,726,335 $5.82 /cwt. $ 973,472.73 Class IV Butterfat 16.62% 3,352,970 $1.0941 /lb. 3,668,484.48 Total Class IV Milk 3.68% 20,079,305 $ 4,641,957.21
Producer Milk 100.00% 545,995,742 $ 70,114,748.52 Adjustments
Overage and Other Source $6,651.03Inventory Adjustments $2,787.24Producer butterfat at uniform butterfat price ($22,501,838.11)Location Adjustments to Producers $3,157,682.221/2 Unobligated Balance in P.S.F $187,336.80
Adjusted Pool Value $ 9.69286 $50,967,367.70Reserve for Producer Settlement Fund $ 0.04286 $225,374.17
Uniform Skim Milk Price per cwt. (Fulton County, Georgia): $9.65
Uniform Price per cwt. (Fulton County, Georgia) $13.22** At 3.5% butterfat test; for information purposes.
OTHER FEDERAL ORDERS: CLASS I AND UNIFORM PRICES (At 3.5% Butterfat)MARKET NAME CLASS I %
(Priced at) FEB 2009 MAR 2009 FEB 2009 FEB 2009Appalachian (Charlotte) $ 14.12 $ 12.83 $ 12.98 69.00%Arizona (Phoenix $ 13.07 $ 11.78 $ 10.69 33.22%Central (Kansas City) $ 12.72 $ 11.43 $ 10.38 31.86%Florida (Tampa) $ 16.12 $ 14.83 $ 15.02 81.37%Mideast (Cleveland) $ 12.72 $ 11.43 $ 10.83 42.40%Northeast (Boston) $ 13.97 $ 12.68 $ 11.75 43.00%Pacific Northwest (Seattle) $ 12.62 $ 11.33 $ 10.31 28.55%Southeast (Atlanta) $ 14.52 $ 13.23 $ 13.22 67.93%Southwest (Dallas) $ 13.72 $ 12.43 $ 11.31 34.36%Upper Midwest (Chicago) $ 12.52 $ 11.23 $ 9.82 14.30%
Page 2
F.O. 7 - SOUTHEAST: CALCULATION OF UNIFORM PRICES - FEBRUARY 2009
Price per unit
CLASS I
$ 16.41
UNIFORM JAN 2009
$ 13.50$ 11.60
$ 16.62
$ 12.49$ 12.49$ 18.92$ 13.22$ 14.14$ 12.12

Receipts: February 2009 February 2008Producer Milk
Class I 370,916,337 389,275,544Class II 57,125,125 69,259,388Class III 97,874,975 94,584,357Class IV 20,079,305 52,992,042
Total Producer Milk 545,995,742 606,111,331Average Butterfat Test 3.69% 3.75%
Percent of Producer Milk in Class I 67.93% 64.22%Daily Average Receipts 19,499,848 20,900,391
Other Source MilkClass I 8,128,170 7,529,376Class II 3,013,772 12,723,612Class III 11,437,257 2,394,416Class IV 7,988,644 8,297,361
Total Other Source Milk 30,567,843 30,944,765Overage
Class I 0 1,778Class II 0 0Class III 0 0Class IV 6,079 24,907
Total Overage 6,079 26,685Opening Inventory
Class I 26,514,391 37,488,681Class II 525,109 2,806,369Class III 6,088,859 79,084Class IV 14,891,998 14,019,312
Total Opening Inventory 48,020,357 54,393,446Total Receipts 624,590,021 691,476,227
Utilization:Class I Utilization
Inventory of Packaged FMP 29,529,838 34,862,583Route Disposition Class I 365,154,256 388,573,939Shrinkage 1,641,343 3,112,969Transfers & Diversions to Nonpool 9,233,461 7,745,888
Total Class I Utilization 405,558,898 434,295,379Average Butterfat Test 1.99% 2.02%
Daily Average Utilization 14,484,246 14,975,703Class II Utilization
Nonfluid Used To Produce 1,568,105 2,243,937Shrinkage 541,132 3,378Transfers & Diversions to Nonpool/Commercial Foods 36,984,601 50,739,267Used To Produce/Other Uses 21,570,168 31,802,787
Total Class II Utilization 60,664,006 84,789,369Average Butterfat Test 9.69% 7.97%
Class III UtilizationShrinkage 7,300,970 0Transfers & Diversions to Nonpool 103,656,529 97,057,857Used To Produce/Other Uses 4,443,592 0
Total Class III Utilization 115,401,091 97,057,857Average Butterfat Test 3.76% 4.41%
Class IV UtilizationInventory 19,833,001 14,020,385Nonfluid Used To Fortify 1,363,993 1,193,563Shrinkage 0 7,012,270Transfers & Diversions to Nonpool 21,769,032 48,462,247Used To Produce/Other Uses 0 4,645,157
Total Class IV Utilization 42,966,026 75,333,622Average Butterfat Test 11.67% 8.61%
Total Utilization 624,590,021 691,476,227
SOUTHEAST MILK MARKETING AREA-FEDERAL ORDER 7STATISTICAL SUMMARY
Page 3

Page 4
Packaged Class I Route Sales in Marketing Area Product Description Pounds Percent
January 2009 Whole Milk 145,698,715 31.93%Fat Free Milk 53,622,772 11.75%Lowfat Milk (incl. 1%) 37,397,303 8.20%Reduced Fat Milk (incl. 2%) 164,947,823 36.15%Cultured Fluid Milk (incl. Buttermilk) 9,330,458 2.04%Flavored Drinks and Milk 45,287,555 9.93%Total Disposition in Marketing Area 456,284,626 100.00% Total Disposition by Pool Plants 363,030,212 79.56%Total Disposition by Nonpool Plants 93,254,414 20.44%Total Disposition in Marketing Area 456,284,626 100.00%
Southeast Market Summary The minimum order uniform price for payment to producers supplying the Southeast Order marketing
area during February 2009 is $13.22 per hundredweight for milk with a 3.5% butterfat test in Fulton County, Georgia. This is .965 times the uniform skim milk price of $9.65 per hundredweight plus 3.5 times the uniform butterfat price of $1.1155 per pound. Payment to producers may be reduced by location differentials, if applicable, and by properly authorized deductions.
Uniform prices are the result of marketwide pooling; all producer milk was classified and priced according to the milk's use. In February, Class I use, which is primarily bottled or packaged fluid milk, accounted for 69.12% of all producer skim milk (priced to handlers at $7.07 per hundredweight, plus the Class I differential, see page 2) and 36.90% of producer butterfat (priced to handlers at $1.1140 per pound plus Class I differential). Class II use, which is milk used in fluid cream products and miscellaneous manufacturing, accounted for 9.88% of all producer skim milk ($6.63 per hundredweight) and 25.66% of producer butterfat ($1.1011 per pound). Class III use, mostly milk used to produce cheese, accounted for 17.82% of all producer skim milk ($5.68 per hundredweight) and 20.82% of producer butterfat ($1.0941 per pound). Class IV use, generally milk processed into butter and powder, accounted for 3.18% of all producer skim milk ($5.82 per hundredweight) and 16.62% of producer butterfat ($1.0941 per pound).
Receipts of producer milk during February 2009 totaled 546.0 million pounds. There were 26 regulated pool distributing plants, 3 pool supply plants and 11 cooperative associations submitting reports of receipts and utilization that were included in the computation of the uniform prices for February 2009. Class I route disposition in the area totaled 456.3 million pounds in January 2009.
USDA Expands Market News Web Portal to Include Dairy (cont.) (continued from pg. 1) to register. USDA Market News reports provide timely, unbiased and reliable
information to producers, shippers and handlers, manufacturers and processors, wholesale and retail marketers, market analysts and others. USDA and cooperating State agency market reporters gather information on supplies, demand, and prices of agricultural commodities.
Established in 1915, USDA Market News issues over 1000 daily reports on fruits and vegetables, livestock, dairy products, grain, poultry, and cotton. The service helps businesses make informed marketing decisions and is a primary data source for other uses – such as contract pricing, dispute resolution, and insurance settlements.
USDA Concludes Proceeding to Amend Appalachian and Southeast Milk Marketing Orders
The USDA has announced a rule that concludes the rulemaking proceeding to consider proposals to amend the producer-handler provisions of the Appalachian and Southeast Milk Marketing Orders. The proposed amendments were considered at a public hearing held at Atlanta, Georgia, in February 2004.
The rule terminates the proceeding concerning proposed amendments that would: 1) Limit the exemption for producer-handlers to those dairy farmers with less than 3 million pounds of fluid milk products sales; and 2) Allow dairy farmers to purchase supplemental supplies of milk from other sources while retaining their producer-handler status.
Other proposals considered as part of this proceeding were addressed in previously issued decisions. The rule terminating the proceeding appears in the March 13, 2009 Federal Register.

FEDERAL ORDER 7 - SOUTHEAST: CLASS AND UNIFORM PRICESPool CLASS I* CLASS II CLASS III CLASS IV UNIFORM*
Period Skim/cwt Bfat/lb @ 3.5 Skim/cwt Bfat/lb @ 3.5 Skim/cwt Bfat/lb @ 3.5 Skim/cwt Bfat/lb @ 3.5 Skim/cwt Bfat/lb @ 3.5Nov 2007 $20.14 $1.4628 $24.55 $17.74 $1.4147 $22.07 $14.81 $1.4077 $19.22 $ 16.03 $1.4077 $20.40 $ 19.12 $1.4310 $23.46Dec $18.75 $1.4430 $23.14 $16.35 $1.4418 $20.82 $16.14 $1.4348 $20.60 $ 14.67 $1.4348 $19.18 $ 18.03 $1.4389 $22.44Jan 2008 $19.63 $1.4643 $24.07 $15.61 $1.3389 $19.75 $15.19 $1.3319 $19.32 $ 12.05 $1.3319 $16.29 $ 18.26 $1.3813 $22.46Feb $18.54 $1.3970 $22.78 $14.39 $1.3080 $18.46 $12.93 $1.3010 $17.03 $ 10.48 $1.3010 $14.67 $ 16.81 $1.3355 $20.90Mar $15.64 $1.3448 $19.80 $11.24 $1.3674 $15.63 $13.72 $1.3604 $18.00 $ 9.75 $1.3604 $14.17 $ 14.55 $1.3561 $18.79Apr $17.49 $1.3793 $21.71 $10.47 $1.4818 $15.29 $12.02 $1.4748 $16.76 $ 9.74 $1.4748 $14.56 $ 15.46 $1.4418 $19.97May $15.70 $1.5043 $20.42 $10.40 $1.5632 $15.51 $13.20 $1.5562 $18.18 $ 10.17 $1.5562 $15.26 $ 14.74 $1.5368 $19.60June $16.97 $1.6005 $21.98 $10.89 $1.6230 $16.19 $15.12 $1.6160 $20.25 $ 10.64 $1.6160 $15.92 $ 15.72 $1.6095 $20.80July $19.50 $1.6466 $24.58 $11.31 $1.6844 $16.81 $12.82 $1.6774 $18.24 $ 11.12 $1.6774 $16.60 $ 17.46 $1.6650 $22.68Aug $16.85 $1.7184 $22.27 $11.74 $1.7483 $17.45 $11.63 $1.7413 $17.32 $ 10.93 $1.7413 $16.64 $ 15.74 $1.7316 $21.25Sep $15.78 $1.7791 $21.45 $11.59 $1.8266 $17.58 $10.27 $1.8196 $16.28 $ 9.41 $1.8196 $15.45 $ 14.84 $1.8024 $20.63Oct $13.56 $1.7831 $19.33 $10.46 $1.8577 $16.60 $10.97 $1.8507 $17.06 $ 7.40 $1.8507 $13.62 $ 13.03 $1.8230 $18.95Nov $15.09 $1.8768 $21.13 $8.52 $1.7800 $14.45 $9.64 $1.7730 $15.51 $ 6.26 $1.7730 $12.25 $ 13.33 $1.8125 $19.21Dec $13.29 $1.8305 $19.23 $6.88 $1.3068 $11.21 $11.12 $1.2998 $15.28 $ 6.01 $1.2998 $10.35 $ 12.01 $1.5024 $16.85Jan 2009 $15.04 $1.4363 $19.54 $6.74 $1.1154 $10.41 $7.15 $1.1084 $10.78 $ 5.92 $1.1084 $9.59 $ 12.77 $1.2288 $16.62Feb $10.87 $1.1520 $14.52 $6.63 $1.1011 $10.25 $5.68 $1.0941 $9.31 $ 5.82 $1.0941 $9.45 $ 9.65 $1.1155 $13.22Mar $9.61 $1.1298 $13.23 $6.51
Pool CLASS I CLASS II CLASS III CLASS IVPeriod 1000 lbs. % 1000 lbs. % 1000 lbs. % 1000 lbs. %
Nov 2007 409,617 70.33% 48,795 8.38% 105,214 18.06% 18,794 3.23%Dec 392,849 66.17% 59,990 10.11% 97,737 16.47% 43,014 7.25%Jan 2008 427,443 66.56% 54,698 8.52% 109,863 17.11% 50,144 7.81%Feb 389,276 64.22% 69,259 11.43% 94,584 15.61% 52,992 8.74%Mar 398,126 64.80% 83,411 13.58% 82,833 13.48% 49,999 8.14%Apr 388,115 63.76% 81,108 13.33% 100,604 16.53% 38,804 6.38%May 386,639 64.74% 79,323 13.28% 96,547 16.17% 34,668 5.81%June 346,682 70.25% 71,361 14.46% 27,363 5.54% 48,094 9.75%July 365,692 67.73% 64,438 11.94% 68,086 12.61% 41,668 7.72%Aug 398,922 72.09% 57,441 10.38% 51,033 9.22% 45,981 8.31%Sep 400,017 74.55% 52,644 9.81% 61,540 11.47% 22,397 4.17%Oct 414,863 73.62% 58,955 10.46% 64,708 11.48% 25,002 4.44%Nov 381,264 67.96% 59,573 10.62% 63,744 11.36% 56,464 10.06%Dec 404,358 66.68% 53,632 8.84% 75,350 12.42% 73,126 12.06%Jan 2009 413,503 68.14% 58,107 9.57% 73,691 12.14% 61,575 10.15%Feb 370,916 67.93% 57,125 10.46% 97,875 17.93% 20,079 3.68%545,996 2,900**
3,073
493,500 2,6662,936
606,876 2,914
2,9052,933
* Class I and uniform prices are at Fulton County (Atlanta), Georgia;** Estimated
2,948606,111 2,989
608,631 2,943
539,885
597,176 2,956
553,377
FEDERAL ORDER 7 - SOUTHEAST: POOLED RECEIPTS AND UTILIZATION OF PRODUCER MILKProducer Milk
1000 lbs. FarmsNumber of
582,419
642,148 3,068
614,369
593,590 3,1433,097
536,598 563,528
606,466 2,974561,045 2,906
Class I Utilization
62%
64%
66%
68%
70%
Feb-08 Jan-09Feb-09
Page 5

** The base rate for making partial payments in Fulton County, GA for March will be $11.90 per hundredweight. This is 90 percent of the preceding month’s uniform price of $13.22 per hundredweight.
Producer Touch Base Requirements & Handler Diversion Limits [per Order Amendment issued March 17, 2008]
Jan Feb Mar Apr May Jun Jul Aug Sep Oct Nov Dec Producer Touch Base Days 1 1 1 1 1 1 1 1 1 1 1 1 Diversion Percentage Limits 25% 25% 35% 35% 35% 35% 25% 25% 25% 25% 25% 35%
WASDE Dairy Report 1/ WASDE - 468 March 11, 2009 Milk production for 2009 is lowered from last month. Cow numbers for 2009 are forecast higher than last month because recent revisions to 2008 cow estimates indicated a larger-than-expected dairy herd. However, milk production forecasts for 2009 are lowered as milk per cow growth is forecast slower, reflecting poor returns. The herd liquidation rate during 2009 is raised from last month. Trade forecasts for 2009 are unchanged from last month. CCC net removals are reduced as early demand strength is helping absorb dairy products and reduced production later in the year is expected to help limit supplies. Milk production estimates for 2008 are revised higher. Trade estimates for 2008 reflect December data. Ending stocks for 2008 are raised to reflect recently published revisions. Milk price estimates for 2009 are raised. Forecasts for butter and cheese prices are raised from last month as demand has been stronger than expected and later year reductions in milk supplies are expected to support product prices. Nonfat dry milk and whey prices are unchanged. As a result of higher cheese and butter prices, the annual Class III and Class IV price forecasts are raised. The all milk price is also forecast higher this month at $11.25 to $11.85 per cwt.
1/ The World Agricultural Supply and Demand Estimates (WASDE) report provides USDA's comprehensive forecasts of supply and demand for major U.S. and global crops and U.S. livestock, including dairy. The most recent WASDE report is available at www.usda.gov/oce/commodity/wasde/index.htm.
Southeast Marketing Area - Federal Order 7 Pool and Payment Dates for the Pooling Periods
March through May 2009 MA Payment Dates Payments for Producer Milk
Due to: Due From: Partial Payment** Due Final Payment Due Pool Month
Pool & Uniform Price Release
Date All Funds P/S & T-Credit Coop Nonmember Coop Nonmember
MAR 2009 04/11/09 04/13/09 04/14/09 03/25/09 03/26/09 04/14/09 04/15/09 APR 2009 05/11/09 05/12/09 05/13/09 04/27/09 04/27/09 05/13/09 05/14/09 MAY 2009 06/11/09 06/12/09 06/15/09 05/26/09 05/26/09 06/15/09 06/16/09
"The U.S. Department of Agriculture (USDA) prohibits discrimination in all its programs and activities on the basis of race, color, national origin, age, disability, and where applicable, sex, marital status, familial status, parental status, religion, sexual orientation, genetic information, political beliefs, reprisal, or because all or a part of an individual's income is derived from any public assistance program. (Not all prohibited bases apply to all programs.) Persons with disabilities who require alternative means for communication of program information (Braille, large print, audiotape, etc.) should contact USDA's TARGET Center at (202) 720-2600 (voice and TDD). To file a complaint of discrimination write to USDA, Director, Office of Civil Rights, 1400 Independence Avenue, S.W., Washington, D.C. 20250-9410 or call (800) 795-3272 (voice) or (202) 720-6382 (TDD). USDA is an equal opportunity provider and employer."
MILK MARKET ADMINISTRATORU.S. Department Of Agriculture 1550 North Brown Road, Suite 120Lawrenceville, Georgia 30043
www.fmmatlanta.com

United States Agricultural 1400 Independence Avenue, SW. Department of Marketing Room 2968-S, STOP 0225 Agriculture Service Washington, DC 20250-0225
March 13, 2009
USDA to Host an Information Session Regarding Proposals Received Seeking to Amend Producer-Handler and Exempt Plant Provisions of Federal Milk Marketing
Orders The Department of Agriculture (USDA) is hosting a public information session to ensure that all proposals received are fully understood. The information session will begin at 8:30 a.m. on March 20, 2009 in the USDA Whitten Building, 1400 Independence Ave, SW, Room 107-A, Washington, DC, 20250. The session will be available for attendance, telephone call-in, or via live Audio Webcast. The purpose of the pre-hearing information session is for interested parties to learn about the intent of proposals that have been submitted to amend producer-handler and exempt plant provisions and how the proposals would accomplish that intent. The session is intended to clarify the intent and effect of proposed amendments. The session will enable proponents to better prepare testimony and evidence in support of, or in opposition to, proposals that may be included should a Notice of Hearing regarding the amendment of producer-handler and exempt plant provisions be issued. The session will not become part of an official hearing record and will be conducted outside of ex-parte rules allowing government officials to freely discuss the proposed amendments. Participation in the information session is strongly encouraged for all parties that have submitted proposals to ensure that the proposals are understood by USDA. Participants should be prepared to present their proposal(s) and answer questions from a panel of USDA representatives. In accordance with security requirements at USDA Headquarters facilities you will need to provide the full name(s) of all representatives attending the information session. Should you wish to attend, please RSVP to Kate Fisher at (202) 720-9368, or by e-mail at: [email protected] your intent to participate no later than March 17, 2009. All proposals that were submitted along with additional information regarding the session will be available on March 16, 2009 at http://www.ams.usda.gov/dairy. Sincerely, Dana H. Coale /s/ Deputy Administrator Dairy Programs


March Uniform Price Falls The uniform price in Fulton County, GA,
was $12.47 per hundredweight of milk at 3.5 percent butterfat for the month of March. The uniform price is $0.75 lower than the previous month and is $6.32 per hundredweight lower than March of last year.
Class I utilization was 60.71 percent in March, a decrease of 7.22 percent compared with the previous month and a decrease of 4.09 percent compared with March of last year.
National Dairy Situation The USDA estimates that the total U.S.
production of milk in February was 14.7 billion pounds, an decrease of 2.8 percent from Feb-ruary 2008 and an increase of 1.4 percent when compared with January 2009 on a daily average basis. Total cheese output (excluding cottage cheese) was 769 million pounds, 1.4 percent higher than February 2008 and 3.3 percent higher than January 2009 on a daily average basis. Butter production was 145 mil-lion pounds, 2.4 percent above February 2008 and a decrease of 8.0 percent compared to January 2009 on a daily average basis.
Nonfat dry milk powder production was 123 million pounds in February, 8.0 percent higher than February 2008 and 11.6 percent lower than January 2009 on a daily average basis. Dry whey production was 82.7 million pounds in February, a 2.7 percent decrease from February of last year and a 3.5 percent below last month on a daily average basis.
The milk-feed price ratio, the pounds of 16 percent mixed dairy feed equal in value to one pound of whole milk, was 1.51 in March 2009, up 0.01 points from February’s revised ratio.
Market Information BULLETIN
ISSUED FOR THE INFORMATION OF PRODUCERS WHO ARE NOT MEMBERS OF COOPERATIVE ASSOCIATIONS
Sue L. Mosley, Market Administrator
www.fmmatlanta.com
Southeast Marketing Area Federal Order 7
Volume 10—No. 4 April 2009
Hearing Announced on Proposed Amendments to All Federal Milk Orders
The U. S. Department of Agriculture has an-nounced that it will hold a national public hearing to consider proposals seeking to amend or remove the producer-handler provisions and revise the exempt plant provisions applicable to all Federal milk market-ing orders. The hearing will begin at 1 p.m. on May 4, 2009, at The Westin - Cincinnati, 21 East Fifth Street, Cincinnati, Ohio, 45202.
USDA will also consider a proposal seeking to amend the orders to include provisions related to in-dividual handler pools as an alternative to the pro-ducer-handler provisions.
The National Milk Producers Federation and the International Dairy Foods Association submitted ini-tial proposals. USDA requested additional proposals from the industry that would examine all features of the producer-handler and exempt plant provisions. USDA received proposals from dairy farmers, pro-ducer-handlers, dairy farmer cooperatives, and fluid milk processors.
Anyone interested in participating in the hearing should notify an official from USDA upon arrival. The hearing notice was published in the April 9, 2009 Federal Register. Copies of the hearing notice and additional information are available from USDA/AMS/Dairy Programs, STOP 0231 - Rm. 2971, 1400 Inde-pendence Avenue, SW, Washington, D.C. 20250-0231 and may also be found on the AMS web site at www.ams.usda.gov/dairy.
If you have questions or concerns regarding this announcement, you may contact this office directly or visit www.fmmatlanta.com.
Reminder: Our Address Has Changed Our P.O. Box is no longer in use. Please direct all
written communications to: 1550 North Brown Road, Suite 120, Lawrenceville, GA 30043.

Calculation of Uniform Butterfat Price:Utilization Pounds Price/lb. Value
Class I Butterfat 33.81% 8,327,421 $1.0918 $ 9,091,878.25 Class I Differential at Location 277,962.84 Class II Butterfat 23.84% 5,872,605 $1.1664 6,849,806.46 Class III Butterfat 20.89% 5,145,375 $1.1594 5,965,547.78 Class IV Butterfat 21.46% 5,287,185 $1.1594 6,129,962.28
Total Butterfat 100.00% 24,632,586 $ 28,315,157.61
Uniform Butterfat Price per lb. (Fulton County, Georgia): $1.1495
Calculation of Uniform Skim Milk PriceProducer Milk Utilization Pounds ValueClass I Skim Milk 61.72% 403,139,566 $5.81 /cwt. $ 23,422,408.78 Class I Butterfat 33.81% 8,327,421 $1.0918 /lb. 9,091,878.25 Class I Differential at Location 411,466,987 13,788,869.68 Total Class I Milk 60.71% 411,466,987 $ 46,303,156.71 Class II Skim Milk 9.62% 62,805,454 $6.51 /cwt. $ 4,088,635.05 Class II Butterfat 23.84% 5,872,605 $1.1664 /lb. 6,849,806.46 Total Class II Milk 10.13% 68,678,059 $ 10,938,441.51 Class III Skim Milk 19.32% 126,173,130 $6.61 /cwt. $ 8,340,043.89 Class III Butterfat 20.89% 5,145,375 $1.1594 /lb. 5,965,547.78 Total Class III Milk 19.38% 131,318,505 $ 14,305,591.67 Class IV Skim Milk 9.34% 60,971,436 $5.78 /cwt. $ 3,524,149.02 Class IV Butterfat 21.46% 5,287,185 $1.1594 /lb. 6,129,962.28 Total Class IV Milk 9.78% 66,258,621 $ 9,654,111.30
Producer Milk 100.00% 677,722,172 $ 81,201,301.19 Adjustments
Overage and Other Source $2,517.09Inventory Adjustments $32,703.94Producer butterfat at uniform butterfat price ($28,315,157.61)Location Adjustments to Producers $4,344,503.461/2 Unobligated Balance in P.S.F $165,320.14
Adjusted Pool Value $ 8.79377 $57,431,188.21Reserve for Producer Settlement Fund $ 0.04377 $285,849.41
Uniform Skim Milk Price per cwt. (Fulton County, Georgia): $8.75
Uniform Price per cwt. (Fulton County, Georgia) $12.47** At 3.5% butterfat test; for information purposes.
OTHER FEDERAL ORDERS: CLASS I AND UNIFORM PRICES (At 3.5% Butterfat)MARKET NAME CLASS I %
(Priced at) MAR 2009 APR 2009 MAR 2009 MAR 2009Appalachian (Charlotte) $ 12.83 $ 13.76 $ 12.29 69.60%Arizona (Phoenix $ 11.78 $ 12.71 $ 10.63 32.00%Central (Kansas City) $ 11.43 $ 12.36 $ 10.44 35.10%Florida (Tampa) $ 14.83 $ 15.76 $ 14.19 83.89%Mideast (Cleveland) $ 11.43 $ 12.36 $ 10.73 40.80%Northeast (Boston) $ 12.68 $ 13.61 $ 11.56 43.10%Pacific Northwest (Seattle) $ 11.33 $ 12.26 $ 10.48 31.07%Southeast (Atlanta) $ 13.23 $ 14.16 $ 12.47 60.71%Southwest (Dallas) $ 12.43 $ 13.36 $ 11.45 53.61%Upper Midwest (Chicago) $ 11.23 $ 12.16 $ 10.57 14.10%
Page 2
F.O. 7 - SOUTHEAST: CALCULATION OF UNIFORM PRICES - MARCH 2009
Price per unit
CLASS I
$ 12.98
UNIFORM FEB 2009
$ 11.31$ 9.82
$ 13.22
$ 10.69$ 10.38$ 15.02$ 10.83$ 11.75$ 10.31

Receipts: March 2009 March 2008Producer Milk
Class I 411,466,987 398,125,806Class II 68,678,059 83,411,270Class III 131,318,505 82,832,840Class IV 66,258,621 49,998,844
Total Producer Milk 677,722,172 614,368,760Average Butterfat Test 3.63% 3.71%
Percent of Producer Milk in Class I 60.71% 64.80%Daily Average Receipts 21,862,006 19,818,347
Other Source MilkClass I 8,074,482 7,161,588Class II 3,078,782 13,484,873Class III 2,262,601 3,085,939Class IV 8,851,877 12,536,956
Total Other Source Milk 22,267,742 36,269,356Overage
Class I 0 0Class II 0 0Class III 2,158 0Class IV 0 140,440
Total Overage 2,158 140,440Opening Inventory
Class I 29,529,838 34,862,583Class II 1,210,562 1,495,280Class III 2,208,973 40,875Class IV 16,413,466 12,604,888
Total Opening Inventory 49,362,839 49,003,626Total Receipts 749,354,911 699,782,182
Utilization:Class I Utilization
Inventory of Packaged FMP 35,302,448 29,468,238Route Disposition Class I 399,868,499 399,376,463Shrinkage 2,989,095 3,407,912Transfers & Diversions to Nonpool 10,911,265 7,897,364
Total Class I Utilization 449,071,307 440,149,977Average Butterfat Test 2.01% 2.06%
Daily Average Utilization 14,486,171 14,198,386Class II Utilization
Nonfluid Used To Produce 1,454,555 2,162,722Shrinkage 487,925 341Transfers & Diversions to Nonpool/Commercial Foods 45,684,020 60,848,039Used To Produce/Other Uses 25,343,061 35,380,321
Total Class II Utilization 72,969,561 98,391,423Average Butterfat Test 9.15% 7.42%
Class III UtilizationShrinkage 0 0Transfers & Diversions to Nonpool 135,790,079 85,959,654Used To Produce/Other Uses 0 0
Total Class III Utilization 135,790,079 85,959,654Average Butterfat Test 3.88% 4.47%
Class IV UtilizationInventory 17,394,737 22,502,239Nonfluid Used To Fortify 1,817,604 1,222,178Shrinkage 7,677,954 6,241,423Transfers & Diversions to Nonpool 59,811,468 40,335,322Used To Produce/Other Uses 4,822,201 4,979,966
Total Class IV Utilization 91,523,964 75,281,128Average Butterfat Test 7.38% 8.32%
Total Utilization 749,354,911 699,782,182
SOUTHEAST MILK MARKETING AREA-FEDERAL ORDER 7STATISTICAL SUMMARY
Page 3

Page 4
Packaged Class I Route Sales in Marketing Area Product Description Pounds Percent
February 2009 Whole Milk 123,537,438 31.11%Fat Free Milk 46,737,018 11.77%Lowfat Milk (incl. 1%) 32,186,883 8.10%Reduced Fat Milk (incl. 2%) 142,665,584 35.92%Cultured Fluid Milk (incl. Buttermilk) 8,086,023 2.04%Flavored Drinks and Milk 43,941,864 11.06%Total Disposition in Marketing Area 397,154,810 100.00% Total Disposition by Pool Plants 320,884,495 80.80%Total Disposition by Nonpool Plants 76,270,315 19.20%Total Disposition in Marketing Area 397,154,810 100.00%
Southeast Market Summary The minimum order uniform price for payment to producers supplying the Southeast Order marketing
area during March 2009 is $12.47 per hundredweight for milk with a 3.5% butterfat test in Fulton County, Georgia. This is .965 times the uniform skim milk price of $8.75 per hundredweight plus 3.5 times the uniform butterfat price of $1.1495 per pound. Payment to producers may be reduced by location differentials, if applicable, and by properly authorized deductions.
Uniform prices are the result of marketwide pooling; all producer milk was classified and priced according to the milk's use. In March, Class I use, which is primarily bottled or packaged fluid milk, accounted for 61.72% of all producer skim milk (priced to handlers at $5.81 per hundredweight, plus the Class I differential, see page 2) and 33.81% of producer butterfat (priced to handlers at $1.098 per pound plus Class I differential). Class II use, which is milk used in fluid cream products and miscellaneous manufacturing, accounted for 9.62% of all producer skim milk ($6.51 per hundredweight) and 23.84% of producer butterfat ($1.1664 per pound). Class III use, mostly milk used to produce cheese, accounted for 19.32% of all producer skim milk ($6.61 per hundredweight) and 20.89% of producer butterfat ($1.1594 per pound). Class IV use, generally milk processed into butter and powder, accounted for 9.34% of all producer skim milk ($5.78 per hundredweight) and 21.46% of producer butterfat ($1.1594 per pound).
Receipts of producer milk during March 2009 totaled 677.7 million pounds. There were 26 regulated pool distributing plants, 3 pool supply plants and 11 cooperative associations submitting reports of receipts and utilization that were included in the computation of the uniform prices for March 2009. Class I route disposition in the area totaled 397.2 million pounds in February 2009.
Mailbox Milk Prices, January 2009 with Comparisons Reporting Area 1/ January 2008 December 2008 2008 Average January 2009 New England States 3/ $21.78 $16.18 $19.14 $14.95 Eastern Pennsylvania 4/ $21.30 $15.63 $18.60 $14.45 Appalachian States 5/ $22.21 $16.58 $20.12 $16.55 Southeast States 6/ $22.94 $17.39 $20.94 $17.05 Southern Missouri 7/ $21.15 $15.54 $18.84 $14.98 Florida $23.87 $18.61 $22.50 $18.39 Western Pennsylvania 8/ $21.14 $15.92 $18.75 $14.37 Indiana $21.23 $15.83 $18.77 $14.86 Wisconsin $20.79 $16.63 $18.63 $12.94 Corn Belt States 9/ $19.97 $15.20 $17.78 $13.61 Western Texas 10/ $19.53 $14.45 $17.20 $12.98 Northwest States 11/ $19.59 $14.55 $17.25 $12.75 All Federal Orders 12/ $20.70 $16.12 $18.41 $13.77 California 13/ $17.97 $12.83 $16.17 $10.57
Source: Dairy Market News; 1/ Information is shown for those areas for which prices are reported for at least 75% of the milk marketed under Federal milk orders. 2/ Net pay price received by dairy farmers for milk. 3/ Includes Connecticut, Maine, Massachusetts, New Hampshire, Rhode Island, and Vermont. 4/ All the counties to the east of those listed in 8/. 5/ Includes Kentucky, North Carolina, South Carolina, Tennessee, and Virginia. 6/ Includes Alabama, Arkansas, Georgia, Louisiana, and Mississippi. 7/ The counties of Vernon, Cedar, Polk, Dallas, Laclede, Texas, Dent, Crawford, Washington, St. Francois, and Perry and all those to the south of these. 8/ The counties of Warren, Elk, Clearfield, Indiana, Westmoreland, and Fayette, and all those to the west of these. 9/ Includes Kansas, Nebraska and the Missouri counties to the north of those listed in 7/. 10/ All counties to the west of Fanin, Hunt, Van Zandt, Henderson, Anderson, Houston, Cherokee, Nacogdoches, and Shelby. 11/ Includes Oregon and Washington. 12/ Weighted average of the information for all selected reporting areas in Federal milk orders. 13/ Calculated by California Department of Food and Agriculture.

FEDERAL ORDER 7 - SOUTHEAST: CLASS AND UNIFORM PRICESPool CLASS I* CLASS II CLASS III CLASS IV UNIFORM*
Period Skim/cwt Bfat/lb @ 3.5 Skim/cwt Bfat/lb @ 3.5 Skim/cwt Bfat/lb @ 3.5 Skim/cwt Bfat/lb @ 3.5 Skim/cwt Bfat/lb @ 3.5Jan 2008 $19.63 $1.4643 $24.07 $15.61 $1.3389 $19.75 $15.19 $1.3319 $19.32 $ 12.05 $1.3319 $16.29 $ 18.26 $1.3813 $22.46Feb $18.54 $1.3970 $22.78 $14.39 $1.3080 $18.46 $12.93 $1.3010 $17.03 $ 10.48 $1.3010 $14.67 $ 16.81 $1.3355 $20.90Mar $15.64 $1.3448 $19.80 $11.24 $1.3674 $15.63 $13.72 $1.3604 $18.00 $ 9.75 $1.3604 $14.17 $ 14.55 $1.3561 $18.79Apr $17.49 $1.3793 $21.71 $10.47 $1.4818 $15.29 $12.02 $1.4748 $16.76 $ 9.74 $1.4748 $14.56 $ 15.46 $1.4418 $19.97May $15.70 $1.5043 $20.42 $10.40 $1.5632 $15.51 $13.20 $1.5562 $18.18 $ 10.17 $1.5562 $15.26 $ 14.74 $1.5368 $19.60June $16.97 $1.6005 $21.98 $10.89 $1.6230 $16.19 $15.12 $1.6160 $20.25 $ 10.64 $1.6160 $15.92 $ 15.72 $1.6095 $20.80July $19.50 $1.6466 $24.58 $11.31 $1.6844 $16.81 $12.82 $1.6774 $18.24 $ 11.12 $1.6774 $16.60 $ 17.46 $1.6650 $22.68Aug $16.85 $1.7184 $22.27 $11.74 $1.7483 $17.45 $11.63 $1.7413 $17.32 $ 10.93 $1.7413 $16.64 $ 15.74 $1.7316 $21.25Sep $15.78 $1.7791 $21.45 $11.59 $1.8266 $17.58 $10.27 $1.8196 $16.28 $ 9.41 $1.8196 $15.45 $ 14.84 $1.8024 $20.63Oct $13.56 $1.7831 $19.33 $10.46 $1.8577 $16.60 $10.97 $1.8507 $17.06 $ 7.40 $1.8507 $13.62 $ 13.03 $1.8230 $18.95Nov $15.09 $1.8768 $21.13 $8.52 $1.7800 $14.45 $9.64 $1.7730 $15.51 $ 6.26 $1.7730 $12.25 $ 13.33 $1.8125 $19.21Dec $13.29 $1.8305 $19.23 $6.88 $1.3068 $11.21 $11.12 $1.2998 $15.28 $ 6.01 $1.2998 $10.35 $ 12.01 $1.5024 $16.85Jan 2009 $15.04 $1.4363 $19.54 $6.74 $1.1154 $10.41 $7.15 $1.1084 $10.78 $ 5.92 $1.1084 $9.59 $ 12.77 $1.2288 $16.62Feb $10.87 $1.1520 $14.52 $6.63 $1.1011 $10.25 $5.68 $1.0941 $9.31 $ 5.82 $1.0941 $9.45 $ 9.65 $1.1155 $13.22Mar $9.61 $1.1298 $13.23 $6.51 $1.1664 $10.36 $6.61 $1.1594 $10.44 $ 5.78 $1.1594 $9.64 $8.75 $1.1495 $12.47Apr $10.36 $1.1880 $14.16 $6.47
Pool CLASS I CLASS II CLASS III CLASS IVPeriod 1000 lbs. % 1000 lbs. % 1000 lbs. % 1000 lbs. %
Jan 2008 427,443 66.56% 54,698 8.52% 109,863 17.11% 50,144 7.81%Feb 389,276 64.22% 69,259 11.43% 94,584 15.61% 52,992 8.74%Mar 398,126 64.80% 83,411 13.58% 82,833 13.48% 49,999 8.14%Apr 388,115 63.76% 81,108 13.33% 100,604 16.53% 38,804 6.38%May 386,639 64.74% 79,323 13.28% 96,547 16.17% 34,668 5.81%June 346,682 70.25% 71,361 14.46% 27,363 5.54% 48,094 9.75%July 365,692 67.73% 64,438 11.94% 68,086 12.61% 41,668 7.72%Aug 398,922 72.09% 57,441 10.38% 51,033 9.22% 45,981 8.31%Sep 400,017 74.55% 52,644 9.81% 61,540 11.47% 22,397 4.17%Oct 414,863 73.62% 58,955 10.46% 64,708 11.48% 25,002 4.44%Nov 381,264 67.96% 59,573 10.62% 63,744 11.36% 56,464 10.06%Dec 404,358 66.68% 53,632 8.84% 75,350 12.42% 73,126 12.06%Jan 2009 413,503 68.14% 58,107 9.57% 73,691 12.14% 61,575 10.15%Feb 370,916 67.93% 57,125 10.46% 97,875 17.93% 20,079 3.68%Mar 411,467 60.71% 68,678 10.13% 131,319 19.38% 66,259 9.78%
642,148 3,068
614,369
536,598
FEDERAL ORDER 7 - SOUTHEAST: POOLED RECEIPTS AND UTILIZATION OF PRODUCER MILKProducer Milk
1000 lbs. FarmsNumber of
* Class I and uniform prices are at Fulton County (Atlanta), Georgia;** Estimated
2,948606,111 2,989
608,631 2,943
539,885
597,176 2,956
553,377
606,876 2,914
2,9052,933
563,528
606,466 2,974561,045 2,906
3,073
493,500 2,6662,936
677,722 2,900**545,996 2,878
Class I Utilization
60%
62%
64%
66%
68%
70%
Mar-08 Feb-09Mar-09
Page 5

** The base rate for making partial payments in Fulton County, GA for April will be $11.22 per hundredweight. This is 90 percent of the preceding month’s uniform price of $12.47 per hundredweight.
Producer Touch Base Requirements & Handler Diversion Limits [per Order Amendment issued March 17, 2008]
Jan Feb Mar Apr May Jun Jul Aug Sep Oct Nov Dec Producer Touch Base Days 1 1 1 1 1 1 1 1 1 1 1 1 Diversion Percentage Limits 25% 25% 35% 35% 35% 35% 25% 25% 25% 25% 25% 35%
WASDE Dairy Report 1/ WASDE - 469 April 9, 2009 Milk production forecasts for 2009 are lowered from last month. Cow numbers for 2009 are forecast lower, as producers are expected to liquidate herds in response to poor returns. The recently announced Cooperatives Working Together (CWT) herd buyout is expected to encourage a more rapid reduction in cow numbers by encouraging producers to reduce herds. Milk per cow growth is slowed from last month reflecting poor returns. Import forecasts are unchanged from last month, but commercial exports are lowered due to reduced butter exports. CCC net removals are reduced as strengthening prices through the year will result in lower sales of dairy products to the CCC. Milk price estimates for 2009 are raised. Forecasts for all dairy products are up from last month. Reductions in milk supplies are expected to support product prices. As a result of higher product prices, the Class III and Class IV price forecasts are raised from last month. The all milk price is also forecast higher this month at $11.85 to $12.35 per cwt.
1/ The World Agricultural Supply and Demand Estimates (WASDE) report provides USDA's comprehensive forecasts of supply and demand for major U.S. and global crops and U.S. livestock, including dairy. The most recent WASDE report is available at www.usda.gov/oce/commodity/wasde/index.htm.
Southeast Marketing Area - Federal Order 7 Pool and Payment Dates for the Pooling Periods
April through June 2009 MA Payment Dates Payments for Producer Milk
Due to: Due From: Partial Payment** Due Final Payment Due Pool Month
Pool & Uniform Price Release
Date All Funds P/S & T-Credit Coop Nonmember Coop Nonmember
APR 2009 05/11/09 05/12/09 05/13/09 04/27/09 04/27/09 05/13/09 05/14/09 MAY 2009 06/11/09 06/12/09 06/15/09 05/26/09 05/26/09 06/15/09 06/16/09 JUN 2009 07/11/09 07/13/09 07/14/09 06/25/09 06/26/09 07/14/09 07/15/09
"The U.S. Department of Agriculture (USDA) prohibits discrimination in all its programs and activities on the basis of race, color, national origin, age, disability, and where applicable, sex, marital status, familial status, parental status, religion, sexual orientation, genetic information, political beliefs, reprisal, or because all or a part of an individual's income is derived from any public assistance program. (Not all prohibited bases apply to all programs.) Persons with disabilities who require alternative means for communication of program information (Braille, large print, audiotape, etc.) should contact USDA's TARGET Center at (202) 720-2600 (voice and TDD). To file a complaint of discrimination write to USDA, Director, Office of Civil Rights, 1400 Independence Avenue, S.W., Washington, D.C. 20250-9410 or call (800) 795-3272 (voice) or (202) 720-6382 (TDD). USDA is an equal opportunity provider and employer."
MILK MARKET ADMINISTRATORU.S. Department Of Agriculture 1550 North Brown Road, Suite 120Lawrenceville, Georgia 30043
www.fmmatlanta.com

April Uniform Price Up The uniform price in Fulton County, GA,
was $13.14 per hundredweight of milk at 3.5 percent butterfat for the month of April. The uniform price is $0.67 higher than the previous month but is $6.83 per hundredweight lower compared with April of last year.
Class I utilization was 61.02 percent in April, an increase of 0.31 percent compared with the previous month and a decrease of 2.74 percent compared with April of last year.
National Dairy Situation The USDA estimates that the total U.S.
production of milk in March was 16.4 billion pounds, a decrease of 0.3 percent from March 2008 and an increase of 0.5 percent when compared with February 2009 on a daily aver-age basis. Total cheese output (excluding cot-tage cheese) was 871 million pounds, 4.3 per-cent higher than March 2008 and 2.3 percent above February 2009 on a daily average ba-sis. Butter production was 145 million pounds, 4.4 percent less than March 2008 and a de-cline of 9.7 percent compared with February 2009 on a daily average basis.
Nonfat dry milk powder production was 136 million pounds in March, a slight increase compared with March 2008 and a slight de-crease compared to February 2009 on a daily average basis. Dry whey production was 92.3 million pounds in March, a decrease of 5.7 percent compared with March of last year and 0.8 percent higher than last month on a daily average basis.
The milk-feed price ratio, the pounds of 16 percent mixed dairy feed equal in value to one pound of whole milk, was 1.59 in April 2009, up 0.02 points from March’s revised ratio.
Market Information BULLETIN
ISSUED FOR THE INFORMATION OF PRODUCERS WHO ARE NOT MEMBERS OF COOPERATIVE ASSOCIATIONS
Sue L. Mosley, Market Administrator
www.fmmatlanta.com
Southeast Marketing Area Federal Order 7
Volume 10—No. 5 May 2009
Comparing Retail and Producer Milk Prices Producer milk prices have dramatically declined
over the past six months. Historically, declines in producer milk prices do eventually result in lower prices to consumers, though other segments of the marketing chain tend to pass along price reductions more slowly than price increases. Have retail milk prices fallen at the same rate as producer milk prices? Examining two different retail price surveys, one conducted by the U.S. Department of Agricul-ture (USDA) and one conducted by the U.S. Depart-ment of Labor (DOL) suggests the answer is no. The Class I ’mover’, that is to say the Federal Order fluid milk price without location adjustments, has fallen 50.6% since January 2008. The retail price of whole milk has fallen 8.3% in New Orleans, LA, 23.3% in Miami, FL and 26.8% in Atlanta, GA ac-cording to the USDA survey. The DOL’s more com-prehensive survey (the consumer price index or ‘CPI Milk: Southern Cities’ in chart below) shows a 19.7% decline in retail milk prices. Page four of this Bulletin has a more detailed depiction of these price series.
Changes in Retail and Producer Milk Price: January 2008 to April 2009
Price Series Jan-08 Apr-09 % Chg
Retail Price:Atlanta,GA $4.26 $3.12 -26.8%
Retail Price:Miami, Fl $4.29 $3.29 -23.3%
Retail Price:New Orleans, LA $4.35 $3.99 -8.3%
CPI Milk: Southern Cities $4.22 $3.39* -19.7%
Class I Price 'Mover' $20.97 $10.36 -50.6% *March 2009 price, April not available at time of publication.

Calculation of Uniform Butterfat Price:Utilization Pounds Price/lb. Value
Class I Butterfat 34.46% 8,018,035 $1.1500 $ 9,220,740.25 Class I Differential at Location 267,142.04 Class II Butterfat 24.82% 5,775,154 $1.2119 6,998,909.15 Class III Butterfat 20.66% 4,806,785 $1.2049 5,791,695.23 Class IV Butterfat 20.06% 4,667,051 $1.2049 5,623,329.71
Total Butterfat 100.00% 23,267,025 $ 27,901,816.38
Uniform Butterfat Price per lb. (Fulton County, Georgia): $1.1992
Calculation of Uniform Skim Milk PriceProducer Milk Utilization Pounds ValueClass I Skim Milk 62.01% 385,651,221 $6.56 /cwt. $ 25,298,720.11 Class I Butterfat 34.46% 8,018,035 $1.1500 /lb. 9,220,740.25 Class I Differential at Location 393,669,256 13,181,903.19 Total Class I Milk 61.02% 393,669,256 $ 47,701,363.55 Class II Skim Milk 9.09% 56,512,869 $6.47 /cwt. $ 3,656,382.63 Class II Butterfat 24.82% 5,775,154 $1.2119 /lb. 6,998,909.15 Total Class II Milk 9.65% 62,288,023 $ 10,655,291.78 Class III Skim Milk 18.96% 117,934,283 $6.80 /cwt. $ 8,019,531.24 Class III Butterfat 20.66% 4,806,785 $1.2049 /lb. 5,791,695.23 Total Class III Milk 19.02% 122,741,068 $ 13,811,226.47 Class IV Skim Milk 9.94% 61,831,214 $5.81 /cwt. $ 3,592,393.54 Class IV Butterfat 20.06% 4,667,051 $1.2049 /lb. 5,623,329.71 Total Class IV Milk 10.31% 66,498,265 $ 9,215,723.25
Producer Milk 100.00% 645,196,612 $ 81,383,605.05 Adjustments
Overage and Other Source $0.00Inventory Adjustments $78,090.77Producer butterfat at uniform butterfat price ($27,901,816.38)Location Adjustments to Producers $4,118,119.551/2 Unobligated Balance in P.S.F $277,527.16
Adjusted Pool Value $ 9.31866 $57,955,526.15Reserve for Producer Settlement Fund $ 0.04866 $302,653.45
Uniform Skim Milk Price per cwt. (Fulton County, Georgia): $9.27
Uniform Price per cwt. (Fulton County, Georgia) $13.14** At 3.5% butterfat test; for information purposes.
OTHER FEDERAL ORDERS: CLASS I AND UNIFORM PRICES (At 3.5% Butterfat)MARKET NAME CLASS I %
(Priced at) APR 2009 MAY 2009 APR 2009 APR 2009Appalachian (Charlotte) $ 13.76 $ 14.37 $ 12.97 68.05%Arizona (Phoenix $ 12.71 $ 13.32 $ 11.06 32.28%Central (Kansas City) $ 12.36 $ 12.97 $ 10.91 31.56%Florida (Tampa) $ 15.76 $ 16.37 $ 15.11 85.80%Mideast (Cleveland) $ 12.36 $ 12.97 $ 11.28 39.60%Northeast (Boston) $ 13.61 $ 14.22 $ 12.08 41.70%Pacific Northwest (Seattle) $ 12.26 $ 12.87 $ 11.01 33.08%Southeast (Atlanta) $ 14.16 $ 14.77 $ 13.14 61.02%Southwest (Dallas) $ 13.36 $ 13.97 $ 11.89 34.94%Upper Midwest (Chicago) $ 12.16 $ 12.77 $ 10.98 13.30%
$ 12.47
$ 10.63$ 10.44$ 14.19$ 10.73$ 11.56$ 10.48
Page 2
F.O. 7 - SOUTHEAST: CALCULATION OF UNIFORM PRICES - APRIL 2009
Price per unit
CLASS I
$ 12.29
UNIFORM MAR 2009
$ 11.45$ 10.57

Receipts: April 2009 April 2008Producer Milk
Class I 393,669,256 388,115,181Class II 62,288,023 81,107,576Class III 122,741,068 100,604,041Class IV 66,498,265 38,804,061
Total Producer Milk 645,196,612 608,630,859Average Butterfat Test 3.61% 3.62%
Percent of Producer Milk in Class I 61.02% 63.76%Daily Average Receipts 21,506,554 20,287,695
Other Source MilkClass I 7,341,349 6,344,256Class II 3,513,264 14,906,860Class III 2,253,667 2,524,562Class IV 11,093,124 9,588,709
Total Other Source Milk 24,201,404 33,364,387Overage
Class I 0 0Class II 0 26,334Class III 0 0Class IV 0 6,785
Total Overage 0 33,119Opening Inventory
Class I 35,640,331 32,019,591Class II 2,537,761 2,975,177Class III 3,009,888 380,875Class IV 11,509,205 18,114,621
Total Opening Inventory 52,697,185 53,490,264Total Receipts 722,095,201 695,518,629
Utilization:Class I Utilization
Inventory of Packaged FMP 34,970,235 31,691,919Route Disposition Class I 389,639,977 384,285,318Shrinkage 2,573,592 2,632,904Transfers & Diversions to Nonpool 9,467,132 7,868,887
Total Class I Utilization 436,650,936 426,479,028Average Butterfat Test 2.02% 2.04%
Daily Average Utilization 14,555,031 14,215,968Class II Utilization
Nonfluid Used To Produce 1,747,900 1,753,781Shrinkage 317,963 54,382Transfers & Diversions to Nonpool/Commercial Foods 42,174,336 59,961,930Used To Produce/Other Uses 24,098,849 37,245,854
Total Class II Utilization 68,339,048 99,015,947Average Butterfat Test 9.96% 7.50%
Class III UtilizationShrinkage 0 0Transfers & Diversions to Nonpool 128,004,623 103,509,478Used To Produce/Other Uses 0 0
Total Class III Utilization 128,004,623 103,509,478Average Butterfat Test 3.82% 4.12%
Class IV UtilizationInventory 18,031,020 23,561,350Nonfluid Used To Fortify 1,620,957 1,272,229Shrinkage 7,829,670 6,521,945Transfers & Diversions to Nonpool 56,961,908 30,134,423Used To Produce/Other Uses 4,657,039 5,024,229
Total Class IV Utilization 89,100,594 66,514,176Average Butterfat Test 6.71% 8.21%
Total Utilization 722,095,201 695,518,629
SOUTHEAST MILK MARKETING AREA-FEDERAL ORDER 7STATISTICAL SUMMARY
Page 3

Page 4
Packaged Class I Route Sales in Marketing Area Product Description Pounds Percent
March 2009 Whole Milk 137,395,849 31.39%Fat Free Milk 50,906,682 11.63%Lowfat Milk (incl. 1%) 35,737,072 8.16%Reduced Fat Milk (incl. 2%) 157,599,587 36.00%Cultured Fluid Milk (incl. Buttermilk) 8,411,933 1.92%Flavored Drinks and Milk 47,703,922 10.90%Total Disposition in Marketing Area 437,755,045 100.00% Total Disposition by Pool Plants 350,177,837 79.99%Total Disposition by Nonpool Plants 87,577,208 20.01%Total Disposition in Marketing Area 437,755,045 100.00%
$1.43
$0.92
$1.80
$0.81
$1.35$1.33
$1.79
Atlanta,GA$3.12
Miami,Fl$4.29
New Orleans,LA
$4.35 $4.42
$4.22$3.39
$0.50
$1.50
$2.50
$3.50
$4.50
$5.50
Jan-08 Feb Mar Apr May Jun Jul Aug Sep Oct Nov Dec Jan-09 Feb Mar
Class I Price Per GallonUSDA Survey Price:Atlanta,GAUSDA Survey Price:Miami,FlUSDA Survey Price:New Orleans,LACPI Southern Cities Avg Milk Price
Source: USDA, AMS, Dairy Programs; Department of Labor, BLS
Note: The chart above is meant to show changes in milk prices over time, not necessarily their absolute values. The bars “Class I Price Per Gallon”, also known as ‘’the mover” show how Federal Order fluid milk prices have fared since January 2008 and are valid representations of price changes for all locations. While Class I price differentials increases in May 2008 (+$0.06/gal in Atlanta, +$0.02 in New Orleans and +$0.15/gal in Miami) are not shown, including differentials would not significantly alter the trends revealed.
Southeast Market Summary The minimum order uniform price for payment to producers supplying the Southeast Order marketing
area during April 2009 is $13.14 per hundredweight for milk with a 3.5% butterfat test in Fulton County, Georgia. This is .965 times the uniform skim milk price of $9.27 per hundredweight plus 3.5 times the uniform butterfat price of $1.1992 per pound. Payment to producers may be reduced by location differentials, if applicable, and by properly authorized deductions.
Uniform prices are the result of marketwide pooling; all producer milk was classified and priced according to the milk's use. In April, Class I use, which is primarily bottled or packaged fluid milk, accounted for 62.01% of all producer skim milk (priced to handlers at $6.56 per hundredweight, plus the Class I differential, see page 2) and 34.46% of producer butterfat (priced to handlers at $1.1500 per pound plus Class I differential). Class II use, which is milk used in fluid cream products and miscellaneous manufacturing, accounted for 9.09% of all producer skim milk ($6.47 per hundredweight) and 24.82% of producer butterfat ($1.2119 per pound). Class III use, mostly milk used to produce cheese, accounted for 18.96% of all producer skim milk ($6.80 per hundredweight) and 20.66% of producer butterfat ($1.2049 per pound). Class IV use, generally milk processed into butter and powder, accounted for 9.94% of all producer skim milk ($5.81 per hundredweight) and 20.06% of producer butterfat ($1.2049 per pound).
Receipts of producer milk during April 2009 totaled 645.2 million pounds. There were 26 regulated pool distributing plants, 3 pool supply plants and 11 cooperative associations submitting reports of receipts and utilization that were included in the computation of the uniform prices for April 2009. Class I route disposition in the area was 437.8 million pounds in March 2009.
Retail Whole Milk and Federal Order Class I Prices: 2008 to March 2009

FEDERAL ORDER 7 - SOUTHEAST: CLASS AND UNIFORM PRICESPool CLASS I* CLASS II CLASS III CLASS IV UNIFORM*
Period Skim/cwt Bfat/lb @ 3.5 Skim/cwt Bfat/lb @ 3.5 Skim/cwt Bfat/lb @ 3.5 Skim/cwt Bfat/lb @ 3.5 Skim/cwt Bfat/lb @ 3.5Jan 2008 $19.63 $1.4643 $24.07 $15.61 $1.3389 $19.75 $15.19 $1.3319 $19.32 $ 12.05 $1.3319 $16.29 $ 18.26 $1.3813 $22.46Feb $18.54 $1.3970 $22.78 $14.39 $1.3080 $18.46 $12.93 $1.3010 $17.03 $ 10.48 $1.3010 $14.67 $ 16.81 $1.3355 $20.90Mar $15.64 $1.3448 $19.80 $11.24 $1.3674 $15.63 $13.72 $1.3604 $18.00 $ 9.75 $1.3604 $14.17 $ 14.55 $1.3561 $18.79Apr $17.49 $1.3793 $21.71 $10.47 $1.4818 $15.29 $12.02 $1.4748 $16.76 $ 9.74 $1.4748 $14.56 $ 15.46 $1.4418 $19.97May $15.70 $1.5043 $20.42 $10.40 $1.5632 $15.51 $13.20 $1.5562 $18.18 $ 10.17 $1.5562 $15.26 $ 14.74 $1.5368 $19.60June $16.97 $1.6005 $21.98 $10.89 $1.6230 $16.19 $15.12 $1.6160 $20.25 $ 10.64 $1.6160 $15.92 $ 15.72 $1.6095 $20.80July $19.50 $1.6466 $24.58 $11.31 $1.6844 $16.81 $12.82 $1.6774 $18.24 $ 11.12 $1.6774 $16.60 $ 17.46 $1.6650 $22.68Aug $16.85 $1.7184 $22.27 $11.74 $1.7483 $17.45 $11.63 $1.7413 $17.32 $ 10.93 $1.7413 $16.64 $ 15.74 $1.7316 $21.25Sep $15.78 $1.7791 $21.45 $11.59 $1.8266 $17.58 $10.27 $1.8196 $16.28 $ 9.41 $1.8196 $15.45 $ 14.84 $1.8024 $20.63Oct $13.56 $1.7831 $19.33 $10.46 $1.8577 $16.60 $10.97 $1.8507 $17.06 $ 7.40 $1.8507 $13.62 $ 13.03 $1.8230 $18.95Nov $15.09 $1.8768 $21.13 $8.52 $1.7800 $14.45 $9.64 $1.7730 $15.51 $ 6.26 $1.7730 $12.25 $ 13.33 $1.8125 $19.21Dec $13.29 $1.8305 $19.23 $6.88 $1.3068 $11.21 $11.12 $1.2998 $15.28 $ 6.01 $1.2998 $10.35 $ 12.01 $1.5024 $16.85Jan 2009 $15.04 $1.4363 $19.54 $6.74 $1.1154 $10.41 $7.15 $1.1084 $10.78 $ 5.92 $1.1084 $9.59 $ 12.77 $1.2288 $16.62Feb $10.87 $1.1520 $14.52 $6.63 $1.1011 $10.25 $5.68 $1.0941 $9.31 $ 5.82 $1.0941 $9.45 $ 9.65 $1.1155 $13.22Mar $9.61 $1.1298 $13.23 $6.51 $1.1664 $10.36 $6.61 $1.1594 $10.44 $ 5.78 $1.1594 $9.64 $8.75 $1.1495 $12.47Apr $10.36 $1.1880 $14.16 $6.47 $1.2119 $10.49 $6.80 $1.2049 $10.78 $ 5.81 $1.2049 $9.82 $ 9.27 $1.1992 $13.14May $10.81 $1.2399 $14.77 $6.49
Pool CLASS I CLASS II CLASS III CLASS IVPeriod 1000 lbs. % 1000 lbs. % 1000 lbs. % 1000 lbs. %
Jan 2008 427,443 66.56% 54,698 8.52% 109,863 17.11% 50,144 7.81%Feb 389,276 64.22% 69,259 11.43% 94,584 15.61% 52,992 8.74%Mar 398,126 64.80% 83,411 13.58% 82,833 13.48% 49,999 8.14%Apr 388,115 63.76% 81,108 13.33% 100,604 16.53% 38,804 6.38%May 386,639 64.74% 79,323 13.28% 96,547 16.17% 34,668 5.81%June 346,682 70.25% 71,361 14.46% 27,363 5.54% 48,094 9.75%July 365,692 67.73% 64,438 11.94% 68,086 12.61% 41,668 7.72%Aug 398,922 72.09% 57,441 10.38% 51,033 9.22% 45,981 8.31%Sep 400,017 74.55% 52,644 9.81% 61,540 11.47% 22,397 4.17%Oct 414,863 73.62% 58,955 10.46% 64,708 11.48% 25,002 4.44%Nov 381,264 67.96% 59,573 10.62% 63,744 11.36% 56,464 10.06%Dec 404,358 66.68% 53,632 8.84% 75,350 12.42% 73,126 12.06%Jan 2009 413,503 68.14% 58,107 9.57% 73,691 12.14% 61,575 10.15%Feb 370,916 67.93% 57,125 10.46% 97,875 17.93% 20,079 3.68%Mar 411,467 60.71% 68,678 10.13% 131,319 19.38% 66,259 9.78%Apr 393,669 61.02% 62,288 9.65% 122,741 19.02% 66,498 10.31%645,197 2,900**
642,148 3,068
614,369
536,598
606,876 2,914
2,9052,933
FEDERAL ORDER 7 - SOUTHEAST: POOLED RECEIPTS AND UTILIZATION OF PRODUCER MILKProducer Milk
1000 lbs. FarmsNumber of
2,948606,111 2,989
608,631 2,943
539,885
597,176 2,956
553,377
563,528
606,466 2,974561,045 2,906
3,073
493,500 2,6662,936
677,722 2,910545,996 2,878
Class I Utilization
56%
58%
60%
62%
64%
Apr-08 Mar-09Apr-09
Page 5

** The base rate for making partial payments in Fulton County, GA for April will be $11.83 per hundredweight. This is 90 percent of the preceding month’s uniform price of $13.14 per hundredweight.
Producer Touch Base Requirements & Handler Diversion Limits [per Order Amendment issued March 17, 2008]
Jan Feb Mar Apr May Jun Jul Aug Sep Oct Nov Dec Producer Touch Base Days 1 1 1 1 1 1 1 1 1 1 1 1 Diversion Percentage Limits 25% 25% 35% 35% 35% 35% 25% 25% 25% 25% 25% 35%
WASDE Dairy Report 1/ WASDE - 470 May 12, 2009 Milk production is forecast to decline in 2010 as the sector responds to weak 2009 returns. Cow numbers are forecast to decline from 2009 although the pace of decline will slacken during the year as returns improve. Growth in milk per cow is expected to improve slightly in 2010. Commercial exports are forecast to increase as the global economy improves. Domestic disappearance of fat and skim solids reflect tightening supplies and improved exports. Product prices are forecast higher as demand improves and supplies tighten. With firmer cheese and whey prices, the Class III price is forecast to rise above 2009. Likewise, stronger butter and nonfat dry milk (NDM) prices will push Class IV prices above 2009. The 2010 all milk price is forecast at $14.70 to $15.70 per cwt. Forecast milk supply for 2009 is lowered slightly from last month primarily reflecting weaker expected growth in milk per cow. Cheese prices are lowered but butter and whey price forecasts are raised. The NDM price forecast is unchanged. The Class III price forecast is lowered slightly as the weaker cheese prices more than offsets the higher whey price. The Class IV price forecast is unchanged. The milk price is forecast to average $11.85 to $12.35 per cwt.
1/ The World Agricultural Supply and Demand Estimates (WASDE) report provides USDA's comprehensive forecasts of supply and demand for major U.S. and global crops and U.S. livestock, including dairy. The most recent WASDE report is available at www.usda.gov/oce/commodity/wasde/index.htm.
Southeast Marketing Area - Federal Order 7 Pool and Payment Dates for the Pooling Periods
May through July 2009 MA Payment Dates Payments for Producer Milk
Due to: Due From: Partial Payment** Due Final Payment Due Pool Month
Pool & Uniform Price Release
Date All Funds P/S & T-Credit Coop Nonmember Coop Nonmember
MAY 2009 06/11/09 06/12/09 06/15/09 05/26/09 05/26/09 06/15/09 06/16/09 JUN 2009 07/11/09 07/13/09 07/14/09 06/25/09 06/26/09 07/14/09 07/15/09 JUL 2009 08/11/09 08/12/09 08/13/09 07/27/09 07/27/09 08/13/09 08/14/09
"The U.S. Department of Agriculture (USDA) prohibits discrimination in all its programs and activities on the basis of race, color, national origin, age, disability, and where applicable, sex, marital status, familial status, parental status, religion, sexual orientation, genetic information, political beliefs, reprisal, or because all or a part of an individual's income is derived from any public assistance program. (Not all prohibited bases apply to all programs.) Persons with disabilities who require alternative means for communication of program information (Braille, large print, audiotape, etc.) should contact USDA's TARGET Center at (202) 720-2600 (voice and TDD). To file a complaint of discrimination write to USDA, Director, Office of Civil Rights, 1400 Independence Avenue, S.W., Washington, D.C. 20250-9410 or call (800) 795-3272 (voice) or (202) 720-6382 (TDD). USDA is an equal opportunity provider and employer."
MILK MARKET ADMINISTRATORU.S. Department Of Agriculture 1550 North Brown Road, Suite 120Lawrenceville, Georgia 30043
www.fmmatlanta.com

Uniform Price Rises The uniform price in Fulton County, GA,
was $13.21 per hundredweight of milk at 3.5 percent butterfat for the month of May. The uniform price is $0.07 higher than the previous month but is $6.39 per hundredweight lower compared with May of last year.
Class I utilization was 57.18 percent in May, a decrease of 3.84 percent compared with the previous month and a decrease of 7.56 percent compared with May of last year.
National Dairy Situation The USDA estimates that the total U.S.
production of milk in April was 16.1 billion pounds, a decrease of 0.1 percent from April 2008 and an increase of 1.1 percent when compared with March 2009 on a daily average basis. Total cheese output (excluding cottage cheese) was 846 million pounds, 3.2 percent above April 2008 and 0.4 percent higher than March 2009 on a daily average basis. Butter production was 144 million pounds, 3.9 per-cent below April 2008 and 1.1 percent above March 2009 on a daily average basis.
Nonfat dry milk powder production was 139 million pounds in April, a 3.1 percent in-crease compared with April 2008 and a 6.2 percent increase compared to March 2009 on a daily average basis. Dry whey production was 92.8 million pounds in April, a decrease of 6.0 percent compared with April of last year and 3.9 percent higher than the previous month on a daily average basis.
The milk-feed price ratio, the pounds of 16 percent mixed dairy feed equal in value to one pound of whole milk, was 1.47 in May 2009, down 0.11 points from April’s revised ratio based on lower milk and higher feed prices.
Market Information BULLETIN
ISSUED FOR THE INFORMATION OF PRODUCERS WHO ARE NOT MEMBERS OF COOPERATIVE ASSOCIATIONS
Sue L. Mosley, Market Administrator
www.fmmatlanta.com
Southeast Marketing Area Federal Order 7
Volume 10—No. 6 June 2009
Update on Marketing Services Federal regulations of the Southeast and Florida
Orders include a provision that authorizes a deduc-tion from producers for marketing services. These funds pay for the Market Administrator to provide, along with market information and other services, a milk sample and test verification program on behalf of producers who are not cooperative members and cooperative members who are not receiving such services from a cooperative association.
The Market Administrator has an established testing regime for nonmember farm bulk milk tank samples. These samples are tested for butterfat for payment consideration, as well as protein, solids-non-fat, and somatic cells. A final test which deter-mines the freezing point of the sample can indicate contamination or adulteration. Additionally, bulk milk tanks for nonmember producers are checked for proper calibration as resources permit. These and other monitoring steps, including sending raw milk control samples to industry testing laboratories, are performed to assure accuracy in market reporting and producer payments.
In May 2009, the Market Administrator handled samples from 594 producers and ran a total of 6,286 various tests on those samples. If interested, pro-ducers may view the results of any of their Market Administrator tests online at www.fmmatlanta.com under the ‘Laboratory and Test Results’ link.
Proposed Rules on Promotion and Imports The USDA has published a proposed rule
amending the National Dairy Promotion and Re-search Order. The proposed rule would establish a dairy import assessment program as required by the Farm Security and Rural Investment Act of 2002 (2002 Farm Bill) and the Food, Conservation, and Energy Act of 2008 (2008 Farm Bill).
The proposed rule would (continued on page 4)

Calculation of Uniform Butterfat Price:Utilization Pounds Price/lb. Value
Class I Butterfat 33.19% 7,821,090 $1.2019 $ 9,400,168.09 Class I Differential at Location 262,547.19 Class II Butterfat 23.33% 5,498,732 $1.2718 6,993,287.38 Class III Butterfat 23.02% 5,426,186 $1.2648 6,863,040.03 Class IV Butterfat 20.46% 4,822,909 $1.2648 6,100,015.30
Total Butterfat 100.00% 23,568,917 $ 29,619,057.99
Uniform Butterfat Price per lb. (Fulton County, Georgia): $1.2567
Calculation of Uniform Skim Milk PriceProducer Milk Utilization Pounds ValueClass I Skim Milk 58.07% 371,463,169 $7.01 /cwt. $ 26,039,568.15 Class I Butterfat 33.19% 7,821,090 $1.2019 /lb. 9,400,168.09 Class I Differential at Location 379,284,259 12,731,356.31 Total Class I Milk 57.18% 379,284,259 $ 48,171,092.55 Class II Skim Milk 8.72% 55,796,049 $6.49 /cwt. $ 3,621,163.59 Class II Butterfat 23.33% 5,498,732 $1.2718 /lb. 6,993,287.38 Total Class II Milk 9.24% 61,294,781 $ 10,614,450.97 Class III Skim Milk 23.38% 149,589,897 $5.61 /cwt. $ 8,391,993.20 Class III Butterfat 23.02% 5,426,186 $1.2648 /lb. 6,863,040.03 Total Class III Milk 23.37% 155,016,083 $ 15,255,033.23 Class IV Skim Milk 9.83% 62,881,640 $5.92 /cwt. $ 3,722,593.10 Class IV Butterfat 20.46% 4,822,909 $1.2648 /lb. 6,100,015.30 Total Class IV Milk 10.21% 67,704,549 $ 9,822,608.40
Producer Milk 100.00% 663,299,672 $ 83,863,185.15 Adjustments
Overage and Other Source $5,571.13Inventory Adjustments $8,983.08Producer butterfat at uniform butterfat price ($29,619,057.99)Location Adjustments to Producers $4,115,861.551/2 Unobligated Balance in P.S.F $334,801.02
Adjusted Pool Value $ 9.17720 $58,709,343.94Reserve for Producer Settlement Fund $ 0.04720 $301,925.98
Uniform Skim Milk Price per cwt. (Fulton County, Georgia): $9.13
Uniform Price per cwt. (Fulton County, Georgia) $13.21** At 3.5% butterfat test; for information purposes.
OTHER FEDERAL ORDERS: CLASS I AND UNIFORM PRICES (At 3.5% Butterfat)MARKET NAME CLASS I %
(Priced at) MAY 2009 JUN 2009 MAY 2009 MAY 2009Appalachian (Charlotte) $ 14.37 $ 13.48 $ 12.97 $ 13.28 64.70%Arizona (Phoenix $ 13.32 $ 12.43 $ 11.06 $ 11.15 30.68%Central (Kansas City) $ 12.97 $ 12.08 $ 10.91 $ 10.82 26.78%Florida (Tampa) $ 16.37 $ 15.48 $ 15.11 $ 15.65 85.68%Mideast (Cleveland) $ 12.97 $ 12.08 $ 11.28 $ 11.27 37.70%Northeast (Boston) $ 14.22 $ 13.33 $ 12.08 $ 12.18 39.90%Pacific Northwest (Seattle) $ 12.87 $ 11.98 $ 11.01 $ 10.83 26.18%Southeast (Atlanta) $ 14.77 $ 13.88 $ 13.14 $ 13.21 57.18%Southwest (Dallas) $ 13.97 $ 13.08 $ 11.89 $ 11.84 32.56%Upper Midwest (Chicago) $ 12.77 $ 11.88 $ 10.98 $ 10.30 12.40%
Page 2
F.O. 7 - SOUTHEAST: CALCULATION OF UNIFORM PRICES - MAY 2009
Price per unit
CLASS I UNIFORM APR 2009

Receipts: May 2009 May 2008Producer Milk
Class I 379,284,259 386,638,392Class II 61,294,781 79,322,933Class III 155,016,083 96,547,343Class IV 67,704,549 34,667,771
Total Producer Milk 663,299,672 597,176,439Average Butterfat Test 3.55% 3.58%
Percent of Producer Milk in Class I 57.18% 64.74%Daily Average Receipts 21,396,764 19,263,756
Other Source MilkClass I 6,878,081 5,093,594Class II 3,390,662 16,538,083Class III 2,909,666 3,620,638Class IV 7,101,240 7,266,967
Total Other Source Milk 20,279,649 32,519,282Overage
Class I 6,317 0Class II 0 3,800Class III 0 201Class IV 32,393 97,277
Total Overage 38,710 101,278Opening Inventory
Class I 35,076,642 31,791,443Class II 729,352 3,579,347Class III 3,428,810 1,290,645Class IV 13,814,691 17,883,175
Total Opening Inventory 53,049,495 54,544,610Total Receipts 736,667,526 684,341,609
Utilization:Class I Utilization
Inventory of Packaged FMP 26,492,569 29,551,486Route Disposition Class I 382,881,850 381,826,635Shrinkage 2,610,159 3,991,452Transfers & Diversions to Nonpool 9,260,721 8,153,856
Total Class I Utilization 421,245,299 423,523,429Average Butterfat Test 2.05% 2.07%
Daily Average Utilization 13,588,558 13,662,046Class II Utilization
Nonfluid Used To Produce 1,368,899 2,027,663Shrinkage 287,492 0Transfers & Diversions to Nonpool/Commercial Foods 40,368,672 59,167,841Used To Produce/Other Uses 23,389,732 38,248,659
Total Class II Utilization 65,414,795 99,444,163Average Butterfat Test 9.71% 7.53%
Class III UtilizationShrinkage 7,753,961 0Transfers & Diversions to Nonpool 148,959,694 101,458,827Used To Produce/Other Uses 4,640,904 0
Total Class III Utilization 161,354,559 101,458,827Average Butterfat Test 3.44% 4.19%
Class IV UtilizationInventory 27,393,094 12,847,116Nonfluid Used To Fortify 1,642,956 1,155,244Shrinkage 8,967 6,563,655Transfers & Diversions to Nonpool 59,607,856 34,354,079Used To Produce/Other Uses 0 4,995,096
Total Class IV Utilization 88,652,873 59,915,190Average Butterfat Test 6.69% 7.69%
Total Utilization 736,667,526 684,341,609
SOUTHEAST MILK MARKETING AREA-FEDERAL ORDER 7STATISTICAL SUMMARY
Page 3

Page 4
Packaged Class I Route Sales in Marketing Area Product Description Pounds Percent
April 2009 Whole Milk 132,992,711 31.66%Fat Free Milk 48,813,097 11.62%Lowfat Milk (incl. 1%) 33,756,729 8.04%Reduced Fat Milk (incl. 2%) 151,329,712 36.03%Cultured Fluid Milk (incl. Buttermilk) 8,344,097 1.99%Flavored Drinks and Milk 44,789,107 10.66%Total Disposition in Marketing Area 420,025,453 100.00% Total Disposition by Pool Plants 340,506,339 81.07%Total Disposition by Nonpool Plants 79,519,114 18.93%Total Disposition in Marketing Area 420,025,453 100.00%
Southeast Market Summary The minimum order uniform price for payment to producers supplying the Southeast Order
marketing area during May 2009 is $13.21 per hundredweight for milk with a 3.5% butterfat test in Fulton County, Georgia. This is .965 times the uniform skim milk price of $9.13 per hundredweight plus 3.5 times the uniform butterfat price of $1.2567 per pound. Payment to producers may be reduced by location differentials, if applicable, and by properly authorized deductions.
Uniform prices are the result of marketwide pooling; all producer milk was classified and priced according to the milk's use. In May, Class I use, which is primarily bottled or packaged fluid milk, accounted for 58.07% of all producer skim milk (priced to handlers at $7.01 per hundredweight, plus the Class I differential, see page 2) and 33.19% of producer butterfat (priced to handlers at $1.2019 per pound plus Class I differential). Class II use, which is milk used in fluid cream products and miscellaneous manufacturing, accounted for 8.72% of all producer skim milk ($6.49 per hundredweight) and 23.33% of producer butterfat ($1.2718 per pound). Class III use, mostly milk used to produce cheese, accounted for 23.38% of all producer skim milk ($5.61 per hundredweight) and 23.02% of producer butterfat ($1.2648 per pound). Class IV use, generally milk processed into butter and powder, accounted for 9.83% of all producer skim milk ($5.92 per hundredweight) and 20.46% of producer butterfat ($1.2648 per pound).
Receipts of producer milk during May 2009 totaled 663.3 million pounds. There were 26 regulated pool distributing plants, 3 pool supply plants and 11 cooperative associations submitting reports of receipts and utilization that were included in the computation of the uniform prices for May 2009. Class I route disposition in the area was 420.0 million pounds in April 2009.
USDA Issues Proposed Rules on Promotion and Imports (continued from page 4) amend the term “United States” to mean all States, the District of Columbia and the Commonwealth of Puerto Rico.
The 2002 Farm Bill mandated that the Dairy Order be amended to implement an assessment on imported dairy products to fund promotion and research. The 2008 Farm Bill specified that importers of dairy products be assessed a rate of 7.5 cents per hundredweight, or the equivalent thereof.
The Dairy Board was established under the Dairy Production Stabilization Act of 1983 to develop and administer a coordinated program of promotion, research, and nutrition education to strengthen the dairy industry’s positioning in domestic and foreign markets. Initially, two importer representatives, as appointed by the Secretary, will be added to the current 36-member Dairy Board. Thereafter, importer representation on the Dairy Board will be adjusted at least once every three years if necessary to reflect the volume of imports relative to domestic marketings.
Producers in the added areas of Alaska, Hawaii, and the Commonwealth of Puerto Rico are assessed 15 cents per hundredweight of milk produced and marketed. These four new areas will be added to the regions of closest geographic proximity.
The proposed rule was published in the May 19, 2009 Federal Register and is available on www.regulations.gov and AMS’s website at www.ams.usda.gov/dairy.

FEDERAL ORDER 7 - SOUTHEAST: CLASS AND UNIFORM PRICESPool CLASS I* CLASS II CLASS III CLASS IV UNIFORM*
Period Skim/cwt Bfat/lb @ 3.5 Skim/cwt Bfat/lb @ 3.5 Skim/cwt Bfat/lb @ 3.5 Skim/cwt Bfat/lb @ 3.5 Skim/cwt Bfat/lb @ 3.5Jan 2008 $19.63 $1.4643 $24.07 $15.61 $1.3389 $19.75 $15.19 $1.3319 $19.32 $ 12.05 $1.3319 $16.29 $ 18.26 $1.3813 $22.46Feb $18.54 $1.3970 $22.78 $14.39 $1.3080 $18.46 $12.93 $1.3010 $17.03 $ 10.48 $1.3010 $14.67 $ 16.81 $1.3355 $20.90Mar $15.64 $1.3448 $19.80 $11.24 $1.3674 $15.63 $13.72 $1.3604 $18.00 $ 9.75 $1.3604 $14.17 $ 14.55 $1.3561 $18.79Apr $17.49 $1.3793 $21.71 $10.47 $1.4818 $15.29 $12.02 $1.4748 $16.76 $ 9.74 $1.4748 $14.56 $ 15.46 $1.4418 $19.97May $15.70 $1.5043 $20.42 $10.40 $1.5632 $15.51 $13.20 $1.5562 $18.18 $ 10.17 $1.5562 $15.26 $ 14.74 $1.5368 $19.60June $16.97 $1.6005 $21.98 $10.89 $1.6230 $16.19 $15.12 $1.6160 $20.25 $ 10.64 $1.6160 $15.92 $ 15.72 $1.6095 $20.80July $19.50 $1.6466 $24.58 $11.31 $1.6844 $16.81 $12.82 $1.6774 $18.24 $ 11.12 $1.6774 $16.60 $ 17.46 $1.6650 $22.68Aug $16.85 $1.7184 $22.27 $11.74 $1.7483 $17.45 $11.63 $1.7413 $17.32 $ 10.93 $1.7413 $16.64 $ 15.74 $1.7316 $21.25Sep $15.78 $1.7791 $21.45 $11.59 $1.8266 $17.58 $10.27 $1.8196 $16.28 $ 9.41 $1.8196 $15.45 $ 14.84 $1.8024 $20.63Oct $13.56 $1.7831 $19.33 $10.46 $1.8577 $16.60 $10.97 $1.8507 $17.06 $ 7.40 $1.8507 $13.62 $ 13.03 $1.8230 $18.95Nov $15.09 $1.8768 $21.13 $8.52 $1.7800 $14.45 $9.64 $1.7730 $15.51 $ 6.26 $1.7730 $12.25 $ 13.33 $1.8125 $19.21Dec $13.29 $1.8305 $19.23 $6.88 $1.3068 $11.21 $11.12 $1.2998 $15.28 $ 6.01 $1.2998 $10.35 $ 12.01 $1.5024 $16.85Jan 2009 $15.04 $1.4363 $19.54 $6.74 $1.1154 $10.41 $7.15 $1.1084 $10.78 $ 5.92 $1.1084 $9.59 $ 12.77 $1.2288 $16.62Feb $10.87 $1.1520 $14.52 $6.63 $1.1011 $10.25 $5.68 $1.0941 $9.31 $ 5.82 $1.0941 $9.45 $ 9.65 $1.1155 $13.22Mar $9.61 $1.1298 $13.23 $6.51 $1.1664 $10.36 $6.61 $1.1594 $10.44 $ 5.78 $1.1594 $9.64 $8.75 $1.1495 $12.47Apr $10.36 $1.1880 $14.16 $6.47 $1.2119 $10.49 $6.80 $1.2049 $10.78 $ 5.81 $1.2049 $9.82 $ 9.27 $1.1992 $13.14May $10.81 $1.2399 $14.77 $6.49 $1.2718 $10.71 $5.61 $1.2648 $9.84 $ 5.92 $1.2648 $10.14 $ 9.13 $1.2567 $13.21Jun $9.71 $1.2897 $13.88 $6.61
Pool CLASS I CLASS II CLASS III CLASS IVPeriod 1000 lbs. % 1000 lbs. % 1000 lbs. % 1000 lbs. %
Jan 2008 427,443 66.56% 54,698 8.52% 109,863 17.11% 50,144 7.81%Feb 389,276 64.22% 69,259 11.43% 94,584 15.61% 52,992 8.74%Mar 398,126 64.80% 83,411 13.58% 82,833 13.48% 49,999 8.14%Apr 388,115 63.76% 81,108 13.33% 100,604 16.53% 38,804 6.38%May 386,639 64.74% 79,323 13.28% 96,547 16.17% 34,668 5.81%June 346,682 70.25% 71,361 14.46% 27,363 5.54% 48,094 9.75%July 365,692 67.73% 64,438 11.94% 68,086 12.61% 41,668 7.72%Aug 398,922 72.09% 57,441 10.38% 51,033 9.22% 45,981 8.31%Sep 400,017 74.55% 52,644 9.81% 61,540 11.47% 22,397 4.17%Oct 414,863 73.62% 58,955 10.46% 64,708 11.48% 25,002 4.44%Nov 381,264 67.96% 59,573 10.62% 63,744 11.36% 56,464 10.06%Dec 404,358 66.68% 53,632 8.84% 75,350 12.42% 73,126 12.06%Jan 2009 413,503 68.14% 58,107 9.57% 73,691 12.14% 61,575 10.15%Feb 370,916 67.93% 57,125 10.46% 97,875 17.93% 20,079 3.68%Mar 411,467 60.71% 68,678 10.13% 131,319 19.38% 66,259 9.78%Apr 393,669 61.02% 62,288 9.65% 122,741 19.02% 66,498 10.31%May 379,284 57.18% 61,295 9.24% 155,016 23.37% 67,705 10.21%663,300 2,900**
645,197 2,968
642,148 3,068
614,369
536,598 3,073
493,500 2,6662,936
606,876 2,914
2,9052,933
563,528
606,466 2,974561,045 2,906
FEDERAL ORDER 7 - SOUTHEAST: POOLED RECEIPTS AND UTILIZATION OF PRODUCER MILKProducer Milk
1000 lbs. FarmsNumber of
* Class I and uniform prices are at Fulton County (Atlanta), Georgia;** Estimated
2,948606,111 2,989
608,631 2,943
539,885
597,176 2,956
553,377
677,722 2,910545,996 2,878
Class I Utilization
56%
58%
60%
62%
64%
66%
68%
May-08 Apr-09May-09
Page 5

** The base rate for making partial payments in Fulton County, GA for June will be $11.89 per hundredweight. This is 90 percent of the preceding month’s uniform price of $13.21 per hundredweight.
Producer Touch Base Requirements & Handler Diversion Limits [per Order Amendment issued March 17, 2008]
Jan Feb Mar Apr May Jun Jul Aug Sep Oct Nov Dec Producer Touch Base Days 1 1 1 1 1 1 1 1 1 1 1 1 Diversion Percentage Limits 25% 25% 35% 35% 35% 35% 25% 25% 25% 25% 25% 35%
WASDE Dairy Report 1/ WASDE - 471 June 10, 2009 The milk production forecasts for 2009 and 2010 are reduced as higher feed prices further weaken producer returns and sharpen the expected contraction in cow numbers. Growth in milk per cow is also slowed due to higher feed costs. Commercial exports, primarily on a skim-solids basis, are forecast higher in 2009 and 2010 on tighter global dairy product supplies and a weaker U.S. dollar. CCC removals are adjusted to reflect exports under the Dairy Export Incentive Program (DEIP). Most product prices are forecast higher in the face of tighter supplies, but cheese prices are forecast lower for 2009. The Class III price is unchanged for 2009 but raised for 2010 while Class IV prices are forecast higher for 2009 and 2010. The all milk price is forecast at $11.95 to $12.35 per cwt for 2009 and $15.10 to $16.10 for 2010. 1/ The World Agricultural Supply and Demand Estimates (WASDE) report provides USDA's comprehensive forecasts of supply and demand for major U.S. and global crops and U.S. livestock, including dairy. The most recent WASDE report is available at www.usda.gov/oce/commodity/wasde/index.htm.
Southeast Marketing Area - Federal Order 7 Pool and Payment Dates for the Pooling Periods
June through August 2009 MA Payment Dates Payments for Producer Milk
Due to: Due From: Partial Payment** Due Final Payment Due Pool Month
Pool & Uniform Price Release
Date All Funds P/S & T-Credit Coop Nonmember Coop Nonmember
JUN 2009 07/11/09 07/13/09 07/14/09 06/25/09 06/26/09 07/14/09 07/15/09 JUL 2009 08/11/09 08/12/09 08/13/09 07/27/09 07/27/09 08/13/09 08/14/09 AUG 2009 09/11/09 09/14/09 09/15/09 08/25/09 08/26/09 09/15/09 09/16/09
"The U.S. Department of Agriculture (USDA) prohibits discrimination in all its programs and activities on the basis of race, color, national origin, age, disability, and where applicable, sex, marital status, familial status, parental status, religion, sexual orientation, genetic information, political beliefs, reprisal, or because all or a part of an individual's income is derived from any public assistance program. (Not all prohibited bases apply to all programs.) Persons with disabilities who require alternative means for communication of program information (Braille, large print, audiotape, etc.) should contact USDA's TARGET Center at (202) 720-2600 (voice and TDD). To file a complaint of discrimination write to USDA, Director, Office of Civil Rights, 1400 Independence Avenue, S.W., Washington, D.C. 20250-9410 or call (800) 795-3272 (voice) or (202) 720-6382 (TDD). USDA is an equal opportunity provider and employer."
MILK MARKET ADMINISTRATORU.S. Department Of Agriculture 1550 North Brown Road, Suite 120Lawrenceville, Georgia 30043
www.fmmatlanta.com

Uniform Price Falls The uniform price in Fulton County, GA, was
$12.83 per hundredweight of milk at 3.5 percent butterfat for the month of June. The uniform price is $0.38 lower than the previous month and is $7.97 per hundredweight lower compared with June of last year.
Class I utilization was 61.19 percent in June, an increase of 4.01 percent compared with the previous month and a decrease of 9.06 percent compared with June of last year.
National Dairy Situation The USDA estimates that the total U.S.
production of milk in May was 16.7 billion pounds, an increase of 0.1 percent from May 2008 and an increase of 0.4 percent when compared with April 2009 on a daily average basis. Total cheese output was 861 million pounds, 2.6 percent above May 2008 and 1.4 percent below April 2009 on a daily average ba-sis. Butter production was 139 million pounds, 0.3 percent below May 2008 and 5.3 percent below April 2009 on a daily average basis.
Nonfat dry milk powder production was 149.0 million pounds in May, a 13.3 percent in-crease compared with May 2008 and a 4.1 per-cent increase compared to April 2009 on a daily average basis. Dry whey production was 95.3 million pounds in May, a decrease of 3.8 per-cent compared with May 2008 and 0.5 percent below April 2009 on a daily average basis.
Market Information BULLETIN
ISSUED FOR THE INFORMATION OF PRODUCERS WHO ARE NOT MEMBERS OF COOPERATIVE ASSOCIATIONS
Sue L. Mosley, Market Administrator
www.fmmatlanta.com
Southeast Marketing Area Federal Order 7
Volume 10—No. 7 July 2009
2008 Annual Summaries Available The National Agricultural Statistics Service
(NASS) recently published two annual summaries of different segments of the dairy industry for 2008. One report, titled ‘Milk Production, Disposi-tion, and Income 2008 Summary’, focuses on measures of farm level performance of the na-tion’s dairy farms. The second report, ‘Dairy Products 2008 Summary’, reviews the processing of milk into storable goods. Both of these are available at www.nass.usda.gov/Publications. Se-lected highlights from the reports are:
Milk production increased 2.3 percent in 2008 to 190 billion pounds. Milk per cow, at 20,396 pounds, was 192 pounds above 2007. The an-nual average number of milk cows on farms was 9.32 million head, up 126,000 head from 2007.
Cash receipts from marketings of milk during 2008 totaled $34.8 billion, 1.9 percent lower than 2007. Producer returns averaged $18.41 per hundredweight, 4.2 percent below 2007. Market-ings totaled 189 billion pounds, 2.4 percent higher than the previous year.
Total cheese production in 2008 was 9.9 bil-lion pounds, 2 percent above 2007 production. Wisconsin was the leading cheese producing state with 25 percent of the production, followed by California with 21 percent, Idaho with 8 per-cent, New York with 7 percent, and Minnesota and New Mexico with 6 percent each.
The amount of butter production in the United States during 2008 totaled 1.6 billion pounds, 7 percent above 2007. California accounted for 34 percent of butter production in 2008, followed by Wisconsin with 22 percent.
Nonfat dry milk production for human food, at 1.5 billion pounds, was up 17 percent from 2007. California, accounting for 54 percent of total pro-duction, was the largest source of milk powder.
Transportation Credit Update The available balance in the Federal Order 7
transportation credit balancing fund for June 2009 was $4,662,576.34. Preliminary claims were made for $1,431,432.49. Since sufficient funds were available, all eligible claims were paid in full.

Calculation of Uniform Butterfat Price:Utilization Pounds Price/lb. Value
Class I Butterfat 37.31% 8,016,361 $1.2517 $ 10,034,079.07 Class I Differential at Location 268,953.91 Class II Butterfat 25.59% 5,500,234 $1.2614 6,937,995.17 Class III Butterfat 22.79% 4,898,233 $1.2544 6,144,343.46 Class IV Butterfat 14.31% 3,074,750 $1.2544 3,856,966.42
Total Butterfat 100.00% 21,489,578 $ 27,242,338.03
Uniform Butterfat Price per lb. (Fulton County, Georgia): $1.2677
Calculation of Uniform Skim Milk PriceProducer Milk Utilization Pounds ValueClass I Skim Milk 62.07% 362,286,961 $5.91 /cwt. $ 21,411,159.41 Class I Butterfat 37.31% 8,016,361 $1.2517 /lb. 10,034,079.07 Class I Differential at Location 370,303,322 12,406,570.93 Total Class I Milk 61.19% 370,303,322 $ 43,851,809.41 Class II Skim Milk 10.02% 58,470,329 $6.61 /cwt. $ 3,864,888.73 Class II Butterfat 25.59% 5,500,234 $1.2614 /lb. 6,937,995.17 Total Class II Milk 10.57% 63,970,563 $ 10,802,883.90 Class III Skim Milk 21.87% 127,631,485 $5.78 /cwt. $ 7,377,099.85 Class III Butterfat 22.79% 4,898,233 $1.2544 /lb. 6,144,343.46 Total Class III Milk 21.90% 132,529,718 $ 13,521,443.31 Class IV Skim Milk 6.04% 35,275,118 $6.04 /cwt. $ 2,130,617.14 Class IV Butterfat 14.31% 3,074,750 $1.2544 /lb. 3,856,966.42 Total Class IV Milk 6.34% 38,349,868 $ 5,987,583.56
Producer Milk 100.00% 605,153,471 $ 74,163,720.18 Adjustments
Overage and Other Source $17,816.97Inventory Adjustments $49,352.46Producer butterfat at uniform butterfat price ($27,242,338.03)Location Adjustments to Producers $3,694,370.121/2 Unobligated Balance in P.S.F $333,908.58
Adjusted Pool Value $ 8.74079 $51,016,830.28Reserve for Producer Settlement Fund $ 0.04079 $238,071.60
Uniform Skim Milk Price per cwt. (Fulton County, Georgia): $8.70
Uniform Price per cwt. (Fulton County, Georgia) $12.83** At 3.5% butterfat test; for information purposes.
OTHER FEDERAL ORDERS: CLASS I AND UNIFORM PRICES (At 3.5% Butterfat)MARKET NAME CLASS I %
(Priced at) JUN 2009 JUL 2009 JUN 2009 JUN 2009Appalachian (Charlotte) $ 13.48 $ 13.66 $ 13.28 $ 12.66 64.19%Arizona (Phoenix $ 12.43 $ 12.61 $ 11.15 $ 10.95 33.18%Central (Kansas City) $ 12.08 $ 12.26 $ 10.82 $ 10.70 27.47%Florida (Tampa) $ 15.48 $ 15.66 $ 15.65 $ 14.96 88.74%Mideast (Cleveland) $ 12.08 $ 12.26 $ 11.27 $ 10.99 36.90%Northeast (Boston) $ 13.33 $ 13.51 $ 12.18 $ 11.93 41.20%Pacific Northwest (Seattle) $ 11.98 $ 12.16 $ 10.83 $ 10.70 26.86%Southeast (Atlanta) $ 13.88 $ 14.06 $ 13.21 $ 12.83 61.19%Southwest (Dallas) $ 13.08 $ 13.26 $ 11.84 $ 11.64 32.91%Upper Midwest (Chicago) $ 11.88 $ 12.06 $ 10.30 $ 10.29 12.30%
Page 2
F.O. 7 - SOUTHEAST: CALCULATION OF UNIFORM PRICES - JUNE 2009
Price per unit
CLASS I UNIFORM MAY 2009

Receipts: June 2009 June 2008Producer Milk
Class I 370,303,322 346,681,981Class II 63,970,563 71,360,723Class III 132,529,718 27,362,530Class IV 38,349,868 48,094,335
Total Producer Milk 605,153,471 493,499,569Average Butterfat Test 3.55% 3.55%
Percent of Producer Milk in Class I 61.19% 70.25%Daily Average Receipts 20,171,782 16,449,986
Other Source MilkClass I 5,555,302 4,664,397Class II 5,746,057 19,336,620Class III 2,293,404 0Class IV 3,992,592 7,505,007
Total Other Source Milk 17,587,355 31,506,024Overage
Class I 0 106Class II 0 528Class III 308,252 33,441Class IV 0 103,784
Total Overage 308,252 137,859Opening Inventory
Class I 27,540,390 29,557,177Class II 3,302,775 1,494,491Class III 6,101,126 526,541Class IV 16,941,372 10,826,084
Total Opening Inventory 53,885,663 42,404,293Total Receipts 676,934,741 567,547,745
Utilization:Class I Utilization
Inventory of Packaged FMP 30,562,788 28,581,040Route Disposition Class I 363,321,403 342,288,609Shrinkage 1,250,311 2,874,468Transfers & Diversions to Nonpool 8,264,512 7,159,544
Total Class I Utilization 403,399,014 380,903,661Average Butterfat Test 2.15% 2.17%
Daily Average Utilization 13,446,634 12,696,789Class II Utilization
Nonfluid Used To Produce 1,627,934 2,334,022Shrinkage 9,892 125Transfers & Diversions to Nonpool/Commercial Foods 46,331,663 49,993,548Used To Produce/Other Uses 25,049,906 39,864,667
Total Class II Utilization 73,019,395 92,192,362Average Butterfat Test 9.03% 7.81%
Class III UtilizationShrinkage 6,296,656 0Transfers & Diversions to Nonpool 130,307,384 27,909,418Used To Produce/Other Uses 4,628,460 0
Total Class III Utilization 141,232,500 27,909,418Average Butterfat Test 3.57% 5.85%
Class IV UtilizationInventory 16,384,531 21,909,367Nonfluid Used To Fortify 1,546,505 1,072,737Shrinkage 0 6,059,932Transfers & Diversions to Nonpool 41,352,796 33,089,063Used To Produce/Other Uses 0 4,398,111
Total Class IV Utilization 59,283,832 66,529,210Average Butterfat Test 7.41% 5.99%
Total Utilization 676,934,741 567,534,651
SOUTHEAST MILK MARKETING AREA-FEDERAL ORDER 7STATISTICAL SUMMARY
Page 3

Page 4
Packaged Class I Route Sales in Marketing Area Product Description Pounds Percent
May 2009 Whole Milk 136,975,506 32.55%Fat Free Milk 49,613,839 11.79%Lowfat Milk (incl. 1%) 33,684,868 8.01%Reduced Fat Milk (incl. 2%) 153,159,359 36.40%Cultured Fluid Milk (incl. Buttermilk) 8,021,048 1.91%Flavored Drinks and Milk 39,324,833 9.35%Total Disposition in Marketing Area 420,779,453 100.00% Total Disposition by Pool Plants 334,873,867 79.58%Total Disposition by Nonpool Plants 85,905,586 20.42%Total Disposition in Marketing Area 420,779,453 100.00%
Southeast Market Summary The minimum order uniform price for payment to producers supplying the Southeast Order
marketing area during June 2009 is $12.83 per hundredweight for milk with a 3.5% butterfat test in Fulton County, Georgia. This is .965 times the uniform skim milk price of $8.70 per hundredweight plus 3.5 times the uniform butterfat price of $1.2677 per pound. Payment to producers may be reduced by location differentials, if applicable, and by properly authorized deductions.
Uniform prices are the result of marketwide pooling; all producer milk was classified and priced according to the milk's use. In June, Class I use, which is primarily bottled or packaged fluid milk, accounted for 62.07% of all producer skim milk (priced to handlers at $5.91 per hundredweight, plus the Class I differential, see page 2) and 37.31% of producer butterfat (priced to handlers at $1.2517 per pound plus Class I differential). Class II use, which is milk used in fluid cream products and miscellaneous manufacturing, accounted for 10.02% of all producer skim milk ($6.61 per hundredweight) and 25.59% of producer butterfat ($1.2614 per pound). Class III use, mostly milk used to produce cheese, accounted for 21.87% of all producer skim milk ($5.78 per hundredweight) and 22.79% of producer butterfat ($1.2544 per pound). Class IV use, generally milk processed into butter and powder, accounted for 6.04% of all producer skim milk ($6.04 per hundredweight) and 14.31% of producer butterfat ($1.2544 per pound).
Receipts of producer milk during June 2009 totaled 605.2 million pounds. There were 25 regulated pool distributing plants, 3 pool supply plants and 11 cooperative associations submitting reports of receipts and utilization that were included in the computation of the uniform prices for June 2009. Class I route disposition in the area was 420.0 million pounds in May 2009.
Rayne Pegg Named Administrator of the Agricultural Marketing Service Agriculture Secretary Tom Vilsack has recently announced the appointment of Rayne Pegg as
Administrator of the U.S. Department of Agriculture's Agricultural Marketing Service. The agency is part of USDA's Marketing and Regulatory Programs mission area which works to ensure a productive and competitive global and domestic marketplace for U.S. agricultural products. Pegg began serving in this role in early July.
"Rayne's background makes her the ideal person to further the development of programs to ensure efficient, fair marketing of U.S. agricultural products as we work to meet the needs of consumers and industries and provide a safe, sustainable food supply for all Americans" said Vilsack.
Pegg most recently served as the Deputy Secretary of Legislation and Policy for the California Department of Food and Agriculture. In this role, she was the principle advisor to both the Secretary of the Department and the cabinet of the Governor of California on the Department's legislative and policy issues. Pegg represented the Department before the California legislature, regulating bodies and interested parties on issues potentially impacting the Department's programs. She has worked with growers and the public to find common ground and reach agreement on controversial issues. She also worked on legislation and public policy that address: invasive species, the Farm Bill, the Department's budget, organic production, food safety, farmers markets, government oversight, and trade barriers.

FEDERAL ORDER 7 - SOUTHEAST: CLASS AND UNIFORM PRICESPool CLASS I* CLASS II CLASS III CLASS IV UNIFORM*
Period Skim/cwt Bfat/lb @ 3.5 Skim/cwt Bfat/lb @ 3.5 Skim/cwt Bfat/lb @ 3.5 Skim/cwt Bfat/lb @ 3.5 Skim/cwt Bfat/lb @ 3.5Jan 2008 $19.63 $1.4643 $24.07 $15.61 $1.3389 $19.75 $15.19 $1.3319 $19.32 $ 12.05 $1.3319 $16.29 $ 18.26 $1.3813 $22.46Feb $18.54 $1.3970 $22.78 $14.39 $1.3080 $18.46 $12.93 $1.3010 $17.03 $ 10.48 $1.3010 $14.67 $ 16.81 $1.3355 $20.90Mar $15.64 $1.3448 $19.80 $11.24 $1.3674 $15.63 $13.72 $1.3604 $18.00 $ 9.75 $1.3604 $14.17 $ 14.55 $1.3561 $18.79Apr $17.49 $1.3793 $21.71 $10.47 $1.4818 $15.29 $12.02 $1.4748 $16.76 $ 9.74 $1.4748 $14.56 $ 15.46 $1.4418 $19.97May $15.70 $1.5043 $20.42 $10.40 $1.5632 $15.51 $13.20 $1.5562 $18.18 $ 10.17 $1.5562 $15.26 $ 14.74 $1.5368 $19.60Jun $16.97 $1.6005 $21.98 $10.89 $1.6230 $16.19 $15.12 $1.6160 $20.25 $ 10.64 $1.6160 $15.92 $ 15.72 $1.6095 $20.80Jul $19.50 $1.6466 $24.58 $11.31 $1.6844 $16.81 $12.82 $1.6774 $18.24 $ 11.12 $1.6774 $16.60 $ 17.46 $1.6650 $22.68Aug $16.85 $1.7184 $22.27 $11.74 $1.7483 $17.45 $11.63 $1.7413 $17.32 $ 10.93 $1.7413 $16.64 $ 15.74 $1.7316 $21.25Sep $15.78 $1.7791 $21.45 $11.59 $1.8266 $17.58 $10.27 $1.8196 $16.28 $ 9.41 $1.8196 $15.45 $ 14.84 $1.8024 $20.63Oct $13.56 $1.7831 $19.33 $10.46 $1.8577 $16.60 $10.97 $1.8507 $17.06 $ 7.40 $1.8507 $13.62 $ 13.03 $1.8230 $18.95Nov $15.09 $1.8768 $21.13 $8.52 $1.7800 $14.45 $9.64 $1.7730 $15.51 $ 6.26 $1.7730 $12.25 $ 13.33 $1.8125 $19.21Dec $13.29 $1.8305 $19.23 $6.88 $1.3068 $11.21 $11.12 $1.2998 $15.28 $ 6.01 $1.2998 $10.35 $ 12.01 $1.5024 $16.85Jan 2009 $15.04 $1.4363 $19.54 $6.74 $1.1154 $10.41 $7.15 $1.1084 $10.78 $ 5.92 $1.1084 $9.59 $ 12.77 $1.2288 $16.62Feb $10.87 $1.1520 $14.52 $6.63 $1.1011 $10.25 $5.68 $1.0941 $9.31 $ 5.82 $1.0941 $9.45 $ 9.65 $1.1155 $13.22Mar $9.61 $1.1298 $13.23 $6.51 $1.1664 $10.36 $6.61 $1.1594 $10.44 $ 5.78 $1.1594 $9.64 $8.75 $1.1495 $12.47Apr $10.36 $1.1880 $14.16 $6.47 $1.2119 $10.49 $6.80 $1.2049 $10.78 $ 5.81 $1.2049 $9.82 $ 9.27 $1.1992 $13.14May $10.81 $1.2399 $14.77 $6.49 $1.2718 $10.71 $5.61 $1.2648 $9.84 $ 5.92 $1.2648 $10.14 $ 9.13 $1.2567 $13.21Jun $9.71 $1.2897 $13.88 $6.61 $1.2614 $10.79 $5.78 $1.2544 $9.97 $ 6.04 $1.2544 $10.22 $ 8.70 $1.2677 $12.83Jul $9.83 $1.3062 $14.06 $6.73
Pool CLASS I CLASS II CLASS III CLASS IVPeriod 1000 lbs. % 1000 lbs. % 1000 lbs. % 1000 lbs. %
Jan 2008 427,443 66.56% 54,698 8.52% 109,863 17.11% 50,144 7.81%Feb 389,276 64.22% 69,259 11.43% 94,584 15.61% 52,992 8.74%Mar 398,126 64.80% 83,411 13.58% 82,833 13.48% 49,999 8.14%Apr 388,115 63.76% 81,108 13.33% 100,604 16.53% 38,804 6.38%May 386,639 64.74% 79,323 13.28% 96,547 16.17% 34,668 5.81%Jun 346,682 70.25% 71,361 14.46% 27,363 5.54% 48,094 9.75%Jul 365,692 67.73% 64,438 11.94% 68,086 12.61% 41,668 7.72%Aug 398,922 72.09% 57,441 10.38% 51,033 9.22% 45,981 8.31%Sep 400,017 74.55% 52,644 9.81% 61,540 11.47% 22,397 4.17%Oct 414,863 73.62% 58,955 10.46% 64,708 11.48% 25,002 4.44%Nov 381,264 67.96% 59,573 10.62% 63,744 11.36% 56,464 10.06%Dec 404,358 66.68% 53,632 8.84% 75,350 12.42% 73,126 12.06%Jan 2009 413,503 68.14% 58,107 9.57% 73,691 12.14% 61,575 10.15%Feb 370,916 67.93% 57,125 10.46% 97,875 17.93% 20,079 3.68%Mar 411,467 60.71% 68,678 10.13% 131,319 19.38% 66,259 9.78%Apr 393,669 61.02% 62,288 9.65% 122,741 19.02% 66,498 10.31%May 379,284 57.18% 61,295 9.24% 155,016 23.37% 67,705 10.21%Jun 370,303 61.19% 63,971 10.57% 132,530 21.90% 38,350 6.34%
677,722 2,910545,996 2,878
* Class I and uniform prices are at Fulton County (Atlanta), Georgia;** Estimated
2,948606,111 2,989
608,631 2,943
539,885
597,176 2,956
553,377
FEDERAL ORDER 7 - SOUTHEAST: POOLED RECEIPTS AND UTILIZATION OF PRODUCER MILKProducer Milk
1000 lbs. FarmsNumber of
606,876 2,914
2,9052,933
563,528
606,466 2,974561,045 2,906
645,197 2,968
642,148 3,068
614,369
536,598 3,073
493,500 2,6662,936
605,153 3,000**663,300 2,994
Class I Utilization
56%
58%
60%
62%
64%
66%
68%
70%
72%
Jun-08 Mar-09Jun-09
Page 5

** The base rate for making partial payments in Fulton County, GA for July will be $11.55 per hundredweight. This is 90 percent of the preceding month’s uniform price of $12.83 per hundredweight.
Producer Touch Base Requirements & Handler Diversion Limits [per Order Amendment issued March 17, 2008]
Jan Feb Mar Apr May Jun Jul Aug Sep Oct Nov Dec Producer Touch Base Days 1 1 1 1 1 1 1 1 1 1 1 1 Diversion Percentage Limits 25% 25% 35% 35% 35% 35% 25% 25% 25% 25% 25% 35%
WASDE Dairy Report 1/
WASDE - 472 July 10, 2009 The milk production forecast is raised fractionally for 2009 as the reduction in cow numbers is slightly slower than expected. Milk production for 2010 is unchanged. Imports for 2009 on a skim-solids basis are forecast lower; the commercial export forecast is unchanged from last month. Net removals are adjusted for both higher nonfat dry milk (NDM) sales to the CCC and product exports under the Dairy Export Incentive Program (DEIP). Cheese, butter, and NDM price forecasts are lowered as supplies are large but whey prices are forecast higher. For 2009 and 2010, Class III prices are reduced as lower cheese price forecasts more than offset higher whey prices. The Class IV price forecast is reduced in line with lower butter and NDM prices in both 2009 and 2010. The all milk price is forecast at $11.85 to $12.15 per cwt for 2009 and $14.85 to $15.85 for 2010. 1/ The World Agricultural Supply and Demand Estimates (WASDE) report provides USDA's comprehensive forecasts of supply and demand for major U.S. and global crops and U.S. livestock, including dairy. The most recent WASDE report is available at www.usda.gov/oce/commodity/wasde/index.htm.
Southeast Marketing Area - Federal Order 7 Pool and Payment Dates for the Pooling Periods
July through September 2009 MA Payment Dates Payments for Producer Milk
Due to: Due From: Partial Payment** Due Final Payment Due Pool Month
Pool & Uniform Price Release
Date All Funds P/S & T-Credit Coop Nonmember Coop Nonmember
JUL 2009 08/11/09 08/12/09 08/13/09 07/27/09 07/27/09 08/13/09 08/14/09 AUG 2009 09/11/09 09/14/09 09/15/09 08/25/09 08/26/09 09/15/09 09/16/09 SEPT 2009 10/11/09 10/13/09 10/14/09 09/25/09 09/28/09 10/14/09 10/15/09
"The U.S. Department of Agriculture (USDA) prohibits discrimination in all its programs and activities on the basis of race, color, national origin, age, disability, and where applicable, sex, marital status, familial status, parental status, religion, sexual orientation, genetic information, political beliefs, reprisal, or because all or a part of an individual's income is derived from any public assistance program. (Not all prohibited bases apply to all programs.) Persons with disabilities who require alternative means for communication of program information (Braille, large print, audiotape, etc.) should contact USDA's TARGET Center at (202) 720-2600 (voice and TDD). To file a complaint of discrimination write to USDA, Director, Office of Civil Rights, 1400 Independence Avenue, S.W., Washington, D.C. 20250-9410 or call (800) 795-3272 (voice) or (202) 720-6382 (TDD). USDA is an equal opportunity provider and employer."
MILK MARKET ADMINISTRATORU.S. Department Of Agriculture 1550 North Brown Road, Suite 120Lawrenceville, Georgia 30043
www.fmmatlanta.com

Uniform Price Increases The uniform price in Fulton County, GA, was
$13.07 per hundredweight of milk at 3.5 percent butterfat for the month of July. The uniform price is $0.24 higher than the previous month and is $9.61 per hundredweight lower compared with July of last year.
Class I utilization was 66.92 percent in July, an increase of 5.73 percent compared with the previ-ous month and a decrease of 0.81 percent com-pared with July of last year.
National Dairy Situation The USDA estimates that the total U.S.
production of milk in June was 15.9 billion pounds, a decrease of 0.2 percent from June 2008 and a decrease of 2.0 percent when compared with May 2009 on a daily average basis. Total cheese out-put (excluding cottage cheese) was 833 million pounds, 2.0 percent above June 2008 but un-changed from May 2009 on a daily average basis. Butter production was 125 million pounds, 7.5 per-cent above June 2008 but 7.3 percent below May 2009 on a daily average basis.
Nonfat dry milk powder production was 145.0 million pounds in June, a 6.3 percent increase compared with June 2008 and a 0.6 percent in-crease compared to May 2009 on a daily average basis. Dry whey production was 92.0 million pounds in June, a decrease of 3.2 percent com-pared with June 2008 and 0.2 percent decrease compared to May 2009 on a daily average basis.
Market Information BULLETIN
ISSUED FOR THE INFORMATION OF PRODUCERS WHO ARE NOT MEMBERS OF COOPERATIVE ASSOCIATIONS
Sue L. Mosley, Market Administrator
www.fmmatlanta.com
Southeast Marketing Area Federal Order 7
Volume 10—No. 8 August 2009
USDA Increases Dairy Support Price On July 31, Agriculture Secretary Vilsack an-
nounced that the Obama Administration is taking immediate action to support struggling dairy farm-ers by increasing the amount paid for dairy prod-ucts through the Dairy Product Price Support Pro-gram (DPPSP). USDA estimates show that these increases, which will be in place from August 2009 through October 2009, will increase dairy farmers' revenue by $243 million.
The increase will raise the price paid for nonfat dry milk from $0.80 per pound to $0.92 per pound, the price paid for cheddar blocks from $1.13 per pound to $1.31 per pound, and the price of cheddar barrels from $1.10 per pound to $1.28 per pound. This increase in the support price will have an immediate effect upon dairy farmers' bottom line. Temporarily raising the price of these dairy products increases the price that dairy farmers receive for their milk.
USDA estimates the increase in the support price should increase the all milk price received by dairy producers. The increase of the support price will result in the government purchase of an additional 150 million pounds of nonfat dry milk and an additional 75 million pounds of cheese.
Prior to today's announcement, USDA had taken several steps to provide support for dairy farmers, including the following: • In March, USDA transferred approximately 200
million pounds of nonfat dry milk to USDA's Food and Nutrition Service, which will not only remove inventory from the market, but also support low-income families struggling to put nutritious food on their tables.
• USDA expects to spend more than $1 billion in fiscal year 2009 on purchases of dairy products
(continued on page four)
Transportation Credit Update The available balance in the Federal Order 7
transportation credit balancing fund for July 2009 was $4,465,686.00. Preliminary claims were made for $1,862,863.12. Since sufficient funds were available, all eligible claims were paid in full.

Calculation of Uniform Butterfat Price:Utilization Pounds Price/lb. Value
Class I Butterfat 40.94% 8,255,275 $1.2682 $ 10,469,339.75 Class I Differential at Location 275,171.35 Class II Butterfat 26.68% 5,381,269 $1.2508 6,730,891.28 Class III Butterfat 20.56% 4,146,708 $1.2438 5,157,675.42 Class IV Butterfat 11.82% 2,384,159 $1.2438 2,965,416.98
Total Butterfat 100.00% 20,167,411 $ 25,598,494.78
Uniform Butterfat Price per lb. (Fulton County, Georgia): $1.2693
Calculation of Uniform Skim Milk PriceProducer Milk Utilization Pounds ValueClass I Skim Milk 67.88% 373,618,482 $6.03 /cwt. $ 22,529,194.48 Class I Butterfat 40.94% 8,255,275 $1.2682 /lb. 10,469,339.75 Class I Differential at Location 381,873,757 12,791,477.26 Total Class I Milk 66.92% 381,873,757 $ 45,790,011.49 Class II Skim Milk 10.42% 57,384,573 $6.73 /cwt. $ 3,861,981.74 Class II Butterfat 26.68% 5,381,269 $1.2508 /lb. 6,730,891.28 Total Class II Milk 11.00% 62,765,842 $ 10,592,873.02 Class III Skim Milk 19.32% 106,364,624 $5.82 /cwt. $ 6,190,421.14 Class III Butterfat 20.56% 4,146,708 $1.2438 /lb. 5,157,675.42 Total Class III Milk 19.37% 110,511,332 $ 11,348,096.56 Class IV Skim Milk 2.38% 13,095,892 $6.01 /cwt. $ 787,063.10 Class IV Butterfat 11.82% 2,384,159 $1.2438 /lb. 2,965,416.98 Total Class IV Milk 2.71% 15,480,051 $ 3,752,480.08
Producer Milk 100.00% 570,630,982 $ 71,483,461.15 Adjustments
Overage and Other Source $0.00Inventory Adjustments $4,549.32Producer butterfat at uniform butterfat price ($25,598,494.78)Location Adjustments to Producers $3,283,692.381/2 Unobligated Balance in P.S.F $260,562.32
Adjusted Pool Value $ 8.98039 $49,433,770.39Reserve for Producer Settlement Fund $ 0.04039 $222,327.12
Uniform Skim Milk Price per cwt. (Fulton County, Georgia): $8.94
Uniform Price per cwt. (Fulton County, Georgia) $13.07** At 3.5% butterfat test; for information purposes.
OTHER FEDERAL ORDERS: CLASS I AND UNIFORM PRICES (At 3.5% Butterfat)MARKET NAME CLASS I %
(Priced at) JUL 2009 AUG 2009 JUL 2009 JUL 2009Appalachian (Charlotte) $ 13.66 $ 13.44 $ 12.66 $ 12.92 69.81%Arizona (Phoenix $ 12.61 $ 12.39 $ 10.95 $ 11.10 38.47%Central (Kansas City) $ 12.26 $ 12.04 $ 10.70 $ 10.76 28.32%Florida (Tampa) $ 15.66 $ 15.44 $ 14.96 $ 15.08 88.91%Mideast (Cleveland) $ 12.26 $ 12.04 $ 10.99 $ 10.07 37.90%Northeast (Boston) $ 13.51 $ 13.29 $ 11.93 $ 11.99 40.80%Pacific Northwest (Seattle) $ 12.16 $ 11.94 $ 10.70 $ 10.74 27.39%Southeast (Atlanta) $ 14.06 $ 13.84 $ 12.83 $ 13.07 66.92%Southwest (Dallas) $ 13.26 $ 13.04 $ 11.64 $ 11.77 35.30%Upper Midwest (Chicago) $ 12.06 $ 11.84 $ 10.29 $ 10.30 12.30%
Page 2
F.O. 7 - SOUTHEAST: CALCULATION OF UNIFORM PRICES - JULY 2009
Price per unit
CLASS I UNIFORM JUN 2009

Receipts: July 2009 July 2008Producer Milk
Class I 381,873,757 365,692,363Class II 62,765,842 64,437,674Class III 110,511,332 68,086,464Class IV 15,480,051 41,668,237
Total Producer Milk 570,630,982 539,884,738Average Butterfat Test 3.53% 3.55%
Percent of Producer Milk in Class I 66.92% 67.73%Daily Average Receipts 18,407,451 17,415,637
Other Source MilkClass I 5,727,562 6,392,106Class II 6,005,459 20,234,399Class III 2,225,230 10,925,375Class IV 4,265,955 3,685,429
Total Other Source Milk 18,224,206 41,237,309Overage
Class I 0 0Class II 0 0Class III 0 0Class IV 0 17,491
Total Overage 0 17,491Opening Inventory
Class I 30,608,261 28,635,085Class II 2,020,757 3,118,704Class III 3,093,014 2,887,400Class IV 11,270,760 18,365,481
Total Opening Inventory 46,992,792 53,006,670Total Receipts 635,847,980 634,146,208
Utilization:Class I Utilization
Inventory of Packaged FMP 33,788,319 32,465,841Route Disposition Class I 374,867,901 358,333,922Shrinkage 2,494,177 2,431,405Transfers & Diversions to Nonpool 7,059,183 7,488,386
Total Class I Utilization 418,209,580 400,719,554Average Butterfat Test 2.15% 2.13%
Daily Average Utilization 13,490,632 12,926,437Class II Utilization
Nonfluid Used To Produce 1,758,295 2,550,913Shrinkage 272,179 25,968Transfers & Diversions to Nonpool/Commercial Foods 44,860,354 43,334,547Used To Produce/Other Uses 23,901,230 41,879,349
Total Class II Utilization 70,792,058 87,790,777Average Butterfat Test 9.31% 8.80%
Class III UtilizationShrinkage 7,208,428 0Transfers & Diversions to Nonpool 103,809,612 81,899,239Used To Produce/Other Uses 4,811,536 0
Total Class III Utilization 115,829,576 81,899,239Average Butterfat Test 3.69% 3.98%
Class IV UtilizationInventory 12,545,036 14,469,650Nonfluid Used To Fortify 1,499,215 1,113,455Shrinkage 0 6,581,984Transfers & Diversions to Nonpool 16,972,515 37,026,739Used To Produce/Other Uses 0 4,544,810
Total Class IV Utilization 31,016,766 63,736,638Average Butterfat Test 10.67% 6.31%
Total Utilization 635,847,980 634,146,208
SOUTHEAST MILK MARKETING AREA-FEDERAL ORDER 7STATISTICAL SUMMARY
Page 3

Page 4
Packaged Class I Route Sales in Marketing Area Product Description Pounds Percent
June 2009 Whole Milk 138,728,066 35.11%Fat Free Milk 47,769,119 12.09%Lowfat Milk (incl. 1%) 29,496,650 7.46%Reduced Fat Milk (incl. 2%) 151,694,740 38.39%Cultured Fluid Milk (incl. Buttermilk) 7,958,467 2.01%Flavored Drinks and Milk 19,498,761 4.93%Total Disposition in Marketing Area 395,145,803 100.00% Total Disposition by Pool Plants 316,709,120 80.15%Total Disposition by Nonpool Plants 78,436,683 19.85%Total Disposition in Marketing Area 395,145,803 100.00%
Southeast Market Summary The minimum order uniform price for payment to producers supplying the Southeast Order
marketing area during July 2009 is $13.07 per hundredweight for milk with a 3.5% butterfat test in Fulton County, Georgia. This is .965 times the uniform skim milk price of $8.94 per hundredweight plus 3.5 times the uniform butterfat price of $1.2693 per pound. Payment to producers may be reduced by location differentials, if applicable, and by properly authorized deductions.
Uniform prices are the result of marketwide pooling; all producer milk was classified and priced according to the milk's use. In July, Class I use, which is primarily bottled or packaged fluid milk, accounted for 67.88% of all producer skim milk (priced to handlers at $6.03 per hundredweight, plus the Class I differential, see page 2) and 40.94% of producer butterfat (priced to handlers at $1.2682 per pound plus Class I differential). Class II use, which is milk used in fluid cream products and miscellaneous manufacturing, accounted for 10.42% of all producer skim milk ($6.73 per hundredweight) and 26.68% of producer butterfat ($1.2508 per pound). Class III use, mostly milk used to produce cheese, accounted for 19.32% of all producer skim milk ($5.82 per hundredweight) and 20.56% of producer butterfat ($1.2438 per pound). Class IV use, generally milk processed into butter and powder, accounted for 2.38% of all producer skim milk ($6.01 per hundredweight) and 11.82% of producer butterfat ($1.2438 per pound).
Receipts of producer milk during July 2009 totaled 570.6 million pounds. There were 25 regulated pool distributing plants, 3 pool supply plants and 11 cooperative associations submitting reports of receipts and utilization that were included in the computation of the uniform prices for July 2009. Class I route disposition in the area was 395.1 million pounds in June 2009.
USDA Increases Dairy Support Price • (…continued from page one) via the Dairy Product Price Support Program and payments to
producers under the Milk Income Loss Contract (MILC).
• On March 22, 2009, USDA reactivated USDA's Dairy Export Incentive Program (DEIP), to help U.S. dairy exporters meet prevailing world prices in addition to encouraging the development of international export markets in areas where U.S. dairy products are not competitive due to subsidized dairy products from other countries.
• Since March 22, USDA has encouraged the export of 20,000 tons of nonfat dry milk.
• From July 2008 through June 30, 2009, DEIP has announced allocations of 68,201 metric tons of nonfat dry milk; 21,097 metric tons of butterfat; 3,030 metric tons of various cheeses and 34 metric tons of other dairy products.
• USDA is working with the Department of State to identify foreign assistance programs such as U.S. Agency for International Development (USAID) and McGovern-Dole International Food for Education and Child Nutrition Program to make the significant amounts of nonfat dry milk available and induce, through competitive bids, the production of casein.

FEDERAL ORDER 7 - SOUTHEAST: CLASS AND UNIFORM PRICESPool CLASS I* CLASS II CLASS III CLASS IV UNIFORM*
Period Skim/cwt Bfat/lb @ 3.5 Skim/cwt Bfat/lb @ 3.5 Skim/cwt Bfat/lb @ 3.5 Skim/cwt Bfat/lb @ 3.5 Skim/cwt Bfat/lb @ 3.5Feb 2008 $18.54 $1.3970 $22.78 $14.39 $1.3080 $18.46 $12.93 $1.3010 $17.03 $ 10.48 $1.3010 $14.67 $ 16.81 $1.3355 $20.90Mar $15.64 $1.3448 $19.80 $11.24 $1.3674 $15.63 $13.72 $1.3604 $18.00 $ 9.75 $1.3604 $14.17 $ 14.55 $1.3561 $18.79Apr $17.49 $1.3793 $21.71 $10.47 $1.4818 $15.29 $12.02 $1.4748 $16.76 $ 9.74 $1.4748 $14.56 $ 15.46 $1.4418 $19.97May $15.70 $1.5043 $20.42 $10.40 $1.5632 $15.51 $13.20 $1.5562 $18.18 $ 10.17 $1.5562 $15.26 $ 14.74 $1.5368 $19.60Jun $16.97 $1.6005 $21.98 $10.89 $1.6230 $16.19 $15.12 $1.6160 $20.25 $ 10.64 $1.6160 $15.92 $ 15.72 $1.6095 $20.80Jul $19.50 $1.6466 $24.58 $11.31 $1.6844 $16.81 $12.82 $1.6774 $18.24 $ 11.12 $1.6774 $16.60 $ 17.46 $1.6650 $22.68Aug $16.85 $1.7184 $22.27 $11.74 $1.7483 $17.45 $11.63 $1.7413 $17.32 $ 10.93 $1.7413 $16.64 $ 15.74 $1.7316 $21.25Sep $15.78 $1.7791 $21.45 $11.59 $1.8266 $17.58 $10.27 $1.8196 $16.28 $ 9.41 $1.8196 $15.45 $ 14.84 $1.8024 $20.63Oct $13.56 $1.7831 $19.33 $10.46 $1.8577 $16.60 $10.97 $1.8507 $17.06 $ 7.40 $1.8507 $13.62 $ 13.03 $1.8230 $18.95Nov $15.09 $1.8768 $21.13 $8.52 $1.7800 $14.45 $9.64 $1.7730 $15.51 $ 6.26 $1.7730 $12.25 $ 13.33 $1.8125 $19.21Dec $13.29 $1.8305 $19.23 $6.88 $1.3068 $11.21 $11.12 $1.2998 $15.28 $ 6.01 $1.2998 $10.35 $ 12.01 $1.5024 $16.85Jan 2009 $15.04 $1.4363 $19.54 $6.74 $1.1154 $10.41 $7.15 $1.1084 $10.78 $ 5.92 $1.1084 $9.59 $ 12.77 $1.2288 $16.62Feb $10.87 $1.1520 $14.52 $6.63 $1.1011 $10.25 $5.68 $1.0941 $9.31 $ 5.82 $1.0941 $9.45 $ 9.65 $1.1155 $13.22Mar $9.61 $1.1298 $13.23 $6.51 $1.1664 $10.36 $6.61 $1.1594 $10.44 $ 5.78 $1.1594 $9.64 $8.75 $1.1495 $12.47Apr $10.36 $1.1880 $14.16 $6.47 $1.2119 $10.49 $6.80 $1.2049 $10.78 $ 5.81 $1.2049 $9.82 $ 9.27 $1.1992 $13.14May $10.81 $1.2399 $14.77 $6.49 $1.2718 $10.71 $5.61 $1.2648 $9.84 $ 5.92 $1.2648 $10.14 $ 9.13 $1.2567 $13.21Jun $9.71 $1.2897 $13.88 $6.61 $1.2614 $10.79 $5.78 $1.2544 $9.97 $ 6.04 $1.2544 $10.22 $ 8.70 $1.2677 $12.83Jul $9.83 $1.3062 $14.06 $6.73 $1.2508 $10.87 $5.82 $1.2438 $9.97 $ 6.01 $1.2438 $10.15 $ 8.94 $1.2693 $13.07Aug $9.80 $1.2529 $13.84 $6.70
Pool CLASS I CLASS II CLASS III CLASS IVPeriod 1000 lbs. % 1000 lbs. % 1000 lbs. % 1000 lbs. %
Feb 2008 389,276 64.22% 69,259 11.43% 94,584 15.61% 52,992 8.74%Mar 398,126 64.80% 83,411 13.58% 82,833 13.48% 49,999 8.14%Apr 388,115 63.76% 81,108 13.33% 100,604 16.53% 38,804 6.38%May 386,639 64.74% 79,323 13.28% 96,547 16.17% 34,668 5.81%Jun 346,682 70.25% 71,361 14.46% 27,363 5.54% 48,094 9.75%Jul 365,692 67.73% 64,438 11.94% 68,086 12.61% 41,668 7.72%Aug 398,922 72.09% 57,441 10.38% 51,033 9.22% 45,981 8.31%Sep 400,017 74.55% 52,644 9.81% 61,540 11.47% 22,397 4.17%Oct 414,863 73.62% 58,955 10.46% 64,708 11.48% 25,002 4.44%Nov 381,264 67.96% 59,573 10.62% 63,744 11.36% 56,464 10.06%Dec 404,358 66.68% 53,632 8.84% 75,350 12.42% 73,126 12.06%Jan 2009 413,503 68.14% 58,107 9.57% 73,691 12.14% 61,575 10.15%Feb 370,916 67.93% 57,125 10.46% 97,875 17.93% 20,079 3.68%Mar 411,467 60.71% 68,678 10.13% 131,319 19.38% 66,259 9.78%Apr 393,669 61.02% 62,288 9.65% 122,741 19.02% 66,498 10.31%May 379,284 57.18% 61,295 9.24% 155,016 23.37% 67,705 10.21%Jun 370,303 61.19% 63,971 10.57% 132,530 21.90% 38,350 6.34%Jul 381,874 66.92% 62,766 11.00% 110,511 19.37% 15,480 2.71%
3,073
493,500 2,6662,936
2,9052,933
563,528
606,466 2,974561,045 2,906
536,598
FEDERAL ORDER 7 - SOUTHEAST: POOLED RECEIPTS AND UTILIZATION OF PRODUCER MILKProducer Milk
1000 lbs. FarmsNumber of
606,111 2,989
608,631 2,943614,369
545,996 2,878
* Class I and uniform prices are at Fulton County (Atlanta), Georgia;** Estimated
2,948
539,885
597,176 2,956
553,377
606,876 2,914
570,631 3,000**
677,722 2,910645,197 2,968
605,153 2,958663,300 2,994
Class I Utilization
56%
58%
60%
62%
64%
66%
68%
70%
Jul-08 Jun-09Jul-09
Page 5

** The base rate for making partial payments in Fulton County, GA for August will be $11.76 per hundredweight. This is 90 percent of the preceding month’s uniform price of $13.07 per hundredweight.
Producer Touch Base Requirements & Handler Diversion Limits [per Order Amendment issued March 17, 2008]
Jan Feb Mar Apr May Jun Jul Aug Sep Oct Nov Dec Producer Touch Base Days 1 1 1 1 1 1 1 1 1 1 1 1 Diversion Percentage Limits 25% 25% 35% 35% 35% 35% 25% 25% 25% 25% 25% 35%
WASDE Dairy Report 1/
WASDE - 473 August 12, 2009 The milk production forecast is raised for 2009 and 2010 as the reduction in cow numbers is slower than expected and growth in output per cow is higher. Fat and skim-solids basis imports are raised as cheese imports have been stronger than expected; the commercial export forecast for 2009 is adjusted as higher exports in the first half are offset by lower second half exports. Exports for 2010 are lowered as higher domestic prices and larger exportable supplies in competitor countries limit export opportunities into 2010. CCC removals are adjusted to reflect changes in support prices for cheese and nonfat dry milk (NDM). Cheese and NDM price forecasts are raised for 2009 as higher support prices and increased net removals support domestic prices. Forecast cheese and NDM prices for 2010 are lowered as higher forecast production and weaker commercial exports increase domestic supplies. Butter and whey price forecasts are unchanged from last month. Both Class III and Class IV prices are forecast higher for 2009 reflecting higher forecast prices for cheese (Class III) and NDM (Class IV). Class price forecasts for 2010 are reduced as cheese and NDM prices are lowered. The all milk price is forecast at $12.10 to $12.30 per cwt for 2009 and $14.65 to $15.65 for 2010. 1/ The World Agricultural Supply and Demand Estimates (WASDE) report provides USDA's comprehensive forecasts of supply and demand for major U.S. and global crops and U.S. livestock, including dairy. The most recent WASDE report is available at www.usda.gov/oce/commodity/wasde/index.htm.
Southeast Marketing Area - Federal Order 7 Pool and Payment Dates for the Pooling Periods
August through October 2009 MA Payment Dates Payments for Producer Milk
Due to: Due From: Partial Payment** Due Final Payment Due Pool Month
Pool & Uniform Price Release
Date All Funds P/S & T-Credit Coop Nonmember Coop Nonmember
AUG 2009 09/11/09 09/14/09 09/15/09 08/25/09 08/26/09 09/15/09 09/16/09 SEP 2009 10/11/09 10/13/09 10/14/09 09/25/09 09/28/09 10/14/09 10/15/09 OCT 2009 11/11/09 11/12/09 11/13/09 10/26/09 10/26/09 11/13/09 11/16/09
"The U.S. Department of Agriculture (USDA) prohibits discrimination in all its programs and activities on the basis of race, color, national origin, age, disability, and where applicable, sex, marital status, familial status, parental status, religion, sexual orientation, genetic information, political beliefs, reprisal, or because all or a part of an individual's income is derived from any public assistance program. (Not all prohibited bases apply to all programs.) Persons with disabilities who require alternative means for communication of program information (Braille, large print, audiotape, etc.) should contact USDA's TARGET Center at (202) 720-2600 (voice and TDD). To file a complaint of discrimination write to USDA, Director, Office of Civil Rights, 1400 Independence Avenue, S.W., Washington, D.C. 20250-9410 or call (800) 795-3272 (voice) or (202) 720-6382 (TDD). USDA is an equal opportunity provider and employer."
MILK MARKET ADMINISTRATORU.S. Department Of Agriculture 1550 North Brown Road, Suite 120Lawrenceville, Georgia 30043
www.fmmatlanta.com

Uniform Price Increases The uniform price in Fulton County, GA, was
$13.30 per hundredweight of milk at 3.5 percent butterfat for the month of August. The uniform price is $0.23 higher than the previous month and is $7.95 per hundredweight lower compared with August of last year.
Class I utilization was 70.79 percent in Au-gust, an increase of 3.87 percent compared with the previous month and a decrease of 1.30 per-cent compared with August of last year.
National Dairy Situation The USDA estimates that the total U.S.
production of milk in July was 16.0 billion pounds, an increase of 0.03 percent from July 2008 and a decrease of 2.9 percent when compared with June 2009 on a daily average ba-sis. Total cheese output (excluding cottage cheese) was 839 million pounds, 2.0 percent above July 2008 and 2.5 percent less than June 2009 on a daily average basis. Butter production was 112 million pounds, 2.2 percent below July 2008 and 13.3 percent below June 2009 on a daily average basis.
Nonfat dry milk powder production was 132 million pounds in July, a 2.0 percent decrease compared with July 2008 and a 11.3 percent de-crease compared to June 2009 on a daily aver-age basis. Dry whey production was 93 million pounds in July, an increase of 2.0 percent com-pared with July 2008 and 2.5 percent lower com-pared to June 2009 on a daily average basis.
Market Information BULLETIN
ISSUED FOR THE INFORMATION OF PRODUCERS WHO ARE NOT MEMBERS OF COOPERATIVE ASSOCIATIONS
Sue L. Mosley, Market Administrator
www.fmmatlanta.com
Southeast Marketing Area Federal Order 7
Volume 10—No. 9 September 2009
USDA Establishes Dairy Advisory Committee and Requests Nominations
Agriculture Secretary Tom Vilsack has an-nounced that as part of USDA's continuing efforts to listen to and respond to the needs of producers in the dairy industry he is moving forward on estab-lishing the Dairy Industry Advisory Committee and is requesting nominations.
Secretary Vilsack promised to move forward with establishment of a charter creating the com-mittee for two years. Once appointed, the commit-tee will review the issues of farm milk price volatil-ity, and dairy farmer profitability. The committee will also offer suggestions and ideas on how USDA can best address these issues to meet the dairy industry's needs. USDA is establishing the commit-tee under the authority of the Federal Advisory Committee Act of 1972.
The Secretary of Agriculture will appoint up to 15 representatives of the dairy industry to serve in an advisory capacity on the Committee. Represen-tatives will include: producers and producer organi-zations, processors and processor organizations, handlers, consumers, academia, retailers, and state agencies involved in organic and non-organic dairy at the local, regional, national and interna-tional levels.
Written nominations must be received on or be-fore September 28, and should be sent to Judith Lindsay, secretary to Brandon Willis, Deputy Ad-ministrator, Farm Service Agency, Farm Programs, USDA Room 3612-S, Stop 0501, Washington, D.C. 20250-0501; faxed to (202) 720-4726; or e-mailed to: [email protected].
Advisory committee members will elect the chairperson and vice-chairperson who will each serve a two-year term. The announcement was published in the August 28 Federal Register and more details are available at: www.ams.usda.gov/AMSv1.0/DairyAdvisoryCommittee.
Transportation Credit Update The available balance in the Federal Order 7
transportation credit balancing fund for August 2009 was $3,814,038.01. Preliminary claims were made for $3,003,838.90. Since sufficient funds were available, all eligible claims were paid in full.

Calculation of Uniform Butterfat Price:Utilization Pounds Price/lb. Value
Class I Butterfat 39.78% 8,090,493 $1.2149 $ 9,829,139.94 Class I Differential at Location 272,013.05 Class II Butterfat 27.57% 5,607,705 $1.2561 7,043,838.23 Class III Butterfat 15.13% 3,076,101 $1.2491 3,842,357.74 Class IV Butterfat 17.52% 3,562,233 $1.2491 4,449,585.27
Total Butterfat 100.00% 20,336,532 $ 25,436,934.23
Uniform Butterfat Price per lb. (Fulton County, Georgia): $1.2508
Calculation of Uniform Skim Milk PriceProducer Milk Utilization Pounds ValueClass I Skim Milk 71.94% 394,628,244 $6.00 /cwt. $ 23,677,694.64 Class I Butterfat 39.78% 8,090,493 $1.2149 /lb. 9,829,139.94 Class I Differential at Location 402,718,737 13,540,667.72 Total Class I Milk 70.79% 402,718,737 $ 47,047,502.30 Class II Skim Milk 9.96% 54,646,195 $6.70 /cwt. $ 3,661,295.05 Class II Butterfat 27.57% 5,607,705 $1.2561 /lb. 7,043,838.23 Total Class II Milk 10.59% 60,253,900 $ 10,705,133.28 Class III Skim Milk 10.29% 56,458,520 $7.08 /cwt. $ 3,997,263.23 Class III Butterfat 15.13% 3,076,101 $1.2491 /lb. 3,842,357.74 Total Class III Milk 10.46% 59,534,621 $ 7,839,620.97 Class IV Skim Milk 7.81% 42,871,689 $6.23 /cwt. $ 2,670,906.25 Class IV Butterfat 17.52% 3,562,233 $1.2491 /lb. 4,449,585.27 Total Class IV Milk 8.16% 46,433,922 $ 7,120,491.52
Producer Milk 100.00% 568,941,180 $ 72,712,748.07 Adjustments
Overage and Other Source $9,464.24Inventory Adjustments $11,067.99Producer butterfat at uniform butterfat price ($25,436,934.23)Location Adjustments to Producers $3,434,674.791/2 Unobligated Balance in P.S.F $277,426.61
Adjusted Pool Value $ 9.29785 $51,008,447.47Reserve for Producer Settlement Fund $ 0.04785 $262,517.53
Uniform Skim Milk Price per cwt. (Fulton County, Georgia): $9.25
Uniform Price per cwt. (Fulton County, Georgia) $13.30** At 3.5% butterfat test; for information purposes.
OTHER FEDERAL ORDERS: CLASS I AND UNIFORM PRICES (At 3.5% Butterfat)MARKET NAME CLASS I %
(Priced at) AUG 2009 SEPT 2009 AUG 2009 AUG 2009Appalachian (Charlotte) $ 13.44 $ 14.33 $ 12.92 $ 12.86 71.94%Arizona (Phoenix $ 12.39 $ 13.28 $ 11.10 $ 11.55 39.51%Central (Kansas City) $ 12.04 $ 12.93 $ 10.76 $ 11.24 35.28%Florida (Tampa) $ 15.44 $ 16.33 $ 15.08 $ 14.88 87.05%Mideast (Cleveland) $ 12.04 $ 12.93 $ 10.07 $ 11.47 40.50%Northeast (Boston) $ 13.29 $ 14.18 $ 11.99 $ 12.35 42.60%Pacific Northwest (Seattle) $ 11.94 $ 12.83 $ 10.74 $ 11.25 29.00%Southeast (Atlanta) $ 13.84 $ 14.73 $ 13.07 $ 13.30 70.79%Southwest (Dallas) $ 13.04 $ 13.93 $ 11.77 $ 12.34 41.01%Upper Midwest (Chicago) $ 11.84 $ 12.73 $ 10.30 $ 11.32 13.40%
Page 2
F.O. 7 - SOUTHEAST: CALCULATION OF UNIFORM PRICES - AUGUST 2009
Price per unit
CLASS I UNIFORM JUL 2009

Receipts: August 2009 August 2008Producer Milk
Class I 402,718,737 398,921,757Class II 60,253,900 57,441,093Class III 59,534,621 51,033,115Class IV 46,433,922 45,981,186
Total Producer Milk 568,941,180 553,377,151Average Butterfat Test 3.57% 3.57%
Percent of Producer Milk in Class I 70.79% 72.09%Daily Average Receipts 18,352,941 17,850,876
Other Source MilkClass I 8,494,537 7,628,787Class II 4,471,064 18,418,070Class III 1,969,307 2,068,413Class IV 4,429,157 5,579,266
Total Other Source Milk 19,364,065 33,694,536Overage
Class I 0 0Class II 1,999 0Class III 0 0Class IV 111,610 122,154
Total Overage 113,609 122,154Opening Inventory
Class I 34,056,350 32,495,840Class II 487,545 453,095Class III 691,297 31,004Class IV 11,366,194 13,871,030
Total Opening Inventory 46,601,386 46,850,969Total Receipts 635,020,240 634,044,810
Utilization:Class I Utilization
Inventory of Packaged FMP 31,550,827 31,973,462Route Disposition Class I 401,854,334 396,308,313Shrinkage 1,823,134 3,045,652Transfers & Diversions to Nonpool 10,041,329 7,718,957
Total Class I Utilization 445,269,624 439,046,384Average Butterfat Test 2.01% 2.07%
Daily Average Utilization 14,363,536 14,162,787Class II Utilization
Nonfluid Used To Produce 1,221,499 2,135,315Shrinkage 216,651 3,418Transfers & Diversions to Nonpool/Commercial Foods 41,557,919 36,062,238Used To Produce/Other Uses 22,218,439 38,111,287
Total Class II Utilization 65,214,508 73,312,258Average Butterfat Test 9.65% 8.83%
Class III UtilizationShrinkage 0 0Transfers & Diversions to Nonpool 62,195,225 53,132,532Used To Produce/Other Uses 0 0
Total Class III Utilization 62,195,225 53,132,532Average Butterfat Test 5.12% 5.00%
Class IV UtilizationInventory 21,722,583 22,649,078Nonfluid Used To Fortify 1,617,532 1,395,729Shrinkage 7,381,985 7,517,375Transfers & Diversions to Nonpool 26,919,026 29,494,732Used To Produce/Other Uses 4,699,757 4,496,722
Total Class IV Utilization 62,340,883 65,553,636Average Butterfat Test 7.13% 7.10%
Total Utilization 635,020,240 634,044,810
SOUTHEAST MILK MARKETING AREA-FEDERAL ORDER 7STATISTICAL SUMMARY
Page 3

Page 4
Packaged Class I Route Sales in Marketing Area Product Description Pounds Percent
July 2009 Whole Milk 143,241,110 35.40%Fat Free Milk 48,892,105 12.08%Lowfat Milk (incl. 1%) 29,668,321 7.33%Reduced Fat Milk (incl. 2%) 156,330,831 38.64%Cultured Fluid Milk (incl. Buttermilk) 8,298,449 2.05%Flavored Drinks and Milk 18,148,516 4.49%Total Disposition in Marketing Area 404,579,332 100.00% Total Disposition by Pool Plants 327,703,426 81.00%Total Disposition by Nonpool Plants 76,875,906 19.00%Total Disposition in Marketing Area 404,579,332 100.00%
Southeast Market Summary The minimum order uniform price for payment to producers supplying the Southeast Order marketing
area during August 2009 is $13.30 per hundredweight for milk with a 3.5% butterfat test in Fulton County, Georgia. This is .965 times the uniform skim milk price of $9.25 per hundredweight plus 3.5 times the uniform butterfat price of $1.2508 per pound. Payment to producers may be reduced by location differentials, if applicable, and by properly authorized deductions.
Uniform prices are the result of marketwide pooling; all producer milk was classified and priced according to the milk's use. In August, Class I use, which is primarily bottled or packaged fluid milk, accounted for 71.94% of all producer skim milk (priced to handlers at $6.00 per hundredweight, plus the Class I differential, see page 2) and 39.78% of producer butterfat (priced to handlers at $1.2149 per pound plus Class I differential). Class II use, which is milk used in fluid cream products and miscellaneous manufacturing, accounted for 9.96% of all producer skim milk ($6.70 per hundredweight) and 27.57% of producer butterfat ($1.2561 per pound). Class III use, mostly milk used to produce cheese, accounted for 10.29% of all producer skim milk ($7.08 per hundredweight) and 15.13% of producer butterfat ($1.2491 per pound). Class IV use, generally milk processed into butter and powder, accounted for 7.81% of all producer skim milk ($6.23 per hundredweight) and 17.52% of producer butterfat ($1.2491 per pound).
Receipts of producer milk during August 2009 totaled 568.9 million pounds. There were 25 regulated pool distributing plants, 3 pool supply plants and 11 cooperative associations submitting reports of receipts and utilization that were included in the computation of the uniform prices for August 2009. Class I route disposition in the area was 404.6 million pounds in July 2009.
Mailbox Milk Prices, January through June 2009 Reporting Area 1/ Jan-09 Feb-09 Mar-09 Apr-09 May-09 Jun-09 New England States 3/ $14.95 $12.46 $12.25 $12.66 $12.65 $12.27 Eastern Pennsylvania 4/ $14.45 $11.98 $11.76 $12.16 $12.14 $11.73 Appalachian States 5/ $16.55 $13.20 $12.25 $12.70 $12.78 $12.36 Southeast States 6/ $17.05 $13.76 $12.47 $13.08 $13.15 $12.85 Southern Missouri 7/ $14.98 $11.69 $10.78 $11.09 $10.77 $10.77 Florida $18.39 $14.97 $13.61 $14.34 $14.70 $14.07 Western Pennsylvania 8/ $14.37 $11.89 $11.61 $12.07 $11.86 $11.53 Indiana $14.86 $12.00 $11.34 $11.76 $12.00 $11.37 Wisconsin $12.94 $11.24 $11.87 $12.17 $11.40 $11.24 Corn Belt States 9/ $13.61 $11.33 $11.43 $11.62 $11.33 $10.96 Western Texas 10/ $12.98 $10.73 $10.73 $11.07 $10.59 $10.20 Northwest States 11/ $12.75 $10.66 $10.95 $11.29 $10.87 $10.55 All Federal Orders 12/ $13.77 $11.61 $11.60 $11.96 $11.61 $11.27 California 13/ $10.57 $9.80 $9.92 $9.88 $9.70 $9.63
Source: Dairy Market News; 1/ Information is shown for those areas for which prices are reported for at least 75% of the milk marketed under Federal milk orders. 2/ Net pay price received by dairy farmers for milk. 3/ Includes Connecticut, Maine, Massachusetts, New Hampshire, Rhode Island, and Vermont. 4/ All the counties to the east of those listed in 8/. 5/ Includes Kentucky, North Carolina, South Carolina, Tennessee, and Virginia. 6/ Includes Alabama, Arkansas, Georgia, Louisiana, and Mississippi. 7/ The counties of Vernon, Cedar, Polk, Dallas, Laclede, Texas, Dent, Crawford, Washington, St. Francois, and Perry and all those to the south of these. 8/ The counties of Warren, Elk, Clearfield, Indiana, Westmoreland, and Fayette, and all those to the west of these. 9/ Includes Kansas, Nebraska and the Missouri counties to the north of those listed in 7/. 10/ All counties to the west of Fanin, Hunt, Van Zandt, Henderson, Anderson, Houston, Cherokee, Nacogdoches, and Shelby. 11/ Includes Oregon and Washington. 12/ Weighted average of the information for all selected reporting areas in Federal milk orders. 13/ Calculated by CA Department of Food and Agriculture.

FEDERAL ORDER 7 - SOUTHEAST: CLASS AND UNIFORM PRICESPool CLASS I* CLASS II CLASS III CLASS IV UNIFORM*
Period Skim/cwt Bfat/lb @ 3.5 Skim/cwt Bfat/lb @ 3.5 Skim/cwt Bfat/lb @ 3.5 Skim/cwt Bfat/lb @ 3.5 Skim/cwt Bfat/lb @ 3.5May 2008 $15.70 $1.5043 $20.42 $10.40 $1.5632 $15.51 $13.20 $1.5562 $18.18 $ 10.17 $1.5562 $15.26 $ 14.74 $1.5368 $19.60Jun $16.97 $1.6005 $21.98 $10.89 $1.6230 $16.19 $15.12 $1.6160 $20.25 $ 10.64 $1.6160 $15.92 $ 15.72 $1.6095 $20.80Jul $19.50 $1.6466 $24.58 $11.31 $1.6844 $16.81 $12.82 $1.6774 $18.24 $ 11.12 $1.6774 $16.60 $ 17.46 $1.6650 $22.68Aug $16.85 $1.7184 $22.27 $11.74 $1.7483 $17.45 $11.63 $1.7413 $17.32 $ 10.93 $1.7413 $16.64 $ 15.74 $1.7316 $21.25Sep $15.78 $1.7791 $21.45 $11.59 $1.8266 $17.58 $10.27 $1.8196 $16.28 $ 9.41 $1.8196 $15.45 $ 14.84 $1.8024 $20.63Oct $13.56 $1.7831 $19.33 $10.46 $1.8577 $16.60 $10.97 $1.8507 $17.06 $ 7.40 $1.8507 $13.62 $ 13.03 $1.8230 $18.95Nov $15.09 $1.8768 $21.13 $8.52 $1.7800 $14.45 $9.64 $1.7730 $15.51 $ 6.26 $1.7730 $12.25 $ 13.33 $1.8125 $19.21Dec $13.29 $1.8305 $19.23 $6.88 $1.3068 $11.21 $11.12 $1.2998 $15.28 $ 6.01 $1.2998 $10.35 $ 12.01 $1.5024 $16.85Jan 2009 $15.04 $1.4363 $19.54 $6.74 $1.1154 $10.41 $7.15 $1.1084 $10.78 $ 5.92 $1.1084 $9.59 $ 12.77 $1.2288 $16.62Feb $10.87 $1.1520 $14.52 $6.63 $1.1011 $10.25 $5.68 $1.0941 $9.31 $ 5.82 $1.0941 $9.45 $ 9.65 $1.1155 $13.22Mar $9.61 $1.1298 $13.23 $6.51 $1.1664 $10.36 $6.61 $1.1594 $10.44 $ 5.78 $1.1594 $9.64 $8.75 $1.1495 $12.47Apr $10.36 $1.1880 $14.16 $6.47 $1.2119 $10.49 $6.80 $1.2049 $10.78 $ 5.81 $1.2049 $9.82 $ 9.27 $1.1992 $13.14May $10.81 $1.2399 $14.77 $6.49 $1.2718 $10.71 $5.61 $1.2648 $9.84 $ 5.92 $1.2648 $10.14 $ 9.13 $1.2567 $13.21Jun $9.71 $1.2897 $13.88 $6.61 $1.2614 $10.79 $5.78 $1.2544 $9.97 $ 6.04 $1.2544 $10.22 $ 8.70 $1.2677 $12.83Jul $9.83 $1.3062 $14.06 $6.73 $1.2508 $10.87 $5.82 $1.2438 $9.97 $ 6.01 $1.2438 $10.15 $ 8.94 $1.2693 $13.07Aug $9.80 $1.2529 $13.84 $6.70 $1.2561 $10.86 $7.08 $1.2491 $11.20 $ 6.23 $1.2491 $10.38 $ 9.25 $1.2508 $13.30Sep $10.54 $1.3026 $14.73 $6.95
Pool CLASS I CLASS II CLASS III CLASS IVPeriod 1000 lbs. % 1000 lbs. % 1000 lbs. % 1000 lbs. %
May 2008 386,639 64.74% 79,323 13.28% 96,547 16.17% 34,668 5.81%Jun 346,682 70.25% 71,361 14.46% 27,363 5.54% 48,094 9.75%Jul 365,692 67.73% 64,438 11.94% 68,086 12.61% 41,668 7.72%Aug 398,922 72.09% 57,441 10.38% 51,033 9.22% 45,981 8.31%Sep 400,017 74.55% 52,644 9.81% 61,540 11.47% 22,397 4.17%Oct 414,863 73.62% 58,955 10.46% 64,708 11.48% 25,002 4.44%Nov 381,264 67.96% 59,573 10.62% 63,744 11.36% 56,464 10.06%Dec 404,358 66.68% 53,632 8.84% 75,350 12.42% 73,126 12.06%Jan 2009 413,503 68.14% 58,107 9.57% 73,691 12.14% 61,575 10.15%Feb 370,916 67.93% 57,125 10.46% 97,875 17.93% 20,079 3.68%Mar 411,467 60.71% 68,678 10.13% 131,319 19.38% 66,259 9.78%Apr 393,669 61.02% 62,288 9.65% 122,741 19.02% 66,498 10.31%May 379,284 57.18% 61,295 9.24% 155,016 23.37% 67,705 10.21%Jun 370,303 61.19% 63,971 10.57% 132,530 21.90% 38,350 6.34%Jul 381,874 66.92% 62,766 11.00% 110,511 19.37% 15,480 2.71%Aug 402,719 70.79% 60,254 10.59% 59,535 10.46% 46,434 8.16%568,941 2,900**
3,073
493,500 2,6662,936
2,9052,933
563,528
606,466
FEDERAL ORDER 7 - SOUTHEAST: POOLED RECEIPTS AND UTILIZATION OF PRODUCER MILKProducer Milk
1000 lbs. FarmsNumber of
545,996 2,878
* Class I and uniform prices are at Fulton County (Atlanta), Georgia;** Estimated
539,885
570,631 2,811
677,722 2,910645,197 2,968
597,176 2,956
553,377
606,876 2,9142,974
561,045 2,906
536,598
605,153 2,958663,300 2,994
Class I Utilization
60%
62%
64%
66%
68%
70%
72%
74%
76%
Aug-08 Jul-09Aug-09
Page 5

** The base rate for making partial payments in Fulton County, GA for September will be $11.97 per hundredweight. This is 90 percent of the preceding month’s uniform price of $13.30 per hundredweight.
Producer Touch Base Requirements & Handler Diversion Limits [per Order Amendment issued March 17, 2008]
Jan Feb Mar Apr May Jun Jul Aug Sep Oct Nov Dec Producer Touch Base Days 1 1 1 1 1 1 1 1 1 1 1 1 Diversion Percentage Limits 25% 25% 35% 35% 35% 35% 25% 25% 25% 25% 25% 35%
WASDE Dairy Report 1/
WASDE - 474 September 11, 2009
The milk production forecast is raised for 2009 and 2010 as milk per cow is forecast higher. Lower feed costs and plentiful supplies of alfalfa hay into 2010 are expected to support increased feeding of higher quality rations. Imports for 2009 are raised as fat-based product imports have been stronger than expected; the commercial export forecast for 2009 is raised as cheese shipments have been firm. Net removals are adjusted to reflect lower expected sales to CCC in 2009. Class III and IV price forecasts are reduced for 2009 due to weaker butter and whey prices. Cheese and nonfat dry milk (NDM) prices are unchanged. The Class III price forecast for 2010 is unchanged; the Class IV price is reduced due to lower butter and NDM prices. The all milk price is forecast at $12.05 to $12.25 per cwt for 2009 and $14.55 to $15.55 for 2010.
1/ The World Agricultural Supply and Demand Estimates (WASDE) report provides USDA's comprehensive forecasts of supply and demand for major U.S. and global crops and U.S. livestock, including dairy. The most recent WASDE report is available at www.usda.gov/oce/commodity/wasde/index.htm.
Southeast Marketing Area - Federal Order 7 Pool and Payment Dates for the Pooling Periods
September through November 2009 MA Payment Dates Payments for Producer Milk
Due to: Due From: Partial Payment** Due Final Payment Due Pool Month
Pool & Uniform Price Release
Date All Funds P/S & T-Credit Coop Nonmember Coop Nonmember
SEP 2009 10/11/09 10/13/09 10/14/09 09/25/09 09/28/09 10/14/09 10/15/09 OCT 2009 11/11/09 11/12/09 11/13/09 10/26/09 10/26/09 11/13/09 11/16/09 NOV 2009 12/11/09 12/14/09 12/15/09 11/25/09 11/27/09 12/15/09 12/16/09
"The U.S. Department of Agriculture (USDA) prohibits discrimination in all its programs and activities on the basis of race, color, national origin, age, disability, and where applicable, sex, marital status, familial status, parental status, religion, sexual orientation, genetic information, political beliefs, reprisal, or because all or a part of an individual's income is derived from any public assistance program. (Not all prohibited bases apply to all programs.) Persons with disabilities who require alternative means for communication of program information (Braille, large print, audiotape, etc.) should contact USDA's TARGET Center at (202) 720-2600 (voice and TDD). To file a complaint of discrimination write to USDA, Director, Office of Civil Rights, 1400 Independence Avenue, S.W., Washington, D.C. 20250-9410 or call (800) 795-3272 (voice) or (202) 720-6382 (TDD). USDA is an equal opportunity provider and employer."
MILK MARKET ADMINISTRATORU.S. Department Of Agriculture 1550 North Brown Road, Suite 120Lawrenceville, Georgia 30043
www.fmmatlanta.com

Uniform Price Increases The uniform price in Fulton County, GA,
was $14.12 per hundredweight of milk at 3.5 percent butterfat for the month of September. The uniform price is $0.82 higher than the pre-vious month and is $6.51 per hundredweight lower compared with September of last year.
Class I utilization was 73.08 percent in September, an increase of 2.29 percent com-pared with the previous month and a decrease of 1.47 percent compared with September of the previous year.
National Dairy Situation The USDA estimates that the total U.S.
production of milk in August was 15.7 billion pounds, a decrease of 0.3 percent from August 2008 and a decrease of 1.7 percent when compared with July 2009. Total cheese output (excluding cottage cheese) was 850 million pounds, 2.6 percent above August 2008 and 1.0 percent above July 2009. Butter production was 100 million pounds, 13.6 percent below August 2008 and 12.3 percent below July 2009. Nonfat dry milk powder production was 106 million pounds in August, an 8.3 percent decrease compared with August 2008 and a 20.0 percent decrease compared to July 2009. Dry whey production was 92.2 million pounds in August, an increase of 3.3 percent com-pared with August 2008 and 3.8 percent lower compared to the previous month.
Market Information BULLETIN
ISSUED FOR THE INFORMATION OF PRODUCERS WHO ARE NOT MEMBERS OF COOPERATIVE ASSOCIATIONS
Sue L. Mosley, Market Administrator
www.fmmatlanta.com
Southeast Marketing Area Federal Order 7
Volume 10—No. 10 October 2009
USDA’s Current Dairy Outlook The World Agricultural Supply and Demand Esti-
mates (WASDE) report provides USDA's comprehen-sive forecasts of supply and demand for major U.S. and global crops and U.S. livestock, including dairy. Excerpts from the October 9, 2009 WASDE report (No. 475) are reprinted below and also available at www.usda.gov/oce/commodity/wasde.
“The milk production forecast is raised for 2009 and 2010 as milk per cow is forecast higher and the rate of decline in cow inventories is lowered in 2010. Import forecasts are raised as butterfat and cheese imports are stronger than expected. Stronger world dairy prices and a weak U.S. dollar are expected to increase export demand for U.S. dairy products. The commercial fat basis export forecast is raised for 2010, and on a skim-solids basis, commercial exports are raised for both 2009 and 2010.
Net removals reflect adjustments in CCC and Dairy Export Incentive Program (DEIP) activities for nonfat dry milk (NDM), butter, and cheese. Firmer do-mestic and export demands are expected to support prices for cheese, whey, and NDM. However, butter prices are forecast lower as supplies remain large. Class III prices for 2009 and 2010 are raised from last month and Class IV prices are raised for 2009. The all milk price is forecast at $12.35 to $12.45 per cwt for 2009 and $14.70 to $15.60 for 2010.”
USDA Seeks Fluid Milk Board Nominations The USDA is asking fluid milk processors and
other interested parties to nominate candidates for the National Fluid Milk Processor Promotion Board. The Secretary of Agriculture will appoint seven indi-viduals to succeed members whose terms expire next year. Appointed members will serve 3-year terms from July 1, 2010 through June 30, 2013. To nomi-nate an individual by the October 31 deadline, call (202) 720-6909 or visit the Dairy Promotion and Re-search Branch’s website at www.ams.usda.gov/Dairy.
Transportation Credit Update Preliminary claims on the Federal Order 7
transportation credit balancing fund for Septem-ber 2009 were made for $3,350,522.06. Since the available balance was $2,000,542.65, eligible claims were paid at the rate of approximately $0.60 on the dollar.

Calculation of Uniform Butterfat Price:Utilization Pounds Price/lb. Value
Class I Butterfat 40.12% 7,948,087 $1.2646 $ 10,051,150.82 Class I Differential at Location 265,300.42 Class II Butterfat 29.48% 5,842,217 $1.2296 7,183,590.00 Class III Butterfat 18.39% 3,644,646 $1.2226 4,455,944.20 Class IV Butterfat 12.01% 2,379,775 $1.2226 2,909,512.96
Total Butterfat 100.00% 19,814,725 $ 24,865,498.40
Uniform Butterfat Price per lb. (Fulton County, Georgia): $1.2549
Calculation of Uniform Skim Milk PriceProducer Milk Utilization Pounds ValueClass I Skim Milk 74.33% 389,135,599 $6.74 /cwt. $ 26,227,739.35 Class I Butterfat 40.12% 7,948,087 $1.2646 /lb. 10,051,150.82 Class I Differential at Location 397,083,686 13,297,379.51 Total Class I Milk 73.08% 397,083,686 $ 49,576,269.68 Class II Skim Milk 12.16% 63,669,108 $6.95 /cwt. $ 4,425,003.00 Class II Butterfat 29.48% 5,842,217 $1.2296 /lb. 7,183,590.00 Total Class II Milk 12.79% 69,511,325 $ 11,608,593.00 Class III Skim Milk 11.41% 59,762,896 $8.12 /cwt. $ 4,852,747.17 Class III Butterfat 18.39% 3,644,646 $1.2226 /lb. 4,455,944.20 Total Class III Milk 11.67% 63,407,542 $ 9,308,691.37 Class IV Skim Milk 2.10% 10,980,039 $7.12 /cwt. $ 781,778.78 Class IV Butterfat 12.01% 2,379,775 $1.2226 /lb. 2,909,512.96 Total Class IV Milk 2.46% 13,359,814 $ 3,691,291.74
Producer Milk 100.00% 543,362,367 $ 74,184,845.79 Adjustments
Overage and Other Source $6,839.22Inventory Adjustments $77,571.83Producer butterfat at uniform butterfat price ($24,865,498.40)Location Adjustments to Producers $3,354,515.901/2 Unobligated Balance in P.S.F $261,362.25
Adjusted Pool Value $ 10.12699 $53,019,636.59Reserve for Producer Settlement Fund $ 0.04699 $246,034.25
Uniform Skim Milk Price per cwt. (Fulton County, Georgia): $10.08
Uniform Price per cwt. (Fulton County, Georgia) $14.12** At 3.5% butterfat test; for information purposes.
OTHER FEDERAL ORDERS: CLASS I AND UNIFORM PRICES (At 3.5% Butterfat)MARKET NAME CLASS I %
(Priced at) SEPT 2009 OCT 2009 SEPT 2009 SEPT 2009Appalachian (Charlotte) $ 14.33 $ 15.75 $ 12.86 $ 13.65 73.03%Arizona (Phoenix $ 13.28 $ 14.70 $ 11.55 $ 12.37 42.38%Central (Kansas City) $ 12.93 $ 14.35 $ 11.24 $ 11.90 40.09%Florida (Tampa) $ 16.33 $ 17.75 $ 14.88 $ 15.58 85.68%Mideast (Cleveland) $ 12.93 $ 14.35 $ 11.47 $ 12.07 43.70%Northeast (Boston) $ 14.18 $ 15.60 $ 12.35 $ 12.93 46.70%Pacific Northwest (Seattle) $ 12.83 $ 14.25 $ 11.25 $ 11.89 49.14%Southeast (Atlanta) $ 14.73 $ 16.15 $ 13.30 $ 14.12 73.08%Southwest (Dallas) $ 13.93 $ 15.35 $ 12.34 $ 13.02 43.09%Upper Midwest (Chicago) $ 12.73 $ 14.15 $ 11.32 $ 12.14 15.50%
Page 2
F.O. 7 - SOUTHEAST: CALCULATION OF UNIFORM PRICES - SEPTEMBER 2009
Price per unit
CLASS I UNIFORM AUG 2009

Receipts: September 2009 September 2008Producer Milk
Class I 397,083,686 400,016,879Class II 69,511,325 52,644,312Class III 63,407,542 61,539,910Class IV 13,359,814 22,396,817
Total Producer Milk 543,362,367 536,597,918Average Butterfat Test 3.65% 3.63%
Percent of Producer Milk in Class I 73.08% 74.55%Daily Average Receipts 18,112,079 17,886,597
Other Source MilkClass I 8,696,457 9,002,471Class II 5,384,392 17,536,760Class III 1,865,127 1,878,574Class IV 4,868,026 5,836,268
Total Other Source Milk 20,814,002 34,254,073Overage
Class I 0 0Class II 5,594 196,142Class III 0 0Class IV 0 17,301
Total Overage 5,594 213,443Opening Inventory
Class I 32,558,978 32,279,944Class II 2,918,757 1,403,576Class III 863,101 203,677Class IV 16,932,575 20,735,364
Total Opening Inventory 53,273,411 54,622,561Total Receipts 617,455,374 625,687,995
Utilization:Class I Utilization
Inventory of Packaged FMP 31,503,635 35,584,417Route Disposition Class I 394,723,964 395,443,285Shrinkage 2,425,719 2,405,766Transfers & Diversions to Nonpool 9,685,803 7,865,826
Total Class I Utilization 438,339,121 441,299,294Average Butterfat Test 1.98% 2.04%
Daily Average Utilization 14,611,304 14,709,976Class II Utilization
Nonfluid Used To Produce 1,295,228 2,448,147Shrinkage 6,720,578 0Transfers & Diversions to Nonpool/Commercial Foods 42,930,786 32,685,816Used To Produce/Other Uses 26,867,882 36,646,827
Total Class II Utilization 77,814,474 71,780,790Average Butterfat Test 8.33% 8.76%
Class III UtilizationShrinkage 0 0Transfers & Diversions to Nonpool 66,135,770 63,622,161Used To Produce/Other Uses 0 0
Total Class III Utilization 66,135,770 63,622,161Average Butterfat Test 5.64% 4.78%
Class IV UtilizationInventory 19,806,280 19,203,266Nonfluid Used To Fortify 1,613,363 1,338,979Shrinkage 0 7,385,465Transfers & Diversions to Nonpool 13,746,366 15,910,335Used To Produce/Other Uses 0 5,147,705
Total Class IV Utilization 35,166,009 48,985,750Average Butterfat Test 10.59% 9.54%
Total Utilization 617,455,374 625,687,995
SOUTHEAST MILK MARKETING AREA-FEDERAL ORDER 7STATISTICAL SUMMARY
Page 3

Page 4
Packaged Class I Route Sales in Marketing Area Product Description Pounds Percent
August 2009 Whole Milk 139,153,739 31.83%Fat Free Milk 51,036,397 11.67%Lowfat Milk (incl. 1%) 35,306,459 8.07%Reduced Fat Milk (incl. 2%) 160,102,245 36.62%Cultured Fluid Milk (incl. Buttermilk) 9,531,447 2.18%Flavored Drinks and Milk 42,107,228 9.63%Total Disposition in Marketing Area 437,237,515 100.00% Total Disposition by Pool Plants 352,897,266 80.71%Total Disposition by Nonpool Plants 84,340,249 19.29%Total Disposition in Marketing Area 437,237,515 100.00%
Southeast Market Summary The minimum order uniform price for payment to producers supplying the Southeast Order marketing
area during September 2009 is $14.12 per hundredweight for milk with a 3.5% butterfat test in Fulton County, Georgia. This is .965 times the uniform skim milk price of $10.08 per hundredweight plus 3.5 times the uniform butterfat price of $1.2549 per pound. Payment to producers may be reduced by location differentials, if applicable, and by properly authorized deductions.
Uniform prices are the result of marketwide pooling; all producer milk was classified and priced according to the milk's use. In September, Class I use, which is primarily bottled or packaged fluid milk, accounted for 74.33% of all producer skim milk (priced to handlers at $6.74 per hundredweight, plus the Class I differential, see page 2) and 40.12% of producer butterfat (priced to handlers at $1.2646 per pound plus Class I differential). Class II use, which is milk used in fluid cream products and miscellaneous manufacturing, accounted for 12.16% of all producer skim milk ($6.95 per hundredweight) and 29.48% of producer butterfat ($1.2296 per pound). Class III use, mostly milk used to produce cheese, accounted for 11.41% of all producer skim milk ($8.12 per hundredweight) and 18.39% of producer butterfat ($1.2226 per pound). Class IV use, generally milk processed into butter and powder, accounted for 2.10% of all producer skim milk ($7.12 per hundredweight) and 12.01% of producer butterfat ($1.2226 per pound).
Receipts of producer milk during September 2009 totaled 543.4 million pounds. There were 25 regulated pool distributing plants, 2 pool supply plants and 12 cooperative associations submitting reports of receipts and utilization that were included in the computation of the uniform prices for September 2009. Class I route disposition in the area was 437.2 million pounds in August 2009.
USDA Creates National Institute of Food and Agriculture On October 8, Agriculture Secretary Tom Vilsack launched the National Institute of Food and Agriculture
(NIFA) with a major speech regarding the role of science and research at USDA. The following are excerpts from Vilsack's prepared remarks:
"The opportunity to truly transform a field of science happens at best once a generation. Right now, I am convinced, is USDA's opportunity to work with the Congress, the other science agencies, and with our partners in industry, academia, and the nonprofit sector, to bring about transformative change. We can build on recent scientific discoveries - incredible advances in sequencing plant and animal genomes, for example. We have new and powerful tools -- biotechnology, nanotechnology, and large-scale computer simulations -- applicable to all types of agriculture.
"Formed in the main from the existing Cooperative State Research, Education, and Extension Service, NIFA will be the Department's extramural research enterprise. It is no exaggeration to say that NIFA will be a research "start-up" company - we will be rebuilding our competitive grants program from the ground up to generate real results for the American people.
“I want USDA science to focus most of its resources on accomplishing a few, bold outcomes with great power to improve human health and protect our environment:
• USDA science will support our ability to keep American agriculture competitive while ending world hunger. At a time when disruptive climate change threatens production of some of the world's staple foods, some of the biggest gains we can make in ending world hunger will involve development of stress-resistant crops.
(continued on pg. 6)

FEDERAL ORDER 7 - SOUTHEAST: CLASS AND UNIFORM PRICESPool CLASS I* CLASS II CLASS III CLASS IV UNIFORM*
Period Skim/cwt Bfat/lb @ 3.5 Skim/cwt Bfat/lb @ 3.5 Skim/cwt Bfat/lb @ 3.5 Skim/cwt Bfat/lb @ 3.5 Skim/cwt Bfat/lb @ 3.5Jul 2008 $19.50 $1.6466 $24.58 $11.31 $1.6844 $16.81 $12.82 $1.6774 $18.24 $ 11.12 $1.6774 $16.60 $ 17.46 $1.6650 $22.68Aug $16.85 $1.7184 $22.27 $11.74 $1.7483 $17.45 $11.63 $1.7413 $17.32 $ 10.93 $1.7413 $16.64 $ 15.74 $1.7316 $21.25Sep $15.78 $1.7791 $21.45 $11.59 $1.8266 $17.58 $10.27 $1.8196 $16.28 $ 9.41 $1.8196 $15.45 $ 14.84 $1.8024 $20.63Oct $13.56 $1.7831 $19.33 $10.46 $1.8577 $16.60 $10.97 $1.8507 $17.06 $ 7.40 $1.8507 $13.62 $ 13.03 $1.8230 $18.95Nov $15.09 $1.8768 $21.13 $8.52 $1.7800 $14.45 $9.64 $1.7730 $15.51 $ 6.26 $1.7730 $12.25 $ 13.33 $1.8125 $19.21Dec $13.29 $1.8305 $19.23 $6.88 $1.3068 $11.21 $11.12 $1.2998 $15.28 $ 6.01 $1.2998 $10.35 $ 12.01 $1.5024 $16.85Jan 2009 $15.04 $1.4363 $19.54 $6.74 $1.1154 $10.41 $7.15 $1.1084 $10.78 $ 5.92 $1.1084 $9.59 $ 12.77 $1.2288 $16.62Feb $10.87 $1.1520 $14.52 $6.63 $1.1011 $10.25 $5.68 $1.0941 $9.31 $ 5.82 $1.0941 $9.45 $ 9.65 $1.1155 $13.22Mar $9.61 $1.1298 $13.23 $6.51 $1.1664 $10.36 $6.61 $1.1594 $10.44 $ 5.78 $1.1594 $9.64 $8.75 $1.1495 $12.47Apr $10.36 $1.1880 $14.16 $6.47 $1.2119 $10.49 $6.80 $1.2049 $10.78 $ 5.81 $1.2049 $9.82 $ 9.27 $1.1992 $13.14May $10.81 $1.2399 $14.77 $6.49 $1.2718 $10.71 $5.61 $1.2648 $9.84 $ 5.92 $1.2648 $10.14 $ 9.13 $1.2567 $13.21Jun $9.71 $1.2897 $13.88 $6.61 $1.2614 $10.79 $5.78 $1.2544 $9.97 $ 6.04 $1.2544 $10.22 $ 8.70 $1.2677 $12.83Jul $9.83 $1.3062 $14.06 $6.73 $1.2508 $10.87 $5.82 $1.2438 $9.97 $ 6.01 $1.2438 $10.15 $ 8.94 $1.2693 $13.07Aug $9.80 $1.2529 $13.84 $6.70 $1.2561 $10.86 $7.08 $1.2491 $11.20 $ 6.23 $1.2491 $10.38 $ 9.25 $1.2508 $13.30Sep $10.54 $1.3026 $14.73 $6.95 $1.2296 $11.01 $8.12 $1.2226 $12.11 $ 7.12 $1.2226 $11.15 $ 10.08 $1.2549 $14.12Oct $12.23 $1.2421 $16.15 $7.71
Pool CLASS I CLASS II CLASS III CLASS IVPeriod 1000 lbs. % 1000 lbs. % 1000 lbs. % 1000 lbs. %
Jul 2008 365,692 67.73% 64,438 11.94% 68,086 12.61% 41,668 7.72%Aug 398,922 72.09% 57,441 10.38% 51,033 9.22% 45,981 8.31%Sep 400,017 74.55% 52,644 9.81% 61,540 11.47% 22,397 4.17%Oct 414,863 73.62% 58,955 10.46% 64,708 11.48% 25,002 4.44%Nov 381,264 67.96% 59,573 10.62% 63,744 11.36% 56,464 10.06%Dec 404,358 66.68% 53,632 8.84% 75,350 12.42% 73,126 12.06%Jan 2009 413,503 68.14% 58,107 9.57% 73,691 12.14% 61,575 10.15%Feb 370,916 67.93% 57,125 10.46% 97,875 17.93% 20,079 3.68%Mar 411,467 60.71% 68,678 10.13% 131,319 19.38% 66,259 9.78%Apr 393,669 61.02% 62,288 9.65% 122,741 19.02% 66,498 10.31%May 379,284 57.18% 61,295 9.24% 155,016 23.37% 67,705 10.21%Jun 370,303 61.19% 63,971 10.57% 132,530 21.90% 38,350 6.34%Jul 381,874 66.92% 62,766 11.00% 110,511 19.37% 15,480 2.71%Aug 402,719 70.79% 60,254 10.59% 59,535 10.46% 46,434 8.16%Sep 397,084 73.08% 69,511 12.79% 63,408 11.67% 13,360 2.46%
605,153 2,958663,300 2,994
606,876 2,9142,974
561,045 2,906
545,996 2,878
* Class I and uniform prices are at Fulton County (Atlanta), Georgia;** Estimated
539,885
570,631 2,811
677,722 2,910645,197 2,968
563,528
606,466
FEDERAL ORDER 7 - SOUTHEAST: POOLED RECEIPTS AND UTILIZATION OF PRODUCER MILKProducer Milk
1000 lbs. FarmsNumber of
553,377 536,598
3,0732,936
2,9052,933
543,362 2,850**568,941 2,803
Class I Utilization
62%
64%
66%
68%
70%
72%
74%
76%
78%
Sep-08 Aug-09Sep-09
Page 5

** The base rate for making partial payments in Fulton County, GA for October will be $12.71 per hundredweight. This is 90 percent of the preceding month’s uniform price of $14.12 per hundredweight.
Producer Touch Base Requirements & Handler Diversion Limits [per Order Amendment issued March 17, 2008]
Jan Feb Mar Apr May Jun Jul Aug Sep Oct Nov Dec Producer Touch Base Days 1 1 1 1 1 1 1 1 1 1 1 1 Diversion Percentage Limits 25% 25% 35% 35% 35% 35% 25% 25% 25% 25% 25% 35%
USDA Creates National Institute of Food and Agriculture (continued from pg. 4)
• USDA science will support our ability to improve nutrition and end child obesity. At USDA we want to take the nutrition and food choice insights we have gained from our science to test out some new approaches to school lunches, breakfast and our other nutrition assistance and education programs.
• USDA science will support our efforts to radically improve food safety for all Americans. Each year in the U.S. alone, food-borne pathogens like E. coli kill 5,000 people and sicken 75 million more; the cost to the economy from these infections exceeds $35 billion.
• USDA science will secure America's energy future. President Obama has set ambitious but achievable goals for securing America's energy future from new domestic sources, including 60 billion gallons a year from biofuels by 2030. We plan to focus specifically on rapidly improving the amount and quality of plant-based feedstocks that will be the source of biofuels.
• USDA science will make us better stewards of America's environment and natural resources. We believe that research in this priority area will identify agricultural operations in the United States that, within 10 years, will be net carbon sinks.”
Southeast Marketing Area - Federal Order 7 Pool and Payment Dates for the Pooling Periods
October through December 2009 MA Payment Dates Payments for Producer Milk
Due to: Due From: Partial Payment** Due Final Payment Due Pool Month
Pool & Uniform Price Release
Date All Funds P/S & T-Credit Coop Nonmember Coop Nonmember
OCT 2009 11/11/09 11/12/09 11/13/09 10/26/09 10/26/09 11/13/09 11/16/09 NOV 2009 12/11/09 12/14/09 12/15/09 11/25/09 11/27/09 12/15/09 12/16/09 DEC 2009 01/11/10 01/12/10 01/13/10 12/28/09 12/28/09 01/13/10 01/14/10
"The U.S. Department of Agriculture (USDA) prohibits discrimination in all its programs and activities on the basis of race, color, national origin, age, disability, and where applicable, sex, marital status, familial status, parental status, religion, sexual orientation, genetic information, political beliefs, reprisal, or because all or a part of an individual's income is derived from any public assistance program. (Not all prohibited bases apply to all programs.) Persons with disabilities who require alternative means for communication of program information (Braille, large print, audiotape, etc.) should contact USDA's TARGET Center at (202) 720-2600 (voice and TDD). To file a complaint of discrimination write to USDA, Director, Office of Civil Rights, 1400 Independence Avenue, S.W., Washington, D.C. 20250-9410 or call (800) 795-3272 (voice) or (202) 720-6382 (TDD). USDA is an equal opportunity provider and employer."
MILK MARKET ADMINISTRATORU.S. Department Of Agriculture 1550 North Brown Road, Suite 120Lawrenceville, Georgia 30043
www.fmmatlanta.com

Uniform Price Up $1.43 in October The uniform price in Fulton County, GA, was
$15.55 per hundredweight of milk at 3.5 percent butterfat for the month of October. The uniform price is $1.43 higher than the previous month and is $3.40 per hundredweight lower compared with October of last year.
Class I utilization was 74.01 percent in Octo-ber, an increase of 0.93 percent compared with the previous month and an increase of 0.39 per-cent compared with October 2008.
National Dairy Situation The USDA estimates that the total U.S.
production of milk in September was 15.0 billion pounds, a decrease of 0.7 percent from Sep-tember 2008 and a decrease of 1.4 percent when compared with August 2009 on a daily av-erage basis. Total cheese output was 845 mil-lion pounds, 4.4 percent above September 2008 and 2.9 percent above August 2009 on a daily average basis. Butter production was 94.6 mil-lion pounds, 21.9 percent below September 2008 and 3.1 percent below August 2009 on a daily average basis.
Nonfat dry milk powder production was 87.1 million pounds in September, a 1.8 percent above September 2008 and a 14.9 percent be-low August 2009 on a daily average basis. Dry whey production was 83.9 million pounds, 2.8 percent above September 2008 and 0.3 percent below August 2009 on a daily average basis.
Market Information BULLETIN
ISSUED FOR THE INFORMATION OF PRODUCERS WHO ARE NOT MEMBERS OF COOPERATIVE ASSOCIATIONS
Sue L. Mosley, Market Administrator
www.fmmatlanta.com
Southeast Marketing Area Federal Order 7
Volume 10—No. 11 November 2009
USDA Issues Recommended Decision on Pro-posed Amendments to all Federal Milk Orders
The U.S. Department of Agriculture has issued a recommended decision to adopt amendments to the producer-handler definition in all Federal milk mar-keting orders. This decision is based on testimony and evidence given at a public hearing held May 4 through May 19, 2009 in Cincinnati, Ohio.
The decision recommends that the producer-handler definitions of all Federal milk marketing or-ders be amended to limit exemption from pooling and pricing provisions of the orders to those pro-ducer-handlers with total route disposition of fluid milk products of 3 million pounds or less per month. The exempt plant definition would continue to limit disposition of Class I milk products to 150,000 pounds or less per month.
Interested persons have until December 21, 2009 to file comments in response to the decision. You may send your comments by using the Federal eRulemaking portal at www.regulations.gov. The recommended decision was published in the Octo-ber 21, 2009 Federal Register and available at www.fmmatlanta.com under ‘What’s New’. To re-quest that a copy of this recommended decision be mailed to you, please contact this office.
August Mailbox Prices According to Dairy Market News (vol. 76, report
45), in August 2009, mailbox milk prices for selected reporting areas in Federal milk orders averaged $12.04, up $0.74 from the previous month average, and down $6.54 from August 2008. Prices ranged from $15.37 in Florida to $10.51 in New Mexico, while the mailbox price reported for the Southeast area was $13.88, up $0.50 from last month.
Southern Dairy Conference 2010 The 36th Annual Southern Dairy Conference will
be held in Atlanta, GA on January 26-27, 2010. Go to www.southerndairyconference.farming.officelive.com for registration and other conference information.
Transportation Credit Update Preliminary claims on the Federal Order 7
transportation credit balancing fund for October 2009 were made for $3,729,682.18. Since the available balance was $1,254,841.87, eligible claims were paid at the rate of approximately $0.34 on the dollar.

Calculation of Uniform Butterfat Price:Utilization Pounds Price/lb. Value
Class I Butterfat 39.70% 8,427,381 $1.2041 $ 10,147,409.45 Class I Differential at Location 282,213.24 Class II Butterfat 27.60% 5,858,005 $1.2822 7,511,134.04 Class III Butterfat 17.69% 3,755,647 $1.2752 4,789,201.05 Class IV Butterfat 15.01% 3,187,236 $1.2752 4,064,363.35
Total Butterfat 100.00% 21,228,269 $ 26,794,321.13
Uniform Butterfat Price per lb. (Fulton County, Georgia): $1.2622
Calculation of Uniform Skim Milk PriceProducer Milk Utilization Pounds ValueClass I Skim Milk 75.35% 409,853,230 $8.43 /cwt. $ 34,550,627.29 Class I Butterfat 39.70% 8,427,381 $1.2041 /lb. 10,147,409.45 Class I Differential at Location 418,280,611 14,027,348.33 Total Class I Milk 74.01% 418,280,611 $ 58,725,385.07 Class II Skim Milk 10.07% 54,759,068 $7.71 /cwt. $ 4,221,924.15 Class II Butterfat 27.60% 5,858,005 $1.2822 /lb. 7,511,134.04 Total Class II Milk 10.73% 60,617,073 $ 11,733,058.19 Class III Skim Milk 11.07% 60,219,420 $8.66 /cwt. $ 5,215,001.76 Class III Butterfat 17.69% 3,755,647 $1.2752 /lb. 4,789,201.05 Total Class III Milk 11.32% 63,975,067 $ 10,004,202.81 Class IV Skim Milk 3.51% 19,105,333 $7.66 /cwt. $ 1,463,468.53 Class IV Butterfat 15.01% 3,187,236 $1.2752 /lb. 4,064,363.35 Total Class IV Milk 3.94% 22,292,569 $ 5,527,831.88
Producer Milk 100.00% 565,165,320 $ 85,990,477.95 Adjustments
Overage and Other Source $44,665.27Inventory Adjustments $17,596.04Producer butterfat at uniform butterfat price ($26,794,321.13)Location Adjustments to Producers $3,403,956.091/2 Unobligated Balance in P.S.F $330,245.39
Adjusted Pool Value $ 11.58087 $62,992,619.61Reserve for Producer Settlement Fund $ 0.04087 $222,283.90
Uniform Skim Milk Price per cwt. (Fulton County, Georgia): $11.54
Uniform Price per cwt. (Fulton County, Georgia) $15.55** At 3.5% butterfat test; for information purposes.
OTHER FEDERAL ORDERS: CLASS I AND UNIFORM PRICES (At 3.5% Butterfat)MARKET NAME CLASS I %
(Priced at) OCT 2009 NOV 2009 OCT 2009 OCT 2009Appalachian (Charlotte) $ 15.75 $ 16.26 $ 13.65 $ 15.05 73.52%Arizona (Phoenix $ 14.70 $ 15.21 $ 12.37 $ 13.38 40.26%Central (Kansas City) $ 14.35 $ 14.86 $ 11.90 $ 12.79 40.16%Florida (Tampa) $ 17.75 $ 18.26 $ 15.58 $ 17.23 88.40%Mideast (Cleveland) $ 14.35 $ 14.86 $ 12.07 $ 13.14 46.20%Northeast (Boston) $ 15.60 $ 16.11 $ 12.93 $ 14.06 48.90%Pacific Northwest (Seattle) $ 14.25 $ 14.76 $ 11.89 $ 12.86 30.89%Southeast (Atlanta) $ 16.15 $ 16.66 $ 14.12 $ 15.55 74.01%Southwest (Dallas) $ 15.35 $ 15.86 $ 13.02 $ 14.05 43.78%Upper Midwest (Chicago) $ 14.15 $ 14.66 $ 12.14 $ 12.94 14.20%
Page 2
F.O. 7 - SOUTHEAST: CALCULATION OF UNIFORM PRICES - OCTOBER 2009
Price per unit
CLASS I UNIFORM SEPT 2009

Receipts: October 2009 October 2008Producer Milk
Class I 418,280,611 414,862,742Class II 60,617,073 58,954,746Class III 63,975,067 64,708,100Class IV 22,292,569 25,001,990
Total Producer Milk 565,165,320 563,527,578Average Butterfat Test 3.76% 3.71%
Percent of Producer Milk in Class I 74.01% 73.62%Daily Average Receipts 18,231,139 18,178,309
Other Source MilkClass I 10,457,302 9,467,439Class II 5,264,197 6,113,911Class III 2,089,512 2,042,703Class IV 5,296,644 5,535,717
Total Other Source Milk 23,107,655 23,159,770Overage
Class I 0 0Class II 413,391 9,210Class III 0 185Class IV 36,586 22,370
Total Overage 449,977 31,765Opening Inventory
Class I 31,503,635 35,931,377Class II 1,043,662 2,627,526Class III 221,123 53,012Class IV 18,541,494 15,392,581
Total Opening Inventory 51,309,914 54,004,496Total Receipts 640,032,866 640,723,609
Utilization:Class I Utilization
Inventory of Packaged FMP 32,139,209 38,423,877Route Disposition Class I 412,345,927 407,798,040Shrinkage 3,560,422 3,641,909Transfers & Diversions to Nonpool 12,195,990 10,397,732
Total Class I Utilization 460,241,548 460,261,558Average Butterfat Test 2.00% 2.04%
Daily Average Utilization 14,846,502 14,847,147Class II Utilization
Nonfluid Used To Produce 1,307,438 1,741,971Shrinkage 0 0Transfers & Diversions to Nonpool/Commercial Foods 41,892,059 39,287,420Used To Produce/Other Uses 24,138,826 26,676,002
Total Class II Utilization 67,338,323 67,705,393Average Butterfat Test 10.37% 9.62%
Class III UtilizationShrinkage 0 0Transfers & Diversions to Nonpool 66,285,702 66,804,000Used To Produce/Other Uses 0 0
Total Class III Utilization 66,285,702 66,804,000Average Butterfat Test 5.79% 5.21%
Class IV UtilizationInventory 17,332,599 12,725,262Nonfluid Used To Fortify 1,854,027 1,513,590Shrinkage 7,368,069 7,808,811Transfers & Diversions to Nonpool 15,014,736 19,265,274Used To Produce/Other Uses 4,597,862 4,639,721
Total Class IV Utilization 46,167,293 45,952,658Average Butterfat Test 9.88% 10.25%
Total Utilization 640,032,866 640,723,609
SOUTHEAST MILK MARKETING AREA-FEDERAL ORDER 7STATISTICAL SUMMARY
Page 3

Page 4
Packaged Class I Route Sales in Marketing Area Product Description Pounds Percent
September 2009 Whole Milk 131,774,540 30.93%Fat Free Milk 48,683,483 11.43%Lowfat Milk (incl. 1%) 35,572,483 8.35%Reduced Fat Milk (incl. 2%) 153,135,125 35.95%Cultured Fluid Milk (incl. Buttermilk) 8,234,204 1.93%Flavored Drinks and Milk 48,593,049 11.41%Total Disposition in Marketing Area 425,992,884 100.00% Total Disposition by Pool Plants 346,951,373 81.45%Total Disposition by Nonpool Plants 79,041,511 18.55%Total Disposition in Marketing Area 425,992,884 100.00%
Southeast Market Summary The minimum order uniform price for payment to producers supplying the Southeast Order marketing
area during October 2009 is $15.55 per hundredweight for milk with a 3.5% butterfat test in Fulton County, Georgia. This is .965 times the uniform skim milk price of $11.54 per hundredweight plus 3.5 times the uniform butterfat price of $1.2622 per pound. Payment to producers may be reduced by location differentials, if applicable, and by properly authorized deductions.
Uniform prices are the result of marketwide pooling; all producer milk was classified and priced according to the milk's use. In October, Class I use, which is primarily bottled or packaged fluid milk, accounted for 75.35% of all producer skim milk (priced to handlers at $8.43 per hundredweight, plus the Class I differential, see page 2) and 39.70% of producer butterfat (priced to handlers at $1.2041 per pound plus Class I differential). Class II use, which is milk used in fluid cream products and miscellaneous manufacturing, accounted for 10.07% of all producer skim milk ($7.71 per hundredweight) and 27.60% of producer butterfat ($1.2822 per pound). Class III use, mostly milk used to produce cheese, accounted for 11.07% of all producer skim milk ($8.66 per hundredweight) and 17.69% of producer butterfat ($1.2752 per pound). Class IV use, generally milk processed into butter and powder, accounted for 3.51% of all producer skim milk ($7.66 per hundredweight) and 15.01% of producer butterfat ($1.2752 per pound).
Receipts of producer milk during October 2010 totaled 565.2 million pounds. There were 25 regulated pool distributing plants, 2 pool supply plants and 11 cooperative associations submitting reports of receipts and utilization that were included in the computation of the uniform prices for October 2009. Class I route disposition in the area was 426.0 million pounds in September 2009.
Release Dates for 2010 Federal Milk Order Price Data Listed below are the release dates for the Federal milk order program for price data applicable to January through
December 2010. For more details, visit www.fmmatlanta.com and click on “What’s New”.
Advanced Prices and Pricing Factors Class and Component Prices Month to Which
Prices Apply Release Date Time Period of NASS Prices 1/ Release Date Time Period of NASS
Prices 1/ January Dec. 18, 2009 12/5, 12 Feb. 5, 2010 1/2, 9, 16, 23, 30 February Jan. 22, 2010 1/9, 16 Mar. 5 2/6, 13, 20, 27 March Feb. 19 2/6, 13 Apr. 2 3/6, 13, 20, 27 April Mar. 19 3/6, 13 May. 30 4/3, 10, 17, 24 May May. 21 4/10, 17 Jun. 4 5/1, 8, 15, 22, 29 June Apr. 24 5/8, 15 Jul. 2 6/5, 12, 19, 26 July Jun. 18 6/5, 12 Jul. 30 7/3, 10, 17, 24 August Jul. 23 7/10, 17 Sep. 3 7/31, 8/7, 14, 21, 28 September Aug. 20 8/7, 14 Oct. 1 9/4, 11, 18, 25 October Sept. 17 9/4, 11 Nov. 5 10/2, 9, 16, 23, 30 November Oct. 22 10/9, 16 Dec. 3 11/6, 13, 20, 27 December Nov. 19 11/6, 13 Dec. 30 12/4, 11, 18, 25
1/ Weekly sales periods, ending on the indicated date, that are included in the applicable average. Information for the week usually is released by NASS on Friday of the following week.

FEDERAL ORDER 7 - SOUTHEAST: CLASS AND UNIFORM PRICESPool CLASS I* CLASS II CLASS III CLASS IV UNIFORM*
Period Skim/cwt Bfat/lb @ 3.5 Skim/cwt Bfat/lb @ 3.5 Skim/cwt Bfat/lb @ 3.5 Skim/cwt Bfat/lb @ 3.5 Skim/cwt Bfat/lb @ 3.5Sep 2008 $15.78 $1.7791 $21.45 $11.59 $1.8266 $17.58 $10.27 $1.8196 $16.28 $ 9.41 $1.8196 $15.45 $ 14.84 $1.8024 $20.63Oct $13.56 $1.7831 $19.33 $10.46 $1.8577 $16.60 $10.97 $1.8507 $17.06 $ 7.40 $1.8507 $13.62 $ 13.03 $1.8230 $18.95Nov $15.09 $1.8768 $21.13 $8.52 $1.7800 $14.45 $9.64 $1.7730 $15.51 $ 6.26 $1.7730 $12.25 $ 13.33 $1.8125 $19.21Dec $13.29 $1.8305 $19.23 $6.88 $1.3068 $11.21 $11.12 $1.2998 $15.28 $ 6.01 $1.2998 $10.35 $ 12.01 $1.5024 $16.85Jan 2009 $15.04 $1.4363 $19.54 $6.74 $1.1154 $10.41 $7.15 $1.1084 $10.78 $ 5.92 $1.1084 $9.59 $ 12.77 $1.2288 $16.62Feb $10.87 $1.1520 $14.52 $6.63 $1.1011 $10.25 $5.68 $1.0941 $9.31 $ 5.82 $1.0941 $9.45 $ 9.65 $1.1155 $13.22Mar $9.61 $1.1298 $13.23 $6.51 $1.1664 $10.36 $6.61 $1.1594 $10.44 $ 5.78 $1.1594 $9.64 $8.75 $1.1495 $12.47Apr $10.36 $1.1880 $14.16 $6.47 $1.2119 $10.49 $6.80 $1.2049 $10.78 $ 5.81 $1.2049 $9.82 $ 9.27 $1.1992 $13.14May $10.81 $1.2399 $14.77 $6.49 $1.2718 $10.71 $5.61 $1.2648 $9.84 $ 5.92 $1.2648 $10.14 $ 9.13 $1.2567 $13.21Jun $9.71 $1.2897 $13.88 $6.61 $1.2614 $10.79 $5.78 $1.2544 $9.97 $ 6.04 $1.2544 $10.22 $ 8.70 $1.2677 $12.83Jul $9.83 $1.3062 $14.06 $6.73 $1.2508 $10.87 $5.82 $1.2438 $9.97 $ 6.01 $1.2438 $10.15 $ 8.94 $1.2693 $13.07Aug $9.80 $1.2529 $13.84 $6.70 $1.2561 $10.86 $7.08 $1.2491 $11.20 $ 6.23 $1.2491 $10.38 $ 9.25 $1.2508 $13.30Sep $10.54 $1.3026 $14.73 $6.95 $1.2296 $11.01 $8.12 $1.2226 $12.11 $ 7.12 $1.2226 $11.15 $ 10.08 $1.2549 $14.12Oct $12.23 $1.2421 $16.15 $7.71 $1.2822 $11.93 $8.66 $1.2752 $12.82 $ 7.66 $1.2752 $11.86 $ 11.54 $1.2622 $15.55Nov $12.50 $1.3132 $16.66 $8.38
Pool CLASS I CLASS II CLASS III CLASS IVPeriod 1000 lbs. % 1000 lbs. % 1000 lbs. % 1000 lbs. %
Sep 2008 400,017 74.55% 52,644 9.81% 61,540 11.47% 22,397 4.17%Oct 414,863 73.62% 58,955 10.46% 64,708 11.48% 25,002 4.44%Nov 381,264 67.96% 59,573 10.62% 63,744 11.36% 56,464 10.06%Dec 404,358 66.68% 53,632 8.84% 75,350 12.42% 73,126 12.06%Jan 2009 413,503 68.14% 58,107 9.57% 73,691 12.14% 61,575 10.15%Feb 370,916 67.93% 57,125 10.46% 97,875 17.93% 20,079 3.68%Mar 411,467 60.71% 68,678 10.13% 131,319 19.38% 66,259 9.78%Apr 393,669 61.02% 62,288 9.65% 122,741 19.02% 66,498 10.31%May 379,284 57.18% 61,295 9.24% 155,016 23.37% 67,705 10.21%Jun 370,303 61.19% 63,971 10.57% 132,530 21.90% 38,350 6.34%Jul 381,874 66.92% 62,766 11.00% 110,511 19.37% 15,480 2.71%Aug 402,719 70.79% 60,254 10.59% 59,535 10.46% 46,434 8.16%Sep 397,084 73.08% 69,511 12.79% 63,408 11.67% 13,360 2.46%Oct 418,281 74.01% 60,617 10.73% 63,975 11.32% 22,293 3.94%
563,528
606,466
FEDERAL ORDER 7 - SOUTHEAST: POOLED RECEIPTS AND UTILIZATION OF PRODUCER MILKProducer Milk
1000 lbs. FarmsNumber of
536,598 2,9052,933
* Class I and uniform prices are at Fulton County (Atlanta), Georgia;** Estimated
570,631 2,811
677,722 2,910645,197 2,968
543,362 2,734568,941
2,974561,045 2,906
545,996 2,878
663,300 2,994
606,876 2,914
565,165 2,800**
605,153 2,958
2,803
Class I Utilization
66%
68%
70%
72%
74%
76%
78%
Oct-08 Sep-09Oct-09
Page 5

** The base rate for making partial payments in Fulton County, GA for November will be $14.00 per hundredweight. This is 90 percent of the preceding month’s uniform price of $15.55 per hundredweight.
Producer Touch Base Requirements & Handler Diversion Limits [per Order Amendment issued March 17, 2008]
Jan Feb Mar Apr May Jun Jul Aug Sep Oct Nov Dec Producer Touch Base Days 1 1 1 1 1 1 1 1 1 1 1 1 Diversion Percentage Limits 25% 25% 35% 35% 35% 35% 25% 25% 25% 25% 25% 35%
WASDE Dairy Report 1/ WASDE - 476 November 10, 2009
The milk production forecasts are raised for 2009 and 2010 as milk per cow is forecast higher and the rate of decline in cow inventories is slowed. Improved milk prices are expected to more than outweigh higher feed costs and slow the pace of liquidation. Improving global demand and concerns about world supplies of dairy products have pushed international dairy prices higher and are expected to result in higher U.S. dairy exports during the remainder of this year and into 2010. Import forecasts are lowered for 2009.
Fat-basis ending stocks are forecast higher for 2009, but 2010 stocks are forecast lower on both
a fat and skim-solids basis as supplies tighten. Improving domestic and export demand and lower year-to-year milk production is expected to lead to higher prices for U.S. cheese, butter, nonfat dry milk, and whey. Class III and IV price forecasts for 2009 and 2010 are raised from last month. The all milk price is forecast at $12.60 to $12.70 per cwt for 2009 and $16.05 to $16.95 for 2010.
1/ The World Agricultural Supply and Demand Estimates (WASDE) report provides USDA's comprehensive forecasts of supply and demand for major U.S. and global crops and U.S. livestock, including dairy. The most recent WASDE report is available at www.usda.gov/oce/commodity/wasde/index.htm.
Southeast Marketing Area - Federal Order 7 Pool and Payment Dates for the Pooling Periods
November 2009 through January 2010 MA Payment Dates Payments for Producer Milk
Due to: Due From: Partial Payment** Due Final Payment Due Pool Month
Pool & Uniform Price Release
Date All Funds P/S & T-Credit Coop Nonmember Coop Nonmember
NOV 2009 12/11/09 12/14/09 12/15/09 11/25/09 11/27/09 12/15/09 12/16/09 DEC 2009 01/11/10 01/12/10 01/13/10 12/28/09 12/28/09 01/13/10 01/14/10 JAN 2010 02/11/10 02/12/10 02/16/10 01/25/10 01/26/10 02/16/10 02/16/10
"The U.S. Department of Agriculture (USDA) prohibits discrimination in all its programs and activities on the basis of race, color, national origin, age, disability, and where applicable, sex, marital status, familial status, parental status, religion, sexual orientation, genetic information, political beliefs, reprisal, or because all or a part of an individual's income is derived from any public assistance program. (Not all prohibited bases apply to all programs.) Persons with disabilities who require alternative means for communication of program information (Braille, large print, audiotape, etc.) should contact USDA's TARGET Center at (202) 720-2600 (voice and TDD). To file a complaint of discrimination write to USDA, Director, Office of Civil Rights, 1400 Independence Avenue, S.W., Washington, D.C. 20250-9410 or call (800) 795-3272 (voice) or (202) 720-6382 (TDD). USDA is an equal opportunity provider and employer."
MILK MARKET ADMINISTRATORU.S. Department Of Agriculture 1550 North Brown Road, Suite 120Lawrenceville, Georgia 30043
www.fmmatlanta.com

Uniform Price Up $0.73 The uniform price in Fulton County, GA, was
$16.28 per hundredweight of milk at 3.5 percent butterfat for the month of November. The uniform price is $0.73 higher than the previous month and is $2.93 per hundredweight lower compared with November of last year.
Class I utilization was 70.33 percent in No-vember, a decrease of 3.68 percent compared with the previous month and an increase of 2.37 percent compared with November 2008.
National Dairy Situation The USDA estimates that the total U.S.
production of milk in October was 15.4 billion pounds, a decrease of 1.1 percent from October 2008 and a decrease of 0.7 percent when compared with September 2009 on a daily aver-age basis. Total cheese output was 861 million pounds, 1.3 percent above October 2008 and 1.1 percent less than September 2009 on a daily av-erage basis. Butter production was 112 million pounds, 14.3 percent below October 2008 but 14.5 percent above September 2009 on a daily average basis.
Nonfat dry milk powder production was 91.5 million pounds in October, 24.4 percent less than October 2008 and 2.2 percent higher than Sep-tember 2009 on a daily average basis. Dry whey production was 88.7 million pounds, 1.1 percent above October 2008 and 2.5 percent below Sep-tember 2009 on a daily average basis.
Market Information BULLETIN
ISSUED FOR THE INFORMATION OF PRODUCERS WHO ARE NOT MEMBERS OF COOPERATIVE ASSOCIATIONS
Sue L. Mosley, Market Administrator
www.fmmatlanta.com
Southeast Marketing Area Federal Order 7
Volume 10—No. 12 December 2009
Less Milk Production and Firm Global Demand Combine To Raise 2010’s Milk Price Forecast
Feed costs have fallen substantially in 2009, but are unlikely to fall as much next year. The benchmark 16-percent protein ration value is pro-jected to average in the mid-$7.00 per cwt range this year compared with over $9.00 per cwt in 2008. In 2010, the price should continue to fall, but not by nearly as much. Falling soybean meal prices will constitute a large share of the drop. Corn prices for the 2009/10 crop year are forecast to decline to $3.25 to $3.85 per bushel compared with the 2008/09 crop year average of $4.06 per bushel. Soybean meal prices are forecast to de-cline from $331 per ton average in 2009/10 to a forecast $260, with $310 per ton in 2010/11.
The U.S. dairy herd is forecast to continue to contract in 2010, with most of the herd reduction coming in early 2010 and attenuating later in the year. The U.S. dairy herd is expected to average 8.97 million next year and is expected to average below 9 million cows in each of the four quarters of 2010. The forecast decline in herd size will repre-sent a 2.5-percent decline year-over-year. This de-cline follows a 1.3-percent decline in 2009. In con-trast, milk production per cow is forecast to rise to 20,950 pounds, a 1.84-percent year-over-year in-crease and slightly ahead of the 5-year-trend in-crease. In light of lower feed prices and improving milk prices, the short-term response is to produce more milk per cow as rations are improved. This will occur before producers undertake any herd expansion, which requires investment in livestock.
Commercial disappearance is forecast to rise by less than half-a-percent next year on a fat ba-sis and to be virtually unchanged from 2009 on a skims-solids basis. World markets remain firm, and the export forecast remains unchanged from last month. Product exports (continued on page 6)
Transportation Credit Update Preliminary claims on the Federal Order 7 trans-
portation credit balancing fund for November 2009 were made for $3,342,176.15. Since the available balance was $1,185,524.14, eligible claims were paid at the rate of approximately $0.36 on the dollar.

Calculation of Uniform Butterfat Price:Utilization Pounds Price/lb. Value
Class I Butterfat 38.28% 8,111,916 $1.2752 $ 10,344,315.28 Class I Differential at Location 270,316.46 Class II Butterfat 29.02% 6,149,827 $1.4726 9,056,235.27 Class III Butterfat 20.77% 4,401,350 $1.4656 6,450,618.55 Class IV Butterfat 11.93% 2,526,985 $1.4656 3,703,549.23
Total Butterfat 100.00% 21,190,078 $ 29,825,034.79
Uniform Butterfat Price per lb. (Fulton County, Georgia): $1.4075
Calculation of Uniform Skim Milk PriceProducer Milk Utilization Pounds ValueClass I Skim Milk 71.58% 386,582,902 $8.70 /cwt. $ 33,632,712.48 Class I Butterfat 38.28% 8,111,916 $1.2752 /lb. 10,344,315.28 Class I Differential at Location 394,694,818 13,205,293.21 Total Class I Milk 70.33% 394,694,818 $ 57,182,320.97 Class II Skim Milk 11.21% 60,540,894 $8.38 /cwt. $ 5,073,326.94 Class II Butterfat 29.02% 6,149,827 $1.4726 /lb. 9,056,235.27 Total Class II Milk 11.88% 66,690,721 $ 14,129,562.21 Class III Skim Milk 12.50% 67,482,451 $9.27 /cwt. $ 6,255,623.18 Class III Butterfat 20.77% 4,401,350 $1.4656 /lb. 6,450,618.55 Total Class III Milk 12.81% 71,883,801 $ 12,706,241.73 Class IV Skim Milk 4.71% 25,422,965 $8.41 /cwt. $ 2,138,071.38 Class IV Butterfat 11.93% 2,526,985 $1.4656 /lb. 3,703,549.23 Total Class IV Milk 4.98% 27,949,950 $ 5,841,620.61
Producer Milk 100.00% 561,219,290 $ 89,859,745.52 Adjustments
Overage and Other Source $13,345.75Inventory Adjustments $53,920.82Producer butterfat at uniform butterfat price ($29,825,034.79)Location Adjustments to Producers $3,408,054.151/2 Unobligated Balance in P.S.F $276,376.94
Adjusted Pool Value $ 11.81166 $63,786,408.40Reserve for Producer Settlement Fund $ 0.04166 $224,970.12
Uniform Skim Milk Price per cwt. (Fulton County, Georgia): $11.77
Uniform Price per cwt. (Fulton County, Georgia) $16.28** At 3.5% butterfat test; for information purposes.
OTHER FEDERAL ORDERS: CLASS I AND UNIFORM PRICES (At 3.5% Butterfat)MARKET NAME CLASS I %
(Priced at) NOV 2009 DEC 2009 NOV 2009 NOV 2009Appalachian (Charlotte) $ 16.26 $ 17.39 $ 15.05 $ 15.89 71.22%Arizona (Phoenix $ 15.21 $ 16.34 $ 13.38 $ 14.38 38.58%Central (Kansas City) $ 14.86 $ 15.99 $ 12.79 $ 13.86 37.26%Florida (Tampa) $ 18.26 $ 19.39 $ 17.23 $ 17.80 84.94%Mideast (Cleveland) $ 14.86 $ 15.99 $ 13.14 $ 14.11 44.00%Northeast (Boston) $ 16.11 $ 17.24 $ 14.06 $ 15.02 46.30%Pacific Northwest (Seattle) $ 14.76 $ 15.89 $ 12.86 $ 13.92 29.80%Southeast (Atlanta) $ 16.66 $ 17.79 $ 15.55 $ 16.28 70.33%Southwest (Dallas) $ 15.86 $ 16.99 $ 14.05 $ 15.03 72.13%Upper Midwest (Chicago) $ 14.66 $ 15.79 $ 12.94 $ 14.12 15.00%
Page 2
F.O. 7 - SOUTHEAST: CALCULATION OF UNIFORM PRICES - NOVEMBER 2009
Price per unit
CLASS I UNIFORM OCT 2009
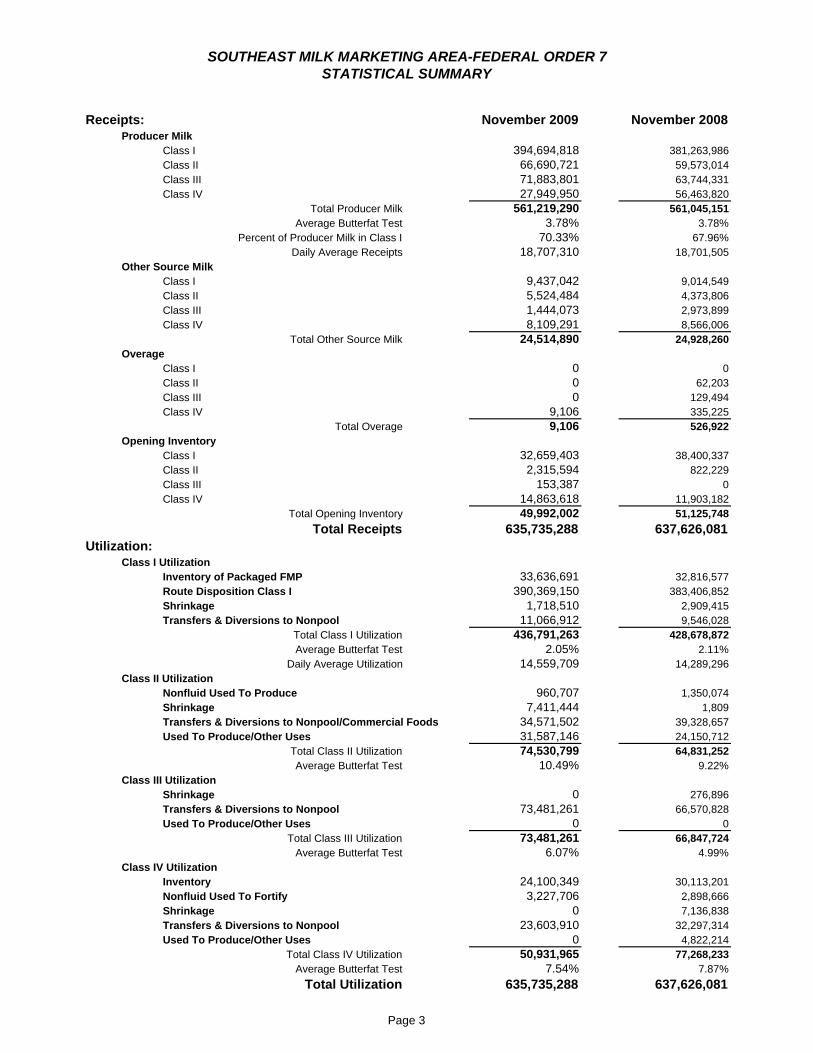
Receipts: November 2009 November 2008Producer Milk
Class I 394,694,818 381,263,986Class II 66,690,721 59,573,014Class III 71,883,801 63,744,331Class IV 27,949,950 56,463,820
Total Producer Milk 561,219,290 561,045,151Average Butterfat Test 3.78% 3.78%
Percent of Producer Milk in Class I 70.33% 67.96%Daily Average Receipts 18,707,310 18,701,505
Other Source MilkClass I 9,437,042 9,014,549Class II 5,524,484 4,373,806Class III 1,444,073 2,973,899Class IV 8,109,291 8,566,006
Total Other Source Milk 24,514,890 24,928,260Overage
Class I 0 0Class II 0 62,203Class III 0 129,494Class IV 9,106 335,225
Total Overage 9,106 526,922Opening Inventory
Class I 32,659,403 38,400,337Class II 2,315,594 822,229Class III 153,387 0Class IV 14,863,618 11,903,182
Total Opening Inventory 49,992,002 51,125,748Total Receipts 635,735,288 637,626,081
Utilization:Class I Utilization
Inventory of Packaged FMP 33,636,691 32,816,577Route Disposition Class I 390,369,150 383,406,852Shrinkage 1,718,510 2,909,415Transfers & Diversions to Nonpool 11,066,912 9,546,028
Total Class I Utilization 436,791,263 428,678,872Average Butterfat Test 2.05% 2.11%
Daily Average Utilization 14,559,709 14,289,296Class II Utilization
Nonfluid Used To Produce 960,707 1,350,074Shrinkage 7,411,444 1,809Transfers & Diversions to Nonpool/Commercial Foods 34,571,502 39,328,657Used To Produce/Other Uses 31,587,146 24,150,712
Total Class II Utilization 74,530,799 64,831,252Average Butterfat Test 10.49% 9.22%
Class III UtilizationShrinkage 0 276,896Transfers & Diversions to Nonpool 73,481,261 66,570,828Used To Produce/Other Uses 0 0
Total Class III Utilization 73,481,261 66,847,724Average Butterfat Test 6.07% 4.99%
Class IV UtilizationInventory 24,100,349 30,113,201Nonfluid Used To Fortify 3,227,706 2,898,666Shrinkage 0 7,136,838Transfers & Diversions to Nonpool 23,603,910 32,297,314Used To Produce/Other Uses 0 4,822,214
Total Class IV Utilization 50,931,965 77,268,233Average Butterfat Test 7.54% 7.87%
Total Utilization 635,735,288 637,626,081
SOUTHEAST MILK MARKETING AREA-FEDERAL ORDER 7STATISTICAL SUMMARY
Page 3

Page 4
Packaged Class I Route Sales in Marketing Area Product Description Pounds Percent
October 2009 Whole Milk 138,751,473 30.81%Fat Free Milk 51,287,714 11.39%Lowfat Milk (incl. 1%) 37,203,000 8.26%Reduced Fat Milk (incl. 2%) 163,453,592 36.30%Cultured Fluid Milk (incl. Buttermilk) 8,864,428 1.97%Flavored Drinks and Milk 50,716,489 11.26%Total Disposition in Marketing Area 450,276,696 100.00% Total Disposition by Pool Plants 362,992,511 80.62%Total Disposition by Nonpool Plants 87,284,185 19.38%Total Disposition in Marketing Area 450,276,696 100.00%
Southeast Market Summary The minimum order uniform price for payment to producers supplying the Southeast Order marketing
area during November 2009 is $16.28 per hundredweight for milk with a 3.5% butterfat test in Fulton County, Georgia. This is .965 times the uniform skim milk price of $11.77 per hundredweight plus 3.5 times the uniform butterfat price of $1.4075 per pound. Payment to producers may be reduced by location differentials, if applicable, and by properly authorized deductions.
Uniform prices are the result of marketwide pooling; all producer milk was classified and priced according to the milk's use. In November, Class I use, which is primarily bottled or packaged fluid milk, accounted for 71.58% of all producer skim milk (priced to handlers at $8.70 per hundredweight, plus the Class I differential, see page 2) and 38.28% of producer butterfat (priced to handlers at $1.2752 per pound plus Class I differential). Class II use, which is milk used in fluid cream products and miscellaneous manufacturing, accounted for 11.21% of all producer skim milk ($8.38 per hundredweight) and 29.02% of producer butterfat ($1.4726 per pound). Class III use, mostly milk used to produce cheese, accounted for 12.50% of all producer skim milk ($9.27 per hundredweight) and 20.77% of producer butterfat ($1.4656 per pound). Class IV use, generally milk processed into butter and powder, accounted for 4.71% of all producer skim milk ($8.41 per hundredweight) and 11.93% of producer butterfat ($1.4656 per pound).
Receipts of producer milk during November 2009 totaled 561.2 million pounds. There were 26 regulated pool distributing plants, 3 pool supply plants and 11 cooperative associations submitting reports of receipts and utilization that were included in the computation of the uniform prices for November 2009. Class I route disposition in the area was 450.3 million pounds in October 2009.
Mailbox Milk Prices, January through September 2009 Reporting Area 1/ Jan Feb Mar Apr May Jun Jul Aug Sept New England States 3/ $14.95 $12.46 $12.25 $12.66 $12.65 $12.27 $12.22 $12.57 $13.45 Eastern Pennsylvania 4/ $14.45 $11.98 $11.76 $12.16 $12.14 $11.73 $11.80 $12.12 $12.99 Appalachian States 5/ $16.55 $13.20 $12.25 $12.70 $12.78 $12.36 $12.74 $13.04 $13.94 Southeast States 6/ $17.05 $13.76 $12.47 $13.08 $13.15 $12.85 $13.38 $13.88 $14.77 Southern Missouri 7/ $14.98 $11.69 $10.78 $11.09 $10.77 $10.77 $11.08 $11.51 $12.55 Florida $18.39 $14.97 $13.61 $14.34 $14.70 $14.07 $14.81 $15.37 $16.20 Western Pennsylvania 8/ $14.37 $11.89 $11.61 $12.07 $11.86 $11.53 $11.53 $11.97 $12.97 Indiana $14.86 $12.00 $11.34 $11.76 $12.00 $11.37 $11.51 $11.90 $12.81 Wisconsin $12.94 $11.24 $11.87 $12.17 $11.40 $11.24 $11.15 $12.25 $13.30 Corn Belt States 9/ $13.61 $11.33 $11.43 $11.62 $11.33 $10.96 $10.82 $11.69 $12.82 Western Texas 10/ $12.98 $10.73 $10.73 $11.07 $10.59 $10.20 $10.43 $11.30 $12.22 Northwest States 11/ $12.75 $10.66 $10.95 $11.29 $10.87 $10.55 $10.57 $11.17 $12.17 All Federal Orders 12/ $13.77 $11.61 $11.60 $11.96 $11.61 $11.27 $11.30 $12.04 $12.98 California 13/ $10.57 $9.80 $9.92 $9.88 $9.70 $9.63 $9.60 $10.51 $11.20
Source: Dairy Market News; 1/ Information is shown for those areas for which prices are reported for at least 75% of the milk marketed under Federal milk orders. 2/ Net pay price received by dairy farmers for milk. 3/ Includes Connecticut, Maine, Massachusetts, New Hampshire, Rhode Island, and Vermont. 4/ All the counties to the east of those listed in 8/. 5/ Includes Kentucky, North Carolina, South Carolina, Tennessee, and Virginia. 6/ Includes Alabama, Arkansas, Georgia, Louisiana, and Mississippi. 7/ The counties of Vernon, Cedar, Polk, Dallas, Laclede, Texas, Dent, Crawford, Washington, St. Francois, and Perry and all those to the south of these. 8/ The counties of Warren, Elk, Clearfield, Indiana, Westmoreland, and Fayette, and all those to the west of these. 9/ Includes Kansas, Nebraska and the Missouri counties to the north of those listed in 7/. 10/ All counties to the west of Fanin, Hunt, Van Zandt, Henderson, Anderson, Houston, Cherokee, Nacogdoches, and Shelby. 11/ Includes Oregon and Washington. 12/ Weighted average of the information for all selected reporting areas in Federal milk orders. 13/ Calculated by CA Department of Food and Agriculture.

FEDERAL ORDER 7 - SOUTHEAST: CLASS AND UNIFORM PRICESPool CLASS I* CLASS II CLASS III CLASS IV UNIFORM*
Period Skim/cwt Bfat/lb @ 3.5 Skim/cwt Bfat/lb @ 3.5 Skim/cwt Bfat/lb @ 3.5 Skim/cwt Bfat/lb @ 3.5 Skim/cwt Bfat/lb @ 3.5Sep 2008 $15.78 $1.7791 $21.45 $11.59 $1.8266 $17.58 $10.27 $1.8196 $16.28 $ 9.41 $1.8196 $15.45 $ 14.84 $1.8024 $20.63Oct $13.56 $1.7831 $19.33 $10.46 $1.8577 $16.60 $10.97 $1.8507 $17.06 $ 7.40 $1.8507 $13.62 $ 13.03 $1.8230 $18.95Nov $15.09 $1.8768 $21.13 $8.52 $1.7800 $14.45 $9.64 $1.7730 $15.51 $ 6.26 $1.7730 $12.25 $ 13.33 $1.8125 $19.21Dec $13.29 $1.8305 $19.23 $6.88 $1.3068 $11.21 $11.12 $1.2998 $15.28 $ 6.01 $1.2998 $10.35 $ 12.01 $1.5024 $16.85Jan 2009 $15.04 $1.4363 $19.54 $6.74 $1.1154 $10.41 $7.15 $1.1084 $10.78 $ 5.92 $1.1084 $9.59 $ 12.77 $1.2288 $16.62Feb $10.87 $1.1520 $14.52 $6.63 $1.1011 $10.25 $5.68 $1.0941 $9.31 $ 5.82 $1.0941 $9.45 $ 9.65 $1.1155 $13.22Mar $9.61 $1.1298 $13.23 $6.51 $1.1664 $10.36 $6.61 $1.1594 $10.44 $ 5.78 $1.1594 $9.64 $8.75 $1.1495 $12.47Apr $10.36 $1.1880 $14.16 $6.47 $1.2119 $10.49 $6.80 $1.2049 $10.78 $ 5.81 $1.2049 $9.82 $ 9.27 $1.1992 $13.14May $10.81 $1.2399 $14.77 $6.49 $1.2718 $10.71 $5.61 $1.2648 $9.84 $ 5.92 $1.2648 $10.14 $ 9.13 $1.2567 $13.21Jun $9.71 $1.2897 $13.88 $6.61 $1.2614 $10.79 $5.78 $1.2544 $9.97 $ 6.04 $1.2544 $10.22 $ 8.70 $1.2677 $12.83Jul $9.83 $1.3062 $14.06 $6.73 $1.2508 $10.87 $5.82 $1.2438 $9.97 $ 6.01 $1.2438 $10.15 $ 8.94 $1.2693 $13.07Aug $9.80 $1.2529 $13.84 $6.70 $1.2561 $10.86 $7.08 $1.2491 $11.20 $ 6.23 $1.2491 $10.38 $ 9.25 $1.2508 $13.30Sep $10.54 $1.3026 $14.73 $6.95 $1.2296 $11.01 $8.12 $1.2226 $12.11 $ 7.12 $1.2226 $11.15 $ 10.08 $1.2549 $14.12Oct $12.23 $1.2421 $16.15 $7.71 $1.2822 $11.93 $8.66 $1.2752 $12.82 $ 7.66 $1.2752 $11.86 $ 11.54 $1.2622 $15.55Nov $12.50 $1.3132 $16.66 $8.38 $1.4726 $13.24 $9.27 $1.4656 $14.08 $ 8.41 $1.4656 $13.25 $ 11.77 $1.4075 $16.28Dec $13.11 $1.4690 $17.79 $9.14
Pool CLASS I CLASS II CLASS III CLASS IVPeriod 1000 lbs. % 1000 lbs. % 1000 lbs. % 1000 lbs. %
Sep 2008 400,017 74.55% 52,644 9.81% 61,540 11.47% 22,397 4.17%Oct 414,863 73.62% 58,955 10.46% 64,708 11.48% 25,002 4.44%Nov 381,264 67.96% 59,573 10.62% 63,744 11.36% 56,464 10.06%Dec 404,358 66.68% 53,632 8.84% 75,350 12.42% 73,126 12.06%Jan 2009 413,503 68.14% 58,107 9.57% 73,691 12.14% 61,575 10.15%Feb 370,916 67.93% 57,125 10.46% 97,875 17.93% 20,079 3.68%Mar 411,467 60.71% 68,678 10.13% 131,319 19.38% 66,259 9.78%Apr 393,669 61.02% 62,288 9.65% 122,741 19.02% 66,498 10.31%May 379,284 57.18% 61,295 9.24% 155,016 23.37% 67,705 10.21%Jun 370,303 61.19% 63,971 10.57% 132,530 21.90% 38,350 6.34%Jul 381,874 66.92% 62,766 11.00% 110,511 19.37% 15,480 2.71%Aug 402,719 70.79% 60,254 10.59% 59,535 10.46% 46,434 8.16%Sep 397,084 73.08% 69,511 12.79% 63,408 11.67% 13,360 2.46%Oct 418,281 74.01% 60,617 10.73% 63,975 11.32% 22,293 3.94%Nov 394,695 70.33% 66,691 11.88% 71,884 12.81% 27,950 4.98%
606,876 2,914
565,165 2,837
605,153 2,958
2,803
545,996 2,878
663,300 2,994
536,598 2,9052,933
* Class I and uniform prices are at Fulton County (Atlanta), Georgia;** Estimated
570,631 2,811
677,722 2,910645,197 2,968
FEDERAL ORDER 7 - SOUTHEAST: POOLED RECEIPTS AND UTILIZATION OF PRODUCER MILKProducer Milk
1000 lbs. FarmsNumber of
561,219 2,800**
563,528
606,466
543,362 2,734568,941
2,974561,045 2,906
Class I Utilization
66%
68%
70%
72%
74%
76%
78%
Nov-08 Oct-09Nov-09
Page 5

** The base rate for making partial payments in Fulton County, GA for December will be $14.65 per hundredweight. This is 90 percent of the preceding month’s uniform price of $16.28 per hundredweight.
Producer Touch Base Requirements & Handler Diversion Limits [per Order Amendment issued March 17, 2008]
Jan Feb Mar Apr May Jun Jul Aug Sep Oct Nov Dec Producer Touch Base Days 1 1 1 1 1 1 1 1 1 1 1 1 Diversion Percentage Limits 25% 25% 35% 35% 35% 35% 25% 25% 25% 25% 25% 35%
Less Milk Production, Firm Global Demand Combine To Raise 2010’s Milk Price Forecast (continued from page 1) are projected to continue to rise next year, especially for nonfat dry milk
(NDM) and whey products. Exports of NDM will help draw down stocks next year on a skims-solids basis, but stocks on a fats basis will be drawn down less. Imports are forecast to decline slightly next year on a fats basis but to rise slightly on a skims-solids basis.
Product prices across the board will be higher next year. Cheese prices will likely average $1.290 to $1.300 per pound in 2009 and rise to average $1.615 to $1.695 per pound in 2010. Butter prices are projected to average $1.195 to $1.225 per pound and average $1.430 to $1.540 per pound next year. After averaging 91.0 to 93.0 cents per pound this year, NDM prices are forecast to climb to average $1.245 to $1.305 per pound in 2010. Whey prices are projected to average 25.5 to 26.5 cents per pound in 2009 and rise to 35.0 to 38.0 cents per pound next year.
The higher price prospects for dairy products both this year and next will boost milk prices as well. After averaging $11.30 to $11.40 per cwt in 2009, Class III prices are forecast to rise to average $15.15 to $15.95 per cwt next year. Likewise, Class IV prices are expected to climb from $10.75 to $10.95 in the current year to average $14.60 to $15.50 per cwt in 2010. The all milk price is expected to average $12.70 to $12.80 this year and rise to average $16.35 to $17.15 in 2010.
Livestock, Dairy, & Poultry Outlook/LDP-M-186/December 17, 2009Economic Research Service, USDA
Southeast Marketing Area - Federal Order 7 Pool and Payment Dates for the Pooling Periods
December 2009 through February 2010 MA Payment Dates Payments for Producer Milk
Due to: Due From: Partial Payment** Due Final Payment Due Pool Month
Pool & Uniform Price Release
Date All Funds P/S & T-Credit Coop Nonmember Coop Nonmember
DEC 2009 01/11/10 01/12/10 01/13/10 12/28/09 12/28/09 01/13/10 01/14/10 JAN 2010 02/11/10 02/12/10 02/16/10 01/25/10 01/26/10 02/16/10 02/17/10 FEB 2010 03/11/10 03/12/10 03/15/10 02/25/10 02/26/10 03/15/10 03/16/10
"The U.S. Department of Agriculture (USDA) prohibits discrimination in all its programs and activities on the basis of race, color, national origin, age, disability, and where applicable, sex, marital status, familial status, parental status, religion, sexual orientation, genetic information, political beliefs, reprisal, or because all or a part of an individual's income is derived from any public assistance program. (Not all prohibited bases apply to all programs.) Persons with disabilities who require alternative means for communication of program information (Braille, large print, audiotape, etc.) should contact USDA's TARGET Center at (202) 720-2600 (voice and TDD). To file a complaint of discrimination write to USDA, Director, Office of Civil Rights, 1400 Independence Avenue, S.W., Washington, D.C. 20250-9410 or call (800) 795-3272 (voice) or (202) 720-6382 (TDD). USDA is an equal opportunity provider and employer."
MILK MARKET ADMINISTRATORU.S. Department Of Agriculture 1550 North Brown Road, Suite 120Lawrenceville, Georgia 30043
www.fmmatlanta.com