market impact assessment of the bbc’s high definition ... · of the bbc’s high definition...
TRANSCRIPT

Market Impact Assessment of the BBC’s High Definition
Television Proposals A report of market research conducted for Ofcom by
Illuminas
Publication date: 18 September 2007
Contents Section Page 1 Executive Summary 1 2 Background and Research Objectives 6 3 Research Methodology 8 4 Profile of current HDTV subscribers 12 5 HDTV and its impact on viewing behaviour 18 6 The Impact of HDTV on other TV-based activities 33 7 Perceptions and usage of the trial BBC HD channel 39 8 The proposed 9 hour BBC HD channel 47 9 The proposed overnight BBC HD channel 58
Section 1
Executive Summary Background, objectives and methodology BBC HD is currently in a trial stage and is being offered over both Virgin Media V+ and Sky HD. It has been decided to apply a Public Value Test (PVT) to the BBC’s proposal to make the trial BBC HD channel permanent. The central objective of this piece of research was to assess the possible impact of the BBC launching an HD channel. The research comprised the following elements:
• 400 x 30 minute, in home CAPI interviews with subscribers to HDTV; and
• 10 x diary-depth interviews with respondents from the quantitative stage.
Adoption, understanding and experience of HDTV The backing of major brands, such as Sky, BBC and Virgin, as well as equipment manufacturers like Sony and Panasonic, appears to have reduced perceived risks of adoption and driven take-up of HD rapidly through the adoption curve. There are still misunderstandings about HDTV. Two fifths (41%) of HDTV subscribers think that HD quality pictures are available on all TV channels rather than just dedicated HD broadcast channels. The longer people have had an HDTV subscription the better their understanding that HD quality pictures are only available from HD channels. This could be for one of two reasons:
• those who adopted earlier are more technically sophisticated; or
• the longer people have an HD subscription, the more aware they become that HD quality pictures are only available through HD channels.
Most HDTV subscribers are very impressed by the improvement in picture quality over SD TV. The perceived improvement is greater the larger the size of the screen being watched. Current HD channels are generally very well liked.
1

Impact of HDTV HD channel viewing represents, on average, a third of all time spent watching TV among HDTV subscribers. This is higher among Sky customers (37%) than Virgin Media customers (22%), probably due to the wider range of HD channels available on Sky. Two fifths (43%) claim to have increased their overall TV viewing since subscribing to HDTV. This is higher among younger people. The main types of programme that are watched more after HD has been adopted are Films, Sports and Documentaries. For most subscribers, the programme is the main driver of TV viewing, not picture quality.
• The HD channel is preferred and most will always check whether the programme is being shown on an HD channel before they start watching
• But, most will not choose to watch a HD programme over a programme they like
Most subscribers (88%) have decreased their viewing of SD TV channels since getting HD. The main reduction in viewing has been of those channels that are also now available in HD. A small proportion (20%) of HDTV subscribers claim to watch some SD channels more frequently. Since adopting HDTV, subscribers report:
• A slight net decrease in watching non-HD DVDs and videos.;
• A large net increase in the time they spend watching HD DVDs and Blu Ray.
• A slight net increase in time spent gaming.
The trial BBC HD channel and its impact Awareness of the trial BBC HD channel was fairly high among HDTV subscribers (75%, prompted). Nearly half (46%) of HDTV subscribers currently watch the trial BBC HD channel, making it the most widely watched HD channel. Sky One HD and Sky Movies HD are the next most widely watched with 42% and 41% penetration respectively. Males and the 45+ age group are most likely to watch the trial BBC HD channel, and are more likely to at least be aware of the other HD channels available. Most subscribers (87%) choose the BBC HD trial over BBC 1 in the event that a programme is available on both channels.
2

As a result of starting to watch the BBC HD trial, subscribers report:
• An overall increase in TV viewing – especially among younger/ mid-age and more recent subscribers.
• An increase in viewing other HD channels.
• A decrease in viewing BBC and non-BBC SD channels.
Subscribers also claim that the BBC HD trial had an influence on their decision to purchase HD DVD / Blu Ray and that it has significantly increased their use of hard disc recorders. The latter was especially the case among older subscribers The proposed 9 hour BBC HD channel There are high levels of interest in the 9 hour BBC HD channel concept.
• Three quarters (76%) claimed to be either extremely or somewhat interested in the concept.
• Interest in the concept increases with TV screen size.
• Those who currently watch the BBC HD trial are far more interested in the idea than those that do not currently watch it.
Subscribers claim that if the proposed BBC HD channel ran for 9 hours a day they would:
• Watch more TV overall than they do now (42% ‘slightly’ / ‘much more than now’).
• Watch about the same amount of DVDs as they do at present;.
• Play games about the same amount as they do now;.
• Use their hard disc recorder more than they do now (32% ‘Much’/ ‘A little bit more’).
• Watch more HD DVDs/ Blu Ray than at present - possibly because they would record more programmes or films onto HD DVD or Blu Ray than they currently do.
By far the single biggest negative impact of extending the BBC HD trial channel would be on viewership of SD BBC channels, especially BBC 1. Making the extended BBC HD channel available on Freeview could represent a potential
3

threat to Sky HD and Virgin HD revenues:
• 7% claim they would definitely cancel their subscriptions to these HD channels and 19% claim they would possibly cancel their subscriptions.
The proposed overnight BBC HD channel There is some interest in the proposed overnight BBC HD channel, but less than there is in the 9 hour channel. (51% were extremely or somewhat interested, compared to 76% for the 9 hour channel).
• As with the 9 hour channel, those who currently watch BBC HD are far more interested in the idea of the overnight channel than those who do not currently watch BBC HD.
• The overnight BBC HD concept appeals to a subset of those interested in the 9 hour BBC HD channel.
Subscribers claim that if the overnight BBC HD channel was available they would:
• Watch more TV overall than they do at present (26% ‘slightly’ / ‘much more than now’ – cf 42% for 9 hour BBC HD).
• Use their hard disc recorder more than they do now (43% ‘Much’/ ‘A little bit more’ compared to 32% for 9 hour BBC HD).
The overnight BBC HD channel would result in:
• A reduction in viewing of BBC SD channels (27% ‘Much’/ ‘A little bit less’).
• A very slight reduction in viewing non-BBC SD channels (18% ‘Much’/ ‘A little bit less’).
• No net impact on other HD channels.
4
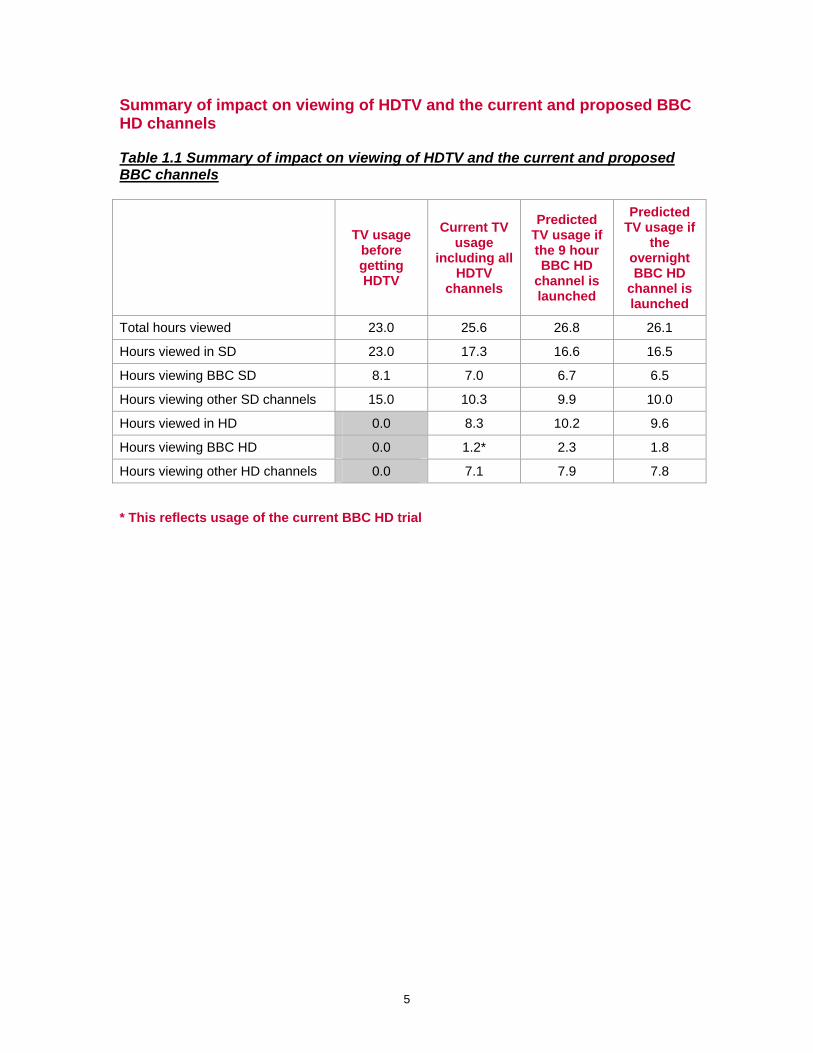
Summary of impact on viewing of HDTV and the current and proposed BBC HD channels Table 1.1 Summary of impact on viewing of HDTV and the current and proposed BBC channels
TV usage before getting HDTV
Current TV usage
including all HDTV
channels
Predicted TV usage if the 9 hour BBC HD
channel is launched
Predicted TV usage if
the overnight BBC HD
channel is launched
Total hours viewed 23.0 25.6 26.8 26.1
Hours viewed in SD 23.0 17.3 16.6 16.5
Hours viewing BBC SD 8.1 7.0 6.7 6.5
Hours viewing other SD channels 15.0 10.3 9.9 10.0
Hours viewed in HD 0.0 8.3 10.2 9.6
Hours viewing BBC HD 0.0 1.2* 2.3 1.8
Hours viewing other HD channels 0.0 7.1 7.9 7.8
* This reflects usage of the current BBC HD trial
5

Section 2
Background and Research Objectives Background High Definition Television (HDTV) involves the broadcasting of television pictures at a higher resolution than “standard television” is broadcast, resulting in sharper, clearer and better defined TV images and an improved viewing experience. At present two platforms offer High Definition (HD) content to viewers in the UK:
• Sky: involves a one-off payment for a Sky HD box (also a PVR) and a monthly HD subscription in addition to the customer’s usual subscription. Gives access to the HD versions of channels the customer is already subscribed to, if available.
• Virgin Media: involves a monthly subscription to the V+ PVR package. Gives access to the trial BBC HD channel and to pay-per-view on-demand HD content.
Various types of content are available via these platforms, including:
• Sky Sports HD, Sky Movies HD, Sky Box Office HD, Sky One HD, Sky Arts HD.
• National Geographic Channel HD and Discovery HD.
• Virgin Media’s HD “on demand” services.
• The trial BBC HD channel.
The last of these (BBC HD) is currently in a trial stage and is being offered over both Virgin Media V+ and Sky HD (as well as via a very small scale trial using Freeview). It has been decided to apply a Public Value Test (PVT) to the BBC’s proposal to make the BBC HD channel permanent - one component of the PVT is a Market Impact Assessment (MIA). This research will inform that MIA. Research Objectives The central objective of this piece of research was to assess the impact of the BBC launching a BBC HD channel. Specifically the research was intended to:
• Assess the degree to which other services would be affected by the launch of a BBC HD Channel.
6

• Measure the potential likely take-up of the new service amongst current HDTV service users.
• Assess the overall impact that the service will have on current viewing behaviour and usage of other entertainment services/equipment.
• Assess the impact that the new BBC service could have on pay-TV providers.
• Measure the likely take-up of HDTV among potential future users and the likely take-up of the BBC HD Channel.
• Understand the degree to which the BBC HD Channel would affect their decision to take up HDTV.
• Assess whether HDTV and the BBC HD Channel would have an impact on their viewing habits and use of other entertainment services/equipment.
• Forecast the overall impact of the following scenarios:
o The BBC do not launch a new HD channel;
o The BBC offers a 9 hour peak-time BBC HD Channel on DTT, cable and satellite;
o The BBC offers a 4 hour overnight BBC HD Channel on DTT and a 9 hour peak-time BBC HD Channel on cable and satellite.
7

Section 3
Research Methodology Programme of research
Component 1: 400 x 30 minute in home CAPI interviews with subscribers to HDTV. The following minimum quotas were set for each region to ensure that a nationally representative sample of HDTV subscribers was achieved. Region Quota NI Min 4% Wales Min 3% North East Min 4% North West Min 7% Yorkshire Min 6% West Midlands Min 6% East Midlands Min 4% East Anglia Min 2% South West Min 5% South East Min 14% London Min 8% Scotland Min 6%
The following quotas were set for each provider to reflect the current share of HDTV subscribers. Provider Quotas Sky Min 70%
Virgin Min 15% Component 2: 10 x diary-depth interviews with respondents from the quantitative stage. The purpose of this stage was to further our understanding of potential biases and sources of error in respondents’ answers about estimated changes in their viewing habits as a result of subscribing to HDTV.
8
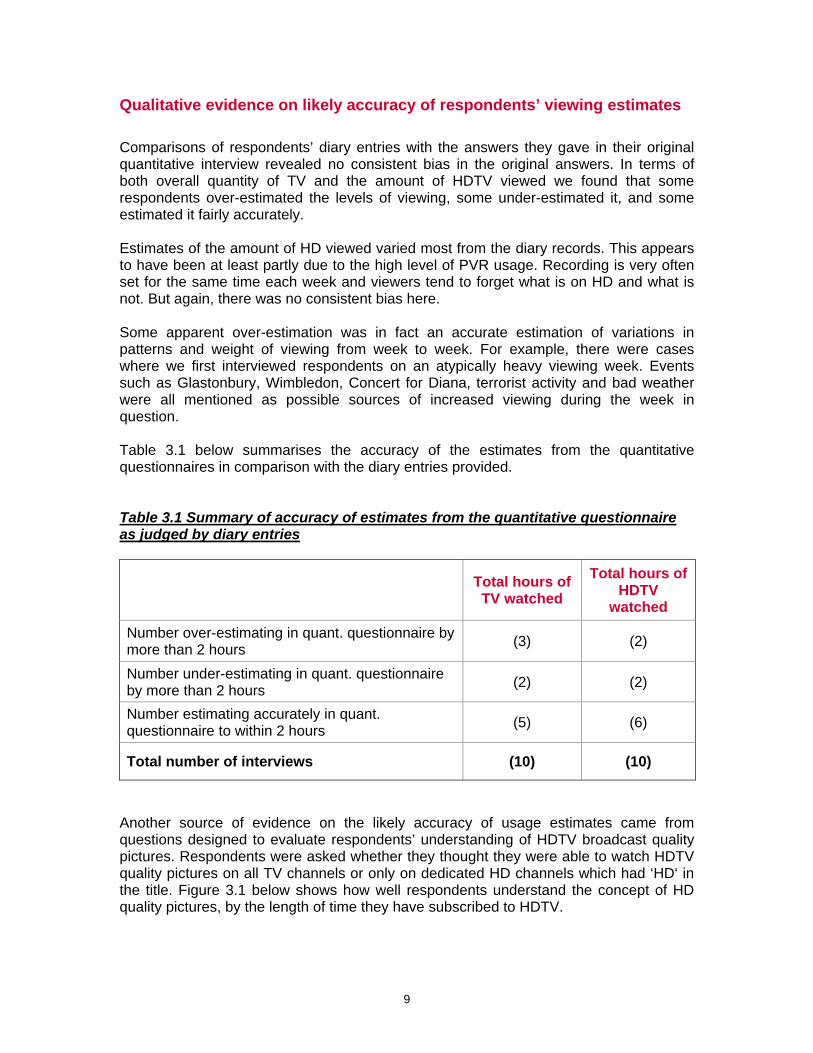
Qualitative evidence on likely accuracy of respondents’ viewing estimates Comparisons of respondents’ diary entries with the answers they gave in their original quantitative interview revealed no consistent bias in the original answers. In terms of both overall quantity of TV and the amount of HDTV viewed we found that some respondents over-estimated the levels of viewing, some under-estimated it, and some estimated it fairly accurately. Estimates of the amount of HD viewed varied most from the diary records. This appears to have been at least partly due to the high level of PVR usage. Recording is very often set for the same time each week and viewers tend to forget what is on HD and what is not. But again, there was no consistent bias here. Some apparent over-estimation was in fact an accurate estimation of variations in patterns and weight of viewing from week to week. For example, there were cases where we first interviewed respondents on an atypically heavy viewing week. Events such as Glastonbury, Wimbledon, Concert for Diana, terrorist activity and bad weather were all mentioned as possible sources of increased viewing during the week in question. Table 3.1 below summarises the accuracy of the estimates from the quantitative questionnaires in comparison with the diary entries provided. Table 3.1 Summary of accuracy of estimates from the quantitative questionnaire as judged by diary entries
Total hours of TV watched
Total hours of HDTV
watched
Number over-estimating in quant. questionnaire by more than 2 hours (3) (2)
Number under-estimating in quant. questionnaire by more than 2 hours (2) (2)
Number estimating accurately in quant. questionnaire to within 2 hours (5) (6)
Total number of interviews (10) (10)
Another source of evidence on the likely accuracy of usage estimates came from questions designed to evaluate respondents’ understanding of HDTV broadcast quality pictures. Respondents were asked whether they thought they were able to watch HDTV quality pictures on all TV channels or only on dedicated HD channels which had ‘HD‘ in the title. Figure 3.1 below shows how well respondents understand the concept of HD quality pictures, by the length of time they have subscribed to HDTV.
9
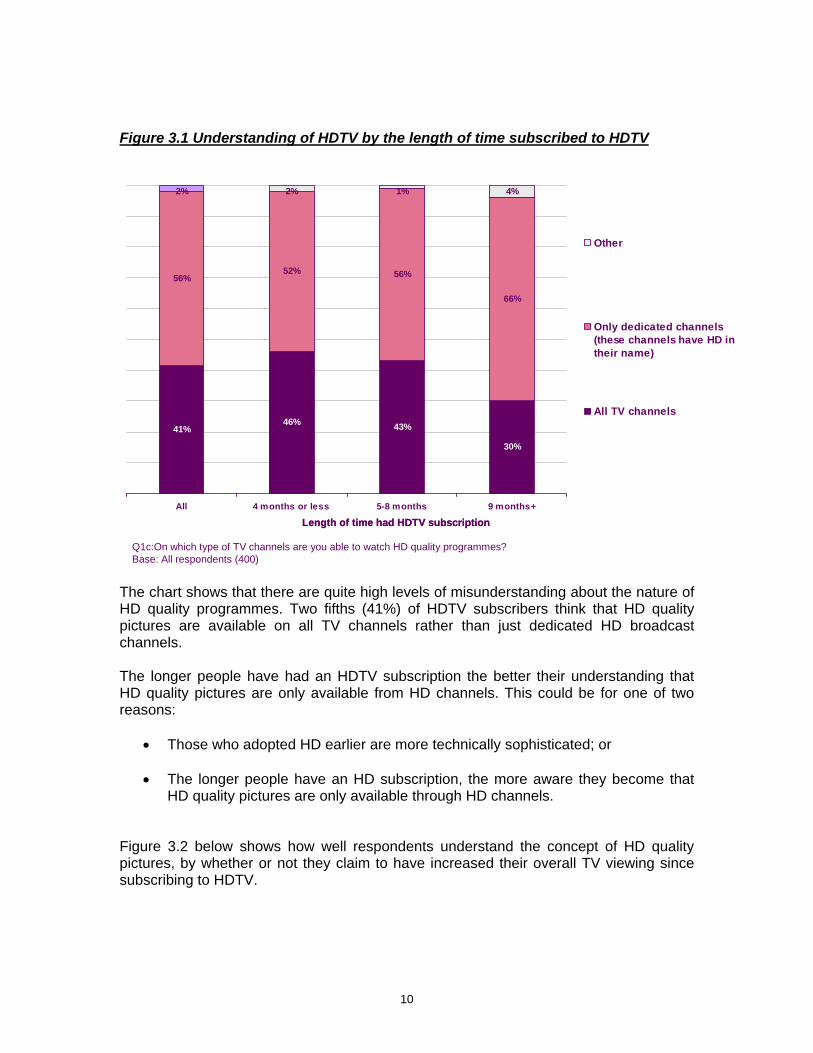
Figure 3.1 Understanding of HDTV by the length of time subscribed to HDTV
Q1c:On which type of TV channels are you able to watch HD quality programmes?Base: All respondents (400)
41%46% 43%
30%
56%52% 56%
66%
2% 1% 4%2%
All 4 months or less 5-8 months 9 months+
Other
Only dedicated channels(these channels have HD intheir name)
All TV channels
Length of time had HDTV subscriptionLength of time had HDTV subscription
The chart shows that there are quite high levels of misunderstanding about the nature of HD quality programmes. Two fifths (41%) of HDTV subscribers think that HD quality pictures are available on all TV channels rather than just dedicated HD broadcast channels. The longer people have had an HDTV subscription the better their understanding that HD quality pictures are only available from HD channels. This could be for one of two reasons:
• Those who adopted HD earlier are more technically sophisticated; or • The longer people have an HD subscription, the more aware they become that
HD quality pictures are only available through HD channels. Figure 3.2 below shows how well respondents understand the concept of HD quality pictures, by whether or not they claim to have increased their overall TV viewing since subscribing to HDTV.
10

Figure 3.2 Understanding of HDTV by whether or not claimed to have increased TV viewing since subscribing to HDTV
Q1c:On which type of TV channels are you able to watch HD quality programmes?Base: All respondents (400)
41%
56%
31%
56%
42%
67%
2% 2%2%
All Increased viewing sincegetting HDTV
No change in viewing
Other
Only dedicatedchannels (thesechannels have HDin their name)
All TV channels
Claimed change in TV viewing since getting HDTV subscriptionClaimed change in TV viewing since getting HDTV subscription
The chart shows that understanding of HDTV is lower among those who claim their viewing has increased since getting HDTV than among those who claim there has been no change in their overall viewing. The figures suggest the need for caution when evaluating the claims of those who claim that their viewing has increased since getting HDTV, as they may be over-inflating the levels of HDTV they are viewing. Cleaning the usage estimate data As we found no consistent bias in reporting usage data across the sample, but a tendency for some respondents to overestimate hours watched and some to underestimate hours watched, the data was cleaned in the following ways:
• Distribution charts were run for all questions involving hours watched to distinguish any outlying cases. These cases were then removed from all analysis of viewing hours.
• The overall change in number of hours was calculated for each respondent to understand the total change. Each case was then tested to make sure their claimed decrease and/or increase in the amount they watched certain channels equalled the total reported change. If any discrepancies were found, the claimed decrease or increase in number of hours watched for certain channels was re-percentaged to match their overall change. Any cases where the discrepancy created an unrealistic scenario were removed from all analysis of viewing hours.
11

Section 4
Profile of current HDTV subscribers Socio-demographic profile Figure 4.1 below shows the socio-demographic profile of respondents in the sample (i.e. HDTV subscribers), compared to the profile of the UK adult population. Figure 4.1 Socio-demographic profile of HDTV subscribers compared to the UK adult population
21%
46%
34%
48%
52%
39%
20%
27%
7%
4%
4%
16%
35%
50%
49%
51%
10%
9%
12%
17%
24%
18%
Under 25
25-44
45+
Male
Female
A
B
C1
C2
D
E
Bar 1UK adult population
Base: All respondents (400)
The chart shows that HDTV subscribers tend to be younger than the general population. They are also much more likely to be from a high social grade, with nearly two fifths (39%) from social grade A.
12

Figure 4.2 below shows the regional profile of respondents in the sample (i.e. HDTV subscribers), compared to the profile of the UK adult population. Figure 4.2 Regional profile of HDTV subscribers compared to the UK adult population
14%
19%
9%
5%
6%
7%
7%
8%
14%
4%
8%
11%
8%
5%
4%
7%
8%
8%
13%
6%
9%
19%
London
South East
South West
Wales
East Anglia
East Mids
West Mids
Yorks/Humb
North West and NI
North East
Scotland
HD TV subscribersUK adult population
Base: All respondents (400)
Minimum quotas were applied to each region to ensure a regional spread of interviewing. If it was difficult to obtain interviews in one region but easy to obtain them in another, the bare minimum would have been interviewed in the first region and additional interviews picked up in the second. The data confirms that HDTV subscription is distributed roughly evenly across the regions.
13

TV screen size and HD subscription Figure 4.3 below shows the TV screen size of respondents in the sample. Figure 4.3 TV Screen size of HDTV subscribers, by gender and HD provider
1% 2% 2%5% 3%7% 5% 6%
13%14%
12%20%
30%
34%
30%
37%
37%42%
32%39%
30%
11% 12% 9% 13%6%
9%
32%
All Male Female Sky Virgin
Don’t know
Over 43"
37" to 42"
32" to 36"
25" to 31"
17" to 24"
Up to 16"
Q1j: What size is the screen on your TV? If you have more than one, I am interested in the main TV you have an HD subscription for.Base: All respondents (400)
Nearly half of HDTV subscribers claim to have a TV screen of 37” or wider. Males and Sky subscribers claim on average to have larger sets than female respondents and Virgin Media subscribers.
14
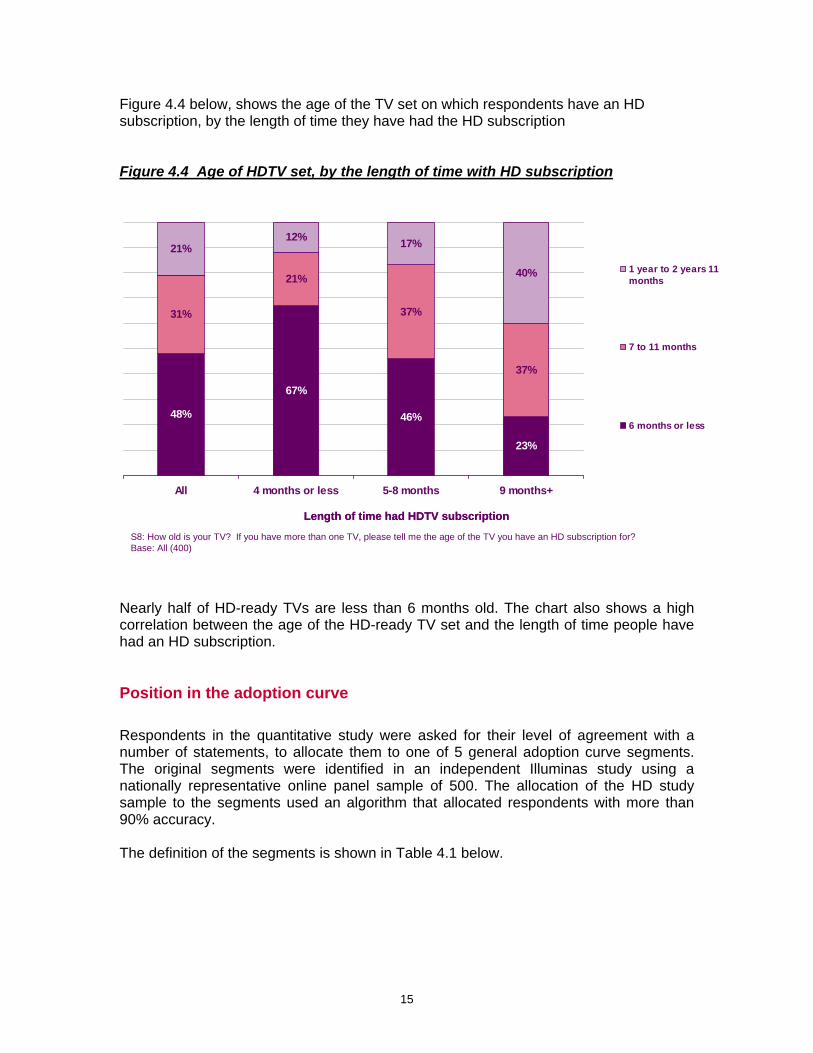
Figure 4.4 below, shows the age of the TV set on which respondents have an HD subscription, by the length of time they have had the HD subscription Figure 4.4 Age of HDTV set, by the length of time with HD subscription
48%
67%
46%
23%
31%
21%
37%
37%
21%12% 17%
40%
All 4 months or less 5-8 months 9 months+
1 year to 2 years 11months
7 to 11 months
6 months or less
S8: How old is your TV? If you have more than one TV, please tell me the age of the TV you have an HD subscription for?Base: All (400)
Length of time had HDTV subscriptionLength of time had HDTV subscription
Nearly half of HD-ready TVs are less than 6 months old. The chart also shows a high correlation between the age of the HD-ready TV set and the length of time people have had an HD subscription. Position in the adoption curve Respondents in the quantitative study were asked for their level of agreement with a number of statements, to allocate them to one of 5 general adoption curve segments. The original segments were identified in an independent Illuminas study using a nationally representative online panel sample of 500. The allocation of the HD study sample to the segments used an algorithm that allocated respondents with more than 90% accuracy. The definition of the segments is shown in Table 4.1 below.
15

Table 4.1 Adoption curve segment definitions
Innovators/ Early adopters Early Majority Mid-market
Connectors Late Majority Laggards
Want to be first to get new products without needing to be influenced
by others to adopt them. Get asked for advice without generally
accepting it themselves.
Like to be amongst the first
to adopt new products but tend
to want to see others using the product or get advice from
others before they adopt a new product. Highly influenced by
peer pressure, the good opinion of others and the need to keep up
with/ ahead of the Jones’s.
Two-way channels for
information about new products.
Their behaviour is not necessarily influenced by
others and they may take and
pass on advice and information
about new products without actually buying
them themselves.
Like to wait until a product has been tried and tested by a lot of other people and has become quite
widespread. Very reliant on the
advice of others before they will
adopt a product.
May never adopt a product even if
most other people have it.
Resistant to influence and
advice of others. May even react
adversely to influence and
advice.
% UK adult population 14% 31% 21% 15% 20%
Figure 4.5 below, shows the proportion of HDTV subscribers falling into each adoption curve segment compared with the proportion in the general adult population. Figure 4.5. Adoption curve segment: HDTV subscribers compared with the general population
21%
15%
20%
31%
14%
4%
12%12%
56%
17%
Innovators/ Early Early Majority Mid-market Late Majority LaggardsAdopters Connectors
UK Population (500) HDTV Subscribers (400)
16

The charts show that HDTV has reached the Early Majority stage of adopters. This group like to be among the first to adopt new products but aim to reduce risk around new product adoption by waiting for others they know to start using a product or getting advice from others before they adopt a new product. This group is also highly influenced by peer pressure, the good opinion of others and the need to keep up with/ ahead of the Joneses. Evidence from the depth interviews confirms that media coverage and backing of major brands, such as Sky, BBC and Virgin, as well as equipment manufacturers like Sony and Panasonic, has greatly reduced perceived risks of adoption and driven take-up rapidly through the adoption curve. For most respondents in the qualitative research, HDTV was either purchased as a status symbol or as a ‘future-proofed’ purchase to avoid getting TV equipment that would be obsolete in a few years time.
17

Section 5
HDTV and its impact on viewing behaviour Adoption of HDTV Figure 5.1 below shows the length of time respondents have had an HDTV subscription.
Figure 5.1. Length of subscription to HDTV
Q2a: For how long has your household had a subscription to HDTV?Base: All respondents (400)
40%
35%
9%
Total
9 months+
5-8 months
4 months orless
The chart shows that HDTV is a very new acquisition for most respondents. 40% have had a subscription to HDTV for 4 months or less and only 1 in 10 has had subscription for more than 9 months.
18
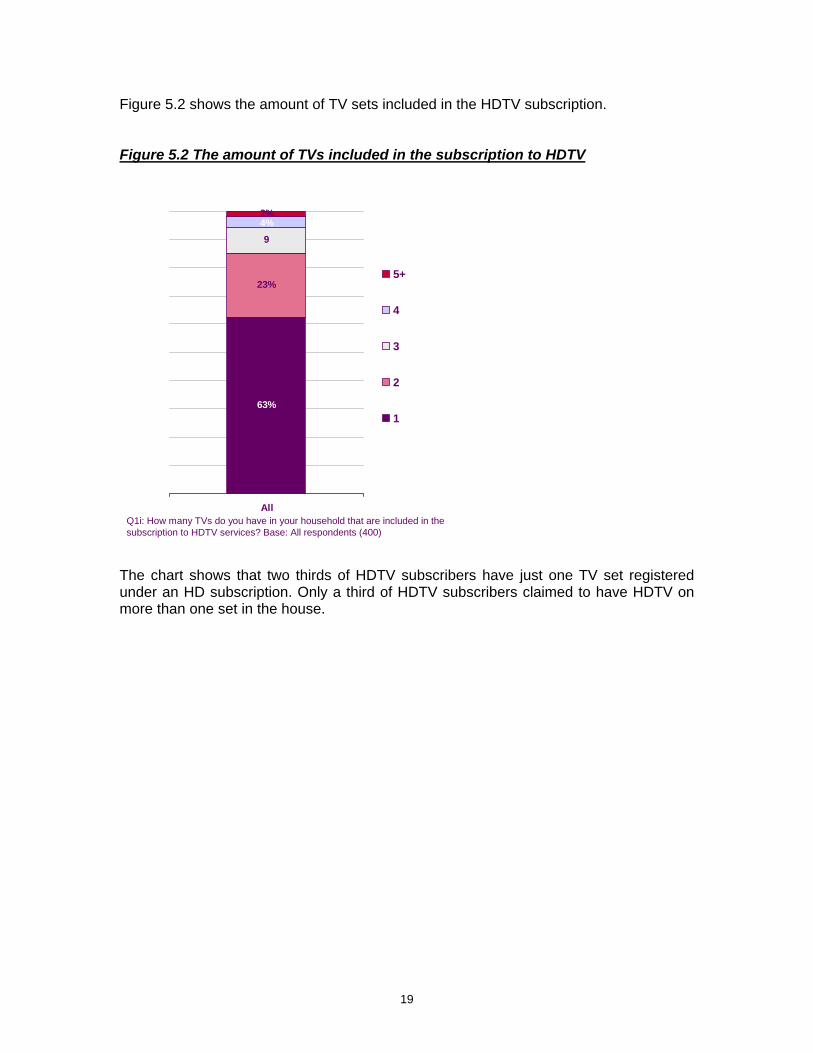
Figure 5.2 shows the amount of TV sets included in the HDTV subscription.
Figure 5.2 The amount of TVs included in the subscription to HDTV
63%
23%
2%
94%
All
5+
4
3
2
1
Q1i: How many TVs do you have in your household that are included in the subscription to HDTV services? Base: All respondents (400)
The chart shows that two thirds of HDTV subscribers have just one TV set registered under an HD subscription. Only a third of HDTV subscribers claimed to have HDTV on more than one set in the house.
19

Evaluation of the HDTV experience The chart below shows respondents’ perceptions of the benefits of HDTV.
Figure 5.3 The main benefits of HDTV
81%
37% 32% 31% 26%4%
Better picturequality generally
Better soundquality generally
Natureprogrammes look
better in HD
Sport looks betterin HD
More TV channels Other
Q2n: Since subscribing to HDTV, what have you found to be the main benefits of it?Base: All respondents (400)
The chart shows that expectations of better picture quality are in general met. In addition, better sound is considered as an advantage by almost two fifths (37%) of respondents. A third of respondents claimed that nature and sport programmes look better in HD. Figure 5.4 below, shows the perception of main benefits of HDTV by gender and Figure 5.5 gives the same information by screen size.
20

Figure 5.4 The main benefits of HDTV by gender
81%
37%32% 31%
26%
83%
38%
22%
79%
36%
29%
21%
29%
4%
36%
43%
4% 4%
Better picturequality generally
Better soundquality generally
Natureprogrammes look
better in HD
Sport looks betterin HD
More TV channels Other
AllMaleFemale
Q2n: Since subscribing to HDTV, what have you found to be the main benefits of it?Base: All respondents (Male: 183; Female: 217)
Males are more likely to comment on the improved look of sport and nature programmes than females. Females are more likely to focus on the increased range of channels that HDTV brings. Figure 5.5 The main benefits of HDTV by TV screen size
37%32% 31%
26%
77%
37%
30% 28%
87%
42% 40%38%
3%
81%
4%
25%19%
30%
71%
4%
43%26%
5%
26% 24%
36%38%
36%
90%
Better picturequality generally
Better sound qualitygenerally
Nature programmeslook better in HD
Sport looks betterin HD
More TV channels Other
Allunder 31inc32-3637-4243+
Q2n: Since subscribing to HDTV, what have you found to be the main benefits of it?Base: All respondents (Male: 183; Female: 217)
21

Improvements in picture quality are more likely to be noticed by those with larger screens. This finding would be consistent with the view, held by some in the industry, that the improved picture quality in HD broadcasts can only be fully appreciated on larger screens. However, in the qualitative research some respondents went further, claiming that the improvement in their viewing experience was due primarily to their having recently acquired a larger and better quality TV screen, and that the HDTV broadcasts only made a secondary (though still important) contribution to the improvement in their viewing experience. The chart below shows how experience of HD compares to respondents’ expectations. Again, this data is shown analysed by screen size. Figure 5.6 HD experience versus expectations by TV screen size
28%19%
27% 31%38%
34%
35%
34%37% 26%
34%30%
29%29%
10% 7%4% 7%
1% 3% 2%
31%
7%
All under 31" 32-36" 37-42" 43"+
Much worse thanyou expected
Slightly worsethan you expected
About the same asyou expected
Slightly better thanyou expected
Much better thanyou expected
Q2p: How has your experience of HDTV compared to your expectations of it?Base: All respondents (400)
The chart shows that experience exceeds expectations for the majority with less than one in ten respondents claiming to be disappointed. Again, those with larger TV sets are generally more impressed by the improvement in quality than those with smaller sets.
22

Figure 5.7 shows the extent to which HDTV picture quality is seen as an improvement on SD TV picture quality. Figure 5.7 Noticeable improvement between HDTV and standard TV by TV screen
size
23% 19% 18%29% 29%
52%49%
56%
53%48%
30% 21%15%
19%
3% 4% 2% 5%1%
21%
3%1%1%
All under 31inc 32-36 37-42 43+
No improvement – HD TVpicture is worse thannormal TV
No improvement – theyare both the same
A slight improvement
A significantimprovement
A drastic improvement
Q2o: How much of an improvement have you noticed between HDTV and normal TV?Base: All respondents (400)
The chart shows that three quarters of respondents have noticed the improvement between HDTV and standard TV. Again the improvement between HD and normal TV is more likely to be noticed by those with larger screens.
Figure 5.8 below, shows how the individual HD channels are received by respondents. (Note: the base size for Sky Arts is very small) Figure 5.8 Attitudes to particular HD channels
47%
36%
35%
33%
30%
30%
27%
25%
24%
42%
46%
46%
57%
49%
44%
47%
52%
58%
8%
11%
19%
7%
22%
23%
7%
20%
17%
3%
3%
13%
3%
1%
7%
5%
2%
1%
National Geographic HD (b=59)
Sky Sports HD (b=74)
Discovery HD (b=72)
Sky Movies HD (b=111)
Sky Box Office HD (b=37)
History Channel HD (b=64)
Sky Arts HD (b=15)
BBC HD (b=153)
Sky One HD (b=113)
I love it I like it a lot I like it a little I don’t particularly like it I don’t like it at all
Q1e_3: How much do you like [channel watched] channel?Base: All watching each channel (bases differ for each channel and are shown on the chart)
2.2
2.9
Mean hours spent
watching
4.1
2.4
4.3
2.0
2.1
2.8
3.3
23

The chart shows the following:
• The HDTV channels are very well liked with the National Geographic HD channel the most widely and well liked of the HD channels.
• Sky Sports seems to be the preferred Sky channel. This is consistent with the fact that, for many, sport was a main reason for getting HDTV in the first place.
• The longer duration of films and sporting events results in more time spent watching Sky Movies HD and Sky Sports HD than other HD channels
Most respondents were impressed with HDTV but there were also some annoyances. These are shown in Figure 5.9. Figure 5.9 Main shortcomings of HDTV
48%
40%
28%
16%
7%
6%
6%
5%
6%
8%
Aren’t enough programmes /channels
Too expensive
Aren’t enough programmes I wantto watch
It will be superseded by anothertechnology sooner or later
Have had technical difficulties withthe equipment
Poor customer service (a Sky orVirgin issue)
Picture quality isn’t good enough
Sound quality isn’t good enough
Took too long to install it (a Sky orVirgin issue)
Other
Q2q: Is there anything that annoys you about HDTV?Base: All respondents (400)
A lack of HD programmes and channels is the major complaint; it was raised by almost a half of respondents. Respondents in the qualitative phase of the study were very excited about the possibility of getting more HD channels and content. The lack of interesting programmes is off-putting for about third of those interviewed. The qualitative research showed that consumers would like to be able to watch all their favourite programming in HD, especially sports programmes. 40% of respondents still think that they pay too much for what they get from their HD subscription.
24

Although, as the qualitative research showed, an important reason for buying an HDTV set was to avoid obsolescence of equipment, there is still a fear (expressed by 16% of respondents) that HD technology will be superseded by another technology in the near future. Technical difficulties with equipment and poor customer service were mentioned as an annoyance by less than 10% of respondents. Problems with regards to time delays and volume differences were mentioned during qualitative interviews.
Current viewing of HDTV Figure 5.10 shows HDTV viewing in comparison to watching a standard TV, by HD provider. Figure 5.10 Hours watching standard TV channels and HDTV, by HD provider
17
5
9
8
16
19Virgin Mediacustomers
Sky customers
All subscribers
Hours watching standard TV channels Hours watching HD TV channels
33%
% of hrs watch HD channel for
37%
22%
Base: All respondents (400)
The chart shows that, among those with an HDTV subscription, claimed HD channel viewing represents a third of all time spent watching TV. Sky customers spend almost twice as much time watching HD channels as Virgin customers (37% vs 22%). This is probably due to the fact that Virgin offers only one linear HD channel in comparison to Sky’s nine linear HD channels. Further, Sky HD customers have made an active choice to pay extra for a HD PVR box and subscription, whereas Virgin customers have HD access and PVR included in their standard subscription.
25

As Figure 5.11 below, shows terrestrial channels are still the most watched by respondents.
Figure 5.11 Top 25 channels watched by frequency of usage
46% 44% 42%39% 38% 38% 37% 37% 37% 37% 35% 33% 33% 32% 32% 31% 29% 28% 27% 27% 26% 26% 25%
7% 9 % 11% 11% 9 % 8 % 8 % 9 %4 %
9 %5%
11%6 %
10 % 12 % 10 % 8 % 9 % 10 % 10 %5% 5% 5%
9 % 7%
63%65%
BBC ONE
ITV1
BBC TWOITV2
Sky O
ne
Sky M
ovies
BBC HD
Five
Sky M
ovies
HD
Chann
el 4
Sky O
ne H
D
BBC THREE
Sky S
ports
1
Discove
ry Chan
nel
E4Fil
m4
UKTV Gold
LIVIN
Gtv
Discove
ry HD
ITV3
Sky S
ports
HD
Sky S
ports
2
Sky M
ovies
Prem
iere
Nation
al Geo
grap
hic
Nation
al Geo
grap
hic H
D
Watch regularly (at least once a week)
Watch occasionally (at least once a month)
All respondents (excluding outliers): Sky subscribers (n=273), NTL subscribers (n=95), All (n=360)
The chart shows that two thirds of respondents watch BBC One and ITV1 at least once a week. Almost a half of respondents (46%) are currently watching BBC HD (38% watch it at least once a week and almost one in ten watches it at least once a month).
Sky Movies HD and Sky One HD are also watched by two fifths of respondents.
26

Impact of adoption of HDTV on viewing behaviour More than two fifths of respondents claim to watch more TV overall since subscribing to HDTV, as can be seen in Figure 5.12. Figure 5.12 The impact of HDTV on TV viewing
14%
29%
57%I watch about
the sameamount of TV
I watch slightlymore TV
I watch muchmore TV
Number of hours watch more TV for
n=150 %
3 hours or less 31%4-5 hours 32%6-10 hours 21%11 hours + 15%Average 8 hours
Q2d Since subscribing to HD TV, do you find that you personally watch more or less TV? (n=400)
A third of those who claimed to watch more TV since getting HDTV claimed to watch up to an extra 3 hours of TV as a result of getting HDTV. One in five watches between 6 and 10 hours more. On average, respondents watch 8 hours more TV since subscribing to the HDTV service.
Younger subscribers (under 25) (47%), more recent subscribers (last 4 months) (40%) and those who felt that HDTV exceeded their expectations (59%) are more likely to have increased the amount of TV that they watch.
In the qualitative stage of the research we found that:
• Some respondents claimed to have increased their viewing to justify the amount they spent on HD.
• TV-on-demand enables people to be in control of their viewing so they can avoid scheduling clashes - e.g. they can record a programme on the Sky Movies SD channel while watching the Sky One HD channel.
• HD also gives consumers more repeat opportunities for watching, which can encourage additional viewing on other HD and even SD channels.
• For most subscribers, the programme is the main driver of TV viewing, not picture quality.
27
• The HD channel is preferred and most will always check whether the programme is being shown on an HD channel before they start watching
• But, most will not choose to watch a HD programme over a programme they like
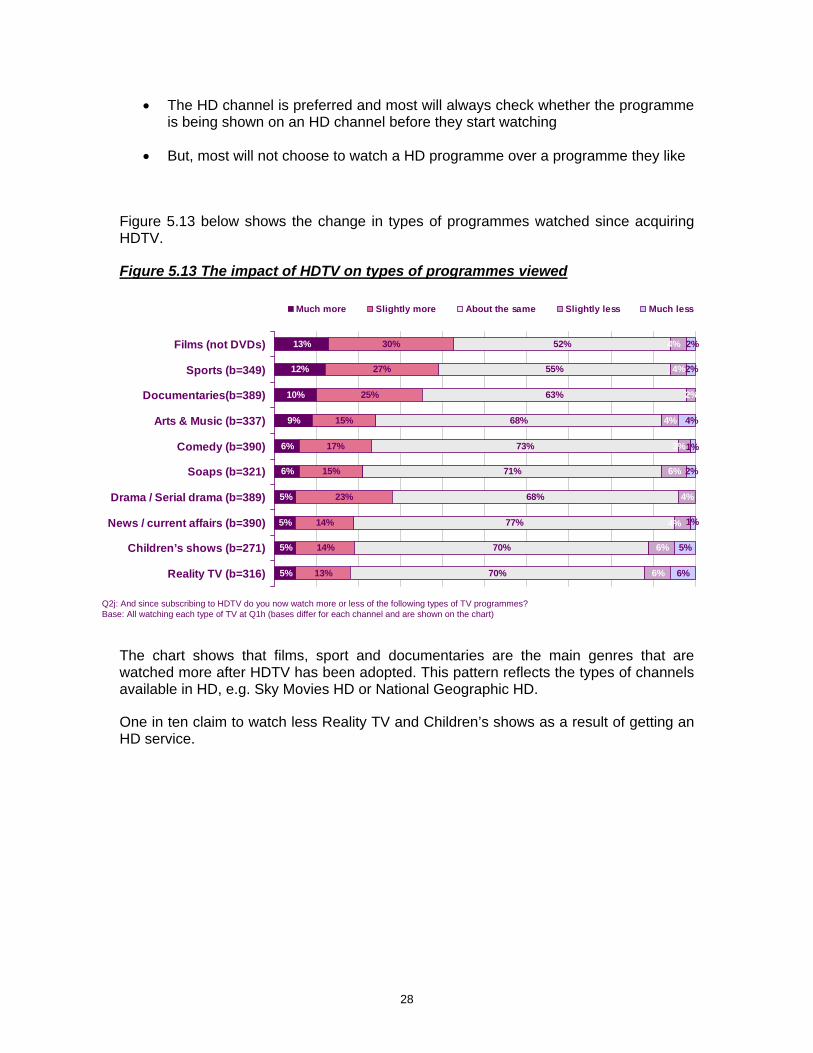
Figure 5.13 below shows the change in types of programmes watched since acquiring HDTV.
Figure 5.13 The impact of HDTV on types of programmes viewed
13%
12%
10%
9%
6%
6%
5%
5%
5%
5%
30%
27%
25%
15%
17%
15%
23%
14%
14%
13%
52%
55%
63%
68%
73%
71%
68%
77%
70%
70%
4%
2%
4%
6%
4%
6%
6%
2%
2%
5%
6%
3%
4%
4%
1%
4%
1%
2%Films (not DVDs)
Sports (b=349)
Documentaries(b=389)
Arts & Music (b=337)
Comedy (b=390)
Soaps (b=321)
Drama / Serial drama (b=389)
News / current affairs (b=390)
Children’s shows (b=271)
Reality TV (b=316)
Much more Slightly more About the same Slightly less Much less
Q2j: And since subscribing to HDTV do you now watch more or less of the following types of TV programmes?Base: All watching each type of TV at Q1h (bases differ for each channel and are shown on the chart)
The chart shows that films, sport and documentaries are the main genres that are watched more after HDTV has been adopted. This pattern reflects the types of channels available in HD, e.g. Sky Movies HD or National Geographic HD.
One in ten claim to watch less Reality TV and Children’s shows as a result of getting an HD service.
28

The chart below shows the impact of HDTV adoption on standard TV channel viewing.
Figure 5.14 Overall change in use of standard TV channels since getting HDTV
25%
12%
10%
29%
23%11+ hours less
5-10 hours less
0-4 hours less
No change
1+ hours more 12%
Overall change in usage of standard TV channels (n=334)
6% 11%
10% 9% 13%
33% 23% 19%
27% 34% 29%
18% 27% 28%
4 mths or less
5-8 mths
9 mths+
Length of time had HDTV subscription
The chart shows that a majority of HDTV subscribers (78%) have decreased their viewing of SD TV channels since obtaining the subscription.
HDTV has had the biggest impact among Sky customers (81% now watch fewer SD channels vs. 67% of Virgin customers). This is probably due to the greater choice of HD channels on Sky.
The chart also shows that the longer respondents have been HDTV subscribers, the greater the reduction in their viewing of SD.
29
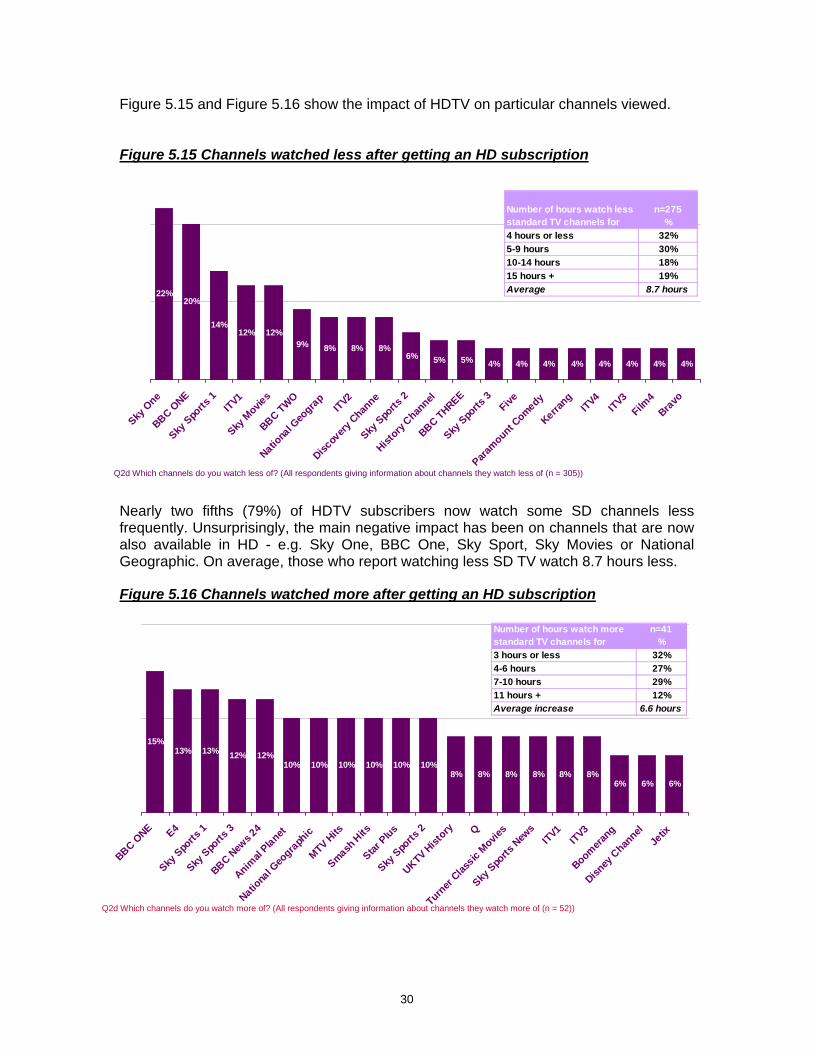
Figure 5.15 and Figure 5.16 show the impact of HDTV on particular channels viewed. Figure 5.15 Channels watched less after getting an HD subscription
14%12% 12%
9% 8% 8% 8%6% 5% 5% 4% 4% 4% 4% 4% 4% 4% 4%
20%22%
Sky O
ne
BBC ONE
Sky S
ports
1ITV1
Sky M
ovies
BBC TWO
Nationa
l Geo
grap
ITV2
Discov
ery C
hanne
Sky S
ports
2
History
Channel
BBC THREE
Sky S
ports
3Five
Paramount C
omedy
Kerrang
ITV4ITV3
Film4
Bravo
Q2d Which channels do you watch less of? (All respondents giving information about channels they watch less of (n = 305))
Number of hours watch less standard TV channels for
n=275 %
4 hours or less 32%5-9 hours 30%10-14 hours 18%15 hours + 19%Average 8.7 hours
Nearly two fifths (79%) of HDTV subscribers now watch some SD channels less frequently. Unsurprisingly, the main negative impact has been on channels that are now also available in HD - e.g. Sky One, BBC One, Sky Sport, Sky Movies or National Geographic. On average, those who report watching less SD TV watch 8.7 hours less.
Figure 5.16 Channels watched more after getting an HD subscription
13% 12% 12%10% 10% 10% 10% 10% 10%
8% 8% 8% 8% 8% 8%6% 6% 6%
13%15%
B
Number of hours watch more standard TV channels for
n=41 %
3 hours or less 32%4-6 hours 27%7-10 hours 29%11 hours + 12%Average increase 6.6 hours
B
C ONE E4
Sky S
ports
1
Sky S
ports
3
BBC New
s 24
Animal
Planet
Nationa
l Geo
graph
ic
MTV Hits
Smash H
its
Star P
lus
Sky S
ports
2
UKTV Hist
ory Q
Turner
Classic
Movies
Sky S
ports
New
sITV1
ITV3
Boomerang
Disney
Chan
nelJe
tix
Q2d Which channels do you watch more of? (All respondents giving information about channels they watch more of (n = 52))
30
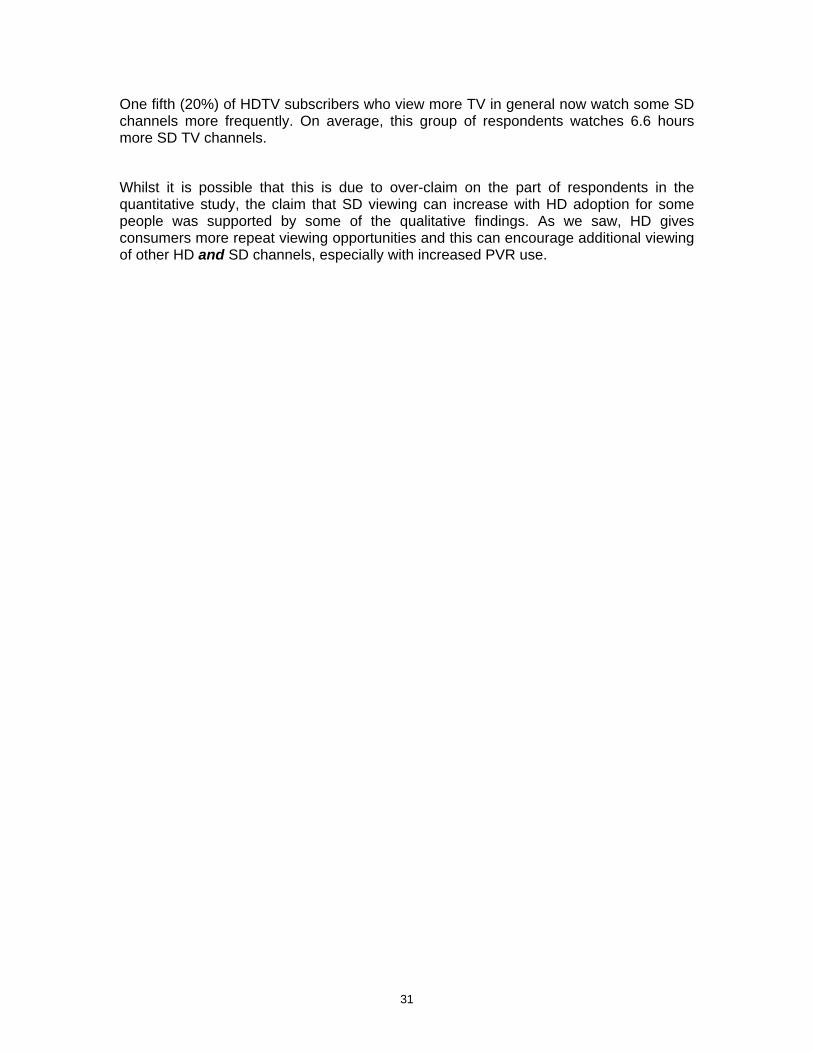
One fifth (20%) of HDTV subscribers who view more TV in general now watch some SD channels more frequently. On average, this group of respondents watches 6.6 hours more SD TV channels.
Whilst it is possible that this is due to over-claim on the part of respondents in the quantitative study, the claim that SD viewing can increase with HD adoption for some people was supported by some of the qualitative findings. As we saw, HD gives consumers more repeat viewing opportunities and this can encourage additional viewing of other HD and SD channels, especially with increased PVR use.
31
Section 6
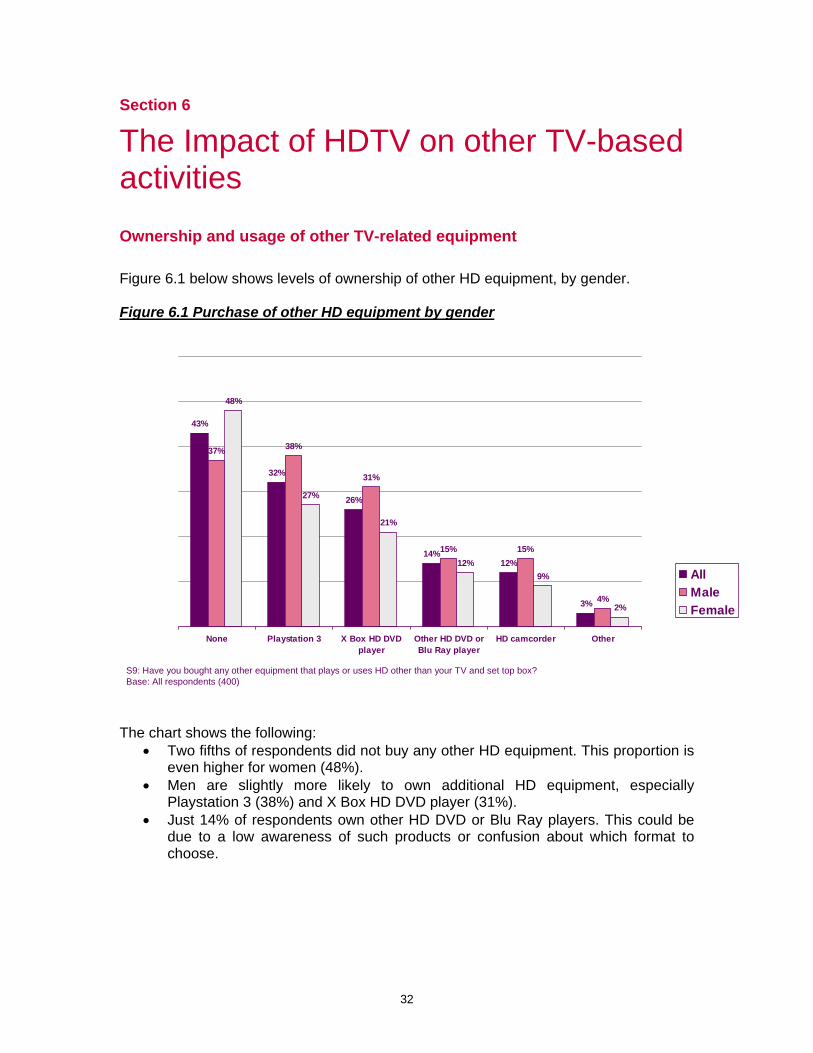
The Impact of HDTV on other TV-based activities Ownership and usage of other TV-related equipment Figure 6.1 below shows levels of ownership of other HD equipment, by gender. Figure 6.1 Purchase of other HD equipment by gender
S9: Have you bought any other equipment that plays or uses HD other than your TV and set top box?Base: All respondents (400)
43%
32%
26%
14%12%
3%
37% 38%
31%
15% 15%
4%
48%
27%
21%
12%9%
2%
None Playstation 3 X Box HD DVDplayer
Other HD DVD orBlu Ray player
HD camcorder Other
AllMaleFemale
The chart shows the following:
• Two fifths of respondents did not buy any other HD equipment. This proportion is even higher for women (48%).
• Men are slightly more likely to own additional HD equipment, especially Playstation 3 (38%) and X Box HD DVD player (31%).
• Just 14% of respondents own other HD DVD or Blu Ray players. This could be due to a low awareness of such products or confusion about which format to choose.
32

Figure 6.2 shows how purchase of additional HD equipment differs by age.
Figure 6.2 Purchase of other HD equipment by age
S9: Have you bought any other equipment that plays or uses HD other than your TV and set top box?Base: All respondents (400)
14%
29%
15% 15%
34%
12%
3%
12%
26%
32%
43%
4%
40%38%
3%
16%16%
39%
30%
2%
9%9%
17%
63%
None Playstation 3 X Box HD DVDplayer
Other HD DVD orBlu Ray player
HD camcorder Other
AllUnder 2525-4445+
The chart shows that the under 45s are much more likely to have at least one type of additional HD equipment. Two thirds of the over 45s do not have any additional HD equipment, compared to only one third of under 25 year olds.
33

Impact of HDTV adoption on use of other TV-related equipment Figure 6.3 below shows the use of other TV–related equipment.
Figure 6.3 The amount of hours spent watching different types of DVDs
19%
25%
31%
30%
33%
27% 12%
4%
4%
12%
1%
1%Watching videos or nonHD DVDs (b=400)
Watching HD DVDs or BluRay DVDs (b=212)
0 1-2hours 3-5 hours 6-10 hours 11-20 hours 21+
Q1l: Roughly how many hours a week do you spend doing each of the following?Bases differ for each and are shown on the chart
The chart shows that non-HD DVDs and videos are still watched more than HD or Blu Ray DVDs. Among those who actually have other HD equipment, one in four does not use it for HD DVD watching, probably because they tend to use it for other purposes, e.g. gaming.
34

Figure 6.4 shows the impact of HD subscription on videos and non-HD DVD viewing.
Figure 6.4 The impact of HD subscription on non-HD DVDs and video viewing
Q2k: Since subscribing to HDTV do you now spend more or less time watching videos and non-HD DVDs?Base: All who spend at least one hour a week watching videos / DVDs (Males: 155; Females: 169)
3%
11%
62%
19%
5%5%
12%
65%
5%2%
11%
60%
23%
5%
15%
I spend much moretime watching videos
and non-HD DVDs
I spend slightly moretime watching videos
and non-HD DVDs
I spend about thesame amount of timewatching videos and
non-HD DVDs
I spend slightly lesstime watching videos
and non-HD DVDs
I spend much lesstime watching videos
and non-HD DVDs
AllMaleFemale
The chart shows that, for two thirds of respondents, getting HD did not have any impact on their non-HD DVD viewing. However, overall there has been a slight net decrease in watching non-HD DVDs and videos since subscribing to HDTV. The chart also shows that females have reduced non-HD video/DVD use to a slightly greater degree than males.
35
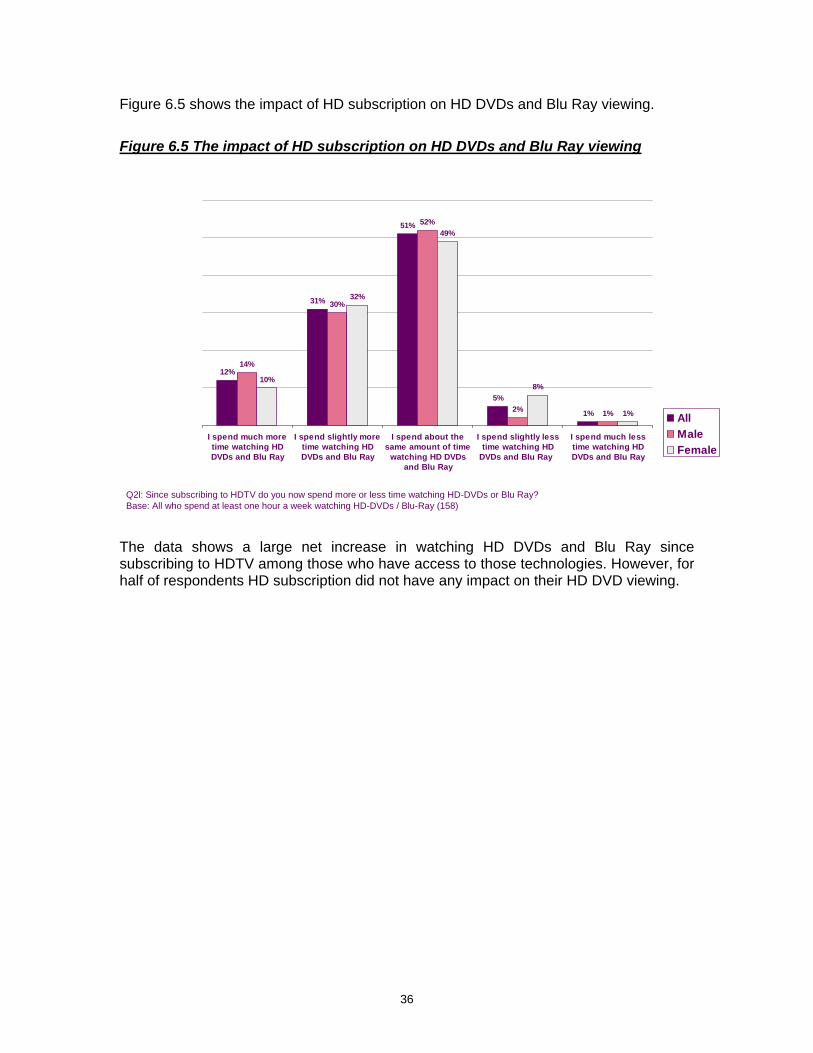
Figure 6.5 shows the impact of HD subscription on HD DVDs and Blu Ray viewing.
Figure 6.5 The impact of HD subscription on HD DVDs and Blu Ray viewing
Q2l: Since subscribing to HDTV do you now spend more or less time watching HD-DVDs or Blu Ray?Base: All who spend at least one hour a week watching HD-DVDs / Blu-Ray (158)
12%
31%
51%
5%
14%
30%
52%
10%
32%
49%
8%
1%1% 1%2%
I spend much moretime watching HDDVDs and Blu Ray
I spend slightly moretime watching HDDVDs and Blu Ray
I spend about thesame amount of time
watching HD DVDsand Blu Ray
I spend slightly lesstime watching HD
DVDs and Blu Ray
I spend much lesstime watching HDDVDs and Blu Ray
AllMaleFemale
The data shows a large net increase in watching HD DVDs and Blu Ray since subscribing to HDTV among those who have access to those technologies. However, for half of respondents HD subscription did not have any impact on their HD DVD viewing.
36

The chart below shows the impact of HD subscription on playing computer games. Figure 6.6 The impact of HD subscription on playing console or computer games
Q2m: Since subscribing to HDTV do you now spend more or less time playing console or computer games?Base: All who spend at least one hour a week playing console / computer games (Males: 137; Females: 136)
5%
16%
66%
12%
7%
20%
61%
4%
13%
71%
13%
1%
12
I spend much more timeplaying
console/computergames
I spend slightly moretime playing console /
computer games
I spend about the sameamount of time playing
console / computergames
I spend slightly less timeplaying console /computer games
I spend much less timeplaying console /computer games
All Male Female Subscribing to HDTV has resulted in a slight net increase in gaming, with one in five claiming to play computer games more and only 12% claiming to play less. Males have increased games usage to a greater degree than females.
37

Section 7
Perceptions and usage of the trial BBC HD channel Awareness and viewing of the trial BBC HD channel Figure 7.1 shows awareness and viewing of the trial BBC HD channel.
Figure 7.1 Awareness and viewing of BBC HD by age and gender
38% 34% 33%
48% 48%
30%
8%9% 8%
8% 11%
6%
18%29%
15%
14%19%
17%
10%
15%
7%
7%
14%
18%29%
23%16%
32%
11%
25%
All Under 25 25-44 45+ Male Female
Unaware of BBC HD
Aware of BBC HD buthavent watched
Aware of BBC HD,havent watched in lastmonth, but havewatched at some point
Watch BBC HD at leastonce a month
Watch BBC HD at leastonce a week
Q1d: Which TV channels do you watch regularly (i.e. at least once a week)?Q1e: Which TV channels do you watch occasionally (i.e. at least once a month)?Q3a: Were you aware that there is a BBC HD channel which shows a range of BBC programmes in High Definition for a few hours each day?Base: All respondents (400; Under 25: 82; 25-44: 184, 45+: 134; Male: 183; Female: 217)
The chart shows the following:
• High awareness and reported viewing of the trial BBC HD channel, especially among older viewers and men.
• 1 in 4 is not aware of BBC HD. Those unaware are most likely to be in 25-44 age bracket (29%) or female (32%).
• Almost a half of over 45s watch BBC HD at least once a week.
• Three quarters of men reported watching BBC HD at some point, including 48% who watch it at least once a week.
38

Figure 7.2 below, shows preferences between the trial BBC HD channel and SD BBC channels when the programme is the same.
Figure 7.2 Choice between BBC1 and BBC HD
Q3c: Can you recall a time when there was a programme you wanted to watch that was on BBC1 and BBC HD at the same time?Q3d: Which channel did you watch it on?Q3e: Why did you watch it on BBC1 and not BBC HD?Base: All who have ever watched BBC HD (257 ), all who recall a time when programme available on both channels (104), all who watched on BBC1 (12)
60%
40%
Can you recall a time when therewas a programme you wanted towatch that was on BBC1 and BBC
HD at the same time?
Yes
No
87%
12%
Which channel did you watch iton?
BBC 1
BBC HD
Can'tremember 2I wanted to watch it on a TV in my
house that doesn’t have HD
3It's the same picture on both channels
6I was already watching BBC 1
6I forgot to check the HD channel
RespondentsReason for choosing BBC1
2I wanted to watch it on a TV in my house that doesn’t have HD
3It's the same picture on both channels
6I was already watching BBC 1
6I forgot to check the HD channel
RespondentsReason for choosing BBC1
The chart shows that when respondents could watch the same programme on both channels, they were more likely to choose the HD version (87% versus 12%). Of the 17 respondents who watched a programme on BBC1 rather than on BBC HD, six forgot to check the HD channel, another six were already watching BBC1, three believe that there is no difference in picture quality between the two channels, and two simply wanted to watch the programme on a TV that didn’t have HD.
39

Figure 7.3 below shows preferences between BBC HD and SD BBC channels when the programme is the same among those who could not recall an occasion when the same programme was being shown on both channels.
Figure 7.3 Choice between BBC1 and BBC HD in future
Q3f: Which channel do you think you would watch it on if this happened?Base: All who have ever watched BBC HD but do not recall a time when programme available on both channels (153)
7%
27%
66%
Which channel do you think youwould watch it on if this
happened?
BBC HD
BBC 1
Don't know /it depends
Those who have not experienced this situation also thought they would probably choose BBC HD (66% versus 7%). Just over a quarter (27%) of respondents were not sure what they would do in such situation.
Figure 7.4 shows reasons given for not watching the BBC HD channel. Figure 7.4 Reasons behind not watching the BBC HD
Q3k: Why don’t you watch the BBC HD channel?Base: All aware but who have never watched the BBC HD channel (44)
41%
25%
25%
7%
2%
14%
I don’t want to watch any of the programmeson it
The programmes are all on normal BBCchannels and I would rather watch those
The programmes aren't on at the time I wantto watch them
I didn’t know about it
Other
Don’t know
40
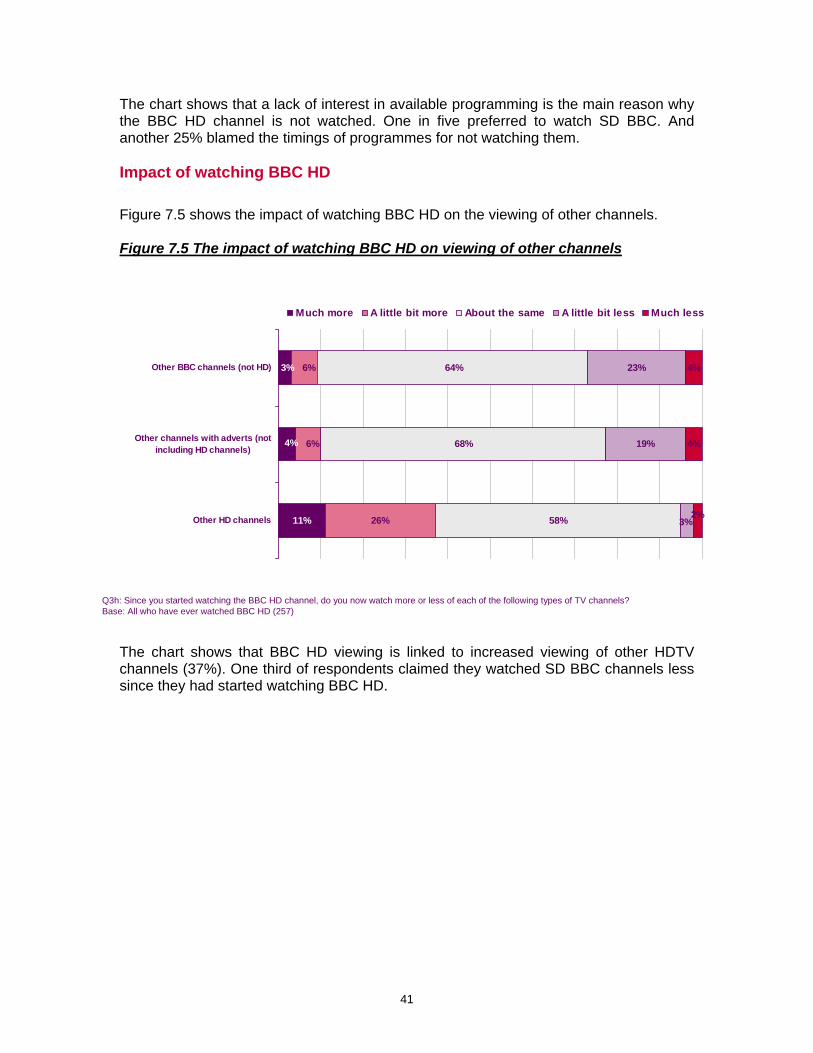
The chart shows that a lack of interest in available programming is the main reason why the BBC HD channel is not watched. One in five preferred to watch SD BBC. And another 25% blamed the timings of programmes for not watching them. Impact of watching BBC HD Figure 7.5 shows the impact of watching BBC HD on the viewing of other channels. Figure 7.5 The impact of watching BBC HD on viewing of other channels
11% 26%
68%
58%
23%
19%
4%
4%4%
3%
6%
6% 64%
3%2%
Other BBC channels (not HD)
Other channels with adverts (notincluding HD channels)
Other HD channels
Much more A little bit more About the same A little bit less Much less
Q3h: Since you started watching the BBC HD channel, do you now watch more or less of each of the following types of TV channels?Base: All who have ever watched BBC HD (257)
The chart shows that BBC HD viewing is linked to increased viewing of other HDTV channels (37%). One third of respondents claimed they watched SD BBC channels less since they had started watching BBC HD.
41

Figures 7.6 and 7.7 show the impact of the trial BBC HD channel on the amount of TV watching and how it varies by age, gender and the length of HDTV subscription.
Figure 7.6 The impact of BBC HD trial on the amount of TV watched, by age and
gender
8% 8% 12%3%
9% 6%
21%31% 24%
13%
23%19%
56% 63%
82%
66%71%
68%
3% 3%
All Under 25 25-44 45+ Male Female
Don’t know
Slightly less TV
About the same
Slightly more TV
Much more TV
Q3g: How has watching the BBC HD trial channel affected the amount of TV you watch?Base: All who have ever watched BBC HD (257)
The chart shows that since starting to watch the trial BBC HD channel, one third of respondents had increased the amount of TV they watch overall. This effect was more pronounced among younger and mid-age groups and among males (32% compared with 25% for females). For the majority of over 45s, the trial BBC HD channel had no impact on overall TV watching.
42

Figure 7.7 The impact of BBC HD trial watching on overall TV viewing by the length of HDTV subscription
8% 8% 12%1%
21% 26% 17%
22%
65%65% 75%68%
1% 4% 1%2%
All 4 months or less 5-8 months 9 months+
Don’t know
Slightly less TV
About the same
Slightly more TV
Much more TV
Q3g: How has watching the BBC HD trial channel affected the amount of TV you watch?Base: All who have ever watched BBC HD (257)
Length of time had subscription to HD TV
Figure 7.7 shows that overall TV viewing has increased slightly more among more recent HDTV subscribers (34%). Three quarters of those who have had a subscription for more than 9 months had not changed their viewing behaviour.
43

Figure 7.8 and 7.9 show the impact of the trial BBC HD channel on hard disk recorder use and how it varies by age and screen size.
Figure 7.8 The impact of BBC HD trial viewing on a hard disk recorder use by age
Q3j: Would you say that your viewing of the BBC HD channel has had any impact on how much you use your hard disc recorder to pause and record programmes?Base: All respondents (257)
30%
17%
35% 34%
43%
47%
42% 40%
12%
7% 6%14%
13% 15%
3%5%
2% 3%2% 5% 2% 1%
8%
14%
All Under 25 25-44 45+
Don’t know
I never use my hard disc
I can’t say as I got my hard discrecorder at the same time
I now use my hard disc recorderless
I use my hard disc recorder thesame as I used to
I use my hard disc recorder morethan I used to
Figure 7.8 shows that BBC HD trial viewing is connected to increased PVR usage (30%), especially among the over 25s.
Figure 7.9 The impact of BBC HD trial viewing on a hard disk recorder use by
screen size
Q3j: Would you say that your viewing of the BBC HD channel has had any impact on how much you use your hard disc recorder to pause and record programmes?Base: All respondents (257)
30%21%
29% 31%
45%
43%
43%40%
46%
39%
17% 4%
9%3%
17%
21%7%
13%3%
2%4% 4%
2% 3% 4%
8%
14%
All under 31inc 32-36 37-42 43+
Don’t know
I never use my hard disc
I can’t say as I got my hard discrecorder at the same time
I now use my hard disc recorderless
I use my hard disc recorder thesame as I used to
I use my hard disc recorder morethan I used to
44

Figure 7.9 shows that those with larger TV screens have increased their PVR usage more than have those with smaller screens. 45% of those with a 43”+ screen claim to have increased their hard disc recorder use compared with only 21% of those who have the smallest TV screen size.
Figure 7.10 shows the impact of the trial BBC HD channel viewing on HD DVD and Blu Ray purchase.
Figure 7.10 The impact of BBC HD viewing on HD DVD and Blu Ray purchase
Q3i: Would you say that your viewing of the BBC HD channel had any influence on your decision to buy your HD DVD or Blu Ray player?Base: All who have ever watched BBC HD and also have HD DVD or Blu Ray recorder (88)
22%
32%
2%
17%
27%
All
Don’t know
It had no influence - I already had my HDDVD / Blu Ray player before I ever watchedBBC HD
I bought my HD DVD / Blu Ray player afterwatching BBC HD but it had no influence
It had some influence
It had a lot of influence
The BBC HD trial has had considerable influence on the decision to buy HD DVD or Blu Ray. More than half of respondents who watched the trial BBC HD channel and have HD DVD/ Blu Ray claimed that the TV channel had a lot or at least some influence on their purchase decision. One third said that it had no impact.
45
Section 8
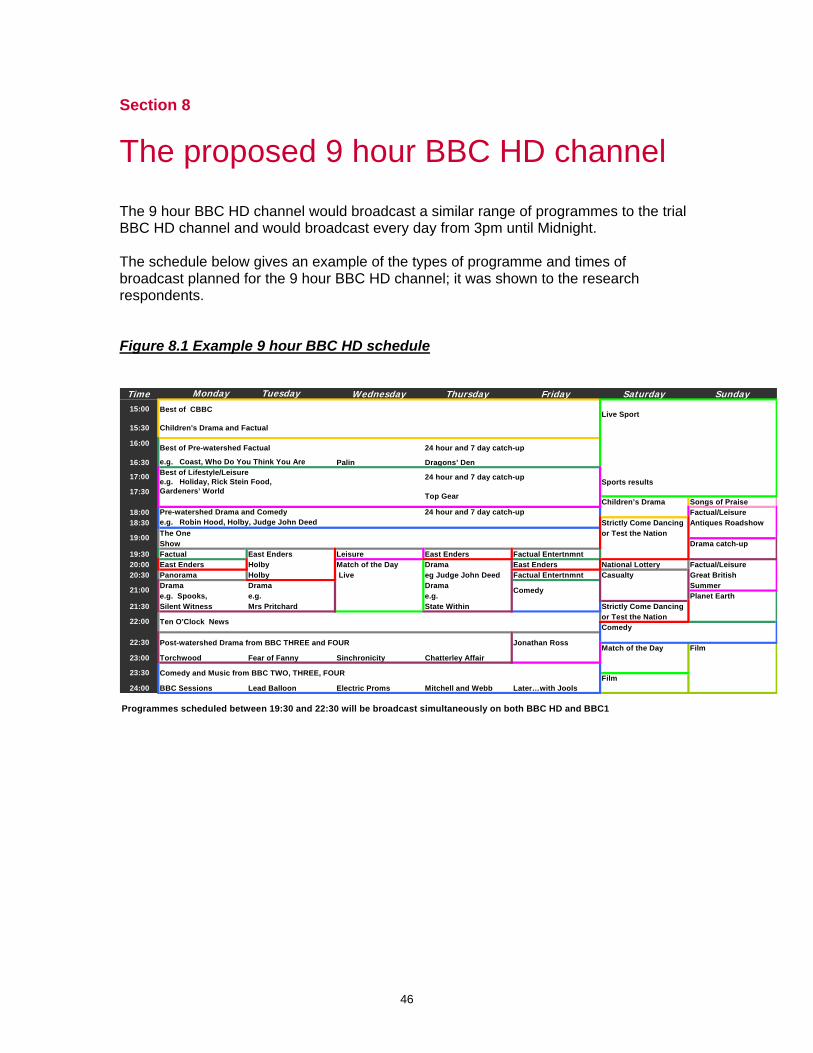
The proposed 9 hour BBC HD channel The 9 hour BBC HD channel would broadcast a similar range of programmes to the trial BBC HD channel and would broadcast every day from 3pm until Midnight. The schedule below gives an example of the types of programme and times of broadcast planned for the 9 hour BBC HD channel; it was shown to the research respondents. Figure 8.1 Example 9 hour BBC HD schedule
Time Wednesday Thursday Friday Saturday Sunday
Live Sport
16:00
16:30 Palin Dragons’ Den
Sports results17:30
Children’s Drama Songs of Praise18:00 Factual/Leisure18:30 Strictly Come Dancing Antiques Roadshow
The One or Test the NationShow Drama catch-up
19:30 Factual East Enders Leisure East Enders Factual Entertnmnt20:00 East Enders Holby Match of the Day Drama East Enders National Lottery Factual/Leisure20:30 Panorama Holby Live eg Judge John Deed Factual Entertnmnt Casualty Great British
Drama Drama Drama Summere.g. Spooks, e.g. e.g. Planet Earth
21:30 Silent Witness Mrs Pritchard State Within Strictly Come Dancing or Test the NationComedy
Match of the Day Film23:00 Torchwood Fear of Fanny Sinchronicity Chatterley Affair
Film
24:00 BBC Sessions Lead Balloon Electric Proms Mitchell and Webb Later…with Jools
Programmes scheduled between 19:30 and 22:30 will be broadcast simultaneously on both BBC HD and BBC1
Jonathan Ross
23:30 Comedy and Music from BBC TWO, THREE, FOUR
22:30 Post-watershed Drama from BBC THREE and FOUR
Comedy
22:00
21:00
Ten O'Clock News
Pre-watershed Drama and Comedy 24 hour and 7 day catch-upe.g. Robin Hood, Holby, Judge John Deed
19:00
Gardeners’ World
24 hour and 7 day catch-up
Top Gear
e.g. Coast, Who Do You Think You Are
17:00 Best of Lifestyle/Leisuree.g. Holiday, Rick Stein Food,
Best of Pre-watershed Factual 24 hour and 7 day catch-up
Children's Drama and Factual
Monday Tuesday15:00 Best of CBBC
15:30
46
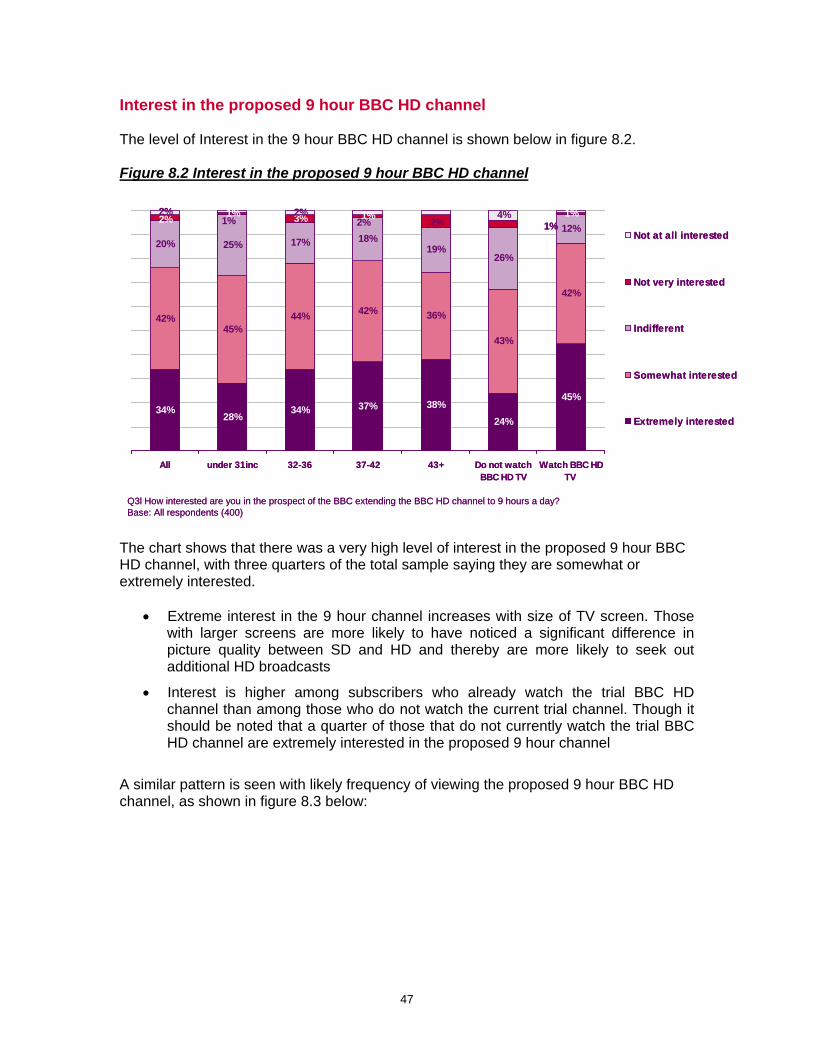
Interest in the proposed 9 hour BBC HD channel The level of Interest in the 9 hour BBC HD channel is shown below in figure 8.2. Figure 8.2 Interest in the proposed 9 hour BBC HD channel
34%28%
34% 37% 38%24%
45%
42%45%
44% 42% 36%
43%
42%
20% 25% 17% 18%19%
26%
12%1% 3% 1% 1%2%
2% 1% 2% 2% 1%4%2%
All under 31inc 32-36 37-42 43+ Do not watchBBC HD TV
Watch BBC HDTV
Not at all interested
Not very interested
Indifferent
Somewhat interested
Extremely interested
Q3l How interested are you in the prospect of the BBC extending the BBC HD channel to 9 hours a day?Base: All respondents (400)
The chart shows that there was a very high level of interest in the proposed 9 hour BBC HD channel, with three quarters of the total sample saying they are somewhat or extremely interested.
• Extreme interest in the 9 hour channel increases with size of TV screen. Those with larger screens are more likely to have noticed a significant difference in picture quality between SD and HD and thereby are more likely to seek out additional HD broadcasts
• Interest is higher among subscribers who already watch the trial BBC HD channel than among those who do not watch the current trial channel. Though it should be noted that a quarter of those that do not currently watch the trial BBC HD channel are extremely interested in the proposed 9 hour channel
A similar pattern is seen with likely frequency of viewing the proposed 9 hour BBC HD channel, as shown in figure 8.3 below:
47
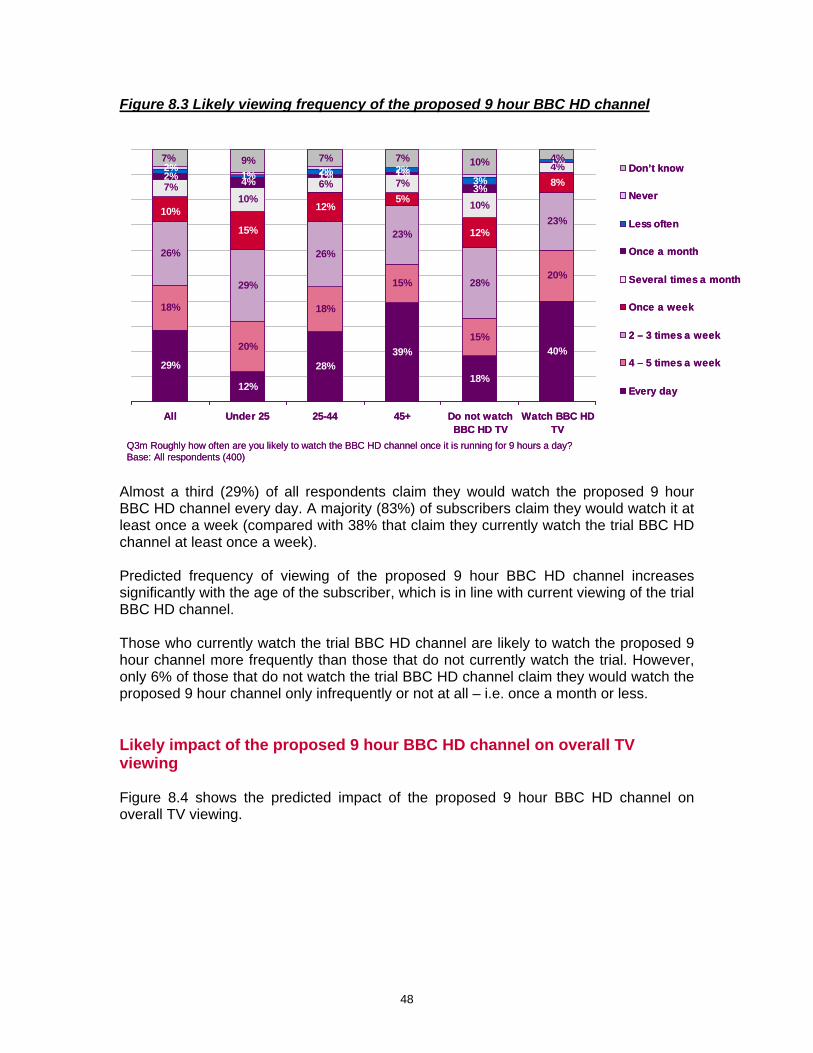
Figure 8.3 Likely viewing frequency of the proposed 9 hour BBC HD channel
29%
12%
28%39%
18%
40%
18%
20%
18%
15%
15%
20%
26%
29%
26%
23%
28%
23%15%
12%5%
12%
8%10%
6% 7%
10%
4%4% 1% 1%
3%1% 2% 2%
3%
1%9% 7% 7% 10% 4%
10%
7%2%2%7%
All Under 25 25-44 45+ Do not watchBBC HD TV
Watch BBC HDTV
Don’t know
Never
Less often
Once a month
Several times a month
Once a week
2 – 3 times a week
4 – 5 times a week
Every day
Q3m Roughly how often are you likely to watch the BBC HD channel once it is running for 9 hours a day?Base: All respondents (400)
29%
12%
28%39%
18%
40%
18%
20%
18%
15%
15%
20%
26%
29%
26%
23%
28%
23%15%
12%5%
12%
8%10%
6% 7%
10%
4%4% 1% 1%
3%1% 2% 2%
3%
1%9% 7% 7% 10% 4%
10%
7%2%2%7%
All Under 25 25-44 45+ Do not watchBBC HD TV
Watch BBC HDTV
Don’t know
Never
Less often
Once a month
Several times a month
Once a week
2 – 3 times a week
4 – 5 times a week
Every day
Q3m Roughly how often are you likely to watch the BBC HD channel once it is running for 9 hours a day?Base: All respondents (400)
Almost a third (29%) of all respondents claim they would watch the proposed 9 hour BBC HD channel every day. A majority (83%) of subscribers claim they would watch it at least once a week (compared with 38% that claim they currently watch the trial BBC HD channel at least once a week). Predicted frequency of viewing of the proposed 9 hour BBC HD channel increases significantly with the age of the subscriber, which is in line with current viewing of the trial BBC HD channel. Those who currently watch the trial BBC HD channel are likely to watch the proposed 9 hour channel more frequently than those that do not currently watch the trial. However, only 6% of those that do not watch the trial BBC HD channel claim they would watch the proposed 9 hour channel only infrequently or not at all – i.e. once a month or less. Likely impact of the proposed 9 hour BBC HD channel on overall TV viewing Figure 8.4 shows the predicted impact of the proposed 9 hour BBC HD channel on overall TV viewing.
48

Figure 8.4 Impact of 9 hour BBC HD channel on overall TV viewing
10% 7%14%
32%28%
35%
52%56%
48%
1%7%1%
1%2%
All Do not watch BBC HD TV Watch BBC HD TV
Don’t know
Much less than now
Slightly less than now
About the same as now
Slightly more than now
Much more than now
Q3n How would the expansion of the BBC HD channel to 9 hours a day affect your TV viewing? Would you watch TV... Base: All likely to watch BBCHD once it is running for 9 hours a day (397)
10% 7%14%
32%28%
35%
52%56%
48%
1%7%1%
1%2%
All Do not watch BBC HD TV Watch BBC HD TV
Don’t know
Much less than now
Slightly less than now
About the same as now
Slightly more than now
Much more than now
Q3n How would the expansion of the BBC HD channel to 9 hours a day affect your TV viewing? Would you watch TV... Base: All likely to watch BBCHD once it is running for 9 hours a day (397) The chart shows that half (52%) of the subscribers who would watch the proposed 9 hour BBC HD channel claim they would watch the same amount of TV as they do now. A further two fifths (42%) would watch more TV overall than they do currently. Those that currently watch the trial BBC HD channel are slightly more likely to increase their overall TV viewing than subscribers that do not watch it at the moment.
Figure 8.5 below shows the likely impact of the proposed 9 hour BBC HD channel on viewing of other channels.
49

Figure 8.5. Whether viewing of any other channels would be reduced with the introduction of the proposed 9 hour BBC HD channel
25% 31% 28%17% 18%
33%
75% 69% 72%83% 82%
67%
All Under 25 25-44 45+ Do not watchBBC HD TV
Watch BBCHD TV
No
Yes
Q3o Are there any TV channels that you think you would watch less once the BBC HD channel is extended to 9 hours a day?Base: All likely to watch BBCHD once it is running for 9 hours a day (397)
A quarter (25%) of subscribers who would watch the proposed 9 hour BBC HD channel claim that it would result in them watching less of other TV channels.
• Younger subscribers are more likely than older subscribers to claim that viewing the 9 hour BBC HD channel would reduce their viewing of other TV channels.
• Those that watch the trial BBC HD channel are more likely than non-viewers to reduce their viewing of other channels.
Figure 8.6 below shows the channels that are likely to be viewed less if the 9 hour BBC HD channel was introduced.
50

Figure 8.6 Channels that would be viewed less if 9 hour BBC HD Channel was introduced
10% 8% 6% 5% 4% 4% 4% 4% 4% 4% 4% 4% 4% 4% 4% 4% 4% 4% 4%
13%
45%
BBC ONE
BBC TWO
BBC THREEITV1
ITV2
VH1 Class
ic
Disney
Chan
nel
Nickelo
deon
Discove
ry C
hann
el
UKTV Hist
ory VH1
E! Enter
tainmen
t E4Ftn
LIVINGtv
LIVINGtv 2
Param
ount C
omed
y
Sky O
ne
Sky N
ews
CBBC Chan
nelITV4
Q2d Which channels would do you watch less of if 9 hour BBC HD channel was introduced? (All respondents giving information about channels they watch less of (n = 100))
- 2.7
- 1.7- 1.7
BBC ONE is the single channel that would lose most viewing time with the introduction of the 9 hour BBC HD channel with almost half (45%) of those who said they would watch less of other channels claiming they would spend less time watching BBC ONE. BBC TWO and BBC THREE would also be slightly affected.
Other channels are also likely to lose some viewing time with the introduction of the 9 hour BBC HD channel, although not to a particularly significant degree. Only the top 20 channels are shown in the above chart. On average, each subscriber that would watch less of another channel if the 9 hour BBC HD channel was introduced would watch 2.7 hours less of BBC ONE than they do currently.
51

Likely impact of the proposed 9 hour BBC HD channel on other TV-based activities
Figure 8.7 below shows that the proposed 9 hour BBC HD channel is likely to have little or no net impact on time spent on other TV-based activities such as watching DVDs, playing computer games and using a PVR. Figure 8.7 Change in time spent watching DVDs if the 9 hour BBC HD channel was introduced
4%9% 5% 1%
10%
13%12%
4%
71%
71%
64%81%
6%
15%13%
1% 4% 2%
12%
1%
All Under 25 25-44 45+
Watch DVDs much less
Watch DVDs slightly less
Watch DVDs about the same
Watch DVDs slightly more
Watch DVDs much more
Q3s: And how would the amount of time you spend watching DVDs change with the expansion of the BBC HD channel?Base: All likely to watch BBCHD once it is running for 9 hours a day and spending at least 1hr/ wk watching DVDs (322)
Nearly three quarters (71%) of current DVD watchers that are likely to watch the proposed 9 hour BBC HD channel are not likely to change the amount of time they spend watching DVDs. Younger subscribers are slightly more likely to spend more time watching DVDs, but this is likely to be due to a growth in DVD viewing overall and not directly linked to the 9 hour BBC HD channel. The few (13%) subscribers that claim they would spend less time watching DVDs might be motivated by the programmes planned for BBC HD, although this is too small to translate into any noticeable impact on DVD sales or rentals. A similar pattern is seen with computer games in Figure 8.8 below.
52

Figure 8.8 Change in time spent playing computer games if the proposed 9 hour BBC HD channel was introduced
4% 7% 4% 2%
10%13%
11%3%
73%70% 75%
73%
9% 6%18%
3% 3%
10%
1%
All Under 25 25-44 45+
Play much less
Play slightly less
Play about the same
Play slightly more
Play much more
Q3t And how would the amount of time you spend playing console or computer games change with the expansion of the BBC HD channel?Base: All likely to watch BBCHD once it is running for 9 hours a day and spending at least 1hr/ wk playing computer games (270)
Again, around three quarters (73%) of computer game playing subscribers who would watch the proposed 9 hour BBC HD channel claim it would have no impact on the amount of time spent playing games. Younger subscribers are slightly more likely to increase their gaming with the introduction of the 9 hour BBC HD channel, although that is likely to be in line with a higher level of gaming in this age group. A slightly different picture is shown by the impact on HD DVDs and Blu Ray viewing as shown in figure 8.9.
53

Figure 8.9 Change in time spent watching HD DVDs / Blu Ray if 9 hour BBC HD channel was introduced
8% 13%7% 4%
17%
22%
17%
7%
65%
59%66%
71%
7% 8%14%
1% 4%9%1%
All Under 25 25-44 45+
Watch much less
Watch slightly less
Watch about the same
Watch slightly more
Watch much more
Q3u And how would the amount of time you spend watching HD DVDs / Blu Ray change with the expansion of the BBC HD channel? Base: All likely to watch BBCHD once it is running for 9 hours a day and spending at least 1hr/ wk HD DVDs / Blu Ray (157)
A quarter (25%) claim they would spend more time watching HD DVDs / Blu Ray than they do at the moment. This is a greater impact than on SD DVDs and computer gaming. This increase is probably due to recording more programmes on HD DVD or Blu Ray than they do currently. The proposed 9 hour BBC HD channel is also likely to result in a net increase in PVR use, as shown in Figure 8.10 below.
54

Figure 8.10 Change in time spent using PVR if 9 hour BBC HD channel was introduced
9%
23%
58%
4%
3%13%
Total
Don't know
I never use my hard disc
I would use it a lot less
I would use it a little bit less
I would use it the same as now
I would use it little bit more
I would use it much more
Q3v How would the extended BBC HD channel affect the number of programmes you record with your hard disc recorder, i.e. your Sky+, V+ or TV Drive box? Base: All likely to watch BBCHD once it is running for 9 hours a day and have a PVR (383)
Nearly a third (32%) of subscribers that use a PVR would increase their PVR use with the extension of the proposed 9 hour BBC HD channel. Only 4% believe their PVR use would decline. Figure 8.11shows the nature of the increase in PVR use.
55
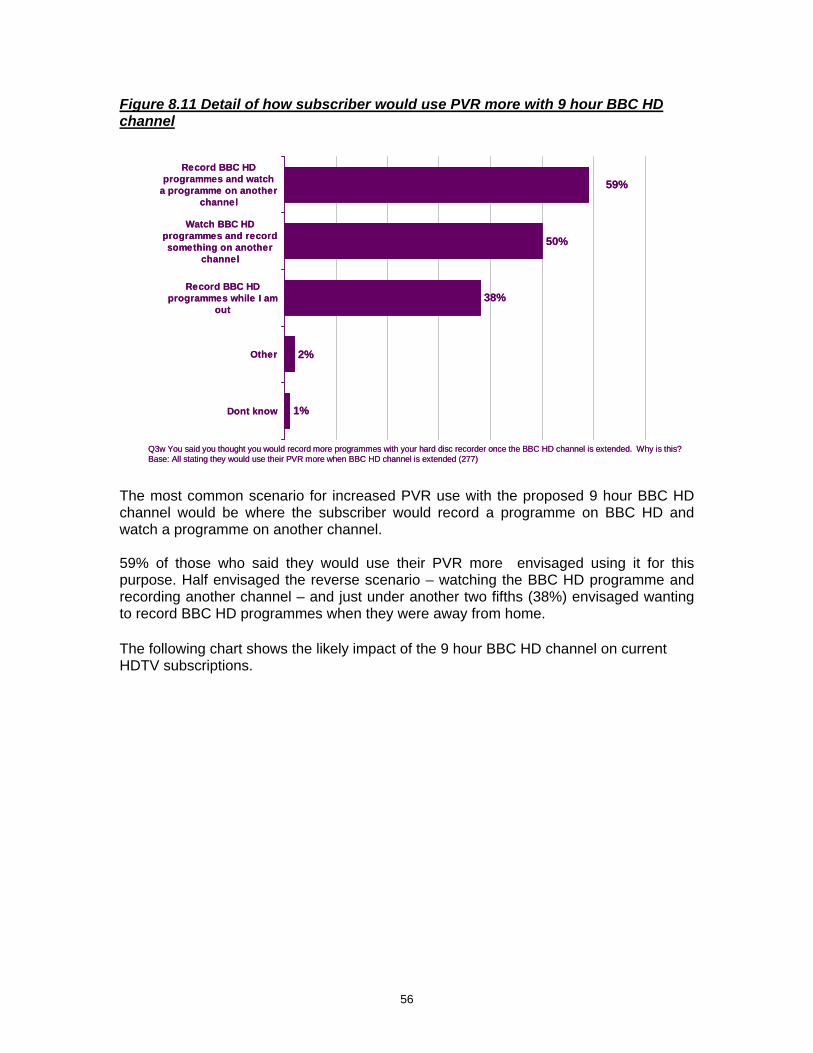
Figure 8.11 Detail of how subscriber would use PVR more with 9 hour BBC HD channel
50%
38%
2%
1%
59%Record BBC HD
programmes and watcha programme on another
channel
Watch BBC HDprogrammes and recordsomething on another
channel
Record BBC HDprogrammes while I am
out
Other
Dont know
Q3w You said you thought you would record more programmes with your hard disc recorder once the BBC HD channel is extended. Why is this? Base: All stating they would use their PVR more when BBC HD channel is extended (277)
The most common scenario for increased PVR use with the proposed 9 hour BBC HD channel would be where the subscriber would record a programme on BBC HD and watch a programme on another channel. 59% of those who said they would use their PVR more envisaged using it for this purpose. Half envisaged the reverse scenario – watching the BBC HD programme and recording another channel – and just under another two fifths (38%) envisaged wanting to record BBC HD programmes when they were away from home. The following chart shows the likely impact of the 9 hour BBC HD channel on current HDTV subscriptions.
56

Figure 8.12 Likelihood of cancelling Sky+ / Virgin subscription if 9 hour BBC HD channel was introduced
7%14%
7% 3%
19%
21%
22%
13%
34%
30%35%
36%
26% 26%38%
10% 11% 10%
30%
1%
Total Under 25 25-44 45+
Don’t know
Definitely not consider cancel mysubscription
Probably not cancel mysubscription
Possibly cancel my subscription
Definitely cancel my subscription
Q3x If the BBC HD channel was extended to 9 hours a day, and this was available on Freeview, how likely would you be to consider cancelling your Sky HD or Virgin HD subscription?Base: All likely to watch BBCHD once it is running for 9 hours a day (397)
The chart shows that the proposed 9 hour BBC HD channel would represent a slight threat to existing Sky HD / Virgin TV subscriptions with 26% of subscribers saying they would at least consider cancelling. Younger subscribers are more likely to cancel than older people. There is no significant difference in likelihood to cancel subscription between current Sky+ and Virgin subscribers.
57

Section 9
The proposed overnight BBC HD channel The proposed 4 hour overnight BBC HD channel on DTT would involve broadcasting a selection of programmes in HD the night before they are shown on SD BBC channels. This would give the viewer the option of watching programmes at the most convenient time and watching the HD versions of each programme instead of SD. Interest in the overnight BBC HD channel Figure 9.1 below shows the level of interest in the proposed overnight BBC HD channel concept among subscribers. Figure 9.1 Interest in overnight BBC HD channel
16%8%
24%
35%
30%
39%
33%
40%
25%
13%
9%8% 3%
11%
6%
All Do not watch BBC HD TV Watch BBC HD TV
Not at all interested
Not very interested
Indifferent
Somewhat interested
Extremely interested
Q3y How interested would you be in this overnight BBC HD service?Base: All respondents (400)
16%8%
24%
35%
30%
39%
33%
40%
25%
13%
9%8% 3%
11%
6%
All Do not watch BBC HD TV Watch BBC HD TV
Not at all interested
Not very interested
Indifferent
Somewhat interested
Extremely interested
Q3y How interested would you be in this overnight BBC HD service?Base: All respondents (400)
Interest in the proposed overnight BBC HD channel is not as high as for the 9 hour channel. However, significant levels of interest are still in evidence, with half (51%) of subscribers saying they are somewhat or very interested. Less than a fifth (17%) of subscribers are not interested. Interest is significantly higher among those that watch the trial BBC HD channel than those that don’t.
58

Figure 9.2 shows the overlap between interest in the proposed overnight BBC HD channel and interest in the proposed 9 hour BBC HD channel. Figure 9.2 Interest in overnight BBC HD channel by interest in 9 hour BBC HD channel
63%
9%
51%
37%
91%
49%
Interested (304) Indifferent/ notinterested (96)
Total (400)
Indifferent/ notinterested
Interested
Q3y How interested would you be in this overnight BBC HD service?Base: All respondents (400)
Interest in extended BBC HD concept
Interested in overnight BBC HD
concept
63%
9%
51%
37%
91%
49%
Interested (304) Indifferent/ notinterested (96)
Total (400)
Indifferent/ notinterested
Interested
Q3y How interested would you be in this overnight BBC HD service?Base: All respondents (400)
Interest in extended BBC HD concept
Interested in overnight BBC HD
concept
There is reasonably high overlap in interest between the two options. Two thirds (63%) of those interested in the 9 hour BBC HD channel are also interested in the overnight BBC HD channel. Very few subscribers (9%) who are not interested in the 9 hour channel are interested in the overnight chaanel. With the exception of this 9%, those interested in the overnight channel are a subset of those interested in the 9 hour channel.
59
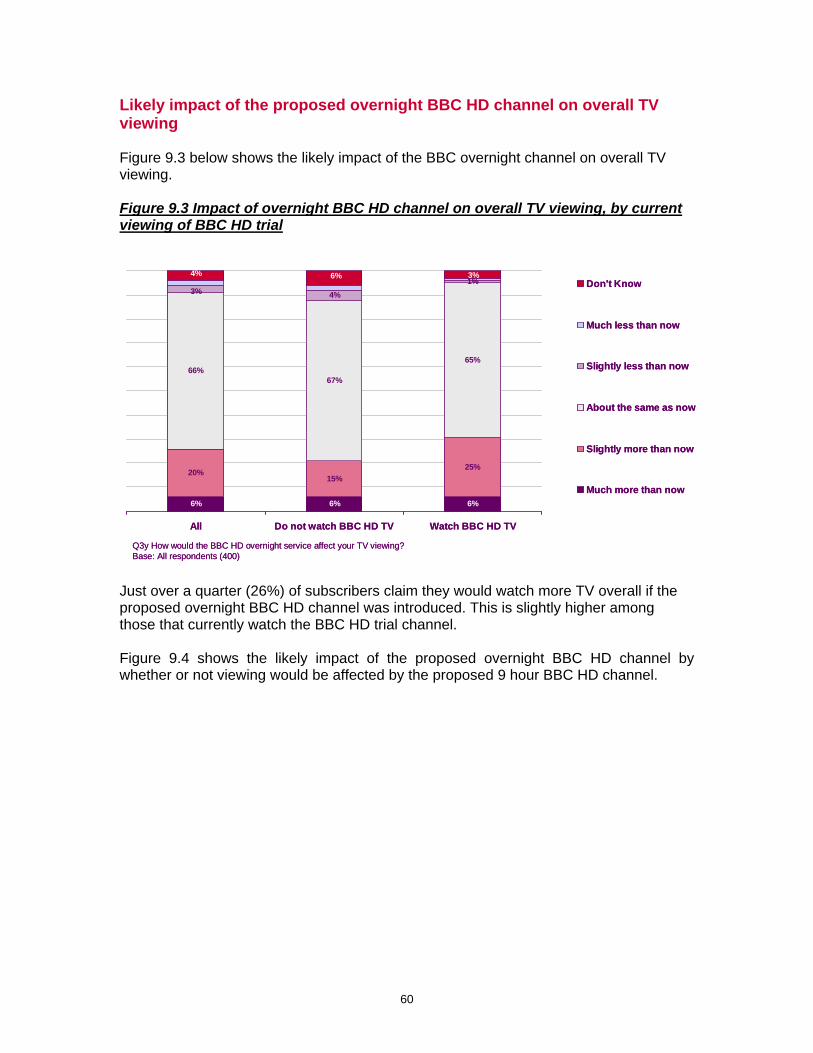
Likely impact of the proposed overnight BBC HD channel on overall TV viewing Figure 9.3 below shows the likely impact of the BBC overnight channel on overall TV viewing. Figure 9.3 Impact of overnight BBC HD channel on overall TV viewing, by current viewing of BBC HD trial
6% 6%
15%25%
67%
65%
4%
6%
20%
66%
1%3%
3%6%4%
All Do not watch BBC HD TV Watch BBC HD TV
Don't Know
Much less than now
Slightly less than now
About the same as now
Slightly more than now
Much more than now
Q3y How would the BBC HD overnight service affect your TV viewing? Base: All respondents (400)
Just over a quarter (26%) of subscribers claim they would watch more TV overall if the proposed overnight BBC HD channel was introduced. This is slightly higher among those that currently watch the BBC HD trial channel. Figure 9.4 shows the likely impact of the proposed overnight BBC HD channel by whether or not viewing would be affected by the proposed 9 hour BBC HD channel.
60

Figure 9.4. Impact of the BBC overnight channel by whether or not viewing would be affected by the 9 hour channel
Change in viewing due to extended BBC HD concept
15%26%
85%74%
41%
59%
More (168) The same or less (232) Total (400)
The same or less
More
Q3y How would the BBC HD overnight service affect your TV viewing? Base: All respondents (400)
Increase total viewing due to overnight BBC HD
concept
Change in viewing due to extended BBC HD concept
15%26%
85%74%
41%
59%
More (168) The same or less (232) Total (400)
The same or less
More
Q3y How would the BBC HD overnight service affect your TV viewing? Base: All respondents (400)
Increase total viewing due to overnight BBC HD
concept
15%26%
85%74%
41%
59%
More (168) The same or less (232) Total (400)
The same or less
More
Q3y How would the BBC HD overnight service affect your TV viewing? Base: All respondents (400)
Increase total viewing due to overnight BBC HD
concept
Most of the increase in BBC HD viewing with the overnight service would from the same subscribers that would increase their TV viewing if the 9 hour BBC HD channel was introduced. However, a small (15%) but significant proportion of those that would not watch more TV with the 9 hour channel say they would increase their overall viewing with the overnight BBC HD channel. This could be because they tend to watch more TV during the night time, or because they are keen to watch increased HD programming in general and therefore would set their PVR to record HD programmes overnight and watch the following day. Figure 9.5 below shows how viewing or recording of the BBC HD overnight broadcasts are likely to impact on viewing of other channels.
61

Figure 9.5 Impact of proposed BBC HD overnight channel on other channels
5%8%
14%22%
77%75%
65%
6% 5%
4%3%
9%
Other HD channels Other channels with adverts(not including HD channels)
Other BBC Channels (not HD)
Much more
A little bit more
About the same
A little bit less
Much less
Q3aa If you watched or recorded the overnight BBC HD service, would you watch more or less of each of the following types of TV chaBase: All respondents (400)
As with the proposed 9 hour BBC HD option, the largest impact of the proposed overnight BBC HD service on other broadcasts would be on other, non-HD, BBC channels. 27% of respondents claim they would watch less of the other BBC channels. About one fifth (18%) of respondents claimed they would watch less of commercial non-HD channels. Other HD channels would be least affected. However, 13% of subscribers say they would actually watch more of other HD channels and 8% say they would watch more of commercial and BBC SD channels if there was an overnight BBC HD channel. This is probably due to respondents anticipating more opportunities to record programmes, allowing for more viewing of other channels than is possible at present.
62
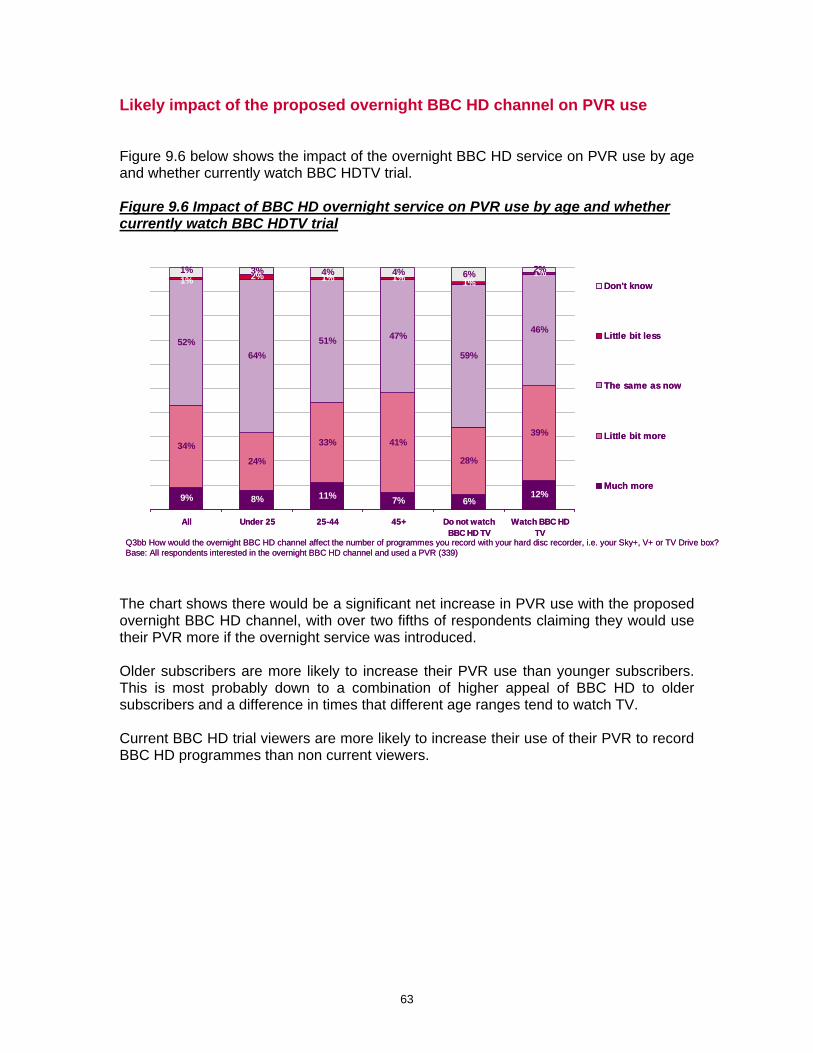
Likely impact of the proposed overnight BBC HD channel on PVR use Figure 9.6 below shows the impact of the overnight BBC HD service on PVR use by age and whether currently watch BBC HDTV trial. Figure 9.6 Impact of BBC HD overnight service on PVR use by age and whether currently watch BBC HDTV trial
9% 8% 11% 7% 6%12%
34%24%
33% 41%
28%
39%
52%64%
51% 47%
59%
46%
2% 1% 1% 1%1%3% 4% 4% 6% 2%
1%1%
All Under 25 25-44 45+ Do not watchBBC HD TV
Watch BBC HDTV
Don't know
Little bit less
The same as now
Little bit more
Much more
Q3bb How would the overnight BBC HD channel affect the number of programmes you record with your hard disc recorder, i.e. your Sky+, V+ or TV Drive box? Base: All respondents interested in the overnight BBC HD channel and used a PVR (339)
The chart shows there would be a significant net increase in PVR use with the proposed overnight BBC HD channel, with over two fifths of respondents claiming they would use their PVR more if the overnight service was introduced. Older subscribers are more likely to increase their PVR use than younger subscribers. This is most probably down to a combination of higher appeal of BBC HD to older subscribers and a difference in times that different age ranges tend to watch TV. Current BBC HD trial viewers are more likely to increase their use of their PVR to record BBC HD programmes than non current viewers.
63

Figure 9.7 below shows that the proposed overnight BBC HD service would increase PVR use. Figure 9.7 Overlap of BBC HD overnight service vs 9 hour service on PVR use
28%
43%
72%
57%
72%
28%
More (116) The same or less (223) Total (339)
The same or less
More
Q3y How would the BBC HD overnight service affect your TV viewing? Base: All respondents with PVR (339)
Change in PVR use due to extended BBC HD concept
Increase PVR use due to overnight
BBC HD concept
The chart shows that most of the increased PVR use would come from the same subscribers that would increase their PVR use with the 9 hour BBC HD channel. However, there is a significant group (28%) who would not record anything extra on the 9 hour BBC HD channel but would use their PVR more to record overnight BBC HD programming. So clearly, in terms of PVR use, the two concepts do impact on the behaviour of rather different groups.
64