market dynamics in india - consumer trends and momentum
DESCRIPTION
Market DynamicsTRANSCRIPT

MARKET DYNAMICS IN INDIA: CONSUMER TRENDS AND MOMENTUM
June 2015

© Euromonitor International
2
With a total GDP of Rs125 trillion (US$2.0 trillion) in
2014, India stood as the ninth largest economy
globally. Average annual real GDP growth of 7.0%
between 2000-2014 surpassed the global average of
3.8% and the Asia Pacific average of 6.3% over the
same period. Robust growth reflects strong and rising
levels of domestic consumption, export
competitiveness and high government spending.
In purchasing power parity (PPP) terms, India
overtook Japan in 2006 to become the third largest
economy globally, after China and the US, implying
that Indian consumers have far better capacity to
acquire goods than their Japanese counterparts.
The country offers both growth and volume
advantages to businesses, as its forecast annual real
GDP growth of 5.8% over 2015-2030 will be the
highest among the 10 biggest markets globally. Its
expected total GDP of US$8.8 trillion by 2030 will
make it the world's third largest economy globally, in
US$ terms - more than the expected sizes of Brazil
and Russia combined.
0
2
4
6
8
10
12
India China Brazil Russia
% r
eal
GD
P C
AG
R
Real GDP % CAGR 2000-2014 and 2015-2030
2000-2014 2015-2030
0 10,000 20,000 30,000 40,000 50,000 60,000
Russia
Brazil
Japan
Indonesia
India
US
China
US$ billion
Total GDP in PPP Terms 2030
Russia Brazil Japan Indonesia India US China
India now world's third largest economy in PPP terms
MARKET DYNAMICS IN INDIA: CONSUMER TRENDS AND MOMENTUM
© Euromonitor International
3
0 50,000 100,000 150,000
Brazil
Russia
Indonesia
US
India
China
Middle-class households (‘000)
Number of Middle-Class Households 2014/2030
2014 2030
0 25 50 75 100
Hi-Fi Stereo
Internet-Enabled…
Personal Computer
Refrigerator
Motorcycle
Cable TV
Bicycle
Cooker
Colour TV Set
Mobile Telephone
% households
Top 10 Consumer Durables in India(% Households) 2014/2030
2014 2030
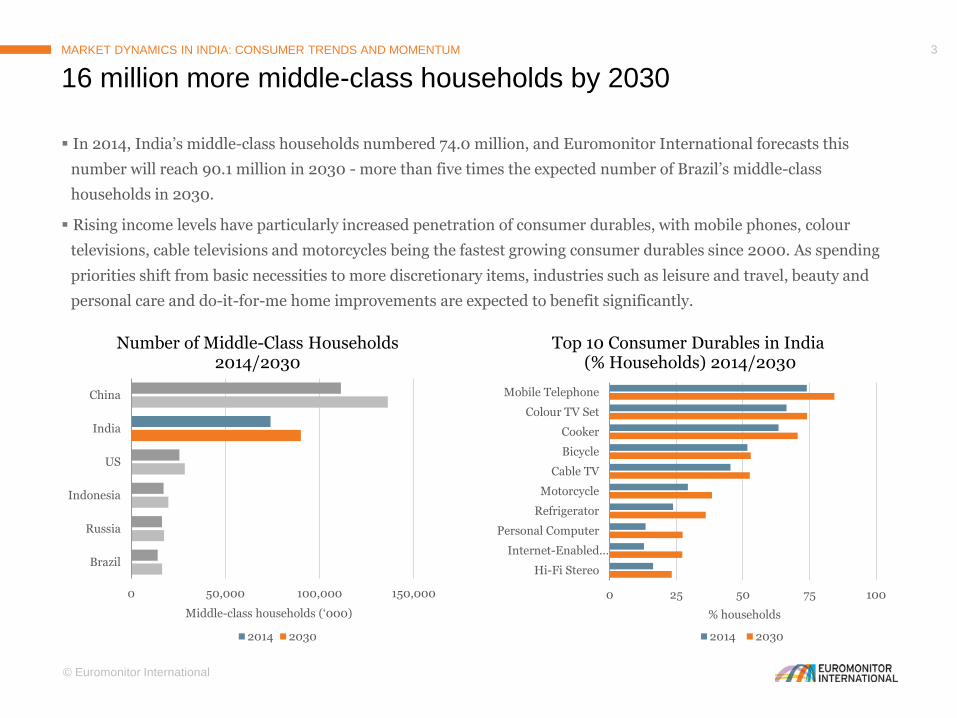
In 2014, India’s middle-class households numbered 74.0 million, and Euromonitor International forecasts this
number will reach 90.1 million in 2030 - more than five times the expected number of Brazil’s middle-class
households in 2030.
Rising income levels have particularly increased penetration of consumer durables, with mobile phones, colour
televisions, cable televisions and motorcycles being the fastest growing consumer durables since 2000. As spending
priorities shift from basic necessities to more discretionary items, industries such as leisure and travel, beauty and
personal care and do-it-for-me home improvements are expected to benefit significantly.
16 million more middle-class households by 2030
MARKET DYNAMICS IN INDIA: CONSUMER TRENDS AND MOMENTUM

© Euromonitor International
4
Discretionary spending is expenditure by consumers or
households on consumer categories such as transport,
leisure and eating-out, other than that of essentials such
as food and non-alcoholic beverages and housing.
The shifting priorities of the Indian middle class are
evident in the shift in spending habits. Consumers are
now moving beyond the basic necessities.
As the modernisation of India’s agricultural sector will
create more efficient food supply chains thereby reducing
grocery prices, spending on necessities is expected to fall.
Rising incomes will increase consumers’ appetite for
discretionary spending. This spending capacity is
improving for rich, middle-class and poorer Indian
households alike.
In 2014, discretionary spending absorbed 41% of the
overall budgets of low-income Indian households (decile
1). This category attracted 55% of the total outgoings of
middle-income homes (decile 5) that year and 67% of the
total expenditure of high-income households (decile 10).
0%
10%
20%
30%
40%
50%
60%
70%
80%
90%
100%
2000 2014 2030
Va
lue
sha
re
Share of Wallet by Category 2000/2014/2030
Discretionary spending
Spending on food and non-alcoholic beverages and housing
Share of wallet shifts towards discretionary spending
MARKET DYNAMICS IN INDIA: CONSUMER TRENDS AND MOMENTUM
© Euromonitor International
5
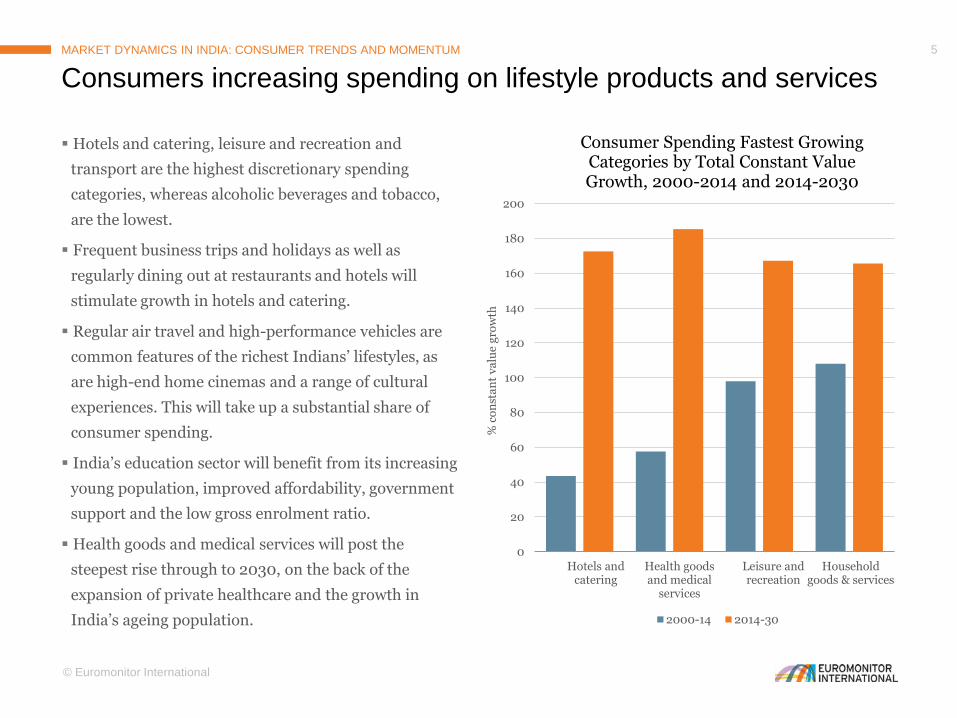
Hotels and catering, leisure and recreation and
transport are the highest discretionary spending
categories, whereas alcoholic beverages and tobacco,
are the lowest.
Frequent business trips and holidays as well as
regularly dining out at restaurants and hotels will
stimulate growth in hotels and catering.
Regular air travel and high-performance vehicles are
common features of the richest Indians’ lifestyles, as
are high-end home cinemas and a range of cultural
experiences. This will take up a substantial share of
consumer spending.
India’s education sector will benefit from its increasing
young population, improved affordability, government
support and the low gross enrolment ratio.
Health goods and medical services will post the
steepest rise through to 2030, on the back of the
expansion of private healthcare and the growth in
India’s ageing population.
0
20
40
60
80
100
120
140
160
180
200
Hotels andcatering
Health goodsand medical
services
Leisure andrecreation
Householdgoods & services
% c
on
sta
nt
va
lue
gro
wth
Consumer Spending Fastest Growing Categories by Total Constant Value Growth, 2000-2014 and 2014-2030
2000-14 2014-30
Consumers increasing spending on lifestyle products and services
MARKET DYNAMICS IN INDIA: CONSUMER TRENDS AND MOMENTUM

© Euromonitor International
6
So who are these consumers?
MARKET DYNAMICS IN INDIA: CONSUMER TRENDS AND MOMENTUM
How are Indian consumers distributed across our five consumer types?
• Ambitious
• Tech-savvy
• Capable
• Self-assured
Undaunted Striver (16%)
“I want to be and have the best.”
• Busy
• Confident
• Image-conscious
• Status-driven
Restless Spender (16%)
“My life is hectic but exciting.”
• Cautious
• Moderate
• Balance-seeking
• Frugal
Prudent Pragmatist (23%)
“I think carefully before making decisions.”
• Family-orientated
• Guarded
• Ambivalent
• Modest
Humble Homebody (21%)
“Family matters most to me.”
• Content
• Independent
• Minimalistic
• Comfortable
Secure Traditionalist (24%)
“I do not need much to be happy”

© Euromonitor International
7
Consumers contributing the most to discretionary spending
MARKET DYNAMICS IN INDIA: CONSUMER TRENDS AND MOMENTUM
Undaunted Strivers and Restless Spenders both earn high incomes, prefer to buy brand names and enjoy shopping.
Undaunted Strivers and Restless Spenders are the most tech-savvy groups. Both are highly active online and on social media and make sure they purchase the latest technology.
Who enjoys shopping? Who spends their money on brand names and luxury products? Who is the technophile?
Share of Population 2011
Undaunted Striverand Restless
Spender32%
Prudent Pragmatist, Secure Traditionalist and
Humble Homebody68%

© Euromonitor International
8
Rapid urbanisation, rising disposable incomes and less
spare time for urban working couples are supporting
demand for prepared meals, which are more convenient
and increasingly becoming a part of their daily lives.
This has raised demand for packaged food, which is
seeing faster year-on-year volume growth than fresh
food.
The average age of first marriage will increase by around
two years for both men and women over 2012-2030;
from 24.5 to 26.5 years for men and from 18.9 to 21.0
years for women.
This will widen the window of opportunity for packaged
food manufacturers, as according to Euromonitor
International’s Global Consumer Trends survey, the 20-
29 years age group is the biggest contributor to ready
meals sales in India.
These unmarried singles prefer packaged food over fresh
food because of its convenience in terms of preparation
time.
Ready meals and snack bars will see tremendous growth
exceeding overall packaged food growth over the forecast
period.
0
2
4
6
8
10
12
14
16
18
15-19
20-24
25-29
30-34
35-39
40-44
45-49
50-54
55-59
60-64
65+
% s
ha
re
Age (years)
Age Group Purchasing Ready Meals for Own Consumption on Weekly Basis in 2011
Packaged food appeals to time-starved consumers
MARKET DYNAMICS IN INDIA: CONSUMER TRENDS AND MOMENTUM
0
200
400
600
800
1,000
1,200
2009 2012 2015 2018
Ind
ex 2
00
9=
100
Packaged Food: Retail Growth Indices by Selected Category 2009-2019
Ready Meals Snack Bars Packaged Food

© Euromonitor International
9
However, convenience, faster-paced lives and
lifestyle changes are impacting health, body and
mind and potentially becoming a cause of many
chronic and cardiovascular diseases.
India is witnessing a rising obesity trend. With
growing urbanisation incomes its citizens are
becoming obese. The overweight population is
expected to reach 23% of the total population by
2030.
Among the reasons for the growing number of
diabetes and obesity cases is an increasing
tendency towards sedentary lifestyles that have
accompanied growing economic prosperity, as
well as genetic predisposition in a country
already known for its sweet tooth.
In 2015, India has an estimated 77.0 million
pre-diabetics, a precursor to Type 2, the most
common type of the disease. The majority of
diabetes cases are in southern India and the
metros.
Changing lifestyles taking their toll…
MARKET DYNAMICS IN INDIA: CONSUMER TRENDS AND MOMENTUM
50,000
70,000
90,000
110,000
130,000
150,000
170,000
2000 2005 2010 2015 2020 2025 2030
Num
be
r o
f p
eo
ple
Number of Diabetic Patients (Aged 20-79 Years) 2000-2030
Number of Diabetic Patients (Aged 20-79 Years)
5
10
15
20
25
2000 2005 2010 2015 2020 2025 2030
Pe
rce
nta
ge
of
ove
rall
po
pu
latio
n
Diabetic Prevalence and Overweight Population 2000-2030
% Population Aged 20-79 Years - Diabetes Prevalence
% Population Aged 15+ Years - Overweight Population (BMI 25-30kg/sq m)

© Euromonitor International
10
India is now one of the world’s most dynamic
markets for weight management products. While
higher-end options, such as custom-made weight
loss programmes, are starting to make inroads,
the market for lower-priced weight management
products, such as better for you reduced fat or
reduced sugar offerings, requires significant
development.
According to Euromonitor International’s Global
Consumer Trends survey, a large majority of
Indian respondents expressed the high
importance of physical exercise in terms of
wellbeing.
While India has not fully adopted the “cult of thinness”,
there is certainly pressure to be slim and this promotes
growth of weight management products.
The strong growth of weight management has been
driven by the emergence of a consumer type that
Euromonitor refers to as the “undaunted striver.”
“Undaunted strivers” are also highly likely to go to the
gym, and therefore consume protein supplements and
sports nutrition.
…and driving strong growth in health and wellness products
MARKET DYNAMICS IN INDIA: CONSUMER TRENDS AND MOMENTUM
0
20
40
60
India China US UK Japan France Germany Russia
Per
cen
tag
e
Survey 2013 :When thinking about health, how important is regular exercise to you?
Very Important ImportantNeither Important nor Unimportant UnimportantNot at all Important
3
5
7
9
11
13
15
17
2014-2015 2015-2016 2016-2017 2017-2018 2018-2019
% v
alu
e g
row
th
Weight Management vs Consumer Health: Forecast Value Growth 2014-2019
Consumer Health Weight Management
Weight Loss Supplements
© Euromonitor International
11
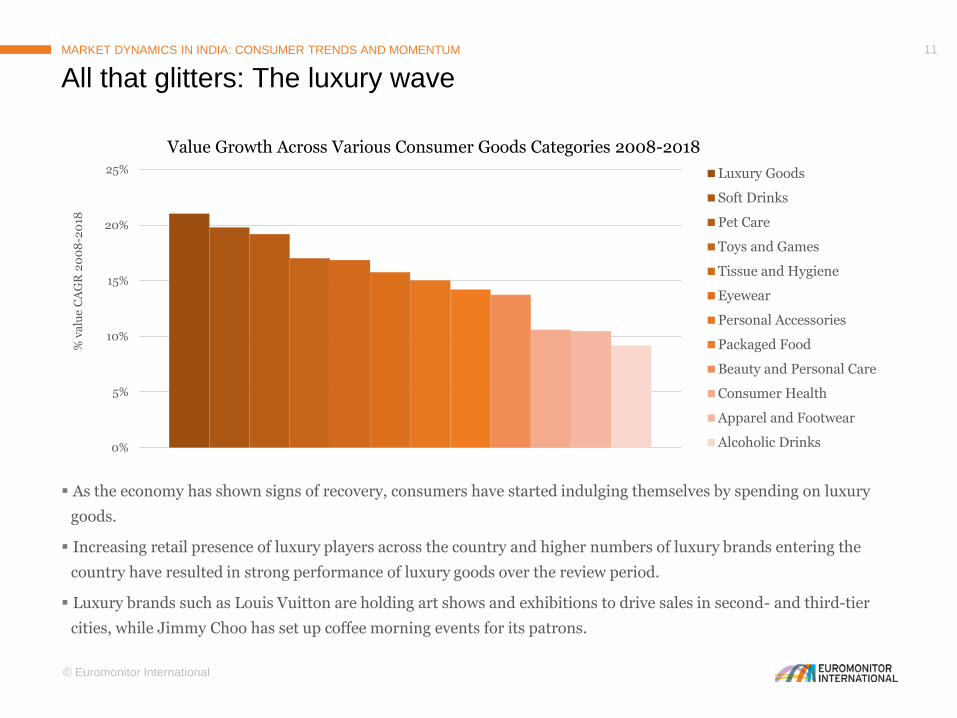
As the economy has shown signs of recovery, consumers have started indulging themselves by spending on luxury
goods.
Increasing retail presence of luxury players across the country and higher numbers of luxury brands entering the
country have resulted in strong performance of luxury goods over the review period.
Luxury brands such as Louis Vuitton are holding art shows and exhibitions to drive sales in second- and third-tier
cities, while Jimmy Choo has set up coffee morning events for its patrons.
All that glitters: The luxury wave
MARKET DYNAMICS IN INDIA: CONSUMER TRENDS AND MOMENTUM
0%
5%
10%
15%
20%
25%
% v
alu
e C
AG
R 2
00
8-2
018
Value Growth Across Various Consumer Goods Categories 2008-2018
Luxury Goods
Soft Drinks
Pet Care
Toys and Games
Tissue and Hygiene
Eyewear
Personal Accessories
Packaged Food
Beauty and Personal Care
Consumer Health
Apparel and Footwear
Alcoholic Drinks

© Euromonitor International
12
In 2014, India’s savings ratio stood at 31% of total disposable
income - ranking the third highest globally, after China’s 39%
and Iran’s 33%. Indian consumers’ saving and wealth
accumulation patterns are largely influenced by the country’s
social and cultural traits, where debt is typically perceived as
an avoidable luxury.
Family-orientated Indian consumers direct a significant
proportion of their savings towards acquiring physical assets
such as real estate and gold over their working lives. Both of
these are seen as secure investments and contribute towards
improving their social status.
0 10 20 30 40 50
Hong Kong
Singapore
India
Iran
China
% disposable income
Countries with Highest Savings Ratios 2014
Hong Kong Singapore India Iran China
0%
20%
40%
60%
80%
100%
1990 1995 2000 2005 2010 2011 2012 2013 2014 2015 2016 2020 2025 2030
Sh
are
of a
nn
ua
l d
isp
osa
ble
in
co
me
pe
r ca
pita
Consumer Savings and Expenditure as Share of Annual Disposable Income per Capita 1990-2030
Consumer Expenditure Annual Savings
The Indian consumer is not just about spending…
MARKET DYNAMICS IN INDIA: CONSUMER TRENDS AND MOMENTUM

© Euromonitor International
13
A significant proportion of total household savings in
India are directed towards home purchases, as the
penetration of mortgage products in India remains
low.
Indeed, some 93% of homeowners in India in 2014
did not have a mortgage. This is significantly higher
than China (77% in 2014) and the Asia Pacific
average of 84% in the same year.
Home Ownership by Tenure (‘000) 2014
Home Owners Without Mortgage
Home Owners With Mortgage
Rented
Others
-10
0
10
20
30
0
5
10
15
20
200
0
200
1
200
2
200
3
200
4
200
5
200
6
200
7
200
8
200
9
201
0
201
1
201
2
201
3
201
4
201
5
201
6
201
7
201
8
% y
-o-y
gro
wth
% y
-o-y
gro
wth
Real Jewellery vs Annual Savings:% Y-o-Y Growth 2000-2018
Real Jewellery - Retail Value RSP Annual Savings
A constant value CAGR of 7% in India’s annual
savings over 2000-2014 has led to an 11% constant
value CAGR in retail sales of real jewellery. Real
jewellery is not only considered a personal accessory
in India, but is also valued as a secure investment.
The personal accessories category therefore
registered the second highest retail value sales after
apparel and footwear in India in 2014.
Gold connection JEWELLERY: Dual commodity
“Real” purchaseHOME OWNERSHIP: An outright purchase
Gold and real estate remain top priorities among savers
MARKET DYNAMICS IN INDIA: CONSUMER TRENDS AND MOMENTUM

© Euromonitor International
14
India’s urban landscape will be primarily defined by 41
major cities that will surpass one million in population by
2025. These cities will drive demand for products and
services.
Per capita income levels in these 41 cities will be
significantly higher. Approximately 36% of households
with over US$15K in disposable income will be from these
cities while only 13% of India’s total population will live in
these 41 cities.
The population of six mega cities will surpass 10 million by
2025.
Over 1/3rd of India’s richest households will reside in 41 major cities
MARKET DYNAMICS IN INDIA: CONSUMER TRENDS AND MOMENTUM
Population and Disposable Income Split 2025
HyderabadBangalore
Chennai
Mumbai
Delhi
Megacities: Cities with
population >10 million
Megacities,2025
Kolkata
Dhanbad Patna Jaipur
Amritsar Bhopal Pune
Allahabad Thriruvanthapuram Surat
Asansol Thrissur Ahmedabad
Jabalpur Malappuram Nasik
Jamshedpur Kozhikode Visakhapatnam
Varanasi Coimbatore Vadodara
Madurai Nagpur Kannur
Meerut Kochi Agra
Ludhiana Indore Ghaziabad
Faridabad Kanpur Lucknow
Rajkot Vijayawada
Cities with population between 1 and 10 million by 2025
Outer circle: Population
Inner circle: Disposable Income

© Euromonitor International
15
The prominent urban regions of India are
expected to be connected by “urban corridor”
projects linking Indian megacities across the
country
The current largest corridor under development -
the Delhi-Mumbai Industrial Corridor - at a cost
of US$90 billion - will be the largest
infrastructure project in India's history. This will
be a 920 mile dedicated freight corridor and will
feature dozens of brand new cities along with new
ports and airports. It is designed to cut the
logistical costs of manufacturing goods, making
India a global manufacturing hub.
Another such project under consideration is a
new industrial corridor between Mumbai and
Bangalore.
However, such developments are expected to
present complex social concerns such as issues of
huge land acquisition.
Another obstacle that might lead to delay is
India’s complex bureaucracy. There is also an
urgent need to focus on social developments along
the corridors between cities.
The rise of the “mega region”
MARKET DYNAMICS IN INDIA: CONSUMER TRENDS AND MOMENTUM
Major Industrial Corridors in India by 2025
Delhi-Mumbai
Mumbai-Nagpur
Hyderabad-Hindupur
Srikakulam-NelloreBangalore-Belgaum
Mehsana-Valsa

© Euromonitor International
16
While the proportion of the rural population has been falling over the last two decades, India remains a
predominantly rural country with over 66% of households still living in rural areas.
A model for rural development called "rurbanisation" has been adopted that has focused on providing all the civic
and infrastructure facilities available in big towns and cities to arrest migration. This has the potential to raise rural
prosperity and bring down the burden on large cities and towns facing overcrowding.
This process has accelerated the convergence in consumer habits between urban and rural India. In fact, packaged
food consumption is rising faster in rural areas than in cities. There is likely to be an acceleration in the
“rurbanisation” trend, making rural and urban India more homogeneous in terms of consumer behaviour, while the
differences that exist within individual cities are expected to increase.
Yet India’s “soul” remains in its villages
MARKET DYNAMICS IN INDIA: CONSUMER TRENDS AND MOMENTUM
0
5
10
15
20
25
30
65%
66%
67%
68%
69%
70%
71%
72%
73%
2000 2001 2002 2003 2004 2005 2006 2007 2008 2009 2010 2011 2012 2013 2014
Sh
are
of
pa
cka
ge
foo
d
va
lue
sale
s in
ru
ral
are
as
Sh
are
of
rura
l p
op
ula
tio
n
Rural Population vs. Sales of Packaged Food in Rural Areas 2000-2014
Share of Rural Population in Total Population Share of Packaged food in Rural areas

© Euromonitor International
17
Traditional retailers such as kiranas (local independent retailers),
haats (open markets) and melas (fairs) play a vital role in the
distribution of many goods in India.
Although the share of traditional retailers has declined slightly, the
majority of packaged food in India is sold through kiranas, hence
having a solid presence in this channel is key to success.
The majority of Indians, particularly in rural areas, lack access to
modern retailing formats and still shop in them because kiranas
give credit and are prepared to deliver even the smallest orders.
Correspondingly, companies need to design strategies that meet the
needs of the rural population and are designing new products and
tools to tap into the rural market.
An interesting example is “Project Shakti” launched by Unilever in
2000. Unilever focused on empowering women, known as Shakti
Ammas, who act as distributors and brand-builders for Unilever.
Similarly, packaging is an area of key focus for manufacturers.
Small pack sizes help boost sales in impulse categories, such as
sweet and savoury snacks and confectionery, and flexible packaging
improves the affordability of such products.
Focus on traditional channels key to success in rural markets
MARKET DYNAMICS IN INDIA: CONSUMER TRENDS AND MOMENTUM
Courtesy of Hindustan Unilever Ltd
Packaged Food Distribution Breakdown 2014
Other GroceryRetailers
TraditionalGrocery Retailers

© Euromonitor International
18
According to the latest survey on future spending priorities conducted by Euromonitor International in 2014, a large
majority of respondents under the age of 45 expressed an intention to increase their spending on new technology.
Indian men, in particular, are eager to increase their technology purchases, making them a prime target for
companies seeking to grow their technology sales.
Interestingly, even low-income Indian men are increasing spending - close to half of Indian male respondents under
24 who earn less than US$2,500 a year and over half of those earning between US$2,500 and US$10,000 a year plan
to increase their spending on new technology.
Young consumers plan to further increase tech spending
MARKET DYNAMICS IN INDIA: CONSUMER TRENDS AND MOMENTUM
0
5
10
15
20
25
30
35
40
45
50
55
15-29 30-44 45-59 60+ All demographics
% o
f re
spo
nd
ents
Interest in Spending on New Technologies, 2013
Source: Euromonitor International consumer survey, GCT Survey 2013
Note: Showing percentage of respondents who indicated that they were interested in spending ion new technologies

© Euromonitor International
19
Despite India’s huge growth potential, India’s
tough business environment remains a major
discouragement for investors.
The dearth of investments and slow regulatory
approvals have led to unstable electricity supply,
inadequate transport networks in cities and rural
areas and low mobile telephone and internet
penetration rates. Meanwhile, complex regulatory
frameworks, stringent red tape, lack of
governance and rigid labour market result in
higher costs for businesses.
In the World Bank’s Ease of Doing Business
(Doing Business) 2015 report, India ranked
142nd out of 189 countries, as businesses struggle
with the country’s complex start-up procedures,
relatively high taxes, difficulties in obtaining
electricity connection and construction permits
and enforcing contracts. At 142nd, India lags
behind many of its Asia Pacific counterparts,
notably China (90th), Indonesia (114th) as well as
Pakistan (128th).
0 50 100 150 200
Protecting Minority Investors
Getting Credit
Registering Property
Trading Across Borders
Getting Electricity
Resolving Insolvency
Paying Taxes
Starting a Business
Dealing with Construction Permits
Enforcing Contracts
India’s Ranking in Doing Business Index 2015
Out of 189 Countries
Despite reforms, business environment remains difficult
MARKET DYNAMICS IN INDIA: CONSUMER TRENDS AND MOMENTUM
© Euromonitor International
20
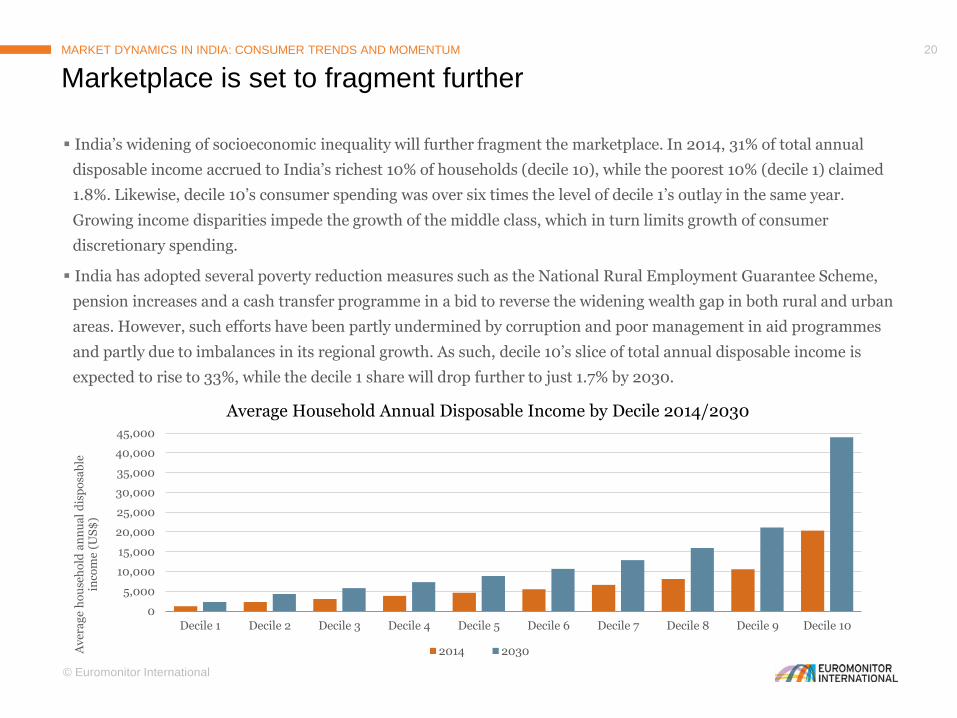
India’s widening of socioeconomic inequality will further fragment the marketplace. In 2014, 31% of total annual
disposable income accrued to India’s richest 10% of households (decile 10), while the poorest 10% (decile 1) claimed
1.8%. Likewise, decile 10’s consumer spending was over six times the level of decile 1’s outlay in the same year.
Growing income disparities impede the growth of the middle class, which in turn limits growth of consumer
discretionary spending.
India has adopted several poverty reduction measures such as the National Rural Employment Guarantee Scheme,
pension increases and a cash transfer programme in a bid to reverse the widening wealth gap in both rural and urban
areas. However, such efforts have been partly undermined by corruption and poor management in aid programmes
and partly due to imbalances in its regional growth. As such, decile 10’s slice of total annual disposable income is
expected to rise to 33%, while the decile 1 share will drop further to just 1.7% by 2030.
Marketplace is set to fragment further
MARKET DYNAMICS IN INDIA: CONSUMER TRENDS AND MOMENTUM
0
5,000
10,000
15,000
20,000
25,000
30,000
35,000
40,000
45,000
Decile 1 Decile 2 Decile 3 Decile 4 Decile 5 Decile 6 Decile 7 Decile 8 Decile 9 Decile 10
Av
era
ge
ho
use
ho
ld a
nn
ua
l d
isp
osa
ble
in
com
e (U
S$
)
Average Household Annual Disposable Income by Decile 2014/2030
2014 2030
THANK YOU FOR READINGThis is an extract from the full Euromonitor International report Mega to Micro: Trends
Shaping India’s Consumers.